Cities with the Lowest Wage/Income Gap (%) in West Virginia
RELATED REPORTS & OPTIONS
Lowest Wage/Income Gap (%)
West Virginia
Compare Cities
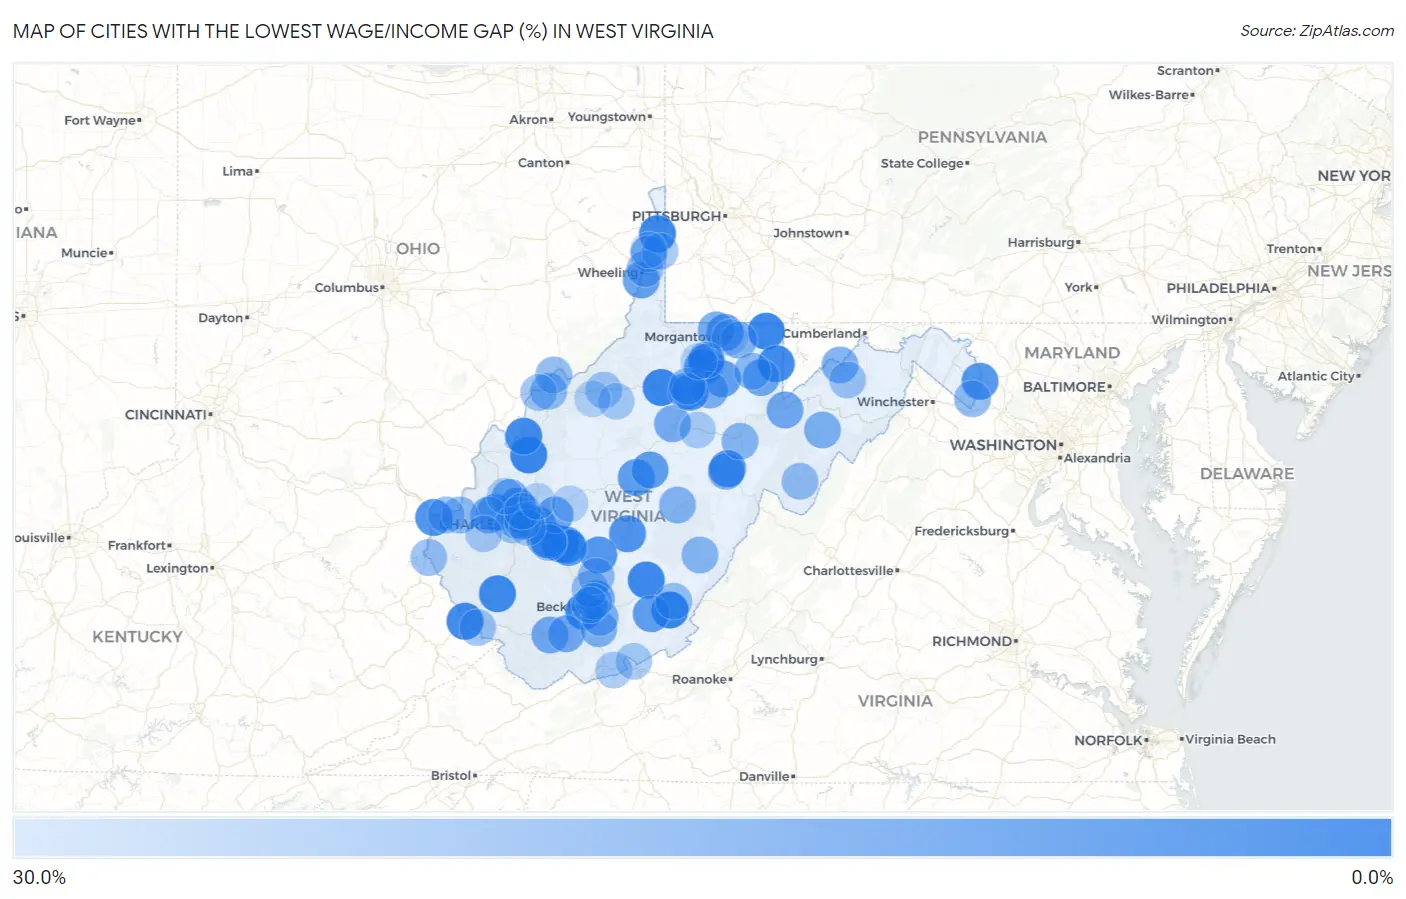
Map of Cities with the Lowest Wage/Income Gap (%) in West Virginia
30.0%
0.0%
Cities with the Lowest Wage/Income Gap (%) in West Virginia
| City | Wage/Income Gap (%) | vs State | vs National | |
| 1. | Ripley | 0.040% | 31.9%(-0.318)#1 | 28.0%(-0.279)#8 |
| 2. | Salem | 0.12% | 31.9%(-0.318)#2 | 28.0%(-0.279)#23 |
| 3. | Ronceverte | 0.13% | 31.9%(-0.317)#3 | 28.0%(-0.279)#26 |
| 4. | East Bank | 0.30% | 31.9%(-0.316)#4 | 28.0%(-0.277)#65 |
| 5. | Brandonville | 0.31% | 31.9%(-0.316)#5 | 28.0%(-0.277)#68 |
| 6. | Hooverson Heights | 0.88% | 31.9%(-0.310)#6 | 28.0%(-0.271)#215 |
| 7. | Rupert | 0.93% | 31.9%(-0.309)#7 | 28.0%(-0.270)#235 |
| 8. | Crab Orchard | 0.98% | 31.9%(-0.309)#8 | 28.0%(-0.270)#250 |
| 9. | Pleasant Valley | 1.3% | 31.9%(-0.305)#9 | 28.0%(-0.266)#348 |
| 10. | West Logan | 1.4% | 31.9%(-0.305)#10 | 28.0%(-0.266)#362 |
| 11. | Williamson | 1.6% | 31.9%(-0.303)#11 | 28.0%(-0.264)#410 |
| 12. | Terra Alta | 2.1% | 31.9%(-0.298)#12 | 28.0%(-0.259)#527 |
| 13. | Ravenswood | 2.2% | 31.9%(-0.297)#13 | 28.0%(-0.258)#545 |
| 14. | Mill Creek | 3.6% | 31.9%(-0.283)#14 | 28.0%(-0.244)#899 |
| 15. | Ceredo | 4.8% | 31.9%(-0.271)#15 | 28.0%(-0.232)#1,192 |
| 16. | Summersville | 5.3% | 31.9%(-0.266)#16 | 28.0%(-0.227)#1,346 |
| 17. | Poca | 5.5% | 31.9%(-0.264)#17 | 28.0%(-0.225)#1,418 |
| 18. | Pratt | 5.8% | 31.9%(-0.261)#18 | 28.0%(-0.222)#1,483 |
| 19. | Bolivar | 6.1% | 31.9%(-0.257)#19 | 28.0%(-0.218)#1,568 |
| 20. | Ansted | 6.2% | 31.9%(-0.257)#20 | 28.0%(-0.218)#1,585 |
| 21. | Charleston | 8.1% | 31.9%(-0.238)#21 | 28.0%(-0.199)#2,119 |
| 22. | White Hall | 8.3% | 31.9%(-0.236)#22 | 28.0%(-0.197)#2,184 |
| 23. | Gassaway | 8.6% | 31.9%(-0.233)#23 | 28.0%(-0.194)#2,288 |
| 24. | Alderson | 8.7% | 31.9%(-0.232)#24 | 28.0%(-0.193)#2,319 |
| 25. | Flatwoods | 9.0% | 31.9%(-0.229)#25 | 28.0%(-0.190)#2,390 |
| 26. | Star City | 9.0% | 31.9%(-0.228)#26 | 28.0%(-0.189)#2,410 |
| 27. | Grafton | 9.3% | 31.9%(-0.226)#27 | 28.0%(-0.187)#2,478 |
| 28. | Handley | 9.8% | 31.9%(-0.221)#28 | 28.0%(-0.182)#2,647 |
| 29. | Hurricane | 10.0% | 31.9%(-0.219)#29 | 28.0%(-0.180)#2,700 |
| 30. | Piney View | 10.2% | 31.9%(-0.217)#30 | 28.0%(-0.178)#2,774 |
| 31. | Benwood | 10.5% | 31.9%(-0.213)#31 | 28.0%(-0.174)#2,865 |
| 32. | Marmet | 11.5% | 31.9%(-0.204)#32 | 28.0%(-0.165)#3,150 |
| 33. | Belle | 11.7% | 31.9%(-0.202)#33 | 28.0%(-0.163)#3,241 |
| 34. | Rowlesburg | 12.1% | 31.9%(-0.198)#34 | 28.0%(-0.159)#3,353 |
| 35. | Pinch | 12.2% | 31.9%(-0.197)#35 | 28.0%(-0.158)#3,397 |
| 36. | Anmoore | 12.2% | 31.9%(-0.197)#36 | 28.0%(-0.158)#3,413 |
| 37. | St Albans | 12.3% | 31.9%(-0.196)#37 | 28.0%(-0.157)#3,425 |
| 38. | Davis | 12.7% | 31.9%(-0.192)#38 | 28.0%(-0.153)#3,588 |
| 39. | Pineville | 13.1% | 31.9%(-0.188)#39 | 28.0%(-0.149)#3,725 |
| 40. | Mullens | 13.3% | 31.9%(-0.186)#40 | 28.0%(-0.147)#3,770 |
| 41. | Winfield | 14.1% | 31.9%(-0.178)#41 | 28.0%(-0.139)#4,052 |
| 42. | Weston | 14.3% | 31.9%(-0.176)#42 | 28.0%(-0.137)#4,116 |
| 43. | Nutter Fort | 14.3% | 31.9%(-0.176)#43 | 28.0%(-0.137)#4,132 |
| 44. | Cassville | 14.4% | 31.9%(-0.175)#44 | 28.0%(-0.136)#4,155 |
| 45. | Windsor Heights | 14.7% | 31.9%(-0.171)#45 | 28.0%(-0.132)#4,277 |
| 46. | Flemington | 14.9% | 31.9%(-0.170)#46 | 28.0%(-0.131)#4,350 |
| 47. | Culloden | 15.5% | 31.9%(-0.164)#47 | 28.0%(-0.125)#4,544 |
| 48. | Keyser | 15.5% | 31.9%(-0.163)#48 | 28.0%(-0.124)#4,568 |
| 49. | Petersburg | 15.7% | 31.9%(-0.162)#49 | 28.0%(-0.123)#4,635 |
| 50. | Ghent | 15.8% | 31.9%(-0.160)#50 | 28.0%(-0.121)#4,709 |
| 51. | Huttonsville | 16.0% | 31.9%(-0.159)#51 | 28.0%(-0.120)#4,775 |
| 52. | Shady Spring | 16.4% | 31.9%(-0.154)#52 | 28.0%(-0.116)#4,957 |
| 53. | Brookhaven | 16.4% | 31.9%(-0.154)#53 | 28.0%(-0.115)#4,959 |
| 54. | Addison Webster Springs | 16.8% | 31.9%(-0.151)#54 | 28.0%(-0.112)#5,109 |
| 55. | Ranson Corporation | 16.8% | 31.9%(-0.150)#55 | 28.0%(-0.112)#5,137 |
| 56. | Stonewood | 17.2% | 31.9%(-0.147)#56 | 28.0%(-0.108)#5,274 |
| 57. | Elkins | 17.7% | 31.9%(-0.141)#57 | 28.0%(-0.102)#5,499 |
| 58. | Hillsboro | 18.0% | 31.9%(-0.139)#58 | 28.0%(-0.100)#5,603 |
| 59. | Nitro | 18.4% | 31.9%(-0.134)#59 | 28.0%(-0.095)#5,782 |
| 60. | Clarksburg | 18.6% | 31.9%(-0.133)#60 | 28.0%(-0.094)#5,835 |
| 61. | Tunnelton | 18.8% | 31.9%(-0.131)#61 | 28.0%(-0.092)#5,918 |
| 62. | Parkersburg | 18.8% | 31.9%(-0.131)#62 | 28.0%(-0.092)#5,931 |
| 63. | Boaz | 19.1% | 31.9%(-0.128)#63 | 28.0%(-0.089)#6,041 |
| 64. | Dunbar | 19.1% | 31.9%(-0.127)#64 | 28.0%(-0.088)#6,076 |
| 65. | Mount Hope | 19.3% | 31.9%(-0.126)#65 | 28.0%(-0.087)#6,158 |
| 66. | Shannondale | 19.5% | 31.9%(-0.124)#66 | 28.0%(-0.085)#6,229 |
| 67. | Pea Ridge | 19.5% | 31.9%(-0.123)#67 | 28.0%(-0.084)#6,259 |
| 68. | Franklin | 19.8% | 31.9%(-0.121)#68 | 28.0%(-0.082)#6,369 |
| 69. | Wheeling | 20.2% | 31.9%(-0.116)#69 | 28.0%(-0.077)#6,626 |
| 70. | Oak Hill | 20.4% | 31.9%(-0.114)#70 | 28.0%(-0.075)#6,723 |
| 71. | Lewisburg | 21.0% | 31.9%(-0.109)#71 | 28.0%(-0.070)#6,980 |
| 72. | Dupont | 21.1% | 31.9%(-0.108)#72 | 28.0%(-0.069)#7,025 |
| 73. | Fort Gay | 21.1% | 31.9%(-0.108)#73 | 28.0%(-0.069)#7,030 |
| 74. | Huntington | 21.3% | 31.9%(-0.106)#74 | 28.0%(-0.067)#7,111 |
| 75. | Fairmont | 21.5% | 31.9%(-0.103)#75 | 28.0%(-0.064)#7,255 |
| 76. | Stanaford | 21.9% | 31.9%(-0.100)#76 | 28.0%(-0.061)#7,418 |
| 77. | Chesapeake | 22.0% | 31.9%(-0.099)#77 | 28.0%(-0.060)#7,494 |
| 78. | Burlington | 22.0% | 31.9%(-0.099)#78 | 28.0%(-0.060)#7,497 |
| 79. | Matewan | 22.2% | 31.9%(-0.096)#79 | 28.0%(-0.057)#7,602 |
| 80. | Blennerhassett | 22.2% | 31.9%(-0.096)#80 | 28.0%(-0.057)#7,610 |
| 81. | Ellenboro | 22.7% | 31.9%(-0.092)#81 | 28.0%(-0.053)#7,812 |
| 82. | Tornado | 22.8% | 31.9%(-0.090)#82 | 28.0%(-0.051)#7,879 |
| 83. | Bethany | 23.9% | 31.9%(-0.080)#83 | 28.0%(-0.041)#8,427 |
| 84. | Jefferson | 24.0% | 31.9%(-0.079)#84 | 28.0%(-0.040)#8,476 |
| 85. | Hamlin | 24.1% | 31.9%(-0.078)#85 | 28.0%(-0.039)#8,522 |
| 86. | Oakvale | 24.5% | 31.9%(-0.074)#86 | 28.0%(-0.035)#8,727 |
| 87. | Pullman | 24.7% | 31.9%(-0.072)#87 | 28.0%(-0.033)#8,823 |
| 88. | Peterstown | 24.8% | 31.9%(-0.071)#88 | 28.0%(-0.032)#8,901 |
| 89. | Buckhannon | 25.0% | 31.9%(-0.068)#89 | 28.0%(-0.029)#9,040 |
| 90. | Sprague | 25.3% | 31.9%(-0.066)#90 | 28.0%(-0.027)#9,176 |
| 91. | South Charleston | 25.8% | 31.9%(-0.061)#91 | 28.0%(-0.022)#9,469 |
| 92. | Eleanor | 25.9% | 31.9%(-0.059)#92 | 28.0%(-0.020)#9,530 |
| 93. | Cross Lanes | 26.7% | 31.9%(-0.052)#93 | 28.0%(-0.013)#9,940 |
| 94. | Cairo | 27.4% | 31.9%(-0.045)#94 | 28.0%(-0.006)#10,316 |
| 95. | Monongah | 27.4% | 31.9%(-0.044)#95 | 28.0%(-0.005)#10,336 |
| 96. | Sissonville | 27.6% | 31.9%(-0.043)#96 | 28.0%(-0.004)#10,440 |
| 97. | Clendenin | 27.8% | 31.9%(-0.041)#97 | 28.0%(-0.002)#10,550 |
| 98. | Beech Bottom | 28.4% | 31.9%(-0.034)#98 | 28.0%(+0.005)#10,890 |
| 99. | Beckley | 28.8% | 31.9%(-0.031)#99 | 28.0%(+0.008)#11,100 |
| 100. | Morgantown | 29.1% | 31.9%(-0.028)#100 | 28.0%(+0.011)#11,297 |
Common Questions
What are the Top 10 Cities with the Lowest Wage/Income Gap (%) in West Virginia?
Top 10 Cities with the Lowest Wage/Income Gap (%) in West Virginia are:
#1
0.040%
#2
0.12%
#3
0.13%
#4
0.30%
#5
0.31%
#6
0.88%
#7
0.93%
#8
0.98%
#9
1.3%
#10
1.4%
What city has the Lowest Wage/Income Gap (%) in West Virginia?
Ripley has the Lowest Wage/Income Gap (%) in West Virginia with 0.040%.
What is the Wage / Income Gap in Percentage Terms in the State of West Virginia?
Wage / Income Gap in Percentage Terms in West Virginia is 31.9%.
What is the Wage / Income Gap in Percentage Terms in the United States?
Wage / Income Gap in Percentage Terms in the United States is 28.0%.