Cities with the Lowest Wage/Income Gap (%) in Oklahoma
RELATED REPORTS & OPTIONS
Lowest Wage/Income Gap (%)
Oklahoma
Compare Cities
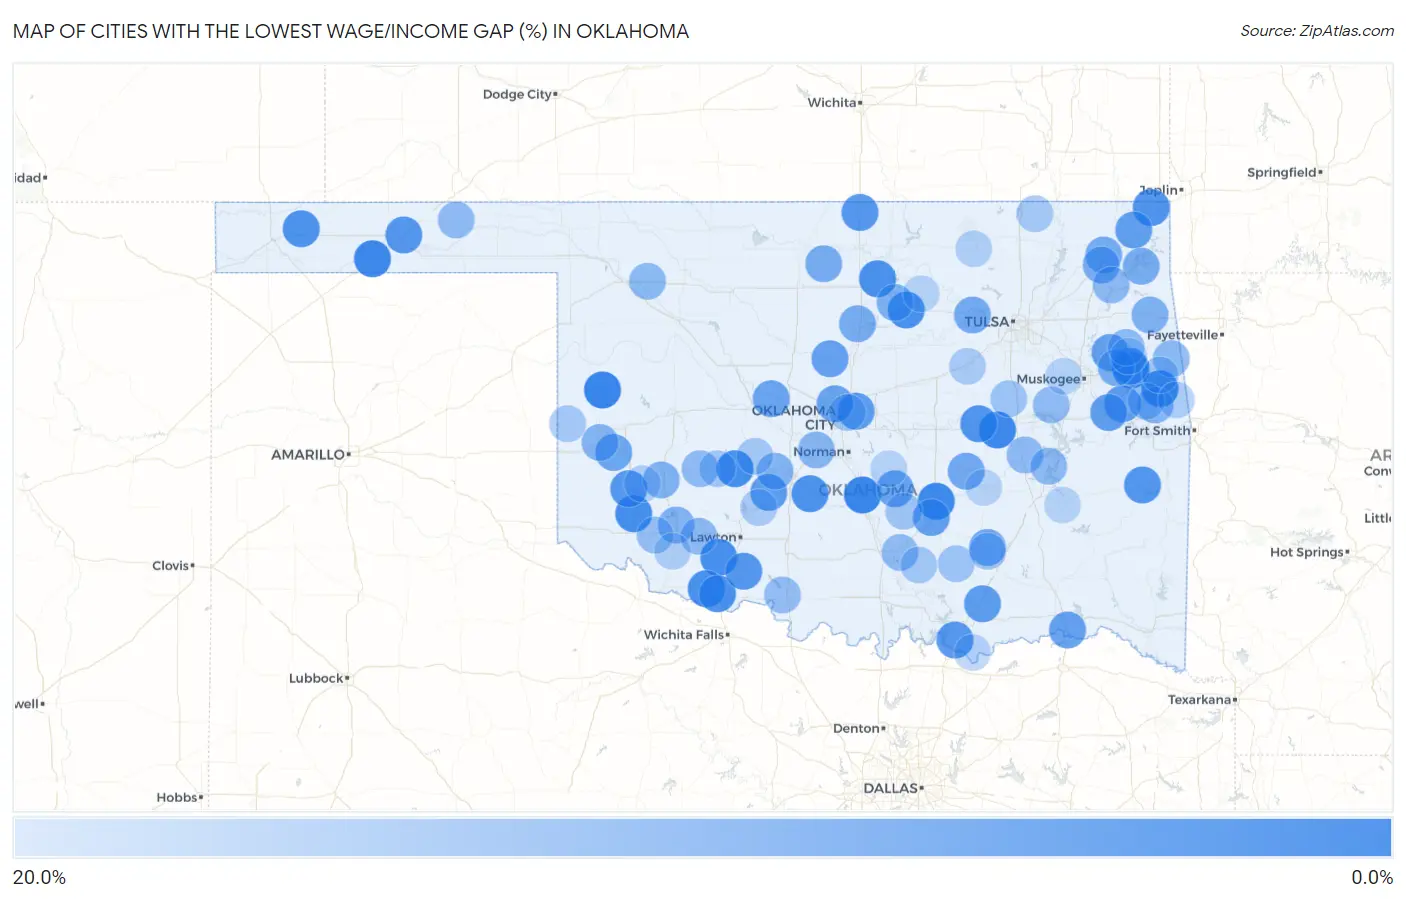
Map of Cities with the Lowest Wage/Income Gap (%) in Oklahoma
20.0%
0.0%
Cities with the Lowest Wage/Income Gap (%) in Oklahoma
| City | Wage/Income Gap (%) | vs State | vs National | |
| 1. | Strong City | 0.24% | 31.4%(-0.311)#1 | 28.0%(-0.277)#50 |
| 2. | Wayne | 0.61% | 31.4%(-0.308)#2 | 28.0%(-0.274)#141 |
| 3. | Weleetka | 0.99% | 31.4%(-0.304)#3 | 28.0%(-0.270)#251 |
| 4. | Goodwell | 1.0% | 31.4%(-0.304)#4 | 28.0%(-0.270)#258 |
| 5. | Greasy | 1.0% | 31.4%(-0.304)#5 | 28.0%(-0.270)#259 |
| 6. | Byng | 1.2% | 31.4%(-0.302)#6 | 28.0%(-0.268)#302 |
| 7. | Fort Cobb | 1.7% | 31.4%(-0.297)#7 | 28.0%(-0.263)#443 |
| 8. | Blair | 1.9% | 31.4%(-0.295)#8 | 28.0%(-0.261)#479 |
| 9. | Faxon | 2.0% | 31.4%(-0.294)#9 | 28.0%(-0.260)#502 |
| 10. | Keys | 2.2% | 31.4%(-0.292)#10 | 28.0%(-0.258)#553 |
| 11. | Grandfield | 2.4% | 31.4%(-0.290)#11 | 28.0%(-0.256)#590 |
| 12. | Red Rock | 2.4% | 31.4%(-0.290)#12 | 28.0%(-0.256)#603 |
| 13. | Glencoe | 2.5% | 31.4%(-0.288)#13 | 28.0%(-0.254)#643 |
| 14. | Devol | 2.8% | 31.4%(-0.286)#14 | 28.0%(-0.252)#690 |
| 15. | Alex | 2.8% | 31.4%(-0.285)#15 | 28.0%(-0.251)#713 |
| 16. | Keyes | 2.9% | 31.4%(-0.285)#16 | 28.0%(-0.250)#746 |
| 17. | Quapaw | 3.3% | 31.4%(-0.281)#17 | 28.0%(-0.247)#820 |
| 18. | Okemah | 3.4% | 31.4%(-0.280)#18 | 28.0%(-0.246)#847 |
| 19. | Fanshawe | 3.7% | 31.4%(-0.276)#19 | 28.0%(-0.242)#933 |
| 20. | Granite | 3.9% | 31.4%(-0.275)#20 | 28.0%(-0.241)#966 |
| 21. | Braman | 4.0% | 31.4%(-0.274)#21 | 28.0%(-0.240)#1,000 |
| 22. | Walters | 4.1% | 31.4%(-0.273)#22 | 28.0%(-0.239)#1,025 |
| 23. | Optima | 4.1% | 31.4%(-0.273)#23 | 28.0%(-0.239)#1,028 |
| 24. | Colbert | 4.2% | 31.4%(-0.272)#24 | 28.0%(-0.238)#1,053 |
| 25. | Spencer | 4.7% | 31.4%(-0.267)#25 | 28.0%(-0.233)#1,177 |
| 26. | Park Hill | 4.9% | 31.4%(-0.265)#26 | 28.0%(-0.231)#1,236 |
| 27. | Caddo | 5.0% | 31.4%(-0.264)#27 | 28.0%(-0.230)#1,263 |
| 28. | Cement | 5.2% | 31.4%(-0.262)#28 | 28.0%(-0.228)#1,301 |
| 29. | Redbird Smith | 5.4% | 31.4%(-0.260)#29 | 28.0%(-0.226)#1,382 |
| 30. | Webbers Falls | 5.4% | 31.4%(-0.260)#30 | 28.0%(-0.225)#1,392 |
| 31. | Narcissa | 5.7% | 31.4%(-0.257)#31 | 28.0%(-0.223)#1,464 |
| 32. | Latta | 5.7% | 31.4%(-0.256)#32 | 28.0%(-0.222)#1,474 |
| 33. | Cimarron City | 5.8% | 31.4%(-0.256)#33 | 28.0%(-0.222)#1,479 |
| 34. | Grant | 5.8% | 31.4%(-0.255)#34 | 28.0%(-0.221)#1,491 |
| 35. | Hulbert | 6.0% | 31.4%(-0.254)#35 | 28.0%(-0.220)#1,541 |
| 36. | Wanette | 6.5% | 31.4%(-0.249)#36 | 28.0%(-0.215)#1,642 |
| 37. | Calumet | 6.7% | 31.4%(-0.247)#37 | 28.0%(-0.213)#1,712 |
| 38. | Shady Grove Cdp Cherokee County | 6.7% | 31.4%(-0.246)#38 | 28.0%(-0.212)#1,723 |
| 39. | The Village | 6.8% | 31.4%(-0.246)#39 | 28.0%(-0.212)#1,739 |
| 40. | Carter | 7.0% | 31.4%(-0.244)#40 | 28.0%(-0.210)#1,783 |
| 41. | Holdenville | 7.4% | 31.4%(-0.240)#41 | 28.0%(-0.206)#1,912 |
| 42. | Coalgate | 7.6% | 31.4%(-0.238)#42 | 28.0%(-0.204)#1,976 |
| 43. | Milfay | 7.7% | 31.4%(-0.237)#43 | 28.0%(-0.203)#2,004 |
| 44. | Vinita | 8.1% | 31.4%(-0.233)#44 | 28.0%(-0.199)#2,117 |
| 45. | Westport | 8.1% | 31.4%(-0.233)#45 | 28.0%(-0.199)#2,129 |
| 46. | Orlando | 8.3% | 31.4%(-0.231)#46 | 28.0%(-0.197)#2,187 |
| 47. | Hunter | 8.3% | 31.4%(-0.231)#47 | 28.0%(-0.197)#2,199 |
| 48. | Big Cabin | 8.4% | 31.4%(-0.230)#48 | 28.0%(-0.196)#2,213 |
| 49. | Dennis | 8.6% | 31.4%(-0.228)#49 | 28.0%(-0.194)#2,282 |
| 50. | Woodall | 8.9% | 31.4%(-0.225)#50 | 28.0%(-0.191)#2,371 |
| 51. | Morrison | 9.0% | 31.4%(-0.224)#51 | 28.0%(-0.190)#2,400 |
| 52. | Cave Spring | 9.3% | 31.4%(-0.221)#52 | 28.0%(-0.187)#2,473 |
| 53. | Hobart | 9.3% | 31.4%(-0.221)#53 | 28.0%(-0.187)#2,502 |
| 54. | Kansas | 9.5% | 31.4%(-0.219)#54 | 28.0%(-0.185)#2,551 |
| 55. | Mountain Park | 9.5% | 31.4%(-0.219)#55 | 28.0%(-0.185)#2,562 |
| 56. | Sayre | 9.9% | 31.4%(-0.215)#56 | 28.0%(-0.181)#2,670 |
| 57. | Verden | 10.0% | 31.4%(-0.214)#57 | 28.0%(-0.180)#2,694 |
| 58. | Brushy | 10.3% | 31.4%(-0.211)#58 | 28.0%(-0.177)#2,788 |
| 59. | Bridge Creek | 10.3% | 31.4%(-0.211)#59 | 28.0%(-0.177)#2,814 |
| 60. | Mooreland | 10.9% | 31.4%(-0.205)#60 | 28.0%(-0.171)#2,970 |
| 61. | Grandview | 11.0% | 31.4%(-0.204)#61 | 28.0%(-0.170)#3,018 |
| 62. | Peavine | 11.1% | 31.4%(-0.203)#62 | 28.0%(-0.169)#3,032 |
| 63. | Hanna | 11.3% | 31.4%(-0.201)#63 | 28.0%(-0.167)#3,084 |
| 64. | Crowder | 11.3% | 31.4%(-0.201)#64 | 28.0%(-0.167)#3,103 |
| 65. | Strang | 11.3% | 31.4%(-0.201)#65 | 28.0%(-0.167)#3,107 |
| 66. | Indiahoma | 11.3% | 31.4%(-0.200)#66 | 28.0%(-0.166)#3,113 |
| 67. | Mountain View | 11.4% | 31.4%(-0.200)#67 | 28.0%(-0.166)#3,121 |
| 68. | Turpin | 11.5% | 31.4%(-0.199)#68 | 28.0%(-0.165)#3,170 |
| 69. | Sulphur | 11.6% | 31.4%(-0.198)#69 | 28.0%(-0.164)#3,199 |
| 70. | Council Hill | 11.6% | 31.4%(-0.198)#70 | 28.0%(-0.164)#3,212 |
| 71. | Waurika | 12.2% | 31.4%(-0.192)#71 | 28.0%(-0.158)#3,391 |
| 72. | Barber | 12.3% | 31.4%(-0.191)#72 | 28.0%(-0.157)#3,443 |
| 73. | Headrick | 12.4% | 31.4%(-0.190)#73 | 28.0%(-0.156)#3,468 |
| 74. | Marble City | 12.4% | 31.4%(-0.190)#74 | 28.0%(-0.156)#3,482 |
| 75. | Okmulgee | 13.1% | 31.4%(-0.182)#75 | 28.0%(-0.148)#3,732 |
| 76. | Bromide | 13.2% | 31.4%(-0.181)#76 | 28.0%(-0.147)#3,765 |
| 77. | Stratford | 13.4% | 31.4%(-0.180)#77 | 28.0%(-0.146)#3,805 |
| 78. | Forest Park | 13.4% | 31.4%(-0.180)#78 | 28.0%(-0.146)#3,810 |
| 79. | Phillips | 13.4% | 31.4%(-0.180)#79 | 28.0%(-0.146)#3,818 |
| 80. | Lyons Switch | 13.7% | 31.4%(-0.177)#80 | 28.0%(-0.143)#3,939 |
| 81. | Pickett | 13.7% | 31.4%(-0.177)#81 | 28.0%(-0.143)#3,943 |
| 82. | Mill Creek | 13.9% | 31.4%(-0.175)#82 | 28.0%(-0.141)#3,992 |
| 83. | Carnegie | 14.0% | 31.4%(-0.174)#83 | 28.0%(-0.140)#4,013 |
| 84. | Wann | 14.1% | 31.4%(-0.173)#84 | 28.0%(-0.139)#4,050 |
| 85. | Gracemont | 14.2% | 31.4%(-0.171)#85 | 28.0%(-0.137)#4,106 |
| 86. | Sweetwater | 14.3% | 31.4%(-0.171)#86 | 28.0%(-0.137)#4,136 |
| 87. | Bristow | 14.7% | 31.4%(-0.167)#87 | 28.0%(-0.133)#4,269 |
| 88. | Fletcher | 14.8% | 31.4%(-0.166)#88 | 28.0%(-0.132)#4,302 |
| 89. | Nicut | 15.3% | 31.4%(-0.161)#89 | 28.0%(-0.127)#4,474 |
| 90. | Manitou | 15.3% | 31.4%(-0.161)#90 | 28.0%(-0.127)#4,480 |
| 91. | Lone Wolf | 15.6% | 31.4%(-0.157)#91 | 28.0%(-0.123)#4,619 |
| 92. | Pawhuska | 15.7% | 31.4%(-0.157)#92 | 28.0%(-0.123)#4,622 |
| 93. | Baron | 15.7% | 31.4%(-0.157)#93 | 28.0%(-0.123)#4,633 |
| 94. | Kemp | 15.7% | 31.4%(-0.157)#94 | 28.0%(-0.123)#4,651 |
| 95. | Taft | 16.0% | 31.4%(-0.154)#95 | 28.0%(-0.120)#4,771 |
| 96. | Tribbey | 16.0% | 31.4%(-0.154)#96 | 28.0%(-0.120)#4,778 |
| 97. | Pawnee | 16.1% | 31.4%(-0.153)#97 | 28.0%(-0.119)#4,805 |
| 98. | Hartshorne | 16.1% | 31.4%(-0.153)#98 | 28.0%(-0.119)#4,819 |
| 99. | Tahlequah | 16.2% | 31.4%(-0.152)#99 | 28.0%(-0.118)#4,865 |
| 100. | Calvin | 16.4% | 31.4%(-0.150)#100 | 28.0%(-0.116)#4,924 |
Common Questions
What are the Top 10 Cities with the Lowest Wage/Income Gap (%) in Oklahoma?
Top 10 Cities with the Lowest Wage/Income Gap (%) in Oklahoma are:
What city has the Lowest Wage/Income Gap (%) in Oklahoma?
Strong City has the Lowest Wage/Income Gap (%) in Oklahoma with 0.24%.
What is the Wage / Income Gap in Percentage Terms in the State of Oklahoma?
Wage / Income Gap in Percentage Terms in Oklahoma is 31.4%.
What is the Wage / Income Gap in Percentage Terms in the United States?
Wage / Income Gap in Percentage Terms in the United States is 28.0%.