East Petersburg borough, PA Map & Demographics
East Petersburg borough Overview
$39,661
PER CAPITA INCOME
$92,708
AVG FAMILY INCOME
$85,828
AVG HOUSEHOLD INCOME
48.3%
WAGE / INCOME GAP [ % ]
51.7¢/ $1
WAGE / INCOME GAP [ $ ]
0.33
INEQUALITY / GINI INDEX
4,588
TOTAL POPULATION
2,281
MALE POPULATION
2,307
FEMALE POPULATION
98.87
MALES / 100 FEMALES
101.14
FEMALES / 100 MALES
45.4
MEDIAN AGE
2.8
AVG FAMILY SIZE
2.4
AVG HOUSEHOLD SIZE
2,875
LABOR FORCE [ PEOPLE ]
74.8%
PERCENT IN LABOR FORCE
2.2%
UNEMPLOYMENT RATE
Income in East Petersburg borough
Income Overview in East Petersburg borough
Per Capita Income in East Petersburg borough is $39,661, while median incomes of families and households are $92,708 and $85,828 respectively.
| Characteristic | Number | Measure |
| Per Capita Income | 4,588 | $39,661 |
| Median Family Income | 1,396 | $92,708 |
| Mean Family Income | 1,396 | $106,669 |
| Median Household Income | 1,923 | $85,828 |
| Mean Household Income | 1,923 | $94,278 |
| Income Deficit | 1,396 | $0 |
| Wage / Income Gap (%) | 4,588 | 48.27% |
| Wage / Income Gap ($) | 4,588 | 51.73¢ per $1 |
| Gini / Inequality Index | 4,588 | 0.33 |
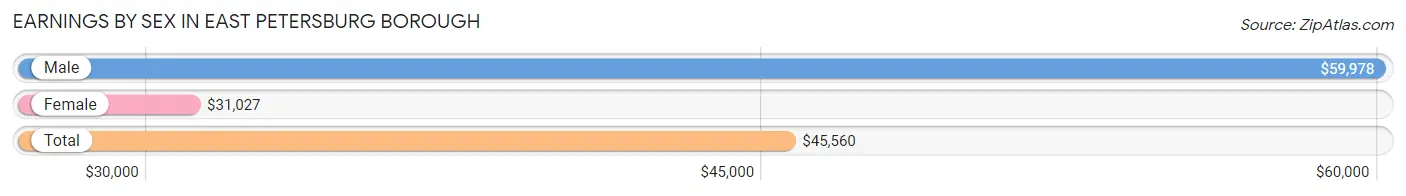
Earnings by Sex in East Petersburg borough
Average Earnings in East Petersburg borough are $45,560, $59,978 for men and $31,027 for women, a difference of 48.3%.
| Sex | Number | Average Earnings |
| Male | 1,445 (49.7%) | $59,978 |
| Female | 1,460 (50.3%) | $31,027 |
| Total | 2,905 (100.0%) | $45,560 |
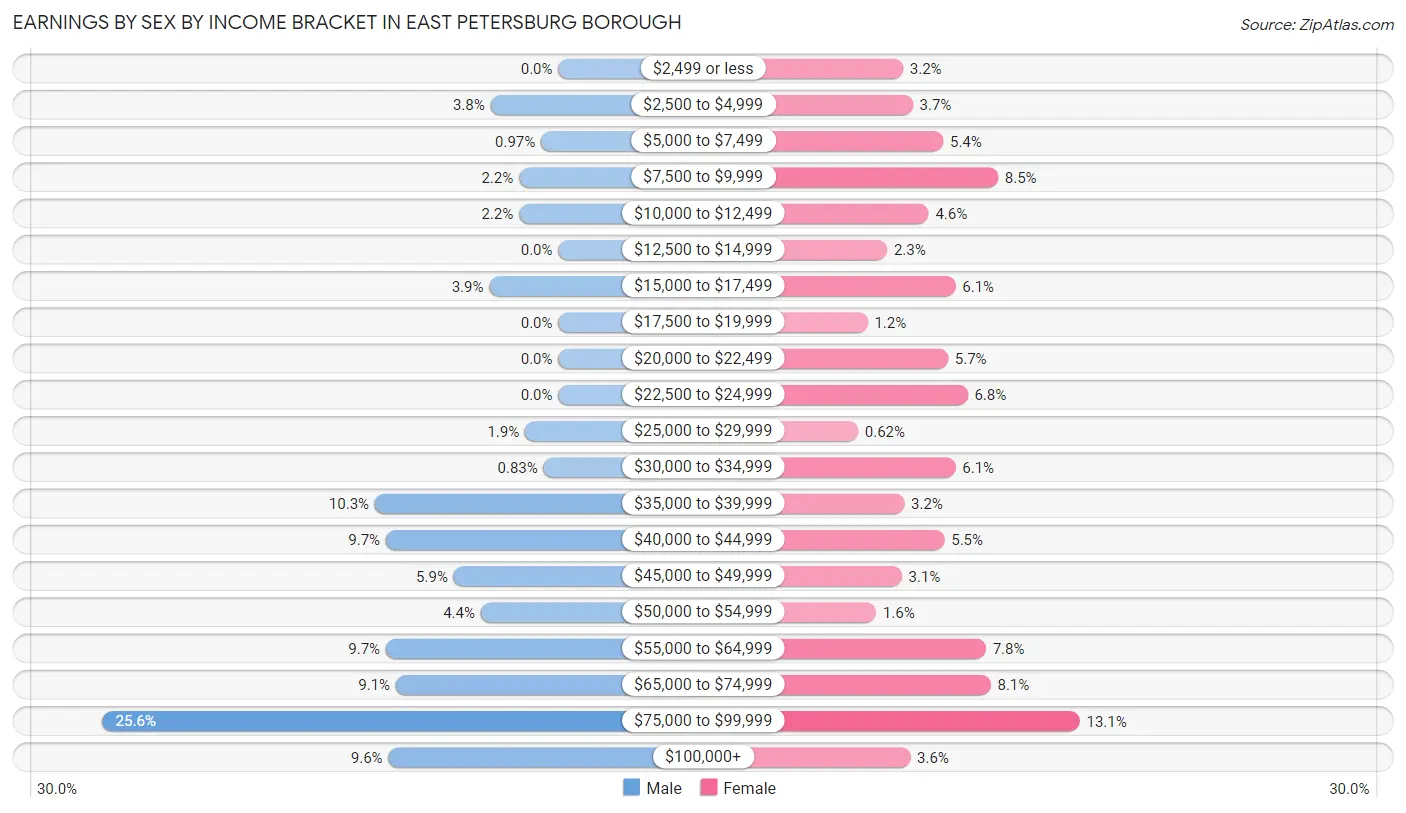
Earnings by Sex by Income Bracket in East Petersburg borough
The most common earnings brackets in East Petersburg borough are $75,000 to $99,999 for men (370 | 25.6%) and $75,000 to $99,999 for women (191 | 13.1%).
| Income | Male | Female |
| $2,499 or less | 0 (0.0%) | 46 (3.2%) |
| $2,500 to $4,999 | 55 (3.8%) | 54 (3.7%) |
| $5,000 to $7,499 | 14 (1.0%) | 79 (5.4%) |
| $7,500 to $9,999 | 32 (2.2%) | 124 (8.5%) |
| $10,000 to $12,499 | 32 (2.2%) | 67 (4.6%) |
| $12,500 to $14,999 | 0 (0.0%) | 33 (2.3%) |
| $15,000 to $17,499 | 56 (3.9%) | 89 (6.1%) |
| $17,500 to $19,999 | 0 (0.0%) | 17 (1.2%) |
| $20,000 to $22,499 | 0 (0.0%) | 83 (5.7%) |
| $22,500 to $24,999 | 0 (0.0%) | 99 (6.8%) |
| $25,000 to $29,999 | 27 (1.9%) | 9 (0.6%) |
| $30,000 to $34,999 | 12 (0.8%) | 89 (6.1%) |
| $35,000 to $39,999 | 149 (10.3%) | 47 (3.2%) |
| $40,000 to $44,999 | 140 (9.7%) | 80 (5.5%) |
| $45,000 to $49,999 | 85 (5.9%) | 45 (3.1%) |
| $50,000 to $54,999 | 63 (4.4%) | 24 (1.6%) |
| $55,000 to $64,999 | 140 (9.7%) | 114 (7.8%) |
| $65,000 to $74,999 | 132 (9.1%) | 118 (8.1%) |
| $75,000 to $99,999 | 370 (25.6%) | 191 (13.1%) |
| $100,000+ | 138 (9.6%) | 52 (3.6%) |
| Total | 1,445 (100.0%) | 1,460 (100.0%) |
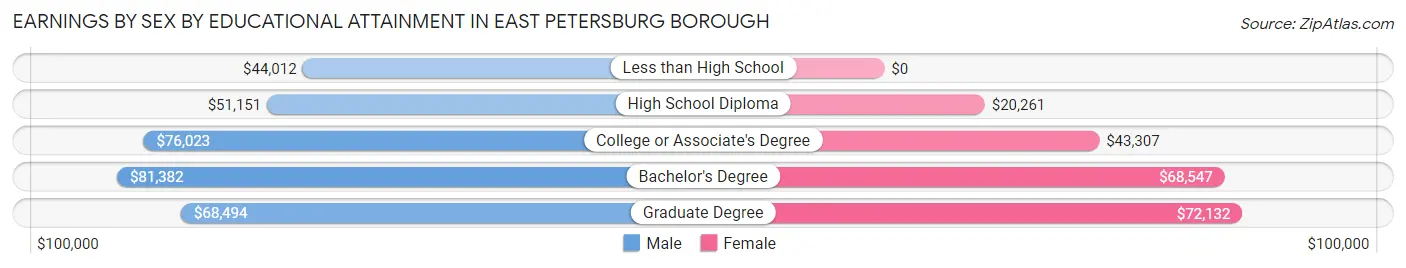
Earnings by Sex by Educational Attainment in East Petersburg borough
Average earnings in East Petersburg borough are $63,323 for men and $37,721 for women, a difference of 40.4%. Men with an educational attainment of bachelor's degree enjoy the highest average annual earnings of $81,382, while those with less than high school education earn the least with $44,012. Women with an educational attainment of graduate degree earn the most with the average annual earnings of $72,132, while those with high school diploma education have the smallest earnings of $20,261.
| Educational Attainment | Male Income | Female Income |
| Less than High School | $44,012 | $0 |
| High School Diploma | $51,151 | $20,261 |
| College or Associate's Degree | $76,023 | $43,307 |
| Bachelor's Degree | $81,382 | $68,547 |
| Graduate Degree | $68,494 | $72,132 |
| Total | $63,323 | $37,721 |
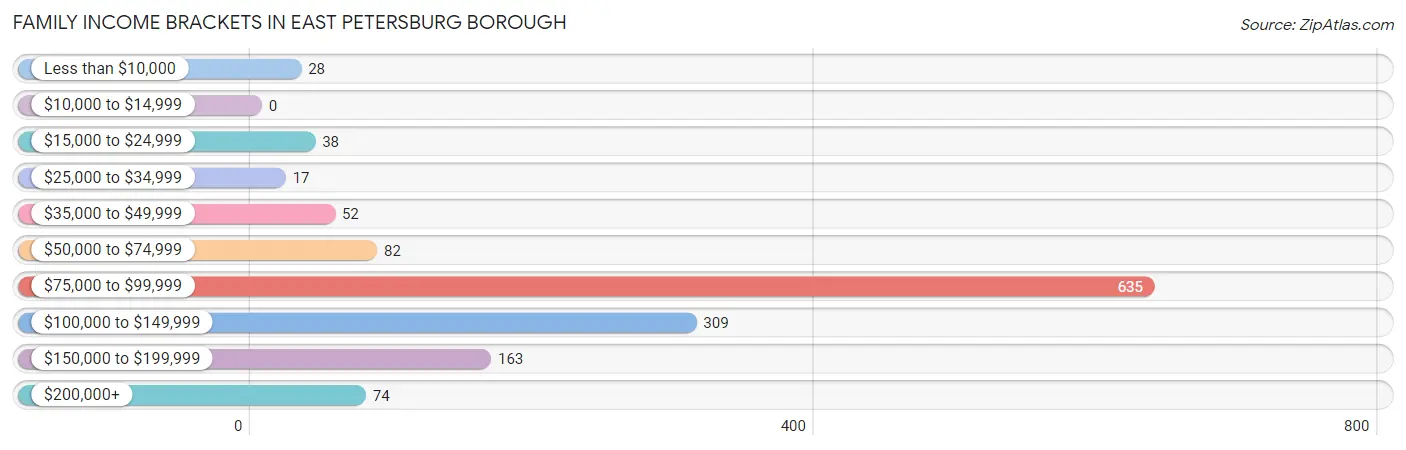
Family Income in East Petersburg borough
Family Income Brackets in East Petersburg borough
According to the East Petersburg borough family income data, there are 635 families falling into the $75,000 to $99,999 income range, which is the most common income bracket and makes up 45.5% of all families.
| Income Bracket | # Families | % Families |
| Less than $10,000 | 28 | 2.0% |
| $10,000 to $14,999 | 0 | 0.0% |
| $15,000 to $24,999 | 38 | 2.7% |
| $25,000 to $34,999 | 17 | 1.2% |
| $35,000 to $49,999 | 52 | 3.7% |
| $50,000 to $74,999 | 82 | 5.9% |
| $75,000 to $99,999 | 635 | 45.5% |
| $100,000 to $149,999 | 309 | 22.1% |
| $150,000 to $199,999 | 163 | 11.7% |
| $200,000+ | 74 | 5.3% |
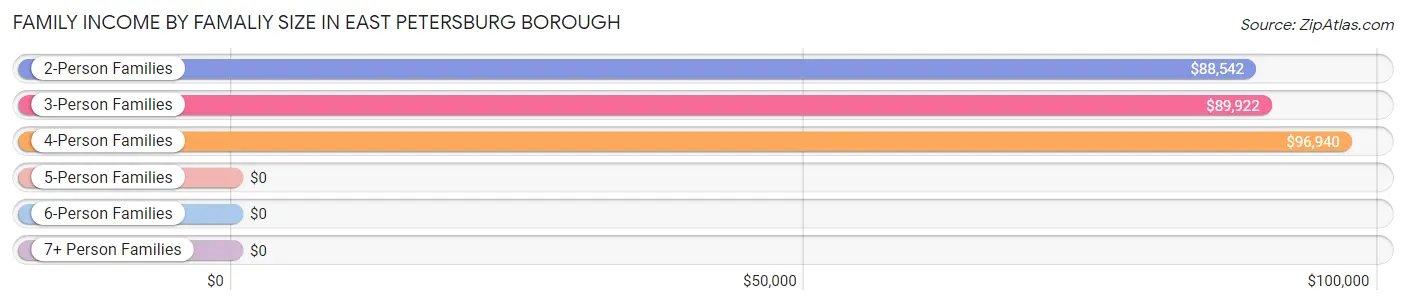
Family Income by Famaliy Size in East Petersburg borough
4-person families (316 | 22.6%) account for the highest median family income in East Petersburg borough with $96,940 per family, while 2-person families (715 | 51.2%) have the highest median income of $44,271 per family member.
| Income Bracket | # Families | Median Income |
| 2-Person Families | 715 (51.2%) | $88,542 |
| 3-Person Families | 233 (16.7%) | $89,922 |
| 4-Person Families | 316 (22.6%) | $96,940 |
| 5-Person Families | 132 (9.5%) | $0 |
| 6-Person Families | 0 (0.0%) | $0 |
| 7+ Person Families | 0 (0.0%) | $0 |
| Total | 1,396 (100.0%) | $92,708 |
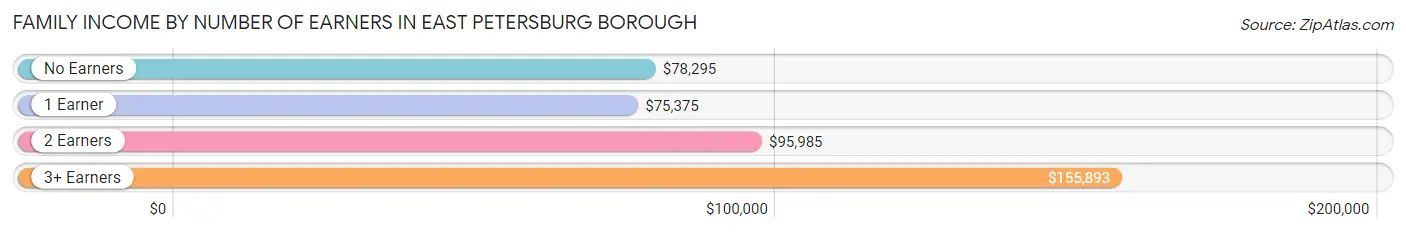
Family Income by Number of Earners in East Petersburg borough
The median family income in East Petersburg borough is $92,708, with families comprising 3+ earners (258) having the highest median family income of $155,893, while families with 1 earner (248) have the lowest median family income of $75,375, accounting for 18.5% and 17.8% of families, respectively.
| Number of Earners | # Families | Median Income |
| No Earners | 178 (12.8%) | $78,295 |
| 1 Earner | 248 (17.8%) | $75,375 |
| 2 Earners | 712 (51.0%) | $95,985 |
| 3+ Earners | 258 (18.5%) | $155,893 |
| Total | 1,396 (100.0%) | $92,708 |
Household Income in East Petersburg borough
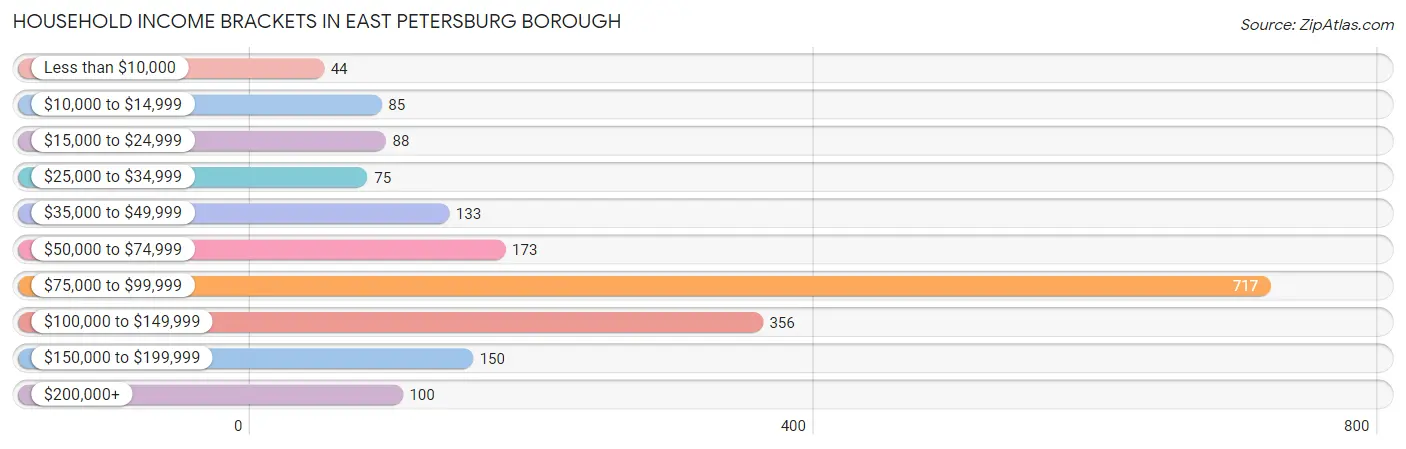
Household Income Brackets in East Petersburg borough
With 717 households falling in the category, the $75,000 to $99,999 income range is the most frequent in East Petersburg borough, accounting for 37.3% of all households. In contrast, only 44 households (2.3%) fall into the less than $10,000 income bracket, making it the least populous group.
| Income Bracket | # Households | % Households |
| Less than $10,000 | 44 | 2.3% |
| $10,000 to $14,999 | 85 | 4.4% |
| $15,000 to $24,999 | 88 | 4.6% |
| $25,000 to $34,999 | 75 | 3.9% |
| $35,000 to $49,999 | 133 | 6.9% |
| $50,000 to $74,999 | 173 | 9.0% |
| $75,000 to $99,999 | 717 | 37.3% |
| $100,000 to $149,999 | 356 | 18.5% |
| $150,000 to $199,999 | 150 | 7.8% |
| $200,000+ | 100 | 5.2% |
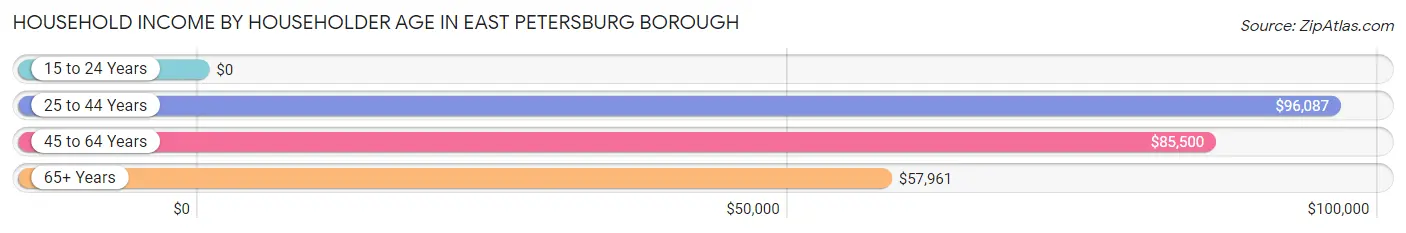
Household Income by Householder Age in East Petersburg borough
The median household income in East Petersburg borough is $85,828, with the highest median household income of $96,087 found in the 25 to 44 years age bracket for the primary householder. A total of 560 households (29.1%) fall into this category.
| Income Bracket | # Households | Median Income |
| 15 to 24 Years | 0 (0.0%) | $0 |
| 25 to 44 Years | 560 (29.1%) | $96,087 |
| 45 to 64 Years | 726 (37.8%) | $85,500 |
| 65+ Years | 637 (33.1%) | $57,961 |
| Total | 1,923 (100.0%) | $85,828 |
Poverty in East Petersburg borough
Income Below Poverty by Sex and Age in East Petersburg borough
With 5.1% poverty level for males and 8.3% for females among the residents of East Petersburg borough, 15 year old males and 75 year old and over females are the most vulnerable to poverty, with 25 males (100.0%) and 55 females (28.3%) in their respective age groups living below the poverty level.
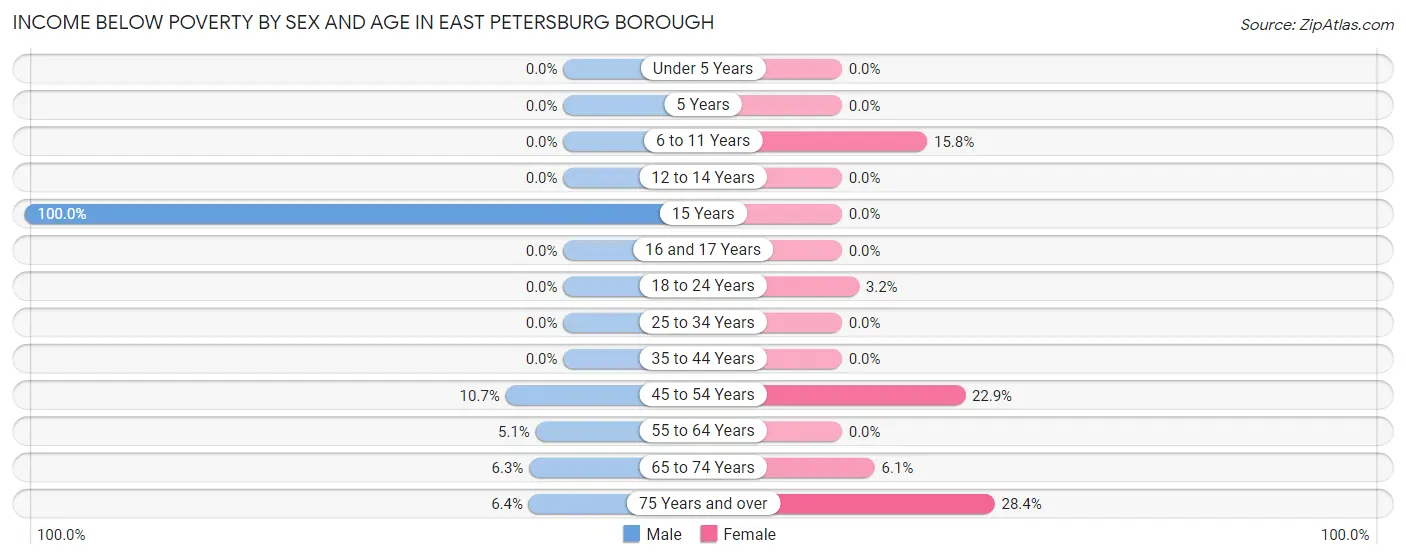
| Age Bracket | Male | Female |
| Under 5 Years | 0 (0.0%) | 0 (0.0%) |
| 5 Years | 0 (0.0%) | 0 (0.0%) |
| 6 to 11 Years | 0 (0.0%) | 38 (15.8%) |
| 12 to 14 Years | 0 (0.0%) | 0 (0.0%) |
| 15 Years | 25 (100.0%) | 0 (0.0%) |
| 16 and 17 Years | 0 (0.0%) | 0 (0.0%) |
| 18 to 24 Years | 0 (0.0%) | 2 (3.2%) |
| 25 to 34 Years | 0 (0.0%) | 0 (0.0%) |
| 35 to 44 Years | 0 (0.0%) | 0 (0.0%) |
| 45 to 54 Years | 44 (10.7%) | 80 (22.9%) |
| 55 to 64 Years | 16 (5.1%) | 0 (0.0%) |
| 65 to 74 Years | 18 (6.3%) | 17 (6.1%) |
| 75 Years and over | 14 (6.4%) | 55 (28.3%) |
| Total | 117 (5.1%) | 192 (8.3%) |
Income Above Poverty by Sex and Age in East Petersburg borough
According to the poverty statistics in East Petersburg borough, males aged under 5 years and females aged under 5 years are the age groups that are most secure financially, with 100.0% of males and 100.0% of females in these age groups living above the poverty line.
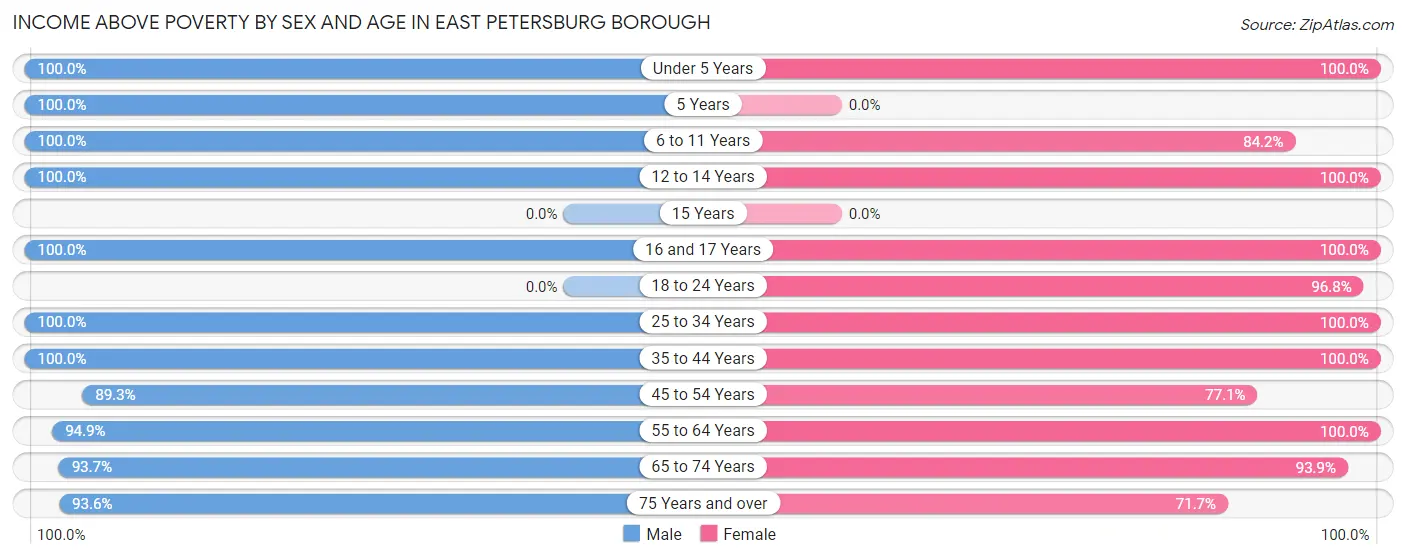
| Age Bracket | Male | Female |
| Under 5 Years | 59 (100.0%) | 97 (100.0%) |
| 5 Years | 124 (100.0%) | 0 (0.0%) |
| 6 to 11 Years | 138 (100.0%) | 202 (84.2%) |
| 12 to 14 Years | 47 (100.0%) | 15 (100.0%) |
| 15 Years | 0 (0.0%) | 0 (0.0%) |
| 16 and 17 Years | 55 (100.0%) | 131 (100.0%) |
| 18 to 24 Years | 0 (0.0%) | 61 (96.8%) |
| 25 to 34 Years | 323 (100.0%) | 351 (100.0%) |
| 35 to 44 Years | 285 (100.0%) | 313 (100.0%) |
| 45 to 54 Years | 367 (89.3%) | 270 (77.1%) |
| 55 to 64 Years | 296 (94.9%) | 274 (100.0%) |
| 65 to 74 Years | 266 (93.7%) | 262 (93.9%) |
| 75 Years and over | 204 (93.6%) | 139 (71.7%) |
| Total | 2,164 (94.9%) | 2,115 (91.7%) |
Income Below Poverty Among Married-Couple Families in East Petersburg borough
The poverty statistics for married-couple families in East Petersburg borough show that 3.0% or 37 of the total 1,247 families live below the poverty line. Families with 1 or 2 children have the highest poverty rate of 8.2%, comprising of 37 families. On the other hand, families with no children have the lowest poverty rate of 0.0%, which includes 0 families.
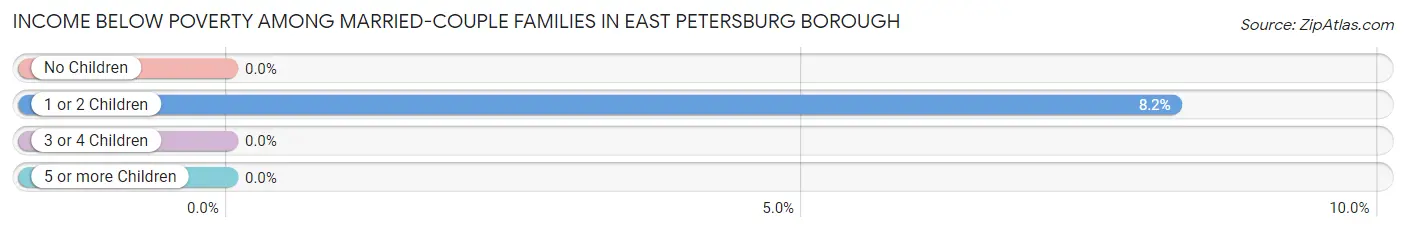
| Children | Above Poverty | Below Poverty |
| No Children | 709 (100.0%) | 0 (0.0%) |
| 1 or 2 Children | 413 (91.8%) | 37 (8.2%) |
| 3 or 4 Children | 88 (100.0%) | 0 (0.0%) |
| 5 or more Children | 0 (0.0%) | 0 (0.0%) |
| Total | 1,210 (97.0%) | 37 (3.0%) |
Income Below Poverty Among Single-Parent Households in East Petersburg borough
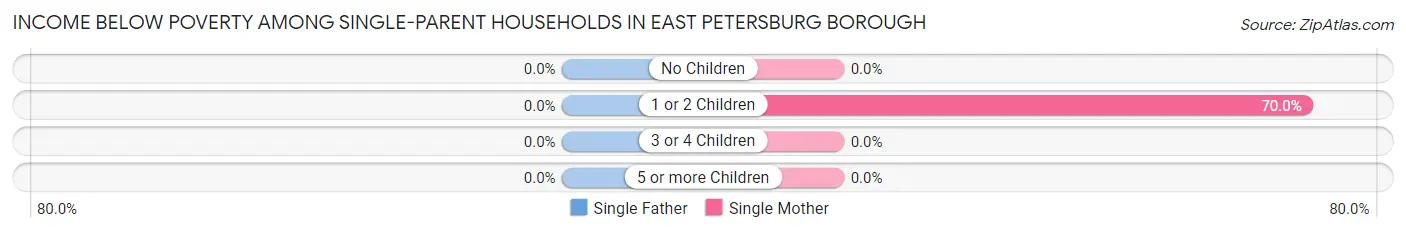
| Children | Single Father | Single Mother |
| No Children | 0 (0.0%) | 0 (0.0%) |
| 1 or 2 Children | 0 (0.0%) | 28 (70.0%) |
| 3 or 4 Children | 0 (0.0%) | 0 (0.0%) |
| 5 or more Children | 0 (0.0%) | 0 (0.0%) |
| Total | 0 (0.0%) | 28 (27.2%) |
Income Below Poverty Among Married-Couple vs Single-Parent Households in East Petersburg borough
The poverty data for East Petersburg borough shows that 37 of the married-couple family households (3.0%) and 28 of the single-parent households (18.8%) are living below the poverty level. Within the married-couple family households, those with 1 or 2 children have the highest poverty rate, with 37 households (8.2%) falling below the poverty line. Among the single-parent households, those with 1 or 2 children have the highest poverty rate, with 28 household (50.9%) living below poverty.
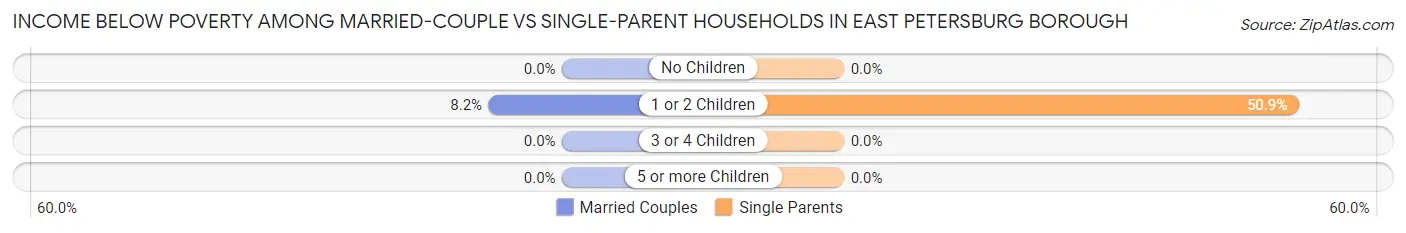
| Children | Married-Couple Families | Single-Parent Households |
| No Children | 0 (0.0%) | 0 (0.0%) |
| 1 or 2 Children | 37 (8.2%) | 28 (50.9%) |
| 3 or 4 Children | 0 (0.0%) | 0 (0.0%) |
| 5 or more Children | 0 (0.0%) | 0 (0.0%) |
| Total | 37 (3.0%) | 28 (18.8%) |
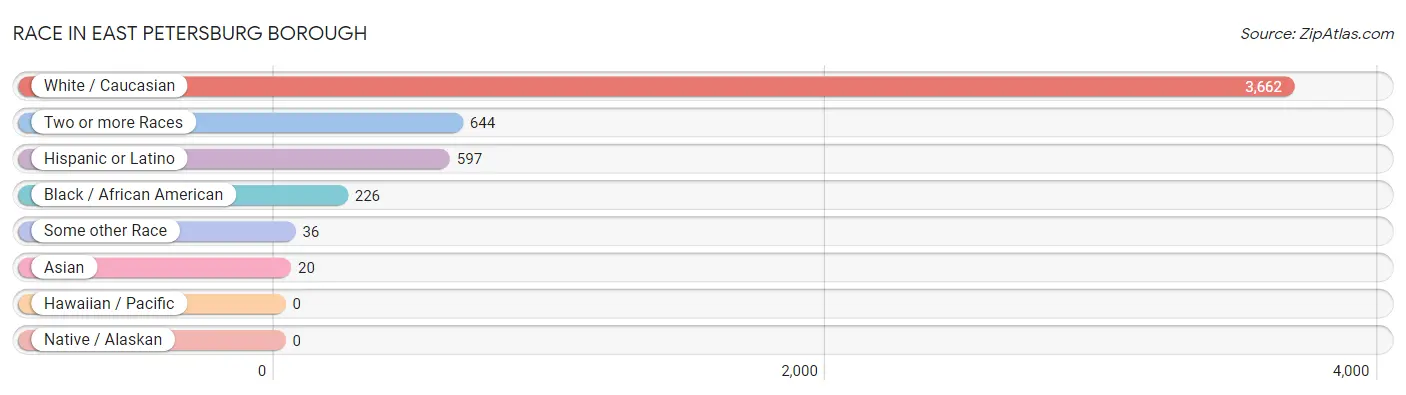
Race in East Petersburg borough
The most populous races in East Petersburg borough are White / Caucasian (3,662 | 79.8%), Two or more Races (644 | 14.0%), and Hispanic or Latino (597 | 13.0%).
| Race | # Population | % Population |
| Asian | 20 | 0.4% |
| Black / African American | 226 | 4.9% |
| Hawaiian / Pacific | 0 | 0.0% |
| Hispanic or Latino | 597 | 13.0% |
| Native / Alaskan | 0 | 0.0% |
| White / Caucasian | 3,662 | 79.8% |
| Two or more Races | 644 | 14.0% |
| Some other Race | 36 | 0.8% |
| Total | 4,588 | 100.0% |
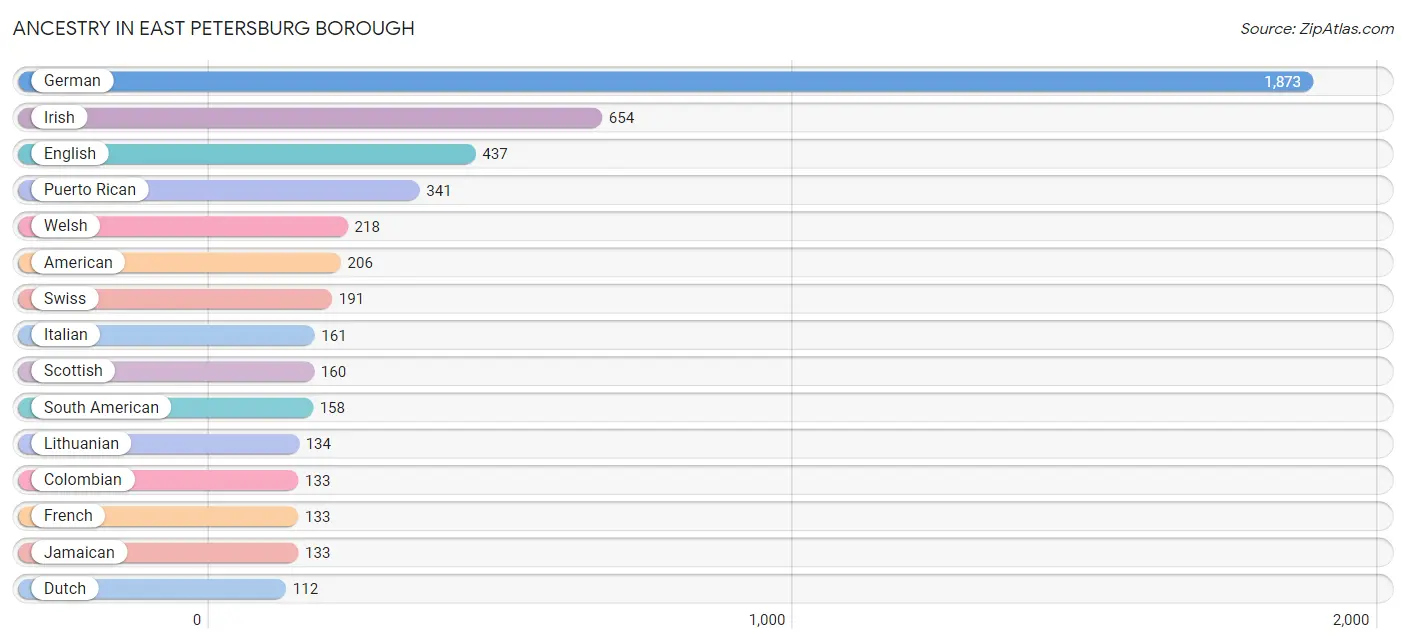
Ancestry in East Petersburg borough
The most populous ancestries reported in East Petersburg borough are German (1,873 | 40.8%), Irish (654 | 14.2%), English (437 | 9.5%), Puerto Rican (341 | 7.4%), and Welsh (218 | 4.8%), together accounting for 76.8% of all East Petersburg borough residents.
| Ancestry | # Population | % Population |
| American | 206 | 4.5% |
| Argentinean | 25 | 0.5% |
| Austrian | 33 | 0.7% |
| Blackfeet | 98 | 2.1% |
| British | 16 | 0.4% |
| Colombian | 133 | 2.9% |
| Czech | 14 | 0.3% |
| Danish | 13 | 0.3% |
| Dutch | 112 | 2.4% |
| Eastern European | 14 | 0.3% |
| English | 437 | 9.5% |
| European | 103 | 2.2% |
| French | 133 | 2.9% |
| German | 1,873 | 40.8% |
| Hungarian | 20 | 0.4% |
| Irish | 654 | 14.2% |
| Italian | 161 | 3.5% |
| Jamaican | 133 | 2.9% |
| Lithuanian | 134 | 2.9% |
| Polish | 72 | 1.6% |
| Puerto Rican | 341 | 7.4% |
| Romanian | 20 | 0.4% |
| Scotch-Irish | 86 | 1.9% |
| Scottish | 160 | 3.5% |
| Slovak | 14 | 0.3% |
| South American | 158 | 3.4% |
| Spaniard | 98 | 2.1% |
| Swiss | 191 | 4.2% |
| Thai | 25 | 0.5% |
| Welsh | 218 | 4.8% | View All 30 Rows |
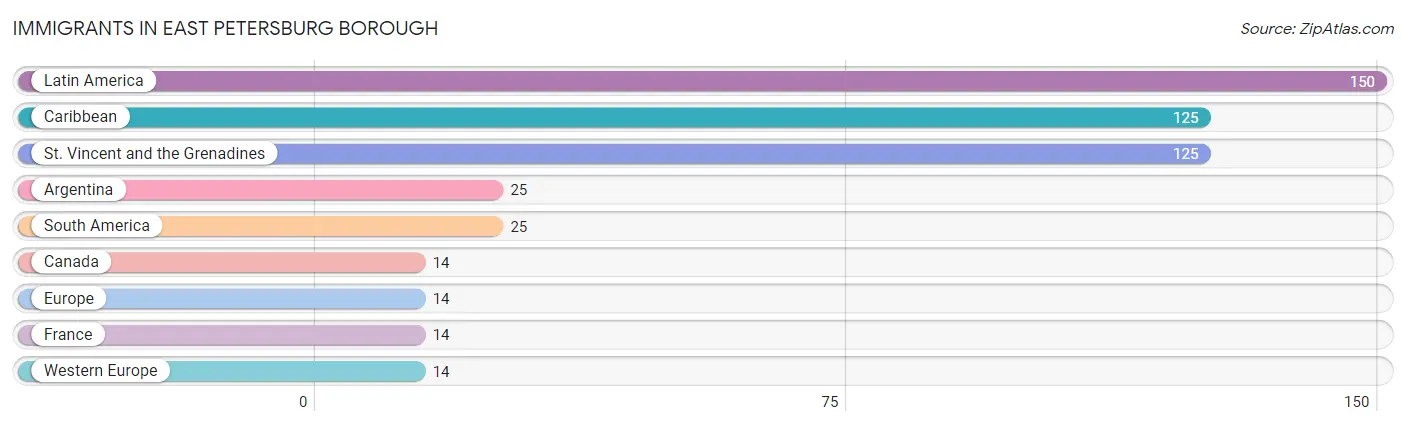
Immigrants in East Petersburg borough
The most numerous immigrant groups reported in East Petersburg borough came from Latin America (150 | 3.3%), Caribbean (125 | 2.7%), St. Vincent and the Grenadines (125 | 2.7%), Argentina (25 | 0.5%), and South America (25 | 0.5%), together accounting for 9.8% of all East Petersburg borough residents.
| Immigration Origin | # Population | % Population |
| Argentina | 25 | 0.5% |
| Canada | 14 | 0.3% |
| Caribbean | 125 | 2.7% |
| Europe | 14 | 0.3% |
| France | 14 | 0.3% |
| Latin America | 150 | 3.3% |
| South America | 25 | 0.5% |
| St. Vincent and the Grenadines | 125 | 2.7% |
| Western Europe | 14 | 0.3% | View All 9 Rows |
Sex and Age in East Petersburg borough
Sex and Age in East Petersburg borough
The most populous age groups in East Petersburg borough are 30 to 34 Years (281 | 12.3%) for men and 50 to 54 Years (234 | 10.1%) for women.
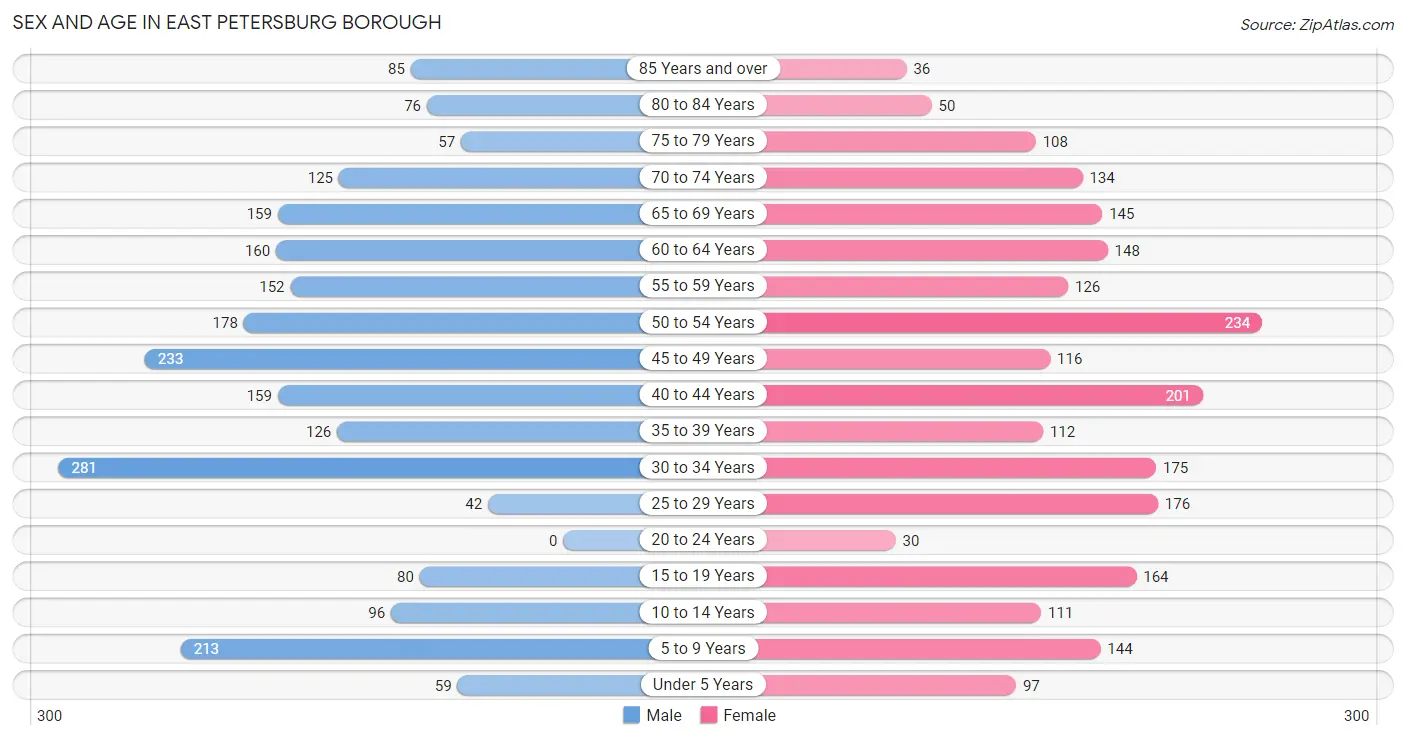
| Age Bracket | Male | Female |
| Under 5 Years | 59 (2.6%) | 97 (4.2%) |
| 5 to 9 Years | 213 (9.3%) | 144 (6.2%) |
| 10 to 14 Years | 96 (4.2%) | 111 (4.8%) |
| 15 to 19 Years | 80 (3.5%) | 164 (7.1%) |
| 20 to 24 Years | 0 (0.0%) | 30 (1.3%) |
| 25 to 29 Years | 42 (1.8%) | 176 (7.6%) |
| 30 to 34 Years | 281 (12.3%) | 175 (7.6%) |
| 35 to 39 Years | 126 (5.5%) | 112 (4.9%) |
| 40 to 44 Years | 159 (7.0%) | 201 (8.7%) |
| 45 to 49 Years | 233 (10.2%) | 116 (5.0%) |
| 50 to 54 Years | 178 (7.8%) | 234 (10.1%) |
| 55 to 59 Years | 152 (6.7%) | 126 (5.5%) |
| 60 to 64 Years | 160 (7.0%) | 148 (6.4%) |
| 65 to 69 Years | 159 (7.0%) | 145 (6.3%) |
| 70 to 74 Years | 125 (5.5%) | 134 (5.8%) |
| 75 to 79 Years | 57 (2.5%) | 108 (4.7%) |
| 80 to 84 Years | 76 (3.3%) | 50 (2.2%) |
| 85 Years and over | 85 (3.7%) | 36 (1.6%) |
| Total | 2,281 (100.0%) | 2,307 (100.0%) |
Families and Households in East Petersburg borough
Median Family Size in East Petersburg borough
The median family size in East Petersburg borough is 2.80 persons per family, with single male/father families (46 | 3.3%) accounting for the largest median family size of 3.13 persons per family. On the other hand, single female/mother families (103 | 7.4%) represent the smallest median family size with 2.65 persons per family.
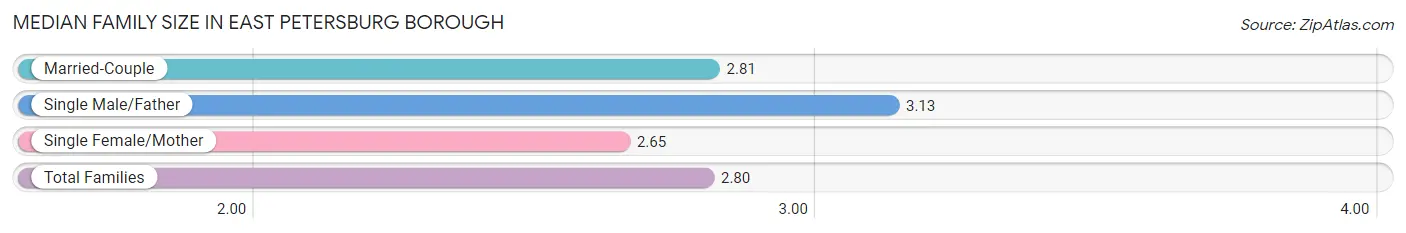
| Family Type | # Families | Family Size |
| Married-Couple | 1,247 (89.3%) | 2.81 |
| Single Male/Father | 46 (3.3%) | 3.13 |
| Single Female/Mother | 103 (7.4%) | 2.65 |
| Total Families | 1,396 (100.0%) | 2.80 |
Median Household Size in East Petersburg borough
The median household size in East Petersburg borough is 2.38 persons per household, with single male/father households (46 | 2.4%) accounting for the largest median household size of 3.13 persons per household. non-family households (527 | 27.4%) represent the smallest median household size with 1.10 persons per household.
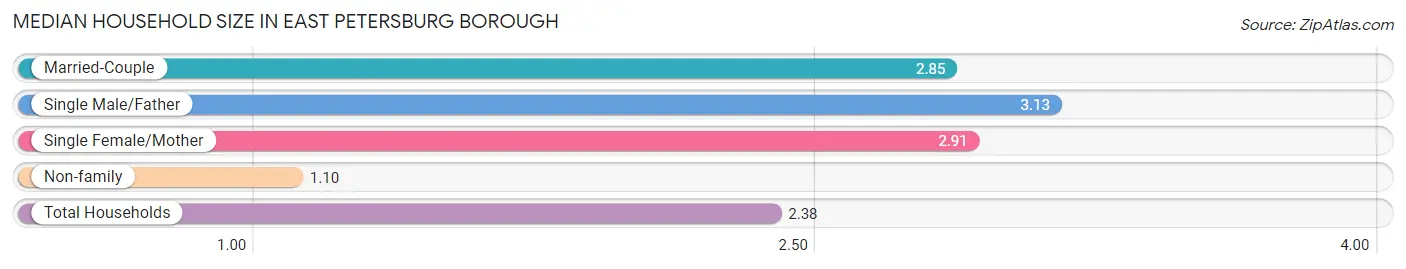
| Household Type | # Households | Household Size |
| Married-Couple | 1,247 (64.8%) | 2.85 |
| Single Male/Father | 46 (2.4%) | 3.13 |
| Single Female/Mother | 103 (5.4%) | 2.91 |
| Non-family | 527 (27.4%) | 1.10 |
| Total Households | 1,923 (100.0%) | 2.38 |
Household Size by Marriage Status in East Petersburg borough
Out of a total of 1,923 households in East Petersburg borough, 1,396 (72.6%) are family households, while 527 (27.4%) are nonfamily households. The most numerous type of family households are 2-person households, comprising 701, and the most common type of nonfamily households are 1-person households, comprising 469.
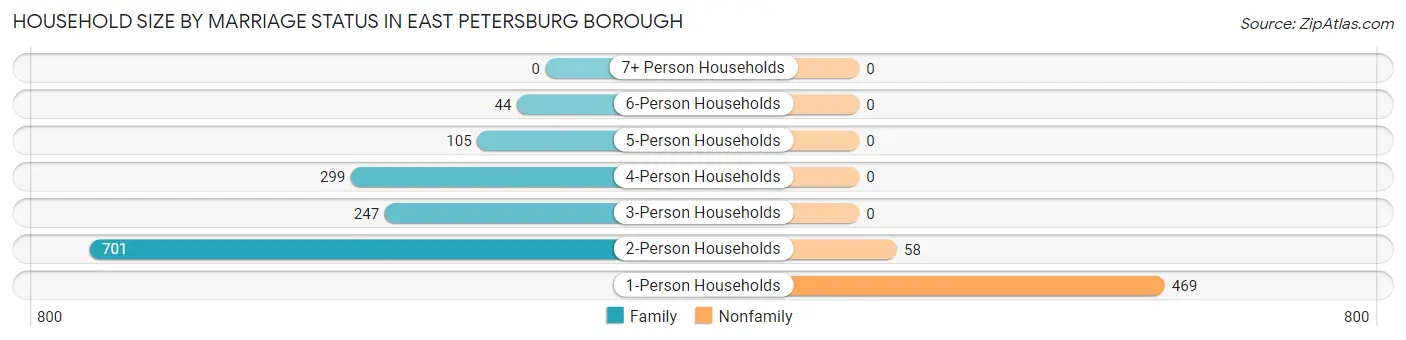
| Household Size | Family Households | Nonfamily Households |
| 1-Person Households | - | 469 (24.4%) |
| 2-Person Households | 701 (36.4%) | 58 (3.0%) |
| 3-Person Households | 247 (12.8%) | 0 (0.0%) |
| 4-Person Households | 299 (15.5%) | 0 (0.0%) |
| 5-Person Households | 105 (5.5%) | 0 (0.0%) |
| 6-Person Households | 44 (2.3%) | 0 (0.0%) |
| 7+ Person Households | 0 (0.0%) | 0 (0.0%) |
| Total | 1,396 (72.6%) | 527 (27.4%) |
Female Fertility in East Petersburg borough
Fertility by Age in East Petersburg borough
Average fertility rate in East Petersburg borough is 21.0 births per 1,000 women. Women in the age bracket of 20 to 34 years have the highest fertility rate with 58.0 births per 1,000 women. Women in the age bracket of 20 to 34 years acount for 100.0% of all women with births.
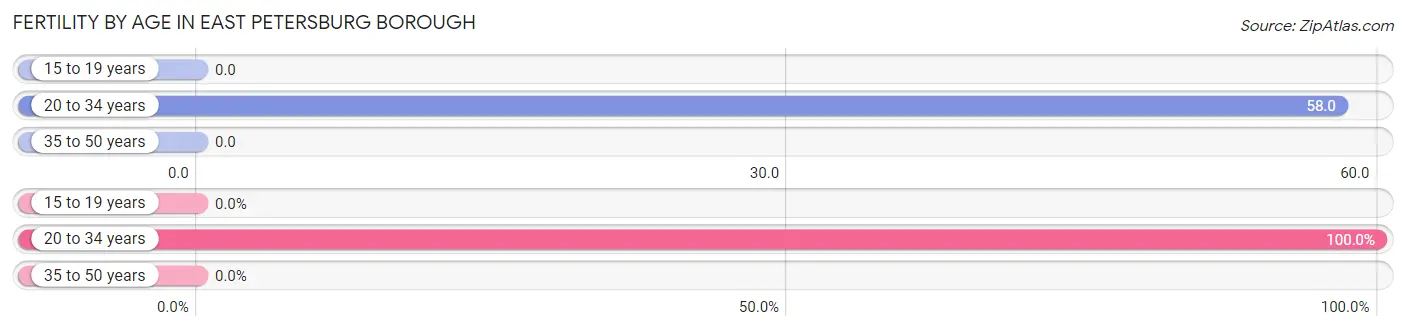
| Age Bracket | Women with Births | Births / 1,000 Women |
| 15 to 19 years | 0 (0.0%) | 0.0 |
| 20 to 34 years | 22 (100.0%) | 58.0 |
| 35 to 50 years | 0 (0.0%) | 0.0 |
| Total | 22 (100.0%) | 21.0 |
Fertility by Age by Marriage Status in East Petersburg borough
90.9% of women with births (22) in East Petersburg borough are married. The highest percentage of unmarried women with births falls into 20 to 34 years age bracket with 9.1% of them unmarried at the time of birth, while the lowest percentage of unmarried women with births belong to 20 to 34 years age bracket with 9.1% of them unmarried.
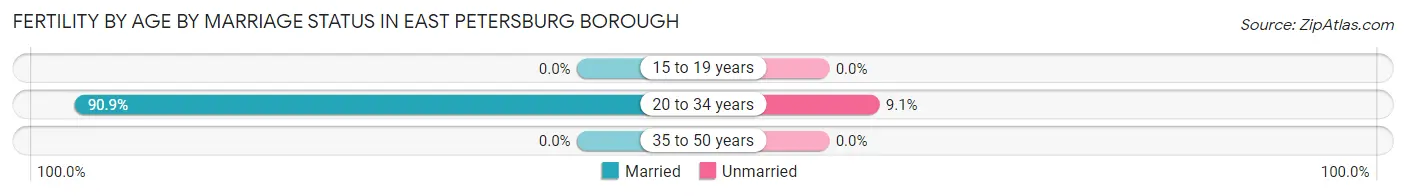
| Age Bracket | Married | Unmarried |
| 15 to 19 years | 0 (0.0%) | 0 (0.0%) |
| 20 to 34 years | 20 (90.9%) | 2 (9.1%) |
| 35 to 50 years | 0 (0.0%) | 0 (0.0%) |
| Total | 20 (90.9%) | 2 (9.1%) |
Fertility by Education in East Petersburg borough
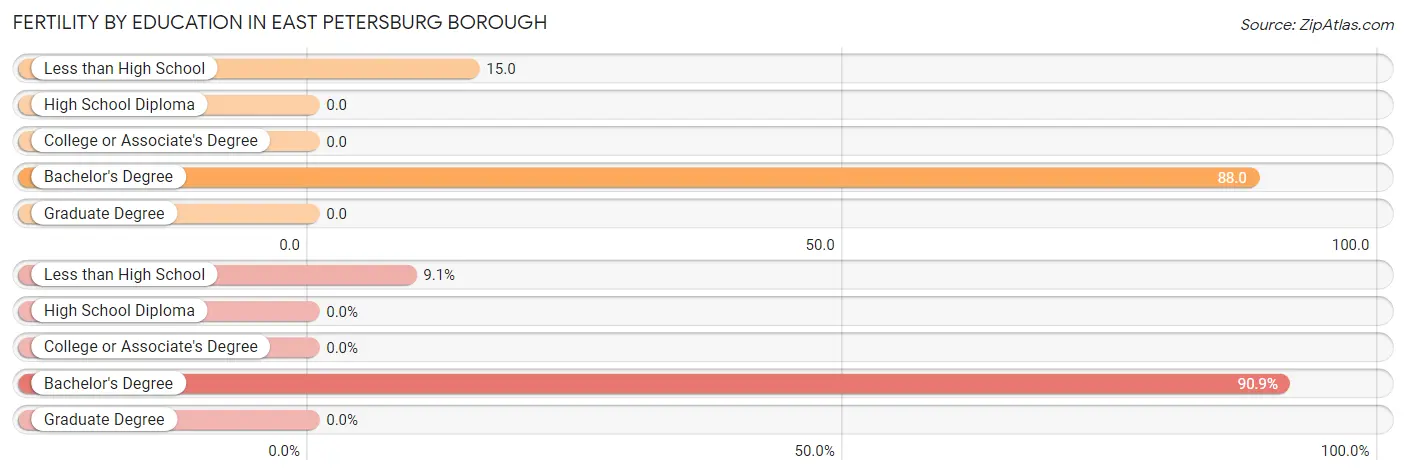
| Educational Attainment | Women with Births | Births / 1,000 Women |
| Less than High School | 2 (9.1%) | 15.0 |
| High School Diploma | 0 (0.0%) | 0.0 |
| College or Associate's Degree | 0 (0.0%) | 0.0 |
| Bachelor's Degree | 20 (90.9%) | 88.0 |
| Graduate Degree | 0 (0.0%) | 0.0 |
| Total | 22 (100.0%) | 21.0 |
Fertility by Education by Marriage Status in East Petersburg borough
9.1% of women with births in East Petersburg borough are unmarried. Women with the educational attainment of bachelor's degree are most likely to be married with 100.0% of them married at childbirth, while women with the educational attainment of less than high school are least likely to be married with 100.0% of them unmarried at childbirth.
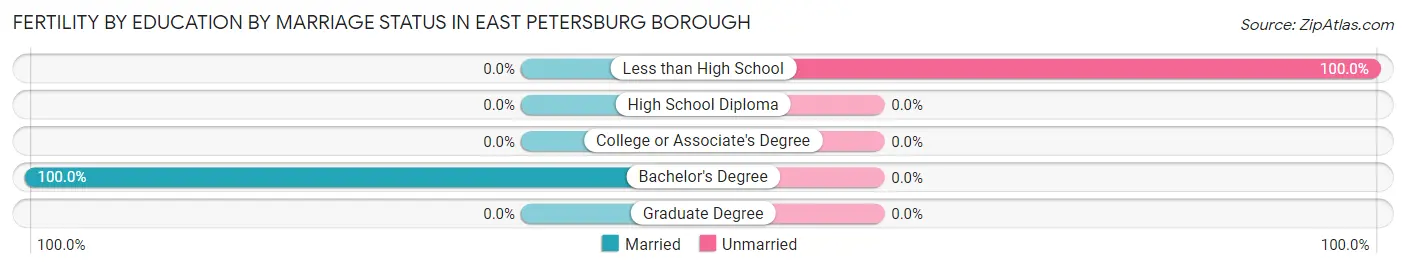
| Educational Attainment | Married | Unmarried |
| Less than High School | 0 (0.0%) | 2 (100.0%) |
| High School Diploma | 0 (0.0%) | 0 (0.0%) |
| College or Associate's Degree | 0 (0.0%) | 0 (0.0%) |
| Bachelor's Degree | 20 (100.0%) | 0 (0.0%) |
| Graduate Degree | 0 (0.0%) | 0 (0.0%) |
| Total | 20 (90.9%) | 2 (9.1%) |
Employment Characteristics in East Petersburg borough
Employment by Class of Employer in East Petersburg borough
Among the 2,738 employed individuals in East Petersburg borough, private company employees (1,930 | 70.5%), not-for-profit organizations (321 | 11.7%), and local government employees (276 | 10.1%) make up the most common classes of employment.
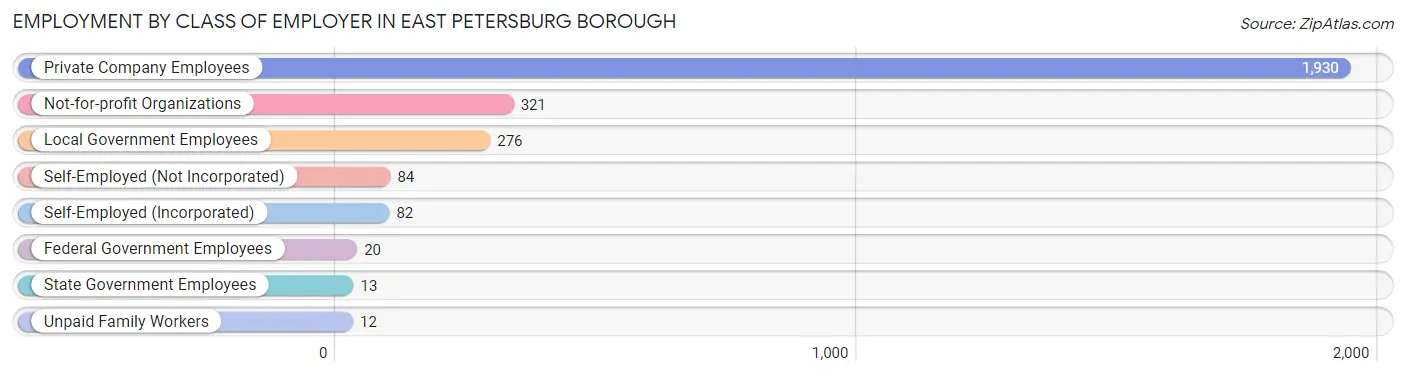
| Employer Class | # Employees | % Employees |
| Private Company Employees | 1,930 | 70.5% |
| Self-Employed (Incorporated) | 82 | 3.0% |
| Self-Employed (Not Incorporated) | 84 | 3.1% |
| Not-for-profit Organizations | 321 | 11.7% |
| Local Government Employees | 276 | 10.1% |
| State Government Employees | 13 | 0.5% |
| Federal Government Employees | 20 | 0.7% |
| Unpaid Family Workers | 12 | 0.4% |
| Total | 2,738 | 100.0% |
Employment Status by Age in East Petersburg borough
According to the labor force statistics for East Petersburg borough, out of the total population over 16 years of age (3,843), 74.8% or 2,875 individuals are in the labor force, with 2.2% or 63 of them unemployed. The age group with the highest labor force participation rate is 35 to 44 years, with 100.0% or 598 individuals in the labor force. Within the labor force, the 16 to 19 years age range has the highest percentage of unemployed individuals, with 7.9% or 16 of them being unemployed.
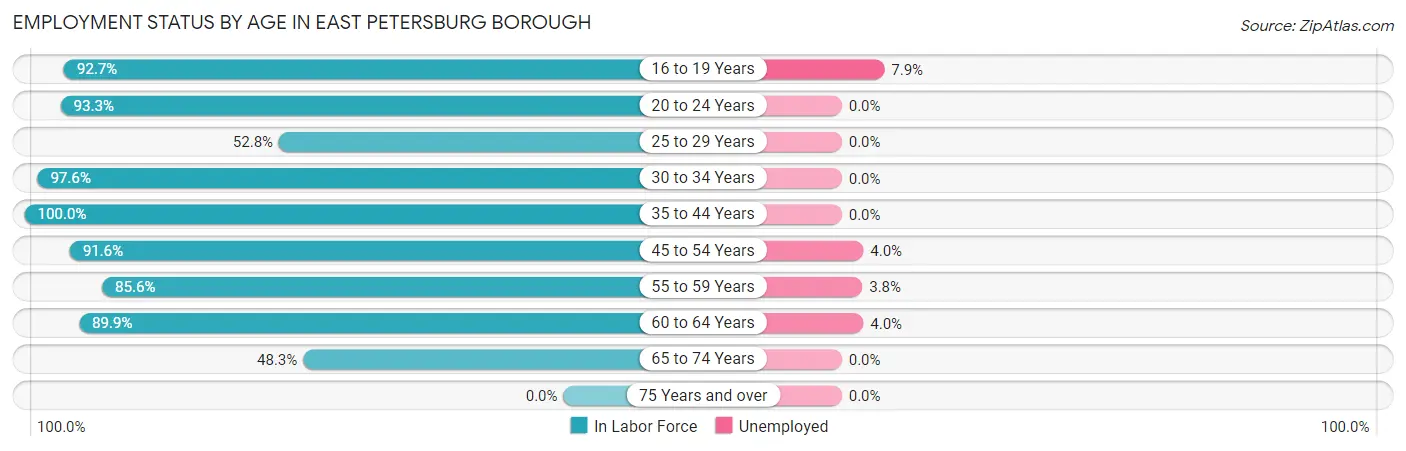
| Age Bracket | In Labor Force | Unemployed |
| 16 to 19 Years | 203 (92.7%) | 16 (7.9%) |
| 20 to 24 Years | 28 (93.3%) | 0 (0.0%) |
| 25 to 29 Years | 115 (52.8%) | 0 (0.0%) |
| 30 to 34 Years | 445 (97.6%) | 0 (0.0%) |
| 35 to 44 Years | 598 (100.0%) | 0 (0.0%) |
| 45 to 54 Years | 697 (91.6%) | 28 (4.0%) |
| 55 to 59 Years | 238 (85.6%) | 9 (3.8%) |
| 60 to 64 Years | 277 (89.9%) | 11 (4.0%) |
| 65 to 74 Years | 272 (48.3%) | 0 (0.0%) |
| 75 Years and over | 0 (0.0%) | 0 (0.0%) |
| Total | 2,875 (74.8%) | 63 (2.2%) |
Employment Status by Educational Attainment in East Petersburg borough
According to labor force statistics for East Petersburg borough, 90.5% of individuals (2,370) out of the total population between 25 and 64 years of age (2,619) are in the labor force, with 2.0% or 47 of them being unemployed. The group with the highest labor force participation rate are those with the educational attainment of less than high school, with 98.6% or 140 individuals in the labor force. Within the labor force, individuals with bachelor's degree or higher education have the highest percentage of unemployment, with 3.4% or 28 of them being unemployed.
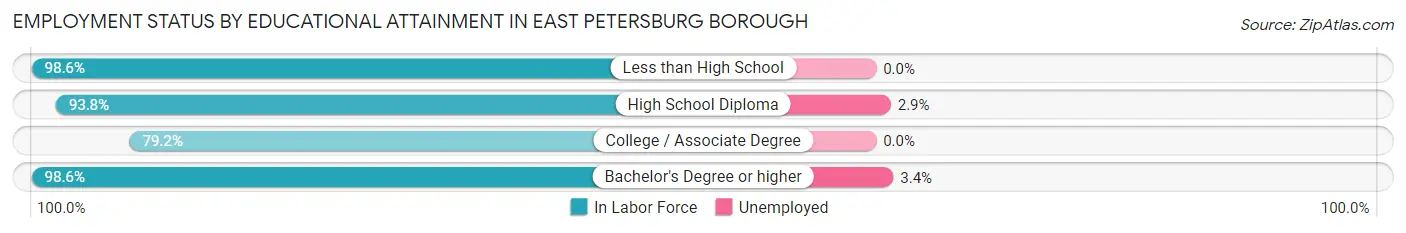
| Educational Attainment | In Labor Force | Unemployed |
| Less than High School | 140 (98.6%) | 0 (0.0%) |
| High School Diploma | 679 (93.8%) | 21 (2.9%) |
| College / Associate Degree | 724 (79.2%) | 0 (0.0%) |
| Bachelor's Degree or higher | 827 (98.6%) | 29 (3.4%) |
| Total | 2,370 (90.5%) | 52 (2.0%) |
Employment Occupations by Sex in East Petersburg borough
Management, Business, Science and Arts Occupations
The most common Management, Business, Science and Arts occupations in East Petersburg borough are Community & Social Service (411 | 14.6%), Management (331 | 11.8%), Education Instruction & Library (236 | 8.4%), Business & Financial (169 | 6.0%), and Health Diagnosing & Treating (133 | 4.7%).
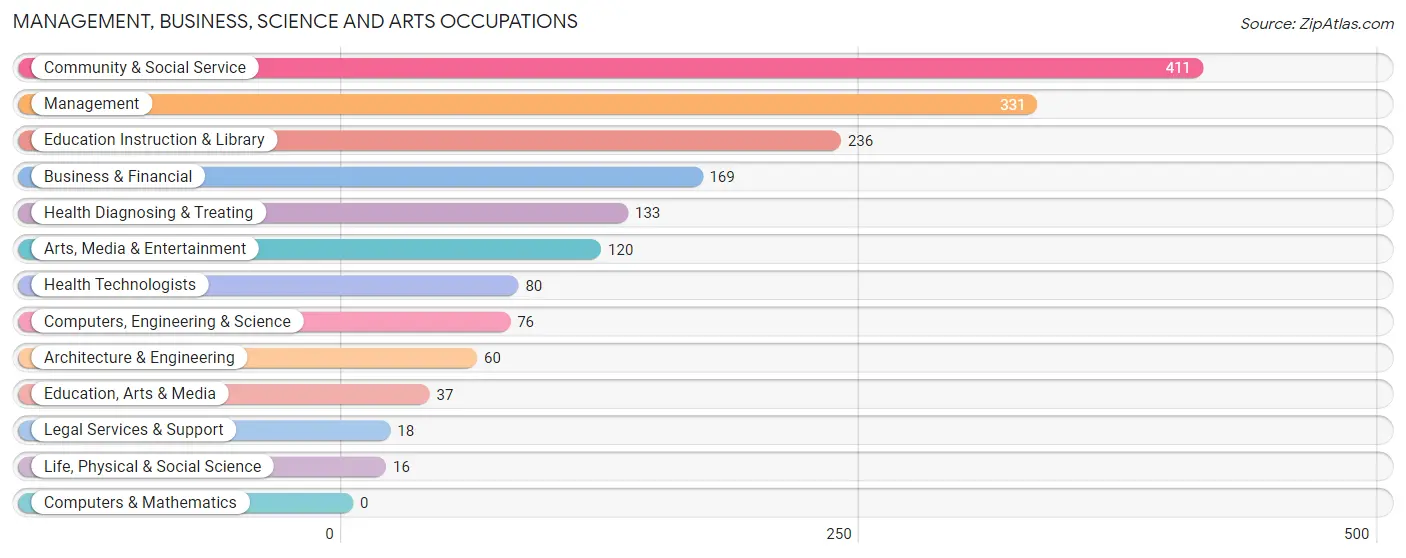
Management, Business, Science and Arts Occupations by Sex
Within the Management, Business, Science and Arts occupations in East Petersburg borough, the most male-oriented occupations are Legal Services & Support (100.0%), Arts, Media & Entertainment (73.3%), and Architecture & Engineering (68.3%), while the most female-oriented occupations are Life, Physical & Social Science (100.0%), Health Technologists (100.0%), and Health Diagnosing & Treating (70.7%).
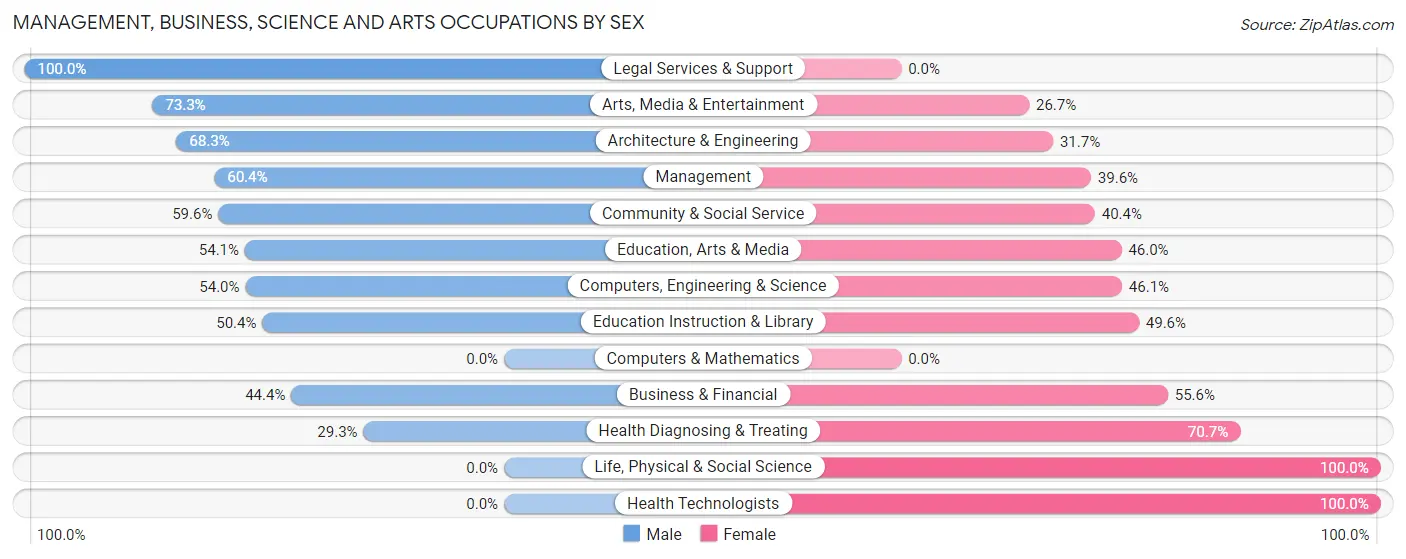
| Occupation | Male | Female |
| Management | 200 (60.4%) | 131 (39.6%) |
| Business & Financial | 75 (44.4%) | 94 (55.6%) |
| Computers, Engineering & Science | 41 (53.9%) | 35 (46.1%) |
| Computers & Mathematics | 0 (0.0%) | 0 (0.0%) |
| Architecture & Engineering | 41 (68.3%) | 19 (31.7%) |
| Life, Physical & Social Science | 0 (0.0%) | 16 (100.0%) |
| Community & Social Service | 245 (59.6%) | 166 (40.4%) |
| Education, Arts & Media | 20 (54.0%) | 17 (46.0%) |
| Legal Services & Support | 18 (100.0%) | 0 (0.0%) |
| Education Instruction & Library | 119 (50.4%) | 117 (49.6%) |
| Arts, Media & Entertainment | 88 (73.3%) | 32 (26.7%) |
| Health Diagnosing & Treating | 39 (29.3%) | 94 (70.7%) |
| Health Technologists | 0 (0.0%) | 80 (100.0%) |
| Total (Category) | 600 (53.6%) | 520 (46.4%) |
| Total (Overall) | 1,432 (51.0%) | 1,377 (49.0%) |
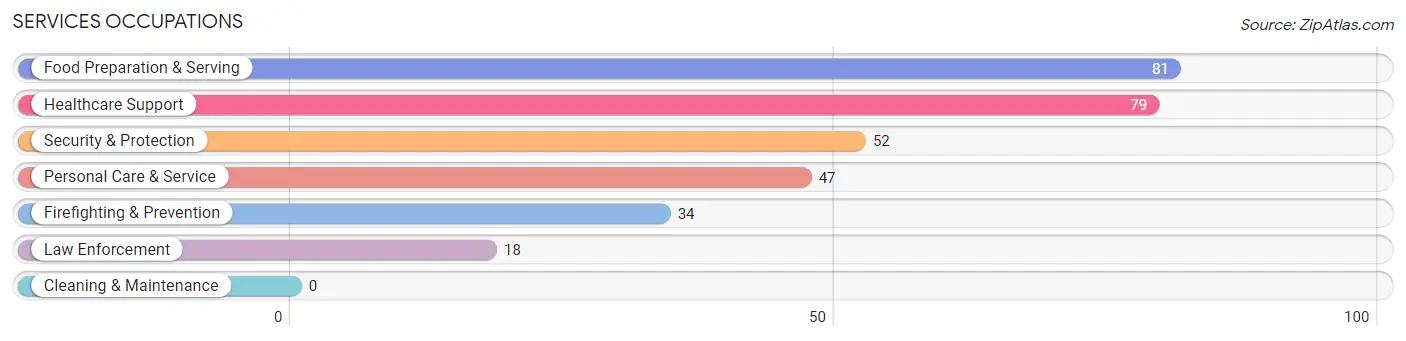
Services Occupations
The most common Services occupations in East Petersburg borough are Food Preparation & Serving (81 | 2.9%), Healthcare Support (79 | 2.8%), Security & Protection (52 | 1.8%), Personal Care & Service (47 | 1.7%), and Firefighting & Prevention (34 | 1.2%).
Services Occupations by Sex
Within the Services occupations in East Petersburg borough, the most male-oriented occupations are Security & Protection (100.0%), Firefighting & Prevention (100.0%), and Law Enforcement (100.0%), while the most female-oriented occupations are Personal Care & Service (74.5%), Food Preparation & Serving (56.8%), and Healthcare Support (16.5%).
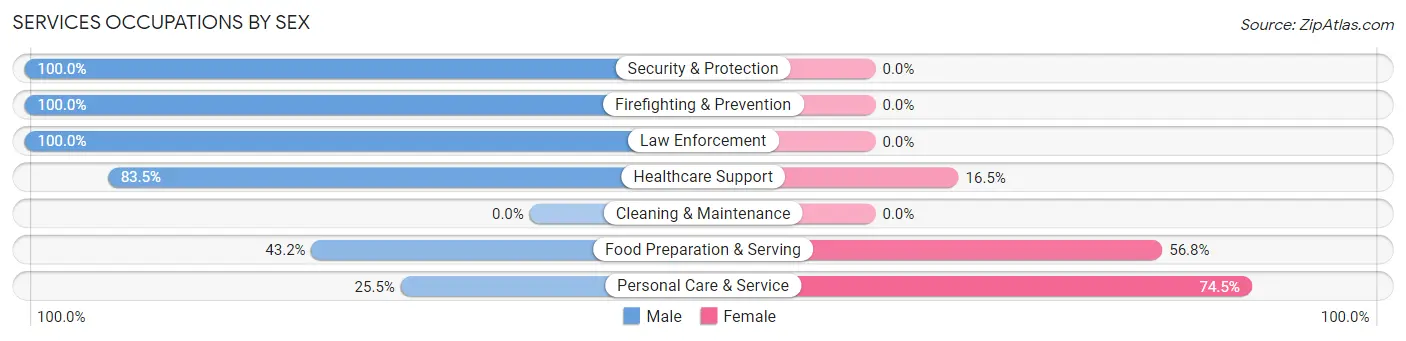
| Occupation | Male | Female |
| Healthcare Support | 66 (83.5%) | 13 (16.5%) |
| Security & Protection | 52 (100.0%) | 0 (0.0%) |
| Firefighting & Prevention | 34 (100.0%) | 0 (0.0%) |
| Law Enforcement | 18 (100.0%) | 0 (0.0%) |
| Food Preparation & Serving | 35 (43.2%) | 46 (56.8%) |
| Cleaning & Maintenance | 0 (0.0%) | 0 (0.0%) |
| Personal Care & Service | 12 (25.5%) | 35 (74.5%) |
| Total (Category) | 165 (63.7%) | 94 (36.3%) |
| Total (Overall) | 1,432 (51.0%) | 1,377 (49.0%) |
Sales and Office Occupations
The most common Sales and Office occupations in East Petersburg borough are Office & Administration (455 | 16.2%), and Sales & Related (340 | 12.1%).

Sales and Office Occupations by Sex

| Occupation | Male | Female |
| Sales & Related | 90 (26.5%) | 250 (73.5%) |
| Office & Administration | 0 (0.0%) | 455 (100.0%) |
| Total (Category) | 90 (11.3%) | 705 (88.7%) |
| Total (Overall) | 1,432 (51.0%) | 1,377 (49.0%) |
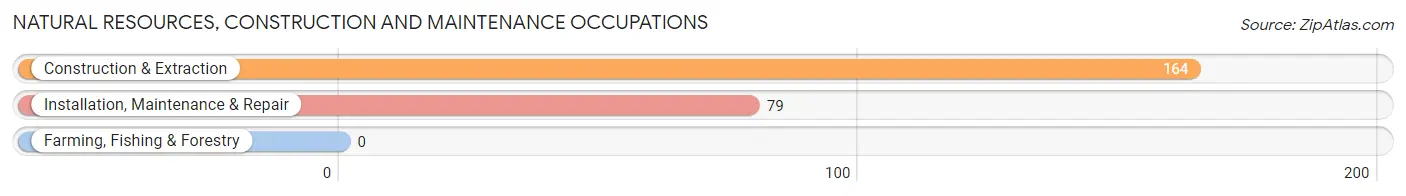
Natural Resources, Construction and Maintenance Occupations
The most common Natural Resources, Construction and Maintenance occupations in East Petersburg borough are Construction & Extraction (164 | 5.8%), and Installation, Maintenance & Repair (79 | 2.8%).
Natural Resources, Construction and Maintenance Occupations by Sex
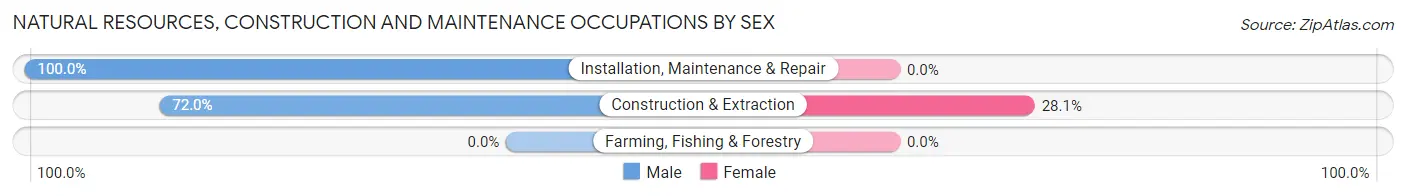
| Occupation | Male | Female |
| Farming, Fishing & Forestry | 0 (0.0%) | 0 (0.0%) |
| Construction & Extraction | 118 (72.0%) | 46 (28.1%) |
| Installation, Maintenance & Repair | 79 (100.0%) | 0 (0.0%) |
| Total (Category) | 197 (81.1%) | 46 (18.9%) |
| Total (Overall) | 1,432 (51.0%) | 1,377 (49.0%) |
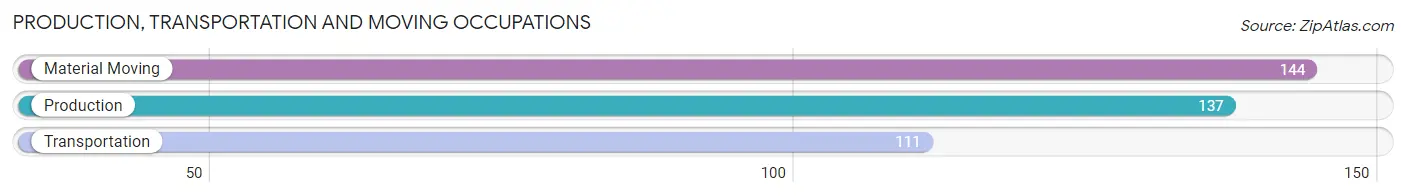
Production, Transportation and Moving Occupations
The most common Production, Transportation and Moving occupations in East Petersburg borough are Material Moving (144 | 5.1%), Production (137 | 4.9%), and Transportation (111 | 4.0%).
Production, Transportation and Moving Occupations by Sex
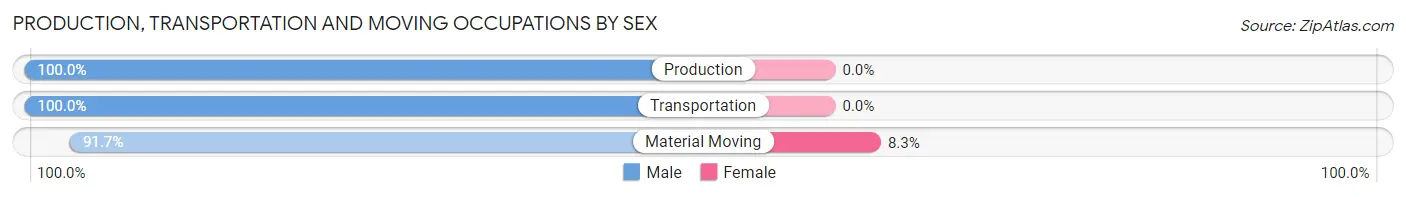
| Occupation | Male | Female |
| Production | 137 (100.0%) | 0 (0.0%) |
| Transportation | 111 (100.0%) | 0 (0.0%) |
| Material Moving | 132 (91.7%) | 12 (8.3%) |
| Total (Category) | 380 (96.9%) | 12 (3.1%) |
| Total (Overall) | 1,432 (51.0%) | 1,377 (49.0%) |
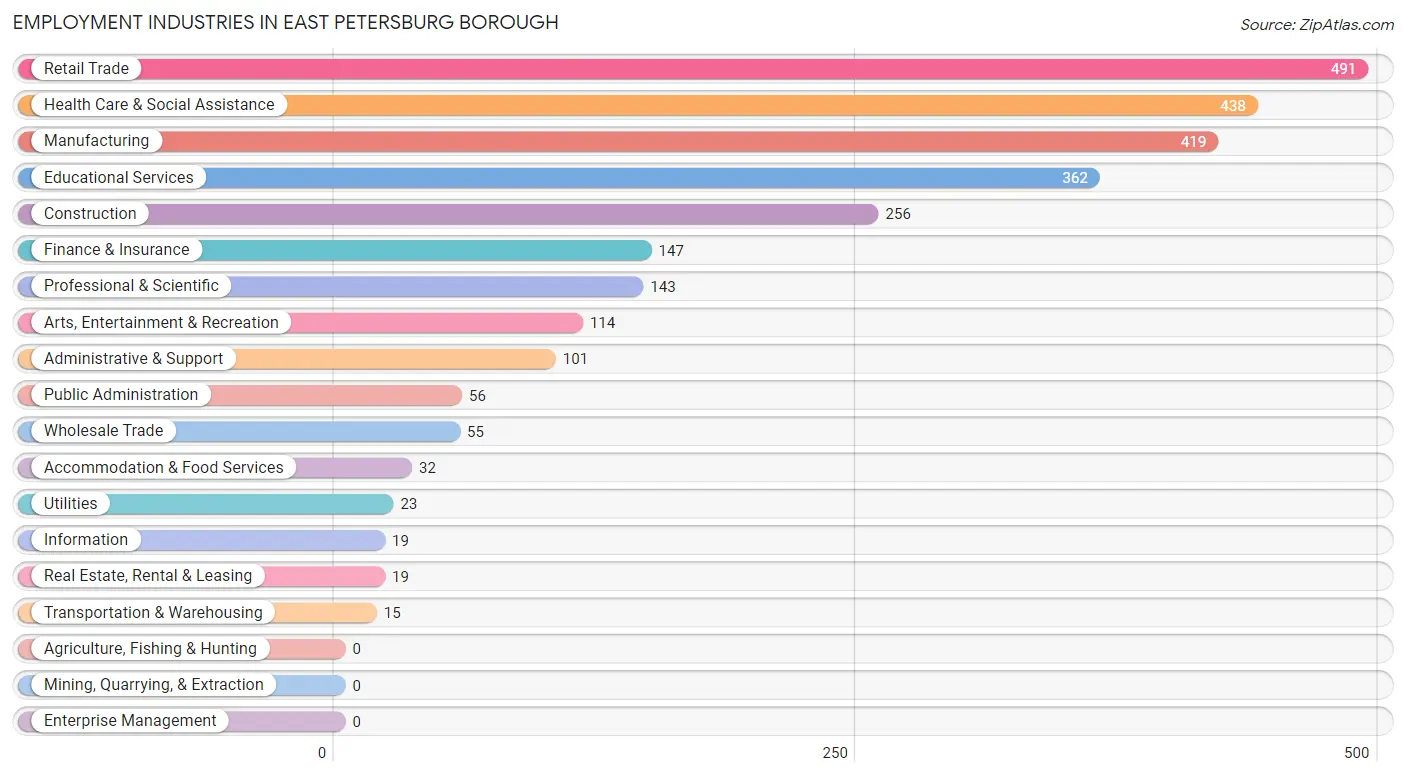
Employment Industries by Sex in East Petersburg borough
Employment Industries in East Petersburg borough
The major employment industries in East Petersburg borough include Retail Trade (491 | 17.5%), Health Care & Social Assistance (438 | 15.6%), Manufacturing (419 | 14.9%), Educational Services (362 | 12.9%), and Construction (256 | 9.1%).
Employment Industries by Sex in East Petersburg borough
The East Petersburg borough industries that see more men than women are Transportation & Warehousing (100.0%), Utilities (100.0%), and Real Estate, Rental & Leasing (100.0%), whereas the industries that tend to have a higher number of women are Information (100.0%), Finance & Insurance (100.0%), and Educational Services (67.1%).
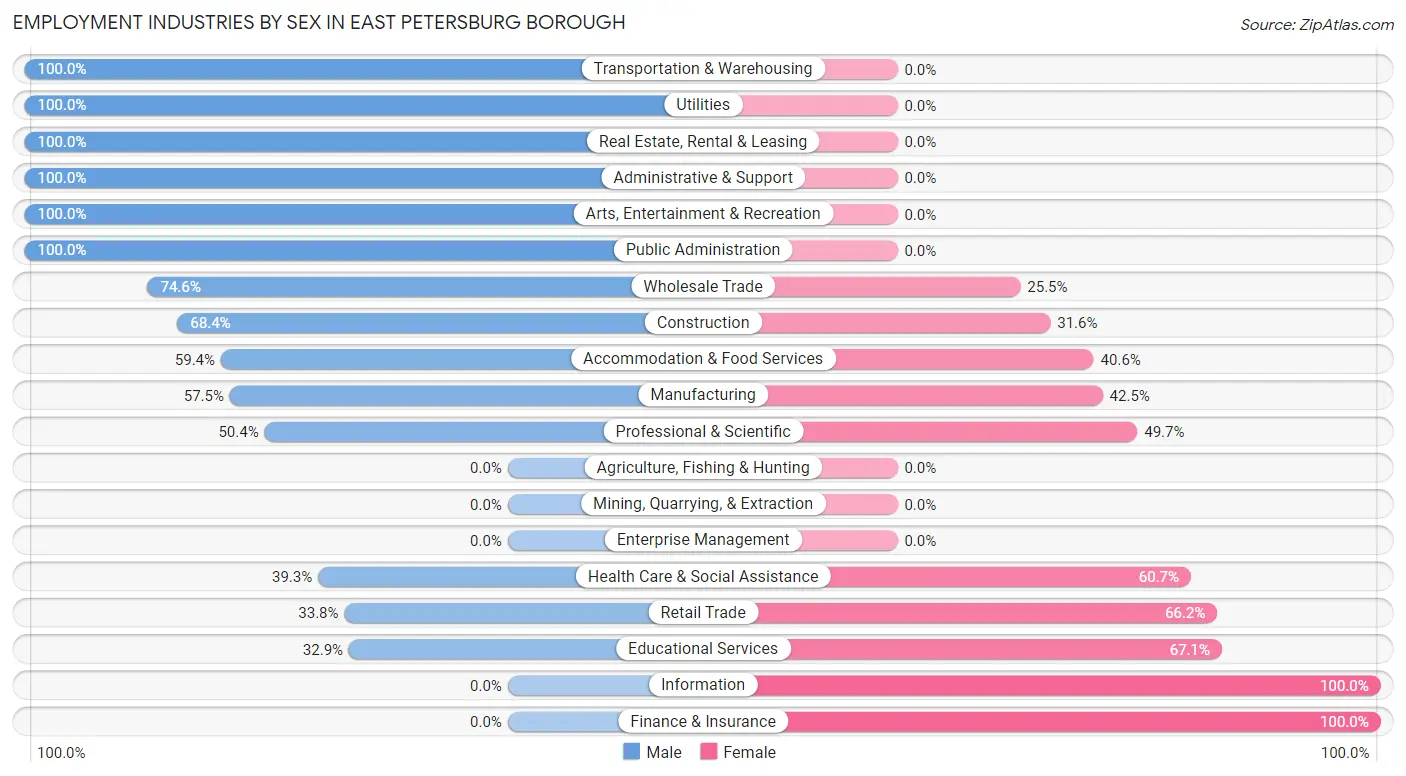
| Industry | Male | Female |
| Agriculture, Fishing & Hunting | 0 (0.0%) | 0 (0.0%) |
| Mining, Quarrying, & Extraction | 0 (0.0%) | 0 (0.0%) |
| Construction | 175 (68.4%) | 81 (31.6%) |
| Manufacturing | 241 (57.5%) | 178 (42.5%) |
| Wholesale Trade | 41 (74.6%) | 14 (25.5%) |
| Retail Trade | 166 (33.8%) | 325 (66.2%) |
| Transportation & Warehousing | 15 (100.0%) | 0 (0.0%) |
| Utilities | 23 (100.0%) | 0 (0.0%) |
| Information | 0 (0.0%) | 19 (100.0%) |
| Finance & Insurance | 0 (0.0%) | 147 (100.0%) |
| Real Estate, Rental & Leasing | 19 (100.0%) | 0 (0.0%) |
| Professional & Scientific | 72 (50.3%) | 71 (49.6%) |
| Enterprise Management | 0 (0.0%) | 0 (0.0%) |
| Administrative & Support | 101 (100.0%) | 0 (0.0%) |
| Educational Services | 119 (32.9%) | 243 (67.1%) |
| Health Care & Social Assistance | 172 (39.3%) | 266 (60.7%) |
| Arts, Entertainment & Recreation | 114 (100.0%) | 0 (0.0%) |
| Accommodation & Food Services | 19 (59.4%) | 13 (40.6%) |
| Public Administration | 56 (100.0%) | 0 (0.0%) |
| Total | 1,432 (51.0%) | 1,377 (49.0%) |
Education in East Petersburg borough
School Enrollment in East Petersburg borough
The most common levels of schooling among the 1,079 students in East Petersburg borough are elementary school (273 | 25.3%), high school (260 | 24.1%), and graduate / professional (215 | 19.9%).
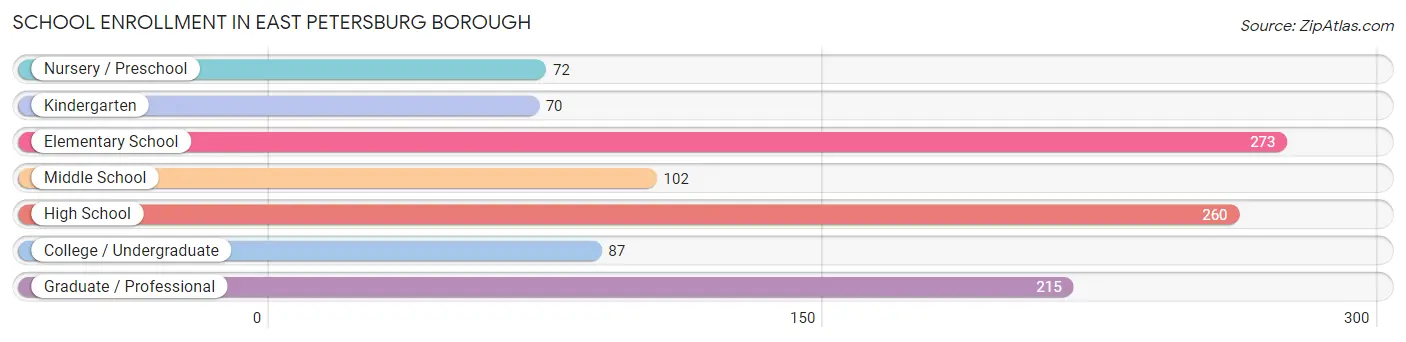
| School Level | # Students | % Students |
| Nursery / Preschool | 72 | 6.7% |
| Kindergarten | 70 | 6.5% |
| Elementary School | 273 | 25.3% |
| Middle School | 102 | 9.5% |
| High School | 260 | 24.1% |
| College / Undergraduate | 87 | 8.1% |
| Graduate / Professional | 215 | 19.9% |
| Total | 1,079 | 100.0% |
School Enrollment by Age by Funding Source in East Petersburg borough
Out of a total of 1,079 students who are enrolled in schools in East Petersburg borough, 213 (19.7%) attend a private institution, while the remaining 866 (80.3%) are enrolled in public schools. The age group of 20 to 24 year olds has the highest likelihood of being enrolled in private schools, with 2 (100.0% in the age bracket) enrolled. Conversely, the age group of 15 to 17 year olds has the lowest likelihood of being enrolled in a private school, with 211 (100.0% in the age bracket) attending a public institution.
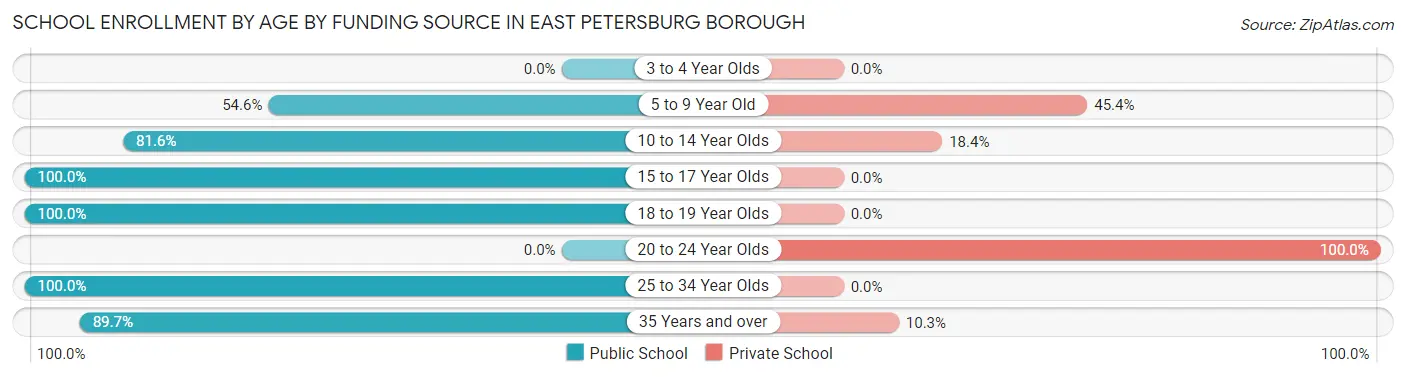
| Age Bracket | Public School | Private School |
| 3 to 4 Year Olds | 0 (0.0%) | 0 (0.0%) |
| 5 to 9 Year Old | 195 (54.6%) | 162 (45.4%) |
| 10 to 14 Year Olds | 169 (81.6%) | 38 (18.4%) |
| 15 to 17 Year Olds | 211 (100.0%) | 0 (0.0%) |
| 18 to 19 Year Olds | 15 (100.0%) | 0 (0.0%) |
| 20 to 24 Year Olds | 0 (0.0%) | 2 (100.0%) |
| 25 to 34 Year Olds | 180 (100.0%) | 0 (0.0%) |
| 35 Years and over | 96 (89.7%) | 11 (10.3%) |
| Total | 866 (80.3%) | 213 (19.7%) |
Educational Attainment by Field of Study in East Petersburg borough
Education (518 | 41.6%), business (243 | 19.5%), science & technology (139 | 11.2%), liberal arts & history (75 | 6.0%), and social sciences (71 | 5.7%) are the most common fields of study among 1,246 individuals in East Petersburg borough who have obtained a bachelor's degree or higher.
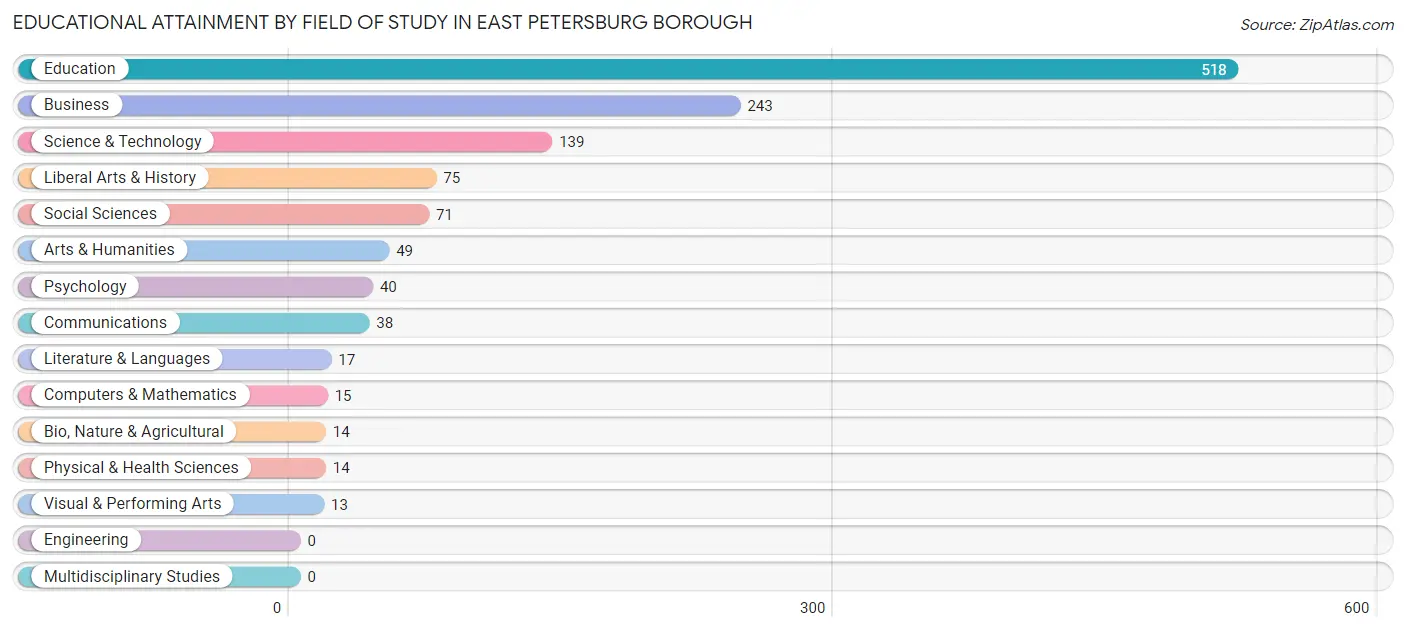
| Field of Study | # Graduates | % Graduates |
| Computers & Mathematics | 15 | 1.2% |
| Bio, Nature & Agricultural | 14 | 1.1% |
| Physical & Health Sciences | 14 | 1.1% |
| Psychology | 40 | 3.2% |
| Social Sciences | 71 | 5.7% |
| Engineering | 0 | 0.0% |
| Multidisciplinary Studies | 0 | 0.0% |
| Science & Technology | 139 | 11.2% |
| Business | 243 | 19.5% |
| Education | 518 | 41.6% |
| Literature & Languages | 17 | 1.4% |
| Liberal Arts & History | 75 | 6.0% |
| Visual & Performing Arts | 13 | 1.0% |
| Communications | 38 | 3.0% |
| Arts & Humanities | 49 | 3.9% |
| Total | 1,246 | 100.0% |
Transportation & Commute in East Petersburg borough
Vehicle Availability by Sex in East Petersburg borough
The most prevalent vehicle ownership categories in East Petersburg borough are males with 2 vehicles (804, accounting for 56.7%) and females with 2 vehicles (621, making up 61.0%).
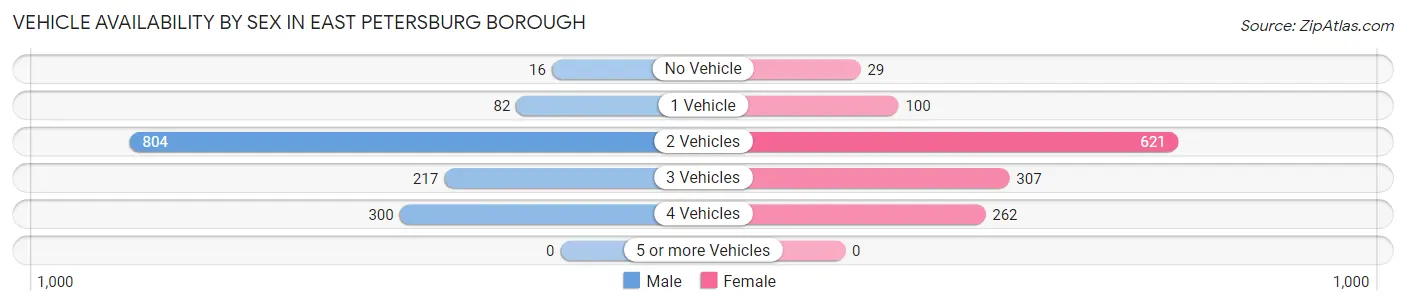
| Vehicles Available | Male | Female |
| No Vehicle | 16 (1.1%) | 29 (2.2%) |
| 1 Vehicle | 82 (5.8%) | 100 (7.6%) |
| 2 Vehicles | 804 (56.7%) | 621 (47.1%) |
| 3 Vehicles | 217 (15.3%) | 307 (23.3%) |
| 4 Vehicles | 300 (21.1%) | 262 (19.9%) |
| 5 or more Vehicles | 0 (0.0%) | 0 (0.0%) |
| Total | 1,419 (100.0%) | 1,319 (100.0%) |
Commute Time in East Petersburg borough
The most frequently occuring commute durations in East Petersburg borough are 10 to 14 minutes (648 commuters, 25.4%), 15 to 19 minutes (538 commuters, 21.1%), and 20 to 24 minutes (513 commuters, 20.1%).
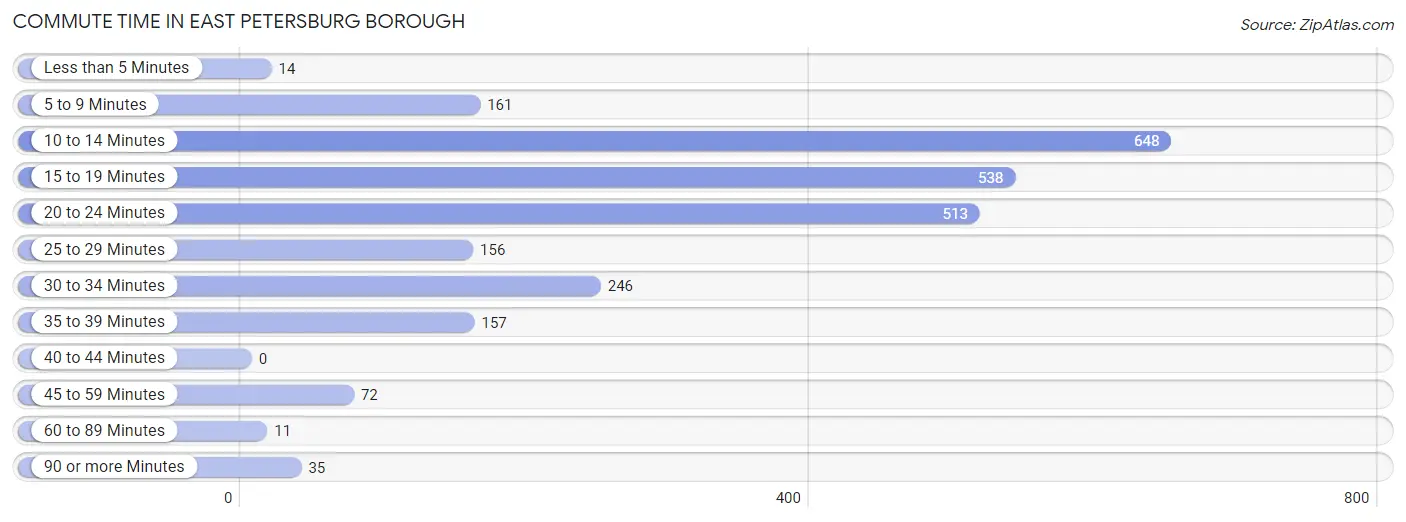
| Commute Time | # Commuters | % Commuters |
| Less than 5 Minutes | 14 | 0.5% |
| 5 to 9 Minutes | 161 | 6.3% |
| 10 to 14 Minutes | 648 | 25.4% |
| 15 to 19 Minutes | 538 | 21.1% |
| 20 to 24 Minutes | 513 | 20.1% |
| 25 to 29 Minutes | 156 | 6.1% |
| 30 to 34 Minutes | 246 | 9.6% |
| 35 to 39 Minutes | 157 | 6.1% |
| 40 to 44 Minutes | 0 | 0.0% |
| 45 to 59 Minutes | 72 | 2.8% |
| 60 to 89 Minutes | 11 | 0.4% |
| 90 or more Minutes | 35 | 1.4% |
Commute Time by Sex in East Petersburg borough
The most common commute times in East Petersburg borough are 20 to 24 minutes (301 commuters, 23.0%) for males and 10 to 14 minutes (351 commuters, 28.2%) for females.
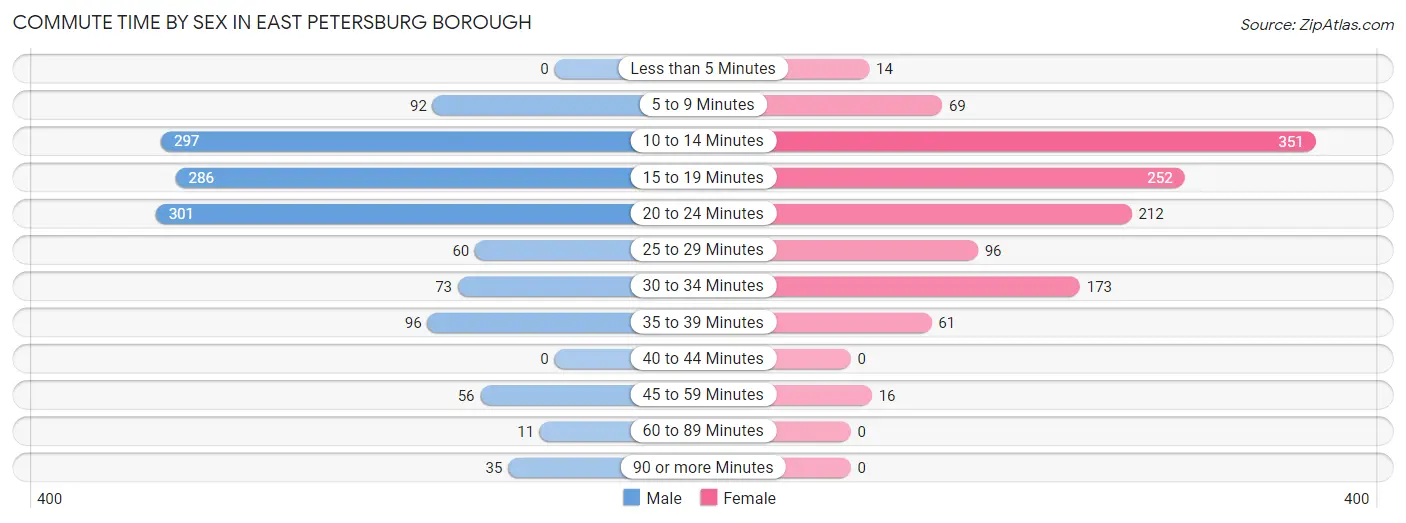
| Commute Time | Male | Female |
| Less than 5 Minutes | 0 (0.0%) | 14 (1.1%) |
| 5 to 9 Minutes | 92 (7.0%) | 69 (5.6%) |
| 10 to 14 Minutes | 297 (22.7%) | 351 (28.2%) |
| 15 to 19 Minutes | 286 (21.9%) | 252 (20.3%) |
| 20 to 24 Minutes | 301 (23.0%) | 212 (17.0%) |
| 25 to 29 Minutes | 60 (4.6%) | 96 (7.7%) |
| 30 to 34 Minutes | 73 (5.6%) | 173 (13.9%) |
| 35 to 39 Minutes | 96 (7.3%) | 61 (4.9%) |
| 40 to 44 Minutes | 0 (0.0%) | 0 (0.0%) |
| 45 to 59 Minutes | 56 (4.3%) | 16 (1.3%) |
| 60 to 89 Minutes | 11 (0.8%) | 0 (0.0%) |
| 90 or more Minutes | 35 (2.7%) | 0 (0.0%) |
Time of Departure to Work by Sex in East Petersburg borough
The most frequent times of departure to work in East Petersburg borough are 6:00 AM to 6:29 AM (297, 22.7%) for males and 7:00 AM to 7:29 AM (288, 23.2%) for females.
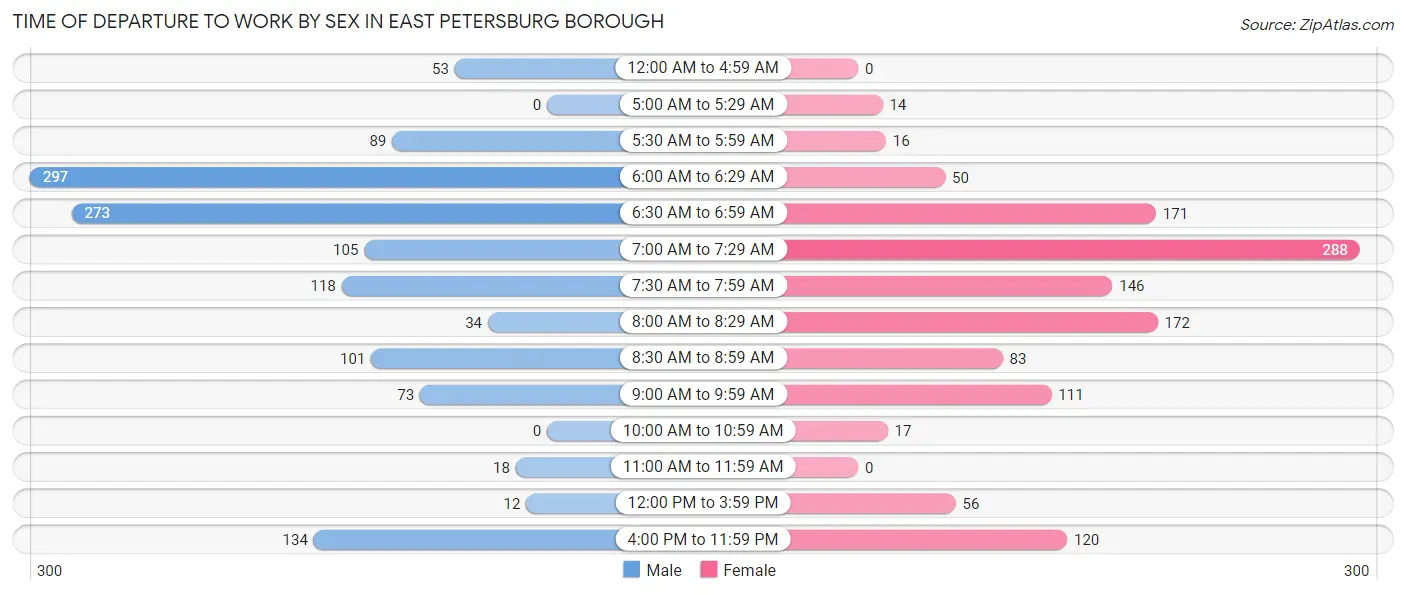
| Time of Departure | Male | Female |
| 12:00 AM to 4:59 AM | 53 (4.1%) | 0 (0.0%) |
| 5:00 AM to 5:29 AM | 0 (0.0%) | 14 (1.1%) |
| 5:30 AM to 5:59 AM | 89 (6.8%) | 16 (1.3%) |
| 6:00 AM to 6:29 AM | 297 (22.7%) | 50 (4.0%) |
| 6:30 AM to 6:59 AM | 273 (20.9%) | 171 (13.8%) |
| 7:00 AM to 7:29 AM | 105 (8.0%) | 288 (23.2%) |
| 7:30 AM to 7:59 AM | 118 (9.0%) | 146 (11.7%) |
| 8:00 AM to 8:29 AM | 34 (2.6%) | 172 (13.8%) |
| 8:30 AM to 8:59 AM | 101 (7.7%) | 83 (6.7%) |
| 9:00 AM to 9:59 AM | 73 (5.6%) | 111 (8.9%) |
| 10:00 AM to 10:59 AM | 0 (0.0%) | 17 (1.4%) |
| 11:00 AM to 11:59 AM | 18 (1.4%) | 0 (0.0%) |
| 12:00 PM to 3:59 PM | 12 (0.9%) | 56 (4.5%) |
| 4:00 PM to 11:59 PM | 134 (10.2%) | 120 (9.7%) |
| Total | 1,307 (100.0%) | 1,244 (100.0%) |
Housing Occupancy in East Petersburg borough
Occupancy by Ownership in East Petersburg borough
Of the total 1,923 dwellings in East Petersburg borough, owner-occupied units account for 1,681 (87.4%), while renter-occupied units make up 242 (12.6%).
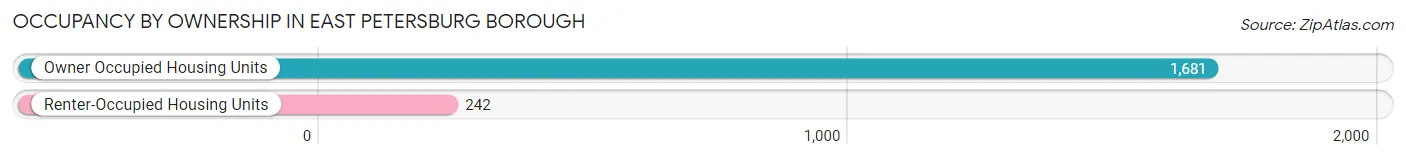
| Occupancy | # Housing Units | % Housing Units |
| Owner Occupied Housing Units | 1,681 | 87.4% |
| Renter-Occupied Housing Units | 242 | 12.6% |
| Total Occupied Housing Units | 1,923 | 100.0% |
Occupancy by Household Size in East Petersburg borough
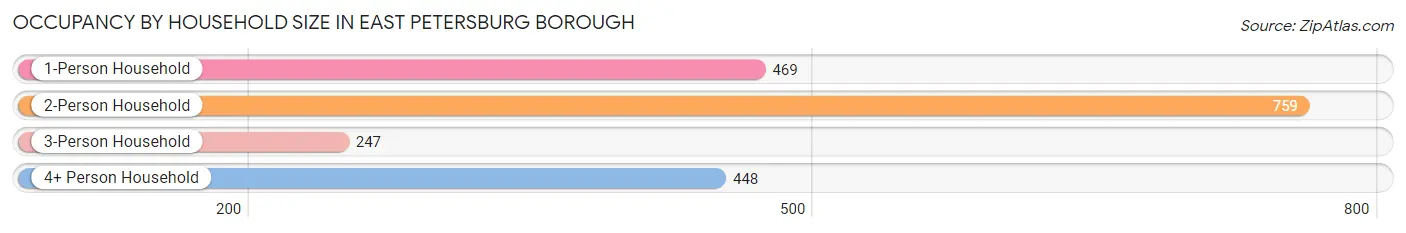
| Household Size | # Housing Units | % Housing Units |
| 1-Person Household | 469 | 24.4% |
| 2-Person Household | 759 | 39.5% |
| 3-Person Household | 247 | 12.8% |
| 4+ Person Household | 448 | 23.3% |
| Total Housing Units | 1,923 | 100.0% |
Occupancy by Ownership by Household Size in East Petersburg borough
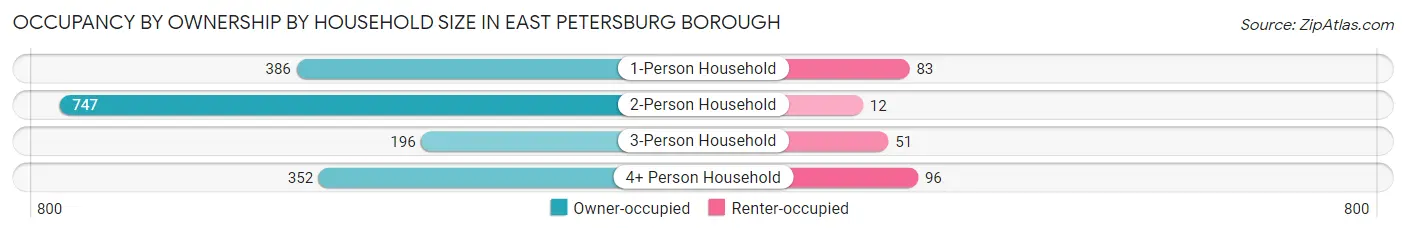
| Household Size | Owner-occupied | Renter-occupied |
| 1-Person Household | 386 (82.3%) | 83 (17.7%) |
| 2-Person Household | 747 (98.4%) | 12 (1.6%) |
| 3-Person Household | 196 (79.3%) | 51 (20.6%) |
| 4+ Person Household | 352 (78.6%) | 96 (21.4%) |
| Total Housing Units | 1,681 (87.4%) | 242 (12.6%) |
Occupancy by Educational Attainment in East Petersburg borough
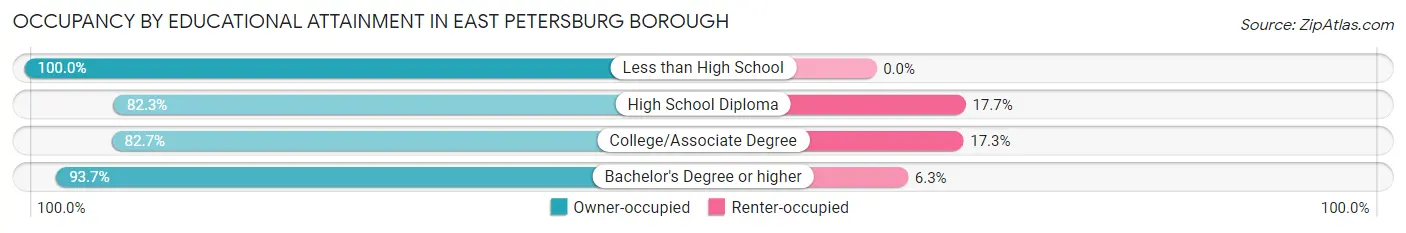
| Household Size | Owner-occupied | Renter-occupied |
| Less than High School | 102 (100.0%) | 0 (0.0%) |
| High School Diploma | 525 (82.3%) | 113 (17.7%) |
| College/Associate Degree | 412 (82.7%) | 86 (17.3%) |
| Bachelor's Degree or higher | 642 (93.7%) | 43 (6.3%) |
Occupancy by Age of Householder in East Petersburg borough
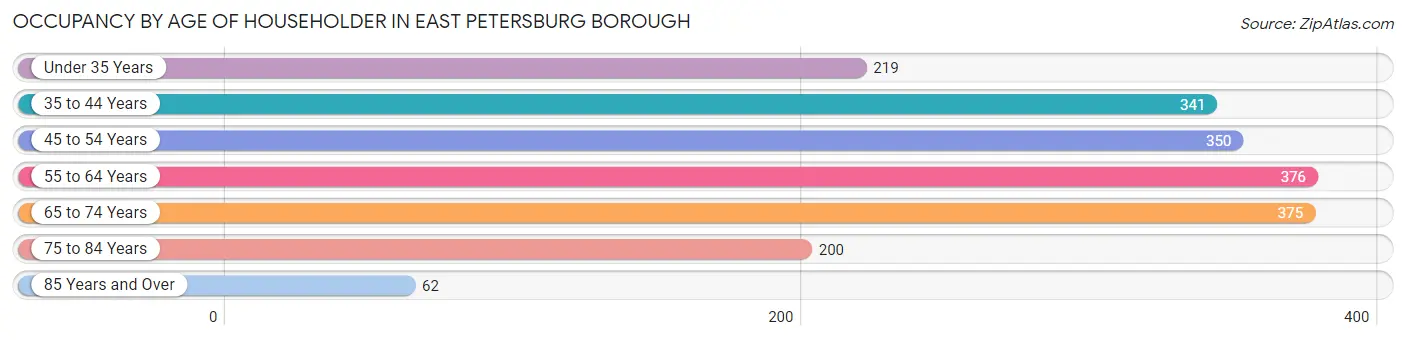
| Age Bracket | # Households | % Households |
| Under 35 Years | 219 | 11.4% |
| 35 to 44 Years | 341 | 17.7% |
| 45 to 54 Years | 350 | 18.2% |
| 55 to 64 Years | 376 | 19.6% |
| 65 to 74 Years | 375 | 19.5% |
| 75 to 84 Years | 200 | 10.4% |
| 85 Years and Over | 62 | 3.2% |
| Total | 1,923 | 100.0% |
Housing Finances in East Petersburg borough
Median Income by Occupancy in East Petersburg borough
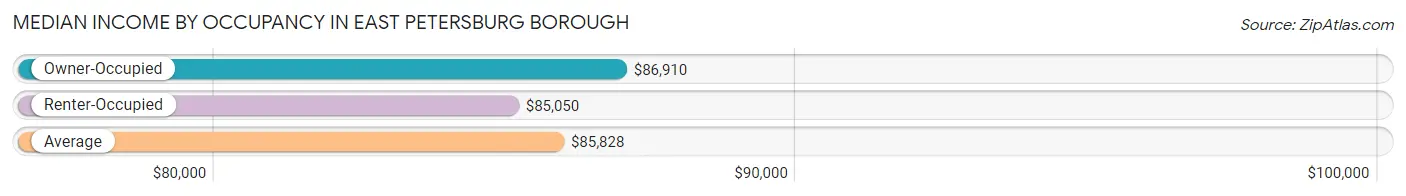
| Occupancy Type | # Households | Median Income |
| Owner-Occupied | 1,681 (87.4%) | $86,910 |
| Renter-Occupied | 242 (12.6%) | $85,050 |
| Average | 1,923 (100.0%) | $85,828 |
Occupancy by Householder Income Bracket in East Petersburg borough
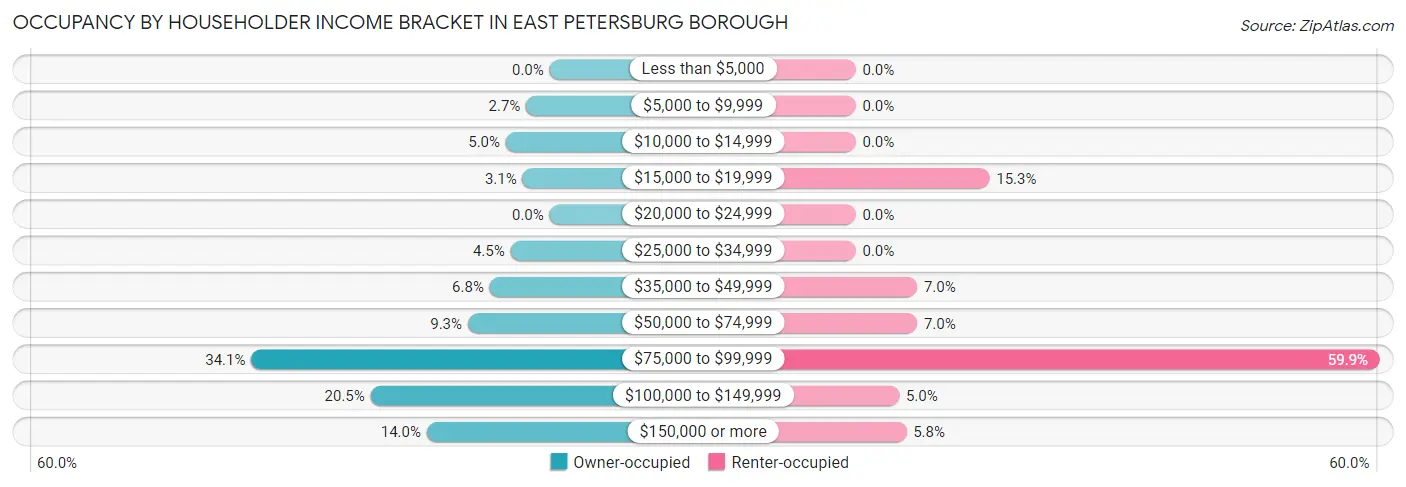
| Income Bracket | Owner-occupied | Renter-occupied |
| Less than $5,000 | 0 (0.0%) | 0 (0.0%) |
| $5,000 to $9,999 | 45 (2.7%) | 0 (0.0%) |
| $10,000 to $14,999 | 84 (5.0%) | 0 (0.0%) |
| $15,000 to $19,999 | 52 (3.1%) | 37 (15.3%) |
| $20,000 to $24,999 | 0 (0.0%) | 0 (0.0%) |
| $25,000 to $34,999 | 75 (4.5%) | 0 (0.0%) |
| $35,000 to $49,999 | 115 (6.8%) | 17 (7.0%) |
| $50,000 to $74,999 | 157 (9.3%) | 17 (7.0%) |
| $75,000 to $99,999 | 573 (34.1%) | 145 (59.9%) |
| $100,000 to $149,999 | 344 (20.5%) | 12 (5.0%) |
| $150,000 or more | 236 (14.0%) | 14 (5.8%) |
| Total | 1,681 (100.0%) | 242 (100.0%) |
Monthly Housing Cost Tiers in East Petersburg borough
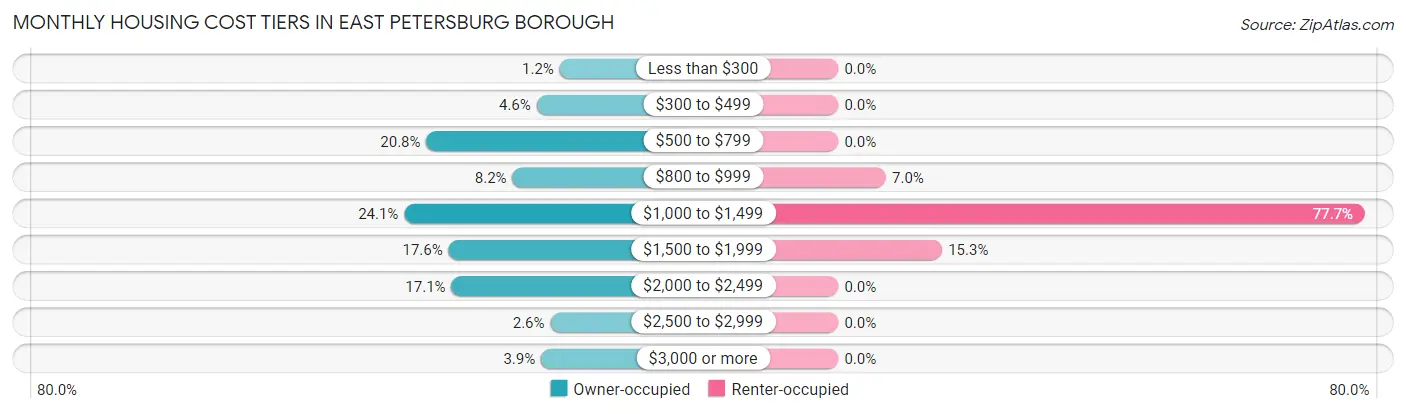
| Monthly Cost | Owner-occupied | Renter-occupied |
| Less than $300 | 20 (1.2%) | 0 (0.0%) |
| $300 to $499 | 77 (4.6%) | 0 (0.0%) |
| $500 to $799 | 350 (20.8%) | 0 (0.0%) |
| $800 to $999 | 137 (8.2%) | 17 (7.0%) |
| $1,000 to $1,499 | 405 (24.1%) | 188 (77.7%) |
| $1,500 to $1,999 | 295 (17.5%) | 37 (15.3%) |
| $2,000 to $2,499 | 288 (17.1%) | 0 (0.0%) |
| $2,500 to $2,999 | 43 (2.6%) | 0 (0.0%) |
| $3,000 or more | 66 (3.9%) | 0 (0.0%) |
| Total | 1,681 (100.0%) | 242 (100.0%) |
Physical Housing Characteristics in East Petersburg borough
Housing Structures in East Petersburg borough
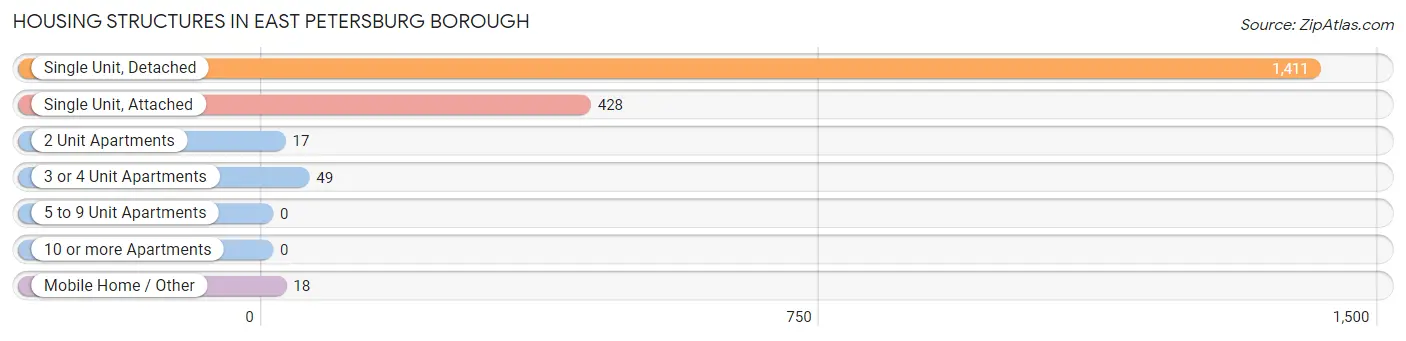
| Structure Type | # Housing Units | % Housing Units |
| Single Unit, Detached | 1,411 | 73.4% |
| Single Unit, Attached | 428 | 22.3% |
| 2 Unit Apartments | 17 | 0.9% |
| 3 or 4 Unit Apartments | 49 | 2.5% |
| 5 to 9 Unit Apartments | 0 | 0.0% |
| 10 or more Apartments | 0 | 0.0% |
| Mobile Home / Other | 18 | 0.9% |
| Total | 1,923 | 100.0% |
Housing Structures by Occupancy in East Petersburg borough
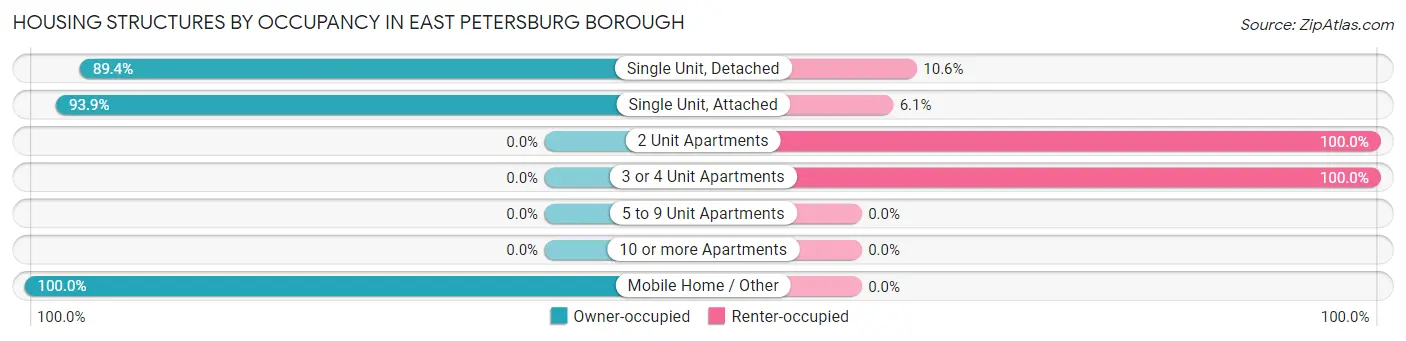
| Structure Type | Owner-occupied | Renter-occupied |
| Single Unit, Detached | 1,261 (89.4%) | 150 (10.6%) |
| Single Unit, Attached | 402 (93.9%) | 26 (6.1%) |
| 2 Unit Apartments | 0 (0.0%) | 17 (100.0%) |
| 3 or 4 Unit Apartments | 0 (0.0%) | 49 (100.0%) |
| 5 to 9 Unit Apartments | 0 (0.0%) | 0 (0.0%) |
| 10 or more Apartments | 0 (0.0%) | 0 (0.0%) |
| Mobile Home / Other | 18 (100.0%) | 0 (0.0%) |
| Total | 1,681 (87.4%) | 242 (12.6%) |
Housing Structures by Number of Rooms in East Petersburg borough
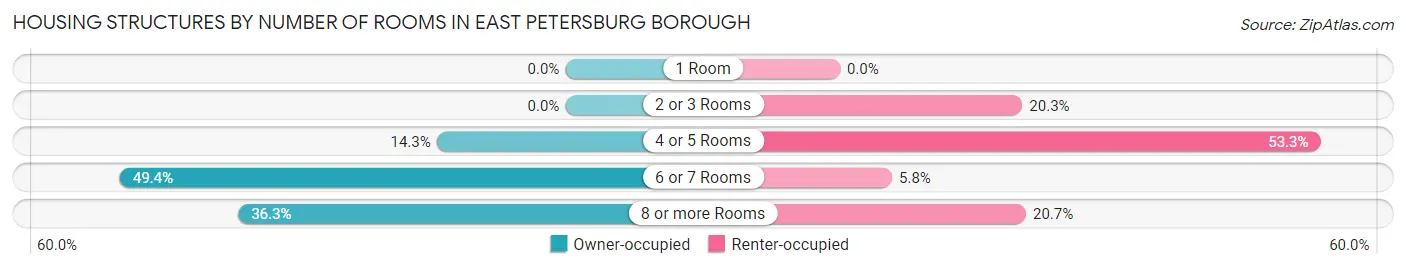
| Number of Rooms | Owner-occupied | Renter-occupied |
| 1 Room | 0 (0.0%) | 0 (0.0%) |
| 2 or 3 Rooms | 0 (0.0%) | 49 (20.3%) |
| 4 or 5 Rooms | 240 (14.3%) | 129 (53.3%) |
| 6 or 7 Rooms | 831 (49.4%) | 14 (5.8%) |
| 8 or more Rooms | 610 (36.3%) | 50 (20.7%) |
| Total | 1,681 (100.0%) | 242 (100.0%) |
Housing Structure by Heating Type in East Petersburg borough
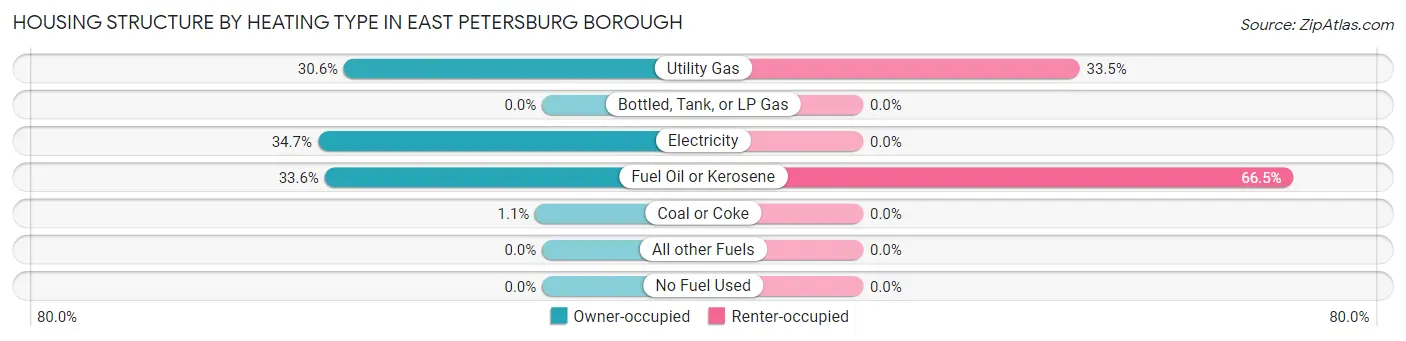
| Heating Type | Owner-occupied | Renter-occupied |
| Utility Gas | 515 (30.6%) | 81 (33.5%) |
| Bottled, Tank, or LP Gas | 0 (0.0%) | 0 (0.0%) |
| Electricity | 583 (34.7%) | 0 (0.0%) |
| Fuel Oil or Kerosene | 565 (33.6%) | 161 (66.5%) |
| Coal or Coke | 18 (1.1%) | 0 (0.0%) |
| All other Fuels | 0 (0.0%) | 0 (0.0%) |
| No Fuel Used | 0 (0.0%) | 0 (0.0%) |
| Total | 1,681 (100.0%) | 242 (100.0%) |
Household Vehicle Usage in East Petersburg borough
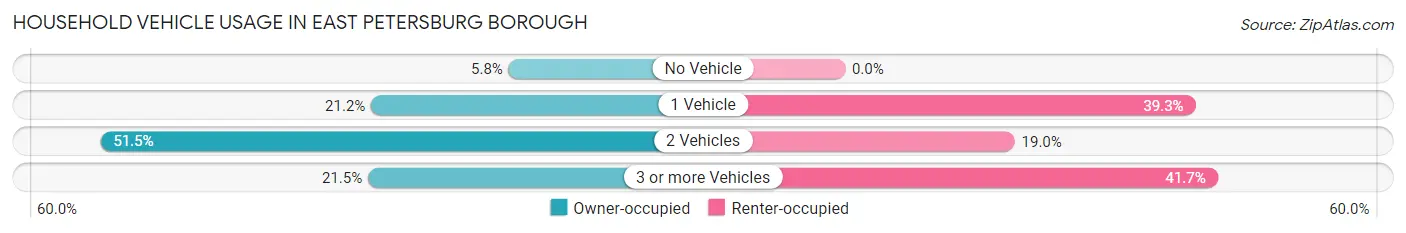
| Vehicles per Household | Owner-occupied | Renter-occupied |
| No Vehicle | 97 (5.8%) | 0 (0.0%) |
| 1 Vehicle | 356 (21.2%) | 95 (39.3%) |
| 2 Vehicles | 866 (51.5%) | 46 (19.0%) |
| 3 or more Vehicles | 362 (21.5%) | 101 (41.7%) |
| Total | 1,681 (100.0%) | 242 (100.0%) |
Real Estate & Mortgages in East Petersburg borough
Real Estate and Mortgage Overview in East Petersburg borough
| Characteristic | Without Mortgage | With Mortgage |
| Housing Units | 558 | 1,123 |
| Median Property Value | $241,800 | $224,700 |
| Median Household Income | $82,500 | $156 |
| Monthly Housing Costs | $687 | $66 |
| Real Estate Taxes | $3,343 | $16 |
Property Value by Mortgage Status in East Petersburg borough
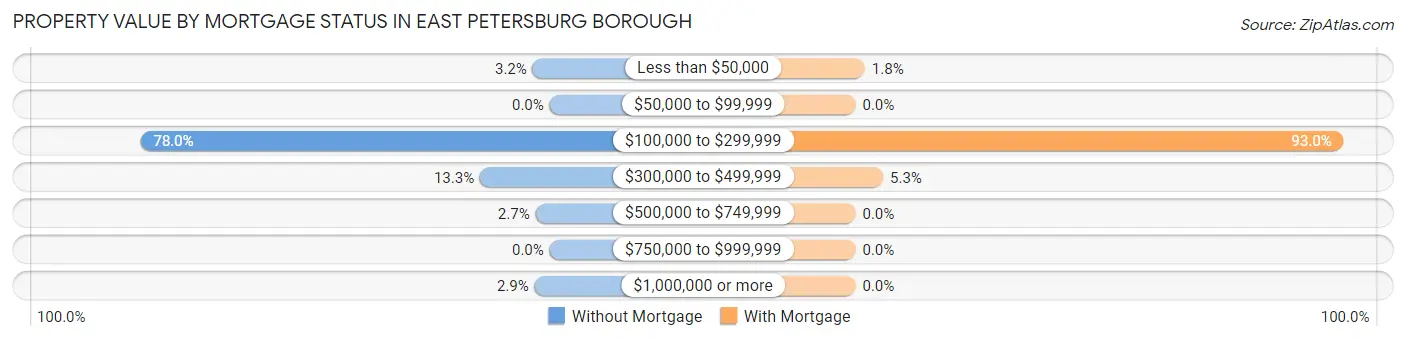
| Property Value | Without Mortgage | With Mortgage |
| Less than $50,000 | 18 (3.2%) | 20 (1.8%) |
| $50,000 to $99,999 | 0 (0.0%) | 0 (0.0%) |
| $100,000 to $299,999 | 435 (78.0%) | 1,044 (93.0%) |
| $300,000 to $499,999 | 74 (13.3%) | 59 (5.2%) |
| $500,000 to $749,999 | 15 (2.7%) | 0 (0.0%) |
| $750,000 to $999,999 | 0 (0.0%) | 0 (0.0%) |
| $1,000,000 or more | 16 (2.9%) | 0 (0.0%) |
| Total | 558 (100.0%) | 1,123 (100.0%) |
Household Income by Mortgage Status in East Petersburg borough
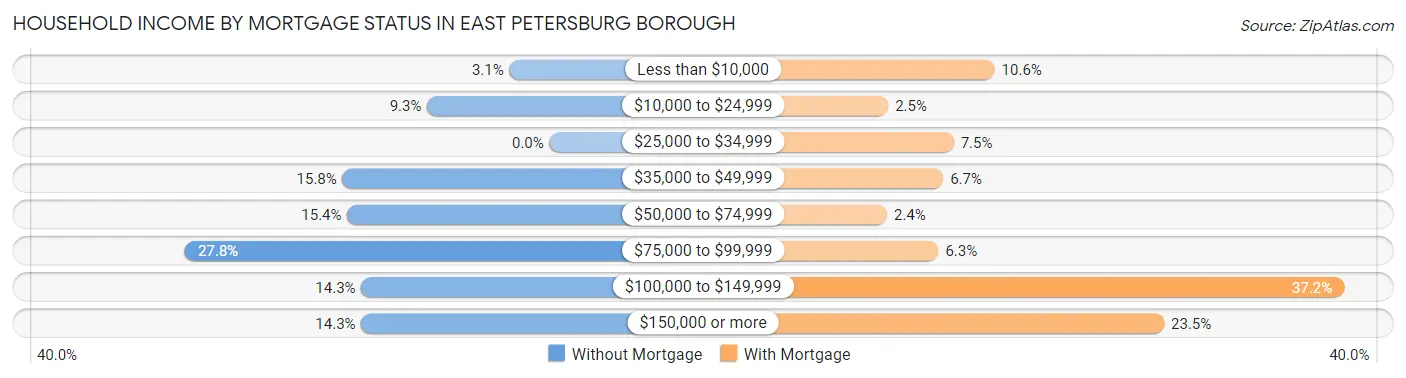
| Household Income | Without Mortgage | With Mortgage |
| Less than $10,000 | 17 (3.0%) | 119 (10.6%) |
| $10,000 to $24,999 | 52 (9.3%) | 28 (2.5%) |
| $25,000 to $34,999 | 0 (0.0%) | 84 (7.5%) |
| $35,000 to $49,999 | 88 (15.8%) | 75 (6.7%) |
| $50,000 to $74,999 | 86 (15.4%) | 27 (2.4%) |
| $75,000 to $99,999 | 155 (27.8%) | 71 (6.3%) |
| $100,000 to $149,999 | 80 (14.3%) | 418 (37.2%) |
| $150,000 or more | 80 (14.3%) | 264 (23.5%) |
| Total | 558 (100.0%) | 1,123 (100.0%) |
Property Value to Household Income Ratio in East Petersburg borough
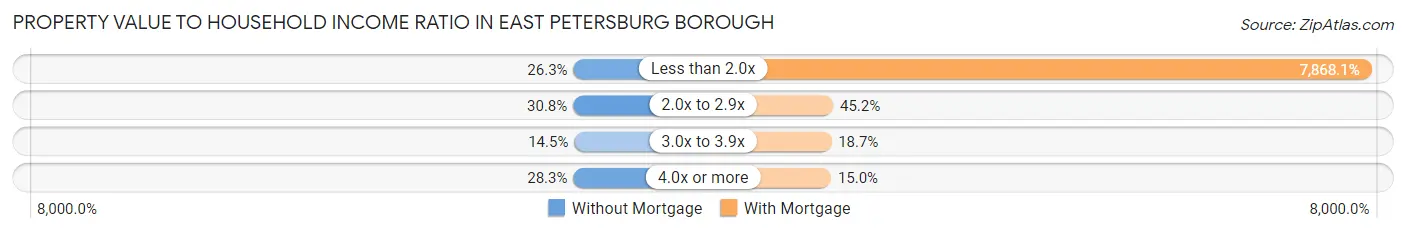
| Value-to-Income Ratio | Without Mortgage | With Mortgage |
| Less than 2.0x | 147 (26.3%) | 88,359 (7,868.1%) |
| 2.0x to 2.9x | 172 (30.8%) | 508 (45.2%) |
| 3.0x to 3.9x | 81 (14.5%) | 210 (18.7%) |
| 4.0x or more | 158 (28.3%) | 168 (15.0%) |
| Total | 558 (100.0%) | 1,123 (100.0%) |
Real Estate Taxes by Mortgage Status in East Petersburg borough
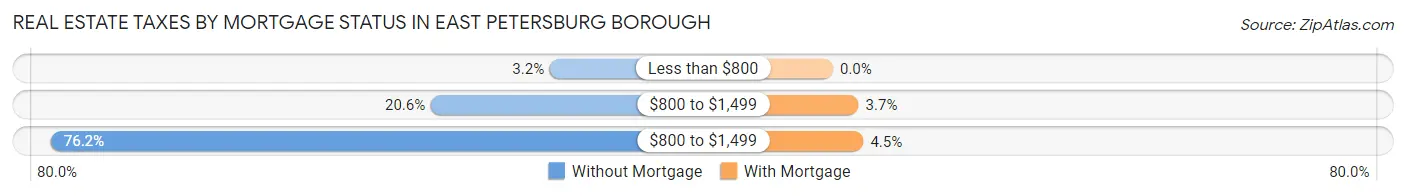
| Property Taxes | Without Mortgage | With Mortgage |
| Less than $800 | 18 (3.2%) | 0 (0.0%) |
| $800 to $1,499 | 115 (20.6%) | 42 (3.7%) |
| $800 to $1,499 | 425 (76.2%) | 50 (4.4%) |
| Total | 558 (100.0%) | 1,123 (100.0%) |
Health & Disability in East Petersburg borough
Health Insurance Coverage by Age in East Petersburg borough
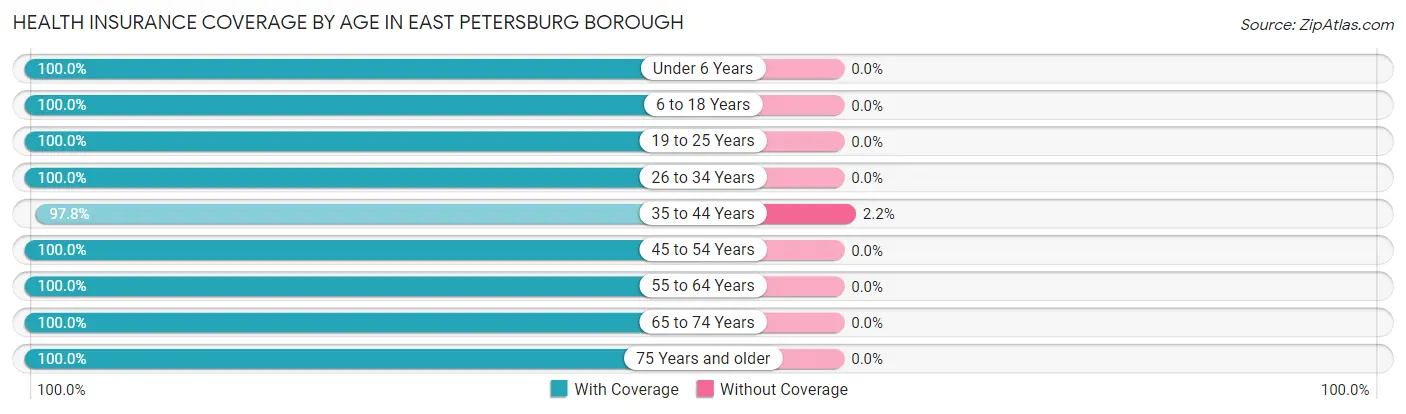
| Age Bracket | With Coverage | Without Coverage |
| Under 6 Years | 280 (100.0%) | 0 (0.0%) |
| 6 to 18 Years | 666 (100.0%) | 0 (0.0%) |
| 19 to 25 Years | 48 (100.0%) | 0 (0.0%) |
| 26 to 34 Years | 674 (100.0%) | 0 (0.0%) |
| 35 to 44 Years | 585 (97.8%) | 13 (2.2%) |
| 45 to 54 Years | 761 (100.0%) | 0 (0.0%) |
| 55 to 64 Years | 586 (100.0%) | 0 (0.0%) |
| 65 to 74 Years | 563 (100.0%) | 0 (0.0%) |
| 75 Years and older | 412 (100.0%) | 0 (0.0%) |
| Total | 4,575 (99.7%) | 13 (0.3%) |
Health Insurance Coverage by Citizenship Status in East Petersburg borough

| Citizenship Status | With Coverage | Without Coverage |
| Native Born | 280 (100.0%) | 0 (0.0%) |
| Foreign Born, Citizen | 666 (100.0%) | 0 (0.0%) |
| Foreign Born, not a Citizen | 48 (100.0%) | 0 (0.0%) |
Health Insurance Coverage by Household Income in East Petersburg borough
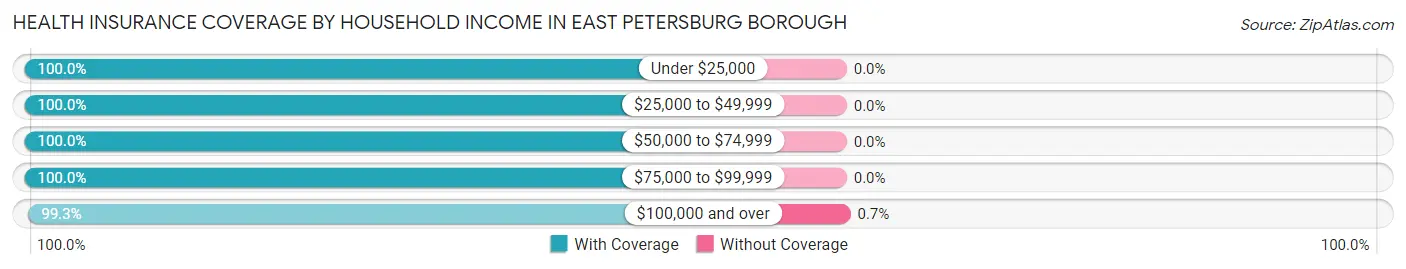
| Household Income | With Coverage | Without Coverage |
| Under $25,000 | 325 (100.0%) | 0 (0.0%) |
| $25,000 to $49,999 | 285 (100.0%) | 0 (0.0%) |
| $50,000 to $74,999 | 252 (100.0%) | 0 (0.0%) |
| $75,000 to $99,999 | 1,857 (100.0%) | 0 (0.0%) |
| $100,000 and over | 1,841 (99.3%) | 13 (0.7%) |
Public vs Private Health Insurance Coverage by Age in East Petersburg borough
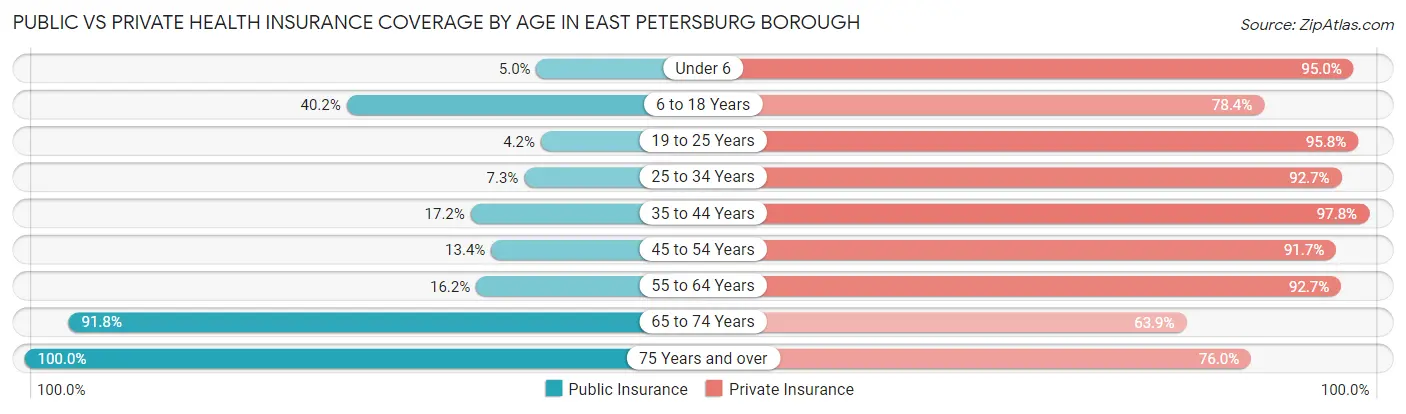
| Age Bracket | Public Insurance | Private Insurance |
| Under 6 | 14 (5.0%) | 266 (95.0%) |
| 6 to 18 Years | 268 (40.2%) | 522 (78.4%) |
| 19 to 25 Years | 2 (4.2%) | 46 (95.8%) |
| 25 to 34 Years | 49 (7.3%) | 625 (92.7%) |
| 35 to 44 Years | 103 (17.2%) | 585 (97.8%) |
| 45 to 54 Years | 102 (13.4%) | 698 (91.7%) |
| 55 to 64 Years | 95 (16.2%) | 543 (92.7%) |
| 65 to 74 Years | 517 (91.8%) | 360 (63.9%) |
| 75 Years and over | 412 (100.0%) | 313 (76.0%) |
| Total | 1,562 (34.1%) | 3,958 (86.3%) |
Disability Status by Sex by Age in East Petersburg borough
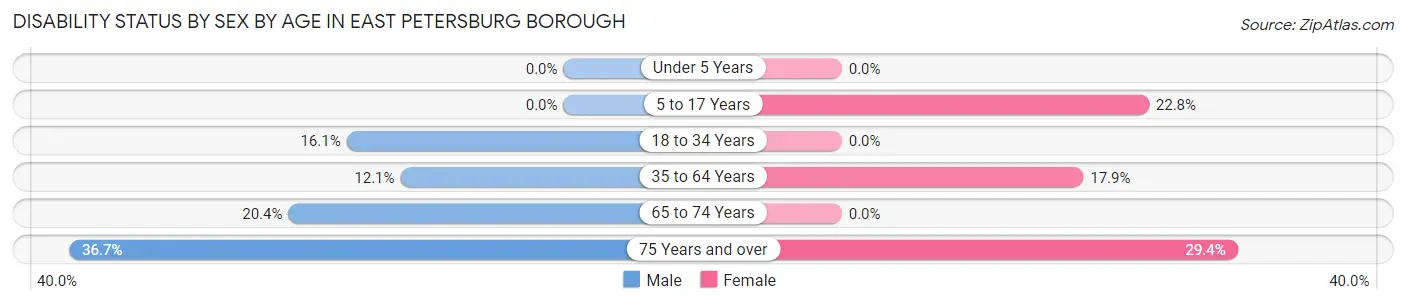
| Age Bracket | Male | Female |
| Under 5 Years | 0 (0.0%) | 0 (0.0%) |
| 5 to 17 Years | 0 (0.0%) | 88 (22.8%) |
| 18 to 34 Years | 52 (16.1%) | 0 (0.0%) |
| 35 to 64 Years | 122 (12.1%) | 168 (17.9%) |
| 65 to 74 Years | 58 (20.4%) | 0 (0.0%) |
| 75 Years and over | 80 (36.7%) | 57 (29.4%) |
Disability Class by Sex by Age in East Petersburg borough
Disability Class: Hearing Difficulty
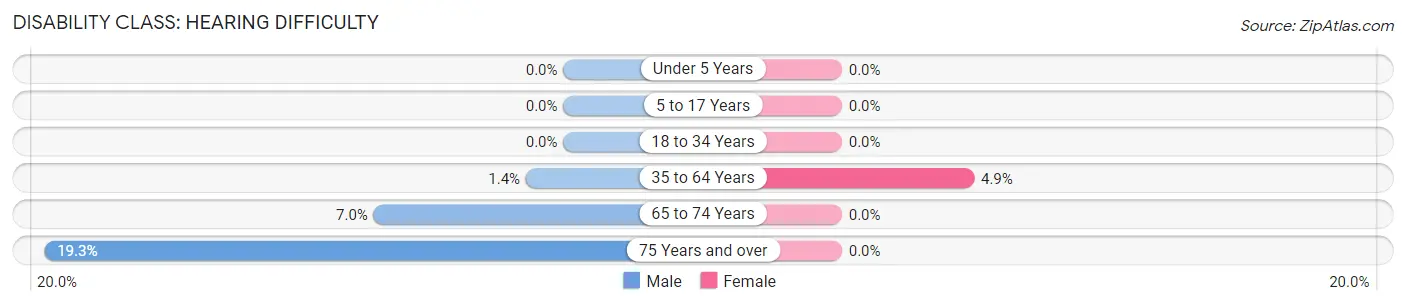
| Age Bracket | Male | Female |
| Under 5 Years | 0 (0.0%) | 0 (0.0%) |
| 5 to 17 Years | 0 (0.0%) | 0 (0.0%) |
| 18 to 34 Years | 0 (0.0%) | 0 (0.0%) |
| 35 to 64 Years | 14 (1.4%) | 46 (4.9%) |
| 65 to 74 Years | 20 (7.0%) | 0 (0.0%) |
| 75 Years and over | 42 (19.3%) | 0 (0.0%) |
Disability Class: Vision Difficulty
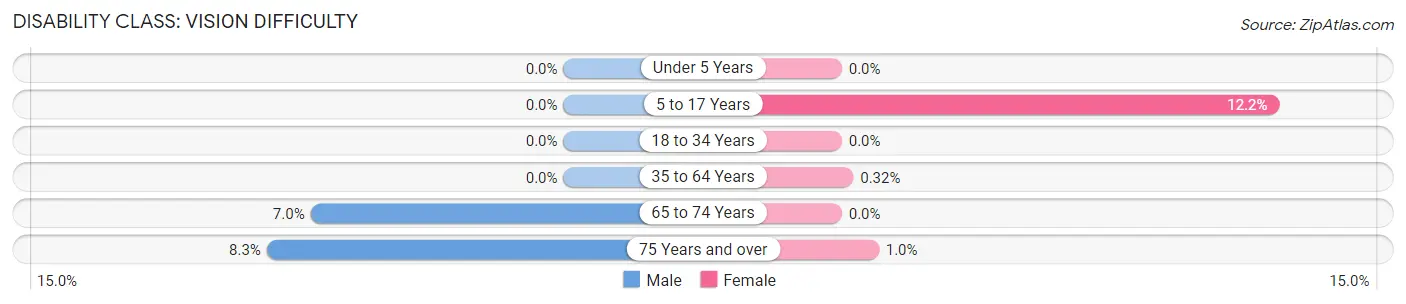
| Age Bracket | Male | Female |
| Under 5 Years | 0 (0.0%) | 0 (0.0%) |
| 5 to 17 Years | 0 (0.0%) | 47 (12.2%) |
| 18 to 34 Years | 0 (0.0%) | 0 (0.0%) |
| 35 to 64 Years | 0 (0.0%) | 3 (0.3%) |
| 65 to 74 Years | 20 (7.0%) | 0 (0.0%) |
| 75 Years and over | 18 (8.3%) | 2 (1.0%) |
Disability Class: Cognitive Difficulty
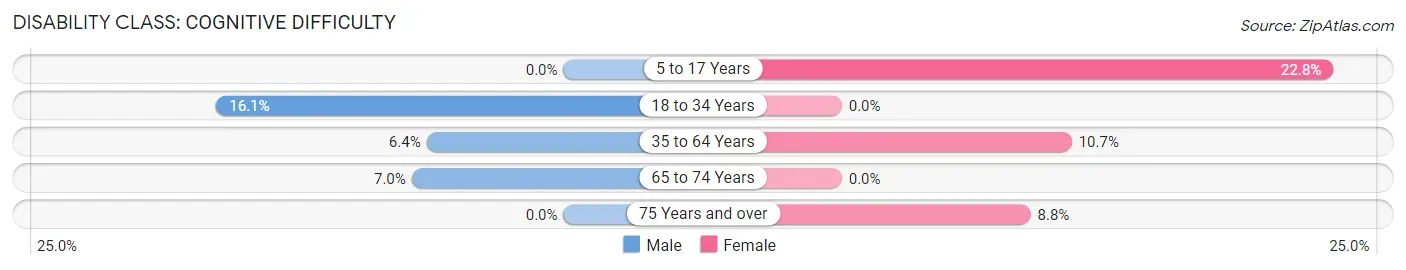
| Age Bracket | Male | Female |
| 5 to 17 Years | 0 (0.0%) | 88 (22.8%) |
| 18 to 34 Years | 52 (16.1%) | 0 (0.0%) |
| 35 to 64 Years | 64 (6.4%) | 100 (10.7%) |
| 65 to 74 Years | 20 (7.0%) | 0 (0.0%) |
| 75 Years and over | 0 (0.0%) | 17 (8.8%) |
Disability Class: Ambulatory Difficulty
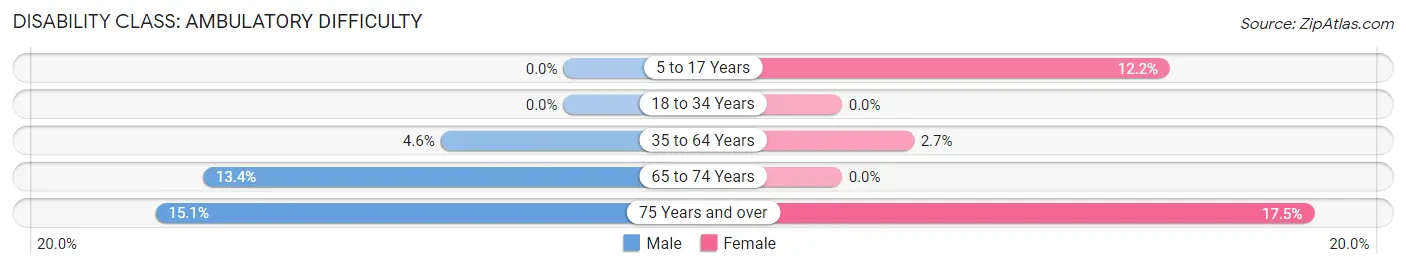
| Age Bracket | Male | Female |
| 5 to 17 Years | 0 (0.0%) | 47 (12.2%) |
| 18 to 34 Years | 0 (0.0%) | 0 (0.0%) |
| 35 to 64 Years | 46 (4.6%) | 25 (2.7%) |
| 65 to 74 Years | 38 (13.4%) | 0 (0.0%) |
| 75 Years and over | 33 (15.1%) | 34 (17.5%) |
Disability Class: Self-Care Difficulty
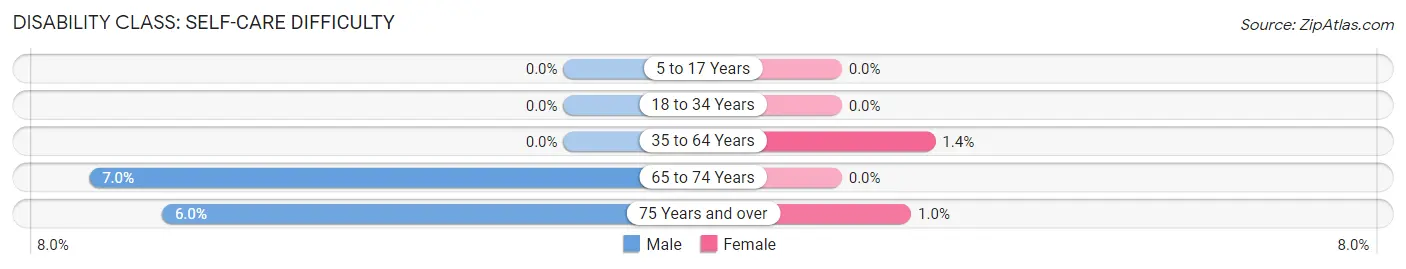
| Age Bracket | Male | Female |
| 5 to 17 Years | 0 (0.0%) | 0 (0.0%) |
| 18 to 34 Years | 0 (0.0%) | 0 (0.0%) |
| 35 to 64 Years | 0 (0.0%) | 13 (1.4%) |
| 65 to 74 Years | 20 (7.0%) | 0 (0.0%) |
| 75 Years and over | 13 (6.0%) | 2 (1.0%) |
Technology Access in East Petersburg borough
Computing Device Access in East Petersburg borough
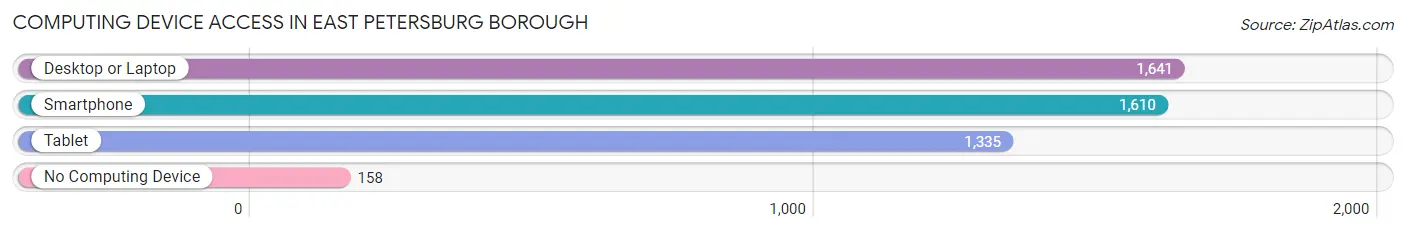
| Device Type | # Households | % Households |
| Desktop or Laptop | 1,641 | 85.3% |
| Smartphone | 1,610 | 83.7% |
| Tablet | 1,335 | 69.4% |
| No Computing Device | 158 | 8.2% |
| Total | 1,923 | 100.0% |
Internet Access in East Petersburg borough
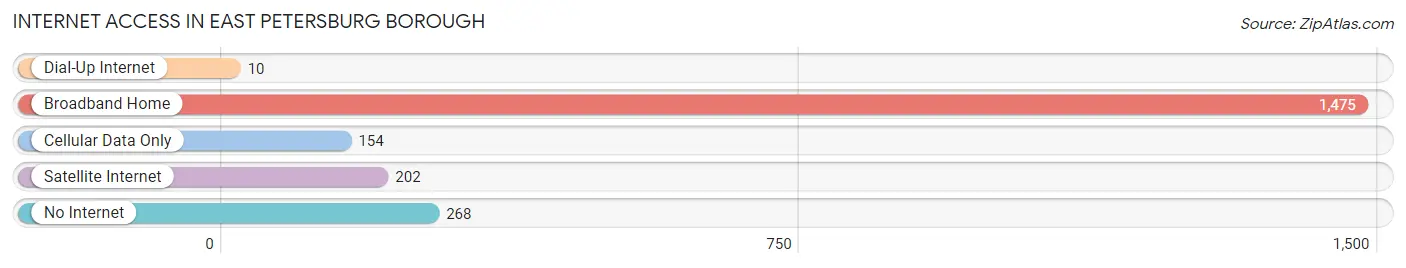
| Internet Type | # Households | % Households |
| Dial-Up Internet | 10 | 0.5% |
| Broadband Home | 1,475 | 76.7% |
| Cellular Data Only | 154 | 8.0% |
| Satellite Internet | 202 | 10.5% |
| No Internet | 268 | 13.9% |
| Total | 1,923 | 100.0% |
East Petersburg borough Summary
East Petersburg Borough is a small borough located in Lancaster County, Pennsylvania. It is situated in the southeastern part of the county, approximately five miles east of the city of Lancaster. The borough is bordered by Manheim Township to the north, East Hempfield Township to the east, and Mountville Borough to the south. The population of East Petersburg Borough was 4,845 at the 2010 census.
History
East Petersburg Borough was founded in 1864 by a group of German immigrants who had settled in the area. The borough was originally known as East Petersburg, but the name was changed to East Petersburg Borough in 1867. The borough was incorporated in 1868.
The borough was originally a farming community, but it began to grow in the late 19th century with the arrival of the railroad. The railroad brought new businesses and industries to the area, and the population of the borough began to grow.
In the early 20th century, East Petersburg Borough was a thriving community with a variety of businesses and industries. The borough was home to several factories, including a cigar factory, a furniture factory, and a shoe factory. The borough also had several stores, including a grocery store, a hardware store, and a drug store.
Geography
East Petersburg Borough is located at 40°10'N 76°17'W (40.17, -76.28). The borough has a total area of 1.2 square miles, all of which is land. The borough is located in the southeastern part of Lancaster County, approximately five miles east of the city of Lancaster.
The borough is bordered by Manheim Township to the north, East Hempfield Township to the east, and Mountville Borough to the south. The borough is located in the Susquehanna River watershed.
Economy
The economy of East Petersburg Borough is largely based on manufacturing and retail. The borough is home to several factories, including a cigar factory, a furniture factory, and a shoe factory. The borough also has several stores, including a grocery store, a hardware store, and a drug store.
The borough is also home to several small businesses, including restaurants, auto repair shops, and a variety of other services. The borough is also home to several churches and a library.
Demographics
As of the 2010 census, the population of East Petersburg Borough was 4,845. The racial makeup of the borough was 94.3% White, 1.3% African American, 0.2% Native American, 1.2% Asian, 0.1% Pacific Islander, 1.2% from other races, and 1.7% from two or more races. Hispanic or Latino of any race were 3.2% of the population.
The median household income in East Petersburg Borough was $50,902, and the median family income was $60,902. The per capita income for the borough was $25,902. About 4.3% of families and 5.7% of the population were below the poverty line, including 8.2% of those under age 18 and 4.3% of those age 65 or over.
Common Questions
What is Per Capita Income in East Petersburg borough?
Per Capita income in East Petersburg borough is $39,661.
What is the Median Family Income in East Petersburg borough?
Median Family Income in East Petersburg borough is $92,708.
What is the Median Household income in East Petersburg borough?
Median Household Income in East Petersburg borough is $85,828.
What is Income or Wage Gap in East Petersburg borough?
Income or Wage Gap in East Petersburg borough is 48.3%.
Women in East Petersburg borough earn 51.7 cents for every dollar earned by a man.
What is Inequality or Gini Index in East Petersburg borough?
Inequality or Gini Index in East Petersburg borough is 0.33.
What is the Total Population of East Petersburg borough?
Total Population of East Petersburg borough is 4,588.
What is the Total Male Population of East Petersburg borough?
Total Male Population of East Petersburg borough is 2,281.
What is the Total Female Population of East Petersburg borough?
Total Female Population of East Petersburg borough is 2,307.
What is the Ratio of Males per 100 Females in East Petersburg borough?
There are 98.87 Males per 100 Females in East Petersburg borough.
What is the Ratio of Females per 100 Males in East Petersburg borough?
There are 101.14 Females per 100 Males in East Petersburg borough.
What is the Median Population Age in East Petersburg borough?
Median Population Age in East Petersburg borough is 45.4 Years.
What is the Average Family Size in East Petersburg borough
Average Family Size in East Petersburg borough is 2.8 People.
What is the Average Household Size in East Petersburg borough
Average Household Size in East Petersburg borough is 2.4 People.
How Large is the Labor Force in East Petersburg borough?
There are 2,875 People in the Labor Forcein in East Petersburg borough.
What is the Percentage of People in the Labor Force in East Petersburg borough?
74.8% of People are in the Labor Force in East Petersburg borough.
What is the Unemployment Rate in East Petersburg borough?
Unemployment Rate in East Petersburg borough is 2.2%.