Cambridge Springs borough, PA Map & Demographics
Cambridge Springs borough Overview
$21,259
PER CAPITA INCOME
$61,625
AVG FAMILY INCOME
$52,109
AVG HOUSEHOLD INCOME
61.6%
WAGE / INCOME GAP [ % ]
38.4¢/ $1
WAGE / INCOME GAP [ $ ]
0.47
INEQUALITY / GINI INDEX
2,297
TOTAL POPULATION
641
MALE POPULATION
1,656
FEMALE POPULATION
38.71
MALES / 100 FEMALES
258.35
FEMALES / 100 MALES
39.8
MEDIAN AGE
3.0
AVG FAMILY SIZE
2.3
AVG HOUSEHOLD SIZE
719
LABOR FORCE [ PEOPLE ]
36.3%
PERCENT IN LABOR FORCE
6.3%
UNEMPLOYMENT RATE
Income in Cambridge Springs borough
Income Overview in Cambridge Springs borough
Per Capita Income in Cambridge Springs borough is $21,259, while median incomes of families and households are $61,625 and $52,109 respectively.
| Characteristic | Number | Measure |
| Per Capita Income | 2,297 | $21,259 |
| Median Family Income | 326 | $61,625 |
| Mean Family Income | 326 | $70,935 |
| Median Household Income | 643 | $52,109 |
| Mean Household Income | 643 | $67,565 |
| Income Deficit | 326 | $0 |
| Wage / Income Gap (%) | 2,297 | 61.56% |
| Wage / Income Gap ($) | 2,297 | 38.44¢ per $1 |
| Gini / Inequality Index | 2,297 | 0.47 |
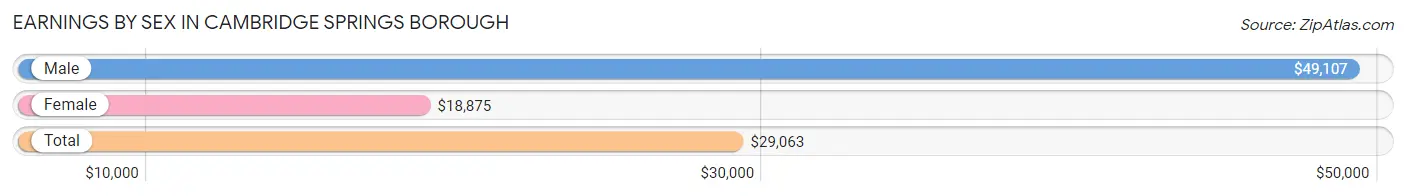
Earnings by Sex in Cambridge Springs borough
Average Earnings in Cambridge Springs borough are $29,063, $49,107 for men and $18,875 for women, a difference of 61.6%.
| Sex | Number | Average Earnings |
| Male | 345 (35.1%) | $49,107 |
| Female | 638 (64.9%) | $18,875 |
| Total | 983 (100.0%) | $29,063 |
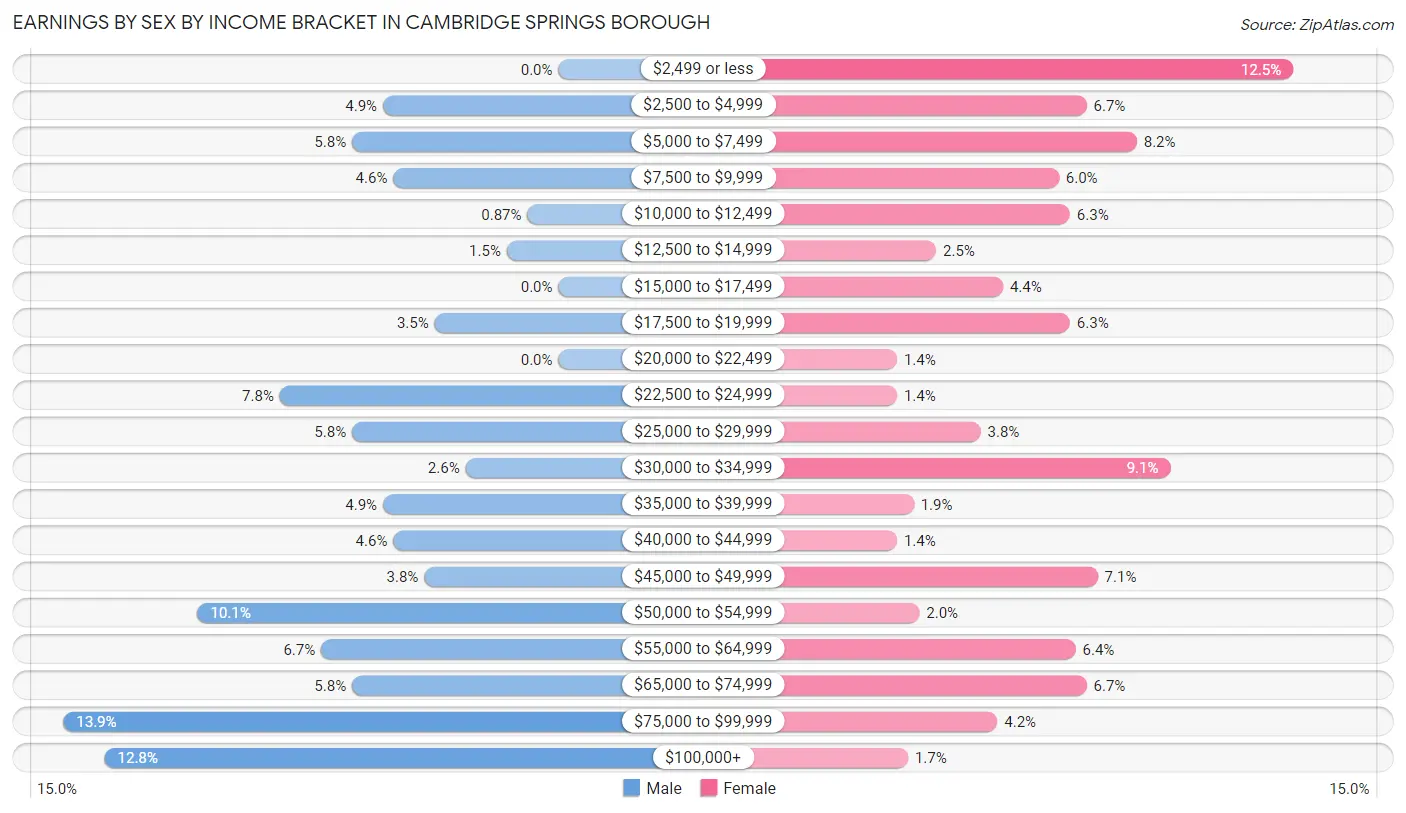
Earnings by Sex by Income Bracket in Cambridge Springs borough
The most common earnings brackets in Cambridge Springs borough are $75,000 to $99,999 for men (48 | 13.9%) and $2,499 or less for women (80 | 12.5%).
| Income | Male | Female |
| $2,499 or less | 0 (0.0%) | 80 (12.5%) |
| $2,500 to $4,999 | 17 (4.9%) | 43 (6.7%) |
| $5,000 to $7,499 | 20 (5.8%) | 52 (8.2%) |
| $7,500 to $9,999 | 16 (4.6%) | 38 (6.0%) |
| $10,000 to $12,499 | 3 (0.9%) | 40 (6.3%) |
| $12,500 to $14,999 | 5 (1.5%) | 16 (2.5%) |
| $15,000 to $17,499 | 0 (0.0%) | 28 (4.4%) |
| $17,500 to $19,999 | 12 (3.5%) | 40 (6.3%) |
| $20,000 to $22,499 | 0 (0.0%) | 9 (1.4%) |
| $22,500 to $24,999 | 27 (7.8%) | 9 (1.4%) |
| $25,000 to $29,999 | 20 (5.8%) | 24 (3.8%) |
| $30,000 to $34,999 | 9 (2.6%) | 58 (9.1%) |
| $35,000 to $39,999 | 17 (4.9%) | 12 (1.9%) |
| $40,000 to $44,999 | 16 (4.6%) | 9 (1.4%) |
| $45,000 to $49,999 | 13 (3.8%) | 45 (7.0%) |
| $50,000 to $54,999 | 35 (10.1%) | 13 (2.0%) |
| $55,000 to $64,999 | 23 (6.7%) | 41 (6.4%) |
| $65,000 to $74,999 | 20 (5.8%) | 43 (6.7%) |
| $75,000 to $99,999 | 48 (13.9%) | 27 (4.2%) |
| $100,000+ | 44 (12.8%) | 11 (1.7%) |
| Total | 345 (100.0%) | 638 (100.0%) |
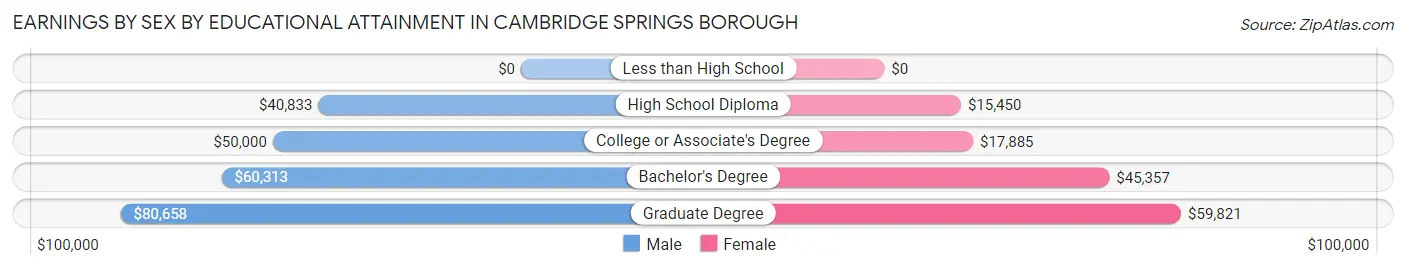
Earnings by Sex by Educational Attainment in Cambridge Springs borough
Average earnings in Cambridge Springs borough are $50,707 for men and $19,211 for women, a difference of 62.1%. Men with an educational attainment of graduate degree enjoy the highest average annual earnings of $80,658, while those with high school diploma education earn the least with $40,833. Women with an educational attainment of graduate degree earn the most with the average annual earnings of $59,821, while those with high school diploma education have the smallest earnings of $15,450.
| Educational Attainment | Male Income | Female Income |
| Less than High School | - | - |
| High School Diploma | $40,833 | $15,450 |
| College or Associate's Degree | $50,000 | $17,885 |
| Bachelor's Degree | $60,313 | $45,357 |
| Graduate Degree | $80,658 | $59,821 |
| Total | $50,707 | $19,211 |
Family Income in Cambridge Springs borough
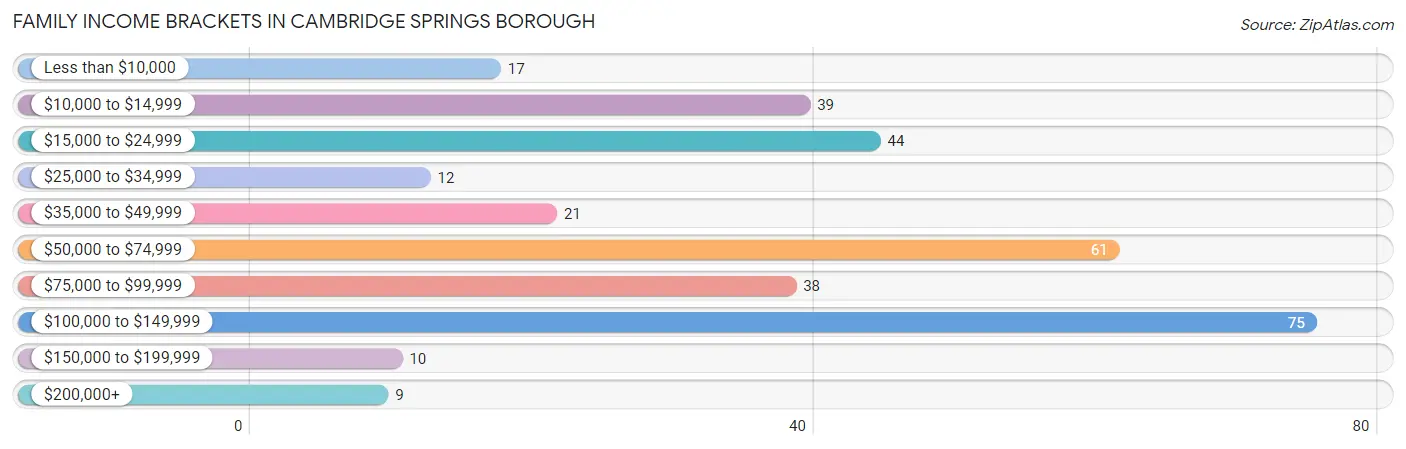
Family Income Brackets in Cambridge Springs borough
According to the Cambridge Springs borough family income data, there are 75 families falling into the $100,000 to $149,999 income range, which is the most common income bracket and makes up 23.0% of all families. Conversely, the $200,000+ income bracket is the least frequent group with only 9 families (2.8%) belonging to this category.
| Income Bracket | # Families | % Families |
| Less than $10,000 | 17 | 5.2% |
| $10,000 to $14,999 | 39 | 12.0% |
| $15,000 to $24,999 | 44 | 13.5% |
| $25,000 to $34,999 | 12 | 3.7% |
| $35,000 to $49,999 | 21 | 6.4% |
| $50,000 to $74,999 | 61 | 18.7% |
| $75,000 to $99,999 | 38 | 11.7% |
| $100,000 to $149,999 | 75 | 23.0% |
| $150,000 to $199,999 | 10 | 3.1% |
| $200,000+ | 9 | 2.8% |
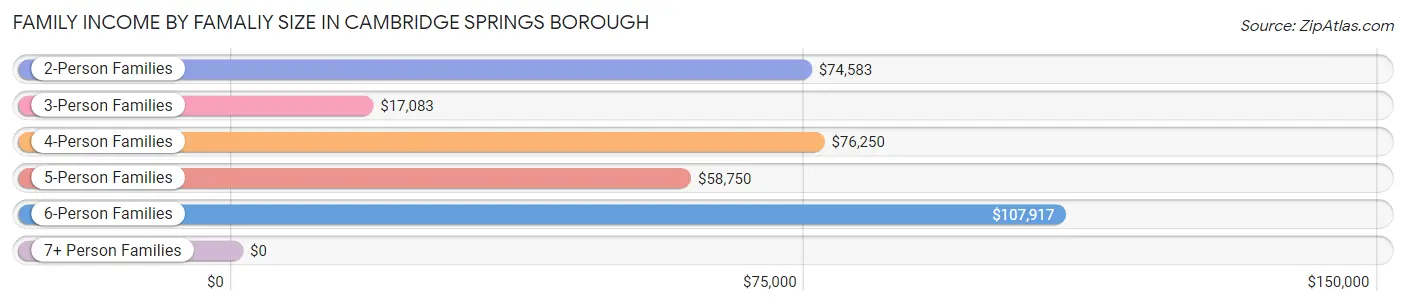
Family Income by Famaliy Size in Cambridge Springs borough
6-person families (13 | 4.0%) account for the highest median family income in Cambridge Springs borough with $107,917 per family, while 2-person families (156 | 47.8%) have the highest median income of $37,292 per family member.
| Income Bracket | # Families | Median Income |
| 2-Person Families | 156 (47.8%) | $74,583 |
| 3-Person Families | 97 (29.7%) | $17,083 |
| 4-Person Families | 47 (14.4%) | $76,250 |
| 5-Person Families | 9 (2.8%) | $58,750 |
| 6-Person Families | 13 (4.0%) | $107,917 |
| 7+ Person Families | 4 (1.2%) | $0 |
| Total | 326 (100.0%) | $61,625 |
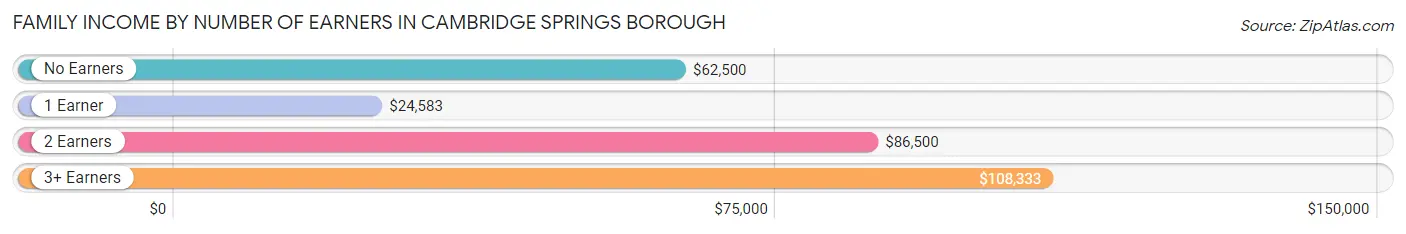
Family Income by Number of Earners in Cambridge Springs borough
The median family income in Cambridge Springs borough is $61,625, with families comprising 3+ earners (20) having the highest median family income of $108,333, while families with 1 earner (136) have the lowest median family income of $24,583, accounting for 6.1% and 41.7% of families, respectively.
| Number of Earners | # Families | Median Income |
| No Earners | 38 (11.7%) | $62,500 |
| 1 Earner | 136 (41.7%) | $24,583 |
| 2 Earners | 132 (40.5%) | $86,500 |
| 3+ Earners | 20 (6.1%) | $108,333 |
| Total | 326 (100.0%) | $61,625 |
Household Income in Cambridge Springs borough
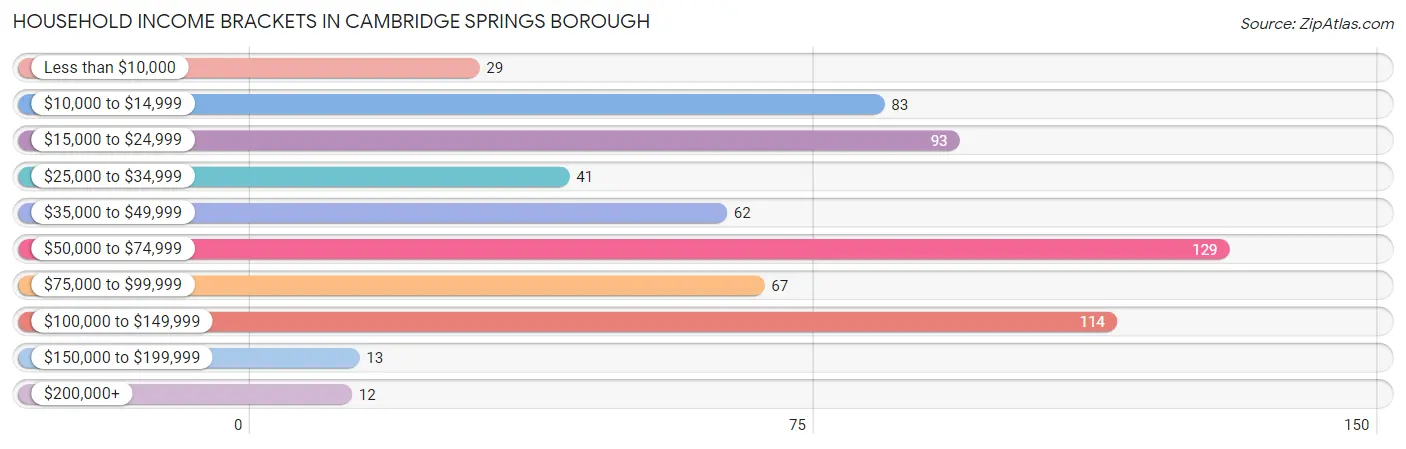
Household Income Brackets in Cambridge Springs borough
With 129 households falling in the category, the $50,000 to $74,999 income range is the most frequent in Cambridge Springs borough, accounting for 20.1% of all households. In contrast, only 12 households (1.9%) fall into the $200,000+ income bracket, making it the least populous group.
| Income Bracket | # Households | % Households |
| Less than $10,000 | 29 | 4.5% |
| $10,000 to $14,999 | 83 | 12.9% |
| $15,000 to $24,999 | 93 | 14.5% |
| $25,000 to $34,999 | 41 | 6.4% |
| $35,000 to $49,999 | 62 | 9.6% |
| $50,000 to $74,999 | 129 | 20.1% |
| $75,000 to $99,999 | 67 | 10.4% |
| $100,000 to $149,999 | 114 | 17.7% |
| $150,000 to $199,999 | 13 | 2.0% |
| $200,000+ | 12 | 1.9% |
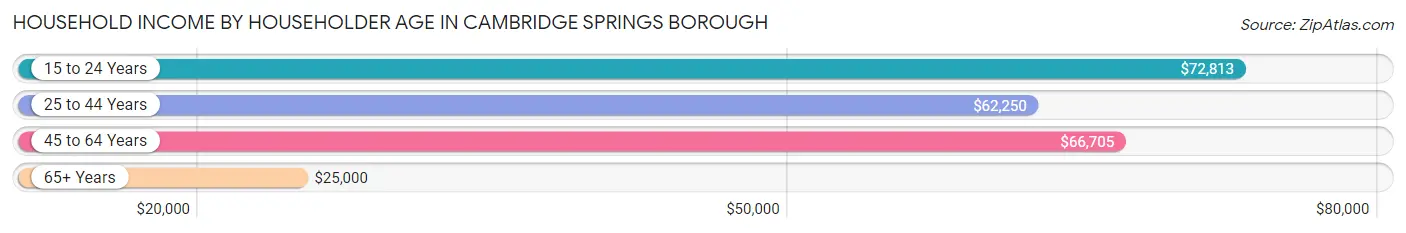
Household Income by Householder Age in Cambridge Springs borough
The median household income in Cambridge Springs borough is $52,109, with the highest median household income of $72,813 found in the 15 to 24 years age bracket for the primary householder. A total of 29 households (4.5%) fall into this category. Meanwhile, the 65+ years age bracket for the primary householder has the lowest median household income of $25,000, with 176 households (27.4%) in this group.
| Income Bracket | # Households | Median Income |
| 15 to 24 Years | 29 (4.5%) | $72,813 |
| 25 to 44 Years | 205 (31.9%) | $62,250 |
| 45 to 64 Years | 233 (36.2%) | $66,705 |
| 65+ Years | 176 (27.4%) | $25,000 |
| Total | 643 (100.0%) | $52,109 |
Poverty in Cambridge Springs borough
Income Below Poverty by Sex and Age in Cambridge Springs borough
With 19.2% poverty level for males and 27.7% for females among the residents of Cambridge Springs borough, under 5 year old males and 5 year old females are the most vulnerable to poverty, with 11 males (45.8%) and 10 females (76.9%) in their respective age groups living below the poverty level.
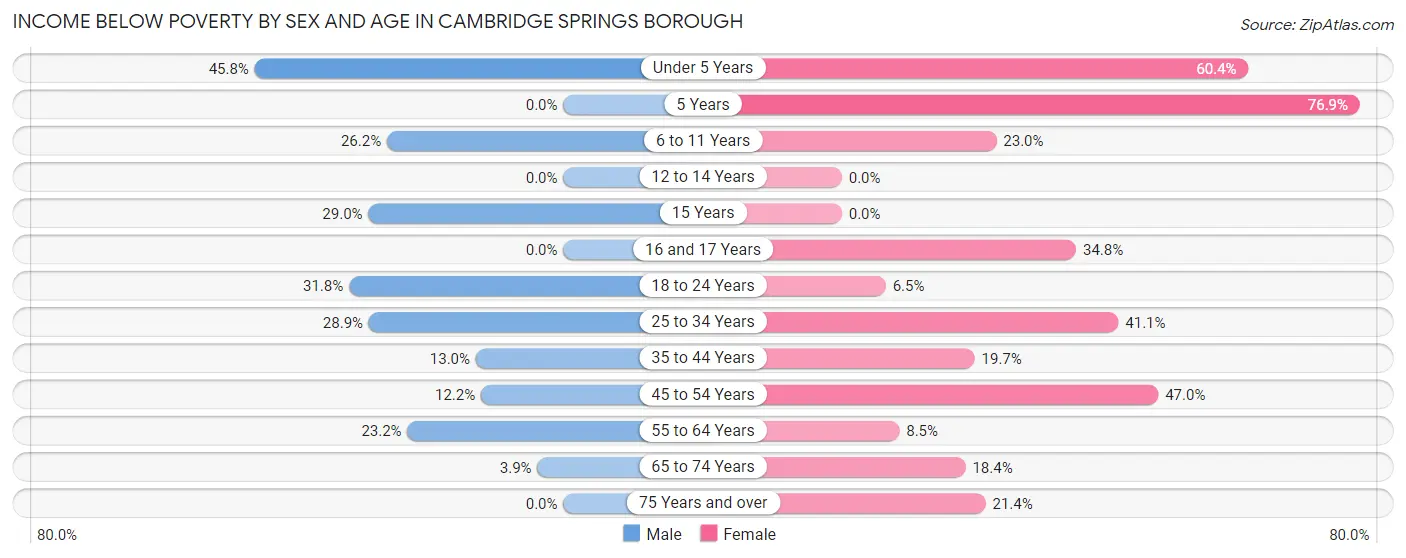
| Age Bracket | Male | Female |
| Under 5 Years | 11 (45.8%) | 32 (60.4%) |
| 5 Years | 0 (0.0%) | 10 (76.9%) |
| 6 to 11 Years | 11 (26.2%) | 14 (23.0%) |
| 12 to 14 Years | 0 (0.0%) | 0 (0.0%) |
| 15 Years | 11 (28.9%) | 0 (0.0%) |
| 16 and 17 Years | 0 (0.0%) | 8 (34.8%) |
| 18 to 24 Years | 14 (31.8%) | 3 (6.5%) |
| 25 to 34 Years | 28 (28.9%) | 46 (41.1%) |
| 35 to 44 Years | 10 (13.0%) | 28 (19.7%) |
| 45 to 54 Years | 11 (12.2%) | 39 (47.0%) |
| 55 to 64 Years | 25 (23.2%) | 7 (8.5%) |
| 65 to 74 Years | 2 (3.8%) | 9 (18.4%) |
| 75 Years and over | 0 (0.0%) | 19 (21.3%) |
| Total | 123 (19.2%) | 215 (27.7%) |
Income Above Poverty by Sex and Age in Cambridge Springs borough
According to the poverty statistics in Cambridge Springs borough, males aged 5 years and females aged 12 to 14 years are the age groups that are most secure financially, with 100.0% of males and 100.0% of females in these age groups living above the poverty line.
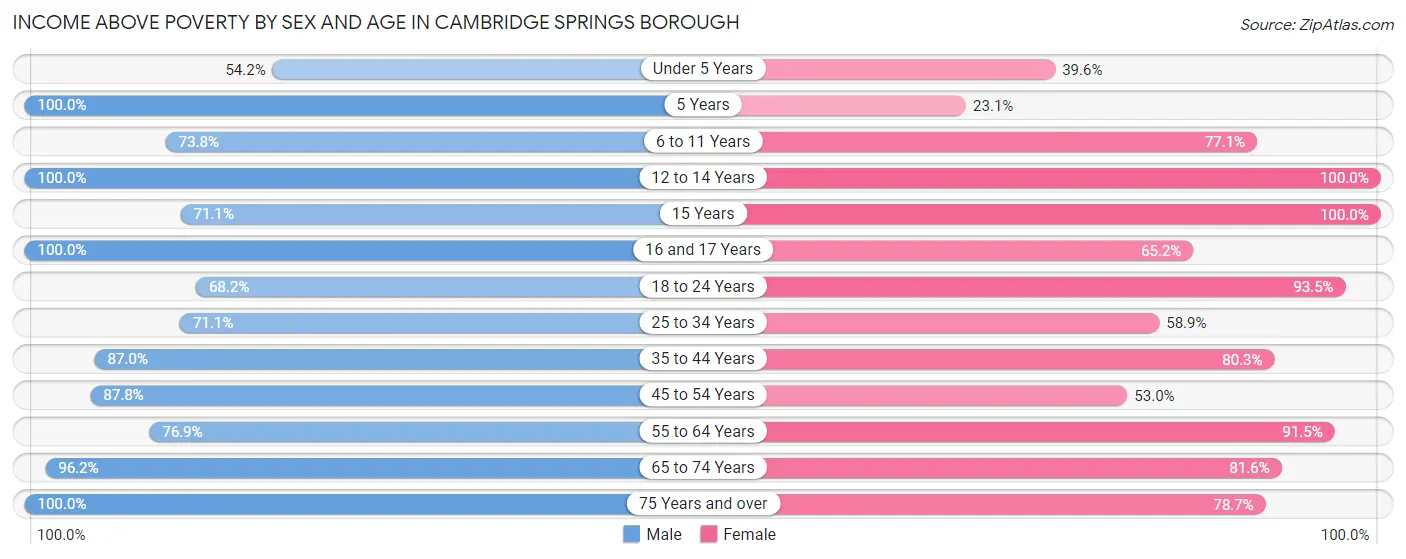
| Age Bracket | Male | Female |
| Under 5 Years | 13 (54.2%) | 21 (39.6%) |
| 5 Years | 4 (100.0%) | 3 (23.1%) |
| 6 to 11 Years | 31 (73.8%) | 47 (77.0%) |
| 12 to 14 Years | 20 (100.0%) | 18 (100.0%) |
| 15 Years | 27 (71.1%) | 4 (100.0%) |
| 16 and 17 Years | 12 (100.0%) | 15 (65.2%) |
| 18 to 24 Years | 30 (68.2%) | 43 (93.5%) |
| 25 to 34 Years | 69 (71.1%) | 66 (58.9%) |
| 35 to 44 Years | 67 (87.0%) | 114 (80.3%) |
| 45 to 54 Years | 79 (87.8%) | 44 (53.0%) |
| 55 to 64 Years | 83 (76.8%) | 75 (91.5%) |
| 65 to 74 Years | 50 (96.2%) | 40 (81.6%) |
| 75 Years and over | 33 (100.0%) | 70 (78.6%) |
| Total | 518 (80.8%) | 560 (72.3%) |
Income Below Poverty Among Married-Couple Families in Cambridge Springs borough
The poverty statistics for married-couple families in Cambridge Springs borough show that 5.6% or 11 of the total 195 families live below the poverty line. Families with 1 or 2 children have the highest poverty rate of 12.7%, comprising of 8 families. On the other hand, families with 3 or 4 children have the lowest poverty rate of 0.0%, which includes 0 families.
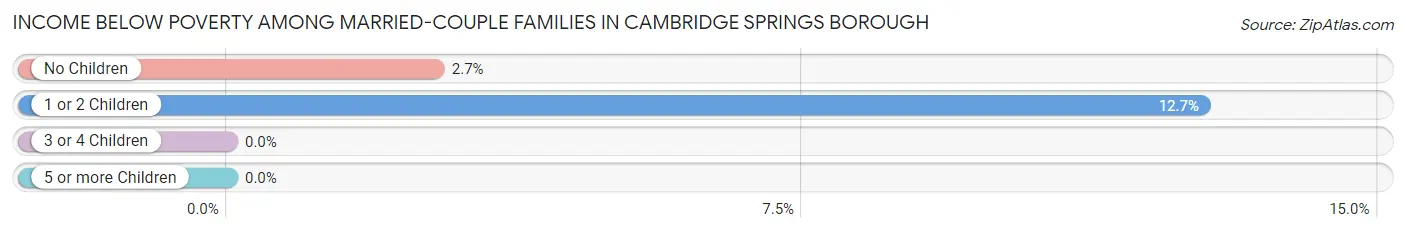
| Children | Above Poverty | Below Poverty |
| No Children | 108 (97.3%) | 3 (2.7%) |
| 1 or 2 Children | 55 (87.3%) | 8 (12.7%) |
| 3 or 4 Children | 17 (100.0%) | 0 (0.0%) |
| 5 or more Children | 4 (100.0%) | 0 (0.0%) |
| Total | 184 (94.4%) | 11 (5.6%) |
Income Below Poverty Among Single-Parent Households in Cambridge Springs borough
According to the poverty data in Cambridge Springs borough, 28.0% or 14 single-father households and 70.4% or 57 single-mother households are living below the poverty line. Among single-father households, those with 1 or 2 children have the highest poverty rate, with 14 households (29.8%) experiencing poverty. Likewise, among single-mother households, those with 1 or 2 children have the highest poverty rate, with 42 households (84.0%) falling below the poverty line.
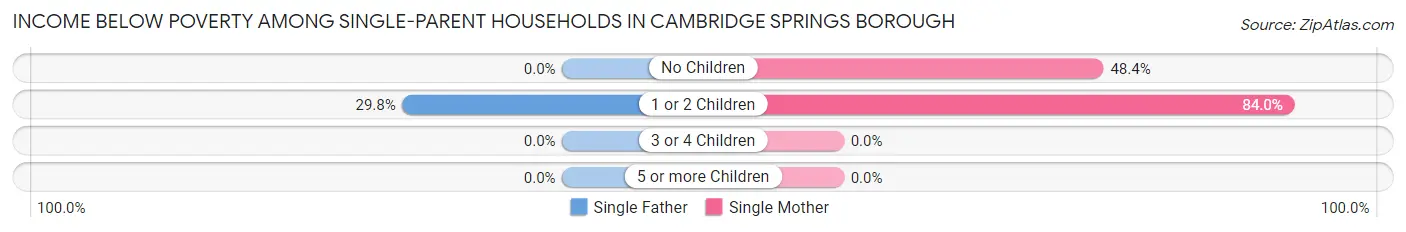
| Children | Single Father | Single Mother |
| No Children | 0 (0.0%) | 15 (48.4%) |
| 1 or 2 Children | 14 (29.8%) | 42 (84.0%) |
| 3 or 4 Children | 0 (0.0%) | 0 (0.0%) |
| 5 or more Children | 0 (0.0%) | 0 (0.0%) |
| Total | 14 (28.0%) | 57 (70.4%) |
Income Below Poverty Among Married-Couple vs Single-Parent Households in Cambridge Springs borough
The poverty data for Cambridge Springs borough shows that 11 of the married-couple family households (5.6%) and 71 of the single-parent households (54.2%) are living below the poverty level. Within the married-couple family households, those with 1 or 2 children have the highest poverty rate, with 8 households (12.7%) falling below the poverty line. Among the single-parent households, those with 1 or 2 children have the highest poverty rate, with 56 household (57.7%) living below poverty.
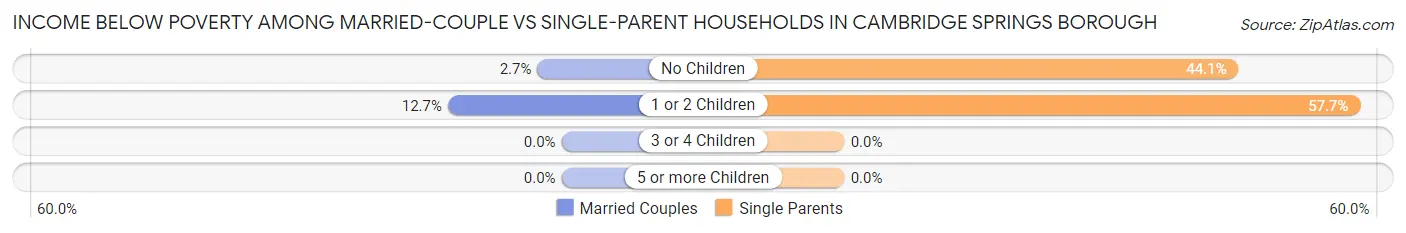
| Children | Married-Couple Families | Single-Parent Households |
| No Children | 3 (2.7%) | 15 (44.1%) |
| 1 or 2 Children | 8 (12.7%) | 56 (57.7%) |
| 3 or 4 Children | 0 (0.0%) | 0 (0.0%) |
| 5 or more Children | 0 (0.0%) | 0 (0.0%) |
| Total | 11 (5.6%) | 71 (54.2%) |
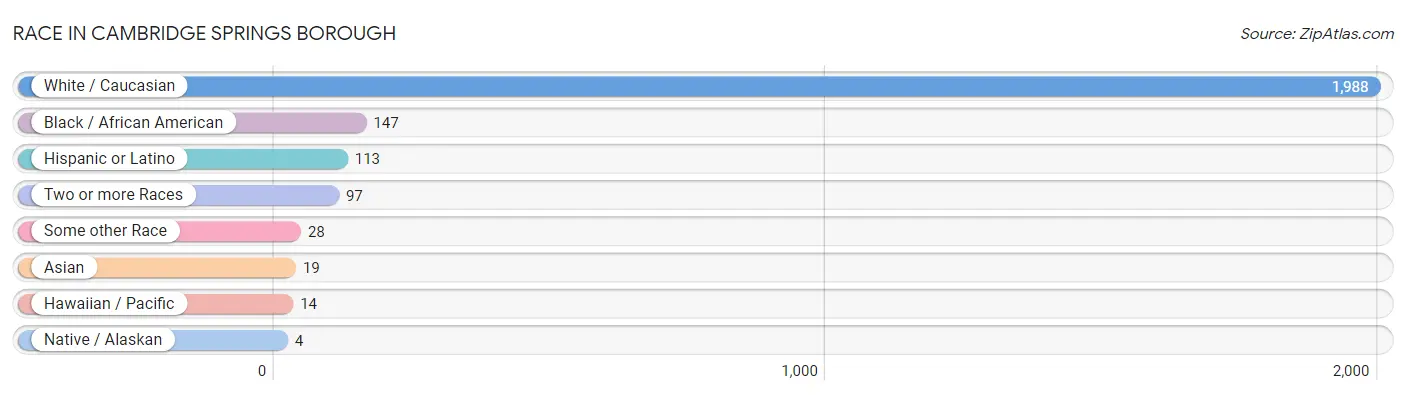
Race in Cambridge Springs borough
The most populous races in Cambridge Springs borough are White / Caucasian (1,988 | 86.6%), Black / African American (147 | 6.4%), and Hispanic or Latino (113 | 4.9%).
| Race | # Population | % Population |
| Asian | 19 | 0.8% |
| Black / African American | 147 | 6.4% |
| Hawaiian / Pacific | 14 | 0.6% |
| Hispanic or Latino | 113 | 4.9% |
| Native / Alaskan | 4 | 0.2% |
| White / Caucasian | 1,988 | 86.6% |
| Two or more Races | 97 | 4.2% |
| Some other Race | 28 | 1.2% |
| Total | 2,297 | 100.0% |
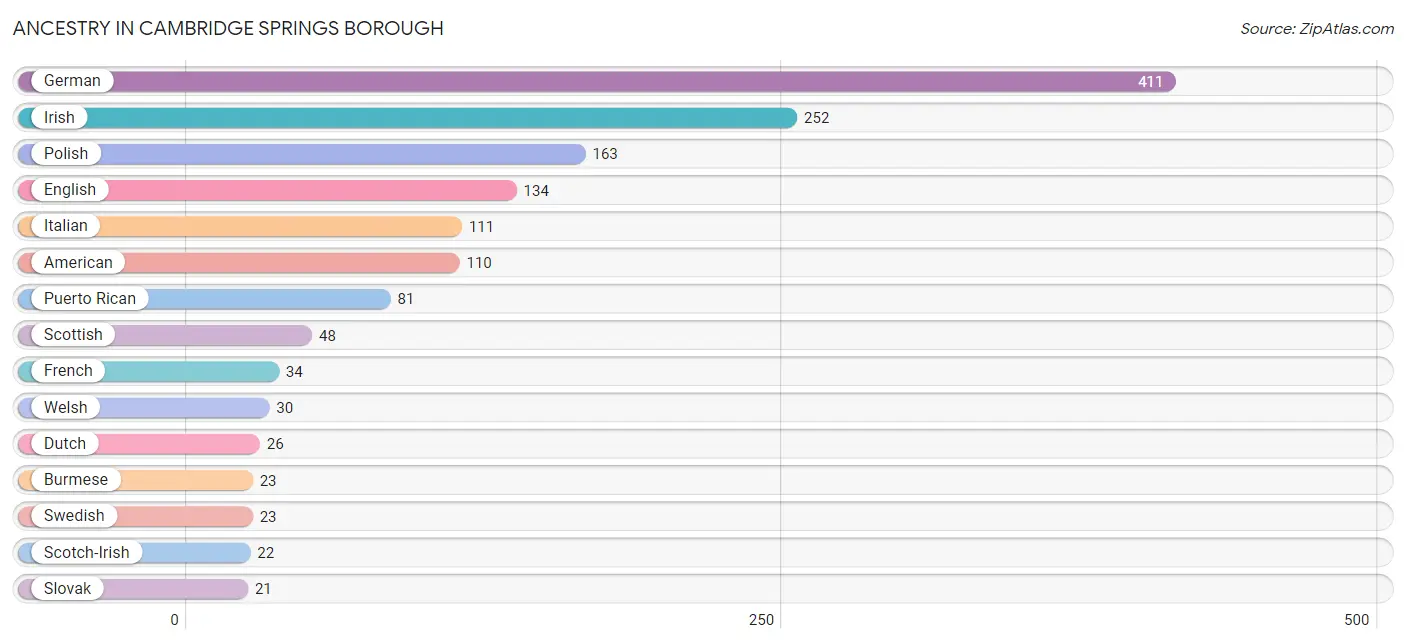
Ancestry in Cambridge Springs borough
The most populous ancestries reported in Cambridge Springs borough are German (411 | 17.9%), Irish (252 | 11.0%), Polish (163 | 7.1%), English (134 | 5.8%), and Italian (111 | 4.8%), together accounting for 46.6% of all Cambridge Springs borough residents.
| Ancestry | # Population | % Population |
| American | 110 | 4.8% |
| British | 3 | 0.1% |
| Burmese | 23 | 1.0% |
| Chippewa | 2 | 0.1% |
| Crow | 2 | 0.1% |
| Cuban | 19 | 0.8% |
| Czech | 17 | 0.7% |
| Dutch | 26 | 1.1% |
| Eastern European | 8 | 0.4% |
| English | 134 | 5.8% |
| Ethiopian | 1 | 0.0% |
| European | 17 | 0.7% |
| Fijian | 14 | 0.6% |
| French | 34 | 1.5% |
| French Canadian | 2 | 0.1% |
| German | 411 | 17.9% |
| Greek | 2 | 0.1% |
| Haitian | 20 | 0.9% |
| Hungarian | 16 | 0.7% |
| Indian (Asian) | 5 | 0.2% |
| Irish | 252 | 11.0% |
| Italian | 111 | 4.8% |
| Lithuanian | 7 | 0.3% |
| Mexican | 13 | 0.6% |
| New Zealander | 2 | 0.1% |
| Northern European | 2 | 0.1% |
| Pennsylvania German | 8 | 0.4% |
| Polish | 163 | 7.1% |
| Portuguese | 14 | 0.6% |
| Puerto Rican | 81 | 3.5% |
| Russian | 14 | 0.6% |
| Scandinavian | 8 | 0.4% |
| Scotch-Irish | 22 | 1.0% |
| Scottish | 48 | 2.1% |
| Sioux | 2 | 0.1% |
| Slavic | 4 | 0.2% |
| Slovak | 21 | 0.9% |
| Subsaharan African | 1 | 0.0% |
| Swedish | 23 | 1.0% |
| Swiss | 6 | 0.3% |
| Thai | 4 | 0.2% |
| Welsh | 30 | 1.3% |
| West Indian | 9 | 0.4% |
| Yugoslavian | 7 | 0.3% | View All 44 Rows |
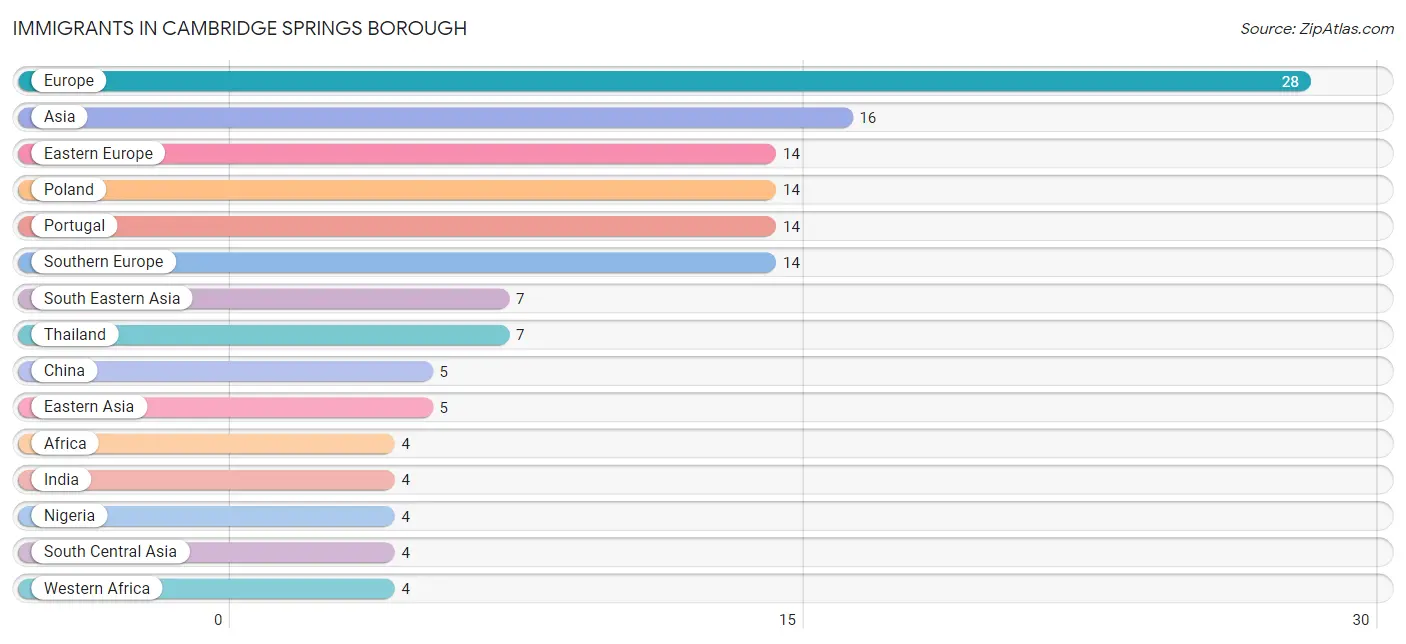
Immigrants in Cambridge Springs borough
The most numerous immigrant groups reported in Cambridge Springs borough came from Europe (28 | 1.2%), Asia (16 | 0.7%), Eastern Europe (14 | 0.6%), Poland (14 | 0.6%), and Portugal (14 | 0.6%), together accounting for 3.8% of all Cambridge Springs borough residents.
| Immigration Origin | # Population | % Population |
| Africa | 4 | 0.2% |
| Asia | 16 | 0.7% |
| China | 5 | 0.2% |
| Eastern Asia | 5 | 0.2% |
| Eastern Europe | 14 | 0.6% |
| Europe | 28 | 1.2% |
| India | 4 | 0.2% |
| Nigeria | 4 | 0.2% |
| Poland | 14 | 0.6% |
| Portugal | 14 | 0.6% |
| South Central Asia | 4 | 0.2% |
| South Eastern Asia | 7 | 0.3% |
| Southern Europe | 14 | 0.6% |
| Thailand | 7 | 0.3% |
| Western Africa | 4 | 0.2% | View All 15 Rows |
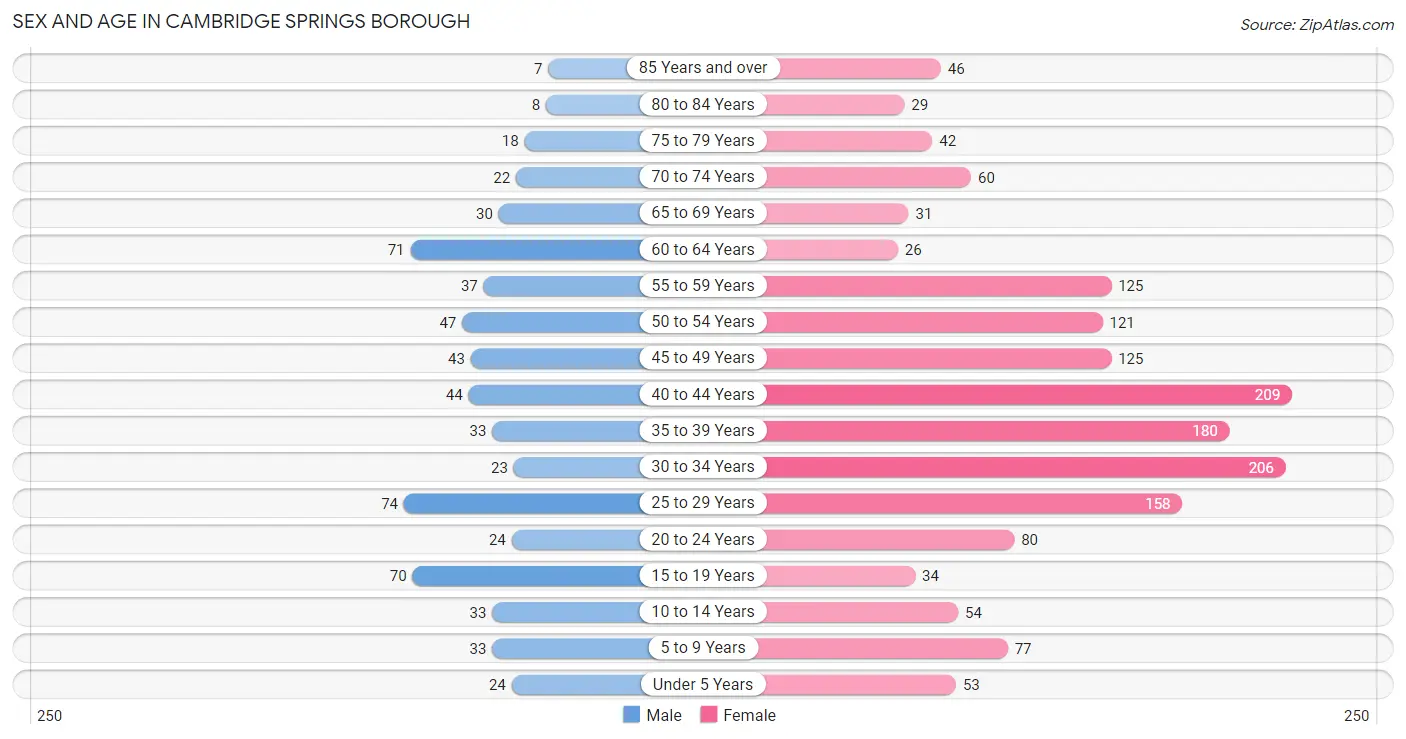
Sex and Age in Cambridge Springs borough
Sex and Age in Cambridge Springs borough
The most populous age groups in Cambridge Springs borough are 25 to 29 Years (74 | 11.5%) for men and 40 to 44 Years (209 | 12.6%) for women.
| Age Bracket | Male | Female |
| Under 5 Years | 24 (3.7%) | 53 (3.2%) |
| 5 to 9 Years | 33 (5.1%) | 77 (4.6%) |
| 10 to 14 Years | 33 (5.1%) | 54 (3.3%) |
| 15 to 19 Years | 70 (10.9%) | 34 (2.1%) |
| 20 to 24 Years | 24 (3.7%) | 80 (4.8%) |
| 25 to 29 Years | 74 (11.5%) | 158 (9.5%) |
| 30 to 34 Years | 23 (3.6%) | 206 (12.4%) |
| 35 to 39 Years | 33 (5.1%) | 180 (10.9%) |
| 40 to 44 Years | 44 (6.9%) | 209 (12.6%) |
| 45 to 49 Years | 43 (6.7%) | 125 (7.5%) |
| 50 to 54 Years | 47 (7.3%) | 121 (7.3%) |
| 55 to 59 Years | 37 (5.8%) | 125 (7.5%) |
| 60 to 64 Years | 71 (11.1%) | 26 (1.6%) |
| 65 to 69 Years | 30 (4.7%) | 31 (1.9%) |
| 70 to 74 Years | 22 (3.4%) | 60 (3.6%) |
| 75 to 79 Years | 18 (2.8%) | 42 (2.5%) |
| 80 to 84 Years | 8 (1.3%) | 29 (1.8%) |
| 85 Years and over | 7 (1.1%) | 46 (2.8%) |
| Total | 641 (100.0%) | 1,656 (100.0%) |
Families and Households in Cambridge Springs borough
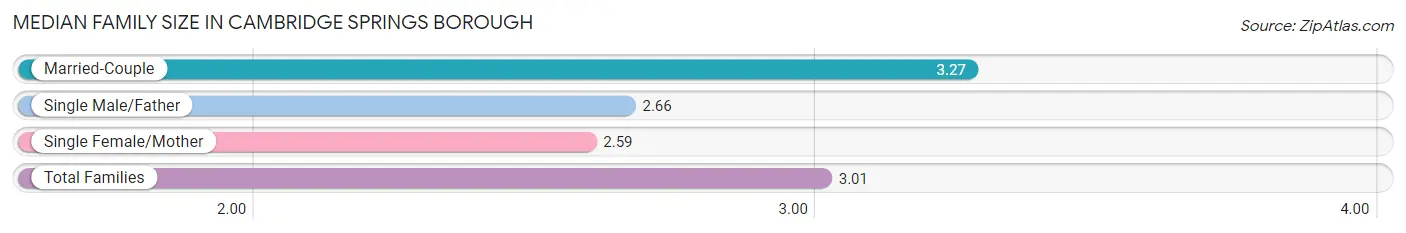
Median Family Size in Cambridge Springs borough
The median family size in Cambridge Springs borough is 3.01 persons per family, with married-couple families (195 | 59.8%) accounting for the largest median family size of 3.27 persons per family. On the other hand, single female/mother families (81 | 24.8%) represent the smallest median family size with 2.59 persons per family.
| Family Type | # Families | Family Size |
| Married-Couple | 195 (59.8%) | 3.27 |
| Single Male/Father | 50 (15.3%) | 2.66 |
| Single Female/Mother | 81 (24.8%) | 2.59 |
| Total Families | 326 (100.0%) | 3.01 |
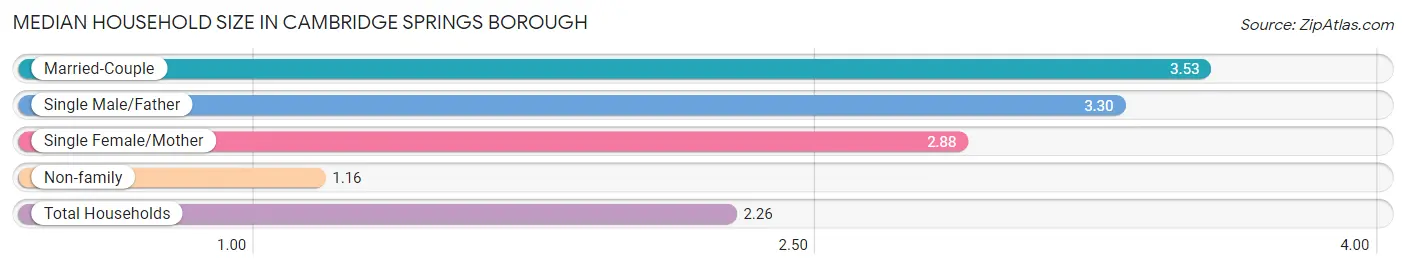
Median Household Size in Cambridge Springs borough
The median household size in Cambridge Springs borough is 2.26 persons per household, with married-couple households (195 | 30.3%) accounting for the largest median household size of 3.53 persons per household. non-family households (317 | 49.3%) represent the smallest median household size with 1.16 persons per household.
| Household Type | # Households | Household Size |
| Married-Couple | 195 (30.3%) | 3.53 |
| Single Male/Father | 50 (7.8%) | 3.30 |
| Single Female/Mother | 81 (12.6%) | 2.88 |
| Non-family | 317 (49.3%) | 1.16 |
| Total Households | 643 (100.0%) | 2.26 |
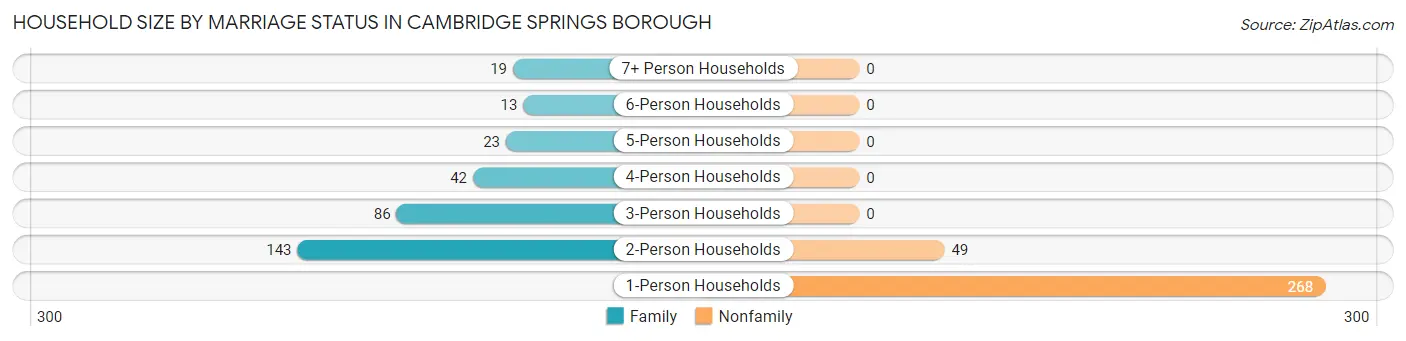
Household Size by Marriage Status in Cambridge Springs borough
Out of a total of 643 households in Cambridge Springs borough, 326 (50.7%) are family households, while 317 (49.3%) are nonfamily households. The most numerous type of family households are 2-person households, comprising 143, and the most common type of nonfamily households are 1-person households, comprising 268.
| Household Size | Family Households | Nonfamily Households |
| 1-Person Households | - | 268 (41.7%) |
| 2-Person Households | 143 (22.2%) | 49 (7.6%) |
| 3-Person Households | 86 (13.4%) | 0 (0.0%) |
| 4-Person Households | 42 (6.5%) | 0 (0.0%) |
| 5-Person Households | 23 (3.6%) | 0 (0.0%) |
| 6-Person Households | 13 (2.0%) | 0 (0.0%) |
| 7+ Person Households | 19 (2.9%) | 0 (0.0%) |
| Total | 326 (50.7%) | 317 (49.3%) |
Female Fertility in Cambridge Springs borough
Fertility by Age in Cambridge Springs borough
Average fertility rate in Cambridge Springs borough is 38.0 births per 1,000 women. Women in the age bracket of 20 to 34 years have the highest fertility rate with 41.0 births per 1,000 women. Women in the age bracket of 35 to 50 years acount for 55.0% of all women with births.

| Age Bracket | Women with Births | Births / 1,000 Women |
| 15 to 19 years | 0 (0.0%) | 0.0 |
| 20 to 34 years | 18 (45.0%) | 41.0 |
| 35 to 50 years | 22 (55.0%) | 39.0 |
| Total | 40 (100.0%) | 38.0 |
Fertility by Age by Marriage Status in Cambridge Springs borough
72.5% of women with births (40) in Cambridge Springs borough are married. The highest percentage of unmarried women with births falls into 20 to 34 years age bracket with 61.1% of them unmarried at the time of birth, while the lowest percentage of unmarried women with births belong to 35 to 50 years age bracket with 0.0% of them unmarried.
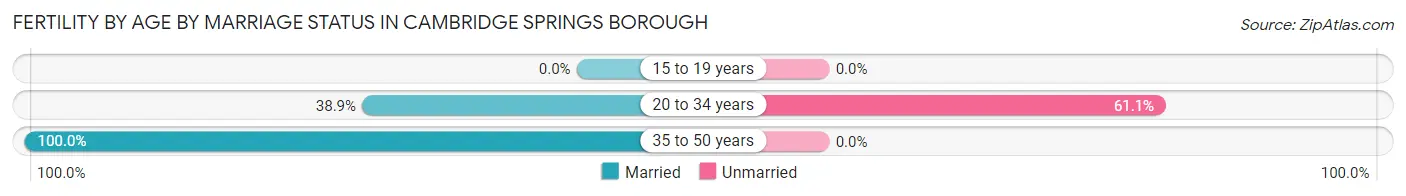
| Age Bracket | Married | Unmarried |
| 15 to 19 years | 0 (0.0%) | 0 (0.0%) |
| 20 to 34 years | 7 (38.9%) | 11 (61.1%) |
| 35 to 50 years | 22 (100.0%) | 0 (0.0%) |
| Total | 29 (72.5%) | 11 (27.5%) |
Fertility by Education in Cambridge Springs borough
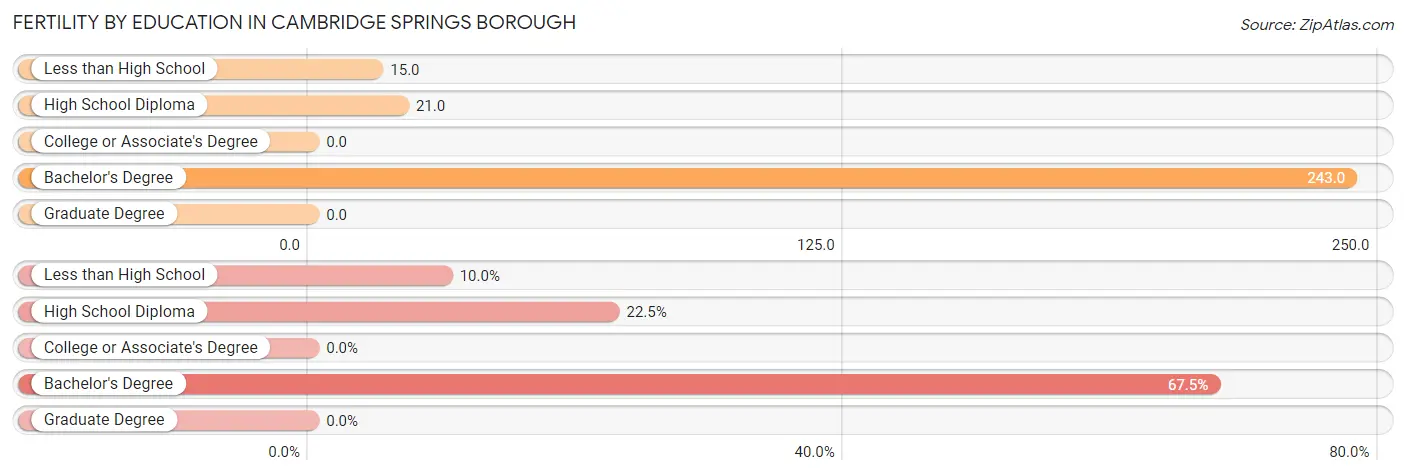
| Educational Attainment | Women with Births | Births / 1,000 Women |
| Less than High School | 4 (10.0%) | 15.0 |
| High School Diploma | 9 (22.5%) | 21.0 |
| College or Associate's Degree | 0 (0.0%) | 0.0 |
| Bachelor's Degree | 27 (67.5%) | 243.0 |
| Graduate Degree | 0 (0.0%) | 0.0 |
| Total | 40 (100.0%) | 38.0 |
Fertility by Education by Marriage Status in Cambridge Springs borough
27.5% of women with births in Cambridge Springs borough are unmarried. Women with the educational attainment of less than high school are most likely to be married with 100.0% of them married at childbirth, while women with the educational attainment of high school diploma are least likely to be married with 66.7% of them unmarried at childbirth.
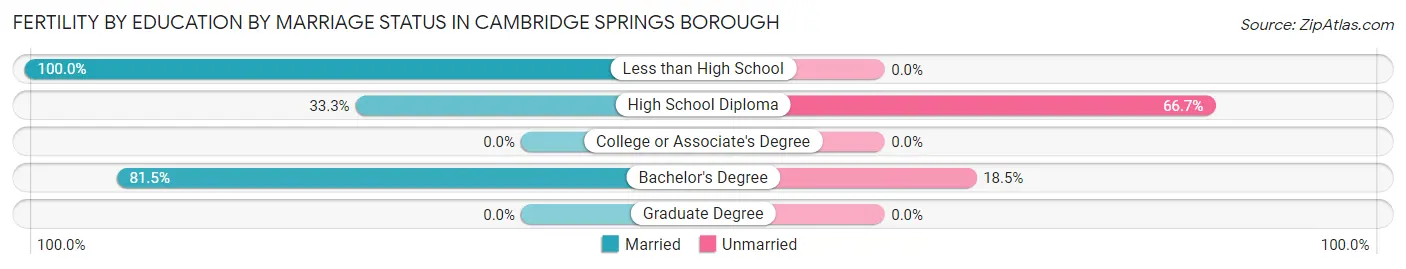
| Educational Attainment | Married | Unmarried |
| Less than High School | 4 (100.0%) | 0 (0.0%) |
| High School Diploma | 3 (33.3%) | 6 (66.7%) |
| College or Associate's Degree | 0 (0.0%) | 0 (0.0%) |
| Bachelor's Degree | 22 (81.5%) | 5 (18.5%) |
| Graduate Degree | 0 (0.0%) | 0 (0.0%) |
| Total | 29 (72.5%) | 11 (27.5%) |
Employment Characteristics in Cambridge Springs borough
Employment by Class of Employer in Cambridge Springs borough
Among the 669 employed individuals in Cambridge Springs borough, private company employees (433 | 64.7%), not-for-profit organizations (111 | 16.6%), and state government employees (72 | 10.8%) make up the most common classes of employment.
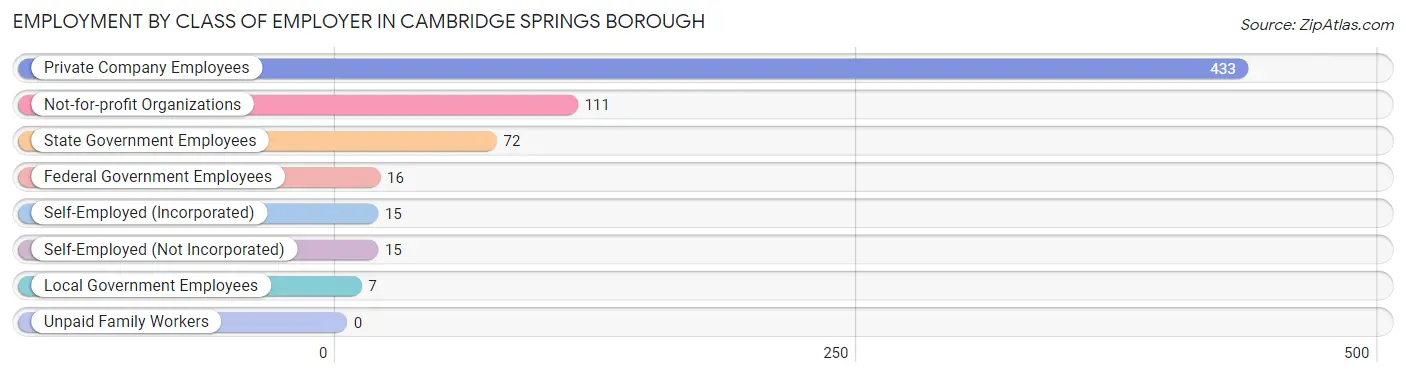
| Employer Class | # Employees | % Employees |
| Private Company Employees | 433 | 64.7% |
| Self-Employed (Incorporated) | 15 | 2.2% |
| Self-Employed (Not Incorporated) | 15 | 2.2% |
| Not-for-profit Organizations | 111 | 16.6% |
| Local Government Employees | 7 | 1.1% |
| State Government Employees | 72 | 10.8% |
| Federal Government Employees | 16 | 2.4% |
| Unpaid Family Workers | 0 | 0.0% |
| Total | 669 | 100.0% |
Employment Status by Age in Cambridge Springs borough
According to the labor force statistics for Cambridge Springs borough, out of the total population over 16 years of age (1,981), 36.3% or 719 individuals are in the labor force, with 6.3% or 45 of them unemployed. The age group with the highest labor force participation rate is 60 to 64 years, with 71.1% or 69 individuals in the labor force. Within the labor force, the 16 to 19 years age range has the highest percentage of unemployed individuals, with 17.6% or 3 of them being unemployed.
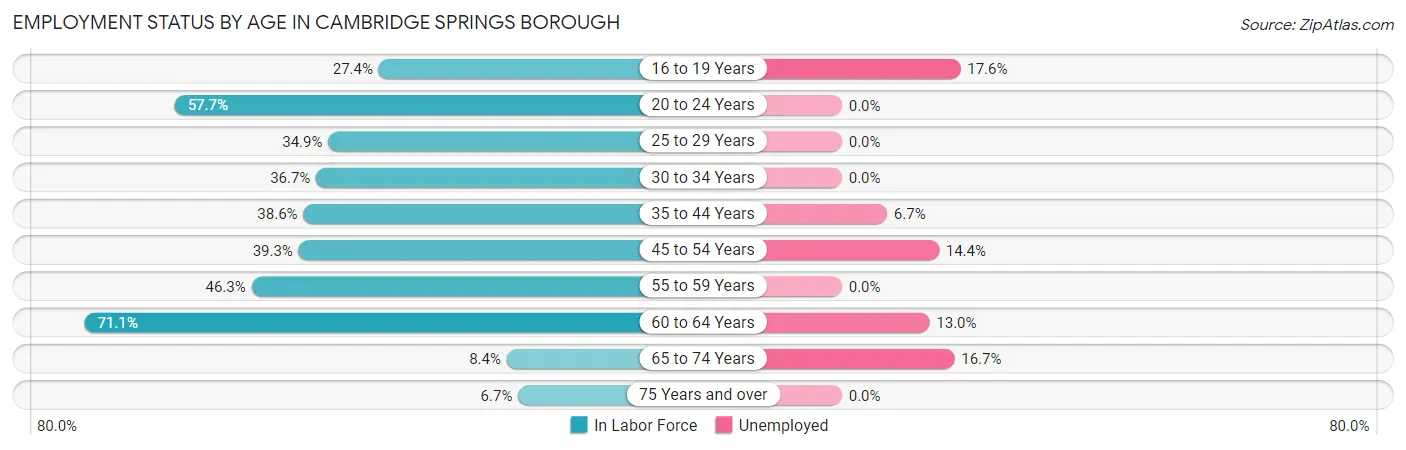
| Age Bracket | In Labor Force | Unemployed |
| 16 to 19 Years | 17 (27.4%) | 3 (17.6%) |
| 20 to 24 Years | 60 (57.7%) | 0 (0.0%) |
| 25 to 29 Years | 81 (34.9%) | 0 (0.0%) |
| 30 to 34 Years | 84 (36.7%) | 0 (0.0%) |
| 35 to 44 Years | 180 (38.6%) | 12 (6.7%) |
| 45 to 54 Years | 132 (39.3%) | 19 (14.4%) |
| 55 to 59 Years | 75 (46.3%) | 0 (0.0%) |
| 60 to 64 Years | 69 (71.1%) | 9 (13.0%) |
| 65 to 74 Years | 12 (8.4%) | 2 (16.7%) |
| 75 Years and over | 10 (6.7%) | 0 (0.0%) |
| Total | 719 (36.3%) | 45 (6.3%) |
Employment Status by Educational Attainment in Cambridge Springs borough
According to labor force statistics for Cambridge Springs borough, 40.8% of individuals (621) out of the total population between 25 and 64 years of age (1,522) are in the labor force, with 6.5% or 40 of them being unemployed. The group with the highest labor force participation rate are those with the educational attainment of bachelor's degree or higher, with 78.5% or 230 individuals in the labor force. Within the labor force, individuals with high school diploma education have the highest percentage of unemployment, with 11.1% or 26 of them being unemployed.
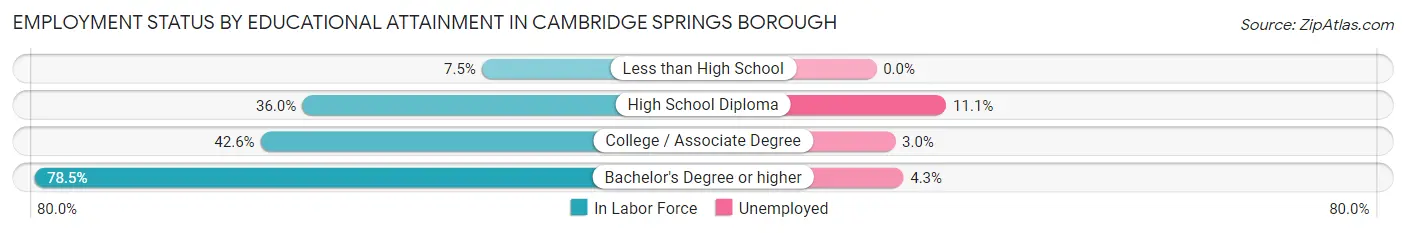
| Educational Attainment | In Labor Force | Unemployed |
| Less than High School | 19 (7.5%) | 0 (0.0%) |
| High School Diploma | 234 (36.0%) | 72 (11.1%) |
| College / Associate Degree | 138 (42.6%) | 10 (3.0%) |
| Bachelor's Degree or higher | 230 (78.5%) | 13 (4.3%) |
| Total | 621 (40.8%) | 99 (6.5%) |
Employment Occupations by Sex in Cambridge Springs borough
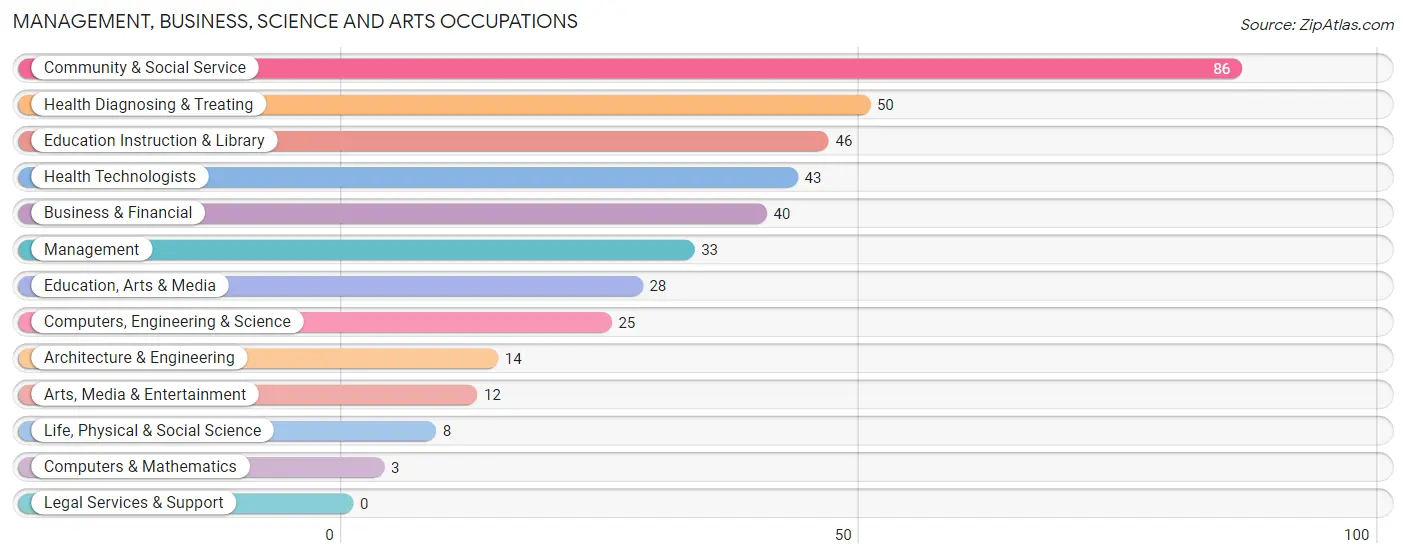
Management, Business, Science and Arts Occupations
The most common Management, Business, Science and Arts occupations in Cambridge Springs borough are Community & Social Service (86 | 12.8%), Health Diagnosing & Treating (50 | 7.4%), Education Instruction & Library (46 | 6.9%), Health Technologists (43 | 6.4%), and Business & Financial (40 | 5.9%).
Management, Business, Science and Arts Occupations by Sex
Within the Management, Business, Science and Arts occupations in Cambridge Springs borough, the most male-oriented occupations are Computers & Mathematics (100.0%), Architecture & Engineering (100.0%), and Computers, Engineering & Science (96.0%), while the most female-oriented occupations are Education Instruction & Library (89.1%), Health Diagnosing & Treating (88.0%), and Health Technologists (86.1%).
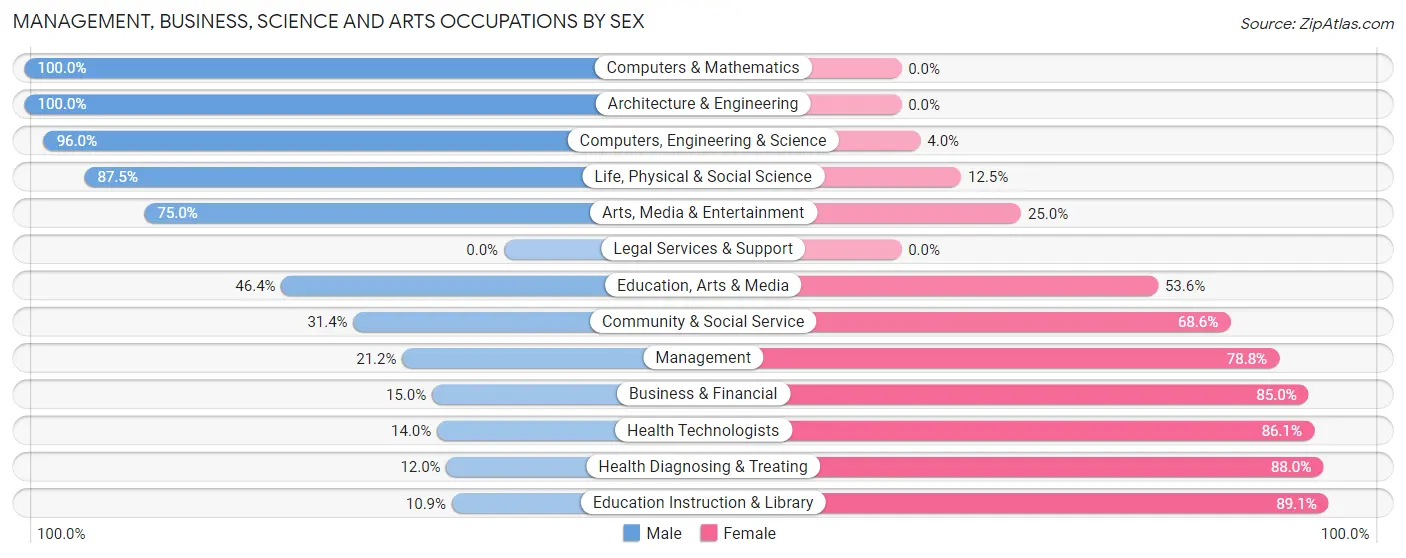
| Occupation | Male | Female |
| Management | 7 (21.2%) | 26 (78.8%) |
| Business & Financial | 6 (15.0%) | 34 (85.0%) |
| Computers, Engineering & Science | 24 (96.0%) | 1 (4.0%) |
| Computers & Mathematics | 3 (100.0%) | 0 (0.0%) |
| Architecture & Engineering | 14 (100.0%) | 0 (0.0%) |
| Life, Physical & Social Science | 7 (87.5%) | 1 (12.5%) |
| Community & Social Service | 27 (31.4%) | 59 (68.6%) |
| Education, Arts & Media | 13 (46.4%) | 15 (53.6%) |
| Legal Services & Support | 0 (0.0%) | 0 (0.0%) |
| Education Instruction & Library | 5 (10.9%) | 41 (89.1%) |
| Arts, Media & Entertainment | 9 (75.0%) | 3 (25.0%) |
| Health Diagnosing & Treating | 6 (12.0%) | 44 (88.0%) |
| Health Technologists | 6 (14.0%) | 37 (86.1%) |
| Total (Category) | 70 (29.9%) | 164 (70.1%) |
| Total (Overall) | 312 (46.4%) | 360 (53.6%) |
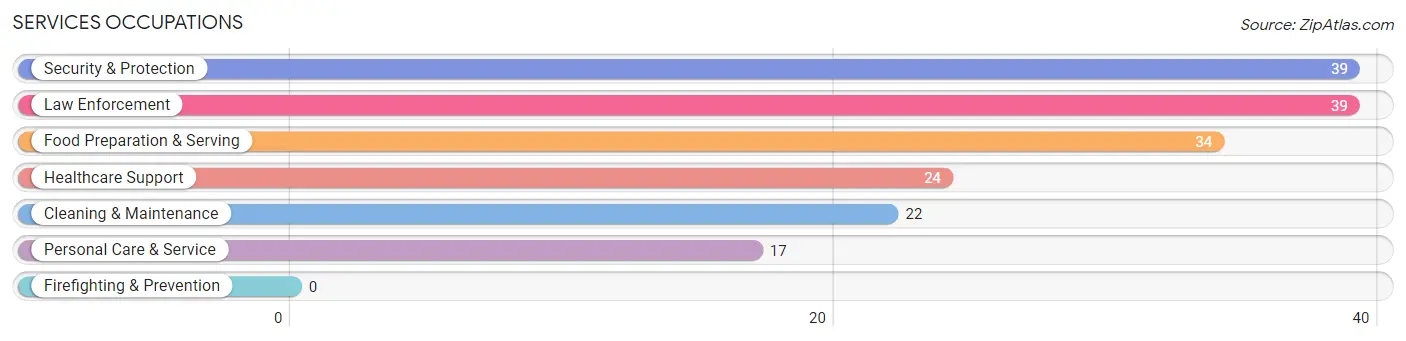
Services Occupations
The most common Services occupations in Cambridge Springs borough are Security & Protection (39 | 5.8%), Law Enforcement (39 | 5.8%), Food Preparation & Serving (34 | 5.1%), Healthcare Support (24 | 3.6%), and Cleaning & Maintenance (22 | 3.3%).
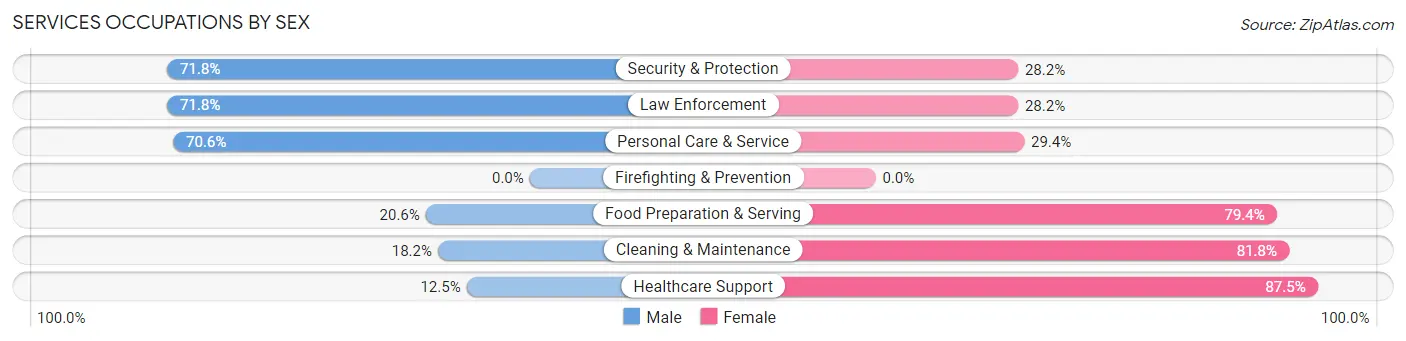
Services Occupations by Sex
Within the Services occupations in Cambridge Springs borough, the most male-oriented occupations are Security & Protection (71.8%), Law Enforcement (71.8%), and Personal Care & Service (70.6%), while the most female-oriented occupations are Healthcare Support (87.5%), Cleaning & Maintenance (81.8%), and Food Preparation & Serving (79.4%).
| Occupation | Male | Female |
| Healthcare Support | 3 (12.5%) | 21 (87.5%) |
| Security & Protection | 28 (71.8%) | 11 (28.2%) |
| Firefighting & Prevention | 0 (0.0%) | 0 (0.0%) |
| Law Enforcement | 28 (71.8%) | 11 (28.2%) |
| Food Preparation & Serving | 7 (20.6%) | 27 (79.4%) |
| Cleaning & Maintenance | 4 (18.2%) | 18 (81.8%) |
| Personal Care & Service | 12 (70.6%) | 5 (29.4%) |
| Total (Category) | 54 (39.7%) | 82 (60.3%) |
| Total (Overall) | 312 (46.4%) | 360 (53.6%) |
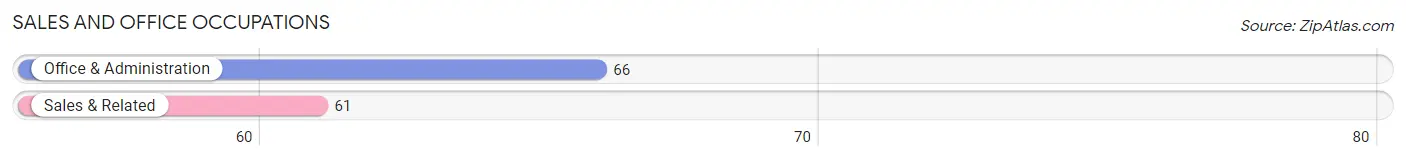
Sales and Office Occupations
The most common Sales and Office occupations in Cambridge Springs borough are Office & Administration (66 | 9.8%), and Sales & Related (61 | 9.1%).
Sales and Office Occupations by Sex
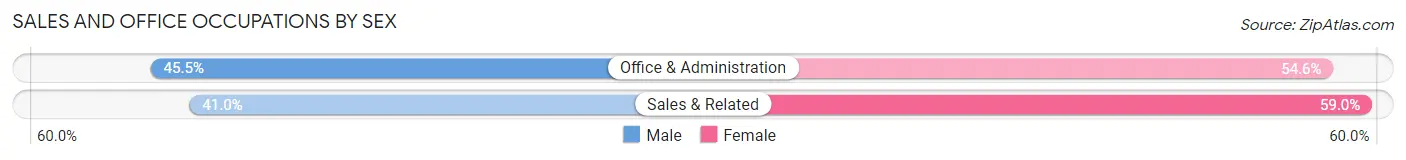
| Occupation | Male | Female |
| Sales & Related | 25 (41.0%) | 36 (59.0%) |
| Office & Administration | 30 (45.5%) | 36 (54.5%) |
| Total (Category) | 55 (43.3%) | 72 (56.7%) |
| Total (Overall) | 312 (46.4%) | 360 (53.6%) |
Natural Resources, Construction and Maintenance Occupations
The most common Natural Resources, Construction and Maintenance occupations in Cambridge Springs borough are Construction & Extraction (38 | 5.7%), and Installation, Maintenance & Repair (15 | 2.2%).
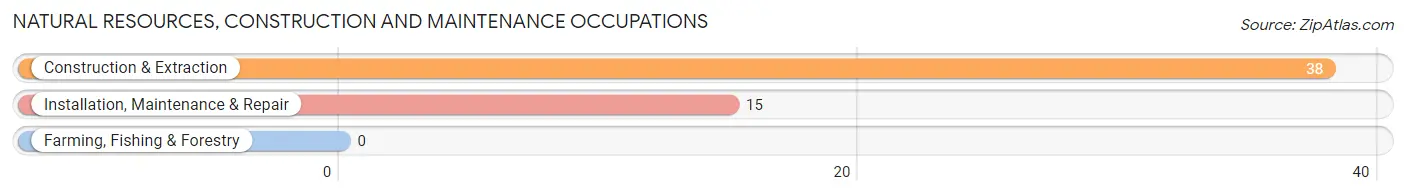
Natural Resources, Construction and Maintenance Occupations by Sex
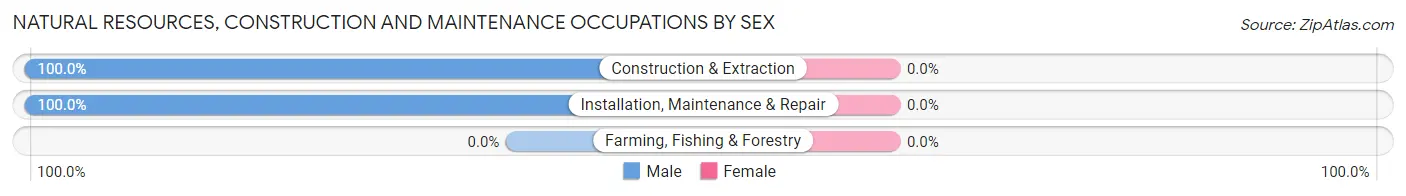
| Occupation | Male | Female |
| Farming, Fishing & Forestry | 0 (0.0%) | 0 (0.0%) |
| Construction & Extraction | 38 (100.0%) | 0 (0.0%) |
| Installation, Maintenance & Repair | 15 (100.0%) | 0 (0.0%) |
| Total (Category) | 53 (100.0%) | 0 (0.0%) |
| Total (Overall) | 312 (46.4%) | 360 (53.6%) |
Production, Transportation and Moving Occupations
The most common Production, Transportation and Moving occupations in Cambridge Springs borough are Production (75 | 11.2%), Material Moving (32 | 4.8%), and Transportation (15 | 2.2%).
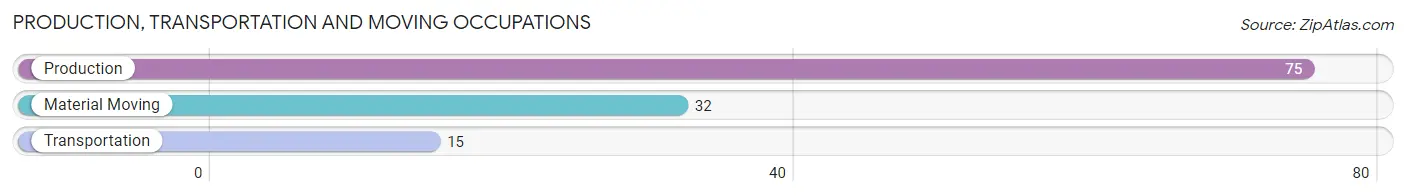
Production, Transportation and Moving Occupations by Sex
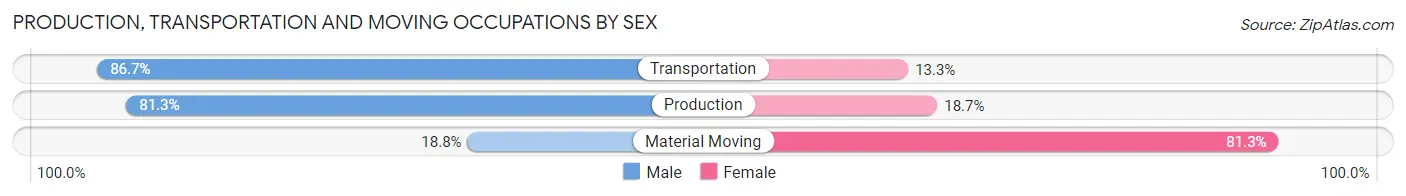
| Occupation | Male | Female |
| Production | 61 (81.3%) | 14 (18.7%) |
| Transportation | 13 (86.7%) | 2 (13.3%) |
| Material Moving | 6 (18.8%) | 26 (81.2%) |
| Total (Category) | 80 (65.6%) | 42 (34.4%) |
| Total (Overall) | 312 (46.4%) | 360 (53.6%) |
Employment Industries by Sex in Cambridge Springs borough
Employment Industries in Cambridge Springs borough
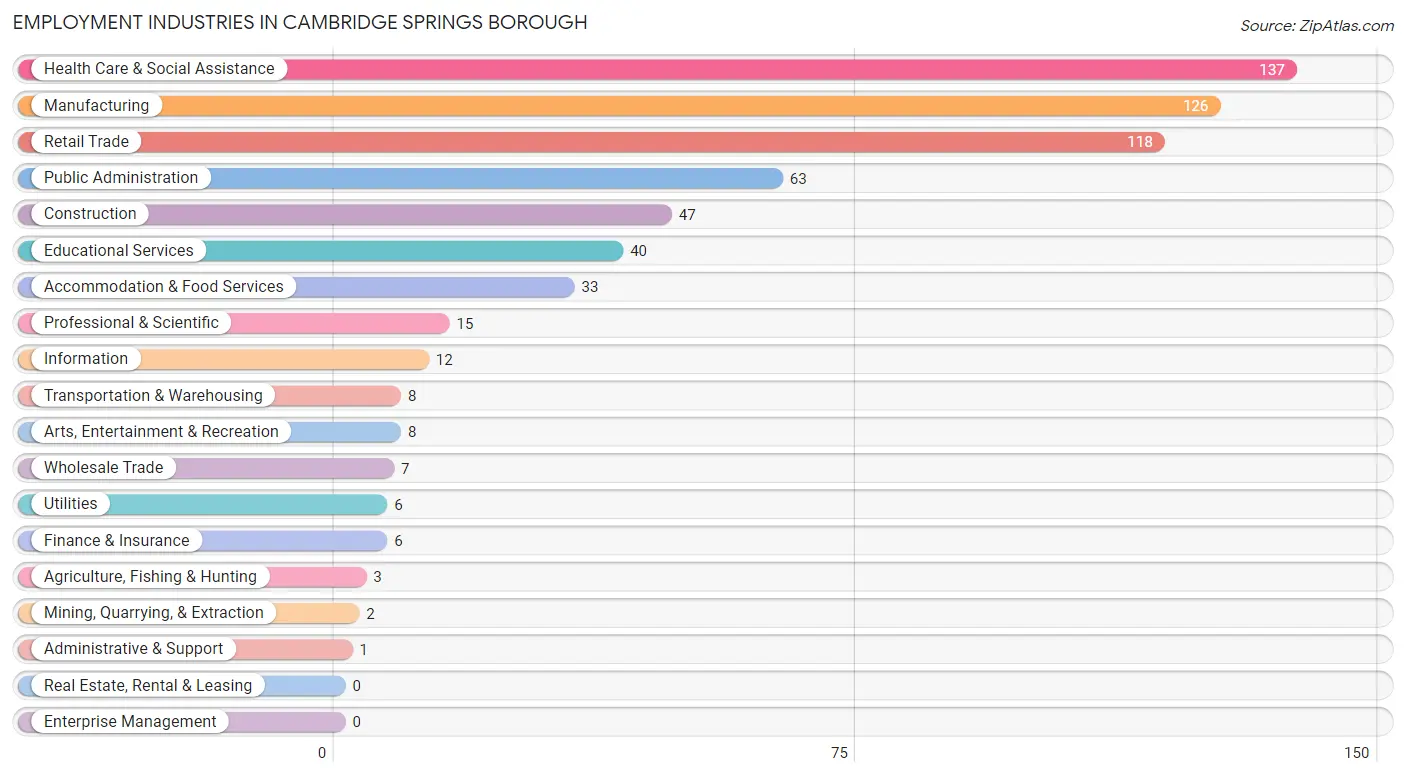
The major employment industries in Cambridge Springs borough include Health Care & Social Assistance (137 | 20.4%), Manufacturing (126 | 18.8%), Retail Trade (118 | 17.6%), Public Administration (63 | 9.4%), and Construction (47 | 7.0%).
Employment Industries by Sex in Cambridge Springs borough
The Cambridge Springs borough industries that see more men than women are Agriculture, Fishing & Hunting (100.0%), Mining, Quarrying, & Extraction (100.0%), and Utilities (100.0%), whereas the industries that tend to have a higher number of women are Wholesale Trade (100.0%), Health Care & Social Assistance (89.0%), and Arts, Entertainment & Recreation (87.5%).
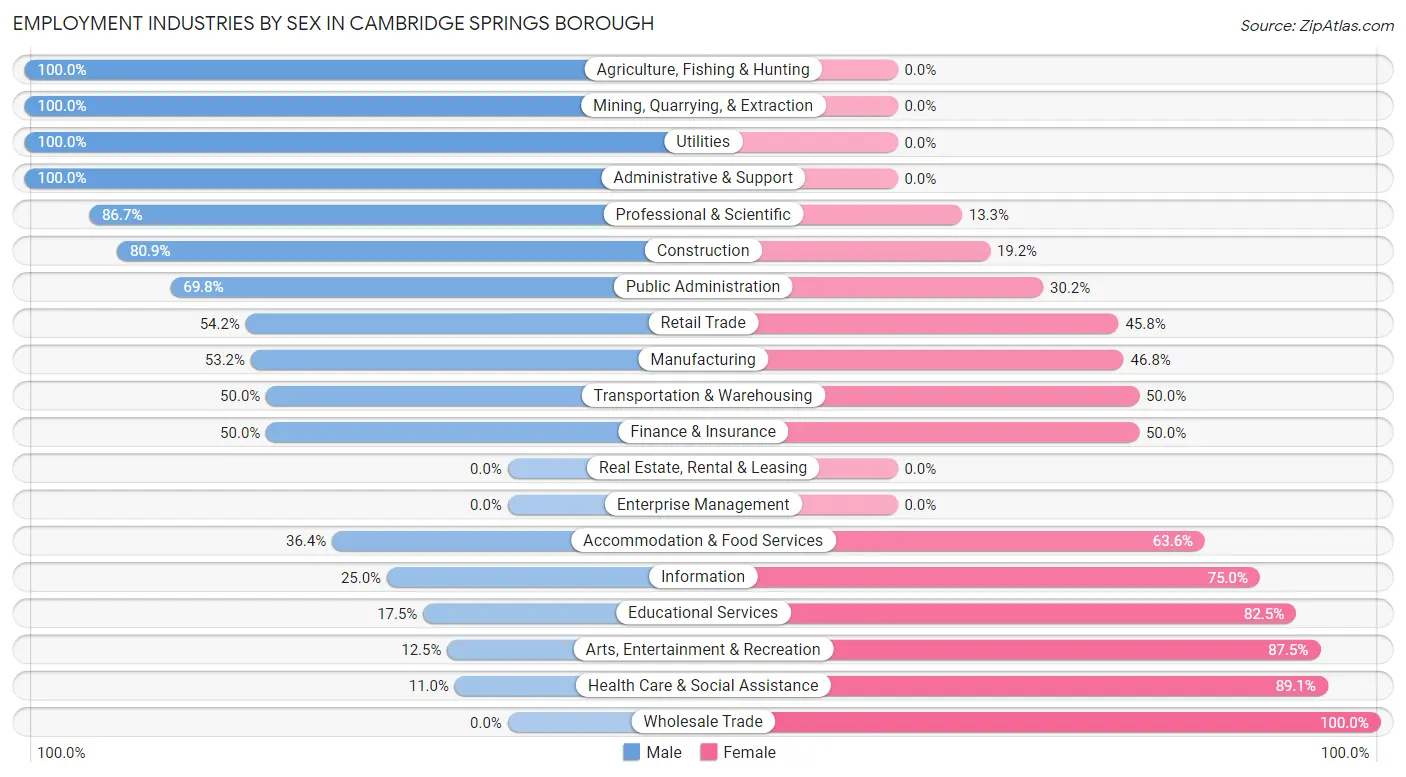
| Industry | Male | Female |
| Agriculture, Fishing & Hunting | 3 (100.0%) | 0 (0.0%) |
| Mining, Quarrying, & Extraction | 2 (100.0%) | 0 (0.0%) |
| Construction | 38 (80.8%) | 9 (19.2%) |
| Manufacturing | 67 (53.2%) | 59 (46.8%) |
| Wholesale Trade | 0 (0.0%) | 7 (100.0%) |
| Retail Trade | 64 (54.2%) | 54 (45.8%) |
| Transportation & Warehousing | 4 (50.0%) | 4 (50.0%) |
| Utilities | 6 (100.0%) | 0 (0.0%) |
| Information | 3 (25.0%) | 9 (75.0%) |
| Finance & Insurance | 3 (50.0%) | 3 (50.0%) |
| Real Estate, Rental & Leasing | 0 (0.0%) | 0 (0.0%) |
| Professional & Scientific | 13 (86.7%) | 2 (13.3%) |
| Enterprise Management | 0 (0.0%) | 0 (0.0%) |
| Administrative & Support | 1 (100.0%) | 0 (0.0%) |
| Educational Services | 7 (17.5%) | 33 (82.5%) |
| Health Care & Social Assistance | 15 (11.0%) | 122 (89.0%) |
| Arts, Entertainment & Recreation | 1 (12.5%) | 7 (87.5%) |
| Accommodation & Food Services | 12 (36.4%) | 21 (63.6%) |
| Public Administration | 44 (69.8%) | 19 (30.2%) |
| Total | 312 (46.4%) | 360 (53.6%) |
Education in Cambridge Springs borough
School Enrollment in Cambridge Springs borough
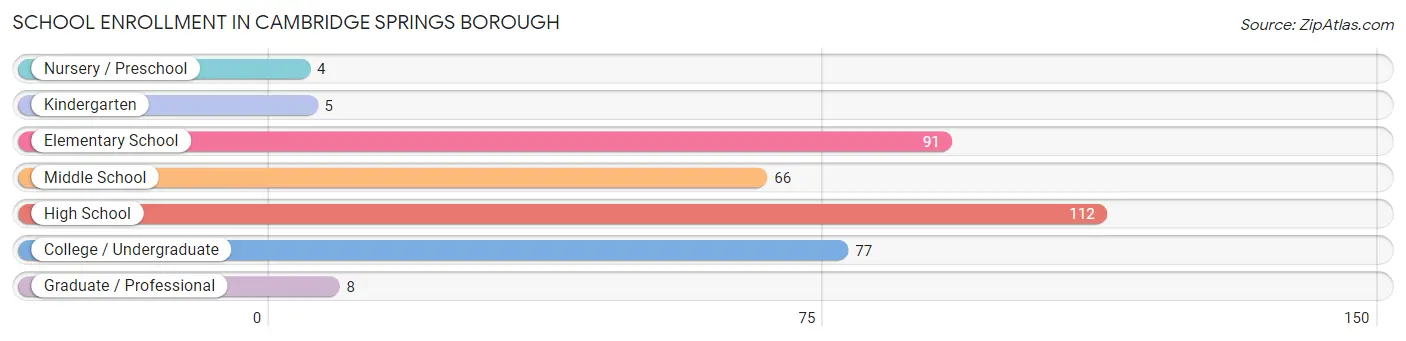
The most common levels of schooling among the 363 students in Cambridge Springs borough are high school (112 | 30.8%), elementary school (91 | 25.1%), and college / undergraduate (77 | 21.2%).
| School Level | # Students | % Students |
| Nursery / Preschool | 4 | 1.1% |
| Kindergarten | 5 | 1.4% |
| Elementary School | 91 | 25.1% |
| Middle School | 66 | 18.2% |
| High School | 112 | 30.8% |
| College / Undergraduate | 77 | 21.2% |
| Graduate / Professional | 8 | 2.2% |
| Total | 363 | 100.0% |
School Enrollment by Age by Funding Source in Cambridge Springs borough
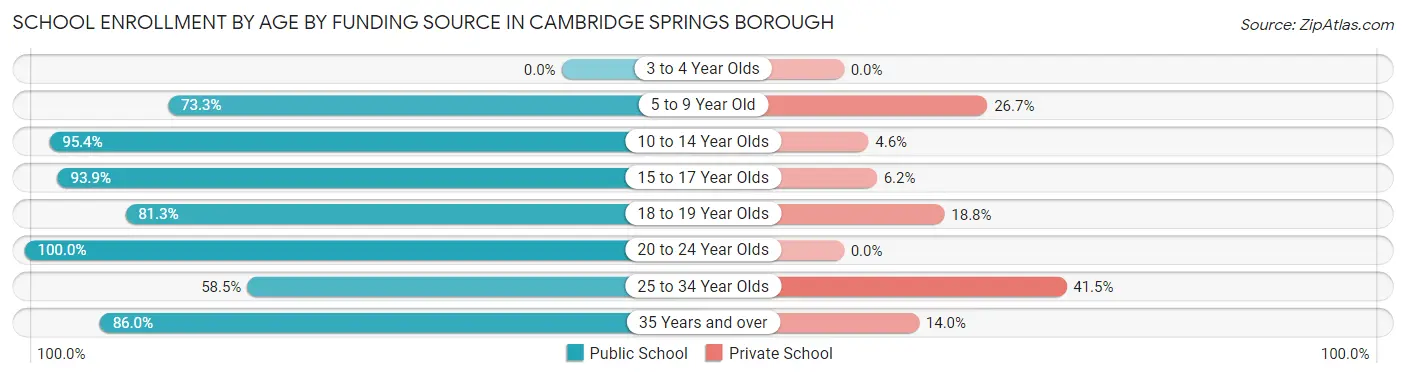
Out of a total of 363 students who are enrolled in schools in Cambridge Springs borough, 58 (16.0%) attend a private institution, while the remaining 305 (84.0%) are enrolled in public schools. The age group of 25 to 34 year olds has the highest likelihood of being enrolled in private schools, with 17 (41.5% in the age bracket) enrolled. Conversely, the age group of 20 to 24 year olds has the lowest likelihood of being enrolled in a private school, with 18 (100.0% in the age bracket) attending a public institution.
| Age Bracket | Public School | Private School |
| 3 to 4 Year Olds | 0 (0.0%) | 0 (0.0%) |
| 5 to 9 Year Old | 63 (73.3%) | 23 (26.7%) |
| 10 to 14 Year Olds | 83 (95.4%) | 4 (4.6%) |
| 15 to 17 Year Olds | 61 (93.9%) | 4 (6.1%) |
| 18 to 19 Year Olds | 13 (81.2%) | 3 (18.8%) |
| 20 to 24 Year Olds | 18 (100.0%) | 0 (0.0%) |
| 25 to 34 Year Olds | 24 (58.5%) | 17 (41.5%) |
| 35 Years and over | 43 (86.0%) | 7 (14.0%) |
| Total | 305 (84.0%) | 58 (16.0%) |
Educational Attainment by Field of Study in Cambridge Springs borough
Education (94 | 26.4%), science & technology (49 | 13.8%), bio, nature & agricultural (45 | 12.6%), psychology (28 | 7.9%), and visual & performing arts (28 | 7.9%) are the most common fields of study among 356 individuals in Cambridge Springs borough who have obtained a bachelor's degree or higher.
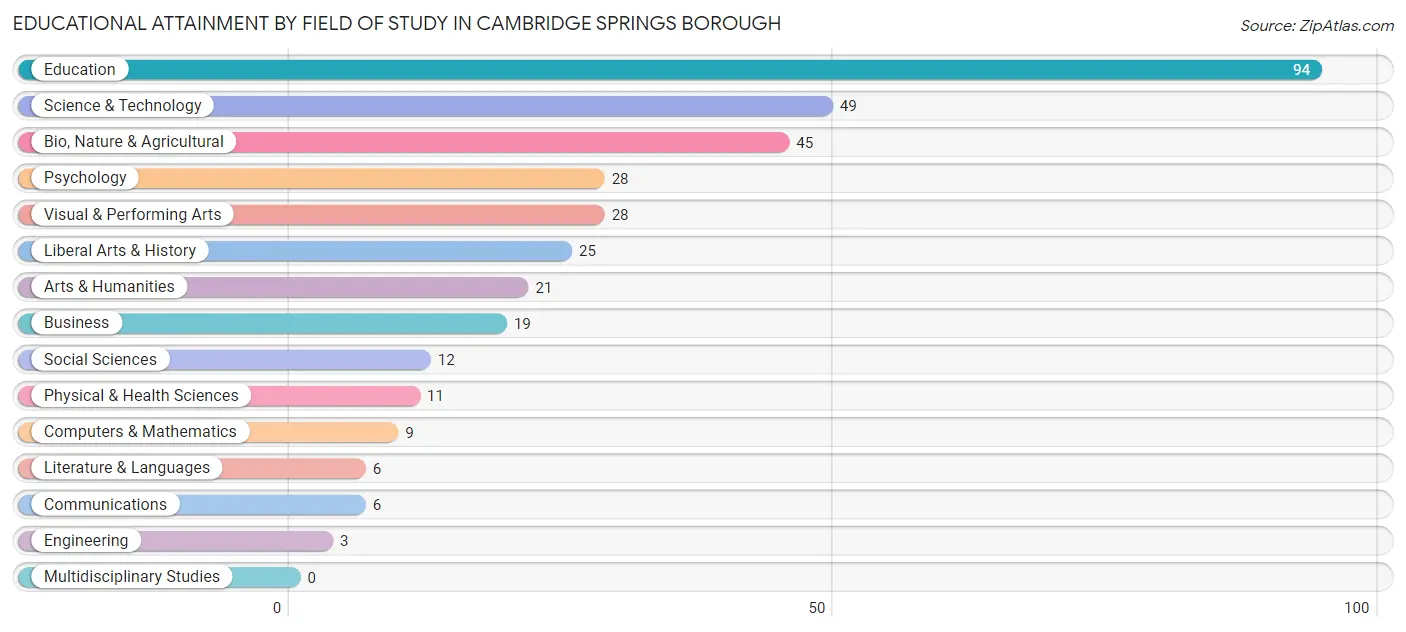
| Field of Study | # Graduates | % Graduates |
| Computers & Mathematics | 9 | 2.5% |
| Bio, Nature & Agricultural | 45 | 12.6% |
| Physical & Health Sciences | 11 | 3.1% |
| Psychology | 28 | 7.9% |
| Social Sciences | 12 | 3.4% |
| Engineering | 3 | 0.8% |
| Multidisciplinary Studies | 0 | 0.0% |
| Science & Technology | 49 | 13.8% |
| Business | 19 | 5.3% |
| Education | 94 | 26.4% |
| Literature & Languages | 6 | 1.7% |
| Liberal Arts & History | 25 | 7.0% |
| Visual & Performing Arts | 28 | 7.9% |
| Communications | 6 | 1.7% |
| Arts & Humanities | 21 | 5.9% |
| Total | 356 | 100.0% |
Transportation & Commute in Cambridge Springs borough
Vehicle Availability by Sex in Cambridge Springs borough
The most prevalent vehicle ownership categories in Cambridge Springs borough are males with 2 vehicles (193, accounting for 62.1%) and females with 2 vehicles (182, making up 53.9%).
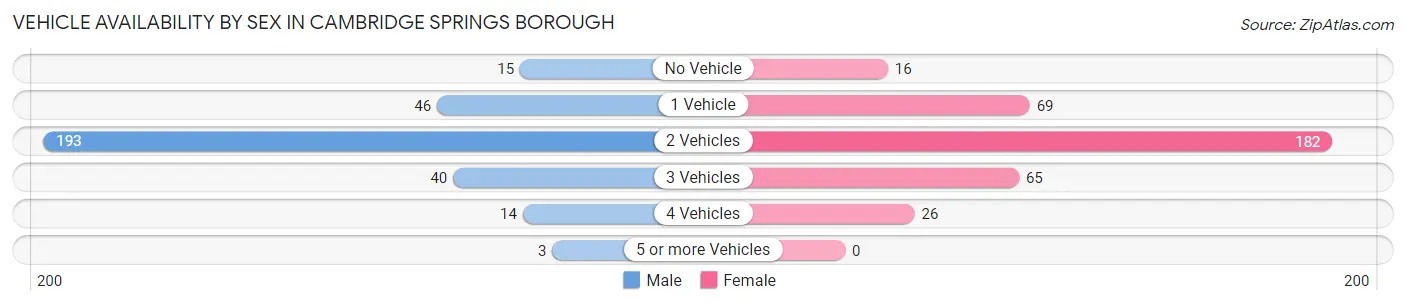
| Vehicles Available | Male | Female |
| No Vehicle | 15 (4.8%) | 16 (4.5%) |
| 1 Vehicle | 46 (14.8%) | 69 (19.3%) |
| 2 Vehicles | 193 (62.1%) | 182 (50.8%) |
| 3 Vehicles | 40 (12.9%) | 65 (18.2%) |
| 4 Vehicles | 14 (4.5%) | 26 (7.3%) |
| 5 or more Vehicles | 3 (1.0%) | 0 (0.0%) |
| Total | 311 (100.0%) | 358 (100.0%) |
Commute Time in Cambridge Springs borough
The most frequently occuring commute durations in Cambridge Springs borough are 15 to 19 minutes (105 commuters, 16.5%), 30 to 34 minutes (96 commuters, 15.1%), and 20 to 24 minutes (87 commuters, 13.7%).
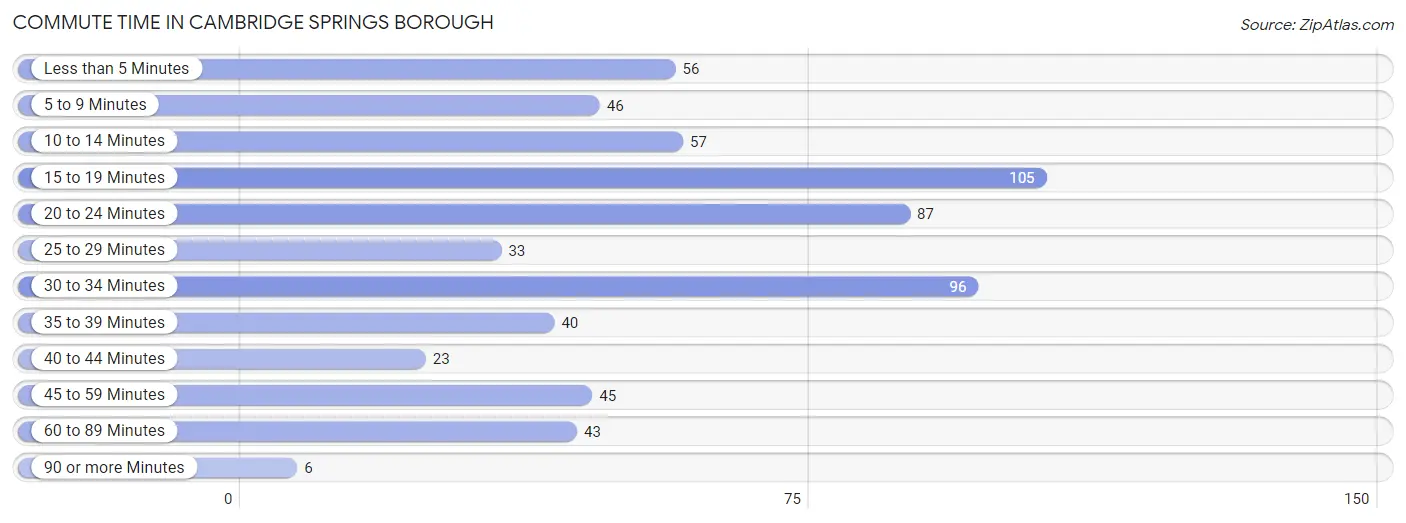
| Commute Time | # Commuters | % Commuters |
| Less than 5 Minutes | 56 | 8.8% |
| 5 to 9 Minutes | 46 | 7.2% |
| 10 to 14 Minutes | 57 | 8.9% |
| 15 to 19 Minutes | 105 | 16.5% |
| 20 to 24 Minutes | 87 | 13.7% |
| 25 to 29 Minutes | 33 | 5.2% |
| 30 to 34 Minutes | 96 | 15.1% |
| 35 to 39 Minutes | 40 | 6.3% |
| 40 to 44 Minutes | 23 | 3.6% |
| 45 to 59 Minutes | 45 | 7.1% |
| 60 to 89 Minutes | 43 | 6.8% |
| 90 or more Minutes | 6 | 0.9% |
Commute Time by Sex in Cambridge Springs borough
The most common commute times in Cambridge Springs borough are 30 to 34 minutes (62 commuters, 21.4%) for males and 15 to 19 minutes (61 commuters, 17.6%) for females.
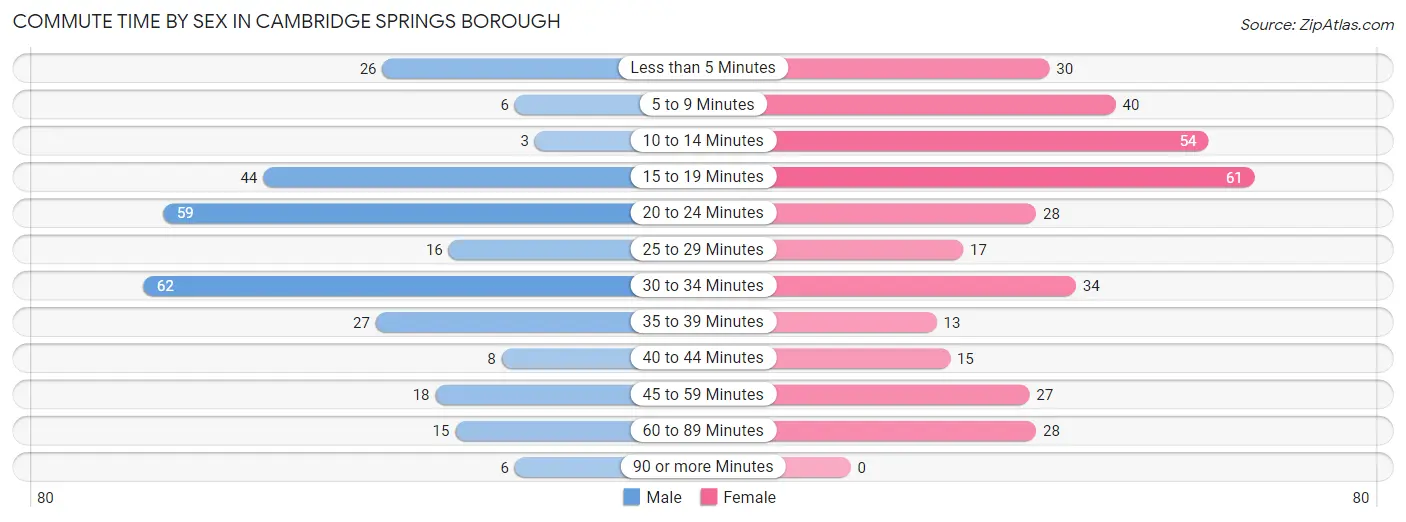
| Commute Time | Male | Female |
| Less than 5 Minutes | 26 (9.0%) | 30 (8.6%) |
| 5 to 9 Minutes | 6 (2.1%) | 40 (11.5%) |
| 10 to 14 Minutes | 3 (1.0%) | 54 (15.6%) |
| 15 to 19 Minutes | 44 (15.2%) | 61 (17.6%) |
| 20 to 24 Minutes | 59 (20.3%) | 28 (8.1%) |
| 25 to 29 Minutes | 16 (5.5%) | 17 (4.9%) |
| 30 to 34 Minutes | 62 (21.4%) | 34 (9.8%) |
| 35 to 39 Minutes | 27 (9.3%) | 13 (3.7%) |
| 40 to 44 Minutes | 8 (2.8%) | 15 (4.3%) |
| 45 to 59 Minutes | 18 (6.2%) | 27 (7.8%) |
| 60 to 89 Minutes | 15 (5.2%) | 28 (8.1%) |
| 90 or more Minutes | 6 (2.1%) | 0 (0.0%) |
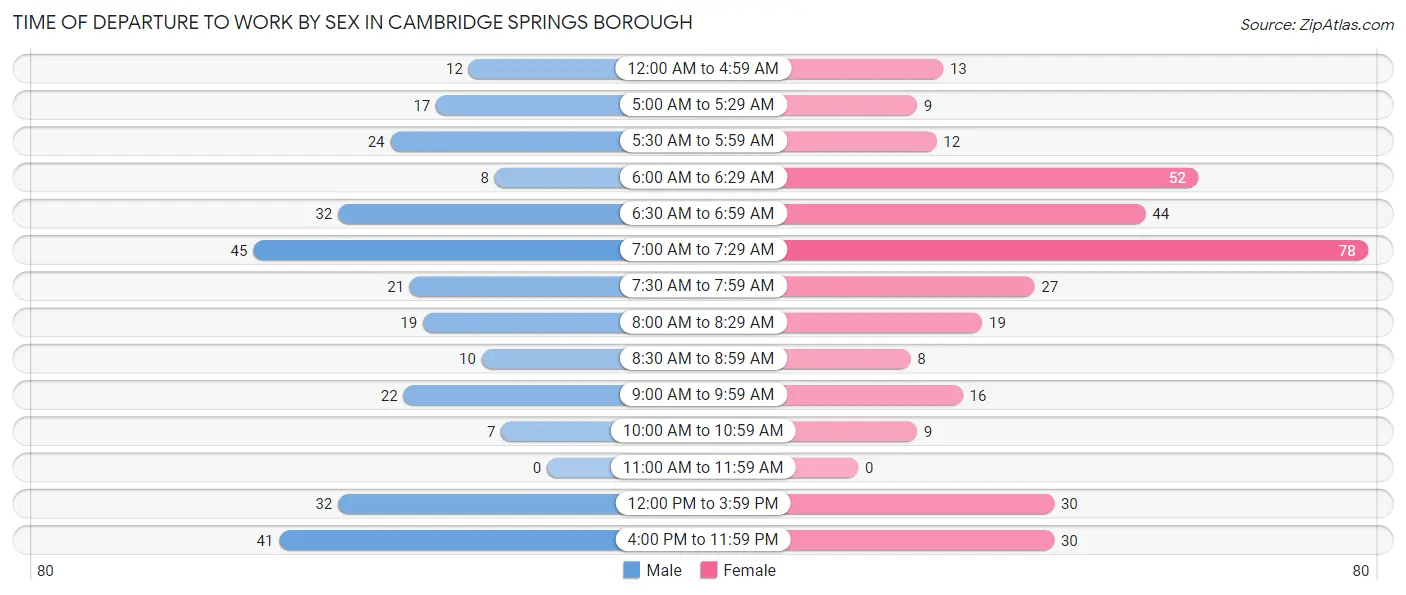
Time of Departure to Work by Sex in Cambridge Springs borough
The most frequent times of departure to work in Cambridge Springs borough are 7:00 AM to 7:29 AM (45, 15.5%) for males and 7:00 AM to 7:29 AM (78, 22.5%) for females.
| Time of Departure | Male | Female |
| 12:00 AM to 4:59 AM | 12 (4.1%) | 13 (3.7%) |
| 5:00 AM to 5:29 AM | 17 (5.9%) | 9 (2.6%) |
| 5:30 AM to 5:59 AM | 24 (8.3%) | 12 (3.5%) |
| 6:00 AM to 6:29 AM | 8 (2.8%) | 52 (15.0%) |
| 6:30 AM to 6:59 AM | 32 (11.0%) | 44 (12.7%) |
| 7:00 AM to 7:29 AM | 45 (15.5%) | 78 (22.5%) |
| 7:30 AM to 7:59 AM | 21 (7.2%) | 27 (7.8%) |
| 8:00 AM to 8:29 AM | 19 (6.6%) | 19 (5.5%) |
| 8:30 AM to 8:59 AM | 10 (3.5%) | 8 (2.3%) |
| 9:00 AM to 9:59 AM | 22 (7.6%) | 16 (4.6%) |
| 10:00 AM to 10:59 AM | 7 (2.4%) | 9 (2.6%) |
| 11:00 AM to 11:59 AM | 0 (0.0%) | 0 (0.0%) |
| 12:00 PM to 3:59 PM | 32 (11.0%) | 30 (8.6%) |
| 4:00 PM to 11:59 PM | 41 (14.1%) | 30 (8.6%) |
| Total | 290 (100.0%) | 347 (100.0%) |
Housing Occupancy in Cambridge Springs borough
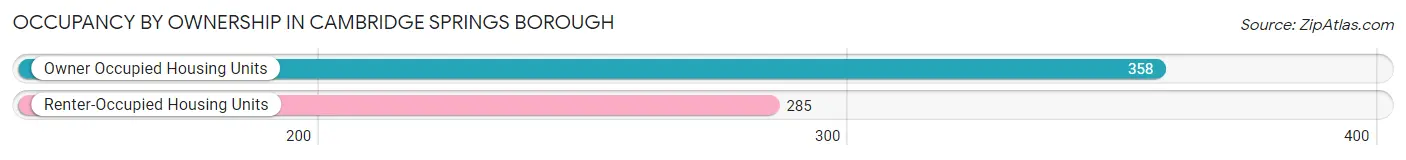
Occupancy by Ownership in Cambridge Springs borough
Of the total 643 dwellings in Cambridge Springs borough, owner-occupied units account for 358 (55.7%), while renter-occupied units make up 285 (44.3%).
| Occupancy | # Housing Units | % Housing Units |
| Owner Occupied Housing Units | 358 | 55.7% |
| Renter-Occupied Housing Units | 285 | 44.3% |
| Total Occupied Housing Units | 643 | 100.0% |
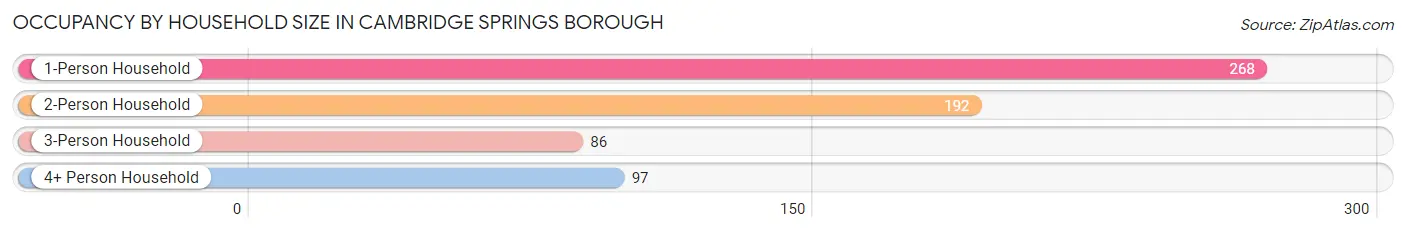
Occupancy by Household Size in Cambridge Springs borough
| Household Size | # Housing Units | % Housing Units |
| 1-Person Household | 268 | 41.7% |
| 2-Person Household | 192 | 29.9% |
| 3-Person Household | 86 | 13.4% |
| 4+ Person Household | 97 | 15.1% |
| Total Housing Units | 643 | 100.0% |
Occupancy by Ownership by Household Size in Cambridge Springs borough
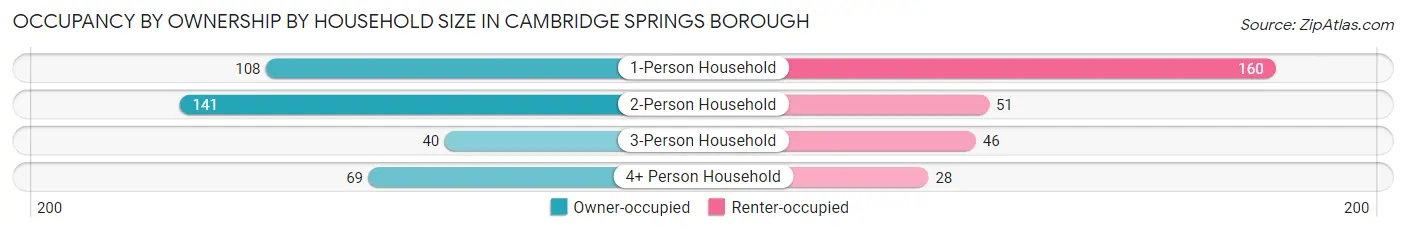
| Household Size | Owner-occupied | Renter-occupied |
| 1-Person Household | 108 (40.3%) | 160 (59.7%) |
| 2-Person Household | 141 (73.4%) | 51 (26.6%) |
| 3-Person Household | 40 (46.5%) | 46 (53.5%) |
| 4+ Person Household | 69 (71.1%) | 28 (28.9%) |
| Total Housing Units | 358 (55.7%) | 285 (44.3%) |
Occupancy by Educational Attainment in Cambridge Springs borough
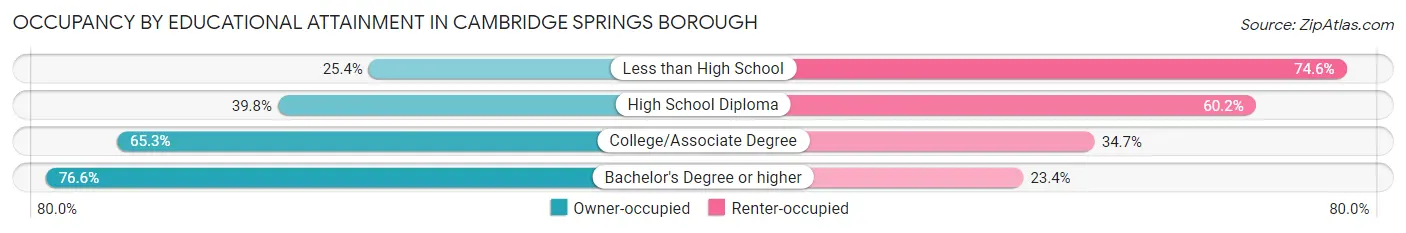
| Household Size | Owner-occupied | Renter-occupied |
| Less than High School | 15 (25.4%) | 44 (74.6%) |
| High School Diploma | 98 (39.8%) | 148 (60.2%) |
| College/Associate Degree | 81 (65.3%) | 43 (34.7%) |
| Bachelor's Degree or higher | 164 (76.6%) | 50 (23.4%) |
Occupancy by Age of Householder in Cambridge Springs borough
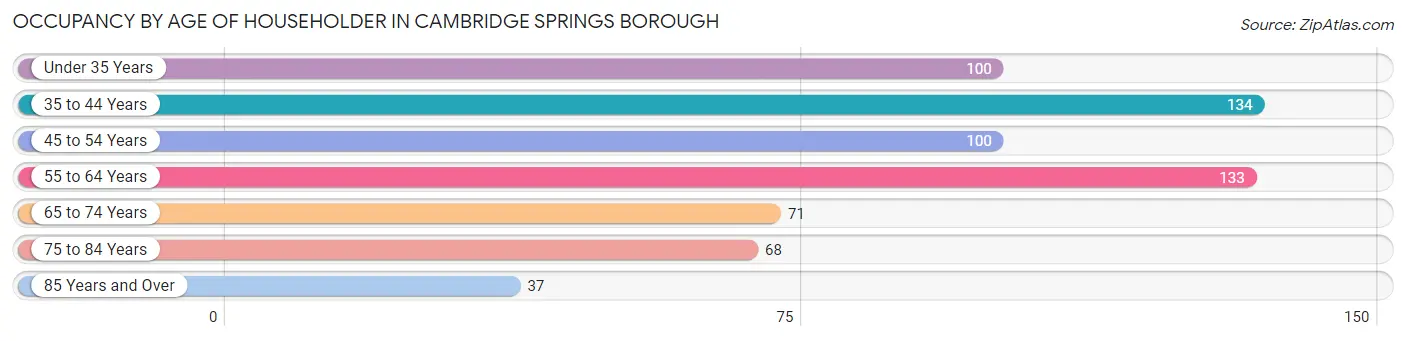
| Age Bracket | # Households | % Households |
| Under 35 Years | 100 | 15.5% |
| 35 to 44 Years | 134 | 20.8% |
| 45 to 54 Years | 100 | 15.5% |
| 55 to 64 Years | 133 | 20.7% |
| 65 to 74 Years | 71 | 11.0% |
| 75 to 84 Years | 68 | 10.6% |
| 85 Years and Over | 37 | 5.8% |
| Total | 643 | 100.0% |
Housing Finances in Cambridge Springs borough
Median Income by Occupancy in Cambridge Springs borough
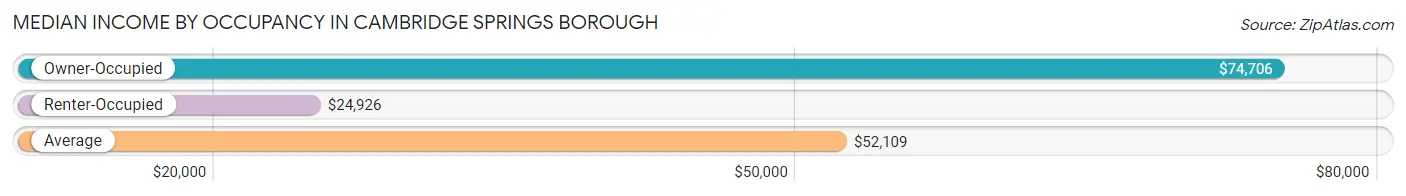
| Occupancy Type | # Households | Median Income |
| Owner-Occupied | 358 (55.7%) | $74,706 |
| Renter-Occupied | 285 (44.3%) | $24,926 |
| Average | 643 (100.0%) | $52,109 |
Occupancy by Householder Income Bracket in Cambridge Springs borough
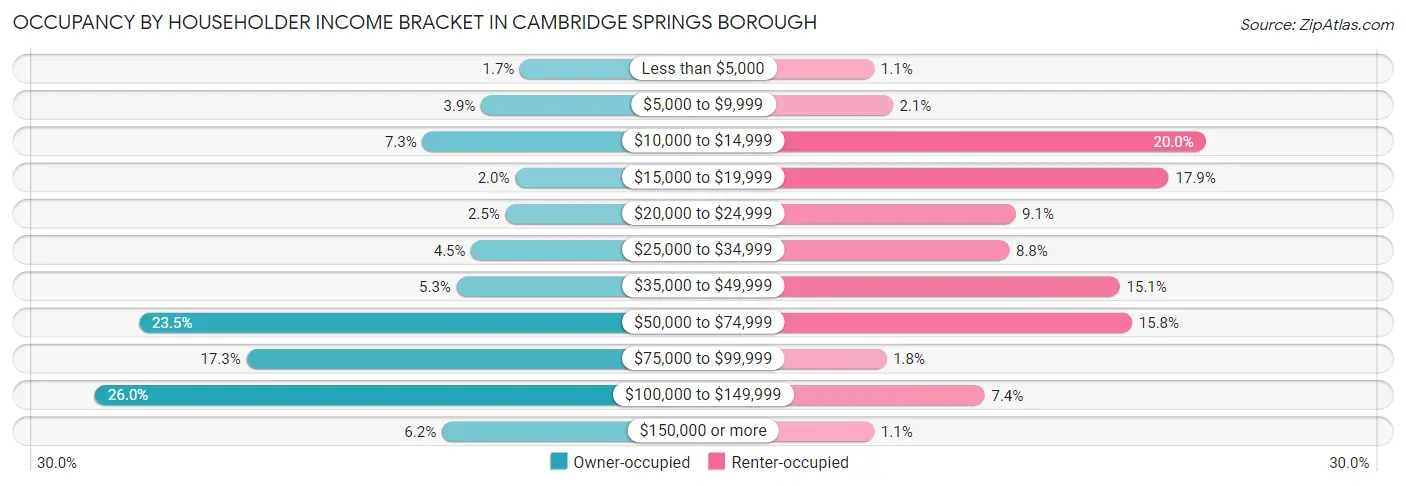
| Income Bracket | Owner-occupied | Renter-occupied |
| Less than $5,000 | 6 (1.7%) | 3 (1.1%) |
| $5,000 to $9,999 | 14 (3.9%) | 6 (2.1%) |
| $10,000 to $14,999 | 26 (7.3%) | 57 (20.0%) |
| $15,000 to $19,999 | 7 (2.0%) | 51 (17.9%) |
| $20,000 to $24,999 | 9 (2.5%) | 26 (9.1%) |
| $25,000 to $34,999 | 16 (4.5%) | 25 (8.8%) |
| $35,000 to $49,999 | 19 (5.3%) | 43 (15.1%) |
| $50,000 to $74,999 | 84 (23.5%) | 45 (15.8%) |
| $75,000 to $99,999 | 62 (17.3%) | 5 (1.8%) |
| $100,000 to $149,999 | 93 (26.0%) | 21 (7.4%) |
| $150,000 or more | 22 (6.1%) | 3 (1.1%) |
| Total | 358 (100.0%) | 285 (100.0%) |
Monthly Housing Cost Tiers in Cambridge Springs borough
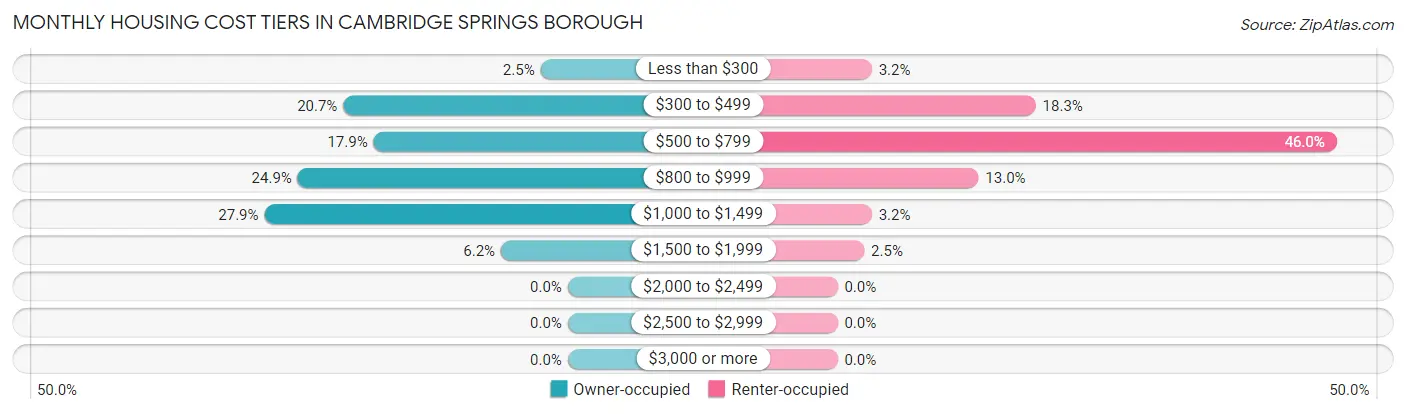
| Monthly Cost | Owner-occupied | Renter-occupied |
| Less than $300 | 9 (2.5%) | 9 (3.2%) |
| $300 to $499 | 74 (20.7%) | 52 (18.2%) |
| $500 to $799 | 64 (17.9%) | 131 (46.0%) |
| $800 to $999 | 89 (24.9%) | 37 (13.0%) |
| $1,000 to $1,499 | 100 (27.9%) | 9 (3.2%) |
| $1,500 to $1,999 | 22 (6.1%) | 7 (2.5%) |
| $2,000 to $2,499 | 0 (0.0%) | 0 (0.0%) |
| $2,500 to $2,999 | 0 (0.0%) | 0 (0.0%) |
| $3,000 or more | 0 (0.0%) | 0 (0.0%) |
| Total | 358 (100.0%) | 285 (100.0%) |
Physical Housing Characteristics in Cambridge Springs borough
Housing Structures in Cambridge Springs borough
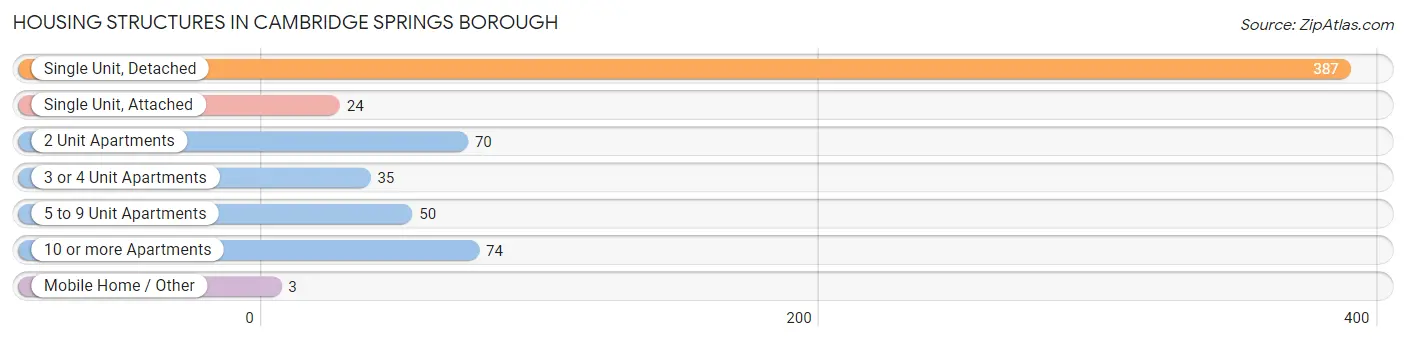
| Structure Type | # Housing Units | % Housing Units |
| Single Unit, Detached | 387 | 60.2% |
| Single Unit, Attached | 24 | 3.7% |
| 2 Unit Apartments | 70 | 10.9% |
| 3 or 4 Unit Apartments | 35 | 5.4% |
| 5 to 9 Unit Apartments | 50 | 7.8% |
| 10 or more Apartments | 74 | 11.5% |
| Mobile Home / Other | 3 | 0.5% |
| Total | 643 | 100.0% |
Housing Structures by Occupancy in Cambridge Springs borough
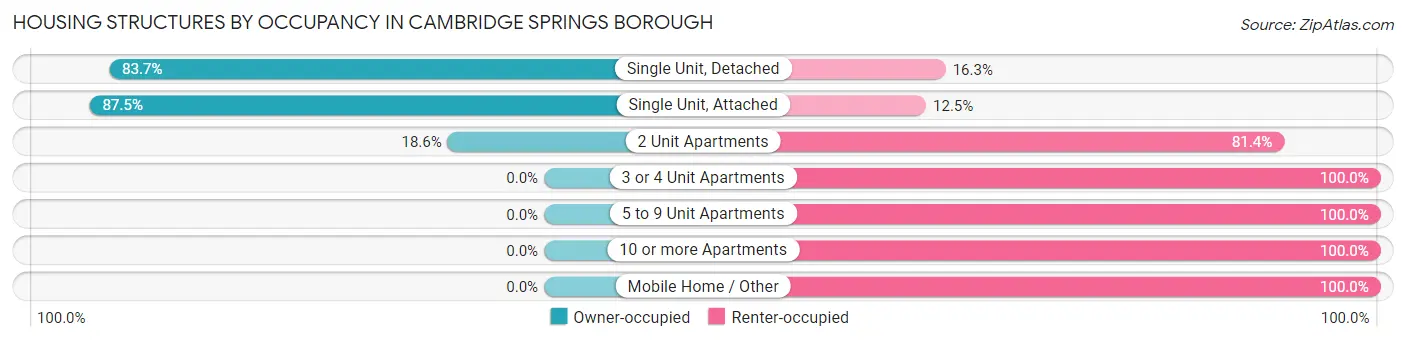
| Structure Type | Owner-occupied | Renter-occupied |
| Single Unit, Detached | 324 (83.7%) | 63 (16.3%) |
| Single Unit, Attached | 21 (87.5%) | 3 (12.5%) |
| 2 Unit Apartments | 13 (18.6%) | 57 (81.4%) |
| 3 or 4 Unit Apartments | 0 (0.0%) | 35 (100.0%) |
| 5 to 9 Unit Apartments | 0 (0.0%) | 50 (100.0%) |
| 10 or more Apartments | 0 (0.0%) | 74 (100.0%) |
| Mobile Home / Other | 0 (0.0%) | 3 (100.0%) |
| Total | 358 (55.7%) | 285 (44.3%) |
Housing Structures by Number of Rooms in Cambridge Springs borough
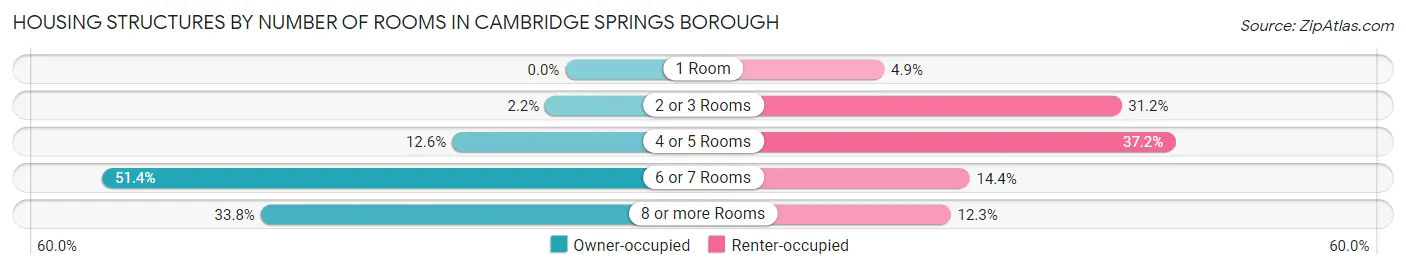
| Number of Rooms | Owner-occupied | Renter-occupied |
| 1 Room | 0 (0.0%) | 14 (4.9%) |
| 2 or 3 Rooms | 8 (2.2%) | 89 (31.2%) |
| 4 or 5 Rooms | 45 (12.6%) | 106 (37.2%) |
| 6 or 7 Rooms | 184 (51.4%) | 41 (14.4%) |
| 8 or more Rooms | 121 (33.8%) | 35 (12.3%) |
| Total | 358 (100.0%) | 285 (100.0%) |
Housing Structure by Heating Type in Cambridge Springs borough
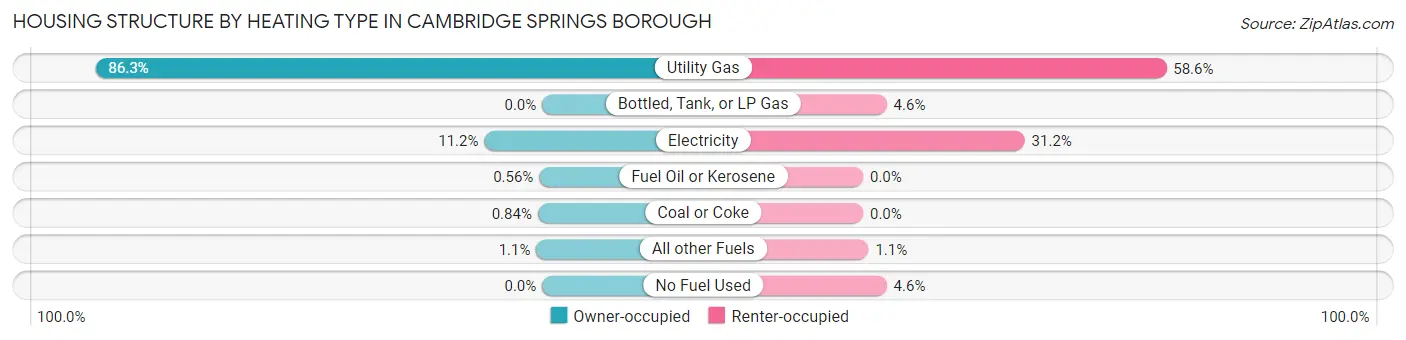
| Heating Type | Owner-occupied | Renter-occupied |
| Utility Gas | 309 (86.3%) | 167 (58.6%) |
| Bottled, Tank, or LP Gas | 0 (0.0%) | 13 (4.6%) |
| Electricity | 40 (11.2%) | 89 (31.2%) |
| Fuel Oil or Kerosene | 2 (0.6%) | 0 (0.0%) |
| Coal or Coke | 3 (0.8%) | 0 (0.0%) |
| All other Fuels | 4 (1.1%) | 3 (1.1%) |
| No Fuel Used | 0 (0.0%) | 13 (4.6%) |
| Total | 358 (100.0%) | 285 (100.0%) |
Household Vehicle Usage in Cambridge Springs borough
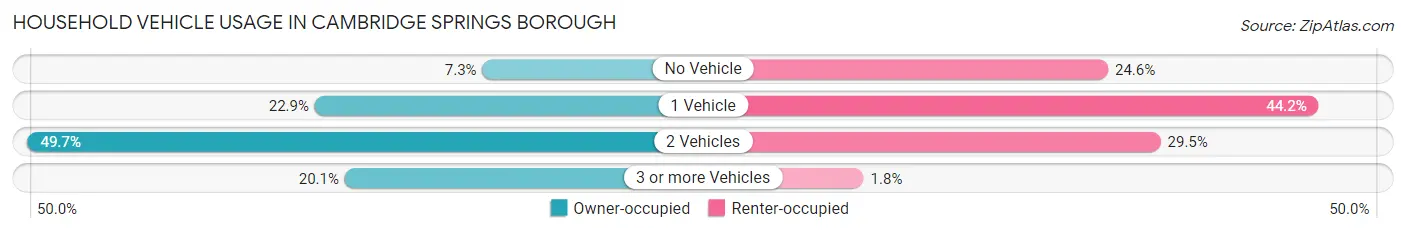
| Vehicles per Household | Owner-occupied | Renter-occupied |
| No Vehicle | 26 (7.3%) | 70 (24.6%) |
| 1 Vehicle | 82 (22.9%) | 126 (44.2%) |
| 2 Vehicles | 178 (49.7%) | 84 (29.5%) |
| 3 or more Vehicles | 72 (20.1%) | 5 (1.8%) |
| Total | 358 (100.0%) | 285 (100.0%) |
Real Estate & Mortgages in Cambridge Springs borough
Real Estate and Mortgage Overview in Cambridge Springs borough
| Characteristic | Without Mortgage | With Mortgage |
| Housing Units | 115 | 243 |
| Median Property Value | $106,300 | $109,200 |
| Median Household Income | $56,750 | $16 |
| Monthly Housing Costs | $446 | $0 |
| Real Estate Taxes | $1,679 | $3 |
Property Value by Mortgage Status in Cambridge Springs borough
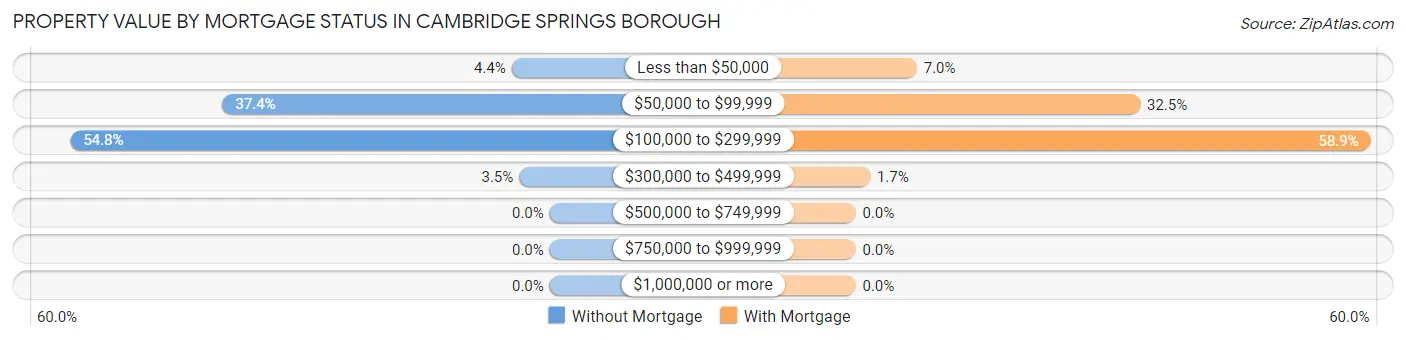
| Property Value | Without Mortgage | With Mortgage |
| Less than $50,000 | 5 (4.3%) | 17 (7.0%) |
| $50,000 to $99,999 | 43 (37.4%) | 79 (32.5%) |
| $100,000 to $299,999 | 63 (54.8%) | 143 (58.9%) |
| $300,000 to $499,999 | 4 (3.5%) | 4 (1.7%) |
| $500,000 to $749,999 | 0 (0.0%) | 0 (0.0%) |
| $750,000 to $999,999 | 0 (0.0%) | 0 (0.0%) |
| $1,000,000 or more | 0 (0.0%) | 0 (0.0%) |
| Total | 115 (100.0%) | 243 (100.0%) |
Household Income by Mortgage Status in Cambridge Springs borough
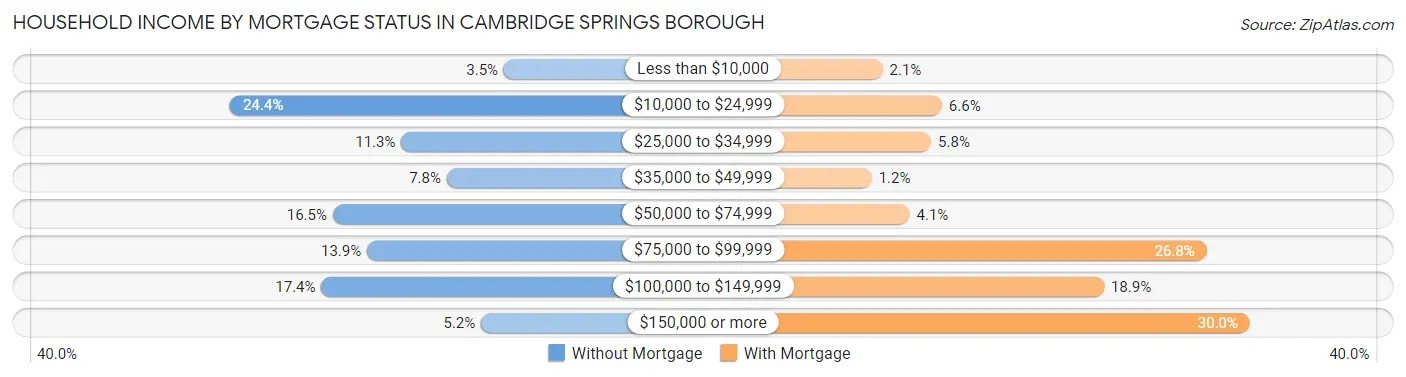
| Household Income | Without Mortgage | With Mortgage |
| Less than $10,000 | 4 (3.5%) | 5 (2.1%) |
| $10,000 to $24,999 | 28 (24.3%) | 16 (6.6%) |
| $25,000 to $34,999 | 13 (11.3%) | 14 (5.8%) |
| $35,000 to $49,999 | 9 (7.8%) | 3 (1.2%) |
| $50,000 to $74,999 | 19 (16.5%) | 10 (4.1%) |
| $75,000 to $99,999 | 16 (13.9%) | 65 (26.8%) |
| $100,000 to $149,999 | 20 (17.4%) | 46 (18.9%) |
| $150,000 or more | 6 (5.2%) | 73 (30.0%) |
| Total | 115 (100.0%) | 243 (100.0%) |
Property Value to Household Income Ratio in Cambridge Springs borough
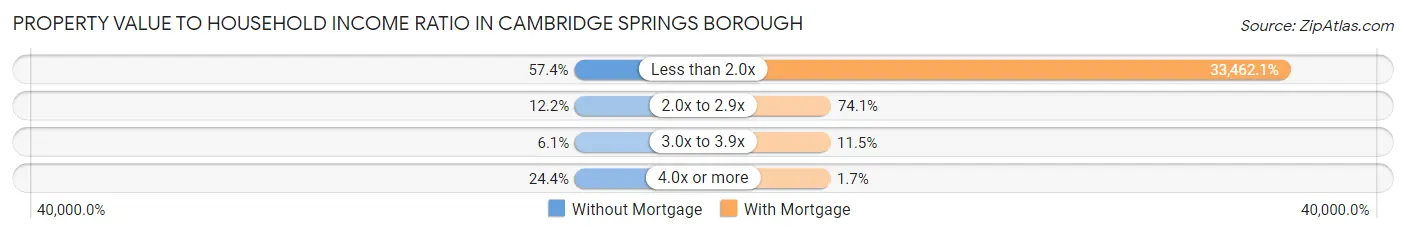
| Value-to-Income Ratio | Without Mortgage | With Mortgage |
| Less than 2.0x | 66 (57.4%) | 81,313 (33,462.1%) |
| 2.0x to 2.9x | 14 (12.2%) | 180 (74.1%) |
| 3.0x to 3.9x | 7 (6.1%) | 28 (11.5%) |
| 4.0x or more | 28 (24.3%) | 4 (1.7%) |
| Total | 115 (100.0%) | 243 (100.0%) |
Real Estate Taxes by Mortgage Status in Cambridge Springs borough
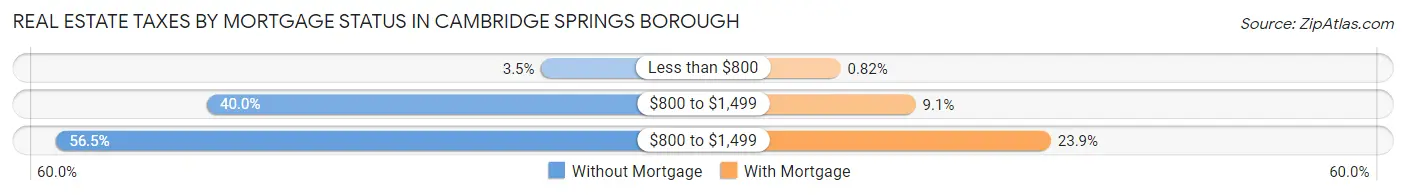
| Property Taxes | Without Mortgage | With Mortgage |
| Less than $800 | 4 (3.5%) | 2 (0.8%) |
| $800 to $1,499 | 46 (40.0%) | 22 (9.0%) |
| $800 to $1,499 | 65 (56.5%) | 58 (23.9%) |
| Total | 115 (100.0%) | 243 (100.0%) |
Health & Disability in Cambridge Springs borough
Health Insurance Coverage by Age in Cambridge Springs borough
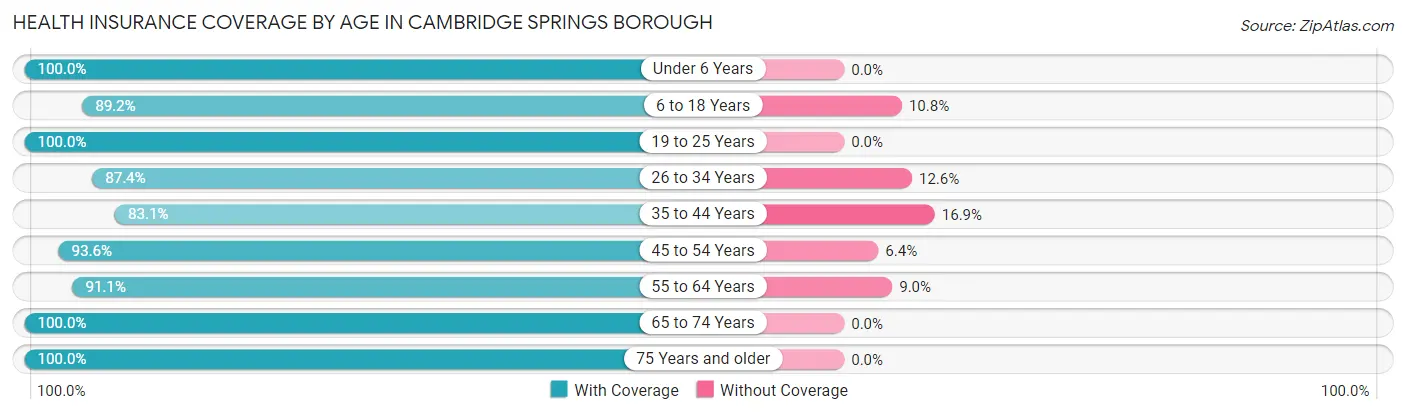
| Age Bracket | With Coverage | Without Coverage |
| Under 6 Years | 108 (100.0%) | 0 (0.0%) |
| 6 to 18 Years | 224 (89.2%) | 27 (10.8%) |
| 19 to 25 Years | 114 (100.0%) | 0 (0.0%) |
| 26 to 34 Years | 152 (87.4%) | 22 (12.6%) |
| 35 to 44 Years | 182 (83.1%) | 37 (16.9%) |
| 45 to 54 Years | 162 (93.6%) | 11 (6.4%) |
| 55 to 64 Years | 173 (91.0%) | 17 (8.9%) |
| 65 to 74 Years | 101 (100.0%) | 0 (0.0%) |
| 75 Years and older | 122 (100.0%) | 0 (0.0%) |
| Total | 1,338 (92.1%) | 114 (7.9%) |
Health Insurance Coverage by Citizenship Status in Cambridge Springs borough
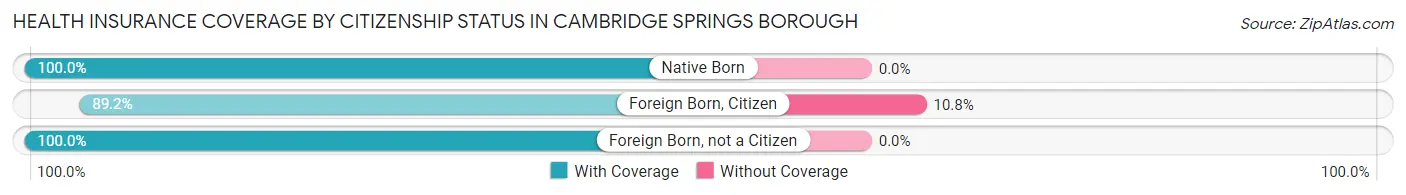
| Citizenship Status | With Coverage | Without Coverage |
| Native Born | 108 (100.0%) | 0 (0.0%) |
| Foreign Born, Citizen | 224 (89.2%) | 27 (10.8%) |
| Foreign Born, not a Citizen | 114 (100.0%) | 0 (0.0%) |
Health Insurance Coverage by Household Income in Cambridge Springs borough
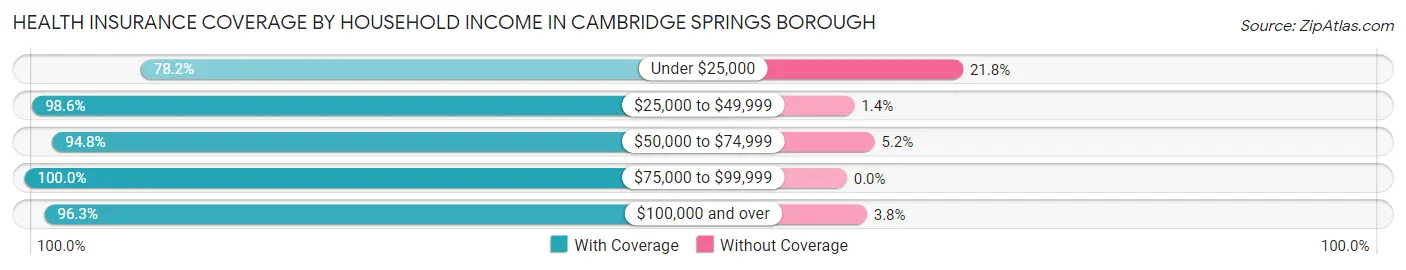
| Household Income | With Coverage | Without Coverage |
| Under $25,000 | 291 (78.2%) | 81 (21.8%) |
| $25,000 to $49,999 | 207 (98.6%) | 3 (1.4%) |
| $50,000 to $74,999 | 292 (94.8%) | 16 (5.2%) |
| $75,000 to $99,999 | 189 (100.0%) | 0 (0.0%) |
| $100,000 and over | 359 (96.3%) | 14 (3.7%) |
Public vs Private Health Insurance Coverage by Age in Cambridge Springs borough
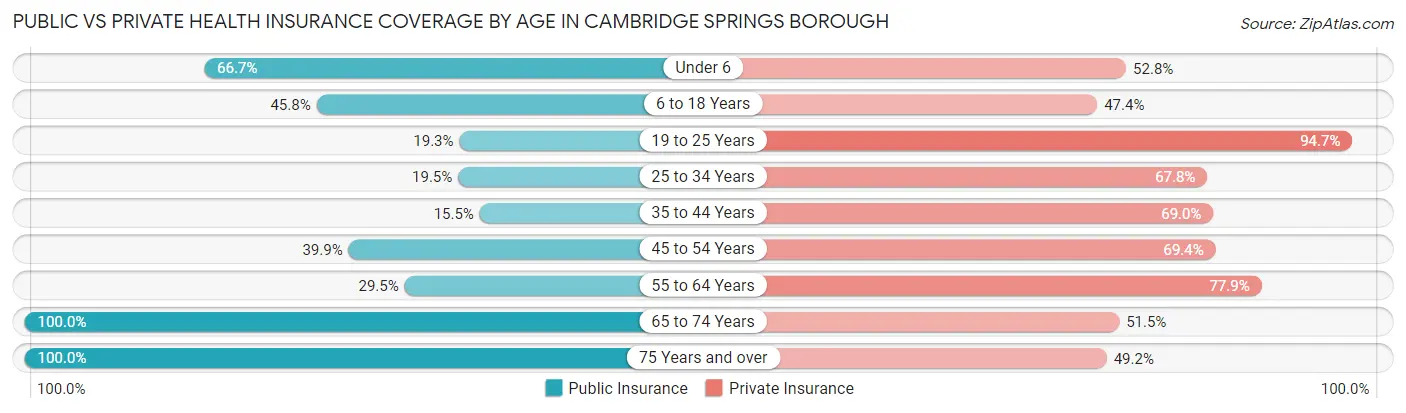
| Age Bracket | Public Insurance | Private Insurance |
| Under 6 | 72 (66.7%) | 57 (52.8%) |
| 6 to 18 Years | 115 (45.8%) | 119 (47.4%) |
| 19 to 25 Years | 22 (19.3%) | 108 (94.7%) |
| 25 to 34 Years | 34 (19.5%) | 118 (67.8%) |
| 35 to 44 Years | 34 (15.5%) | 151 (69.0%) |
| 45 to 54 Years | 69 (39.9%) | 120 (69.4%) |
| 55 to 64 Years | 56 (29.5%) | 148 (77.9%) |
| 65 to 74 Years | 101 (100.0%) | 52 (51.5%) |
| 75 Years and over | 122 (100.0%) | 60 (49.2%) |
| Total | 625 (43.0%) | 933 (64.3%) |
Disability Status by Sex by Age in Cambridge Springs borough
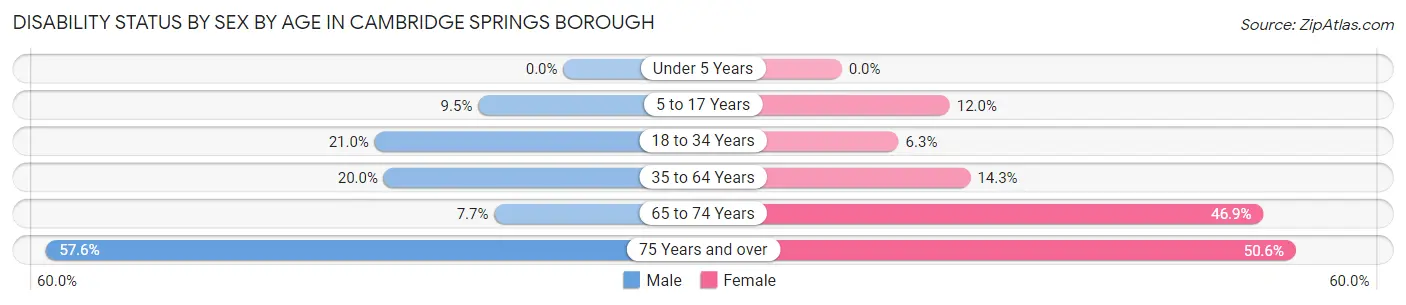
| Age Bracket | Male | Female |
| Under 5 Years | 0 (0.0%) | 0 (0.0%) |
| 5 to 17 Years | 11 (9.5%) | 19 (12.0%) |
| 18 to 34 Years | 29 (21.0%) | 10 (6.3%) |
| 35 to 64 Years | 55 (20.0%) | 44 (14.3%) |
| 65 to 74 Years | 4 (7.7%) | 23 (46.9%) |
| 75 Years and over | 19 (57.6%) | 45 (50.6%) |
Disability Class by Sex by Age in Cambridge Springs borough
Disability Class: Hearing Difficulty
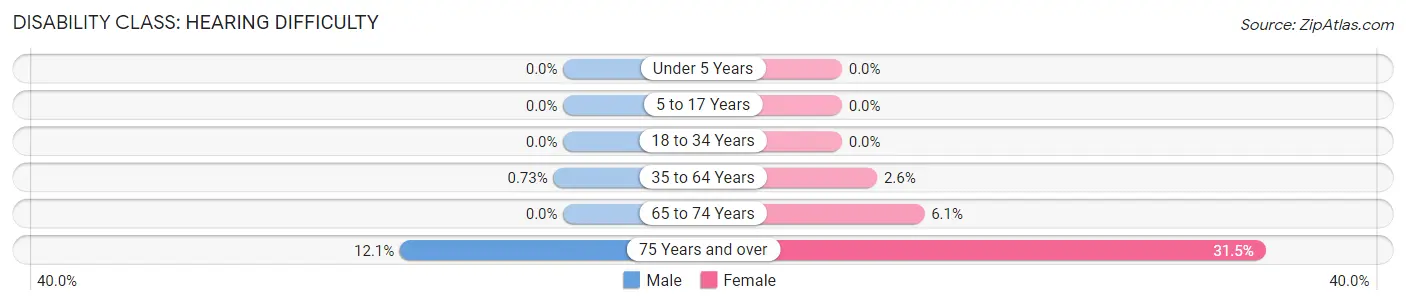
| Age Bracket | Male | Female |
| Under 5 Years | 0 (0.0%) | 0 (0.0%) |
| 5 to 17 Years | 0 (0.0%) | 0 (0.0%) |
| 18 to 34 Years | 0 (0.0%) | 0 (0.0%) |
| 35 to 64 Years | 2 (0.7%) | 8 (2.6%) |
| 65 to 74 Years | 0 (0.0%) | 3 (6.1%) |
| 75 Years and over | 4 (12.1%) | 28 (31.5%) |
Disability Class: Vision Difficulty
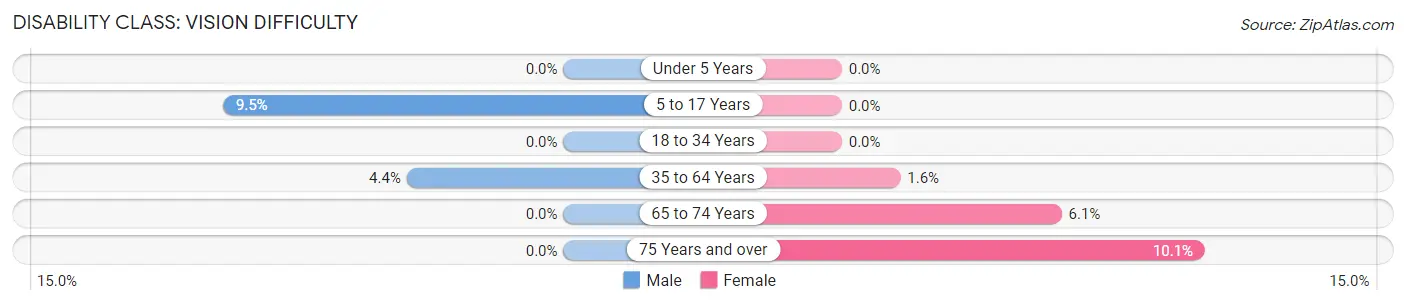
| Age Bracket | Male | Female |
| Under 5 Years | 0 (0.0%) | 0 (0.0%) |
| 5 to 17 Years | 11 (9.5%) | 0 (0.0%) |
| 18 to 34 Years | 0 (0.0%) | 0 (0.0%) |
| 35 to 64 Years | 12 (4.4%) | 5 (1.6%) |
| 65 to 74 Years | 0 (0.0%) | 3 (6.1%) |
| 75 Years and over | 0 (0.0%) | 9 (10.1%) |
Disability Class: Cognitive Difficulty
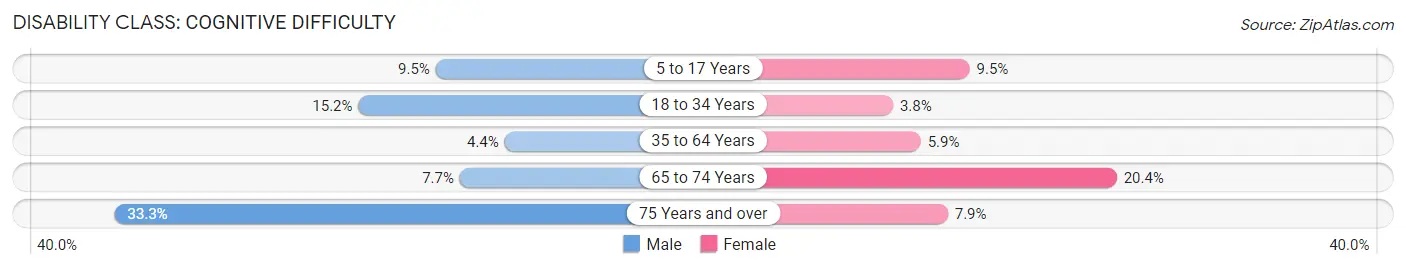
| Age Bracket | Male | Female |
| 5 to 17 Years | 11 (9.5%) | 15 (9.5%) |
| 18 to 34 Years | 21 (15.2%) | 6 (3.8%) |
| 35 to 64 Years | 12 (4.4%) | 18 (5.9%) |
| 65 to 74 Years | 4 (7.7%) | 10 (20.4%) |
| 75 Years and over | 11 (33.3%) | 7 (7.9%) |
Disability Class: Ambulatory Difficulty
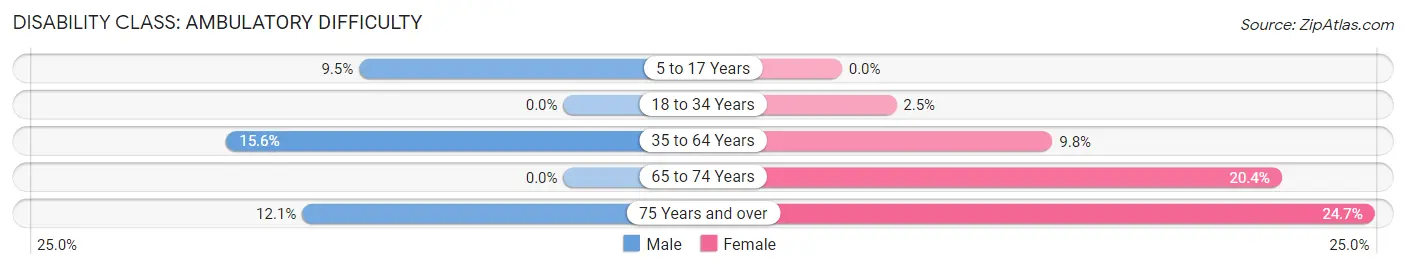
| Age Bracket | Male | Female |
| 5 to 17 Years | 11 (9.5%) | 0 (0.0%) |
| 18 to 34 Years | 0 (0.0%) | 4 (2.5%) |
| 35 to 64 Years | 43 (15.6%) | 30 (9.8%) |
| 65 to 74 Years | 0 (0.0%) | 10 (20.4%) |
| 75 Years and over | 4 (12.1%) | 22 (24.7%) |
Disability Class: Self-Care Difficulty

| Age Bracket | Male | Female |
| 5 to 17 Years | 11 (9.5%) | 12 (7.6%) |
| 18 to 34 Years | 0 (0.0%) | 0 (0.0%) |
| 35 to 64 Years | 6 (2.2%) | 11 (3.6%) |
| 65 to 74 Years | 4 (7.7%) | 3 (6.1%) |
| 75 Years and over | 0 (0.0%) | 9 (10.1%) |
Technology Access in Cambridge Springs borough
Computing Device Access in Cambridge Springs borough
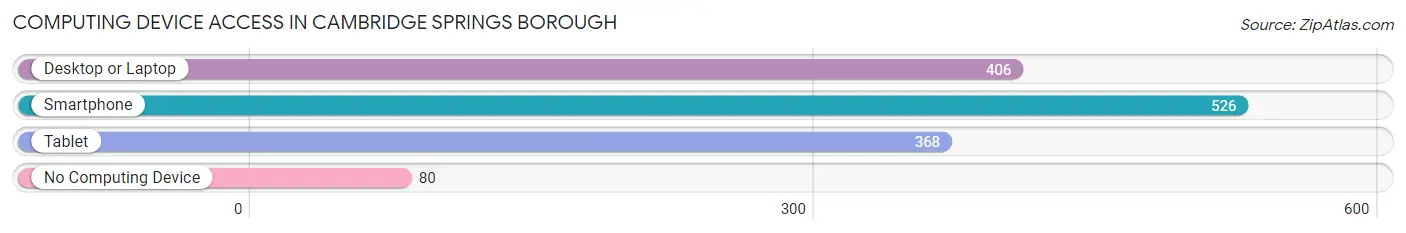
| Device Type | # Households | % Households |
| Desktop or Laptop | 406 | 63.1% |
| Smartphone | 526 | 81.8% |
| Tablet | 368 | 57.2% |
| No Computing Device | 80 | 12.4% |
| Total | 643 | 100.0% |
Internet Access in Cambridge Springs borough
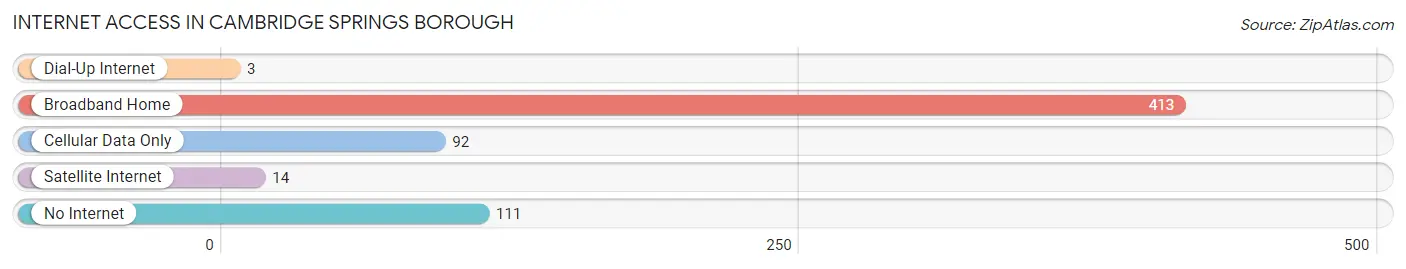
| Internet Type | # Households | % Households |
| Dial-Up Internet | 3 | 0.5% |
| Broadband Home | 413 | 64.2% |
| Cellular Data Only | 92 | 14.3% |
| Satellite Internet | 14 | 2.2% |
| No Internet | 111 | 17.3% |
| Total | 643 | 100.0% |
Cambridge Springs borough Summary
Cambridge Springs Borough is a small borough located in Crawford County, Pennsylvania. It is situated in the northwestern corner of the state, approximately 25 miles south of Erie. The borough is home to a population of 1,717 people, according to the 2010 census.
History
The area that is now Cambridge Springs Borough was first settled in the early 1800s by a group of Quakers from New England. The town was originally known as “Springsville” and was incorporated as a borough in 1866. The name was changed to Cambridge Springs in 1868, after the nearby Cambridge Springs Hotel. The hotel was a popular destination for wealthy visitors from the East Coast, and was the site of the 1904 U.S. Women’s Chess Championship.
The borough was an important stop on the Erie and Pittsburgh Railroad, which ran through the town from 1864 to 1932. The railroad was a major factor in the growth of the town, as it allowed for the transportation of goods and people.
Geography
Cambridge Springs Borough is located in the northwestern corner of Pennsylvania, approximately 25 miles south of Erie. The borough is situated in a rural area, with rolling hills and forests. The borough is bordered by French Creek to the north, and the borough of Venango to the south.
The borough covers an area of 1.2 square miles, with a population density of 1,521 people per square mile. The terrain is mostly flat, with some rolling hills. The climate is humid continental, with cold winters and warm summers.
Economy
The economy of Cambridge Springs Borough is largely based on agriculture and tourism. The borough is home to several farms, which produce a variety of crops, including corn, soybeans, and hay. The borough is also home to several wineries, which produce a variety of wines.
The borough is also home to several small businesses, including restaurants, retail stores, and professional services. The borough is also home to a number of bed and breakfasts, which attract visitors from all over the country.
Demographics
According to the 2010 census, the population of Cambridge Springs Borough was 1,717. The racial makeup of the borough was 97.3% White, 0.7% African American, 0.2% Native American, 0.3% Asian, 0.1% Pacific Islander, 0.3% from other races, and 1.2% from two or more races. Hispanic or Latino of any race were 1.2% of the population.
The median household income in the borough was $37,917, and the median family income was $45,938. The per capita income was $19,945. About 11.2% of families and 14.2% of the population were below the poverty line, including 19.2% of those under age 18 and 8.2% of those age 65 or over.
Common Questions
What is Per Capita Income in Cambridge Springs borough?
Per Capita income in Cambridge Springs borough is $21,259.
What is the Median Family Income in Cambridge Springs borough?
Median Family Income in Cambridge Springs borough is $61,625.
What is the Median Household income in Cambridge Springs borough?
Median Household Income in Cambridge Springs borough is $52,109.
What is Income or Wage Gap in Cambridge Springs borough?
Income or Wage Gap in Cambridge Springs borough is 61.6%.
Women in Cambridge Springs borough earn 38.4 cents for every dollar earned by a man.
What is Inequality or Gini Index in Cambridge Springs borough?
Inequality or Gini Index in Cambridge Springs borough is 0.47.
What is the Total Population of Cambridge Springs borough?
Total Population of Cambridge Springs borough is 2,297.
What is the Total Male Population of Cambridge Springs borough?
Total Male Population of Cambridge Springs borough is 641.
What is the Total Female Population of Cambridge Springs borough?
Total Female Population of Cambridge Springs borough is 1,656.
What is the Ratio of Males per 100 Females in Cambridge Springs borough?
There are 38.71 Males per 100 Females in Cambridge Springs borough.
What is the Ratio of Females per 100 Males in Cambridge Springs borough?
There are 258.35 Females per 100 Males in Cambridge Springs borough.
What is the Median Population Age in Cambridge Springs borough?
Median Population Age in Cambridge Springs borough is 39.8 Years.
What is the Average Family Size in Cambridge Springs borough
Average Family Size in Cambridge Springs borough is 3.0 People.
What is the Average Household Size in Cambridge Springs borough
Average Household Size in Cambridge Springs borough is 2.3 People.
How Large is the Labor Force in Cambridge Springs borough?
There are 719 People in the Labor Forcein in Cambridge Springs borough.
What is the Percentage of People in the Labor Force in Cambridge Springs borough?
36.3% of People are in the Labor Force in Cambridge Springs borough.
What is the Unemployment Rate in Cambridge Springs borough?
Unemployment Rate in Cambridge Springs borough is 6.3%.