Prospect, NY Map & Demographics
Prospect Map
Prospect Overview
$20,977
PER CAPITA INCOME
$62,159
AVG FAMILY INCOME
$60,795
AVG HOUSEHOLD INCOME
53.6%
WAGE / INCOME GAP [ % ]
46.4¢/ $1
WAGE / INCOME GAP [ $ ]
0.27
INEQUALITY / GINI INDEX
275
TOTAL POPULATION
129
MALE POPULATION
146
FEMALE POPULATION
88.36
MALES / 100 FEMALES
113.18
FEMALES / 100 MALES
43.6
MEDIAN AGE
3.6
AVG FAMILY SIZE
3.7
AVG HOUSEHOLD SIZE
108
LABOR FORCE [ PEOPLE ]
69.2%
PERCENT IN LABOR FORCE
Prospect Zip Codes
Prospect Area Codes
Income in Prospect
Income Overview in Prospect
Per Capita Income in Prospect is $20,977, while median incomes of families and households are $62,159 and $60,795 respectively.
| Characteristic | Number | Measure |
| Per Capita Income | 275 | $20,977 |
| Median Family Income | 63 | $62,159 |
| Mean Family Income | 63 | $81,708 |
| Median Household Income | 75 | $60,795 |
| Mean Household Income | 75 | $75,696 |
| Income Deficit | 63 | $0 |
| Wage / Income Gap (%) | 275 | 53.65% |
| Wage / Income Gap ($) | 275 | 46.35¢ per $1 |
| Gini / Inequality Index | 275 | 0.27 |
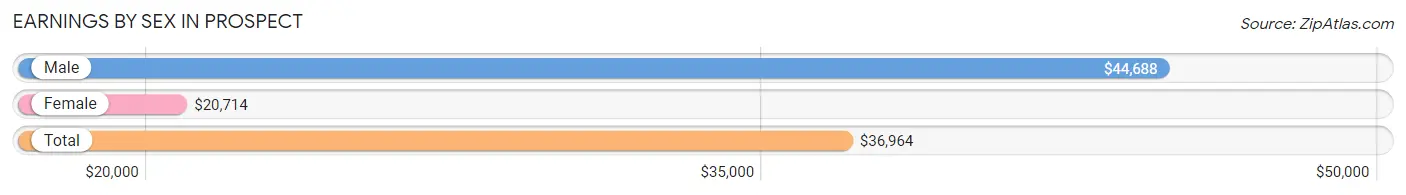
Earnings by Sex in Prospect
Average Earnings in Prospect are $36,964, $44,688 for men and $20,714 for women, a difference of 53.6%.
| Sex | Number | Average Earnings |
| Male | 57 (49.6%) | $44,688 |
| Female | 58 (50.4%) | $20,714 |
| Total | 115 (100.0%) | $36,964 |
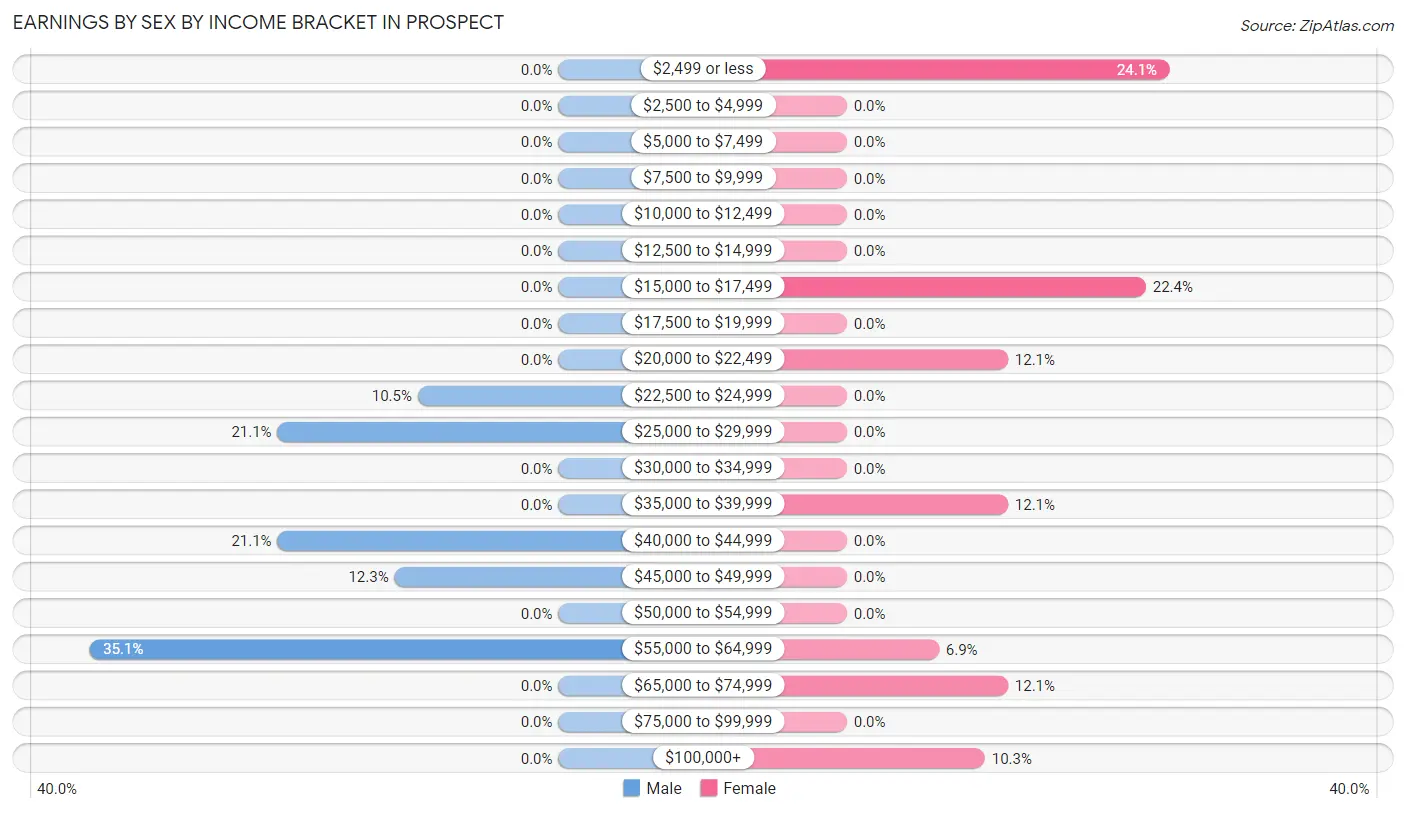
Earnings by Sex by Income Bracket in Prospect
The most common earnings brackets in Prospect are $55,000 to $64,999 for men (20 | 35.1%) and $2,499 or less for women (14 | 24.1%).
| Income | Male | Female |
| $2,499 or less | 0 (0.0%) | 14 (24.1%) |
| $2,500 to $4,999 | 0 (0.0%) | 0 (0.0%) |
| $5,000 to $7,499 | 0 (0.0%) | 0 (0.0%) |
| $7,500 to $9,999 | 0 (0.0%) | 0 (0.0%) |
| $10,000 to $12,499 | 0 (0.0%) | 0 (0.0%) |
| $12,500 to $14,999 | 0 (0.0%) | 0 (0.0%) |
| $15,000 to $17,499 | 0 (0.0%) | 13 (22.4%) |
| $17,500 to $19,999 | 0 (0.0%) | 0 (0.0%) |
| $20,000 to $22,499 | 0 (0.0%) | 7 (12.1%) |
| $22,500 to $24,999 | 6 (10.5%) | 0 (0.0%) |
| $25,000 to $29,999 | 12 (21.0%) | 0 (0.0%) |
| $30,000 to $34,999 | 0 (0.0%) | 0 (0.0%) |
| $35,000 to $39,999 | 0 (0.0%) | 7 (12.1%) |
| $40,000 to $44,999 | 12 (21.0%) | 0 (0.0%) |
| $45,000 to $49,999 | 7 (12.3%) | 0 (0.0%) |
| $50,000 to $54,999 | 0 (0.0%) | 0 (0.0%) |
| $55,000 to $64,999 | 20 (35.1%) | 4 (6.9%) |
| $65,000 to $74,999 | 0 (0.0%) | 7 (12.1%) |
| $75,000 to $99,999 | 0 (0.0%) | 0 (0.0%) |
| $100,000+ | 0 (0.0%) | 6 (10.3%) |
| Total | 57 (100.0%) | 58 (100.0%) |
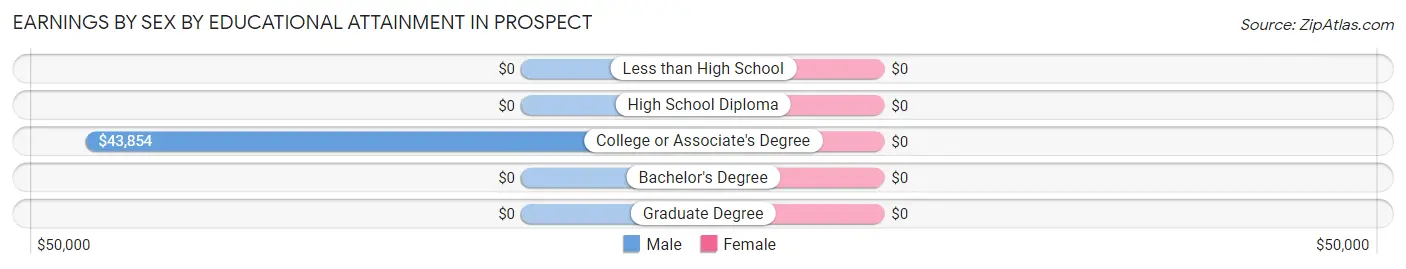
Earnings by Sex by Educational Attainment in Prospect
| Educational Attainment | Male Income | Female Income |
| Less than High School | - | - |
| High School Diploma | - | - |
| College or Associate's Degree | $43,854 | $0 |
| Bachelor's Degree | - | - |
| Graduate Degree | - | - |
| Total | $44,688 | $0 |
Family Income in Prospect
Family Income Brackets in Prospect
According to the Prospect family income data, there are 17 families falling into the $50,000 to $74,999 income range, which is the most common income bracket and makes up 27.0% of all families.
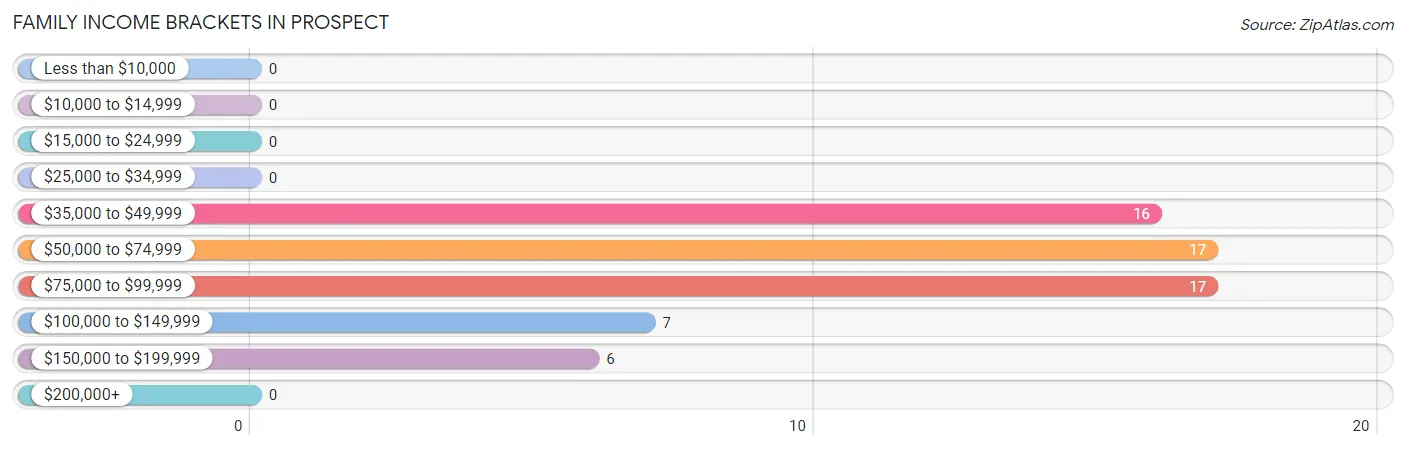
| Income Bracket | # Families | % Families |
| Less than $10,000 | 0 | 0.0% |
| $10,000 to $14,999 | 0 | 0.0% |
| $15,000 to $24,999 | 0 | 0.0% |
| $25,000 to $34,999 | 0 | 0.0% |
| $35,000 to $49,999 | 16 | 25.4% |
| $50,000 to $74,999 | 17 | 27.0% |
| $75,000 to $99,999 | 17 | 27.0% |
| $100,000 to $149,999 | 7 | 11.1% |
| $150,000 to $199,999 | 6 | 9.5% |
| $200,000+ | 0 | 0.0% |
Family Income by Famaliy Size in Prospect
4-person families (19 | 30.2%) account for the highest median family income in Prospect with $128,750 per family, while 4-person families (19 | 30.2%) have the highest median income of $32,188 per family member.
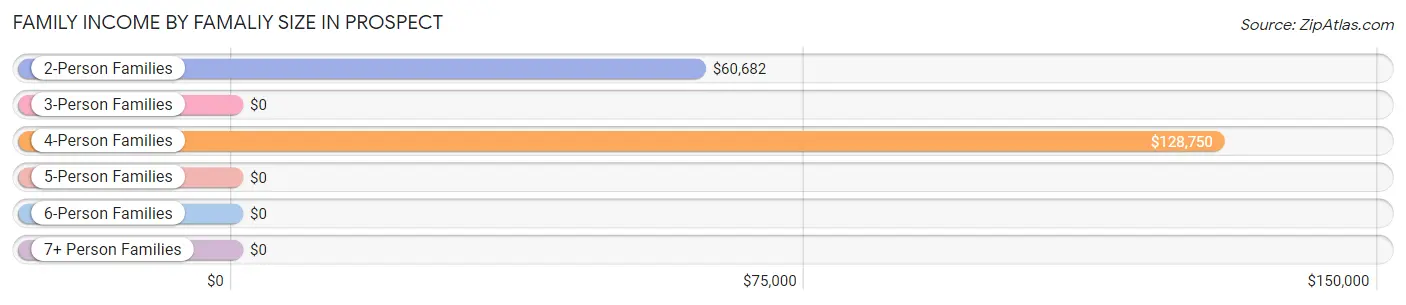
| Income Bracket | # Families | Median Income |
| 2-Person Families | 24 (38.1%) | $60,682 |
| 3-Person Families | 7 (11.1%) | $0 |
| 4-Person Families | 19 (30.2%) | $128,750 |
| 5-Person Families | 0 (0.0%) | $0 |
| 6-Person Families | 13 (20.6%) | $0 |
| 7+ Person Families | 0 (0.0%) | $0 |
| Total | 63 (100.0%) | $62,159 |
Family Income by Number of Earners in Prospect
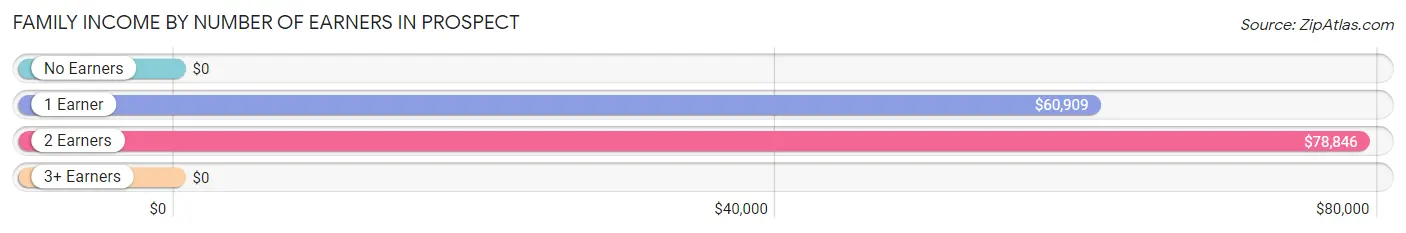
| Number of Earners | # Families | Median Income |
| No Earners | 9 (14.3%) | $0 |
| 1 Earner | 22 (34.9%) | $60,909 |
| 2 Earners | 26 (41.3%) | $78,846 |
| 3+ Earners | 6 (9.5%) | $0 |
| Total | 63 (100.0%) | $62,159 |
Household Income in Prospect
Household Income Brackets in Prospect
With 28 households falling in the category, the $35,000 to $49,999 income range is the most frequent in Prospect, accounting for 37.3% of all households.
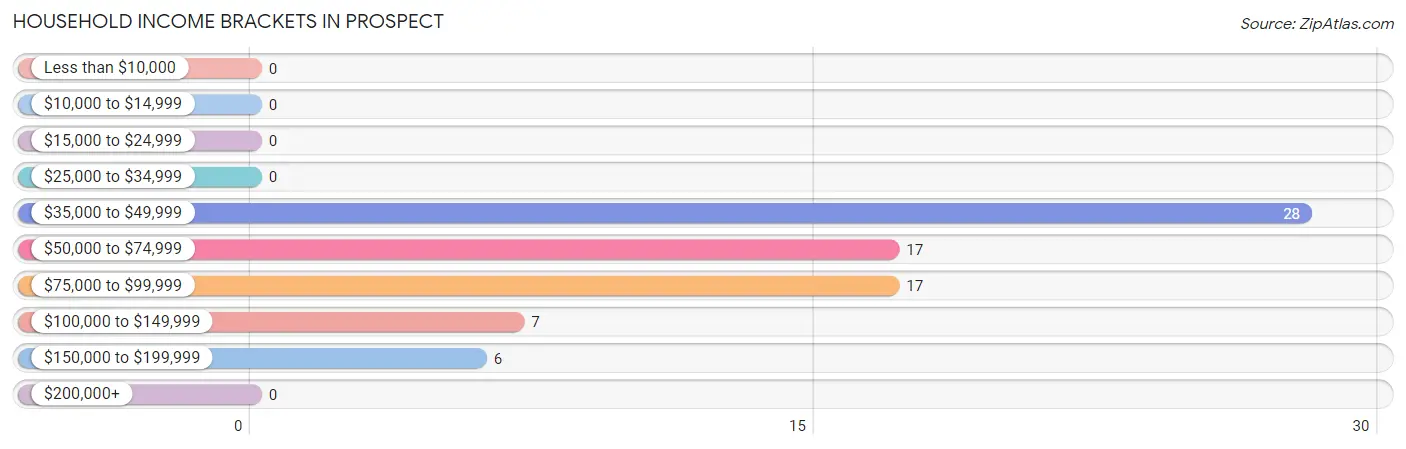
| Income Bracket | # Households | % Households |
| Less than $10,000 | 0 | 0.0% |
| $10,000 to $14,999 | 0 | 0.0% |
| $15,000 to $24,999 | 0 | 0.0% |
| $25,000 to $34,999 | 0 | 0.0% |
| $35,000 to $49,999 | 28 | 37.3% |
| $50,000 to $74,999 | 17 | 22.7% |
| $75,000 to $99,999 | 17 | 22.7% |
| $100,000 to $149,999 | 7 | 9.3% |
| $150,000 to $199,999 | 6 | 8.0% |
| $200,000+ | 0 | 0.0% |
Household Income by Householder Age in Prospect
The median household income in Prospect is $60,795, with the highest median household income of $60,682 found in the 65+ years age bracket for the primary householder. A total of 24 households (32.0%) fall into this category.
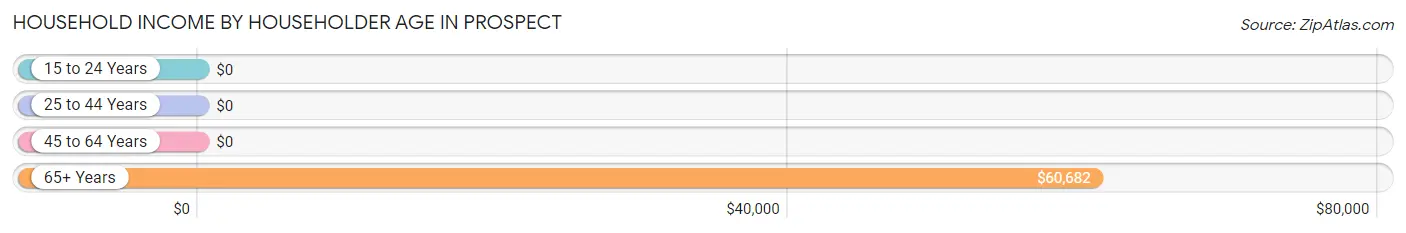
| Income Bracket | # Households | Median Income |
| 15 to 24 Years | 0 (0.0%) | $0 |
| 25 to 44 Years | 13 (17.3%) | $0 |
| 45 to 64 Years | 38 (50.7%) | $0 |
| 65+ Years | 24 (32.0%) | $60,682 |
| Total | 75 (100.0%) | $60,795 |
Poverty in Prospect
Income Below Poverty by Sex and Age in Prospect
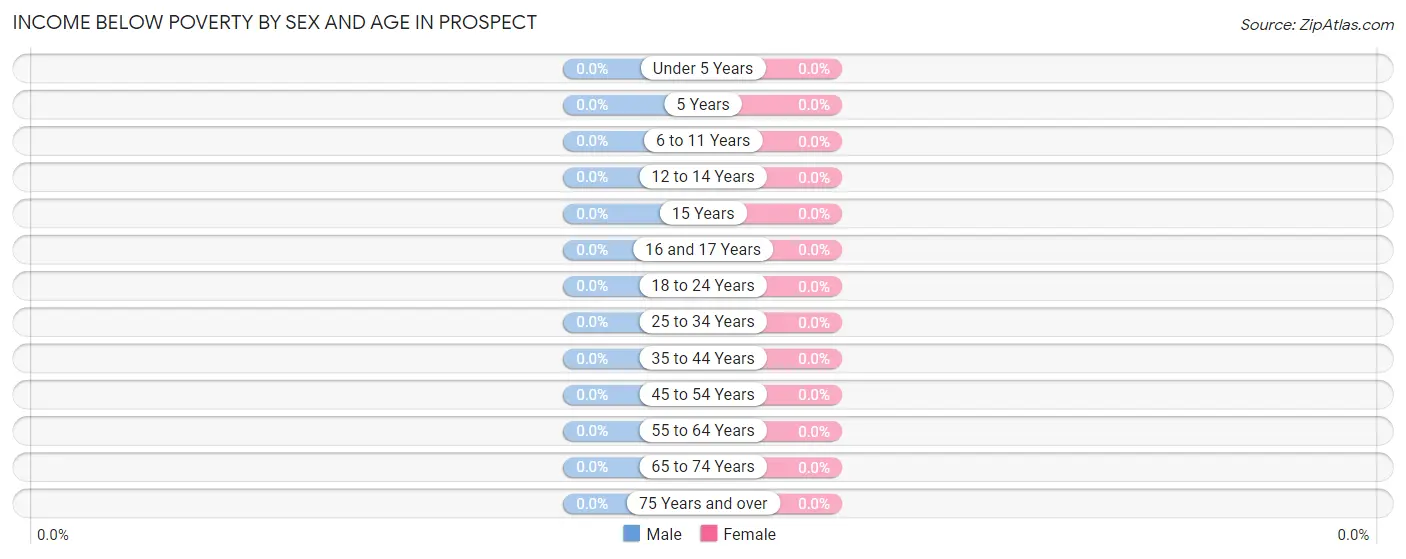
| Age Bracket | Male | Female |
| Under 5 Years | 0 (0.0%) | 0 (0.0%) |
| 5 Years | 0 (0.0%) | 0 (0.0%) |
| 6 to 11 Years | 0 (0.0%) | 0 (0.0%) |
| 12 to 14 Years | 0 (0.0%) | 0 (0.0%) |
| 15 Years | 0 (0.0%) | 0 (0.0%) |
| 16 and 17 Years | 0 (0.0%) | 0 (0.0%) |
| 18 to 24 Years | 0 (0.0%) | 0 (0.0%) |
| 25 to 34 Years | 0 (0.0%) | 0 (0.0%) |
| 35 to 44 Years | 0 (0.0%) | 0 (0.0%) |
| 45 to 54 Years | 0 (0.0%) | 0 (0.0%) |
| 55 to 64 Years | 0 (0.0%) | 0 (0.0%) |
| 65 to 74 Years | 0 (0.0%) | 0 (0.0%) |
| 75 Years and over | 0 (0.0%) | 0 (0.0%) |
| Total | 0 (0.0%) | 0 (0.0%) |
Income Above Poverty by Sex and Age in Prospect
According to the poverty statistics in Prospect, males aged 5 years and females aged under 5 years are the age groups that are most secure financially, with 100.0% of males and 100.0% of females in these age groups living above the poverty line.
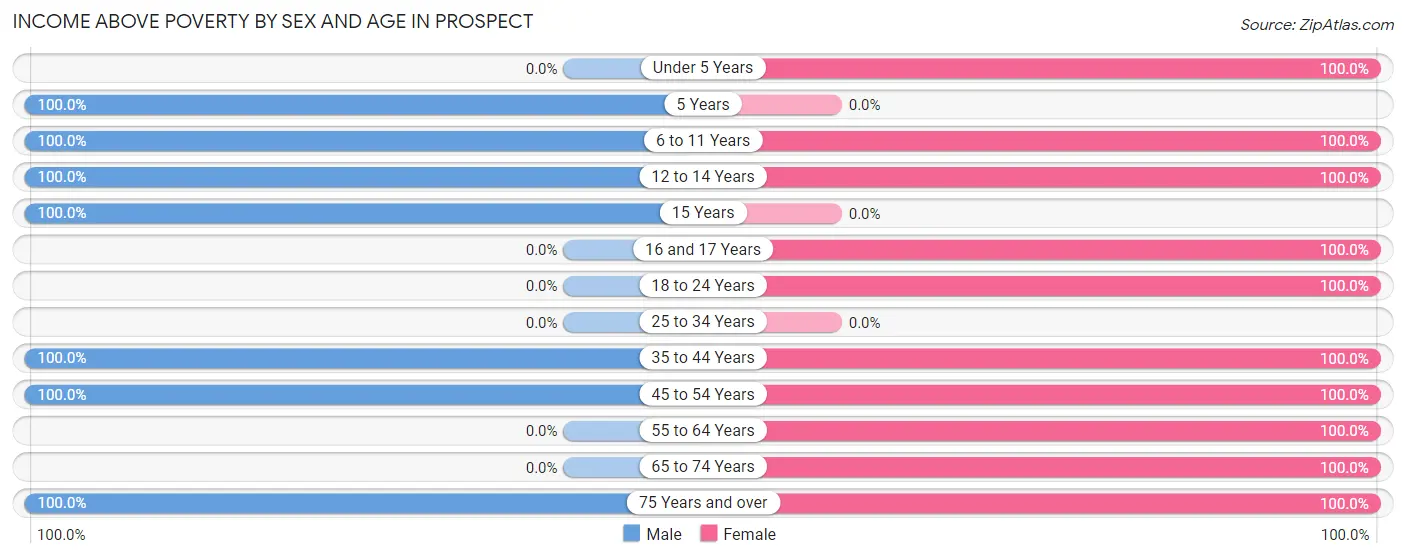
| Age Bracket | Male | Female |
| Under 5 Years | 0 (0.0%) | 13 (100.0%) |
| 5 Years | 13 (100.0%) | 0 (0.0%) |
| 6 to 11 Years | 13 (100.0%) | 5 (100.0%) |
| 12 to 14 Years | 17 (100.0%) | 10 (100.0%) |
| 15 Years | 13 (100.0%) | 0 (0.0%) |
| 16 and 17 Years | 0 (0.0%) | 7 (100.0%) |
| 18 to 24 Years | 0 (0.0%) | 7 (100.0%) |
| 25 to 34 Years | 0 (0.0%) | 0 (0.0%) |
| 35 to 44 Years | 13 (100.0%) | 20 (100.0%) |
| 45 to 54 Years | 44 (100.0%) | 13 (100.0%) |
| 55 to 64 Years | 0 (0.0%) | 7 (100.0%) |
| 65 to 74 Years | 0 (0.0%) | 24 (100.0%) |
| 75 Years and over | 16 (100.0%) | 5 (100.0%) |
| Total | 129 (100.0%) | 111 (100.0%) |
Income Below Poverty Among Married-Couple Families in Prospect
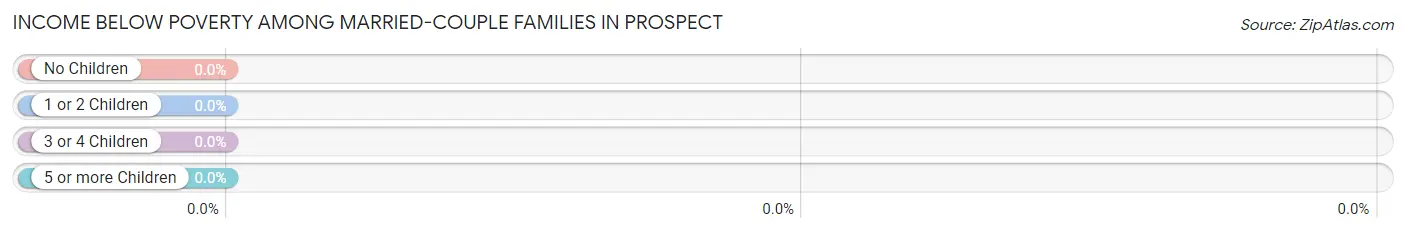
| Children | Above Poverty | Below Poverty |
| No Children | 9 (100.0%) | 0 (0.0%) |
| 1 or 2 Children | 19 (100.0%) | 0 (0.0%) |
| 3 or 4 Children | 13 (100.0%) | 0 (0.0%) |
| 5 or more Children | 0 (0.0%) | 0 (0.0%) |
| Total | 41 (100.0%) | 0 (0.0%) |
Income Below Poverty Among Single-Parent Households in Prospect
| Children | Single Father | Single Mother |
| No Children | 0 (0.0%) | 0 (0.0%) |
| 1 or 2 Children | 0 (0.0%) | 0 (0.0%) |
| 3 or 4 Children | 0 (0.0%) | 0 (0.0%) |
| 5 or more Children | 0 (0.0%) | 0 (0.0%) |
| Total | 0 (0.0%) | 0 (0.0%) |
Income Below Poverty Among Married-Couple vs Single-Parent Households in Prospect
| Children | Married-Couple Families | Single-Parent Households |
| No Children | 0 (0.0%) | 0 (0.0%) |
| 1 or 2 Children | 0 (0.0%) | 0 (0.0%) |
| 3 or 4 Children | 0 (0.0%) | 0 (0.0%) |
| 5 or more Children | 0 (0.0%) | 0 (0.0%) |
| Total | 0 (0.0%) | 0 (0.0%) |
Race in Prospect
The most populous races in Prospect are White / Caucasian (201 | 73.1%), Black / African American (61 | 22.2%), and Two or more Races (13 | 4.7%).
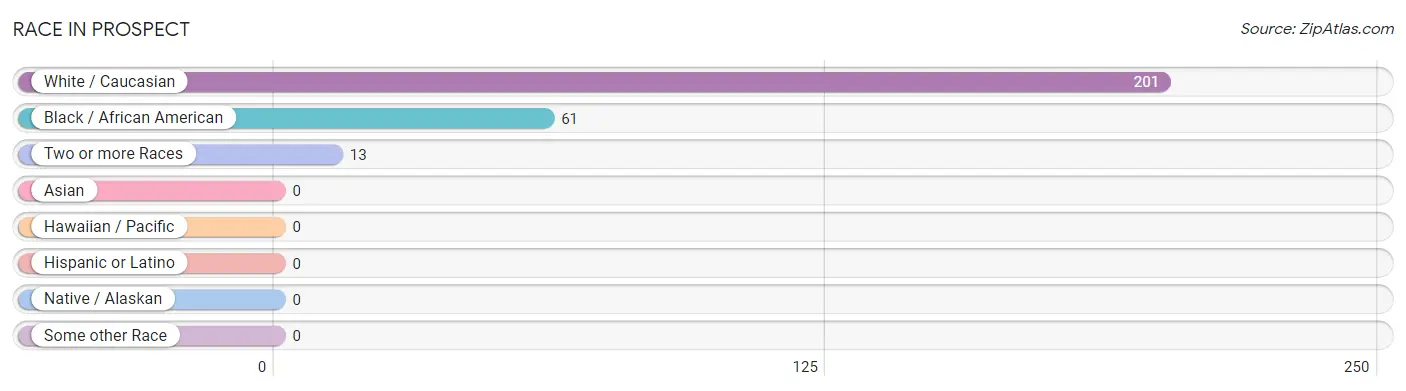
| Race | # Population | % Population |
| Asian | 0 | 0.0% |
| Black / African American | 61 | 22.2% |
| Hawaiian / Pacific | 0 | 0.0% |
| Hispanic or Latino | 0 | 0.0% |
| Native / Alaskan | 0 | 0.0% |
| White / Caucasian | 201 | 73.1% |
| Two or more Races | 13 | 4.7% |
| Some other Race | 0 | 0.0% |
| Total | 275 | 100.0% |
Ancestry in Prospect
The most populous ancestries reported in Prospect are German (110 | 40.0%), Irish (38 | 13.8%), English (35 | 12.7%), Italian (13 | 4.7%), and French (11 | 4.0%), together accounting for 75.3% of all Prospect residents.
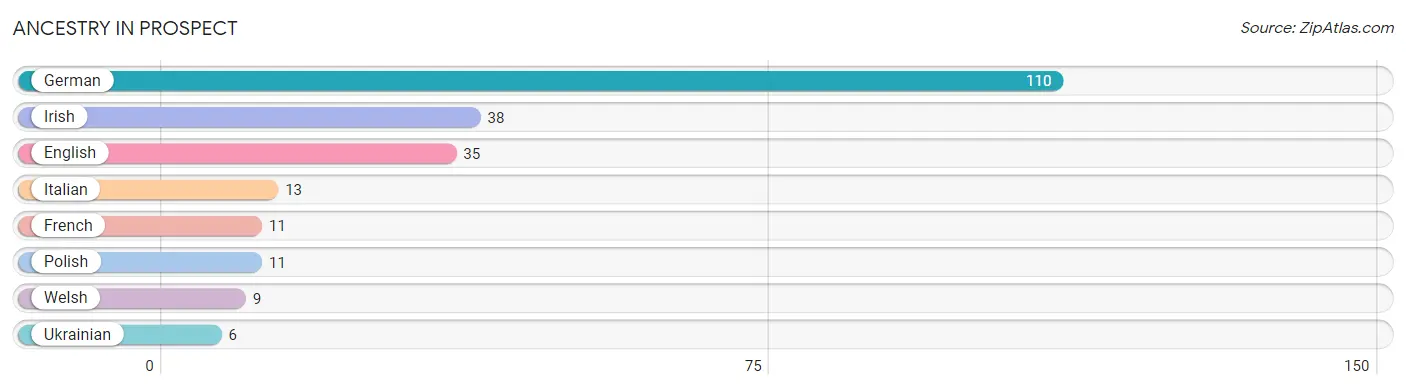
| Ancestry | # Population | % Population |
| English | 35 | 12.7% |
| French | 11 | 4.0% |
| German | 110 | 40.0% |
| Irish | 38 | 13.8% |
| Italian | 13 | 4.7% |
| Polish | 11 | 4.0% |
| Ukrainian | 6 | 2.2% |
| Welsh | 9 | 3.3% | View All 8 Rows |
Immigrants in Prospect

| Immigration Origin | # Population | % Population | View All 0 Rows |
Sex and Age in Prospect
Sex and Age in Prospect
The most populous age groups in Prospect are 5 to 9 Years (26 | 20.2%) for men and Under 5 Years (27 | 18.5%) for women.
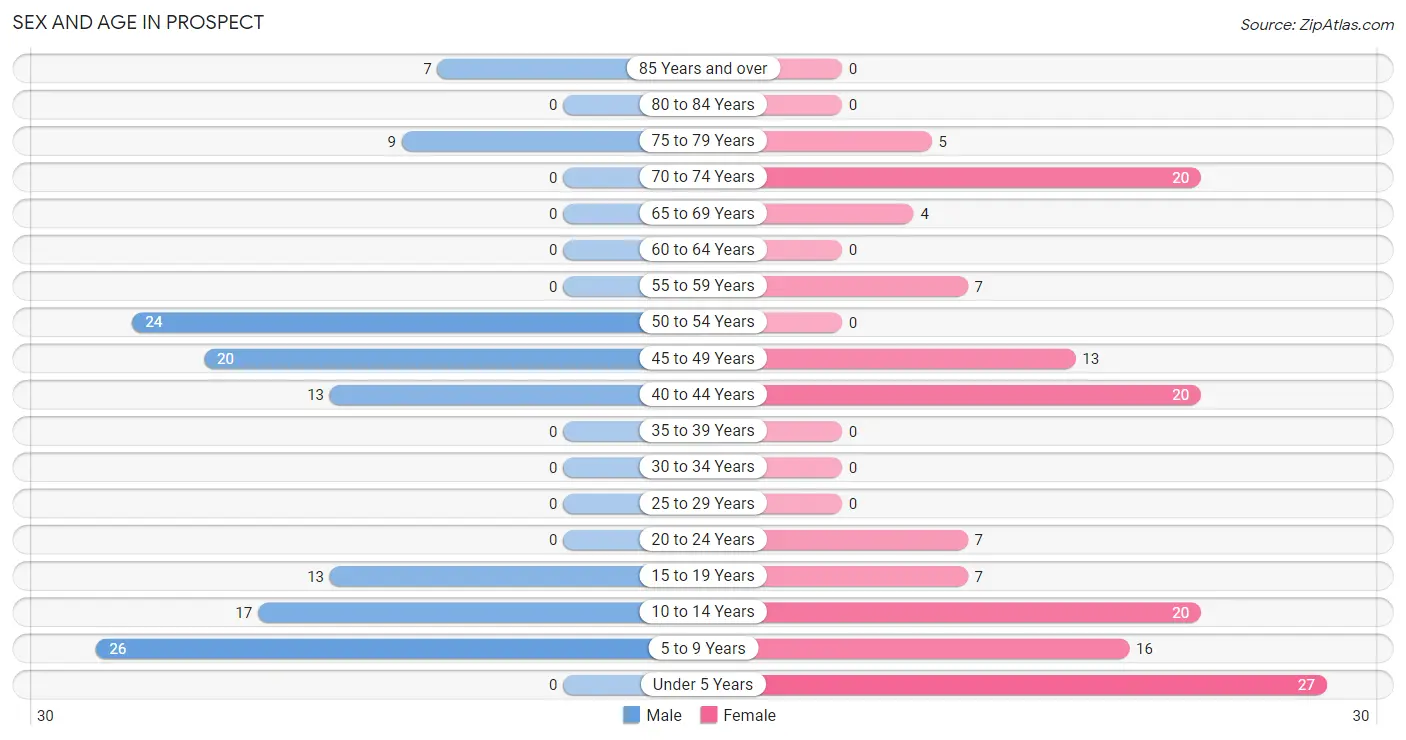
| Age Bracket | Male | Female |
| Under 5 Years | 0 (0.0%) | 27 (18.5%) |
| 5 to 9 Years | 26 (20.2%) | 16 (11.0%) |
| 10 to 14 Years | 17 (13.2%) | 20 (13.7%) |
| 15 to 19 Years | 13 (10.1%) | 7 (4.8%) |
| 20 to 24 Years | 0 (0.0%) | 7 (4.8%) |
| 25 to 29 Years | 0 (0.0%) | 0 (0.0%) |
| 30 to 34 Years | 0 (0.0%) | 0 (0.0%) |
| 35 to 39 Years | 0 (0.0%) | 0 (0.0%) |
| 40 to 44 Years | 13 (10.1%) | 20 (13.7%) |
| 45 to 49 Years | 20 (15.5%) | 13 (8.9%) |
| 50 to 54 Years | 24 (18.6%) | 0 (0.0%) |
| 55 to 59 Years | 0 (0.0%) | 7 (4.8%) |
| 60 to 64 Years | 0 (0.0%) | 0 (0.0%) |
| 65 to 69 Years | 0 (0.0%) | 4 (2.7%) |
| 70 to 74 Years | 0 (0.0%) | 20 (13.7%) |
| 75 to 79 Years | 9 (7.0%) | 5 (3.4%) |
| 80 to 84 Years | 0 (0.0%) | 0 (0.0%) |
| 85 Years and over | 7 (5.4%) | 0 (0.0%) |
| Total | 129 (100.0%) | 146 (100.0%) |
Families and Households in Prospect
Median Family Size in Prospect
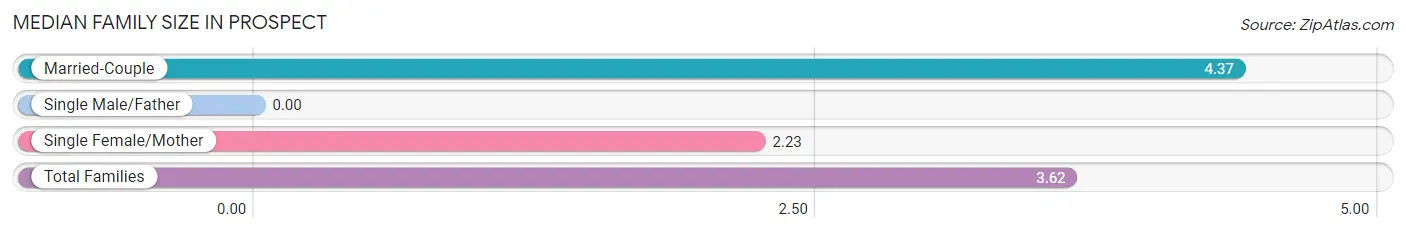
| Family Type | # Families | Family Size |
| Married-Couple | 41 (65.1%) | 4.37 |
| Single Male/Father | 0 (0.0%) | - |
| Single Female/Mother | 22 (34.9%) | 2.23 |
| Total Families | 63 (100.0%) | 3.62 |
Median Household Size in Prospect
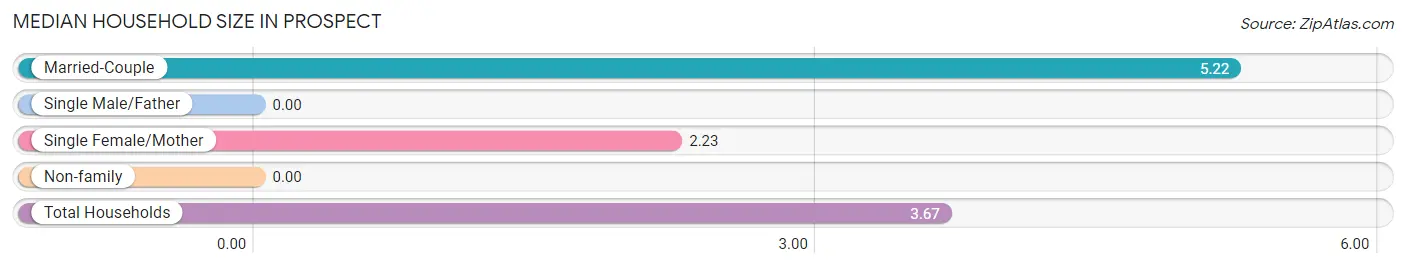
| Household Type | # Households | Household Size |
| Married-Couple | 41 (54.7%) | 5.22 |
| Single Male/Father | 0 (0.0%) | - |
| Single Female/Mother | 22 (29.3%) | 2.23 |
| Non-family | 12 (16.0%) | - |
| Total Households | 75 (100.0%) | 3.67 |
Household Size by Marriage Status in Prospect
Out of a total of 75 households in Prospect, 63 (84.0%) are family households, while 12 (16.0%) are nonfamily households. The most numerous type of family households are 2-person households, comprising 24, and the most common type of nonfamily households are 1-person households, comprising 12.
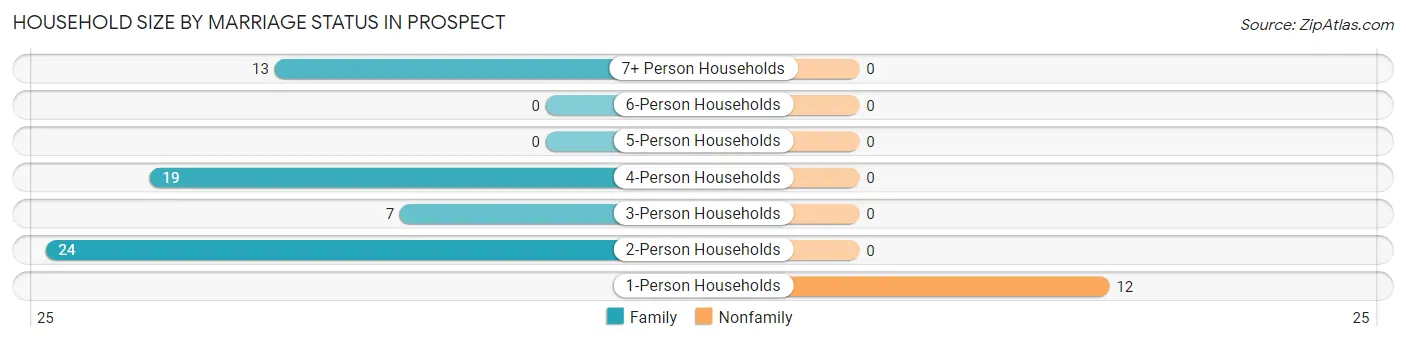
| Household Size | Family Households | Nonfamily Households |
| 1-Person Households | - | 12 (16.0%) |
| 2-Person Households | 24 (32.0%) | 0 (0.0%) |
| 3-Person Households | 7 (9.3%) | 0 (0.0%) |
| 4-Person Households | 19 (25.3%) | 0 (0.0%) |
| 5-Person Households | 0 (0.0%) | 0 (0.0%) |
| 6-Person Households | 0 (0.0%) | 0 (0.0%) |
| 7+ Person Households | 13 (17.3%) | 0 (0.0%) |
| Total | 63 (84.0%) | 12 (16.0%) |
Female Fertility in Prospect
Fertility by Age in Prospect
| Age Bracket | Women with Births | Births / 1,000 Women |
| 15 to 19 years | 0 (0.0%) | 0.0 |
| 20 to 34 years | 0 (0.0%) | 0.0 |
| 35 to 50 years | 0 (0.0%) | 0.0 |
| Total | 0 (0.0%) | 0.0 |
Fertility by Age by Marriage Status in Prospect
| Age Bracket | Married | Unmarried |
| 15 to 19 years | 0 (0.0%) | 0 (0.0%) |
| 20 to 34 years | 0 (0.0%) | 0 (0.0%) |
| 35 to 50 years | 0 (0.0%) | 0 (0.0%) |
| Total | 0 (0.0%) | 0 (0.0%) |
Fertility by Education in Prospect
| Educational Attainment | Women with Births | Births / 1,000 Women |
| Less than High School | 0 (0.0%) | 0.0 |
| High School Diploma | 0 (0.0%) | 0.0 |
| College or Associate's Degree | 0 (0.0%) | 0.0 |
| Bachelor's Degree | 0 (0.0%) | 0.0 |
| Graduate Degree | 0 (0.0%) | 0.0 |
| Total | 0 (0.0%) | 0.0 |
Fertility by Education by Marriage Status in Prospect
| Educational Attainment | Married | Unmarried |
| Less than High School | 0 (0.0%) | 0 (0.0%) |
| High School Diploma | 0 (0.0%) | 0 (0.0%) |
| College or Associate's Degree | 0 (0.0%) | 0 (0.0%) |
| Bachelor's Degree | 0 (0.0%) | 0 (0.0%) |
| Graduate Degree | 0 (0.0%) | 0 (0.0%) |
| Total | 0 (0.0%) | 0 (0.0%) |
Employment Characteristics in Prospect
Employment by Class of Employer in Prospect
Among the 108 employed individuals in Prospect, not-for-profit organizations (37 | 34.3%), private company employees (33 | 30.6%), and local government employees (13 | 12.0%) make up the most common classes of employment.
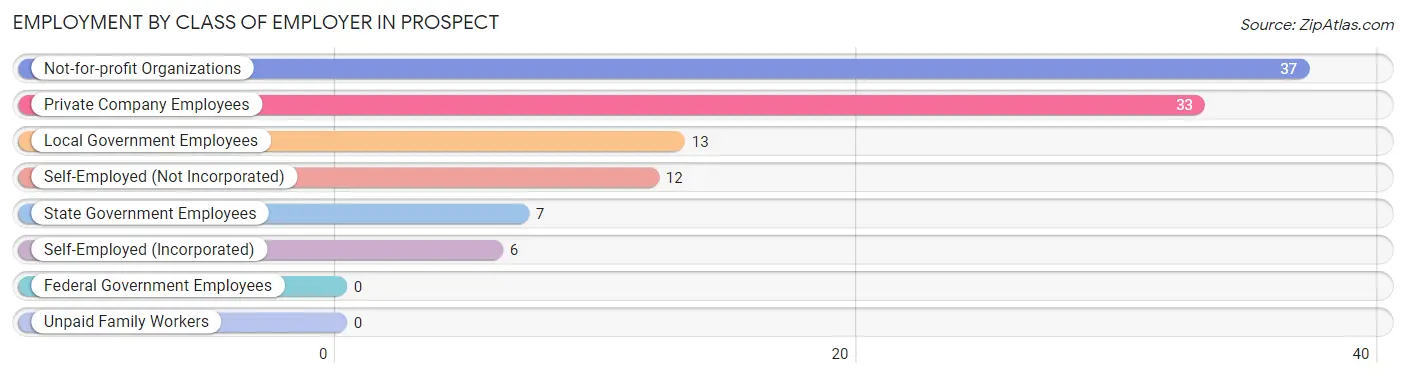
| Employer Class | # Employees | % Employees |
| Private Company Employees | 33 | 30.6% |
| Self-Employed (Incorporated) | 6 | 5.6% |
| Self-Employed (Not Incorporated) | 12 | 11.1% |
| Not-for-profit Organizations | 37 | 34.3% |
| Local Government Employees | 13 | 12.0% |
| State Government Employees | 7 | 6.5% |
| Federal Government Employees | 0 | 0.0% |
| Unpaid Family Workers | 0 | 0.0% |
| Total | 108 | 100.0% |
Employment Status by Age in Prospect
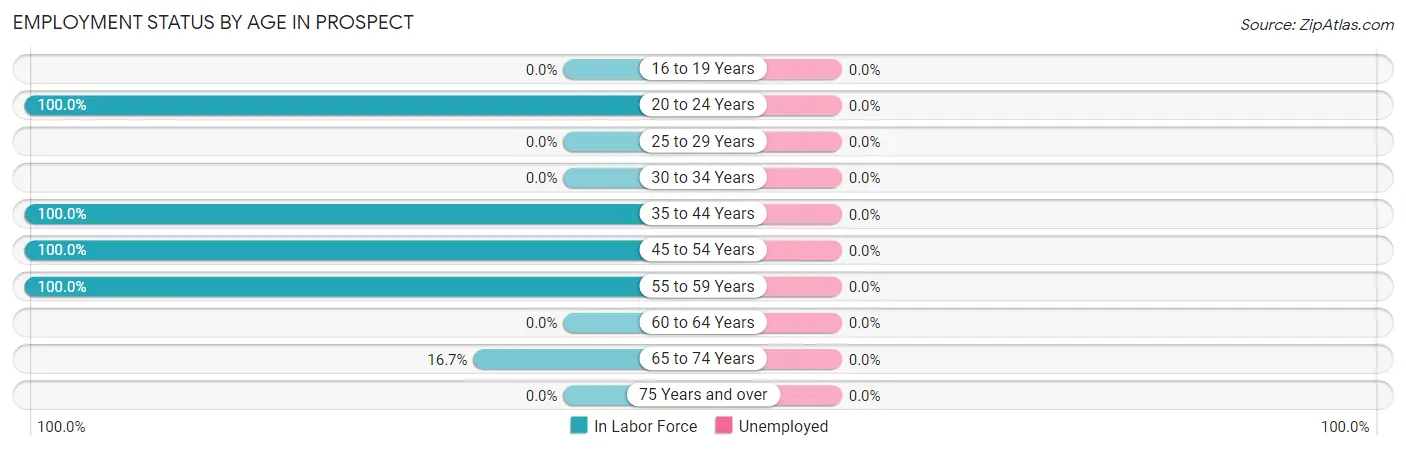
| Age Bracket | In Labor Force | Unemployed |
| 16 to 19 Years | 0 (0.0%) | 0 (0.0%) |
| 20 to 24 Years | 7 (100.0%) | 0 (0.0%) |
| 25 to 29 Years | 0 (0.0%) | 0 (0.0%) |
| 30 to 34 Years | 0 (0.0%) | 0 (0.0%) |
| 35 to 44 Years | 33 (100.0%) | 0 (0.0%) |
| 45 to 54 Years | 57 (100.0%) | 0 (0.0%) |
| 55 to 59 Years | 7 (100.0%) | 0 (0.0%) |
| 60 to 64 Years | 0 (0.0%) | 0 (0.0%) |
| 65 to 74 Years | 4 (16.7%) | 0 (0.0%) |
| 75 Years and over | 0 (0.0%) | 0 (0.0%) |
| Total | 108 (69.2%) | 0 (0.0%) |
Employment Status by Educational Attainment in Prospect
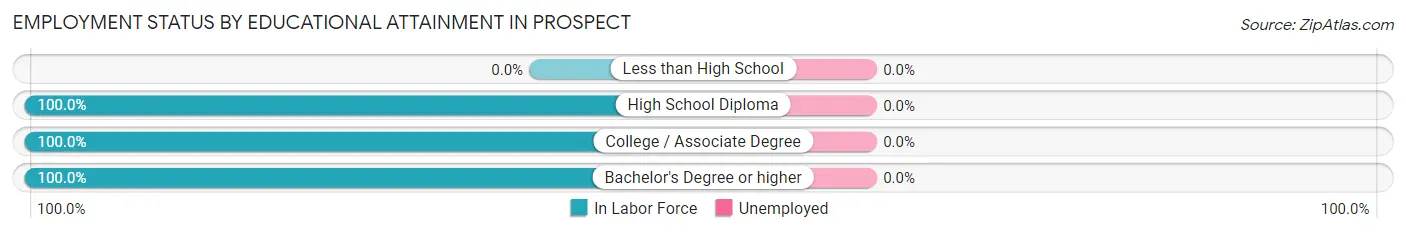
| Educational Attainment | In Labor Force | Unemployed |
| Less than High School | 0 (0.0%) | 0 (0.0%) |
| High School Diploma | 26 (100.0%) | 0 (0.0%) |
| College / Associate Degree | 52 (100.0%) | 0 (0.0%) |
| Bachelor's Degree or higher | 19 (100.0%) | 0 (0.0%) |
| Total | 97 (100.0%) | 0 (0.0%) |
Employment Occupations by Sex in Prospect
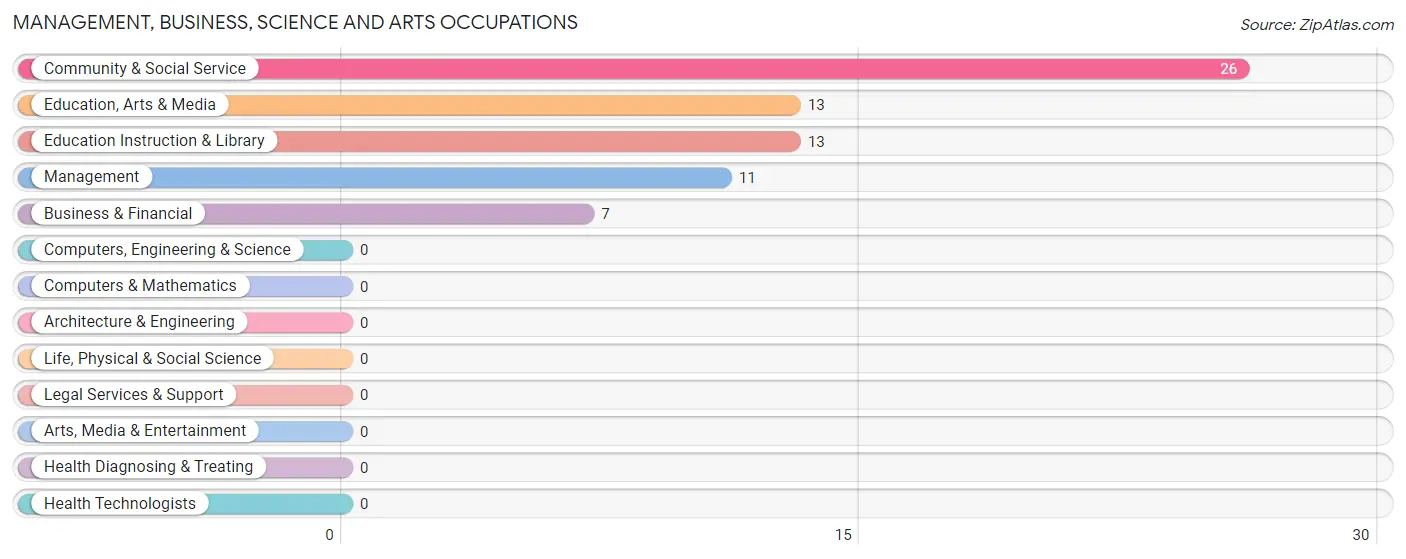
Management, Business, Science and Arts Occupations
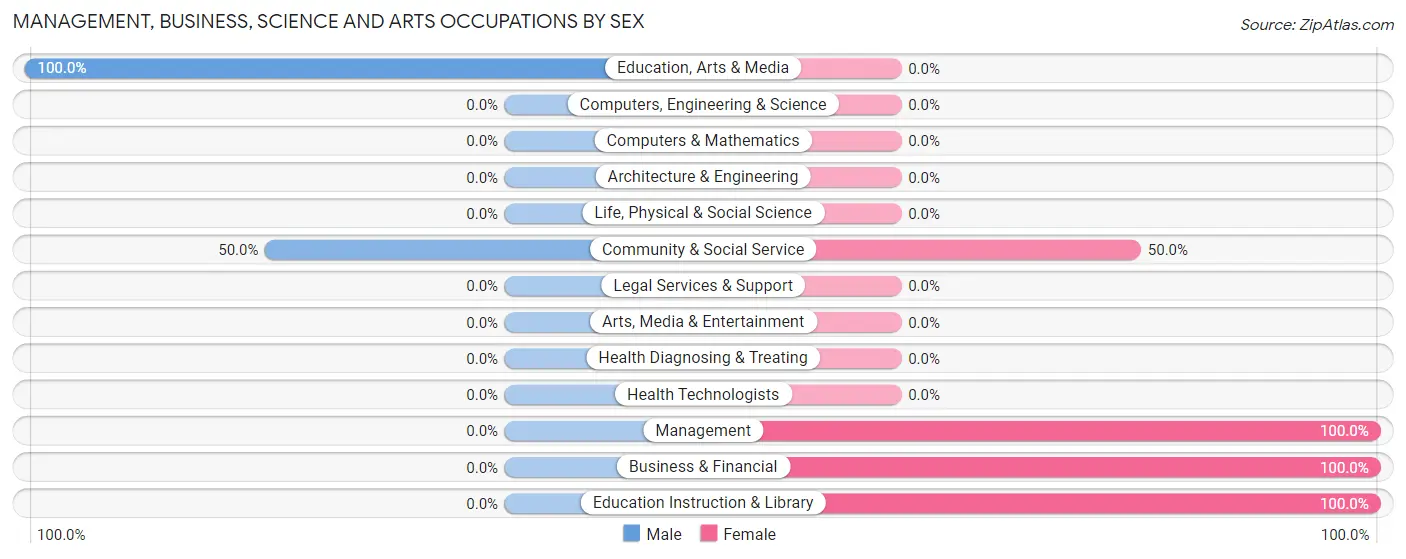
The most common Management, Business, Science and Arts occupations in Prospect are Community & Social Service (26 | 24.1%), Education, Arts & Media (13 | 12.0%), Education Instruction & Library (13 | 12.0%), Management (11 | 10.2%), and Business & Financial (7 | 6.5%).
Management, Business, Science and Arts Occupations by Sex
Within the Management, Business, Science and Arts occupations in Prospect, the most male-oriented occupations are Education, Arts & Media (100.0%), and Community & Social Service (50.0%), while the most female-oriented occupations are Management (100.0%), Business & Financial (100.0%), and Education Instruction & Library (100.0%).
| Occupation | Male | Female |
| Management | 0 (0.0%) | 11 (100.0%) |
| Business & Financial | 0 (0.0%) | 7 (100.0%) |
| Computers, Engineering & Science | 0 (0.0%) | 0 (0.0%) |
| Computers & Mathematics | 0 (0.0%) | 0 (0.0%) |
| Architecture & Engineering | 0 (0.0%) | 0 (0.0%) |
| Life, Physical & Social Science | 0 (0.0%) | 0 (0.0%) |
| Community & Social Service | 13 (50.0%) | 13 (50.0%) |
| Education, Arts & Media | 13 (100.0%) | 0 (0.0%) |
| Legal Services & Support | 0 (0.0%) | 0 (0.0%) |
| Education Instruction & Library | 0 (0.0%) | 13 (100.0%) |
| Arts, Media & Entertainment | 0 (0.0%) | 0 (0.0%) |
| Health Diagnosing & Treating | 0 (0.0%) | 0 (0.0%) |
| Health Technologists | 0 (0.0%) | 0 (0.0%) |
| Total (Category) | 13 (29.5%) | 31 (70.5%) |
| Total (Overall) | 57 (52.8%) | 51 (47.2%) |
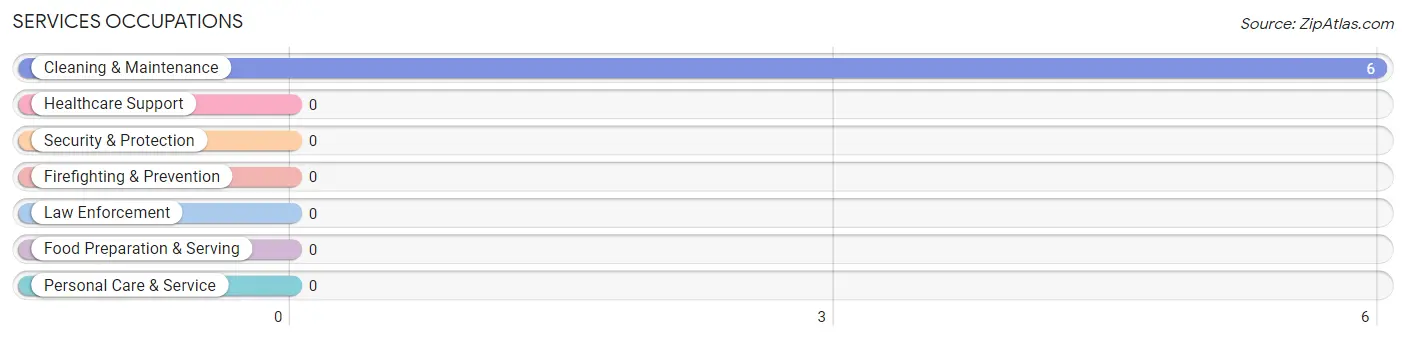
Services Occupations
The most common Services occupations in Prospect are , and Cleaning & Maintenance (6 | 5.6%).
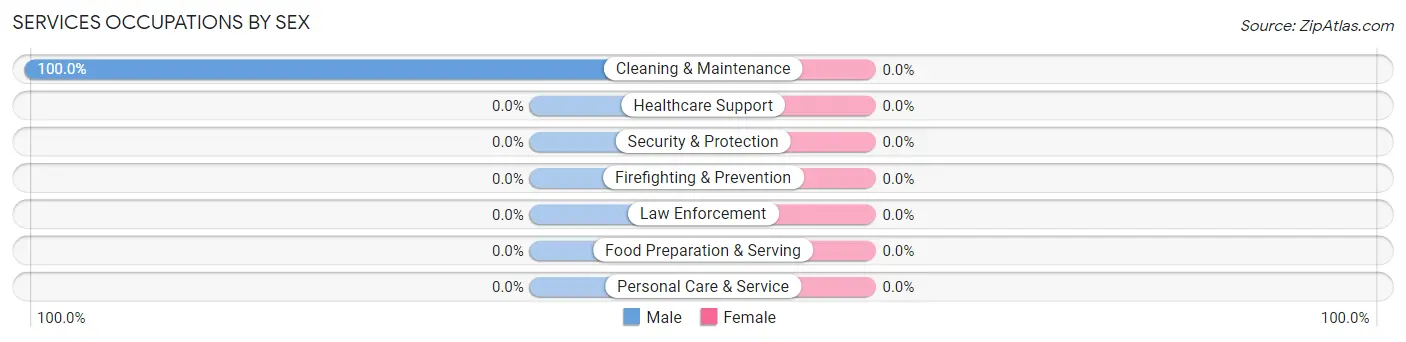
Services Occupations by Sex
| Occupation | Male | Female |
| Healthcare Support | 0 (0.0%) | 0 (0.0%) |
| Security & Protection | 0 (0.0%) | 0 (0.0%) |
| Firefighting & Prevention | 0 (0.0%) | 0 (0.0%) |
| Law Enforcement | 0 (0.0%) | 0 (0.0%) |
| Food Preparation & Serving | 0 (0.0%) | 0 (0.0%) |
| Cleaning & Maintenance | 6 (100.0%) | 0 (0.0%) |
| Personal Care & Service | 0 (0.0%) | 0 (0.0%) |
| Total (Category) | 6 (100.0%) | 0 (0.0%) |
| Total (Overall) | 57 (52.8%) | 51 (47.2%) |
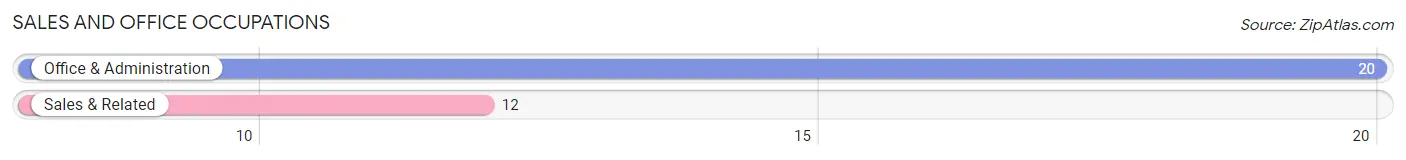
Sales and Office Occupations
The most common Sales and Office occupations in Prospect are Office & Administration (20 | 18.5%), and Sales & Related (12 | 11.1%).
Sales and Office Occupations by Sex
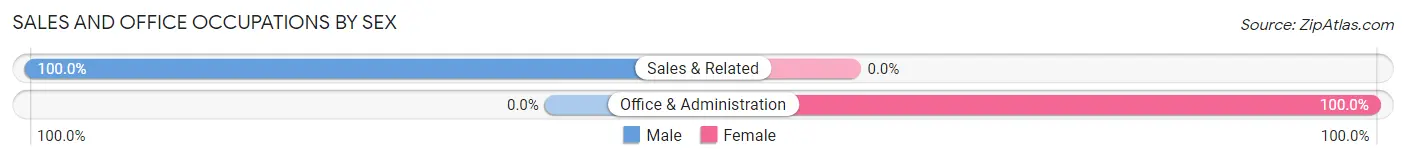
| Occupation | Male | Female |
| Sales & Related | 12 (100.0%) | 0 (0.0%) |
| Office & Administration | 0 (0.0%) | 20 (100.0%) |
| Total (Category) | 12 (37.5%) | 20 (62.5%) |
| Total (Overall) | 57 (52.8%) | 51 (47.2%) |
Natural Resources, Construction and Maintenance Occupations
The most common Natural Resources, Construction and Maintenance occupations in Prospect are , and Installation, Maintenance & Repair (7 | 6.5%).
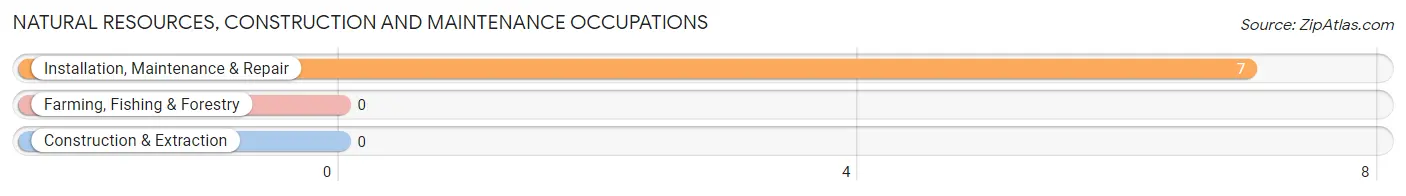
Natural Resources, Construction and Maintenance Occupations by Sex
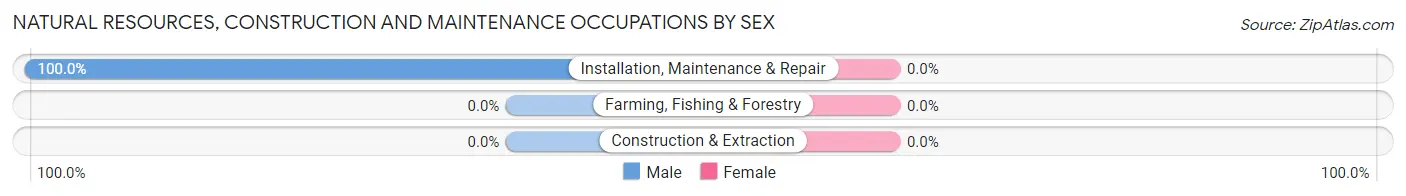
| Occupation | Male | Female |
| Farming, Fishing & Forestry | 0 (0.0%) | 0 (0.0%) |
| Construction & Extraction | 0 (0.0%) | 0 (0.0%) |
| Installation, Maintenance & Repair | 7 (100.0%) | 0 (0.0%) |
| Total (Category) | 7 (100.0%) | 0 (0.0%) |
| Total (Overall) | 57 (52.8%) | 51 (47.2%) |
Production, Transportation and Moving Occupations
The most common Production, Transportation and Moving occupations in Prospect are Production (12 | 11.1%), and Material Moving (7 | 6.5%).
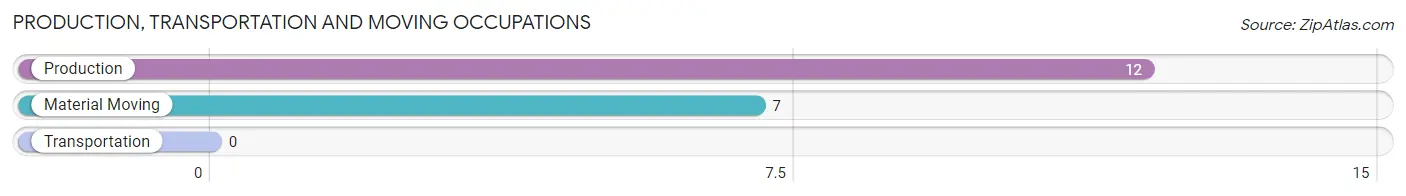
Production, Transportation and Moving Occupations by Sex
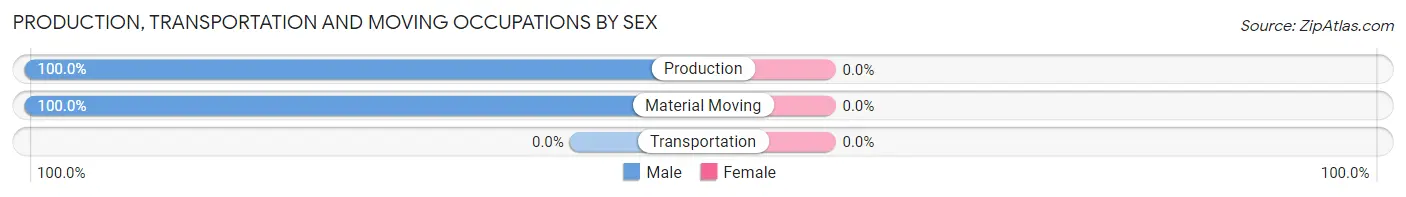
| Occupation | Male | Female |
| Production | 12 (100.0%) | 0 (0.0%) |
| Transportation | 0 (0.0%) | 0 (0.0%) |
| Material Moving | 7 (100.0%) | 0 (0.0%) |
| Total (Category) | 19 (100.0%) | 0 (0.0%) |
| Total (Overall) | 57 (52.8%) | 51 (47.2%) |
Employment Industries by Sex in Prospect
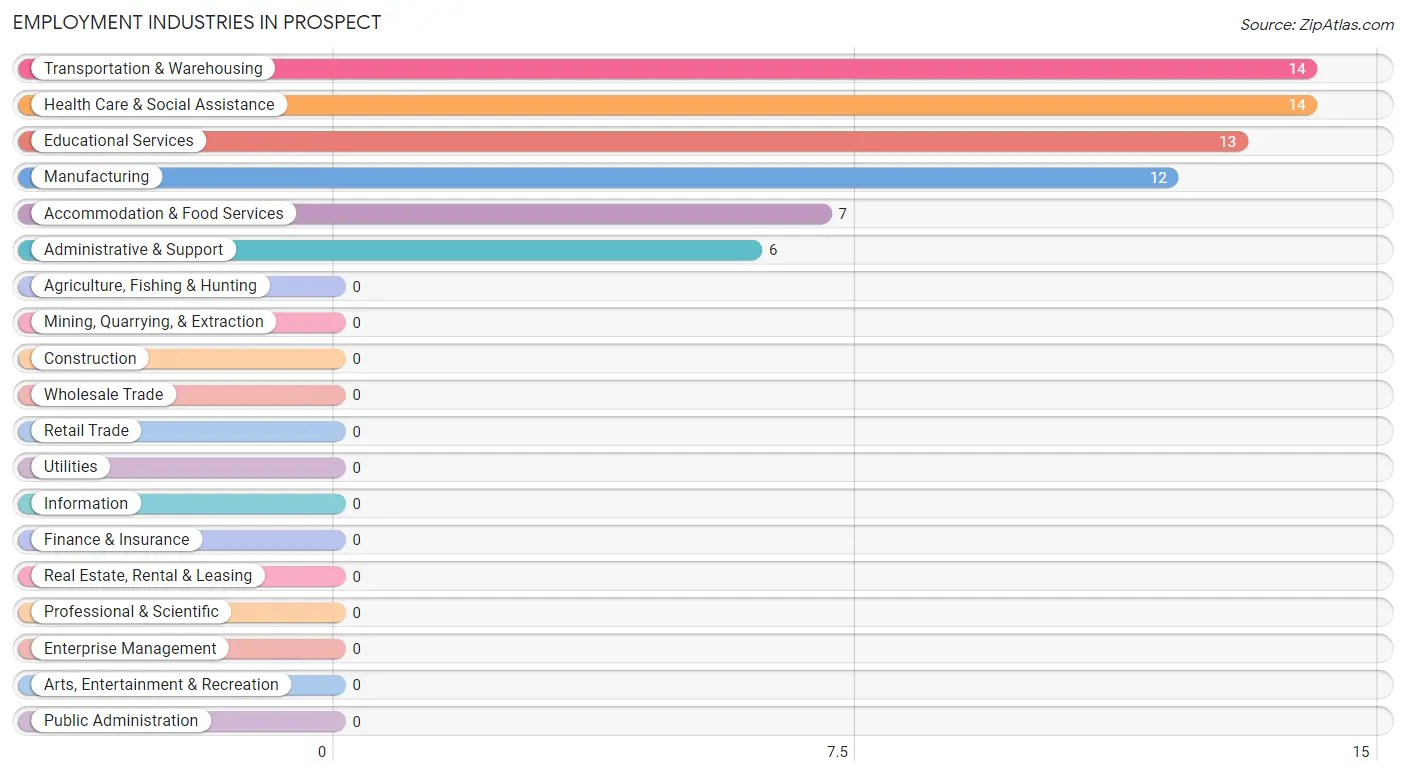
Employment Industries in Prospect
The major employment industries in Prospect include Transportation & Warehousing (14 | 13.0%), Health Care & Social Assistance (14 | 13.0%), Educational Services (13 | 12.0%), Manufacturing (12 | 11.1%), and Accommodation & Food Services (7 | 6.5%).
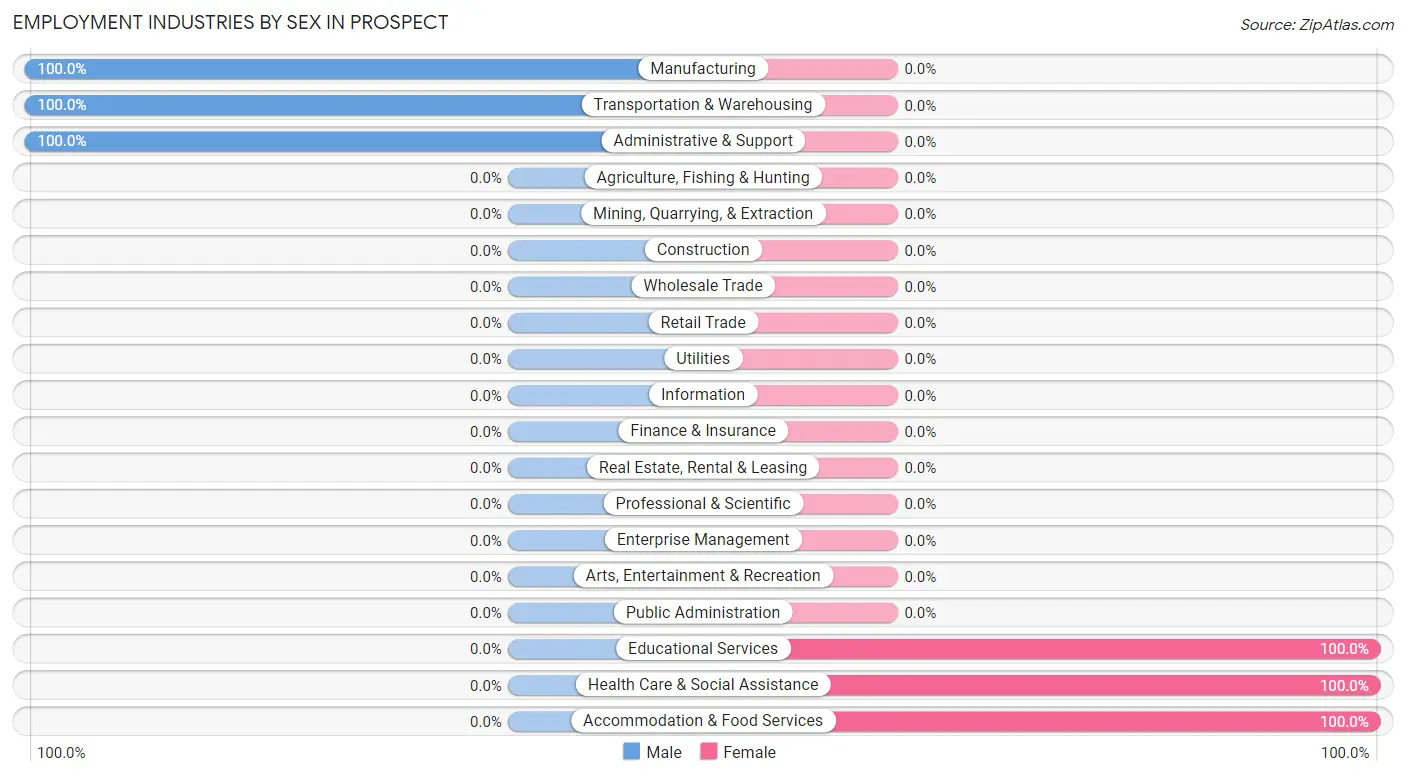
Employment Industries by Sex in Prospect
The Prospect industries that see more men than women are Manufacturing (100.0%), Transportation & Warehousing (100.0%), and Administrative & Support (100.0%), whereas the industries that tend to have a higher number of women are Educational Services (100.0%), Health Care & Social Assistance (100.0%), and Accommodation & Food Services (100.0%).
| Industry | Male | Female |
| Agriculture, Fishing & Hunting | 0 (0.0%) | 0 (0.0%) |
| Mining, Quarrying, & Extraction | 0 (0.0%) | 0 (0.0%) |
| Construction | 0 (0.0%) | 0 (0.0%) |
| Manufacturing | 12 (100.0%) | 0 (0.0%) |
| Wholesale Trade | 0 (0.0%) | 0 (0.0%) |
| Retail Trade | 0 (0.0%) | 0 (0.0%) |
| Transportation & Warehousing | 14 (100.0%) | 0 (0.0%) |
| Utilities | 0 (0.0%) | 0 (0.0%) |
| Information | 0 (0.0%) | 0 (0.0%) |
| Finance & Insurance | 0 (0.0%) | 0 (0.0%) |
| Real Estate, Rental & Leasing | 0 (0.0%) | 0 (0.0%) |
| Professional & Scientific | 0 (0.0%) | 0 (0.0%) |
| Enterprise Management | 0 (0.0%) | 0 (0.0%) |
| Administrative & Support | 6 (100.0%) | 0 (0.0%) |
| Educational Services | 0 (0.0%) | 13 (100.0%) |
| Health Care & Social Assistance | 0 (0.0%) | 14 (100.0%) |
| Arts, Entertainment & Recreation | 0 (0.0%) | 0 (0.0%) |
| Accommodation & Food Services | 0 (0.0%) | 7 (100.0%) |
| Public Administration | 0 (0.0%) | 0 (0.0%) |
| Total | 57 (52.8%) | 51 (47.2%) |
Education in Prospect
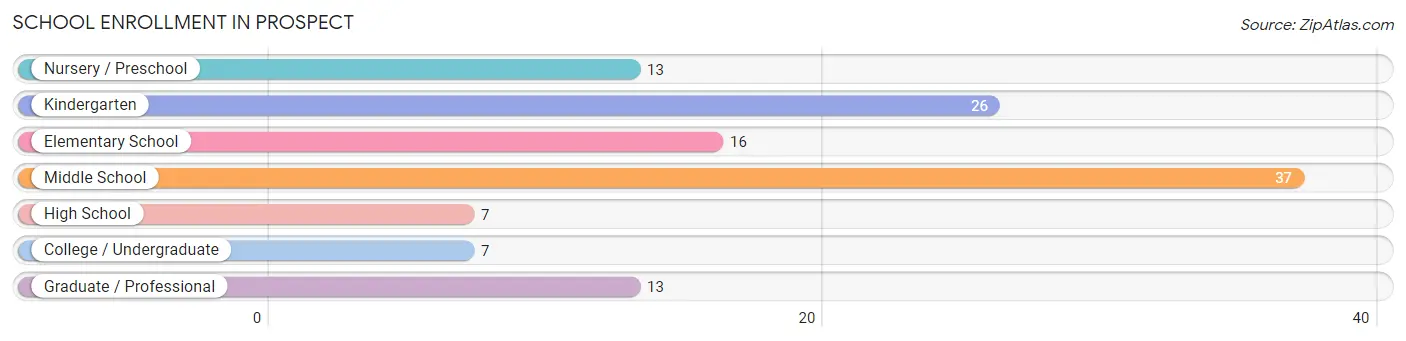
School Enrollment in Prospect
The most common levels of schooling among the 119 students in Prospect are middle school (37 | 31.1%), kindergarten (26 | 21.8%), and elementary school (16 | 13.5%).
| School Level | # Students | % Students |
| Nursery / Preschool | 13 | 10.9% |
| Kindergarten | 26 | 21.8% |
| Elementary School | 16 | 13.5% |
| Middle School | 37 | 31.1% |
| High School | 7 | 5.9% |
| College / Undergraduate | 7 | 5.9% |
| Graduate / Professional | 13 | 10.9% |
| Total | 119 | 100.0% |
School Enrollment by Age by Funding Source in Prospect
Out of a total of 119 students who are enrolled in schools in Prospect, 20 (16.8%) attend a private institution, while the remaining 99 (83.2%) are enrolled in public schools. The age group of 20 to 24 year olds has the highest likelihood of being enrolled in private schools, with 7 (100.0% in the age bracket) enrolled. Conversely, the age group of 3 to 4 year olds has the lowest likelihood of being enrolled in a private school, with 13 (100.0% in the age bracket) attending a public institution.
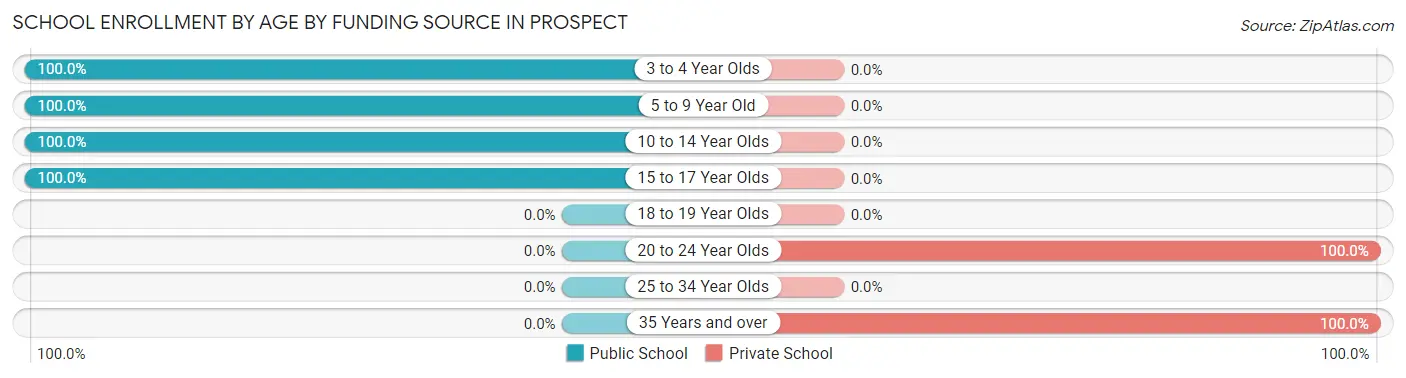
| Age Bracket | Public School | Private School |
| 3 to 4 Year Olds | 13 (100.0%) | 0 (0.0%) |
| 5 to 9 Year Old | 42 (100.0%) | 0 (0.0%) |
| 10 to 14 Year Olds | 37 (100.0%) | 0 (0.0%) |
| 15 to 17 Year Olds | 7 (100.0%) | 0 (0.0%) |
| 18 to 19 Year Olds | 0 (0.0%) | 0 (0.0%) |
| 20 to 24 Year Olds | 0 (0.0%) | 7 (100.0%) |
| 25 to 34 Year Olds | 0 (0.0%) | 0 (0.0%) |
| 35 Years and over | 0 (0.0%) | 13 (100.0%) |
| Total | 99 (83.2%) | 20 (16.8%) |
Educational Attainment by Field of Study in Prospect
Liberal arts & history (13 | 48.1%), bio, nature & agricultural (6 | 22.2%), physical & health sciences (4 | 14.8%), and multidisciplinary studies (4 | 14.8%) are the most common fields of study among 27 individuals in Prospect who have obtained a bachelor's degree or higher.
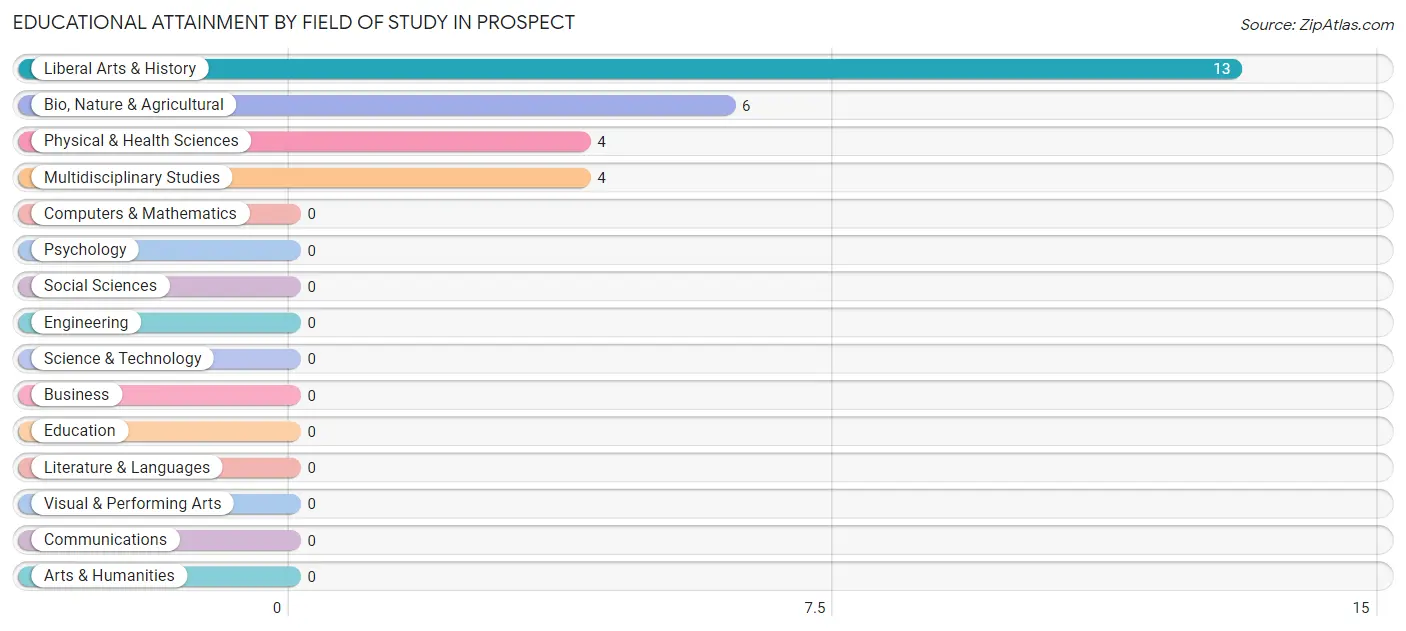
| Field of Study | # Graduates | % Graduates |
| Computers & Mathematics | 0 | 0.0% |
| Bio, Nature & Agricultural | 6 | 22.2% |
| Physical & Health Sciences | 4 | 14.8% |
| Psychology | 0 | 0.0% |
| Social Sciences | 0 | 0.0% |
| Engineering | 0 | 0.0% |
| Multidisciplinary Studies | 4 | 14.8% |
| Science & Technology | 0 | 0.0% |
| Business | 0 | 0.0% |
| Education | 0 | 0.0% |
| Literature & Languages | 0 | 0.0% |
| Liberal Arts & History | 13 | 48.1% |
| Visual & Performing Arts | 0 | 0.0% |
| Communications | 0 | 0.0% |
| Arts & Humanities | 0 | 0.0% |
| Total | 27 | 100.0% |
Transportation & Commute in Prospect
Vehicle Availability by Sex in Prospect
The most prevalent vehicle ownership categories in Prospect are males with 3 vehicles (20, accounting for 35.1%) and females with 3 vehicles (26, making up 39.2%).
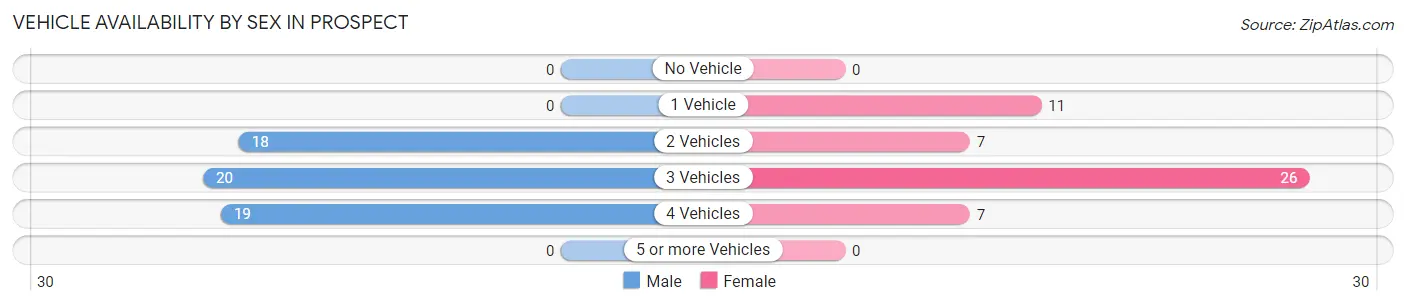
| Vehicles Available | Male | Female |
| No Vehicle | 0 (0.0%) | 0 (0.0%) |
| 1 Vehicle | 0 (0.0%) | 11 (21.6%) |
| 2 Vehicles | 18 (31.6%) | 7 (13.7%) |
| 3 Vehicles | 20 (35.1%) | 26 (51.0%) |
| 4 Vehicles | 19 (33.3%) | 7 (13.7%) |
| 5 or more Vehicles | 0 (0.0%) | 0 (0.0%) |
| Total | 57 (100.0%) | 51 (100.0%) |
Commute Time in Prospect
The most frequently occuring commute durations in Prospect are 30 to 34 minutes (35 commuters, 32.4%), less than 5 minutes (26 commuters, 24.1%), and 20 to 24 minutes (19 commuters, 17.6%).
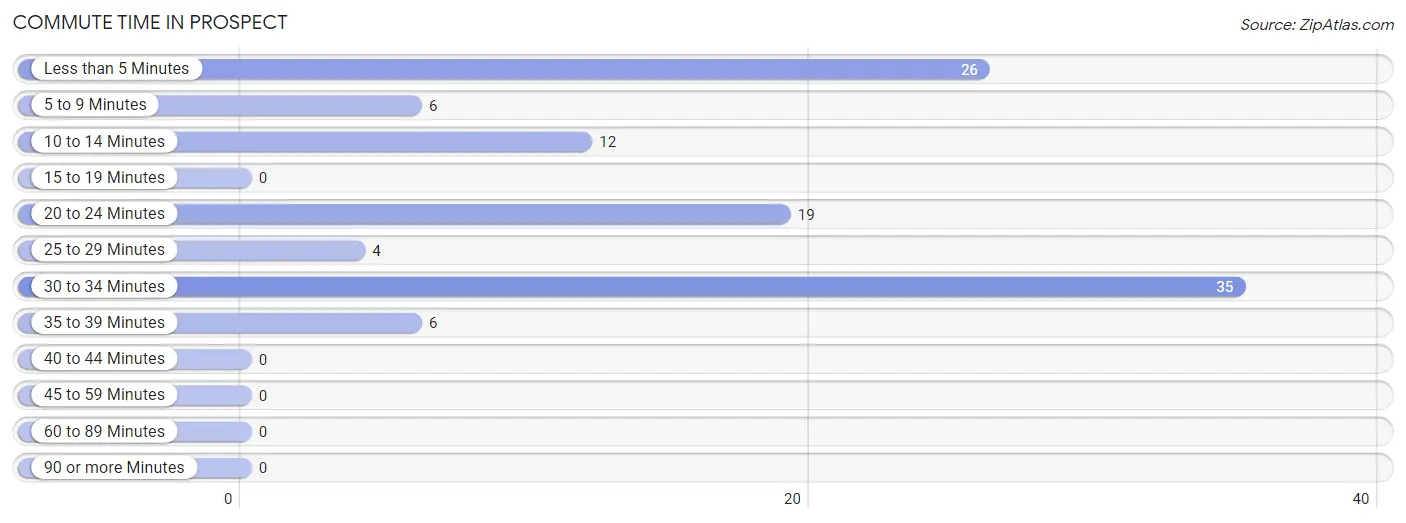
| Commute Time | # Commuters | % Commuters |
| Less than 5 Minutes | 26 | 24.1% |
| 5 to 9 Minutes | 6 | 5.6% |
| 10 to 14 Minutes | 12 | 11.1% |
| 15 to 19 Minutes | 0 | 0.0% |
| 20 to 24 Minutes | 19 | 17.6% |
| 25 to 29 Minutes | 4 | 3.7% |
| 30 to 34 Minutes | 35 | 32.4% |
| 35 to 39 Minutes | 6 | 5.6% |
| 40 to 44 Minutes | 0 | 0.0% |
| 45 to 59 Minutes | 0 | 0.0% |
| 60 to 89 Minutes | 0 | 0.0% |
| 90 or more Minutes | 0 | 0.0% |
Commute Time by Sex in Prospect
The most common commute times in Prospect are 20 to 24 minutes (19 commuters, 33.3%) for males and 30 to 34 minutes (28 commuters, 54.9%) for females.
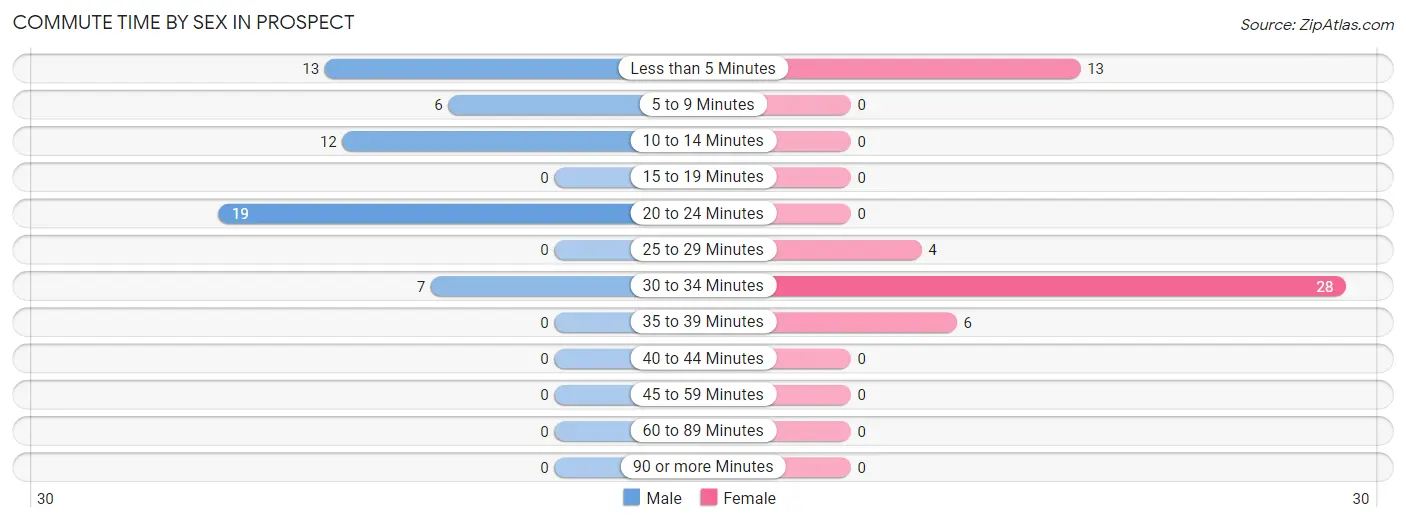
| Commute Time | Male | Female |
| Less than 5 Minutes | 13 (22.8%) | 13 (25.5%) |
| 5 to 9 Minutes | 6 (10.5%) | 0 (0.0%) |
| 10 to 14 Minutes | 12 (21.0%) | 0 (0.0%) |
| 15 to 19 Minutes | 0 (0.0%) | 0 (0.0%) |
| 20 to 24 Minutes | 19 (33.3%) | 0 (0.0%) |
| 25 to 29 Minutes | 0 (0.0%) | 4 (7.8%) |
| 30 to 34 Minutes | 7 (12.3%) | 28 (54.9%) |
| 35 to 39 Minutes | 0 (0.0%) | 6 (11.8%) |
| 40 to 44 Minutes | 0 (0.0%) | 0 (0.0%) |
| 45 to 59 Minutes | 0 (0.0%) | 0 (0.0%) |
| 60 to 89 Minutes | 0 (0.0%) | 0 (0.0%) |
| 90 or more Minutes | 0 (0.0%) | 0 (0.0%) |
Time of Departure to Work by Sex in Prospect
The most frequent times of departure to work in Prospect are 6:00 AM to 6:29 AM (20, 35.1%) for males and 7:00 AM to 7:29 AM (14, 27.5%) for females.
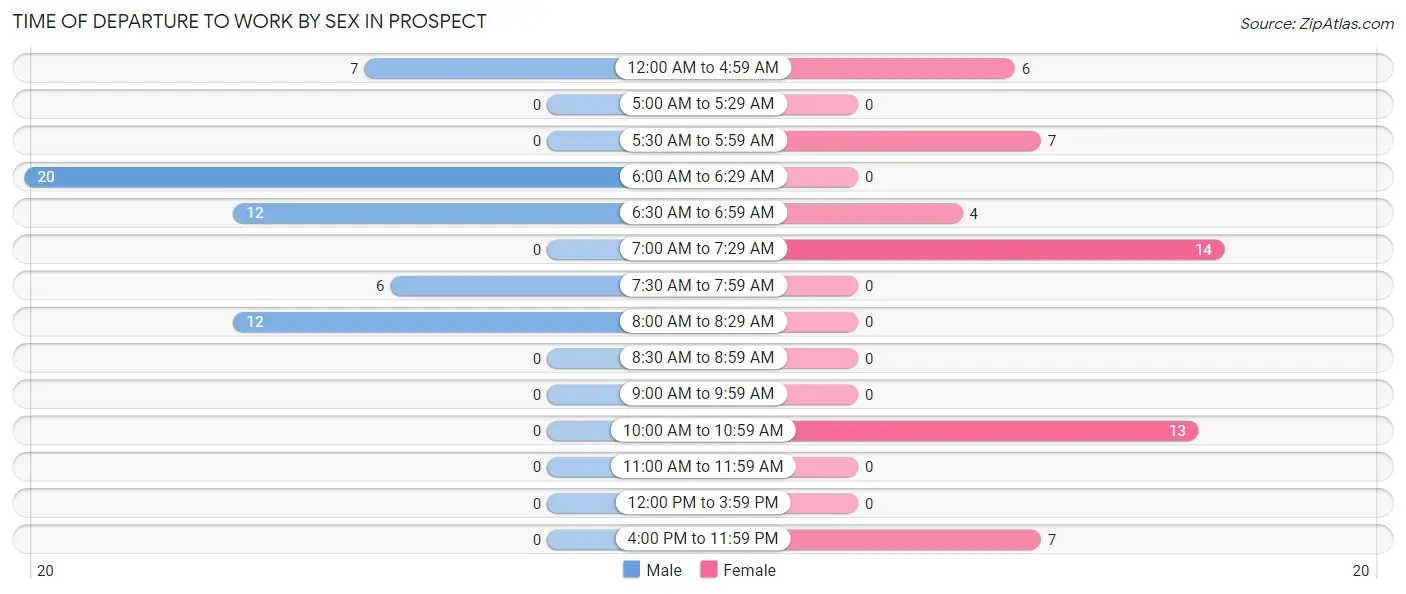
| Time of Departure | Male | Female |
| 12:00 AM to 4:59 AM | 7 (12.3%) | 6 (11.8%) |
| 5:00 AM to 5:29 AM | 0 (0.0%) | 0 (0.0%) |
| 5:30 AM to 5:59 AM | 0 (0.0%) | 7 (13.7%) |
| 6:00 AM to 6:29 AM | 20 (35.1%) | 0 (0.0%) |
| 6:30 AM to 6:59 AM | 12 (21.0%) | 4 (7.8%) |
| 7:00 AM to 7:29 AM | 0 (0.0%) | 14 (27.5%) |
| 7:30 AM to 7:59 AM | 6 (10.5%) | 0 (0.0%) |
| 8:00 AM to 8:29 AM | 12 (21.0%) | 0 (0.0%) |
| 8:30 AM to 8:59 AM | 0 (0.0%) | 0 (0.0%) |
| 9:00 AM to 9:59 AM | 0 (0.0%) | 0 (0.0%) |
| 10:00 AM to 10:59 AM | 0 (0.0%) | 13 (25.5%) |
| 11:00 AM to 11:59 AM | 0 (0.0%) | 0 (0.0%) |
| 12:00 PM to 3:59 PM | 0 (0.0%) | 0 (0.0%) |
| 4:00 PM to 11:59 PM | 0 (0.0%) | 7 (13.7%) |
| Total | 57 (100.0%) | 51 (100.0%) |
Housing Occupancy in Prospect
Occupancy by Ownership in Prospect
Of the total 75 dwellings in Prospect, owner-occupied units account for 62 (82.7%), while renter-occupied units make up 13 (17.3%).
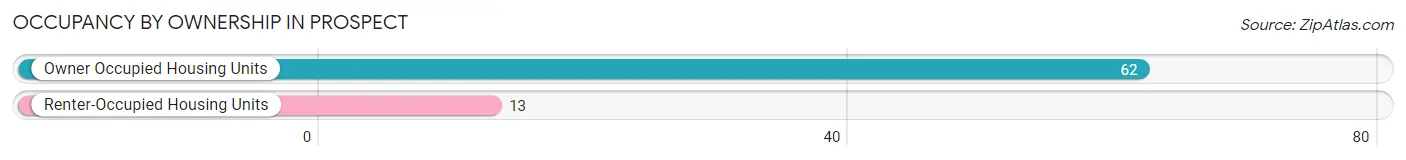
| Occupancy | # Housing Units | % Housing Units |
| Owner Occupied Housing Units | 62 | 82.7% |
| Renter-Occupied Housing Units | 13 | 17.3% |
| Total Occupied Housing Units | 75 | 100.0% |
Occupancy by Household Size in Prospect
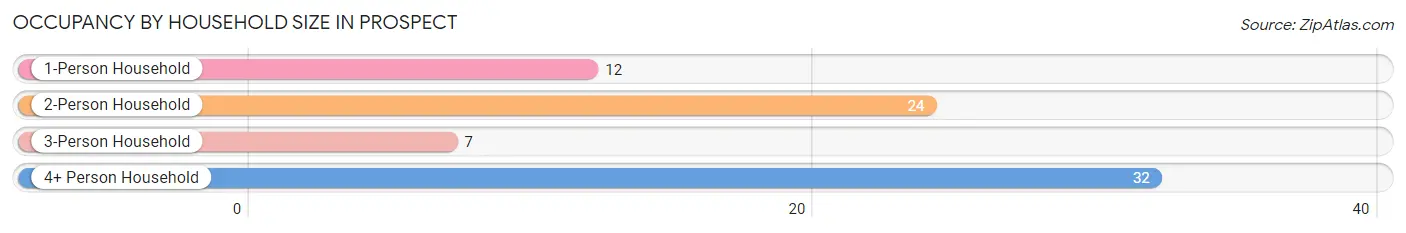
| Household Size | # Housing Units | % Housing Units |
| 1-Person Household | 12 | 16.0% |
| 2-Person Household | 24 | 32.0% |
| 3-Person Household | 7 | 9.3% |
| 4+ Person Household | 32 | 42.7% |
| Total Housing Units | 75 | 100.0% |
Occupancy by Ownership by Household Size in Prospect
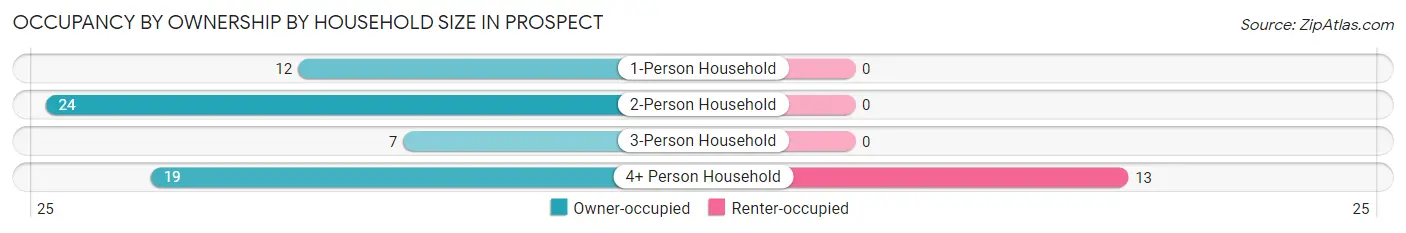
| Household Size | Owner-occupied | Renter-occupied |
| 1-Person Household | 12 (100.0%) | 0 (0.0%) |
| 2-Person Household | 24 (100.0%) | 0 (0.0%) |
| 3-Person Household | 7 (100.0%) | 0 (0.0%) |
| 4+ Person Household | 19 (59.4%) | 13 (40.6%) |
| Total Housing Units | 62 (82.7%) | 13 (17.3%) |
Occupancy by Educational Attainment in Prospect
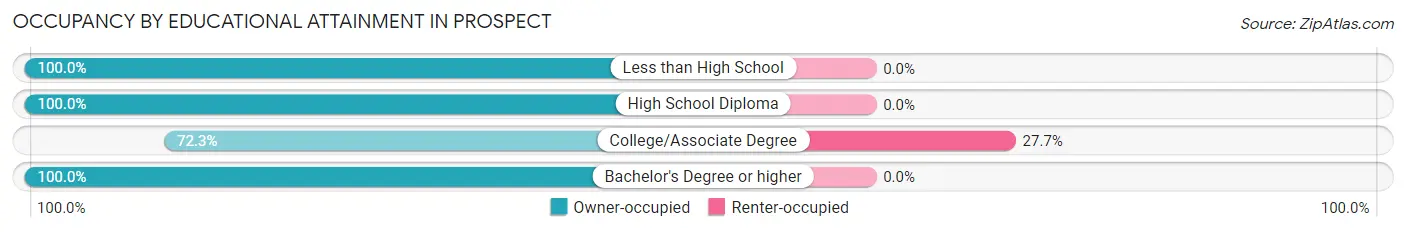
| Household Size | Owner-occupied | Renter-occupied |
| Less than High School | 11 (100.0%) | 0 (0.0%) |
| High School Diploma | 7 (100.0%) | 0 (0.0%) |
| College/Associate Degree | 34 (72.3%) | 13 (27.7%) |
| Bachelor's Degree or higher | 10 (100.0%) | 0 (0.0%) |
Occupancy by Age of Householder in Prospect
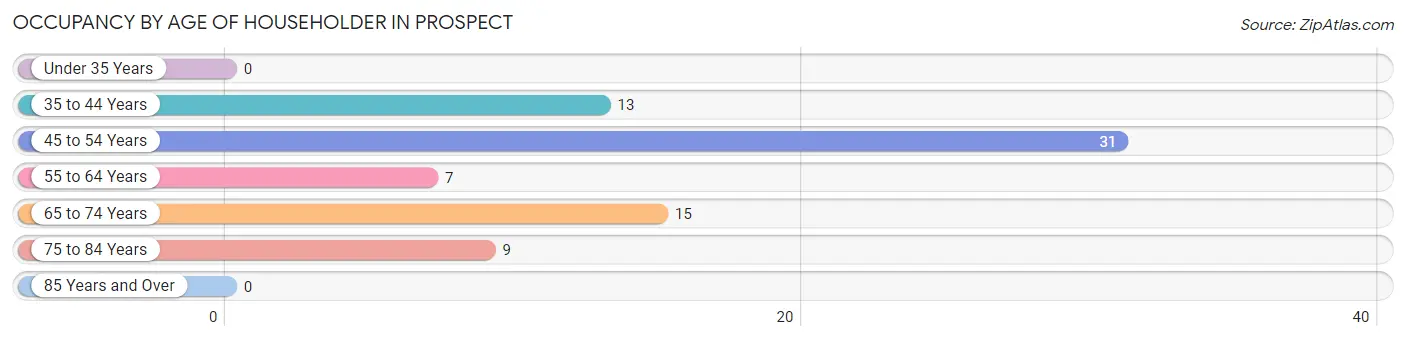
| Age Bracket | # Households | % Households |
| Under 35 Years | 0 | 0.0% |
| 35 to 44 Years | 13 | 17.3% |
| 45 to 54 Years | 31 | 41.3% |
| 55 to 64 Years | 7 | 9.3% |
| 65 to 74 Years | 15 | 20.0% |
| 75 to 84 Years | 9 | 12.0% |
| 85 Years and Over | 0 | 0.0% |
| Total | 75 | 100.0% |
Housing Finances in Prospect
Median Income by Occupancy in Prospect
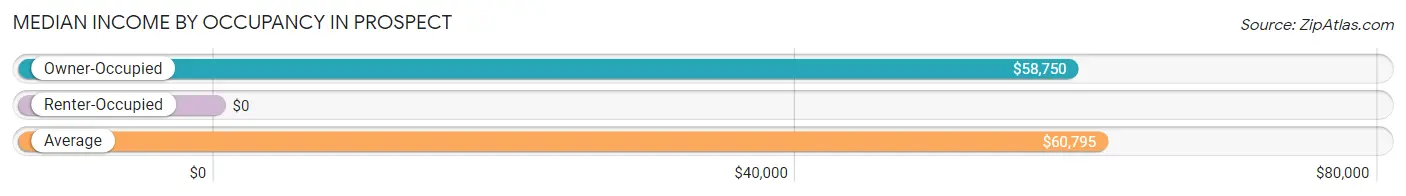
| Occupancy Type | # Households | Median Income |
| Owner-Occupied | 62 (82.7%) | $58,750 |
| Renter-Occupied | 13 (17.3%) | $0 |
| Average | 75 (100.0%) | $60,795 |
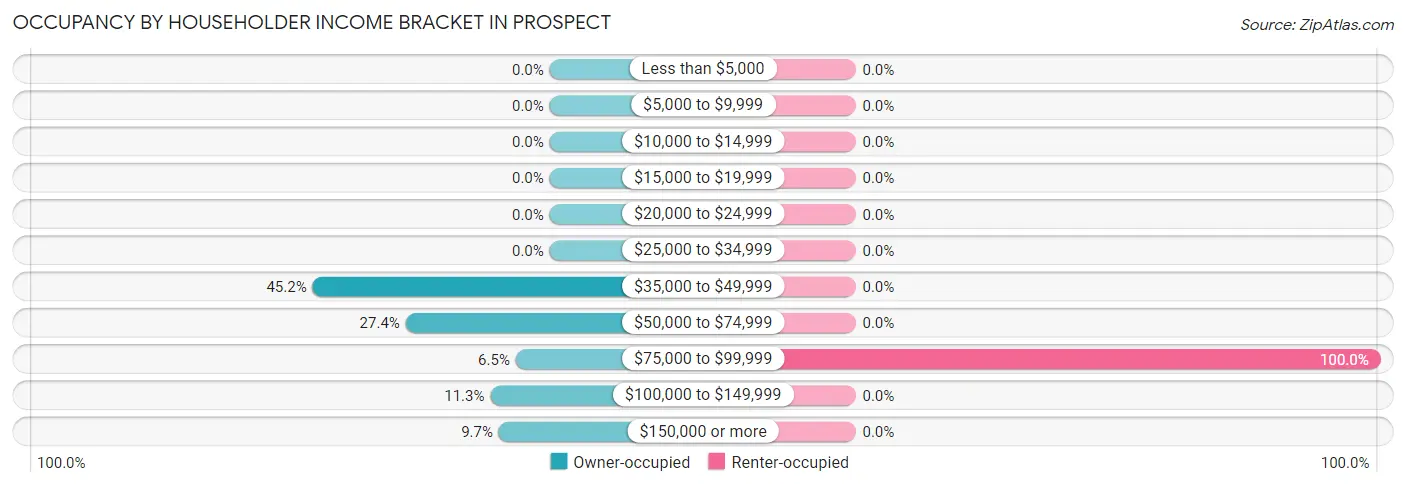
Occupancy by Householder Income Bracket in Prospect
| Income Bracket | Owner-occupied | Renter-occupied |
| Less than $5,000 | 0 (0.0%) | 0 (0.0%) |
| $5,000 to $9,999 | 0 (0.0%) | 0 (0.0%) |
| $10,000 to $14,999 | 0 (0.0%) | 0 (0.0%) |
| $15,000 to $19,999 | 0 (0.0%) | 0 (0.0%) |
| $20,000 to $24,999 | 0 (0.0%) | 0 (0.0%) |
| $25,000 to $34,999 | 0 (0.0%) | 0 (0.0%) |
| $35,000 to $49,999 | 28 (45.2%) | 0 (0.0%) |
| $50,000 to $74,999 | 17 (27.4%) | 0 (0.0%) |
| $75,000 to $99,999 | 4 (6.5%) | 13 (100.0%) |
| $100,000 to $149,999 | 7 (11.3%) | 0 (0.0%) |
| $150,000 or more | 6 (9.7%) | 0 (0.0%) |
| Total | 62 (100.0%) | 13 (100.0%) |
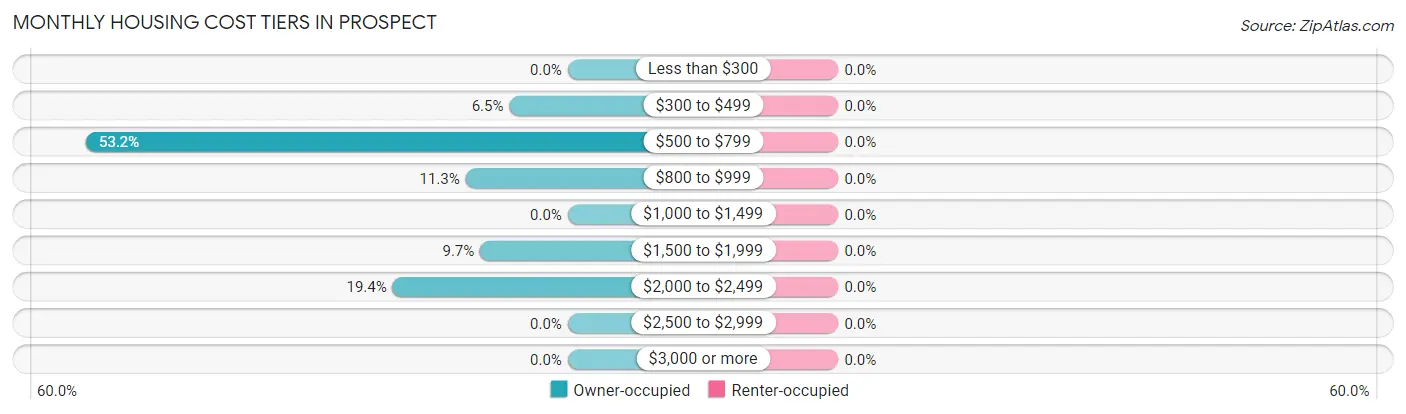
Monthly Housing Cost Tiers in Prospect
| Monthly Cost | Owner-occupied | Renter-occupied |
| Less than $300 | 0 (0.0%) | 0 (0.0%) |
| $300 to $499 | 4 (6.5%) | 0 (0.0%) |
| $500 to $799 | 33 (53.2%) | 0 (0.0%) |
| $800 to $999 | 7 (11.3%) | 0 (0.0%) |
| $1,000 to $1,499 | 0 (0.0%) | 0 (0.0%) |
| $1,500 to $1,999 | 6 (9.7%) | 0 (0.0%) |
| $2,000 to $2,499 | 12 (19.4%) | 0 (0.0%) |
| $2,500 to $2,999 | 0 (0.0%) | 0 (0.0%) |
| $3,000 or more | 0 (0.0%) | 0 (0.0%) |
| Total | 62 (100.0%) | 13 (100.0%) |
Physical Housing Characteristics in Prospect
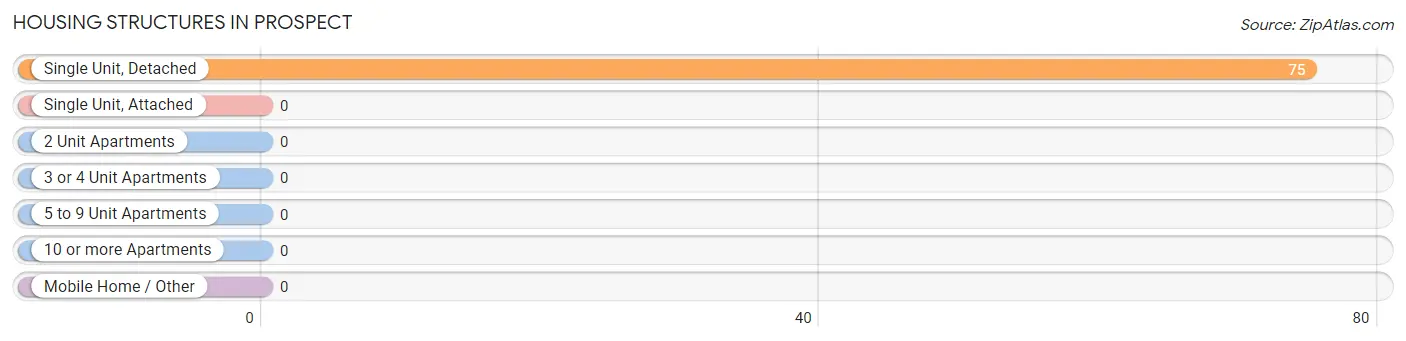
Housing Structures in Prospect
| Structure Type | # Housing Units | % Housing Units |
| Single Unit, Detached | 75 | 100.0% |
| Single Unit, Attached | 0 | 0.0% |
| 2 Unit Apartments | 0 | 0.0% |
| 3 or 4 Unit Apartments | 0 | 0.0% |
| 5 to 9 Unit Apartments | 0 | 0.0% |
| 10 or more Apartments | 0 | 0.0% |
| Mobile Home / Other | 0 | 0.0% |
| Total | 75 | 100.0% |
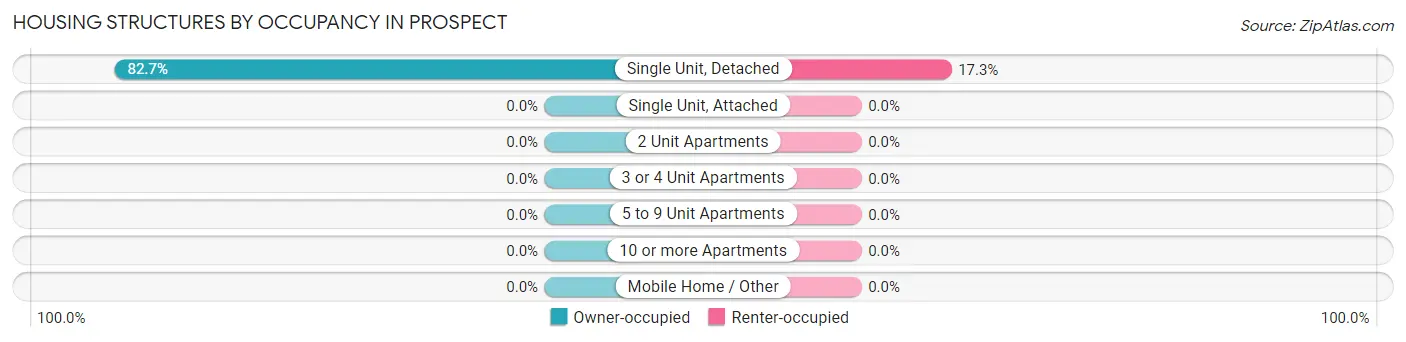
Housing Structures by Occupancy in Prospect
| Structure Type | Owner-occupied | Renter-occupied |
| Single Unit, Detached | 62 (82.7%) | 13 (17.3%) |
| Single Unit, Attached | 0 (0.0%) | 0 (0.0%) |
| 2 Unit Apartments | 0 (0.0%) | 0 (0.0%) |
| 3 or 4 Unit Apartments | 0 (0.0%) | 0 (0.0%) |
| 5 to 9 Unit Apartments | 0 (0.0%) | 0 (0.0%) |
| 10 or more Apartments | 0 (0.0%) | 0 (0.0%) |
| Mobile Home / Other | 0 (0.0%) | 0 (0.0%) |
| Total | 62 (82.7%) | 13 (17.3%) |
Housing Structures by Number of Rooms in Prospect
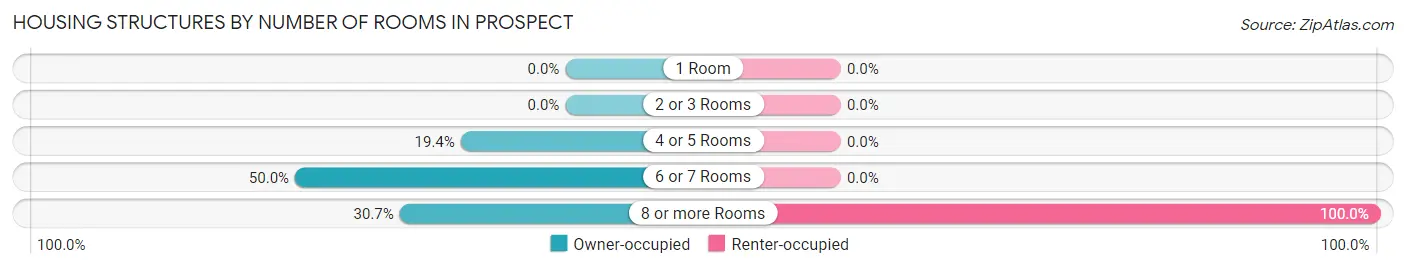
| Number of Rooms | Owner-occupied | Renter-occupied |
| 1 Room | 0 (0.0%) | 0 (0.0%) |
| 2 or 3 Rooms | 0 (0.0%) | 0 (0.0%) |
| 4 or 5 Rooms | 12 (19.4%) | 0 (0.0%) |
| 6 or 7 Rooms | 31 (50.0%) | 0 (0.0%) |
| 8 or more Rooms | 19 (30.6%) | 13 (100.0%) |
| Total | 62 (100.0%) | 13 (100.0%) |
Housing Structure by Heating Type in Prospect
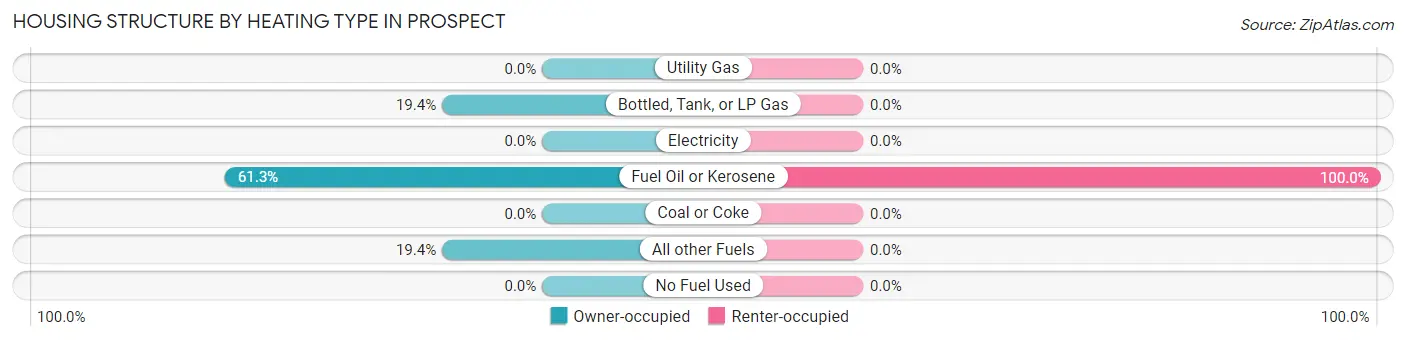
| Heating Type | Owner-occupied | Renter-occupied |
| Utility Gas | 0 (0.0%) | 0 (0.0%) |
| Bottled, Tank, or LP Gas | 12 (19.4%) | 0 (0.0%) |
| Electricity | 0 (0.0%) | 0 (0.0%) |
| Fuel Oil or Kerosene | 38 (61.3%) | 13 (100.0%) |
| Coal or Coke | 0 (0.0%) | 0 (0.0%) |
| All other Fuels | 12 (19.4%) | 0 (0.0%) |
| No Fuel Used | 0 (0.0%) | 0 (0.0%) |
| Total | 62 (100.0%) | 13 (100.0%) |
Household Vehicle Usage in Prospect
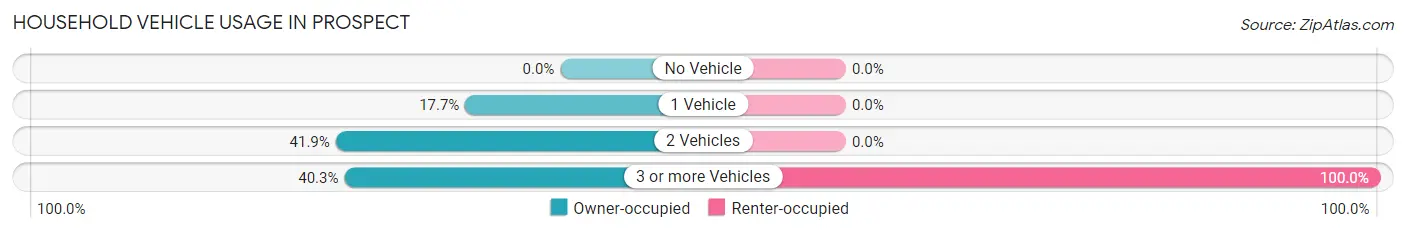
| Vehicles per Household | Owner-occupied | Renter-occupied |
| No Vehicle | 0 (0.0%) | 0 (0.0%) |
| 1 Vehicle | 11 (17.7%) | 0 (0.0%) |
| 2 Vehicles | 26 (41.9%) | 0 (0.0%) |
| 3 or more Vehicles | 25 (40.3%) | 13 (100.0%) |
| Total | 62 (100.0%) | 13 (100.0%) |
Real Estate & Mortgages in Prospect
Real Estate and Mortgage Overview in Prospect
| Characteristic | Without Mortgage | With Mortgage |
| Housing Units | 33 | 29 |
| Median Property Value | $122,900 | $139,600 |
| Median Household Income | $57,708 | $6 |
| Monthly Housing Costs | $641 | $0 |
| Real Estate Taxes | $2,409 | $0 |
Property Value by Mortgage Status in Prospect
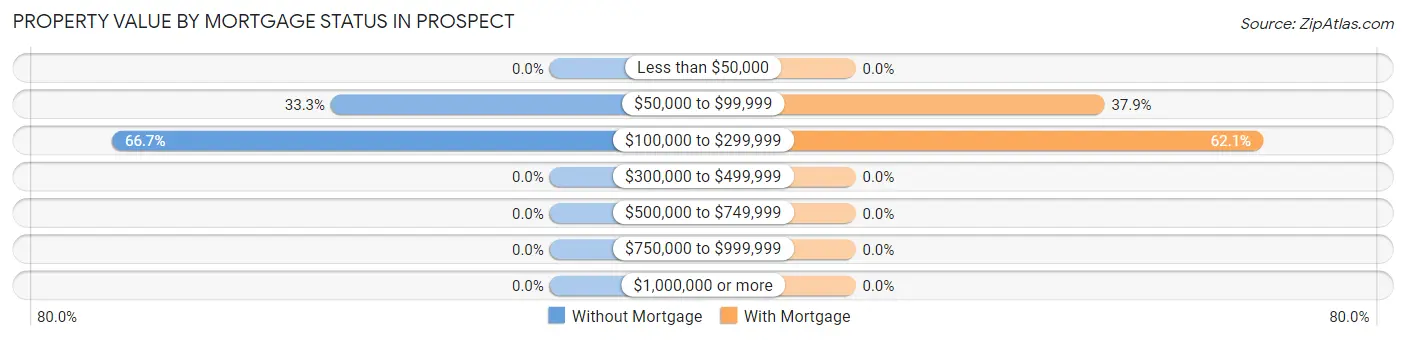
| Property Value | Without Mortgage | With Mortgage |
| Less than $50,000 | 0 (0.0%) | 0 (0.0%) |
| $50,000 to $99,999 | 11 (33.3%) | 11 (37.9%) |
| $100,000 to $299,999 | 22 (66.7%) | 18 (62.1%) |
| $300,000 to $499,999 | 0 (0.0%) | 0 (0.0%) |
| $500,000 to $749,999 | 0 (0.0%) | 0 (0.0%) |
| $750,000 to $999,999 | 0 (0.0%) | 0 (0.0%) |
| $1,000,000 or more | 0 (0.0%) | 0 (0.0%) |
| Total | 33 (100.0%) | 29 (100.0%) |
Household Income by Mortgage Status in Prospect
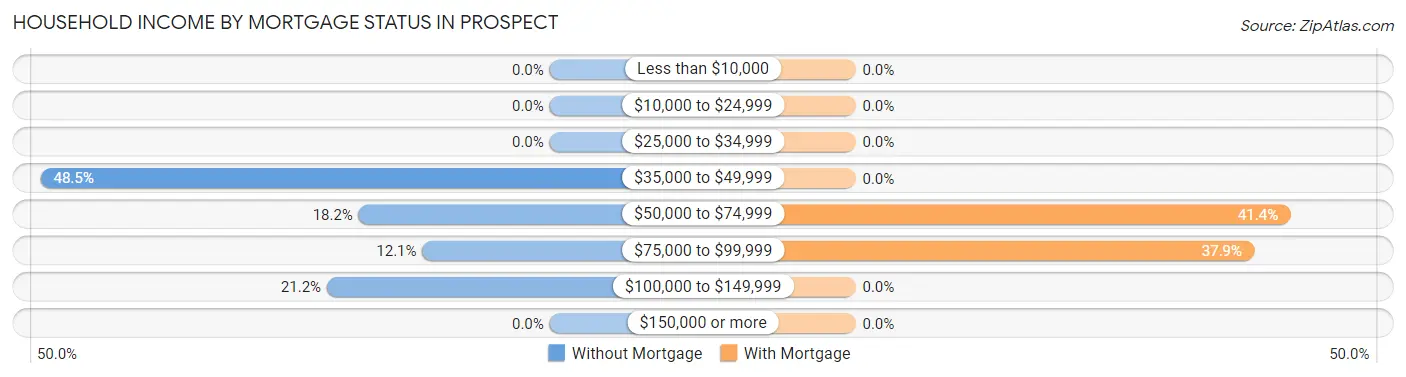
| Household Income | Without Mortgage | With Mortgage |
| Less than $10,000 | 0 (0.0%) | 0 (0.0%) |
| $10,000 to $24,999 | 0 (0.0%) | 0 (0.0%) |
| $25,000 to $34,999 | 0 (0.0%) | 0 (0.0%) |
| $35,000 to $49,999 | 16 (48.5%) | 0 (0.0%) |
| $50,000 to $74,999 | 6 (18.2%) | 12 (41.4%) |
| $75,000 to $99,999 | 4 (12.1%) | 11 (37.9%) |
| $100,000 to $149,999 | 7 (21.2%) | 0 (0.0%) |
| $150,000 or more | 0 (0.0%) | 0 (0.0%) |
| Total | 33 (100.0%) | 29 (100.0%) |
Property Value to Household Income Ratio in Prospect
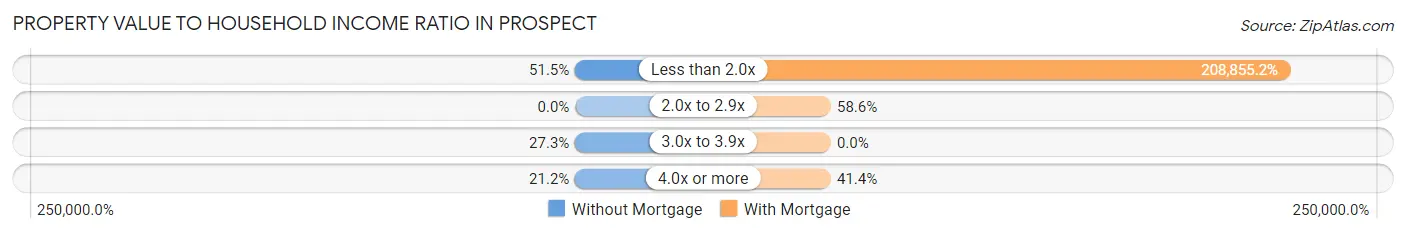
| Value-to-Income Ratio | Without Mortgage | With Mortgage |
| Less than 2.0x | 17 (51.5%) | 60,568 (208,855.2%) |
| 2.0x to 2.9x | 0 (0.0%) | 17 (58.6%) |
| 3.0x to 3.9x | 9 (27.3%) | 0 (0.0%) |
| 4.0x or more | 7 (21.2%) | 12 (41.4%) |
| Total | 33 (100.0%) | 29 (100.0%) |
Real Estate Taxes by Mortgage Status in Prospect
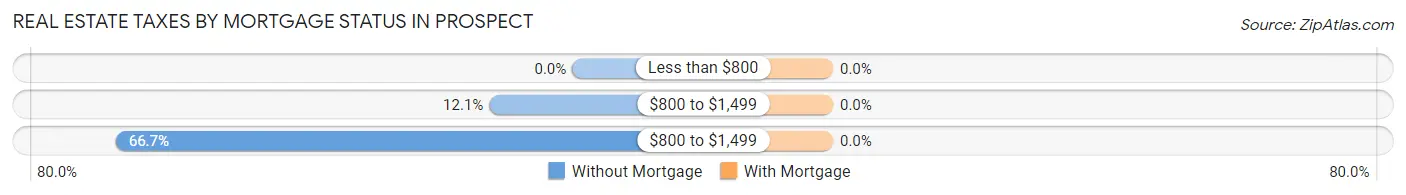
| Property Taxes | Without Mortgage | With Mortgage |
| Less than $800 | 0 (0.0%) | 0 (0.0%) |
| $800 to $1,499 | 4 (12.1%) | 0 (0.0%) |
| $800 to $1,499 | 22 (66.7%) | 0 (0.0%) |
| Total | 33 (100.0%) | 29 (100.0%) |
Health & Disability in Prospect
Health Insurance Coverage by Age in Prospect
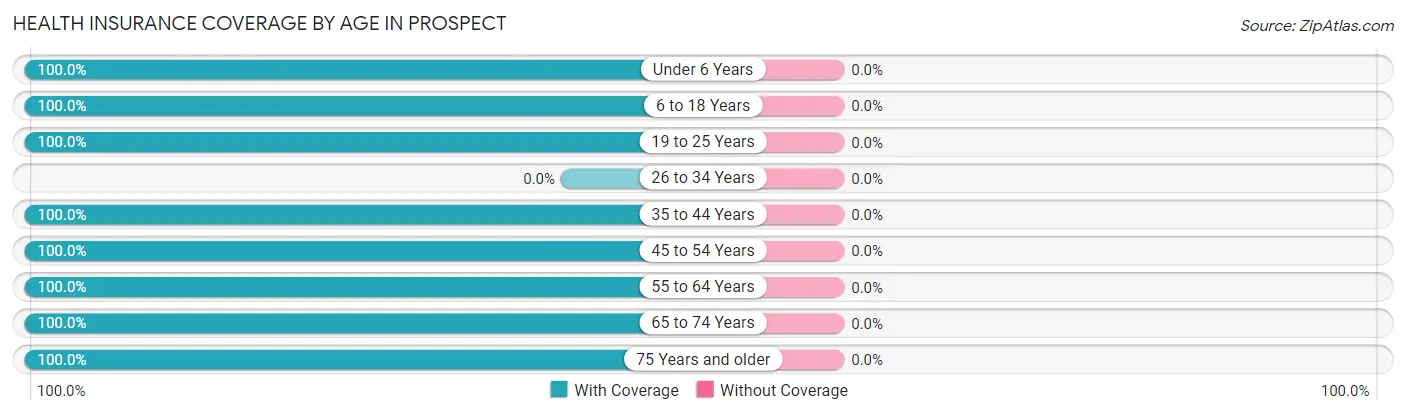
| Age Bracket | With Coverage | Without Coverage |
| Under 6 Years | 40 (100.0%) | 0 (0.0%) |
| 6 to 18 Years | 86 (100.0%) | 0 (0.0%) |
| 19 to 25 Years | 7 (100.0%) | 0 (0.0%) |
| 26 to 34 Years | 0 (0.0%) | 0 (0.0%) |
| 35 to 44 Years | 33 (100.0%) | 0 (0.0%) |
| 45 to 54 Years | 57 (100.0%) | 0 (0.0%) |
| 55 to 64 Years | 7 (100.0%) | 0 (0.0%) |
| 65 to 74 Years | 24 (100.0%) | 0 (0.0%) |
| 75 Years and older | 21 (100.0%) | 0 (0.0%) |
| Total | 275 (100.0%) | 0 (0.0%) |
Health Insurance Coverage by Citizenship Status in Prospect
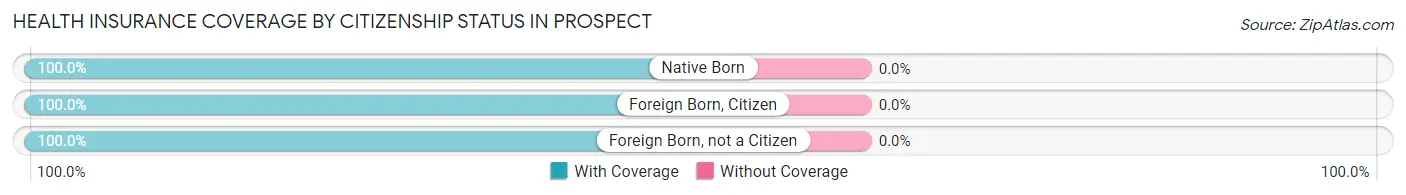
| Citizenship Status | With Coverage | Without Coverage |
| Native Born | 40 (100.0%) | 0 (0.0%) |
| Foreign Born, Citizen | 86 (100.0%) | 0 (0.0%) |
| Foreign Born, not a Citizen | 7 (100.0%) | 0 (0.0%) |
Health Insurance Coverage by Household Income in Prospect
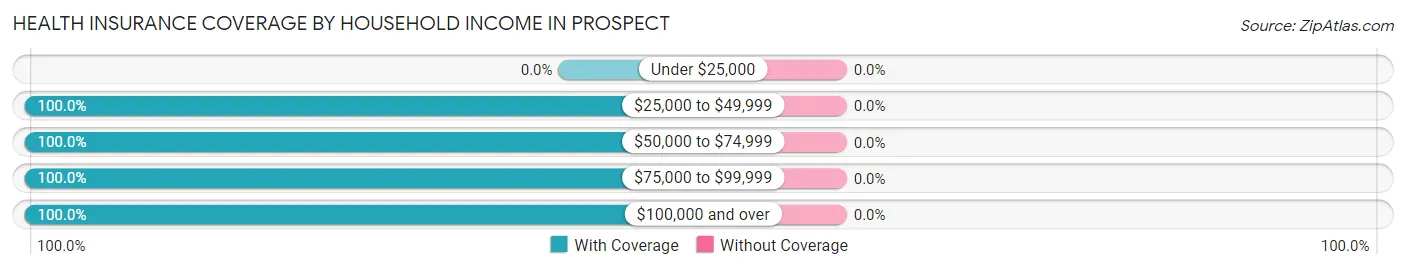
| Household Income | With Coverage | Without Coverage |
| Under $25,000 | 0 (0.0%) | 0 (0.0%) |
| $25,000 to $49,999 | 49 (100.0%) | 0 (0.0%) |
| $50,000 to $74,999 | 50 (100.0%) | 0 (0.0%) |
| $75,000 to $99,999 | 120 (100.0%) | 0 (0.0%) |
| $100,000 and over | 56 (100.0%) | 0 (0.0%) |
Public vs Private Health Insurance Coverage by Age in Prospect
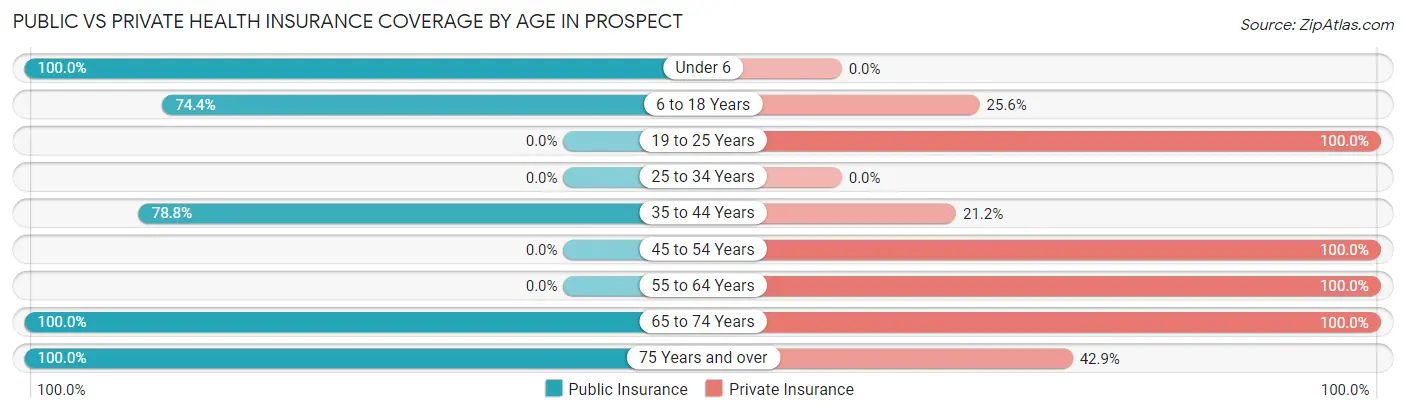
| Age Bracket | Public Insurance | Private Insurance |
| Under 6 | 40 (100.0%) | 0 (0.0%) |
| 6 to 18 Years | 64 (74.4%) | 22 (25.6%) |
| 19 to 25 Years | 0 (0.0%) | 7 (100.0%) |
| 25 to 34 Years | 0 (0.0%) | 0 (0.0%) |
| 35 to 44 Years | 26 (78.8%) | 7 (21.2%) |
| 45 to 54 Years | 0 (0.0%) | 57 (100.0%) |
| 55 to 64 Years | 0 (0.0%) | 7 (100.0%) |
| 65 to 74 Years | 24 (100.0%) | 24 (100.0%) |
| 75 Years and over | 21 (100.0%) | 9 (42.9%) |
| Total | 175 (63.6%) | 133 (48.4%) |
Disability Status by Sex by Age in Prospect
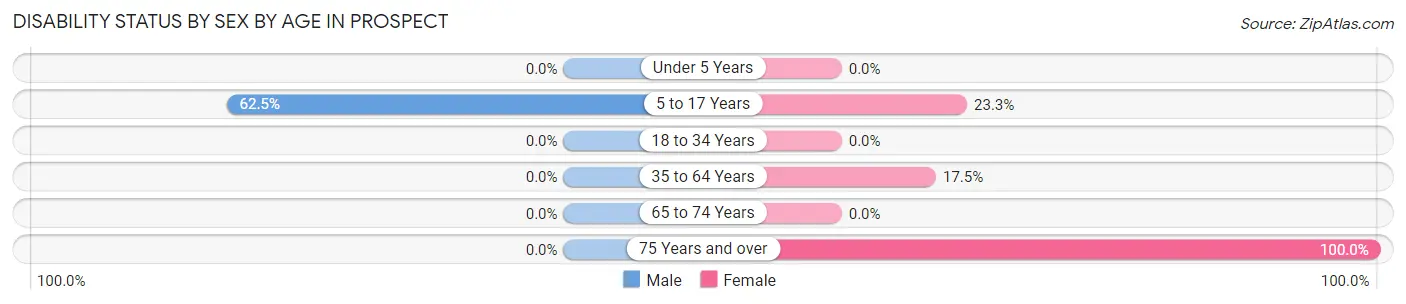
| Age Bracket | Male | Female |
| Under 5 Years | 0 (0.0%) | 0 (0.0%) |
| 5 to 17 Years | 35 (62.5%) | 10 (23.3%) |
| 18 to 34 Years | 0 (0.0%) | 0 (0.0%) |
| 35 to 64 Years | 0 (0.0%) | 7 (17.5%) |
| 65 to 74 Years | 0 (0.0%) | 0 (0.0%) |
| 75 Years and over | 0 (0.0%) | 5 (100.0%) |
Disability Class by Sex by Age in Prospect
Disability Class: Hearing Difficulty
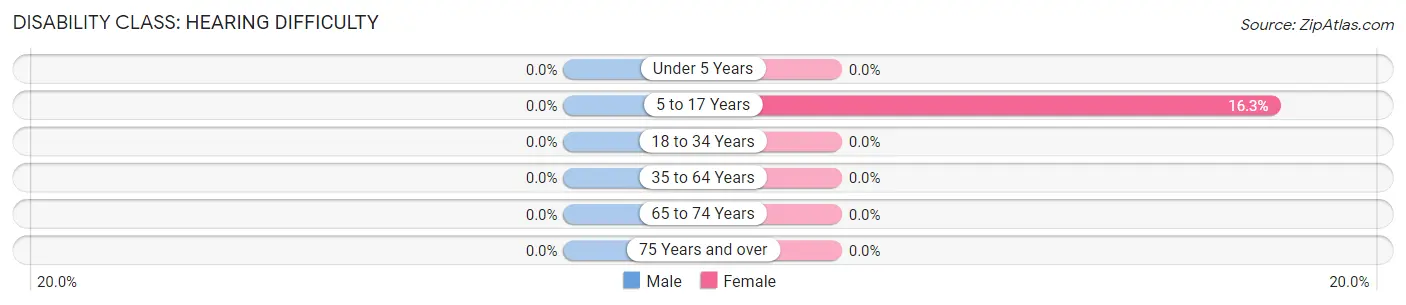
| Age Bracket | Male | Female |
| Under 5 Years | 0 (0.0%) | 0 (0.0%) |
| 5 to 17 Years | 0 (0.0%) | 7 (16.3%) |
| 18 to 34 Years | 0 (0.0%) | 0 (0.0%) |
| 35 to 64 Years | 0 (0.0%) | 0 (0.0%) |
| 65 to 74 Years | 0 (0.0%) | 0 (0.0%) |
| 75 Years and over | 0 (0.0%) | 0 (0.0%) |
Disability Class: Vision Difficulty
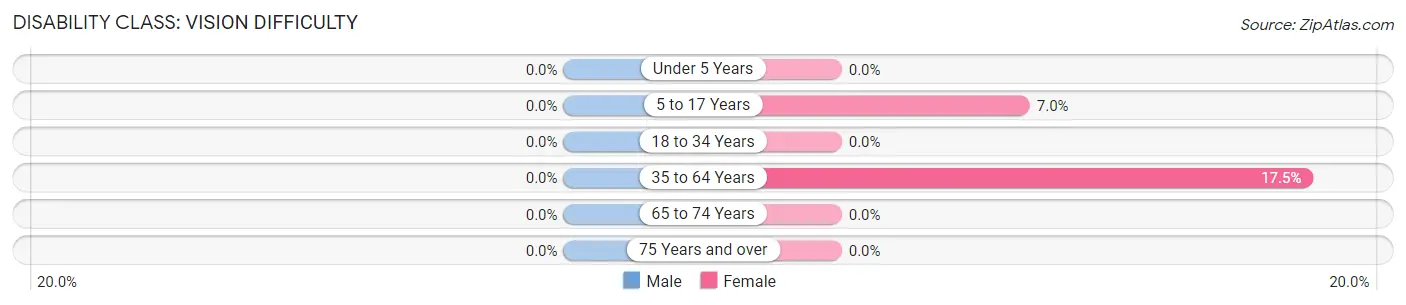
| Age Bracket | Male | Female |
| Under 5 Years | 0 (0.0%) | 0 (0.0%) |
| 5 to 17 Years | 0 (0.0%) | 3 (7.0%) |
| 18 to 34 Years | 0 (0.0%) | 0 (0.0%) |
| 35 to 64 Years | 0 (0.0%) | 7 (17.5%) |
| 65 to 74 Years | 0 (0.0%) | 0 (0.0%) |
| 75 Years and over | 0 (0.0%) | 0 (0.0%) |
Disability Class: Cognitive Difficulty
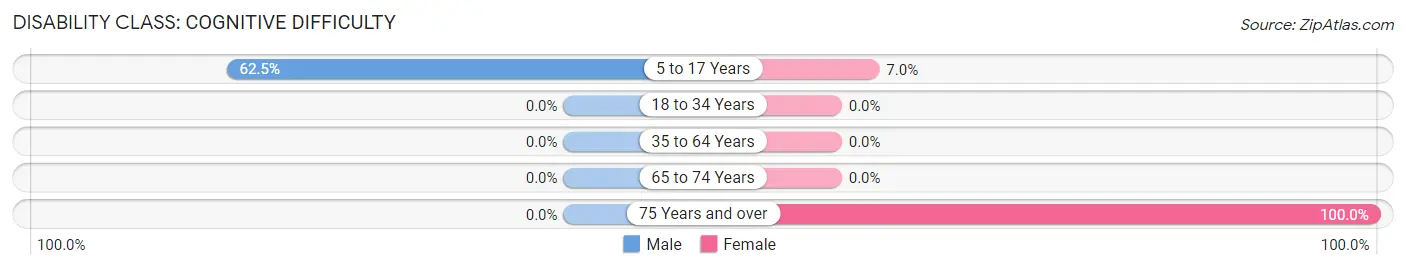
| Age Bracket | Male | Female |
| 5 to 17 Years | 35 (62.5%) | 3 (7.0%) |
| 18 to 34 Years | 0 (0.0%) | 0 (0.0%) |
| 35 to 64 Years | 0 (0.0%) | 0 (0.0%) |
| 65 to 74 Years | 0 (0.0%) | 0 (0.0%) |
| 75 Years and over | 0 (0.0%) | 5 (100.0%) |
Disability Class: Ambulatory Difficulty
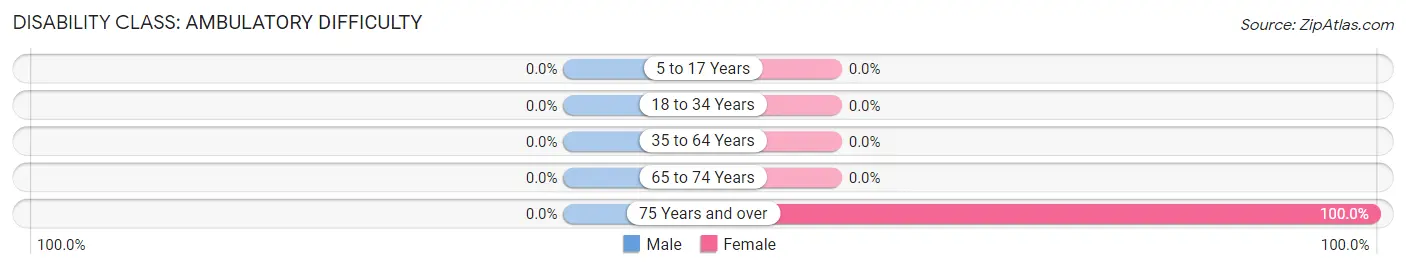
| Age Bracket | Male | Female |
| 5 to 17 Years | 0 (0.0%) | 0 (0.0%) |
| 18 to 34 Years | 0 (0.0%) | 0 (0.0%) |
| 35 to 64 Years | 0 (0.0%) | 0 (0.0%) |
| 65 to 74 Years | 0 (0.0%) | 0 (0.0%) |
| 75 Years and over | 0 (0.0%) | 5 (100.0%) |
Disability Class: Self-Care Difficulty

| Age Bracket | Male | Female |
| 5 to 17 Years | 0 (0.0%) | 0 (0.0%) |
| 18 to 34 Years | 0 (0.0%) | 0 (0.0%) |
| 35 to 64 Years | 0 (0.0%) | 0 (0.0%) |
| 65 to 74 Years | 0 (0.0%) | 0 (0.0%) |
| 75 Years and over | 0 (0.0%) | 5 (100.0%) |
Technology Access in Prospect
Computing Device Access in Prospect
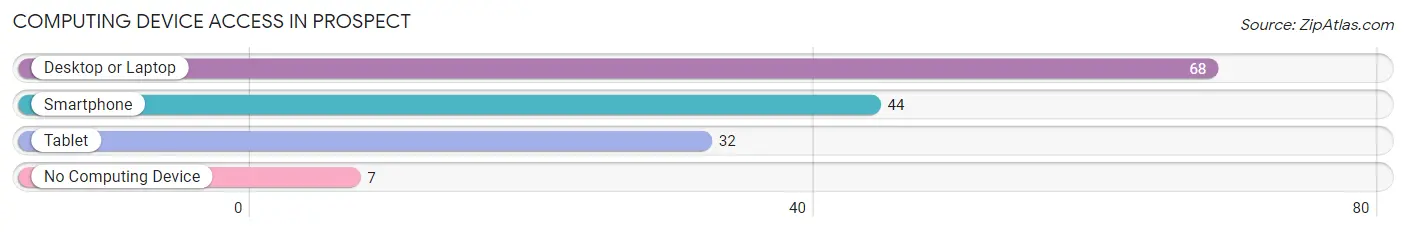
| Device Type | # Households | % Households |
| Desktop or Laptop | 68 | 90.7% |
| Smartphone | 44 | 58.7% |
| Tablet | 32 | 42.7% |
| No Computing Device | 7 | 9.3% |
| Total | 75 | 100.0% |
Internet Access in Prospect
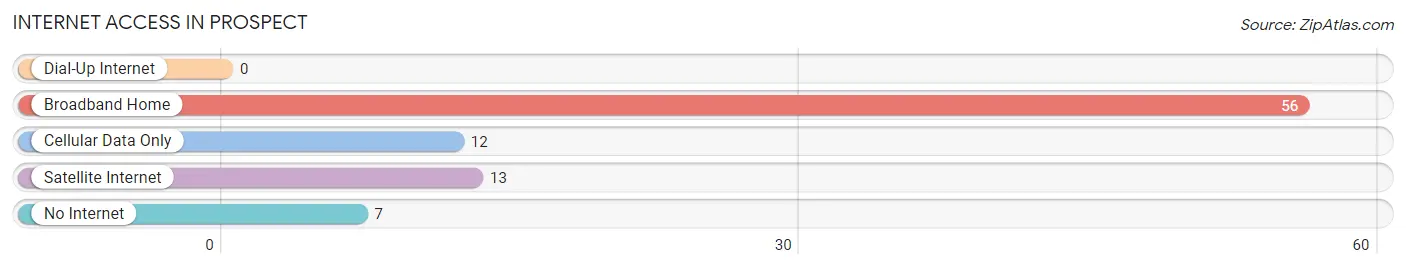
| Internet Type | # Households | % Households |
| Dial-Up Internet | 0 | 0.0% |
| Broadband Home | 56 | 74.7% |
| Cellular Data Only | 12 | 16.0% |
| Satellite Internet | 13 | 17.3% |
| No Internet | 7 | 9.3% |
| Total | 75 | 100.0% |
Prospect Summary
Prospect is a small hamlet located in the town of Prospect, New York, in the county of Herkimer. It is situated in the foothills of the Adirondack Mountains, about 20 miles east of Utica. The hamlet is home to a population of about 1,000 people, and is known for its rural charm and small-town atmosphere.
History
The hamlet of Prospect was first settled in the late 1700s by a group of German immigrants. The settlers were attracted to the area by its abundance of natural resources, including timber, water, and fertile soil. The hamlet was originally known as “Prospect Hill”, and was officially incorporated in 1848.
In the late 1800s, Prospect was a thriving agricultural community, with many farms and orchards. The hamlet was also home to several small businesses, including a sawmill, a gristmill, and a blacksmith shop.
In the early 1900s, Prospect began to experience a decline in population as many of its residents moved away in search of better economic opportunities. The hamlet was also affected by the Great Depression, and many of its businesses closed.
Geography
Prospect is located in the foothills of the Adirondack Mountains, about 20 miles east of Utica. The hamlet is situated on the banks of the West Canada Creek, which flows through the area. The terrain is mostly hilly, with some flat areas in the valleys. The climate is humid continental, with cold winters and warm summers.
Economy
The economy of Prospect is largely based on agriculture and tourism. The hamlet is home to several small farms, which produce a variety of crops, including corn, soybeans, and hay. The area is also popular with tourists, who come to enjoy the rural atmosphere and outdoor activities such as fishing, hunting, and hiking.
In addition to agriculture and tourism, Prospect is home to several small businesses, including a grocery store, a hardware store, and a restaurant. The hamlet also has a post office, a library, and a fire station.
Demographics
As of the 2010 census, the population of Prospect was 1,000. The racial makeup of the hamlet was 97.2% White, 0.7% African American, 0.3% Native American, 0.2% Asian, and 1.6% from other races. The median household income was $41,250, and the median age was 43.
Conclusion
Prospect is a small hamlet located in the town of Prospect, New York, in the county of Herkimer. It is situated in the foothills of the Adirondack Mountains, about 20 miles east of Utica. The hamlet is home to a population of about 1,000 people, and is known for its rural charm and small-town atmosphere. The economy of Prospect is largely based on agriculture and tourism, and the hamlet is home to several small businesses. The racial makeup of the hamlet is mostly White, with a small percentage of African American, Native American, and Asian residents.
Common Questions
What is Per Capita Income in Prospect?
Per Capita income in Prospect is $20,977.
What is the Median Family Income in Prospect?
Median Family Income in Prospect is $62,159.
What is the Median Household income in Prospect?
Median Household Income in Prospect is $60,795.
What is Income or Wage Gap in Prospect?
Income or Wage Gap in Prospect is 53.6%.
Women in Prospect earn 46.4 cents for every dollar earned by a man.
What is Inequality or Gini Index in Prospect?
Inequality or Gini Index in Prospect is 0.27.
What is the Total Population of Prospect?
Total Population of Prospect is 275.
What is the Total Male Population of Prospect?
Total Male Population of Prospect is 129.
What is the Total Female Population of Prospect?
Total Female Population of Prospect is 146.
What is the Ratio of Males per 100 Females in Prospect?
There are 88.36 Males per 100 Females in Prospect.
What is the Ratio of Females per 100 Males in Prospect?
There are 113.18 Females per 100 Males in Prospect.
What is the Median Population Age in Prospect?
Median Population Age in Prospect is 43.6 Years.
What is the Average Family Size in Prospect
Average Family Size in Prospect is 3.6 People.
What is the Average Household Size in Prospect
Average Household Size in Prospect is 3.7 People.
How Large is the Labor Force in Prospect?
There are 108 People in the Labor Forcein in Prospect.
What is the Percentage of People in the Labor Force in Prospect?
69.2% of People are in the Labor Force in Prospect.