Zip Codes with the Highest Percentage of Population with a Degree in Liberal Arts and History in Buffalo, NY

RELATED REPORTS & OPTIONS

Liberal Arts and History
Population
Families and Households
Female Fertility
Female Fertility (Unmarried)
Race (Community Size)
Race (Percentage)
Ancestry (Community Size)
AfghanAfricanAlbanianAlsatianAmericanArabArgentineanArmenianAustralianAustrianBahamianBarbadianBelgianBelizeanBhutaneseBlackfeetBolivianBrazilianBritishBritish West IndianBulgarianBurmeseCajunCambodianCanadianCarpatho RusynCelticCentral AmericanCentral American IndianCherokeeChileanChippewaColombianCosta RicanCreekCroatianCubanCzechCzechoslovakianDanishDominicanDutchDutch West IndianEastern EuropeanEcuadorianEgyptianEnglishEstonianEthiopianEuropeanFilipinoFinnishFrenchFrench American IndianFrench CanadianGermanGerman RussianGhanaianGreekGuamanian / ChamorroGuatemalanGuyaneseHaitianHonduranHungarianIcelanderIndian (Asian)IndonesianIranianIraqiIrishIroquoisIsraeliItalianJamaicanJapaneseJordanianKenyanKoreanLaotianLatvianLebaneseLithuanianMacedonianMalaysianMalteseMexicanMexican American IndianMongolianMoroccanNative HawaiianNavajoNicaraguanNigerianNorthern EuropeanNorwegianOkinawanPakistaniPalestinianPanamanianPennsylvania GermanPeruvianPolishPortuguesePuerto RicanRomanianRussianSalvadoranSamoanScandinavianScotch-IrishScottishSerbianSiouxSlavicSlovakSloveneSomaliSouth AfricanSouth AmericanSouth American IndianSpaniardSpanishSri LankanSubsaharan AfricanSudaneseSwedishSwissSyrianTaiwaneseThaiTrinidadian and TobagonianTurkishUkrainianVenezuelanVietnameseWelshWest IndianYugoslavian
Ancestry (Percentage)
AfghanAfricanAlbanianAlsatianAmericanArabArgentineanArmenianAustralianAustrianBahamianBarbadianBelgianBelizeanBhutaneseBlackfeetBolivianBrazilianBritishBritish West IndianBulgarianBurmeseCajunCambodianCanadianCarpatho RusynCelticCentral AmericanCentral American IndianCherokeeChileanChippewaColombianCosta RicanCreekCroatianCubanCzechCzechoslovakianDanishDominicanDutchDutch West IndianEastern EuropeanEcuadorianEgyptianEnglishEstonianEthiopianEuropeanFilipinoFinnishFrenchFrench American IndianFrench CanadianGermanGerman RussianGhanaianGreekGuamanian / ChamorroGuatemalanGuyaneseHaitianHonduranHungarianIcelanderIndian (Asian)IndonesianIranianIraqiIrishIroquoisIsraeliItalianJamaicanJapaneseJordanianKenyanKoreanLaotianLatvianLebaneseLithuanianMacedonianMalaysianMalteseMexicanMexican American IndianMongolianMoroccanNative HawaiianNavajoNicaraguanNigerianNorthern EuropeanNorwegianOkinawanPakistaniPalestinianPanamanianPennsylvania GermanPeruvianPolishPortuguesePuerto RicanRomanianRussianSalvadoranSamoanScandinavianScotch-IrishScottishSerbianSiouxSlavicSlovakSloveneSomaliSouth AfricanSouth AmericanSouth American IndianSpaniardSpanishSri LankanSubsaharan AfricanSudaneseSwedishSwissSyrianTaiwaneseThaiTrinidadian and TobagonianTurkishUkrainianVenezuelanVietnameseWelshWest IndianYugoslavian
Immigrant Origin (Total)
AfghanistanAfricaAlbaniaArgentinaAsiaAustraliaAustriaBangladeshBarbadosBelarusBosnia and HerzegovinaBrazilBulgariaBurma / MyanmarCameroonCanadaCaribbeanCentral AmericaChinaColombiaCongoCosta RicaCroatiaCubaCzechoslovakiaDominican RepublicEastern AfricaEastern AsiaEastern EuropeEcuadorEgyptEl SalvadorEnglandEritreaEthiopiaEuropeFranceGermanyGhanaGreeceGuatemalaGuyanaHaitiHondurasHong KongHungaryIndiaIndonesiaIranIraqIrelandIsraelItalyJamaicaJapanJordanKazakhstanKenyaKoreaKuwaitLaosLatin AmericaLatviaLebanonLiberiaLithuaniaMalaysiaMexicoMiddle AfricaMoldovaMoroccoNepalNetherlandsNigeriaNorth MacedoniaNorthern AfricaNorthern EuropeNorwayOceaniaPakistanPanamaPeruPhilippinesPolandRomaniaRussiaSaudi ArabiaScotlandSerbiaSierra LeoneSingaporeSomaliaSouth AfricaSouth AmericaSouth Central AsiaSouth Eastern AsiaSouthern EuropeSpainSri LankaSt. Vincent and the GrenadinesSudanSwedenSwitzerlandSyriaTaiwanThailandTrinidad and TobagoTurkeyUgandaUkraineUzbekistanVenezuelaVietnamWest IndiesWestern AfricaWestern AsiaWestern EuropeYemenZaire
Immigrant Origin (Percentage)
AfghanistanAfricaAlbaniaArgentinaAsiaAustraliaAustriaBangladeshBarbadosBelarusBosnia and HerzegovinaBrazilBulgariaBurma / MyanmarCameroonCanadaCaribbeanCentral AmericaChinaColombiaCongoCosta RicaCroatiaCubaCzechoslovakiaDominican RepublicEastern AfricaEastern AsiaEastern EuropeEcuadorEgyptEl SalvadorEnglandEritreaEthiopiaEuropeFranceGermanyGhanaGreeceGuatemalaGuyanaHaitiHondurasHong KongHungaryIndiaIndonesiaIranIraqIrelandIsraelItalyJamaicaJapanJordanKazakhstanKenyaKoreaKuwaitLaosLatin AmericaLatviaLebanonLiberiaLithuaniaMalaysiaMexicoMiddle AfricaMoldovaMoroccoNepalNetherlandsNigeriaNorth MacedoniaNorthern AfricaNorthern EuropeNorwayOceaniaPakistanPanamaPeruPhilippinesPolandRomaniaRussiaSaudi ArabiaScotlandSerbiaSierra LeoneSingaporeSomaliaSouth AfricaSouth AmericaSouth Central AsiaSouth Eastern AsiaSouthern EuropeSpainSri LankaSt. Vincent and the GrenadinesSudanSwedenSwitzerlandSyriaTaiwanThailandTrinidad and TobagoTurkeyUgandaUkraineUzbekistanVenezuelaVietnamWest IndiesWestern AfricaWestern AsiaWestern EuropeYemenZaire
Income
Income (Families)
Income (Households)
Poverty
Poverty (Families)
Unemployment
Employment Occupations
Employment Industries
Employer Class
Commute Time
Commute Means
School Enrollment
Education by Degree Field
Occupancy
Finances
Physical Characteristics
Buffalo
Compare Zip Codes
Comparison Subject

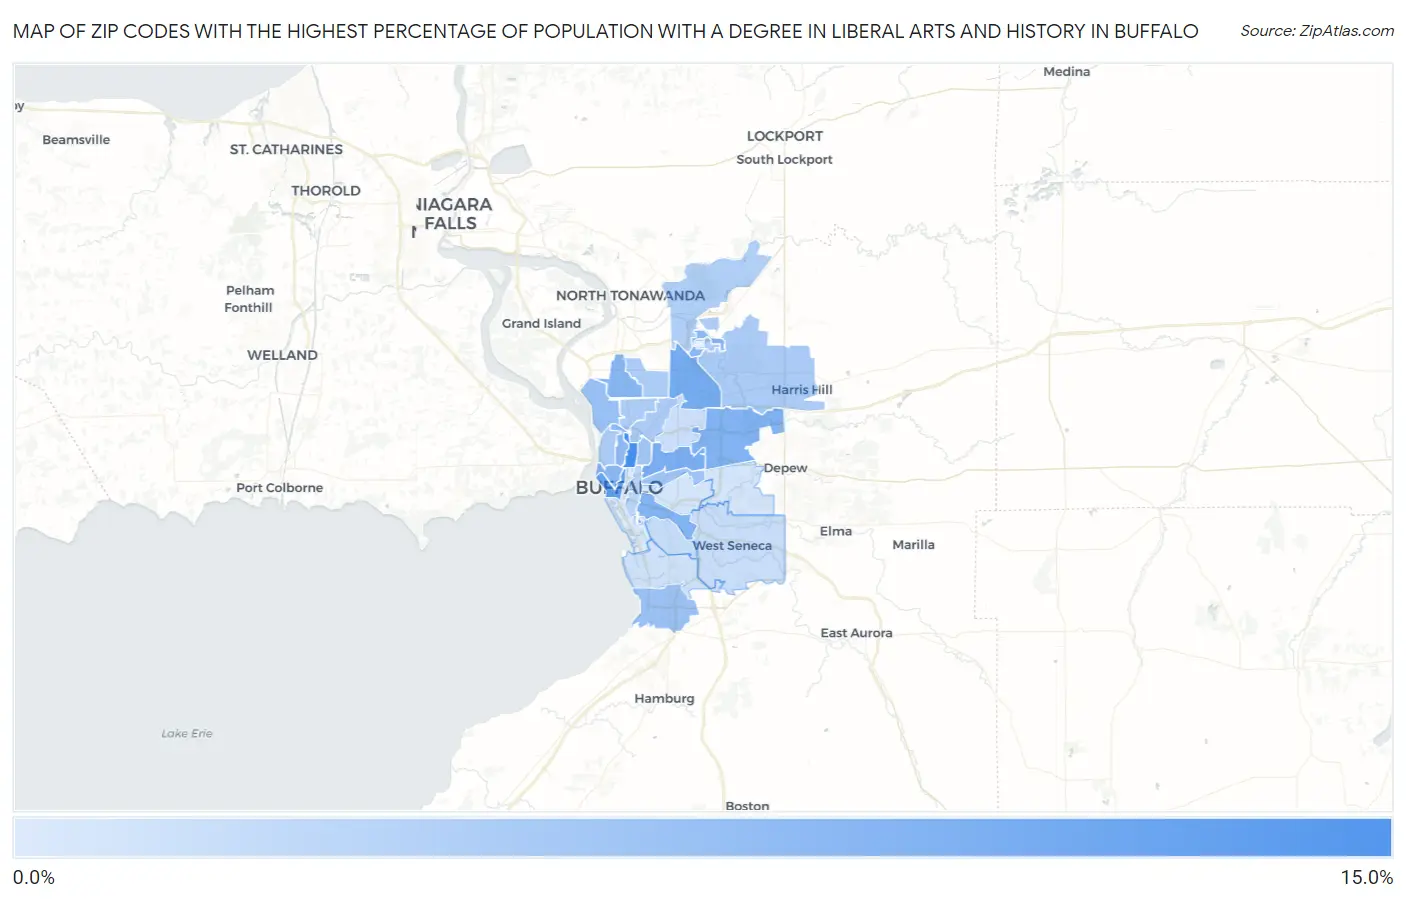
Map of Zip Codes with the Highest Percentage of Population with a Degree in Liberal Arts and History in Buffalo

0.0%
15.0%
Zip Codes with the Highest Percentage of Population with a Degree in Liberal Arts and History in Buffalo Map

Zip Codes with the Highest Percentage of Population with a Degree in Liberal Arts and History in Buffalo, NY

Zip Code % Graduates vs State vs National
1.1420912.1%5.7%(+6.38)#1274.9%(+7.23)#2,174
2.1420210.1%5.7%(+4.33)#1814.9%(+5.18)#3,079
3.142269.1%5.7%(+3.36)#2344.9%(+4.21)#3,782
4.142118.8%5.7%(+3.13)#2494.9%(+3.97)#3,986
5.142258.3%5.7%(+2.62)#2964.9%(+3.47)#4,496
6.142108.3%5.7%(+2.57)#3004.9%(+3.41)#4,563
7.142178.0%5.7%(+2.31)#3284.9%(+3.16)#4,857
8.142017.8%5.7%(+2.12)#3524.9%(+2.97)#5,113
9.142617.8%5.7%(+2.09)#3584.9%(+2.94)#5,156
10.142227.6%5.7%(+1.85)#3784.9%(+2.70)#5,484
11.142077.0%5.7%(+1.30)#4374.9%(+2.15)#6,352
12.142196.7%5.7%(+1.02)#4734.9%(+1.87)#6,857
13.142086.5%5.7%(+0.795)#4964.9%(+1.64)#7,312
14.142126.4%5.7%(+0.682)#5204.9%(+1.53)#7,559
15.142145.9%5.7%(+0.141)#6184.9%(+0.987)#8,895
16.142135.8%5.7%(+0.118)#6214.9%(+0.964)#8,948
17.142215.8%5.7%(+0.081)#6274.9%(+0.928)#9,036
18.142235.7%5.7%(+0.008)#6414.9%(+0.854)#9,228
19.142165.6%5.7%(-0.094)#6624.9%(+0.753)#9,503
20.142285.3%5.7%(-0.383)#7054.9%(+0.463)#10,326
21.142044.9%5.7%(-0.849)#8094.9%(-0.003)#11,757
22.142204.2%5.7%(-1.55)#9594.9%(-0.702)#14,134
23.142243.9%5.7%(-1.77)#1,0004.9%(-0.924)#14,984
24.142153.8%5.7%(-1.93)#1,0344.9%(-1.08)#15,549
25.142183.5%5.7%(-2.18)#1,0884.9%(-1.33)#16,450
26.142063.4%5.7%(-2.35)#1,1264.9%(-1.51)#17,098
27.142273.3%5.7%(-2.37)#1,1314.9%(-1.52)#17,141
28.142032.7%5.7%(-2.97)#1,2324.9%(-2.13)#19,173

Common Questions

What are the Top 10 Zip Codes with the Highest Percentage of Population with a Degree in Liberal Arts and History in Buffalo, NY?
Top 10 Zip Codes with the Highest Percentage of Population with a Degree in Liberal Arts and History in Buffalo, NY are:
#1
12.1%
#2
10.1%
#3
9.1%
#4
8.8%
#5
8.3%
#6
8.3%
#7
8.0%
#8
7.8%
#9
7.8%
#10
7.6%
What zip code has the Highest Percentage of Population with a Degree in Liberal Arts and History in Buffalo, NY?
14209 has the Highest Percentage of Population with a Degree in Liberal Arts and History in Buffalo, NY with 12.1%.
What is the Percentage of Population with a Degree in Liberal Arts and History in Buffalo, NY?
Percentage of Population with a Degree in Liberal Arts and History in Buffalo is 6.6%.
What is the Percentage of Population with a Degree in Liberal Arts and History in New York?
Percentage of Population with a Degree in Liberal Arts and History in New York is 5.7%.
What is the Percentage of Population with a Degree in Liberal Arts and History in the United States?
Percentage of Population with a Degree in Liberal Arts and History in the United States is 4.9%.