Zip Codes with the Highest Percentage of Population with a Degree in Liberal Arts and History in Utica, NY
RELATED REPORTS & OPTIONS
Liberal Arts and History
Utica
Compare Zip Codes
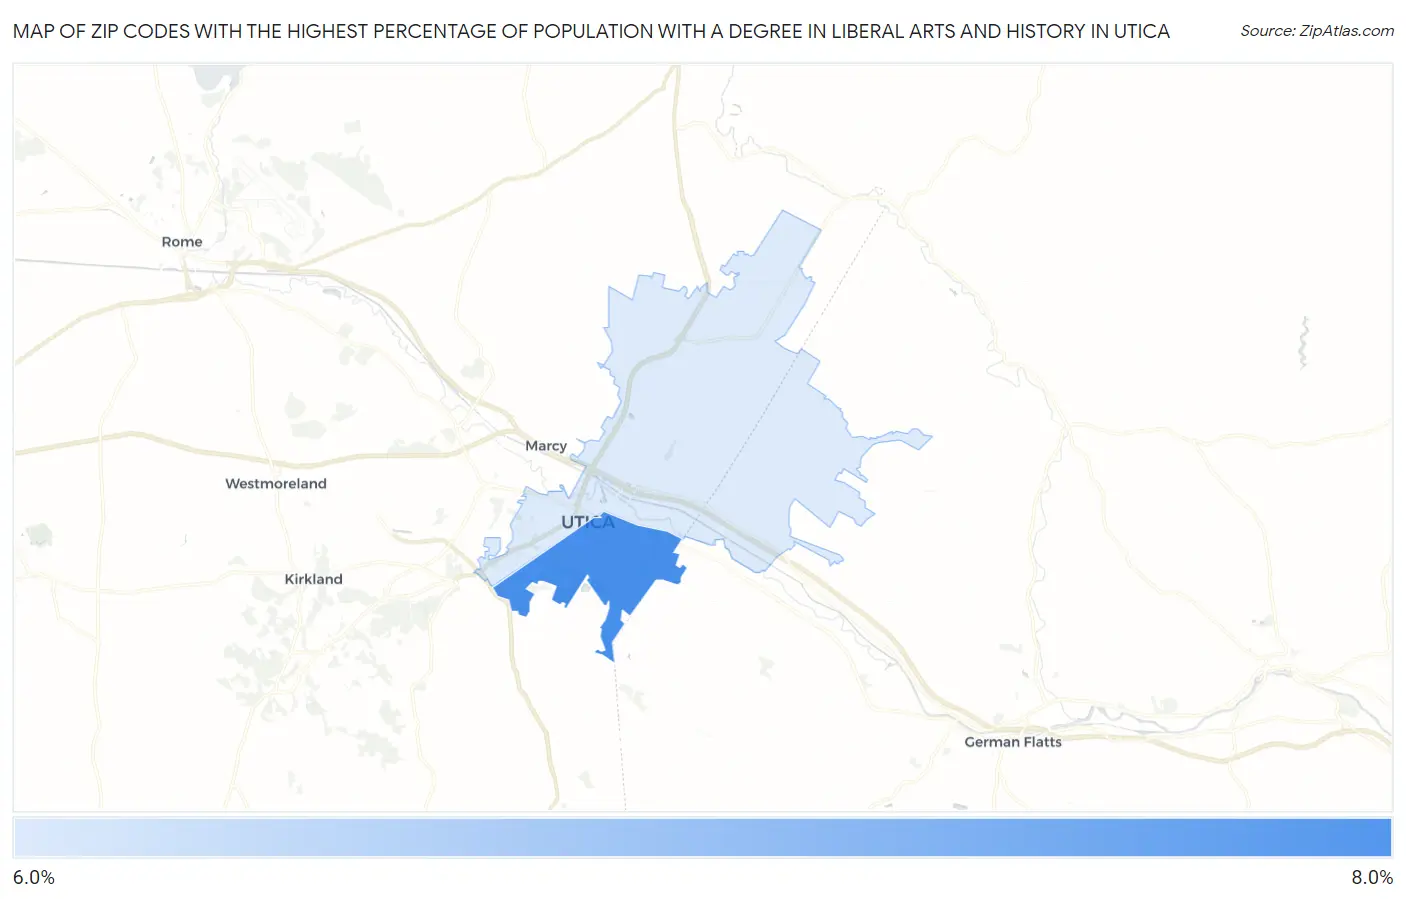
Map of Zip Codes with the Highest Percentage of Population with a Degree in Liberal Arts and History in Utica
6.3%
6.9%
Zip Codes with the Highest Percentage of Population with a Degree in Liberal Arts and History in Utica, NY
| Zip Code | % Graduates | vs State | vs National | |
| 1. | 13501 | 6.9% | 5.7%(+1.18)#455 | 4.9%(+2.03)#6,552 |
| 2. | 13502 | 6.3% | 5.7%(+0.605)#531 | 4.9%(+1.45)#7,733 |
1
Common Questions
What are the Top Zip Codes with the Highest Percentage of Population with a Degree in Liberal Arts and History in Utica, NY?
Top Zip Codes with the Highest Percentage of Population with a Degree in Liberal Arts and History in Utica, NY are:
What zip code has the Highest Percentage of Population with a Degree in Liberal Arts and History in Utica, NY?
13501 has the Highest Percentage of Population with a Degree in Liberal Arts and History in Utica, NY with 6.9%.
What is the Percentage of Population with a Degree in Liberal Arts and History in Utica, NY?
Percentage of Population with a Degree in Liberal Arts and History in Utica is 7.0%.
What is the Percentage of Population with a Degree in Liberal Arts and History in New York?
Percentage of Population with a Degree in Liberal Arts and History in New York is 5.7%.
What is the Percentage of Population with a Degree in Liberal Arts and History in the United States?
Percentage of Population with a Degree in Liberal Arts and History in the United States is 4.9%.