Zip Codes with the Highest Percentage of Population with a Degree in Liberal Arts and History in New York
RELATED REPORTS & OPTIONS
Liberal Arts and History
New York
Compare Zip Codes
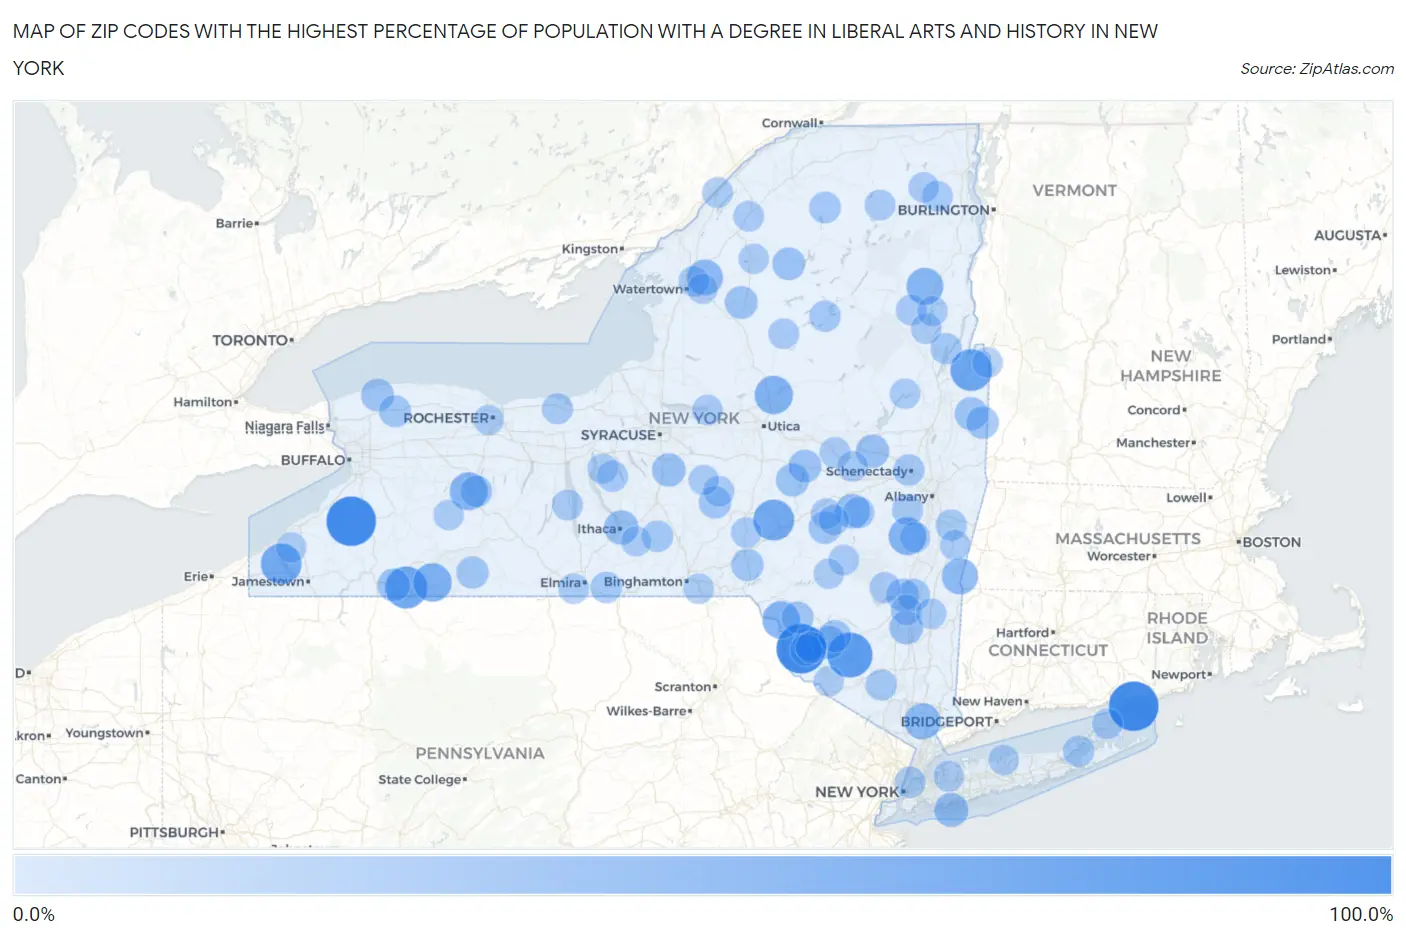
Map of Zip Codes with the Highest Percentage of Population with a Degree in Liberal Arts and History in New York
0.0%
100.0%
Zip Codes with the Highest Percentage of Population with a Degree in Liberal Arts and History in New York
| Zip Code | % Graduates | vs State | vs National | |
| 1. | 12720 | 100.0% | 5.7%(+94.3)#1 | 4.9%(+95.1)#24 |
| 2. | 14035 | 100.0% | 5.7%(+94.3)#2 | 4.9%(+95.1)#45 |
| 3. | 06390 | 100.0% | 5.7%(+94.3)#3 | 4.9%(+95.1)#46 |
| 4. | 12781 | 79.1% | 5.7%(+73.4)#4 | 4.9%(+74.2)#62 |
| 5. | 14788 | 65.5% | 5.7%(+59.8)#5 | 4.9%(+60.6)#85 |
| 6. | 12821 | 64.6% | 5.7%(+58.9)#6 | 4.9%(+59.7)#88 |
| 7. | 13861 | 60.8% | 5.7%(+55.1)#7 | 4.9%(+55.9)#100 |
| 8. | 14722 | 59.6% | 5.7%(+53.8)#8 | 4.9%(+54.7)#106 |
| 9. | 14774 | 50.0% | 5.7%(+44.3)#9 | 4.9%(+45.1)#151 |
| 10. | 13435 | 48.1% | 5.7%(+42.4)#10 | 4.9%(+43.3)#182 |
| 11. | 14556 | 47.2% | 5.7%(+41.5)#11 | 4.9%(+42.3)#187 |
| 12. | 12176 | 46.5% | 5.7%(+40.8)#12 | 4.9%(+41.6)#190 |
| 13. | 12741 | 45.7% | 5.7%(+40.0)#13 | 4.9%(+40.8)#195 |
| 14. | 12855 | 42.5% | 5.7%(+36.8)#14 | 4.9%(+37.6)#228 |
| 15. | 10545 | 39.6% | 5.7%(+33.9)#15 | 4.9%(+34.8)#253 |
| 16. | 12517 | 39.1% | 5.7%(+33.4)#16 | 4.9%(+34.3)#258 |
| 17. | 13602 | 38.1% | 5.7%(+32.4)#17 | 4.9%(+33.2)#267 |
| 18. | 12194 | 33.3% | 5.7%(+27.6)#18 | 4.9%(+28.5)#354 |
| 19. | 14853 | 30.8% | 5.7%(+25.1)#19 | 4.9%(+25.9)#403 |
| 20. | 11569 | 30.0% | 5.7%(+24.3)#20 | 4.9%(+25.1)#422 |
| 21. | 12493 | 28.4% | 5.7%(+22.7)#21 | 4.9%(+23.5)#455 |
| 22. | 13020 | 27.8% | 5.7%(+22.1)#22 | 4.9%(+22.9)#475 |
| 23. | 12751 | 27.6% | 5.7%(+21.8)#23 | 4.9%(+22.7)#479 |
| 24. | 12069 | 26.5% | 5.7%(+20.8)#24 | 4.9%(+21.7)#514 |
| 25. | 12823 | 26.1% | 5.7%(+20.4)#25 | 4.9%(+21.2)#530 |
| 26. | 12749 | 26.0% | 5.7%(+20.3)#26 | 4.9%(+21.2)#537 |
| 27. | 13337 | 25.9% | 5.7%(+20.1)#27 | 4.9%(+21.0)#543 |
| 28. | 14778 | 25.0% | 5.7%(+19.3)#28 | 4.9%(+20.1)#569 |
| 29. | 13690 | 25.0% | 5.7%(+19.3)#29 | 4.9%(+20.1)#571 |
| 30. | 13468 | 25.0% | 5.7%(+19.3)#30 | 4.9%(+20.1)#582 |
| 31. | 13305 | 25.0% | 5.7%(+19.3)#31 | 4.9%(+20.1)#585 |
| 32. | 14008 | 24.5% | 5.7%(+18.8)#32 | 4.9%(+19.7)#608 |
| 33. | 13786 | 24.1% | 5.7%(+18.4)#33 | 4.9%(+19.3)#625 |
| 34. | 12873 | 23.8% | 5.7%(+18.1)#34 | 4.9%(+18.9)#641 |
| 35. | 12475 | 23.3% | 5.7%(+17.5)#35 | 4.9%(+18.4)#664 |
| 36. | 13844 | 22.7% | 5.7%(+17.0)#36 | 4.9%(+17.9)#693 |
| 37. | 14806 | 22.7% | 5.7%(+17.0)#37 | 4.9%(+17.8)#697 |
| 38. | 12507 | 22.4% | 5.7%(+16.7)#38 | 4.9%(+17.5)#712 |
| 39. | 12733 | 22.3% | 5.7%(+16.6)#39 | 4.9%(+17.4)#715 |
| 40. | 13804 | 22.2% | 5.7%(+16.5)#40 | 4.9%(+17.4)#725 |
| 41. | 14105 | 21.1% | 5.7%(+15.4)#41 | 4.9%(+16.3)#791 |
| 42. | 12786 | 21.1% | 5.7%(+15.3)#42 | 4.9%(+16.2)#795 |
| 43. | 12724 | 20.8% | 5.7%(+15.1)#43 | 4.9%(+16.0)#807 |
| 44. | 14462 | 19.9% | 5.7%(+14.1)#44 | 4.9%(+15.0)#877 |
| 45. | 13672 | 19.5% | 5.7%(+13.8)#45 | 4.9%(+14.6)#902 |
| 46. | 13835 | 18.9% | 5.7%(+13.1)#46 | 4.9%(+14.0)#944 |
| 47. | 12305 | 18.7% | 5.7%(+12.9)#47 | 4.9%(+13.8)#964 |
| 48. | 13436 | 18.5% | 5.7%(+12.8)#48 | 4.9%(+13.6)#978 |
| 49. | 14825 | 18.4% | 5.7%(+12.7)#49 | 4.9%(+13.5)#988 |
| 50. | 10914 | 18.2% | 5.7%(+12.5)#50 | 4.9%(+13.3)#1,011 |
| 51. | 10162 | 18.1% | 5.7%(+12.3)#51 | 4.9%(+13.2)#1,031 |
| 52. | 12814 | 18.0% | 5.7%(+12.3)#52 | 4.9%(+13.2)#1,034 |
| 53. | 12071 | 18.0% | 5.7%(+12.3)#53 | 4.9%(+13.2)#1,036 |
| 54. | 11956 | 18.0% | 5.7%(+12.3)#54 | 4.9%(+13.1)#1,038 |
| 55. | 12115 | 17.7% | 5.7%(+12.0)#55 | 4.9%(+12.9)#1,066 |
| 56. | 13147 | 17.3% | 5.7%(+11.6)#56 | 4.9%(+12.5)#1,097 |
| 57. | 12041 | 17.3% | 5.7%(+11.6)#57 | 4.9%(+12.5)#1,100 |
| 58. | 14551 | 16.7% | 5.7%(+10.9)#58 | 4.9%(+11.8)#1,154 |
| 59. | 12778 | 16.7% | 5.7%(+10.9)#59 | 4.9%(+11.8)#1,161 |
| 60. | 12409 | 16.1% | 5.7%(+10.4)#60 | 4.9%(+11.2)#1,248 |
| 61. | 13410 | 16.0% | 5.7%(+10.3)#61 | 4.9%(+11.1)#1,261 |
| 62. | 14842 | 15.9% | 5.7%(+10.1)#62 | 4.9%(+11.0)#1,276 |
| 63. | 11548 | 15.9% | 5.7%(+10.1)#63 | 4.9%(+11.0)#1,277 |
| 64. | 12036 | 15.8% | 5.7%(+10.1)#64 | 4.9%(+10.9)#1,292 |
| 65. | 12857 | 15.8% | 5.7%(+10.0)#65 | 4.9%(+10.9)#1,295 |
| 66. | 12166 | 15.7% | 5.7%(+9.93)#66 | 4.9%(+10.8)#1,308 |
| 67. | 13472 | 15.5% | 5.7%(+9.80)#67 | 4.9%(+10.6)#1,324 |
| 68. | 13464 | 15.5% | 5.7%(+9.77)#68 | 4.9%(+10.6)#1,326 |
| 69. | 12466 | 15.5% | 5.7%(+9.75)#69 | 4.9%(+10.6)#1,332 |
| 70. | 12860 | 15.4% | 5.7%(+9.67)#70 | 4.9%(+10.5)#1,350 |
| 71. | 12976 | 15.4% | 5.7%(+9.67)#71 | 4.9%(+10.5)#1,358 |
| 72. | 12985 | 15.1% | 5.7%(+9.41)#72 | 4.9%(+10.3)#1,397 |
| 73. | 13664 | 15.1% | 5.7%(+9.35)#73 | 4.9%(+10.2)#1,408 |
| 74. | 12981 | 15.1% | 5.7%(+9.34)#74 | 4.9%(+10.2)#1,409 |
| 75. | 13681 | 15.0% | 5.7%(+9.28)#75 | 4.9%(+10.1)#1,419 |
| 76. | 13157 | 14.9% | 5.7%(+9.22)#76 | 4.9%(+10.1)#1,435 |
| 77. | 11957 | 14.8% | 5.7%(+9.11)#77 | 4.9%(+9.95)#1,452 |
| 78. | 13809 | 14.8% | 5.7%(+9.08)#78 | 4.9%(+9.92)#1,464 |
| 79. | 13616 | 14.7% | 5.7%(+9.01)#79 | 4.9%(+9.86)#1,474 |
| 80. | 12870 | 14.6% | 5.7%(+8.92)#80 | 4.9%(+9.77)#1,488 |
| 81. | 12837 | 14.6% | 5.7%(+8.84)#81 | 4.9%(+9.69)#1,510 |
| 82. | 12421 | 14.6% | 5.7%(+8.84)#82 | 4.9%(+9.69)#1,512 |
| 83. | 12514 | 14.4% | 5.7%(+8.72)#83 | 4.9%(+9.57)#1,533 |
| 84. | 12093 | 14.4% | 5.7%(+8.66)#84 | 4.9%(+9.50)#1,540 |
| 85. | 13160 | 14.2% | 5.7%(+8.52)#85 | 4.9%(+9.37)#1,593 |
| 86. | 14784 | 14.2% | 5.7%(+8.46)#86 | 4.9%(+9.31)#1,600 |
| 87. | 12042 | 14.1% | 5.7%(+8.37)#87 | 4.9%(+9.21)#1,620 |
| 88. | 13748 | 14.1% | 5.7%(+8.35)#88 | 4.9%(+9.20)#1,623 |
| 89. | 13612 | 14.0% | 5.7%(+8.33)#89 | 4.9%(+9.17)#1,628 |
| 90. | 14871 | 13.9% | 5.7%(+8.18)#90 | 4.9%(+9.03)#1,661 |
| 91. | 14846 | 13.9% | 5.7%(+8.14)#91 | 4.9%(+8.99)#1,668 |
| 92. | 12835 | 13.9% | 5.7%(+8.13)#92 | 4.9%(+8.98)#1,669 |
| 93. | 14817 | 13.8% | 5.7%(+8.08)#93 | 4.9%(+8.92)#1,683 |
| 94. | 12037 | 13.8% | 5.7%(+8.06)#94 | 4.9%(+8.91)#1,693 |
| 95. | 14611 | 13.7% | 5.7%(+8.01)#95 | 4.9%(+8.86)#1,699 |
| 96. | 12455 | 13.7% | 5.7%(+8.01)#96 | 4.9%(+8.86)#1,700 |
| 97. | 11794 | 13.7% | 5.7%(+8.01)#97 | 4.9%(+8.85)#1,701 |
| 98. | 13072 | 13.7% | 5.7%(+7.99)#98 | 4.9%(+8.84)#1,708 |
| 99. | 12746 | 13.7% | 5.7%(+7.97)#99 | 4.9%(+8.81)#1,712 |
| 100. | 13648 | 13.5% | 5.7%(+7.79)#100 | 4.9%(+8.63)#1,769 |
Common Questions
What are the Top 10 Zip Codes with the Highest Percentage of Population with a Degree in Liberal Arts and History in New York?
Top 10 Zip Codes with the Highest Percentage of Population with a Degree in Liberal Arts and History in New York are:
What zip code has the Highest Percentage of Population with a Degree in Liberal Arts and History in New York?
12720 has the Highest Percentage of Population with a Degree in Liberal Arts and History in New York with 100.0%.
What is the Percentage of Population with a Degree in Liberal Arts and History in the State of New York?
Percentage of Population with a Degree in Liberal Arts and History in New York is 5.7%.
What is the Percentage of Population with a Degree in Liberal Arts and History in the United States?
Percentage of Population with a Degree in Liberal Arts and History in the United States is 4.9%.