Zip Codes with the Highest Percentage of Population with a Degree in Liberal Arts and History in Liverpool, NY
RELATED REPORTS & OPTIONS
Liberal Arts and History
Liverpool
Compare Zip Codes
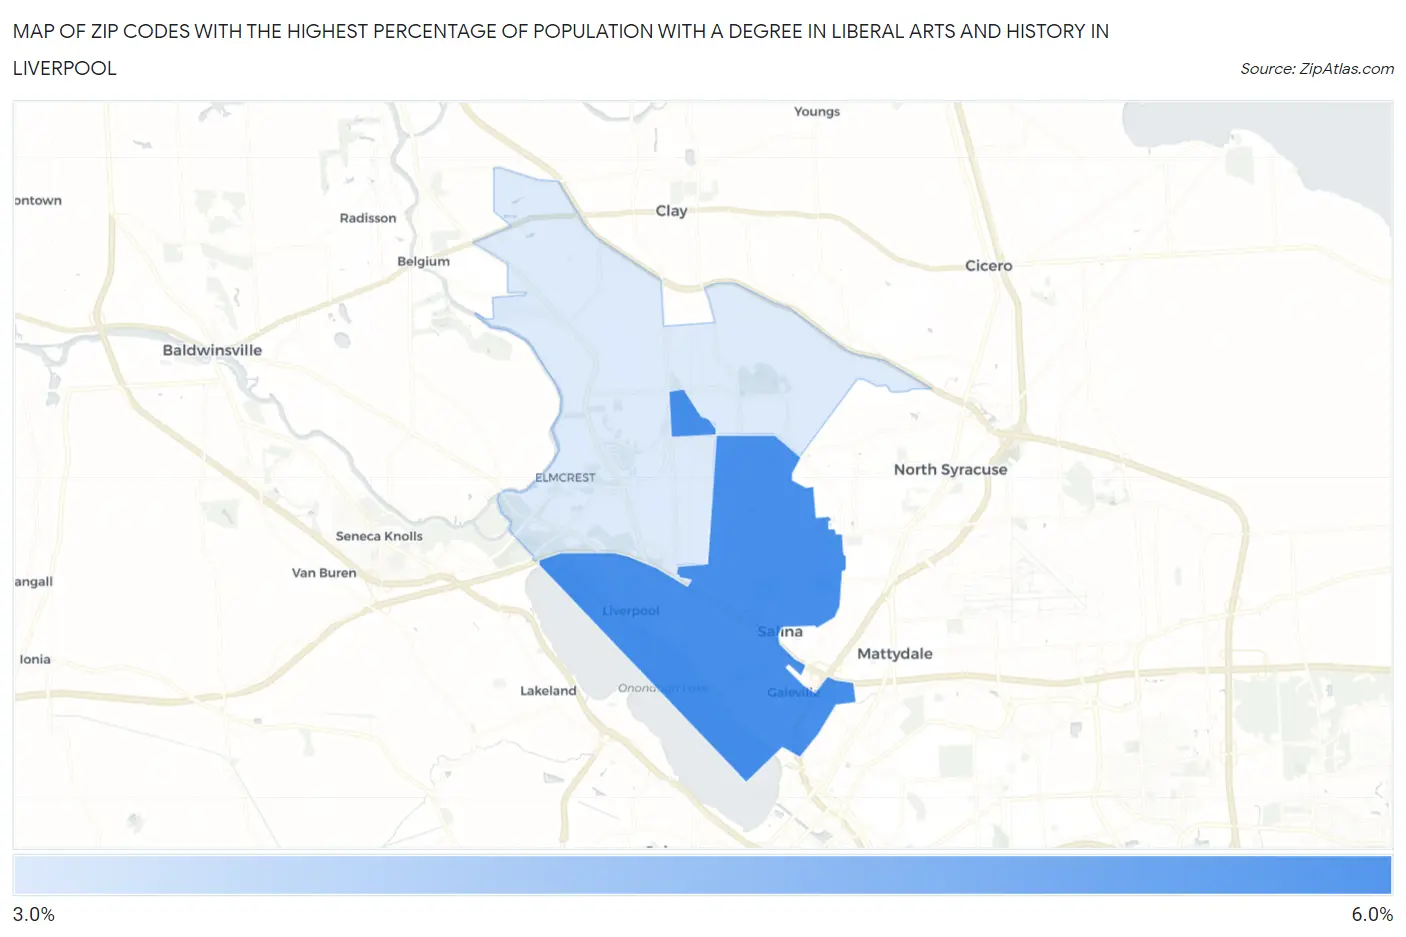
Map of Zip Codes with the Highest Percentage of Population with a Degree in Liberal Arts and History in Liverpool
3.3%
5.6%
Zip Codes with the Highest Percentage of Population with a Degree in Liberal Arts and History in Liverpool, NY
| Zip Code | % Graduates | vs State | vs National | |
| 1. | 13088 | 5.6% | 5.7%(-0.166)#669 | 4.9%(+0.681)#9,713 |
| 2. | 13090 | 3.3% | 5.7%(-2.40)#1,136 | 4.9%(-1.55)#17,258 |
1
Common Questions
What are the Top Zip Codes with the Highest Percentage of Population with a Degree in Liberal Arts and History in Liverpool, NY?
Top Zip Codes with the Highest Percentage of Population with a Degree in Liberal Arts and History in Liverpool, NY are:
What zip code has the Highest Percentage of Population with a Degree in Liberal Arts and History in Liverpool, NY?
13088 has the Highest Percentage of Population with a Degree in Liberal Arts and History in Liverpool, NY with 5.6%.
What is the Percentage of Population with a Degree in Liberal Arts and History in Liverpool, NY?
Percentage of Population with a Degree in Liberal Arts and History in Liverpool is 4.7%.
What is the Percentage of Population with a Degree in Liberal Arts and History in New York?
Percentage of Population with a Degree in Liberal Arts and History in New York is 5.7%.
What is the Percentage of Population with a Degree in Liberal Arts and History in the United States?
Percentage of Population with a Degree in Liberal Arts and History in the United States is 4.9%.