West Carthage, NY Map & Demographics
West Carthage Map
West Carthage Overview
$39,909
PER CAPITA INCOME
$90,375
AVG FAMILY INCOME
$46,875
AVG HOUSEHOLD INCOME
34.0%
WAGE / INCOME GAP [ % ]
66.0¢/ $1
WAGE / INCOME GAP [ $ ]
0.51
INEQUALITY / GINI INDEX
1,632
TOTAL POPULATION
803
MALE POPULATION
829
FEMALE POPULATION
96.86
MALES / 100 FEMALES
103.24
FEMALES / 100 MALES
33.1
MEDIAN AGE
2.8
AVG FAMILY SIZE
1.9
AVG HOUSEHOLD SIZE
822
LABOR FORCE [ PEOPLE ]
60.5%
PERCENT IN LABOR FORCE
0.9%
UNEMPLOYMENT RATE
Income in West Carthage
Income Overview in West Carthage
Per Capita Income in West Carthage is $39,909, while median incomes of families and households are $90,375 and $46,875 respectively.
| Characteristic | Number | Measure |
| Per Capita Income | 1,632 | $39,909 |
| Median Family Income | 373 | $90,375 |
| Mean Family Income | 373 | $105,227 |
| Median Household Income | 845 | $46,875 |
| Mean Household Income | 845 | $77,124 |
| Income Deficit | 373 | $0 |
| Wage / Income Gap (%) | 1,632 | 33.99% |
| Wage / Income Gap ($) | 1,632 | 66.01¢ per $1 |
| Gini / Inequality Index | 1,632 | 0.51 |
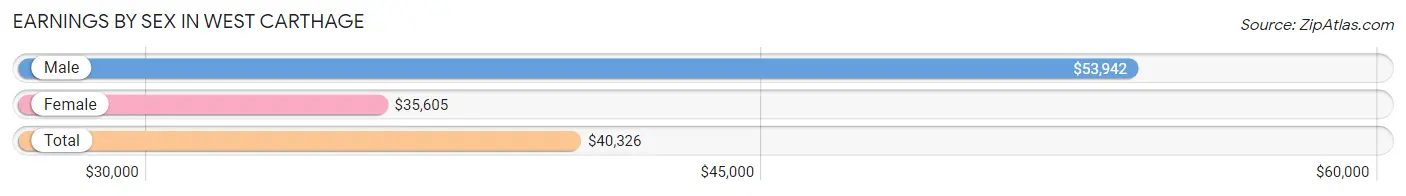
Earnings by Sex in West Carthage
Average Earnings in West Carthage are $40,326, $53,942 for men and $35,605 for women, a difference of 34.0%.
| Sex | Number | Average Earnings |
| Male | 449 (52.6%) | $53,942 |
| Female | 405 (47.4%) | $35,605 |
| Total | 854 (100.0%) | $40,326 |
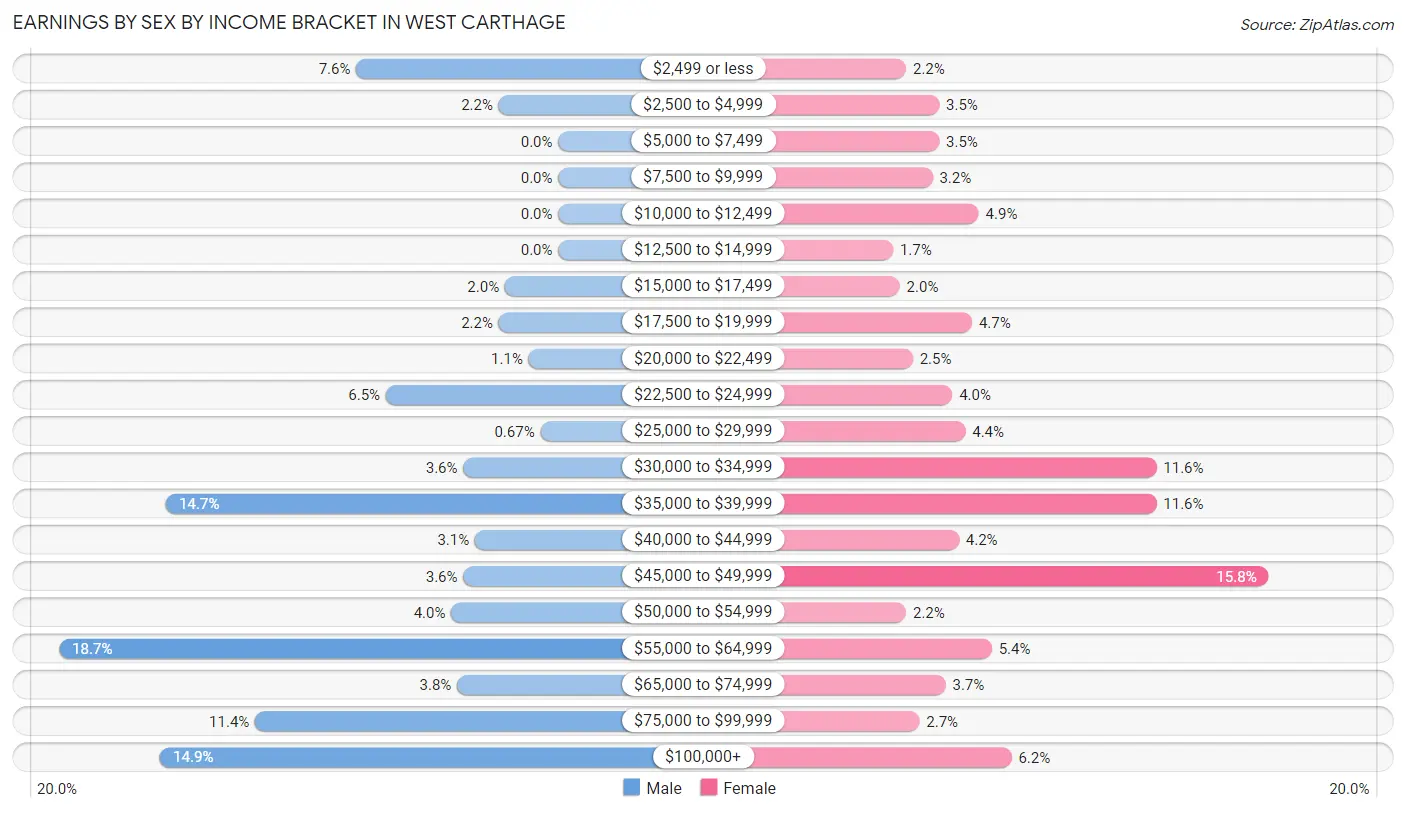
Earnings by Sex by Income Bracket in West Carthage
The most common earnings brackets in West Carthage are $55,000 to $64,999 for men (84 | 18.7%) and $45,000 to $49,999 for women (64 | 15.8%).
| Income | Male | Female |
| $2,499 or less | 34 (7.6%) | 9 (2.2%) |
| $2,500 to $4,999 | 10 (2.2%) | 14 (3.5%) |
| $5,000 to $7,499 | 0 (0.0%) | 14 (3.5%) |
| $7,500 to $9,999 | 0 (0.0%) | 13 (3.2%) |
| $10,000 to $12,499 | 0 (0.0%) | 20 (4.9%) |
| $12,500 to $14,999 | 0 (0.0%) | 7 (1.7%) |
| $15,000 to $17,499 | 9 (2.0%) | 8 (2.0%) |
| $17,500 to $19,999 | 10 (2.2%) | 19 (4.7%) |
| $20,000 to $22,499 | 5 (1.1%) | 10 (2.5%) |
| $22,500 to $24,999 | 29 (6.5%) | 16 (4.0%) |
| $25,000 to $29,999 | 3 (0.7%) | 18 (4.4%) |
| $30,000 to $34,999 | 16 (3.6%) | 47 (11.6%) |
| $35,000 to $39,999 | 66 (14.7%) | 47 (11.6%) |
| $40,000 to $44,999 | 14 (3.1%) | 17 (4.2%) |
| $45,000 to $49,999 | 16 (3.6%) | 64 (15.8%) |
| $50,000 to $54,999 | 18 (4.0%) | 9 (2.2%) |
| $55,000 to $64,999 | 84 (18.7%) | 22 (5.4%) |
| $65,000 to $74,999 | 17 (3.8%) | 15 (3.7%) |
| $75,000 to $99,999 | 51 (11.4%) | 11 (2.7%) |
| $100,000+ | 67 (14.9%) | 25 (6.2%) |
| Total | 449 (100.0%) | 405 (100.0%) |
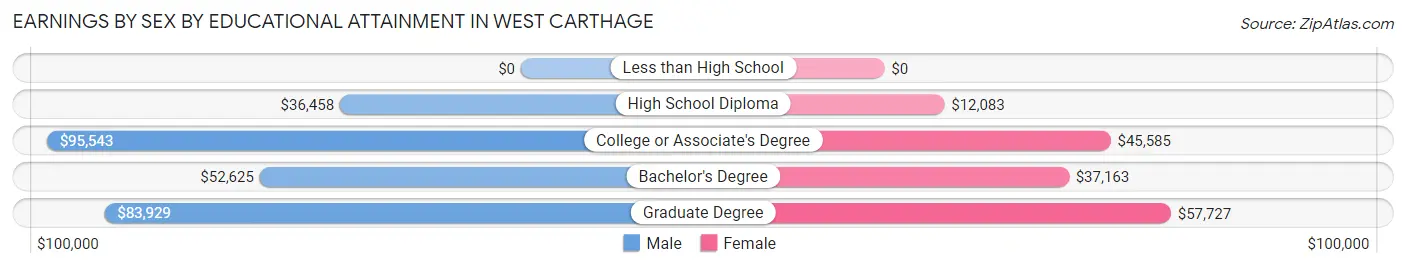
Earnings by Sex by Educational Attainment in West Carthage
Average earnings in West Carthage are $58,897 for men and $37,137 for women, a difference of 36.9%. Men with an educational attainment of college or associate's degree enjoy the highest average annual earnings of $95,543, while those with high school diploma education earn the least with $36,458. Women with an educational attainment of graduate degree earn the most with the average annual earnings of $57,727, while those with high school diploma education have the smallest earnings of $12,083.
| Educational Attainment | Male Income | Female Income |
| Less than High School | - | - |
| High School Diploma | $36,458 | $12,083 |
| College or Associate's Degree | $95,543 | $45,585 |
| Bachelor's Degree | $52,625 | $37,163 |
| Graduate Degree | $83,929 | $57,727 |
| Total | $58,897 | $37,137 |
Family Income in West Carthage
Family Income Brackets in West Carthage
According to the West Carthage family income data, there are 124 families falling into the $100,000 to $149,999 income range, which is the most common income bracket and makes up 33.2% of all families. Conversely, the $10,000 to $14,999 income bracket is the least frequent group with only 9 families (2.4%) belonging to this category.
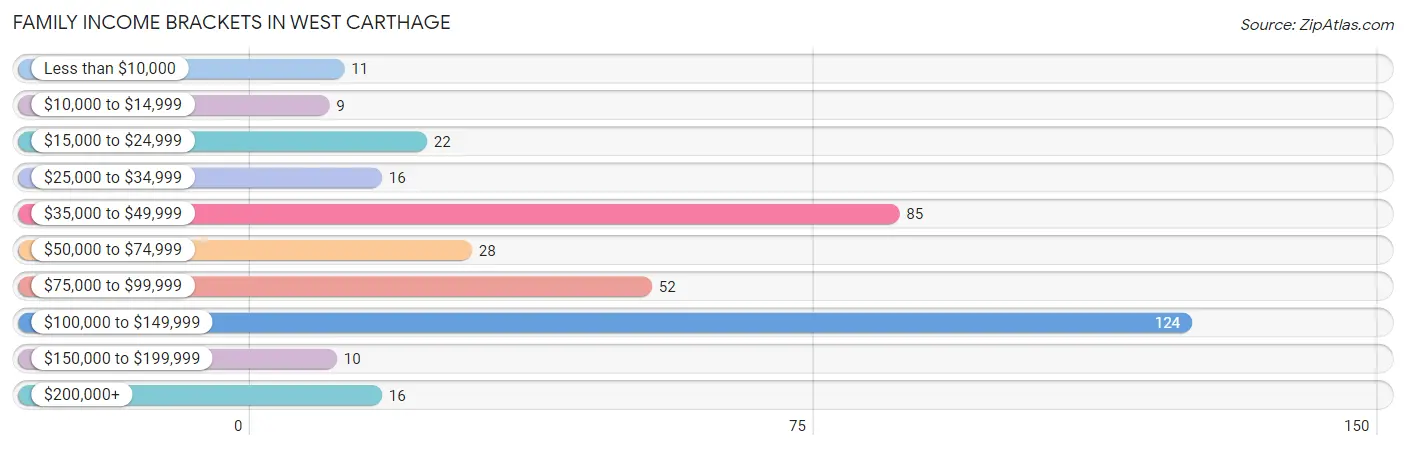
| Income Bracket | # Families | % Families |
| Less than $10,000 | 11 | 2.9% |
| $10,000 to $14,999 | 9 | 2.4% |
| $15,000 to $24,999 | 22 | 5.9% |
| $25,000 to $34,999 | 16 | 4.3% |
| $35,000 to $49,999 | 85 | 22.8% |
| $50,000 to $74,999 | 28 | 7.5% |
| $75,000 to $99,999 | 52 | 13.9% |
| $100,000 to $149,999 | 124 | 33.2% |
| $150,000 to $199,999 | 10 | 2.7% |
| $200,000+ | 16 | 4.3% |
Family Income by Famaliy Size in West Carthage
4-person families (30 | 8.0%) account for the highest median family income in West Carthage with $109,000 per family, while 3-person families (89 | 23.9%) have the highest median income of $31,521 per family member.
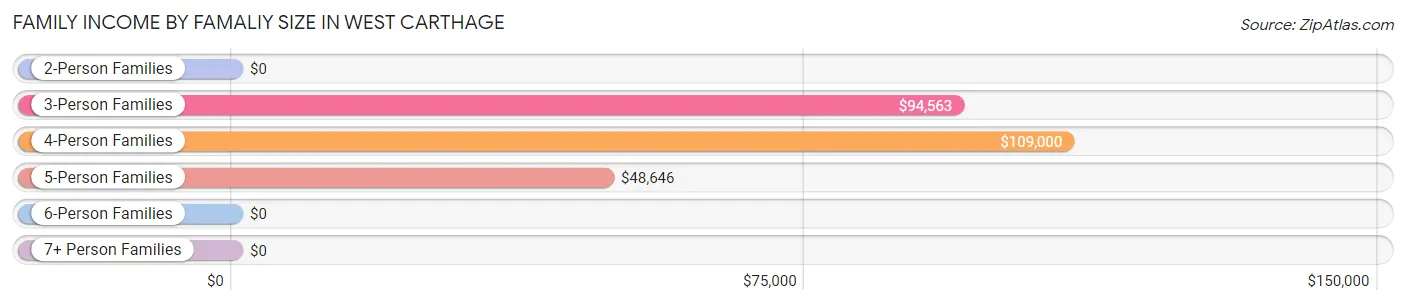
| Income Bracket | # Families | Median Income |
| 2-Person Families | 197 (52.8%) | $0 |
| 3-Person Families | 89 (23.9%) | $94,563 |
| 4-Person Families | 30 (8.0%) | $109,000 |
| 5-Person Families | 38 (10.2%) | $48,646 |
| 6-Person Families | 0 (0.0%) | $0 |
| 7+ Person Families | 19 (5.1%) | $0 |
| Total | 373 (100.0%) | $90,375 |
Family Income by Number of Earners in West Carthage
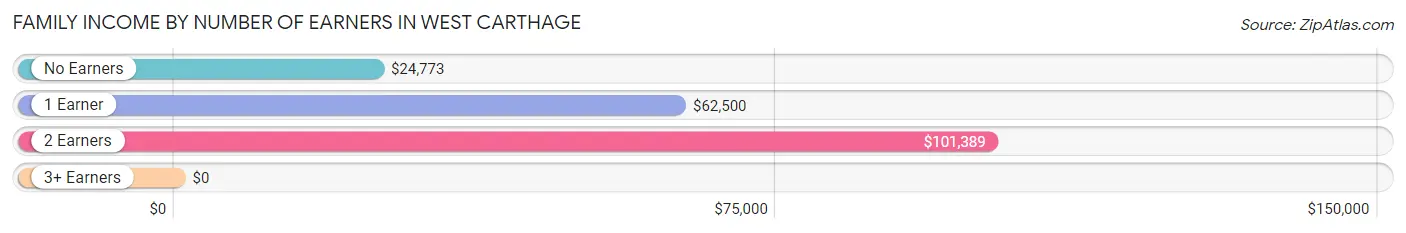
| Number of Earners | # Families | Median Income |
| No Earners | 66 (17.7%) | $24,773 |
| 1 Earner | 130 (34.8%) | $62,500 |
| 2 Earners | 170 (45.6%) | $101,389 |
| 3+ Earners | 7 (1.9%) | $0 |
| Total | 373 (100.0%) | $90,375 |
Household Income in West Carthage
Household Income Brackets in West Carthage
With 217 households falling in the category, the $35,000 to $49,999 income range is the most frequent in West Carthage, accounting for 25.7% of all households. In contrast, only 36 households (4.3%) fall into the $150,000 to $199,999 income bracket, making it the least populous group.
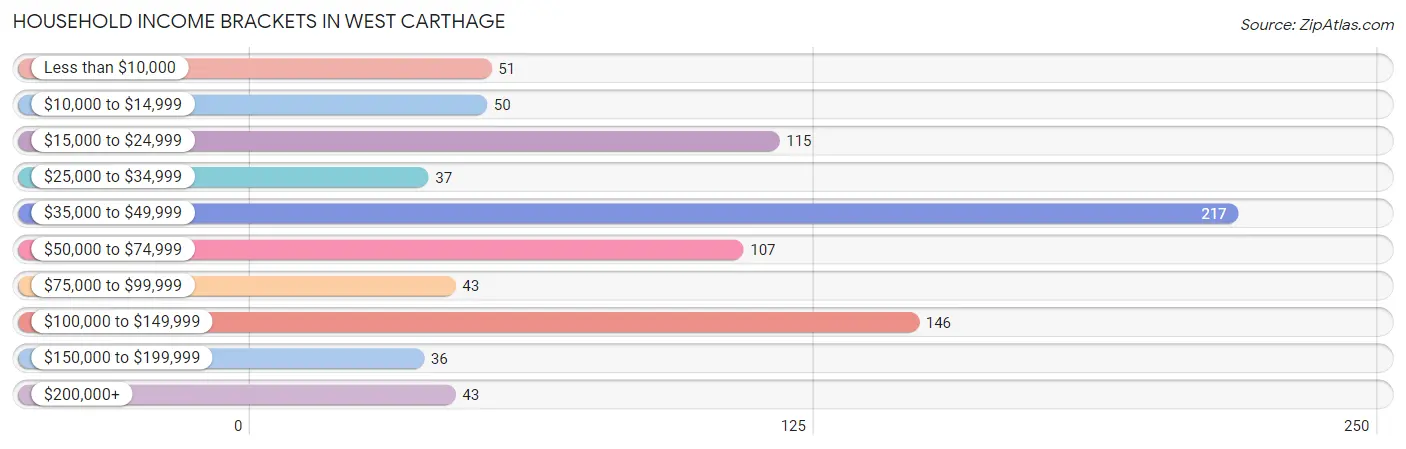
| Income Bracket | # Households | % Households |
| Less than $10,000 | 51 | 6.0% |
| $10,000 to $14,999 | 50 | 5.9% |
| $15,000 to $24,999 | 115 | 13.6% |
| $25,000 to $34,999 | 37 | 4.4% |
| $35,000 to $49,999 | 217 | 25.7% |
| $50,000 to $74,999 | 107 | 12.7% |
| $75,000 to $99,999 | 43 | 5.1% |
| $100,000 to $149,999 | 146 | 17.3% |
| $150,000 to $199,999 | 36 | 4.3% |
| $200,000+ | 43 | 5.1% |
Household Income by Householder Age in West Carthage
The median household income in West Carthage is $46,875, with the highest median household income of $66,094 found in the 25 to 44 years age bracket for the primary householder. A total of 341 households (40.4%) fall into this category. Meanwhile, the 65+ years age bracket for the primary householder has the lowest median household income of $28,750, with 239 households (28.3%) in this group.
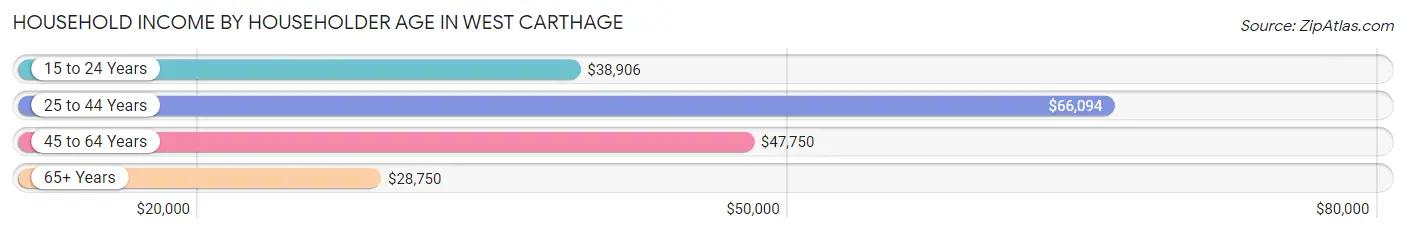
| Income Bracket | # Households | Median Income |
| 15 to 24 Years | 84 (9.9%) | $38,906 |
| 25 to 44 Years | 341 (40.4%) | $66,094 |
| 45 to 64 Years | 181 (21.4%) | $47,750 |
| 65+ Years | 239 (28.3%) | $28,750 |
| Total | 845 (100.0%) | $46,875 |
Poverty in West Carthage
Income Below Poverty by Sex and Age in West Carthage
With 10.3% poverty level for males and 13.0% for females among the residents of West Carthage, 75 year old and over males and 15 year old females are the most vulnerable to poverty, with 17 males (35.4%) and 4 females (100.0%) in their respective age groups living below the poverty level.
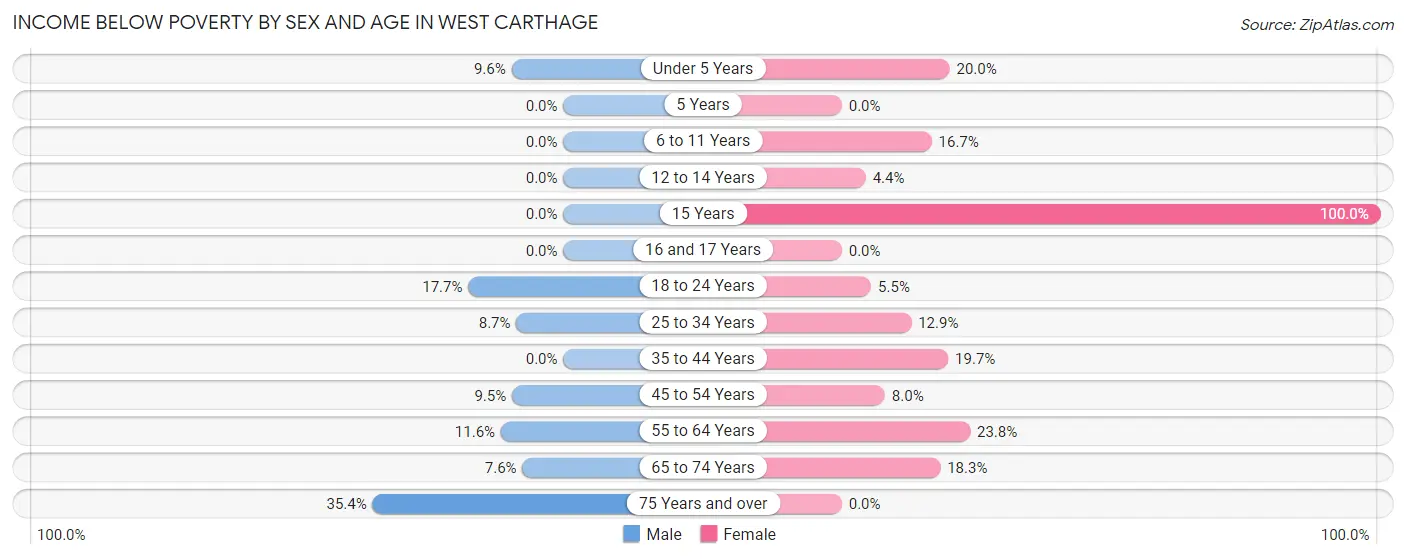
| Age Bracket | Male | Female |
| Under 5 Years | 5 (9.6%) | 10 (20.0%) |
| 5 Years | 0 (0.0%) | 0 (0.0%) |
| 6 to 11 Years | 0 (0.0%) | 3 (16.7%) |
| 12 to 14 Years | 0 (0.0%) | 2 (4.4%) |
| 15 Years | 0 (0.0%) | 4 (100.0%) |
| 16 and 17 Years | 0 (0.0%) | 0 (0.0%) |
| 18 to 24 Years | 24 (17.6%) | 6 (5.4%) |
| 25 to 34 Years | 15 (8.7%) | 25 (12.9%) |
| 35 to 44 Years | 0 (0.0%) | 15 (19.7%) |
| 45 to 54 Years | 6 (9.5%) | 4 (8.0%) |
| 55 to 64 Years | 8 (11.6%) | 20 (23.8%) |
| 65 to 74 Years | 6 (7.6%) | 19 (18.3%) |
| 75 Years and over | 17 (35.4%) | 0 (0.0%) |
| Total | 81 (10.3%) | 108 (13.0%) |
Income Above Poverty by Sex and Age in West Carthage
According to the poverty statistics in West Carthage, males aged 5 years and females aged 5 years are the age groups that are most secure financially, with 100.0% of males and 100.0% of females in these age groups living above the poverty line.
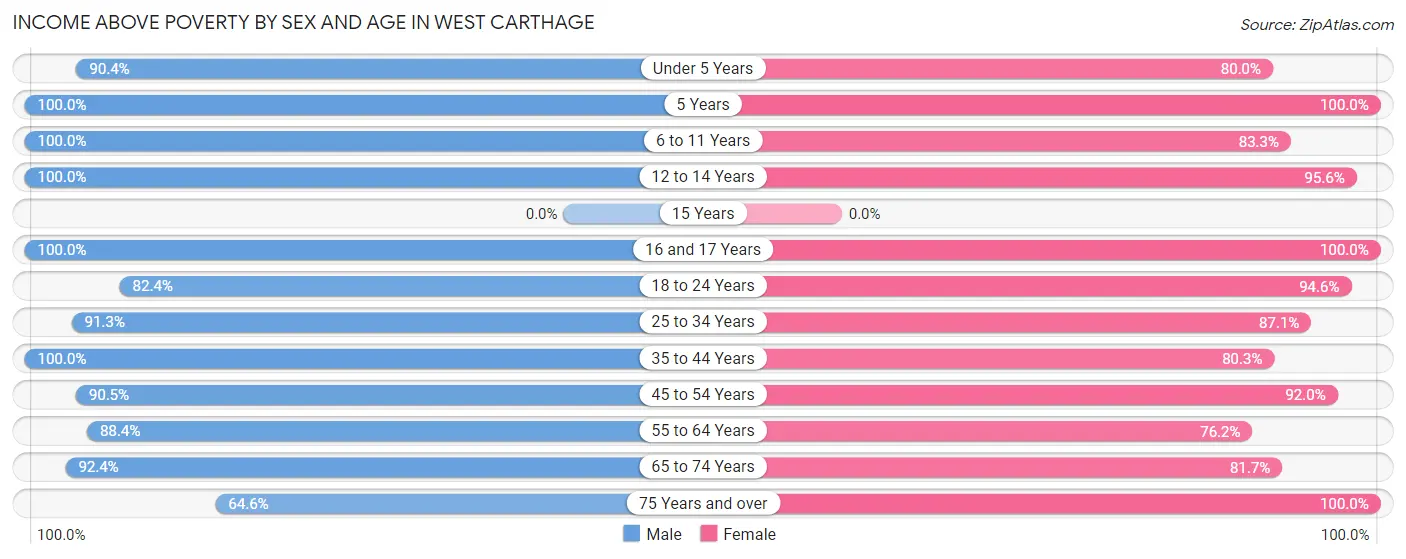
| Age Bracket | Male | Female |
| Under 5 Years | 47 (90.4%) | 40 (80.0%) |
| 5 Years | 10 (100.0%) | 7 (100.0%) |
| 6 to 11 Years | 64 (100.0%) | 15 (83.3%) |
| 12 to 14 Years | 7 (100.0%) | 43 (95.6%) |
| 15 Years | 0 (0.0%) | 0 (0.0%) |
| 16 and 17 Years | 4 (100.0%) | 13 (100.0%) |
| 18 to 24 Years | 112 (82.4%) | 104 (94.6%) |
| 25 to 34 Years | 157 (91.3%) | 169 (87.1%) |
| 35 to 44 Years | 82 (100.0%) | 61 (80.3%) |
| 45 to 54 Years | 57 (90.5%) | 46 (92.0%) |
| 55 to 64 Years | 61 (88.4%) | 64 (76.2%) |
| 65 to 74 Years | 73 (92.4%) | 85 (81.7%) |
| 75 Years and over | 31 (64.6%) | 74 (100.0%) |
| Total | 705 (89.7%) | 721 (87.0%) |
Income Below Poverty Among Married-Couple Families in West Carthage
The poverty statistics for married-couple families in West Carthage show that 4.6% or 12 of the total 259 families live below the poverty line. Families with 3 or 4 children have the highest poverty rate of 10.4%, comprising of 5 families. On the other hand, families with no children have the lowest poverty rate of 3.2%, which includes 4 families.
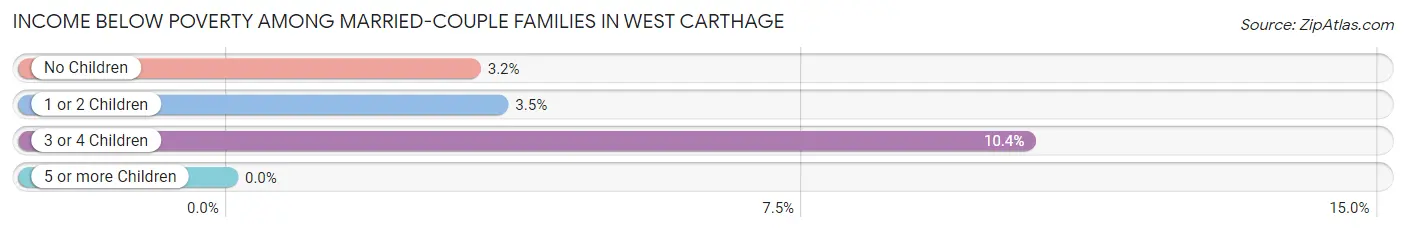
| Children | Above Poverty | Below Poverty |
| No Children | 122 (96.8%) | 4 (3.2%) |
| 1 or 2 Children | 82 (96.5%) | 3 (3.5%) |
| 3 or 4 Children | 43 (89.6%) | 5 (10.4%) |
| 5 or more Children | 0 (0.0%) | 0 (0.0%) |
| Total | 247 (95.4%) | 12 (4.6%) |
Income Below Poverty Among Single-Parent Households in West Carthage
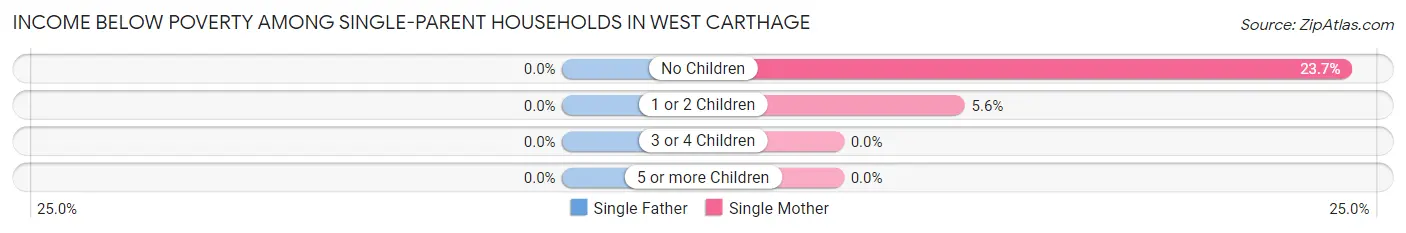
| Children | Single Father | Single Mother |
| No Children | 0 (0.0%) | 9 (23.7%) |
| 1 or 2 Children | 0 (0.0%) | 4 (5.6%) |
| 3 or 4 Children | 0 (0.0%) | 0 (0.0%) |
| 5 or more Children | 0 (0.0%) | 0 (0.0%) |
| Total | 0 (0.0%) | 13 (11.9%) |
Income Below Poverty Among Married-Couple vs Single-Parent Households in West Carthage
The poverty data for West Carthage shows that 12 of the married-couple family households (4.6%) and 13 of the single-parent households (11.4%) are living below the poverty level. Within the married-couple family households, those with 3 or 4 children have the highest poverty rate, with 5 households (10.4%) falling below the poverty line. Among the single-parent households, those with no children have the highest poverty rate, with 9 household (23.7%) living below poverty.
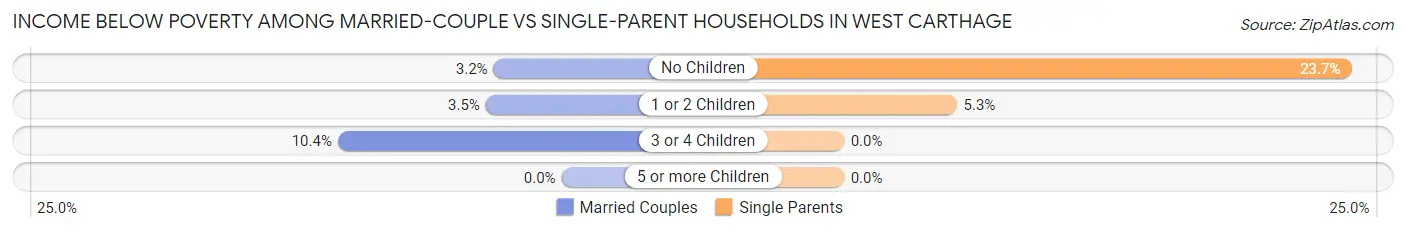
| Children | Married-Couple Families | Single-Parent Households |
| No Children | 4 (3.2%) | 9 (23.7%) |
| 1 or 2 Children | 3 (3.5%) | 4 (5.3%) |
| 3 or 4 Children | 5 (10.4%) | 0 (0.0%) |
| 5 or more Children | 0 (0.0%) | 0 (0.0%) |
| Total | 12 (4.6%) | 13 (11.4%) |
Race in West Carthage
The most populous races in West Carthage are White / Caucasian (1,286 | 78.8%), Hispanic or Latino (177 | 10.8%), and Black / African American (155 | 9.5%).
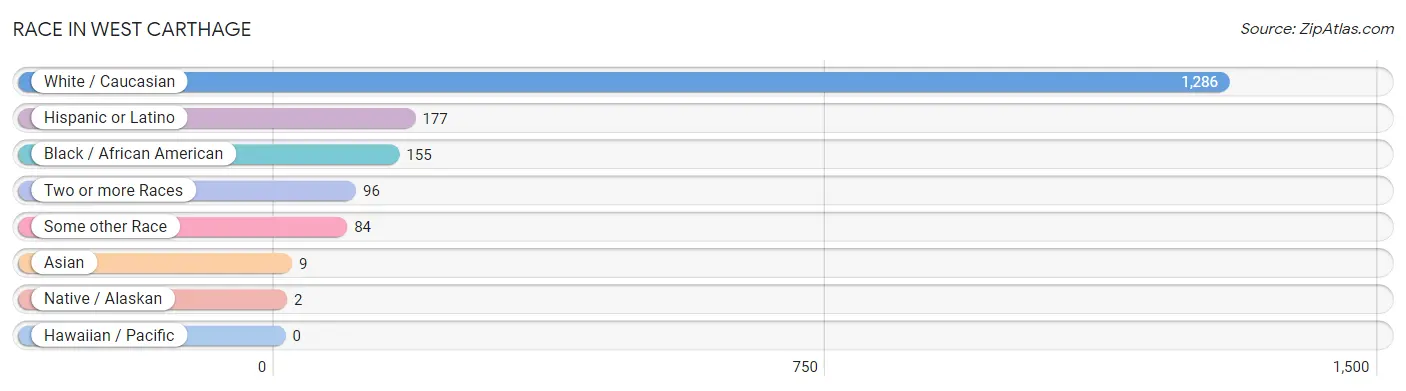
| Race | # Population | % Population |
| Asian | 9 | 0.5% |
| Black / African American | 155 | 9.5% |
| Hawaiian / Pacific | 0 | 0.0% |
| Hispanic or Latino | 177 | 10.8% |
| Native / Alaskan | 2 | 0.1% |
| White / Caucasian | 1,286 | 78.8% |
| Two or more Races | 96 | 5.9% |
| Some other Race | 84 | 5.1% |
| Total | 1,632 | 100.0% |
Ancestry in West Carthage
The most populous ancestries reported in West Carthage are German (222 | 13.6%), Irish (222 | 13.6%), English (136 | 8.3%), French (119 | 7.3%), and Mexican (111 | 6.8%), together accounting for 49.6% of all West Carthage residents.
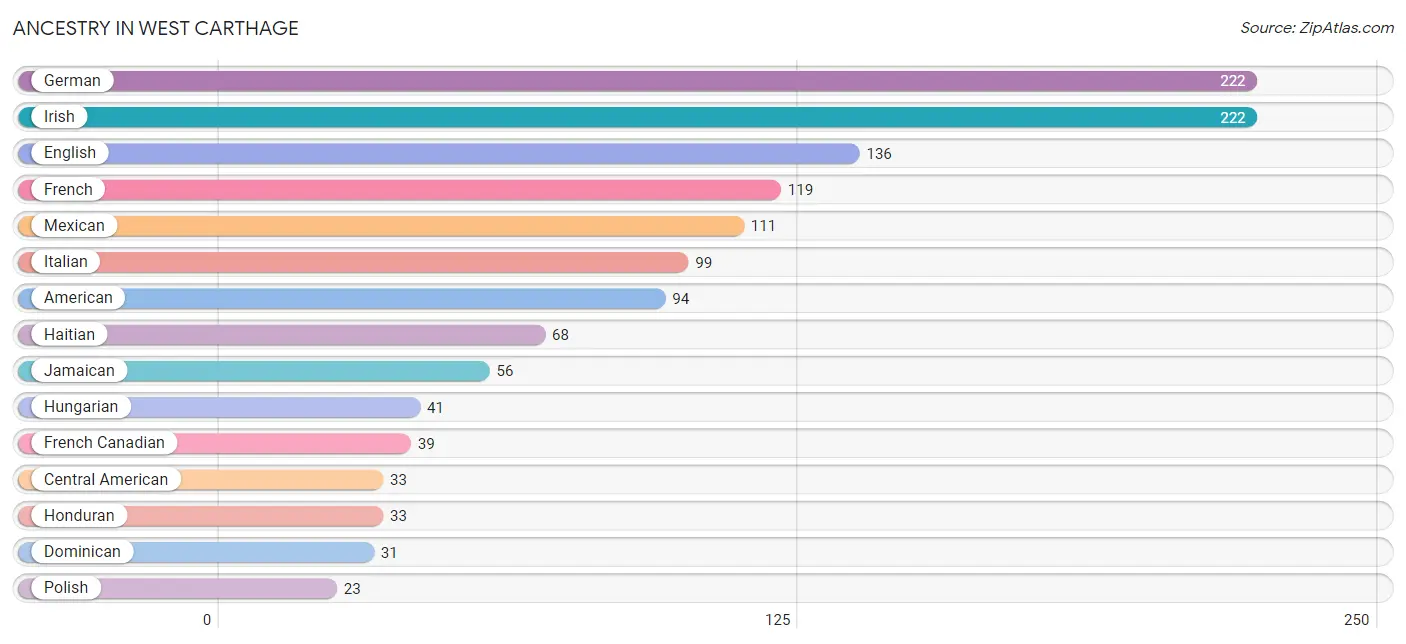
| Ancestry | # Population | % Population |
| American | 94 | 5.8% |
| Arab | 9 | 0.5% |
| British | 4 | 0.3% |
| Burmese | 7 | 0.4% |
| Canadian | 10 | 0.6% |
| Central American | 33 | 2.0% |
| Czech | 6 | 0.4% |
| Dominican | 31 | 1.9% |
| Dutch | 13 | 0.8% |
| English | 136 | 8.3% |
| European | 20 | 1.2% |
| French | 119 | 7.3% |
| French American Indian | 1 | 0.1% |
| French Canadian | 39 | 2.4% |
| German | 222 | 13.6% |
| Greek | 9 | 0.5% |
| Haitian | 68 | 4.2% |
| Honduran | 33 | 2.0% |
| Hungarian | 41 | 2.5% |
| Irish | 222 | 13.6% |
| Iroquois | 2 | 0.1% |
| Italian | 99 | 6.1% |
| Jamaican | 56 | 3.4% |
| Lebanese | 9 | 0.5% |
| Mexican | 111 | 6.8% |
| Polish | 23 | 1.4% |
| Russian | 3 | 0.2% |
| Scotch-Irish | 10 | 0.6% |
| Scottish | 19 | 1.2% |
| Serbian | 6 | 0.4% |
| Swedish | 3 | 0.2% |
| Swiss | 10 | 0.6% |
| Ukrainian | 5 | 0.3% | View All 33 Rows |
Immigrants in West Carthage
The most numerous immigrant groups reported in West Carthage came from Latin America (136 | 8.3%), Caribbean (79 | 4.8%), Central America (57 | 3.5%), Jamaica (48 | 2.9%), and Honduras (33 | 2.0%), together accounting for 21.6% of all West Carthage residents.
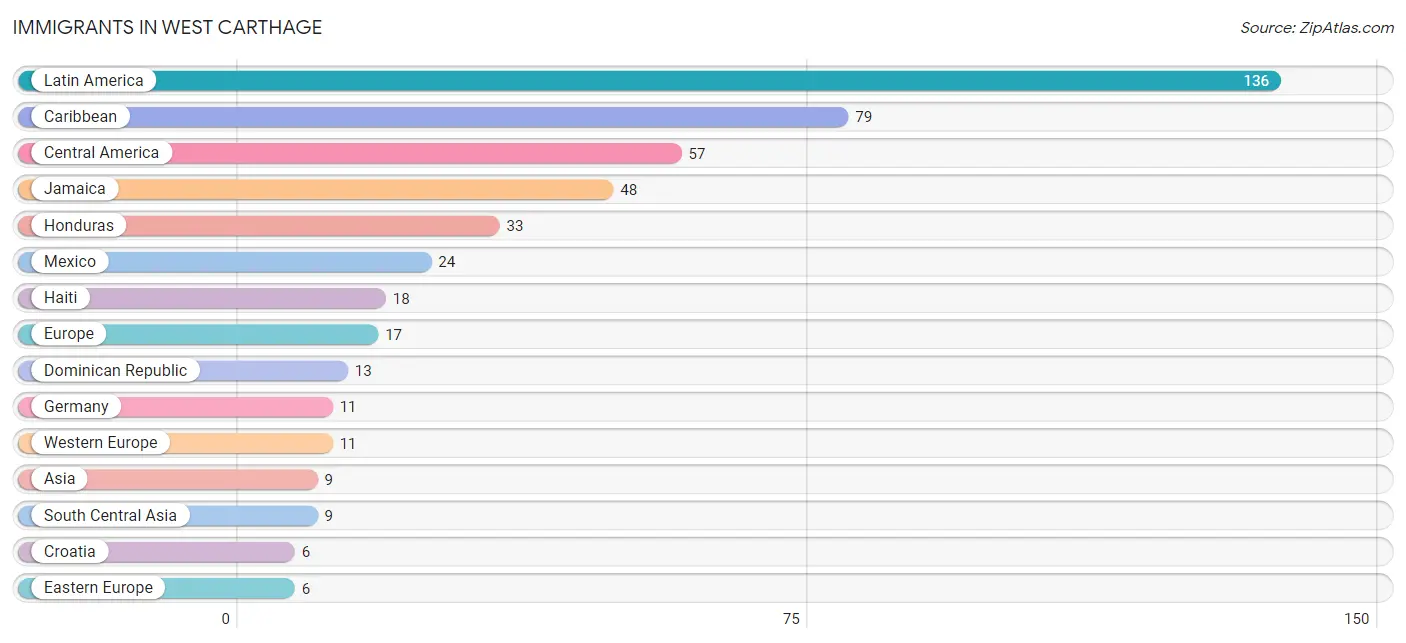
| Immigration Origin | # Population | % Population |
| Asia | 9 | 0.5% |
| Canada | 5 | 0.3% |
| Caribbean | 79 | 4.8% |
| Central America | 57 | 3.5% |
| Croatia | 6 | 0.4% |
| Dominican Republic | 13 | 0.8% |
| Eastern Europe | 6 | 0.4% |
| Europe | 17 | 1.0% |
| Germany | 11 | 0.7% |
| Haiti | 18 | 1.1% |
| Honduras | 33 | 2.0% |
| India | 4 | 0.3% |
| Jamaica | 48 | 2.9% |
| Latin America | 136 | 8.3% |
| Mexico | 24 | 1.5% |
| Pakistan | 5 | 0.3% |
| South Central Asia | 9 | 0.5% |
| Western Europe | 11 | 0.7% | View All 18 Rows |
Sex and Age in West Carthage
Sex and Age in West Carthage
The most populous age groups in West Carthage are 20 to 24 Years (116 | 14.4%) for men and 25 to 29 Years (113 | 13.6%) for women.
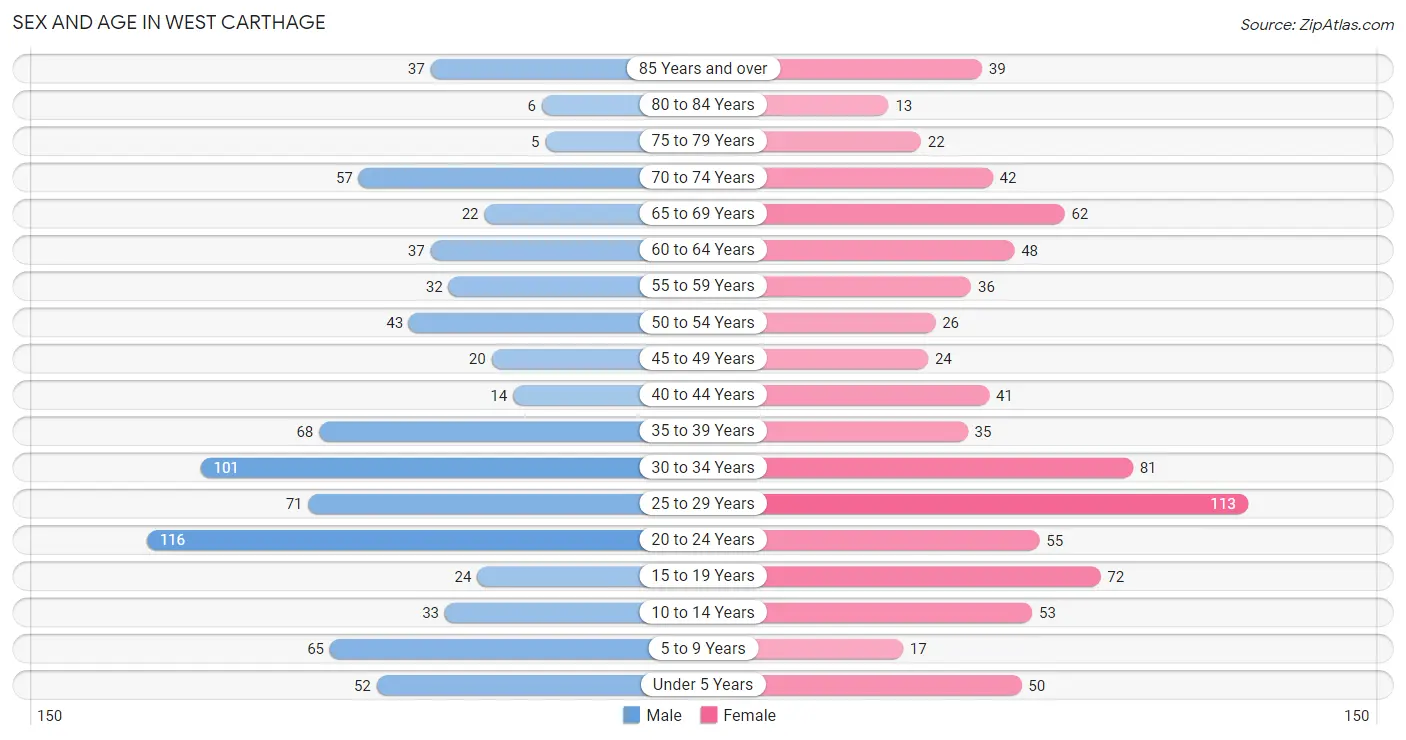
| Age Bracket | Male | Female |
| Under 5 Years | 52 (6.5%) | 50 (6.0%) |
| 5 to 9 Years | 65 (8.1%) | 17 (2.1%) |
| 10 to 14 Years | 33 (4.1%) | 53 (6.4%) |
| 15 to 19 Years | 24 (3.0%) | 72 (8.7%) |
| 20 to 24 Years | 116 (14.4%) | 55 (6.6%) |
| 25 to 29 Years | 71 (8.8%) | 113 (13.6%) |
| 30 to 34 Years | 101 (12.6%) | 81 (9.8%) |
| 35 to 39 Years | 68 (8.5%) | 35 (4.2%) |
| 40 to 44 Years | 14 (1.7%) | 41 (5.0%) |
| 45 to 49 Years | 20 (2.5%) | 24 (2.9%) |
| 50 to 54 Years | 43 (5.3%) | 26 (3.1%) |
| 55 to 59 Years | 32 (4.0%) | 36 (4.3%) |
| 60 to 64 Years | 37 (4.6%) | 48 (5.8%) |
| 65 to 69 Years | 22 (2.7%) | 62 (7.5%) |
| 70 to 74 Years | 57 (7.1%) | 42 (5.1%) |
| 75 to 79 Years | 5 (0.6%) | 22 (2.6%) |
| 80 to 84 Years | 6 (0.7%) | 13 (1.6%) |
| 85 Years and over | 37 (4.6%) | 39 (4.7%) |
| Total | 803 (100.0%) | 829 (100.0%) |
Families and Households in West Carthage
Median Family Size in West Carthage
The median family size in West Carthage is 2.76 persons per family, with married-couple families (259 | 69.4%) accounting for the largest median family size of 2.98 persons per family. On the other hand, single male/father families (5 | 1.3%) represent the smallest median family size with 2.00 persons per family.
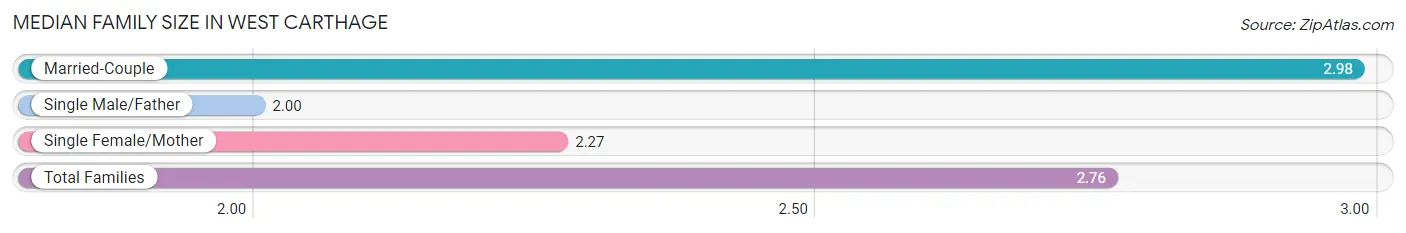
| Family Type | # Families | Family Size |
| Married-Couple | 259 (69.4%) | 2.98 |
| Single Male/Father | 5 (1.3%) | 2.00 |
| Single Female/Mother | 109 (29.2%) | 2.27 |
| Total Families | 373 (100.0%) | 2.76 |
Median Household Size in West Carthage
The median household size in West Carthage is 1.92 persons per household, with married-couple households (259 | 30.6%) accounting for the largest median household size of 3.14 persons per household. non-family households (472 | 55.9%) represent the smallest median household size with 1.13 persons per household.
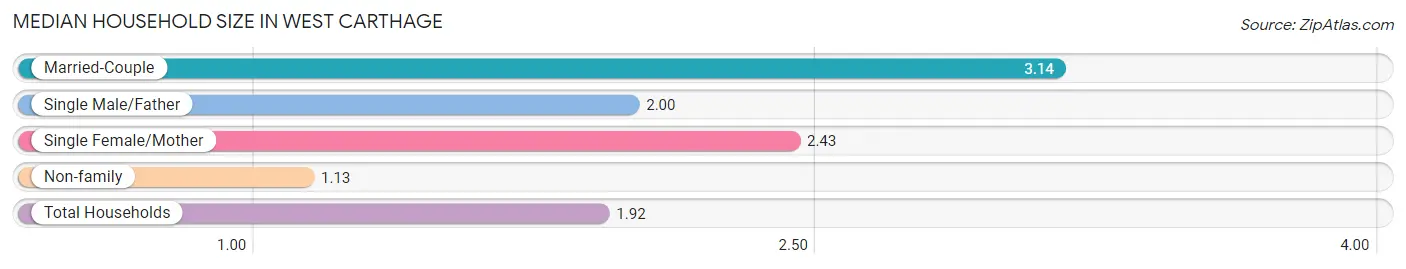
| Household Type | # Households | Household Size |
| Married-Couple | 259 (30.6%) | 3.14 |
| Single Male/Father | 5 (0.6%) | 2.00 |
| Single Female/Mother | 109 (12.9%) | 2.43 |
| Non-family | 472 (55.9%) | 1.13 |
| Total Households | 845 (100.0%) | 1.92 |
Household Size by Marriage Status in West Carthage
Out of a total of 845 households in West Carthage, 373 (44.1%) are family households, while 472 (55.9%) are nonfamily households. The most numerous type of family households are 2-person households, comprising 171, and the most common type of nonfamily households are 1-person households, comprising 423.
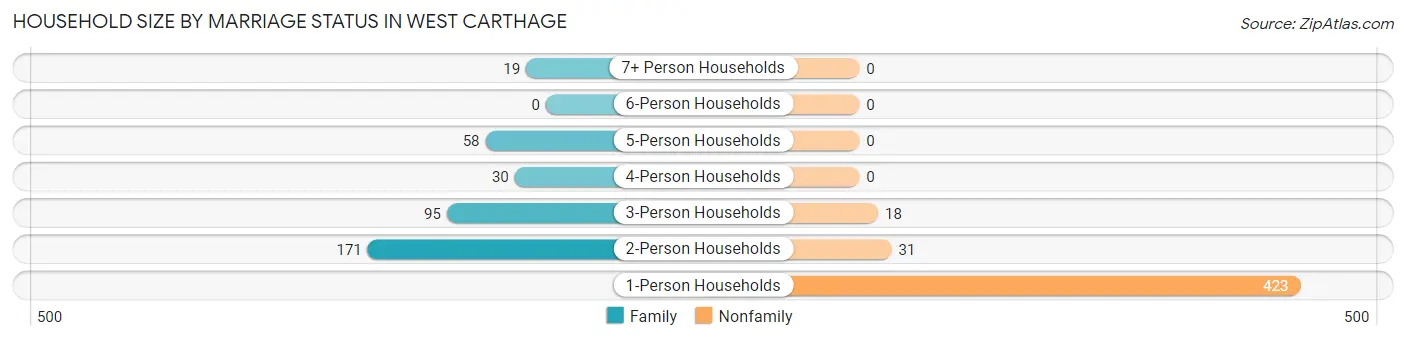
| Household Size | Family Households | Nonfamily Households |
| 1-Person Households | - | 423 (50.1%) |
| 2-Person Households | 171 (20.2%) | 31 (3.7%) |
| 3-Person Households | 95 (11.2%) | 18 (2.1%) |
| 4-Person Households | 30 (3.5%) | 0 (0.0%) |
| 5-Person Households | 58 (6.9%) | 0 (0.0%) |
| 6-Person Households | 0 (0.0%) | 0 (0.0%) |
| 7+ Person Households | 19 (2.2%) | 0 (0.0%) |
| Total | 373 (44.1%) | 472 (55.9%) |
Female Fertility in West Carthage
Fertility by Age in West Carthage
Average fertility rate in West Carthage is 101.0 births per 1,000 women. Women in the age bracket of 20 to 34 years have the highest fertility rate with 173.0 births per 1,000 women. Women in the age bracket of 20 to 34 years acount for 100.0% of all women with births.
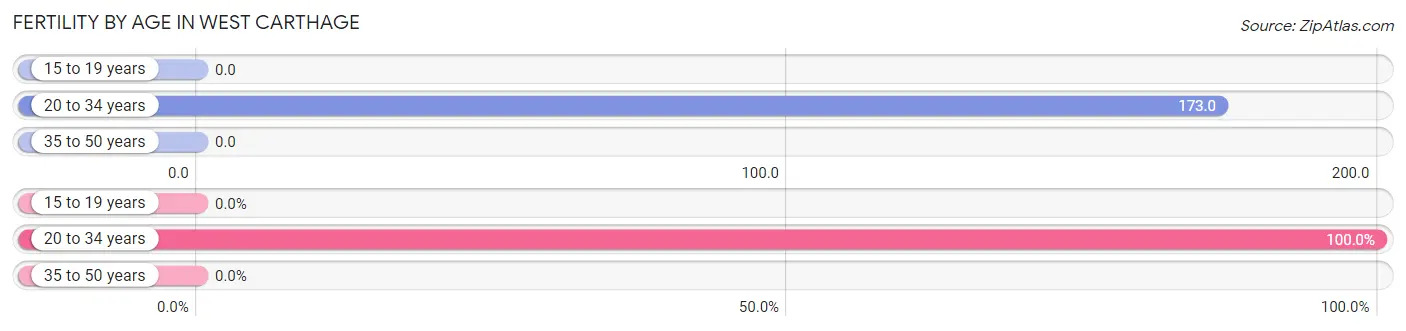
| Age Bracket | Women with Births | Births / 1,000 Women |
| 15 to 19 years | 0 (0.0%) | 0.0 |
| 20 to 34 years | 43 (100.0%) | 173.0 |
| 35 to 50 years | 0 (0.0%) | 0.0 |
| Total | 43 (100.0%) | 101.0 |
Fertility by Age by Marriage Status in West Carthage
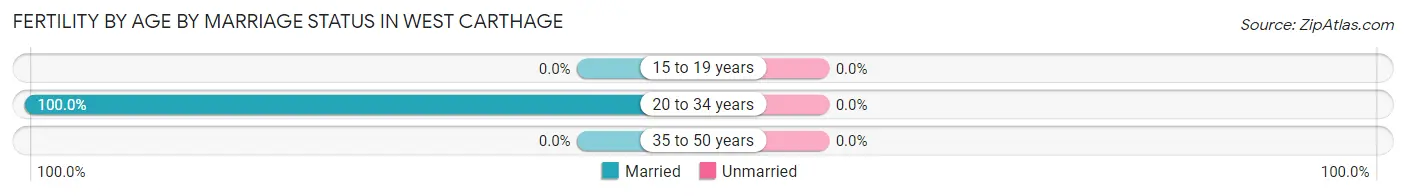
| Age Bracket | Married | Unmarried |
| 15 to 19 years | 0 (0.0%) | 0 (0.0%) |
| 20 to 34 years | 43 (100.0%) | 0 (0.0%) |
| 35 to 50 years | 0 (0.0%) | 0 (0.0%) |
| Total | 43 (100.0%) | 0 (0.0%) |
Fertility by Education in West Carthage
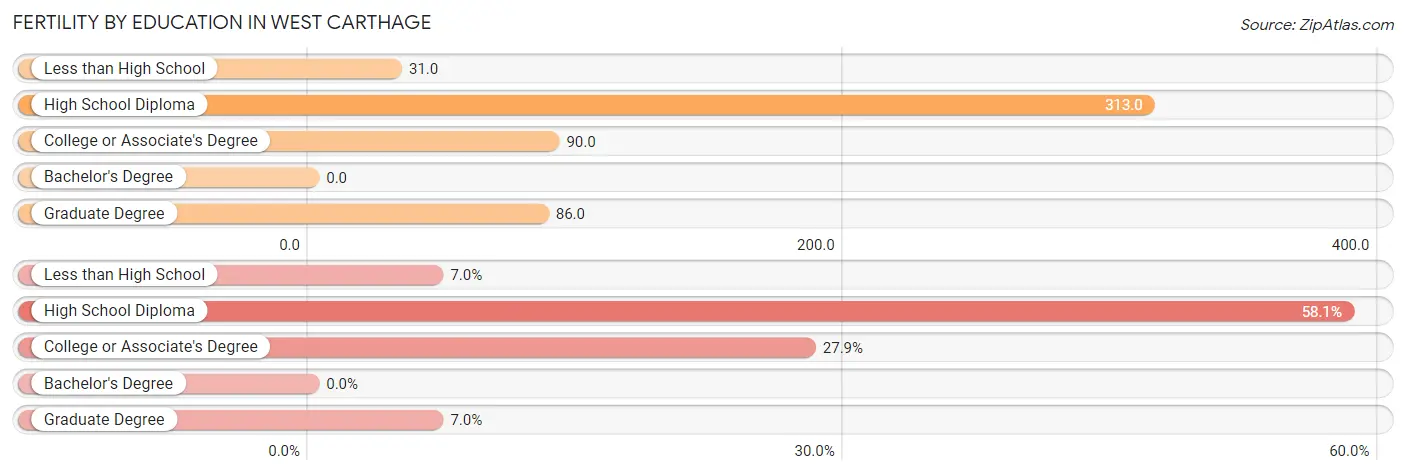
| Educational Attainment | Women with Births | Births / 1,000 Women |
| Less than High School | 3 (7.0%) | 31.0 |
| High School Diploma | 25 (58.1%) | 313.0 |
| College or Associate's Degree | 12 (27.9%) | 90.0 |
| Bachelor's Degree | 0 (0.0%) | 0.0 |
| Graduate Degree | 3 (7.0%) | 86.0 |
| Total | 43 (100.0%) | 101.0 |
Fertility by Education by Marriage Status in West Carthage
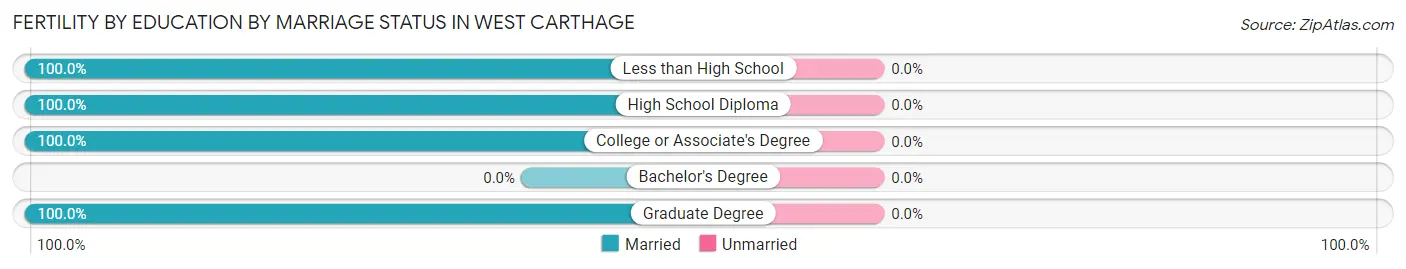
| Educational Attainment | Married | Unmarried |
| Less than High School | 3 (100.0%) | 0 (0.0%) |
| High School Diploma | 25 (100.0%) | 0 (0.0%) |
| College or Associate's Degree | 12 (100.0%) | 0 (0.0%) |
| Bachelor's Degree | 0 (0.0%) | 0 (0.0%) |
| Graduate Degree | 3 (100.0%) | 0 (0.0%) |
| Total | 43 (100.0%) | 0 (0.0%) |
Employment Characteristics in West Carthage
Employment by Class of Employer in West Carthage
Among the 806 employed individuals in West Carthage, private company employees (303 | 37.6%), federal government employees (262 | 32.5%), and not-for-profit organizations (83 | 10.3%) make up the most common classes of employment.
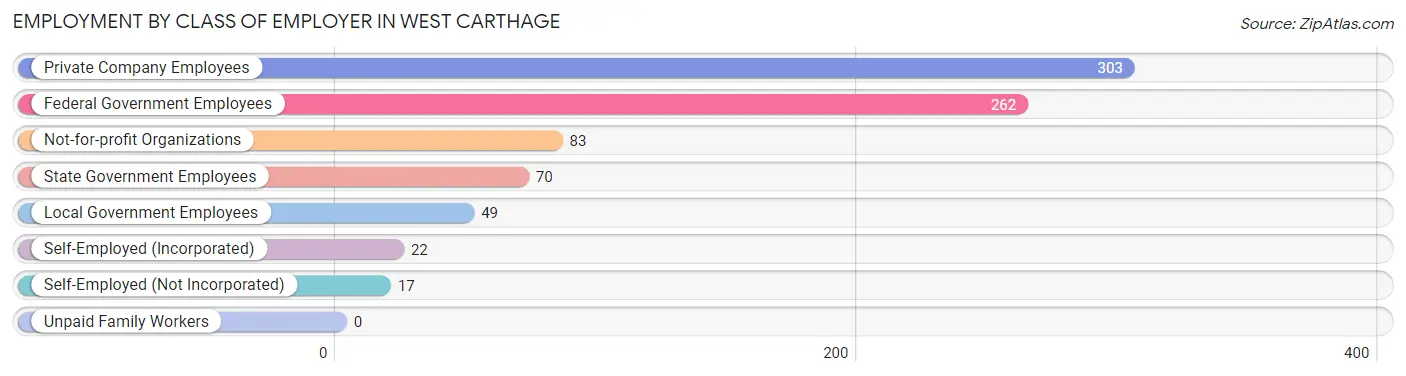
| Employer Class | # Employees | % Employees |
| Private Company Employees | 303 | 37.6% |
| Self-Employed (Incorporated) | 22 | 2.7% |
| Self-Employed (Not Incorporated) | 17 | 2.1% |
| Not-for-profit Organizations | 83 | 10.3% |
| Local Government Employees | 49 | 6.1% |
| State Government Employees | 70 | 8.7% |
| Federal Government Employees | 262 | 32.5% |
| Unpaid Family Workers | 0 | 0.0% |
| Total | 806 | 100.0% |
Employment Status by Age in West Carthage
According to the labor force statistics for West Carthage, out of the total population over 16 years of age (1,358), 60.5% or 822 individuals are in the labor force, with 0.9% or 7 of them unemployed. The age group with the highest labor force participation rate is 25 to 29 years, with 97.3% or 179 individuals in the labor force. Within the labor force, the 45 to 54 years age range has the highest percentage of unemployed individuals, with 7.1% or 6 of them being unemployed.
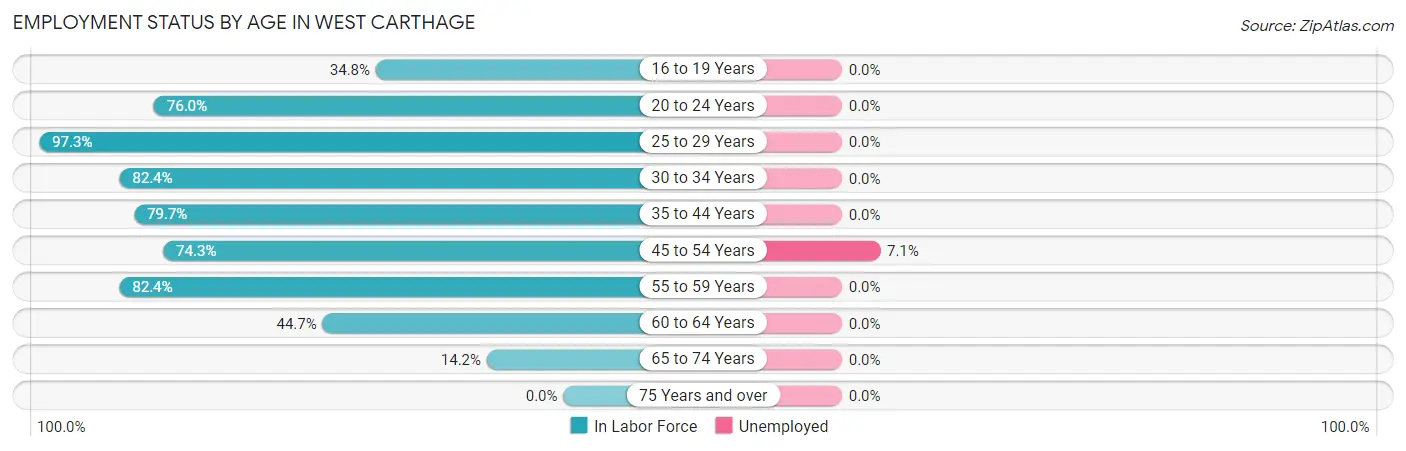
| Age Bracket | In Labor Force | Unemployed |
| 16 to 19 Years | 32 (34.8%) | 0 (0.0%) |
| 20 to 24 Years | 130 (76.0%) | 0 (0.0%) |
| 25 to 29 Years | 179 (97.3%) | 0 (0.0%) |
| 30 to 34 Years | 150 (82.4%) | 0 (0.0%) |
| 35 to 44 Years | 126 (79.7%) | 0 (0.0%) |
| 45 to 54 Years | 84 (74.3%) | 6 (7.1%) |
| 55 to 59 Years | 56 (82.4%) | 0 (0.0%) |
| 60 to 64 Years | 38 (44.7%) | 0 (0.0%) |
| 65 to 74 Years | 26 (14.2%) | 0 (0.0%) |
| 75 Years and over | 0 (0.0%) | 0 (0.0%) |
| Total | 822 (60.5%) | 7 (0.9%) |
Employment Status by Educational Attainment in West Carthage
According to labor force statistics for West Carthage, 80.1% of individuals (633) out of the total population between 25 and 64 years of age (790) are in the labor force, with 1.1% or 7 of them being unemployed. The group with the highest labor force participation rate are those with the educational attainment of bachelor's degree or higher, with 93.1% or 203 individuals in the labor force. Within the labor force, individuals with bachelor's degree or higher education have the highest percentage of unemployment, with 3.0% or 6 of them being unemployed.
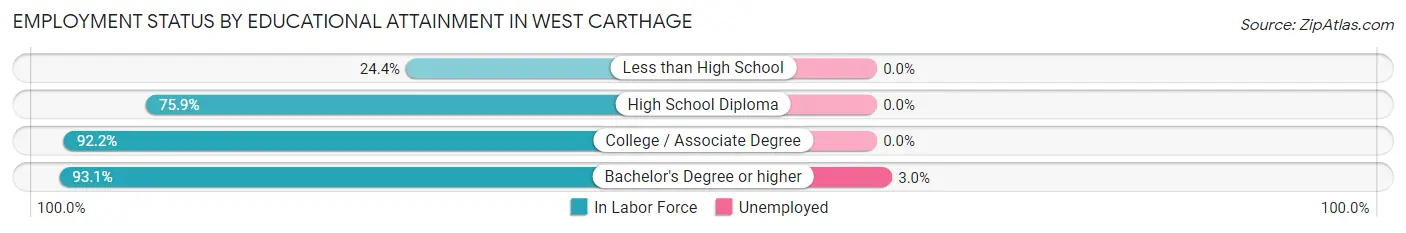
| Educational Attainment | In Labor Force | Unemployed |
| Less than High School | 22 (24.4%) | 0 (0.0%) |
| High School Diploma | 170 (75.9%) | 0 (0.0%) |
| College / Associate Degree | 238 (92.2%) | 0 (0.0%) |
| Bachelor's Degree or higher | 203 (93.1%) | 7 (3.0%) |
| Total | 633 (80.1%) | 9 (1.1%) |
Employment Occupations by Sex in West Carthage
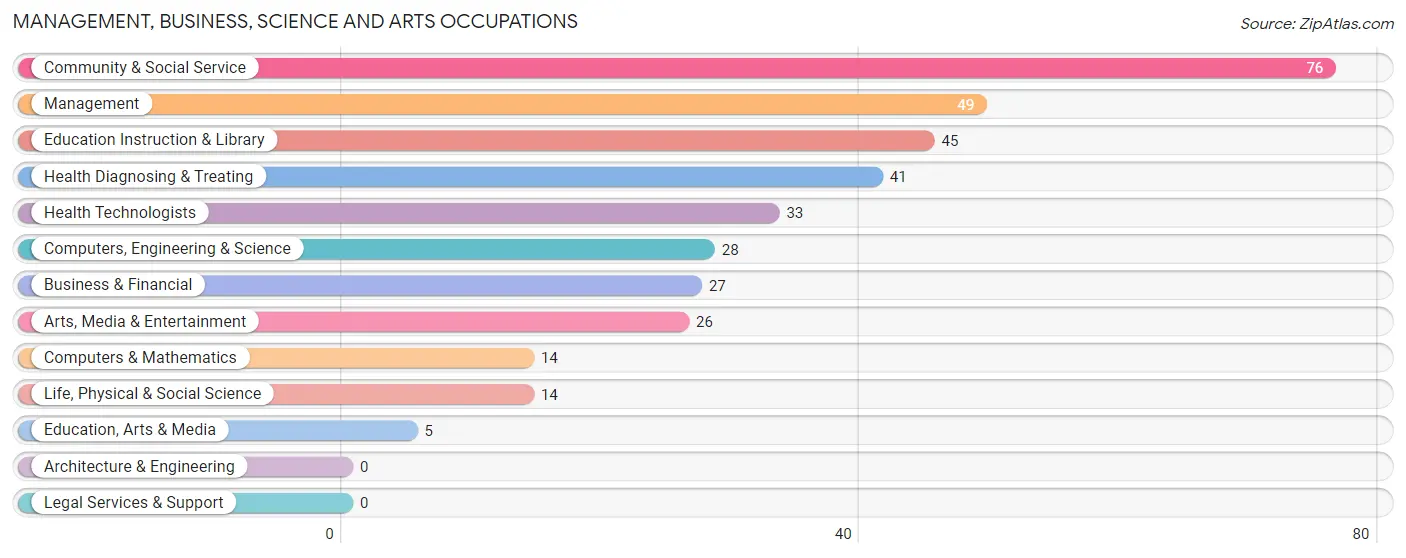
Management, Business, Science and Arts Occupations
The most common Management, Business, Science and Arts occupations in West Carthage are Community & Social Service (76 | 11.4%), Management (49 | 7.4%), Education Instruction & Library (45 | 6.8%), Health Diagnosing & Treating (41 | 6.2%), and Health Technologists (33 | 5.0%).
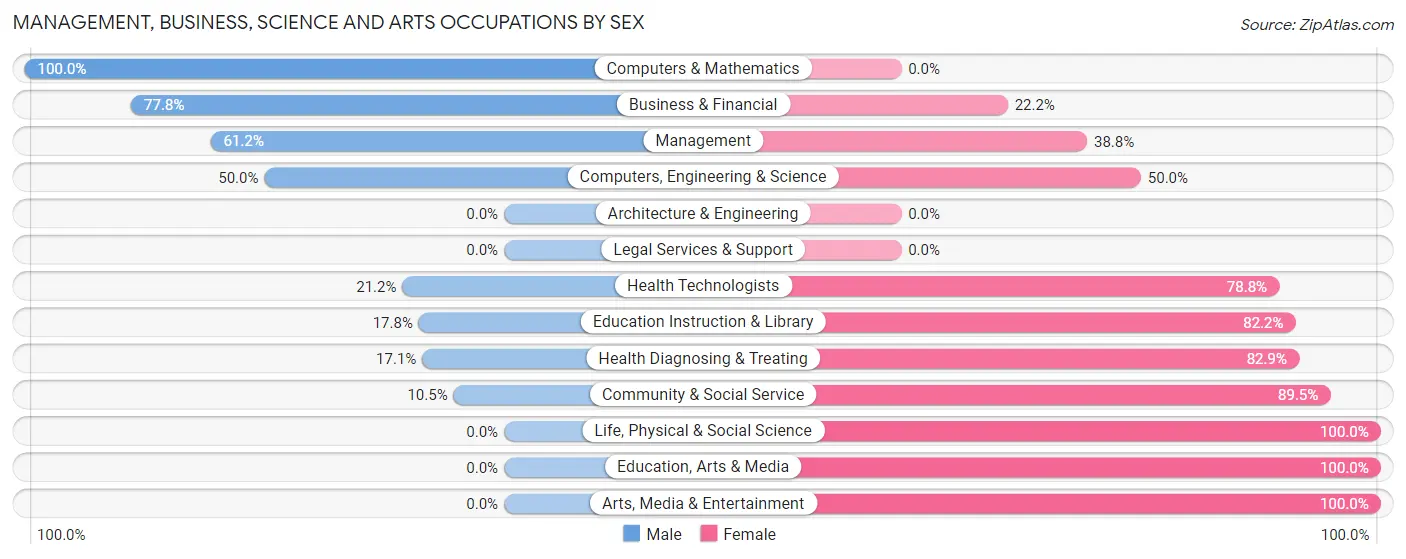
Management, Business, Science and Arts Occupations by Sex
Within the Management, Business, Science and Arts occupations in West Carthage, the most male-oriented occupations are Computers & Mathematics (100.0%), Business & Financial (77.8%), and Management (61.2%), while the most female-oriented occupations are Life, Physical & Social Science (100.0%), Education, Arts & Media (100.0%), and Arts, Media & Entertainment (100.0%).
| Occupation | Male | Female |
| Management | 30 (61.2%) | 19 (38.8%) |
| Business & Financial | 21 (77.8%) | 6 (22.2%) |
| Computers, Engineering & Science | 14 (50.0%) | 14 (50.0%) |
| Computers & Mathematics | 14 (100.0%) | 0 (0.0%) |
| Architecture & Engineering | 0 (0.0%) | 0 (0.0%) |
| Life, Physical & Social Science | 0 (0.0%) | 14 (100.0%) |
| Community & Social Service | 8 (10.5%) | 68 (89.5%) |
| Education, Arts & Media | 0 (0.0%) | 5 (100.0%) |
| Legal Services & Support | 0 (0.0%) | 0 (0.0%) |
| Education Instruction & Library | 8 (17.8%) | 37 (82.2%) |
| Arts, Media & Entertainment | 0 (0.0%) | 26 (100.0%) |
| Health Diagnosing & Treating | 7 (17.1%) | 34 (82.9%) |
| Health Technologists | 7 (21.2%) | 26 (78.8%) |
| Total (Category) | 80 (36.2%) | 141 (63.8%) |
| Total (Overall) | 285 (42.8%) | 381 (57.2%) |
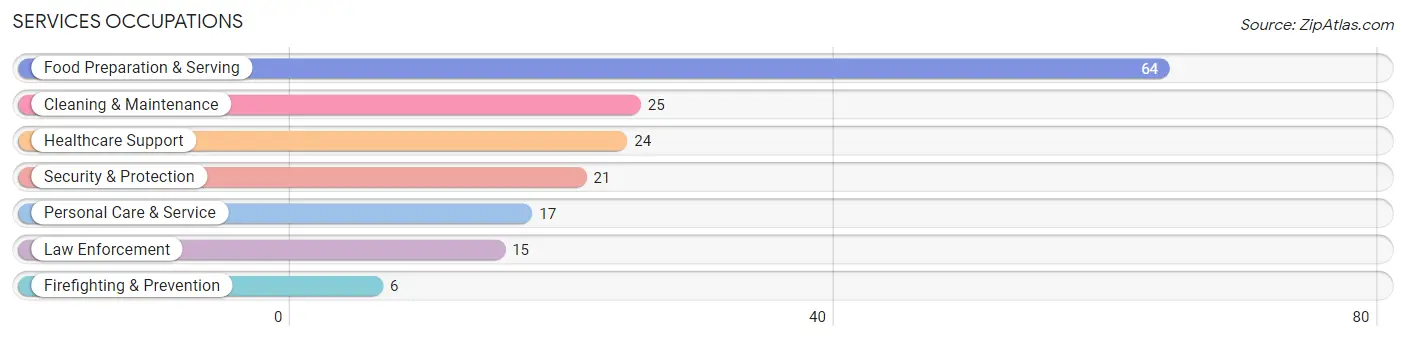
Services Occupations
The most common Services occupations in West Carthage are Food Preparation & Serving (64 | 9.6%), Cleaning & Maintenance (25 | 3.7%), Healthcare Support (24 | 3.6%), Security & Protection (21 | 3.2%), and Personal Care & Service (17 | 2.5%).
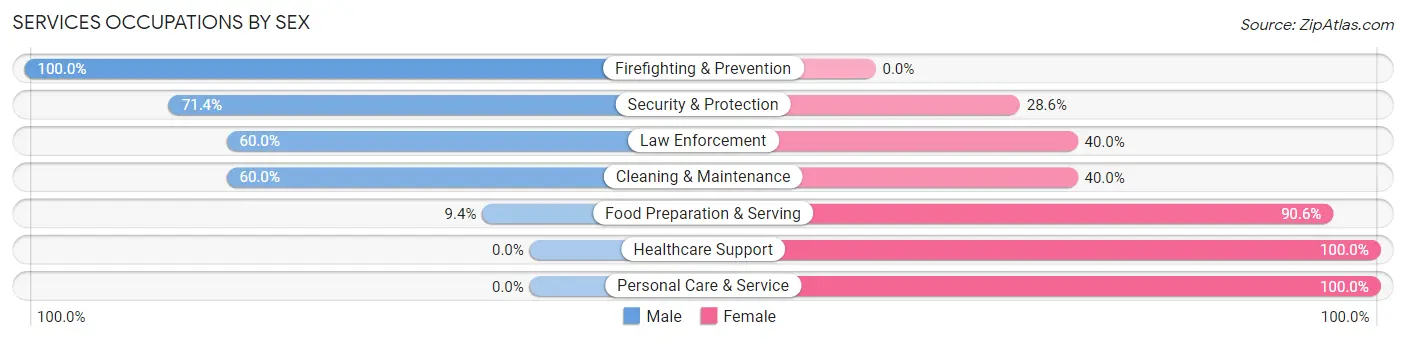
Services Occupations by Sex
Within the Services occupations in West Carthage, the most male-oriented occupations are Firefighting & Prevention (100.0%), Security & Protection (71.4%), and Law Enforcement (60.0%), while the most female-oriented occupations are Healthcare Support (100.0%), Personal Care & Service (100.0%), and Food Preparation & Serving (90.6%).
| Occupation | Male | Female |
| Healthcare Support | 0 (0.0%) | 24 (100.0%) |
| Security & Protection | 15 (71.4%) | 6 (28.6%) |
| Firefighting & Prevention | 6 (100.0%) | 0 (0.0%) |
| Law Enforcement | 9 (60.0%) | 6 (40.0%) |
| Food Preparation & Serving | 6 (9.4%) | 58 (90.6%) |
| Cleaning & Maintenance | 15 (60.0%) | 10 (40.0%) |
| Personal Care & Service | 0 (0.0%) | 17 (100.0%) |
| Total (Category) | 36 (23.8%) | 115 (76.2%) |
| Total (Overall) | 285 (42.8%) | 381 (57.2%) |
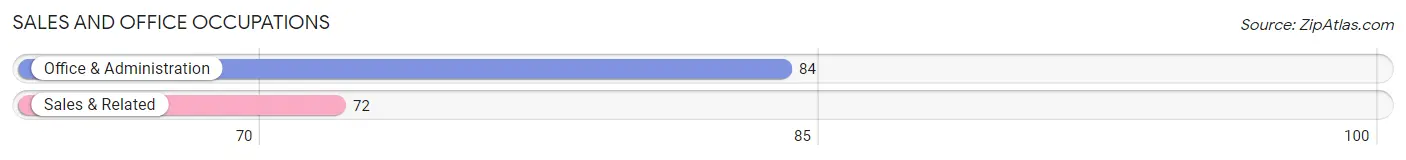
Sales and Office Occupations
The most common Sales and Office occupations in West Carthage are Office & Administration (84 | 12.6%), and Sales & Related (72 | 10.8%).
Sales and Office Occupations by Sex
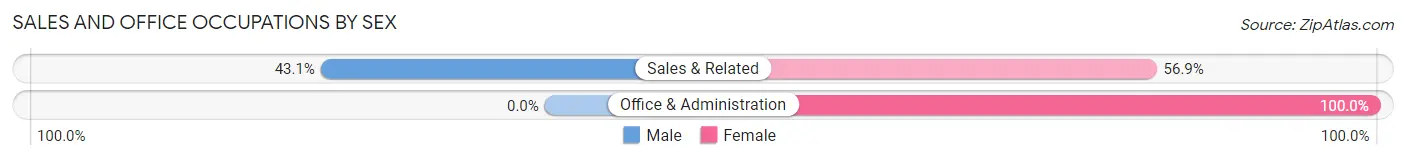
| Occupation | Male | Female |
| Sales & Related | 31 (43.1%) | 41 (56.9%) |
| Office & Administration | 0 (0.0%) | 84 (100.0%) |
| Total (Category) | 31 (19.9%) | 125 (80.1%) |
| Total (Overall) | 285 (42.8%) | 381 (57.2%) |
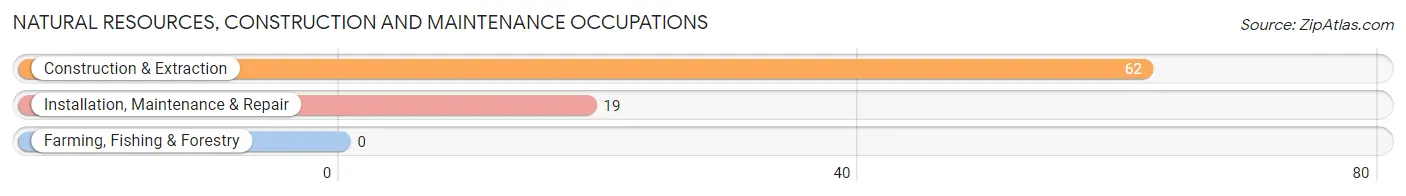
Natural Resources, Construction and Maintenance Occupations
The most common Natural Resources, Construction and Maintenance occupations in West Carthage are Construction & Extraction (62 | 9.3%), and Installation, Maintenance & Repair (19 | 2.9%).
Natural Resources, Construction and Maintenance Occupations by Sex
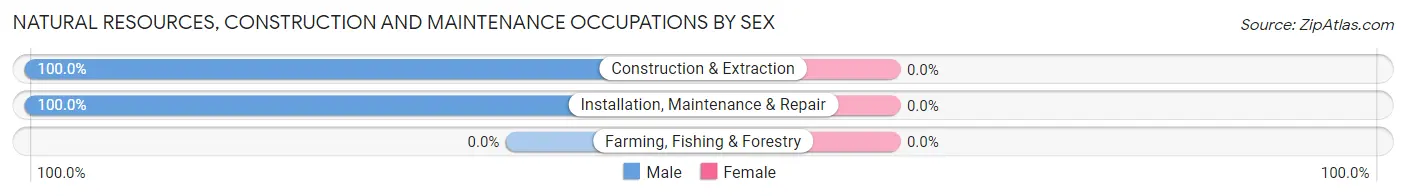
| Occupation | Male | Female |
| Farming, Fishing & Forestry | 0 (0.0%) | 0 (0.0%) |
| Construction & Extraction | 62 (100.0%) | 0 (0.0%) |
| Installation, Maintenance & Repair | 19 (100.0%) | 0 (0.0%) |
| Total (Category) | 81 (100.0%) | 0 (0.0%) |
| Total (Overall) | 285 (42.8%) | 381 (57.2%) |
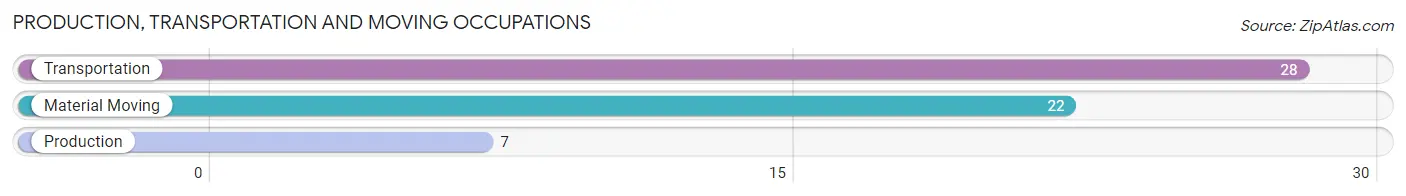
Production, Transportation and Moving Occupations
The most common Production, Transportation and Moving occupations in West Carthage are Transportation (28 | 4.2%), Material Moving (22 | 3.3%), and Production (7 | 1.1%).
Production, Transportation and Moving Occupations by Sex
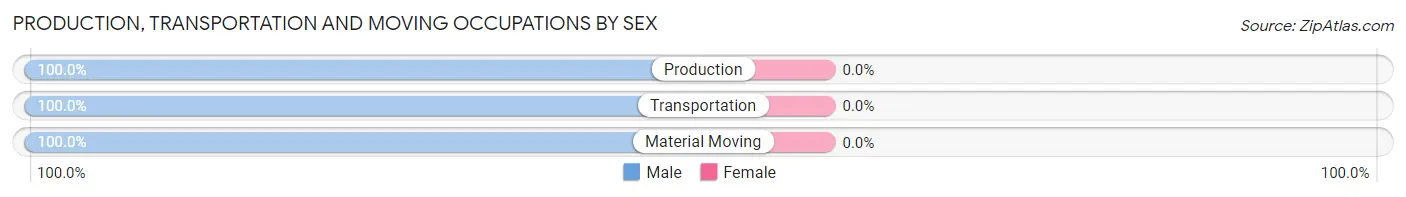
| Occupation | Male | Female |
| Production | 7 (100.0%) | 0 (0.0%) |
| Transportation | 28 (100.0%) | 0 (0.0%) |
| Material Moving | 22 (100.0%) | 0 (0.0%) |
| Total (Category) | 57 (100.0%) | 0 (0.0%) |
| Total (Overall) | 285 (42.8%) | 381 (57.2%) |
Employment Industries by Sex in West Carthage
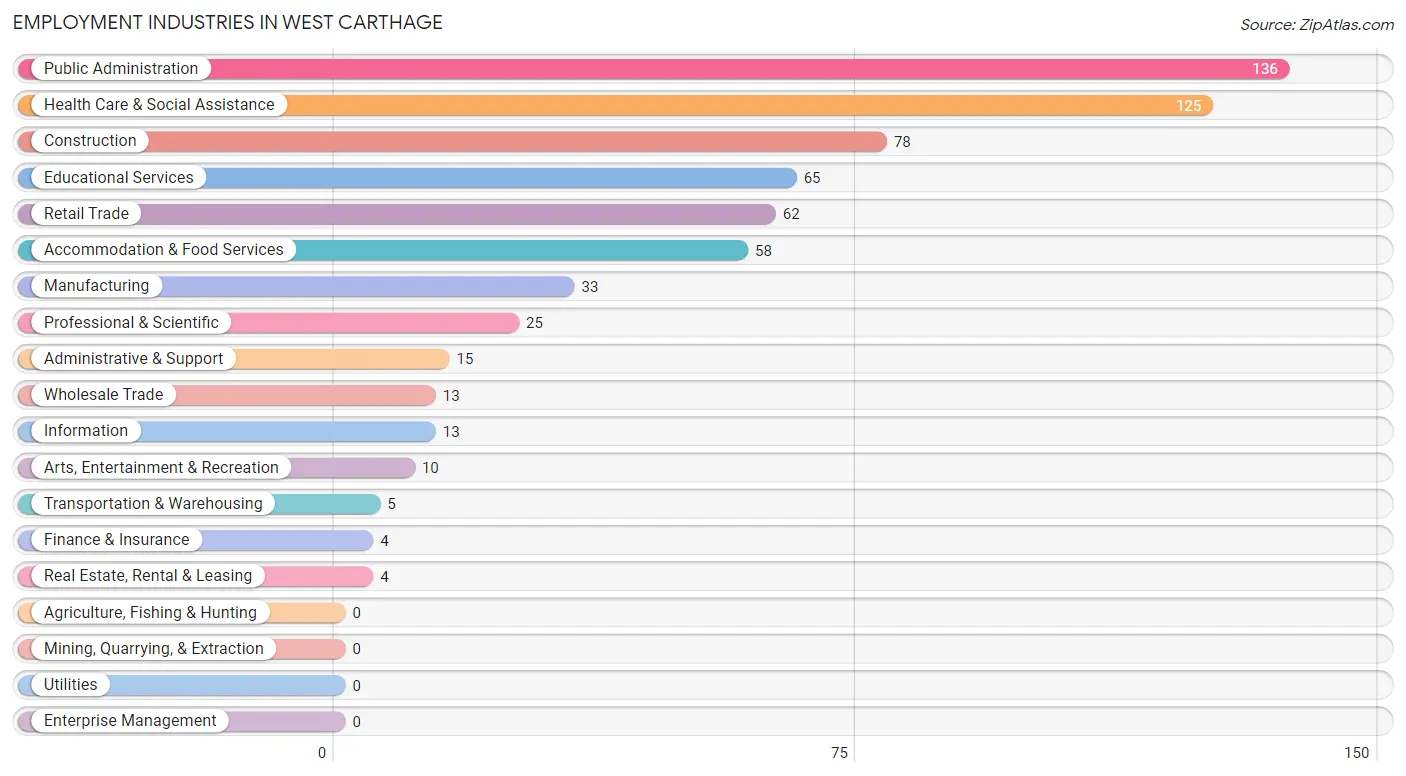
Employment Industries in West Carthage
The major employment industries in West Carthage include Public Administration (136 | 20.4%), Health Care & Social Assistance (125 | 18.8%), Construction (78 | 11.7%), Educational Services (65 | 9.8%), and Retail Trade (62 | 9.3%).
Employment Industries by Sex in West Carthage
The West Carthage industries that see more men than women are Transportation & Warehousing (100.0%), Information (100.0%), and Real Estate, Rental & Leasing (100.0%), whereas the industries that tend to have a higher number of women are Wholesale Trade (100.0%), Finance & Insurance (100.0%), and Arts, Entertainment & Recreation (100.0%).
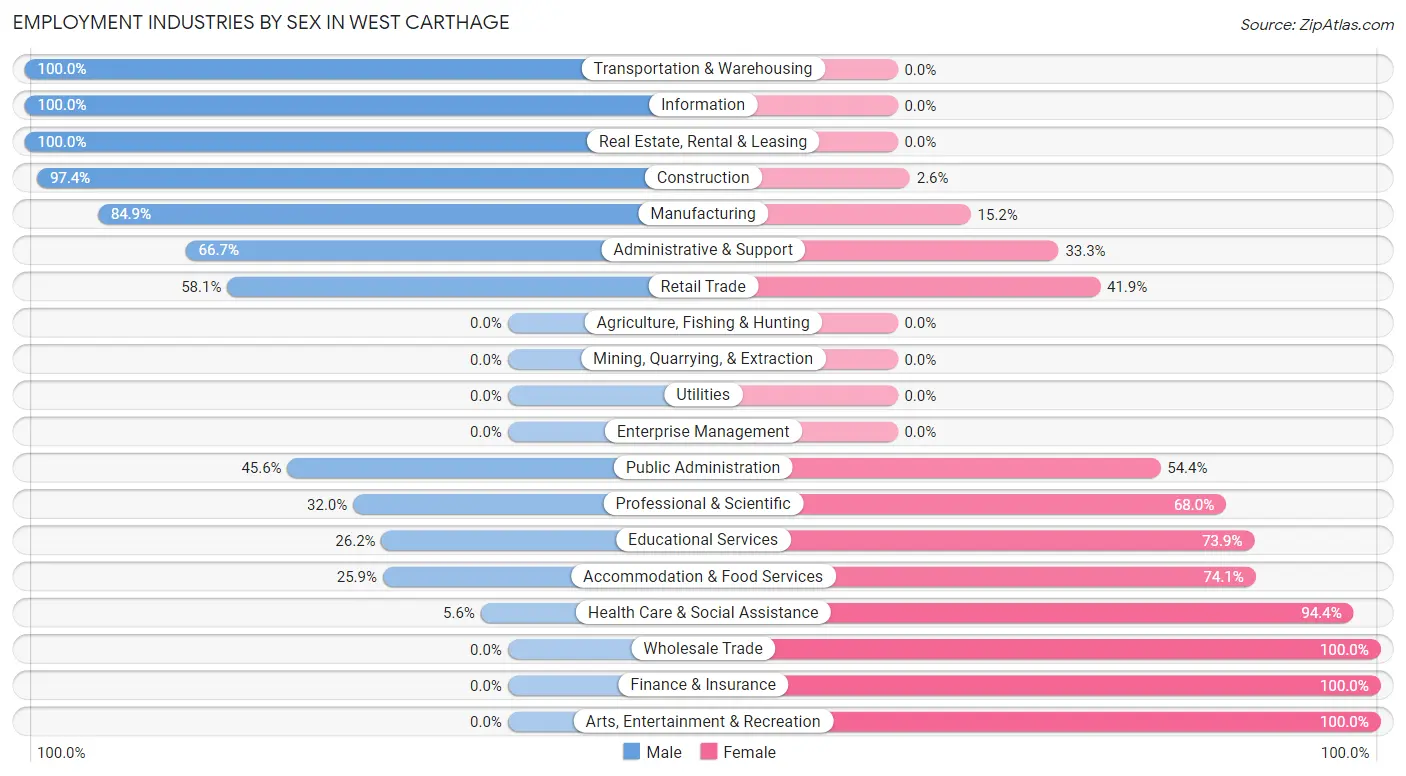
| Industry | Male | Female |
| Agriculture, Fishing & Hunting | 0 (0.0%) | 0 (0.0%) |
| Mining, Quarrying, & Extraction | 0 (0.0%) | 0 (0.0%) |
| Construction | 76 (97.4%) | 2 (2.6%) |
| Manufacturing | 28 (84.9%) | 5 (15.1%) |
| Wholesale Trade | 0 (0.0%) | 13 (100.0%) |
| Retail Trade | 36 (58.1%) | 26 (41.9%) |
| Transportation & Warehousing | 5 (100.0%) | 0 (0.0%) |
| Utilities | 0 (0.0%) | 0 (0.0%) |
| Information | 13 (100.0%) | 0 (0.0%) |
| Finance & Insurance | 0 (0.0%) | 4 (100.0%) |
| Real Estate, Rental & Leasing | 4 (100.0%) | 0 (0.0%) |
| Professional & Scientific | 8 (32.0%) | 17 (68.0%) |
| Enterprise Management | 0 (0.0%) | 0 (0.0%) |
| Administrative & Support | 10 (66.7%) | 5 (33.3%) |
| Educational Services | 17 (26.2%) | 48 (73.9%) |
| Health Care & Social Assistance | 7 (5.6%) | 118 (94.4%) |
| Arts, Entertainment & Recreation | 0 (0.0%) | 10 (100.0%) |
| Accommodation & Food Services | 15 (25.9%) | 43 (74.1%) |
| Public Administration | 62 (45.6%) | 74 (54.4%) |
| Total | 285 (42.8%) | 381 (57.2%) |
Education in West Carthage
School Enrollment in West Carthage
The most common levels of schooling among the 276 students in West Carthage are high school (65 | 23.5%), elementary school (64 | 23.2%), and college / undergraduate (56 | 20.3%).
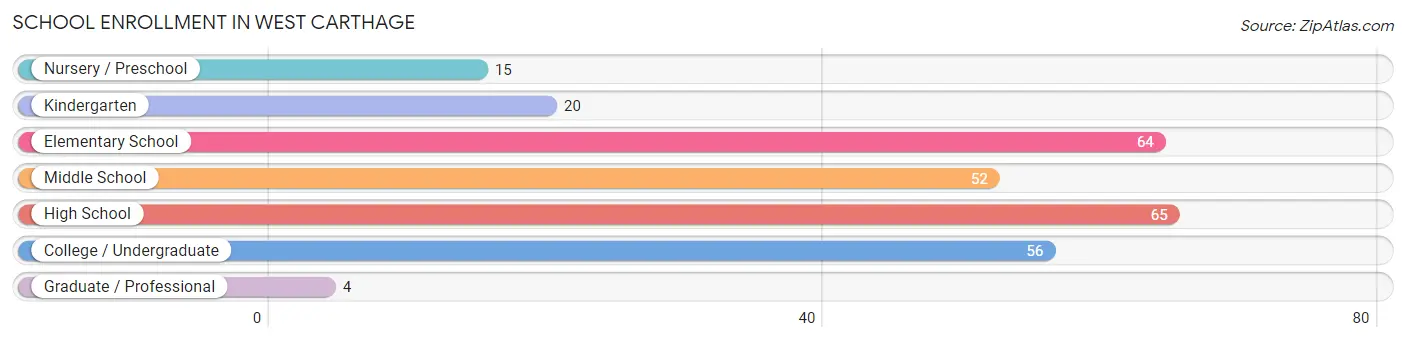
| School Level | # Students | % Students |
| Nursery / Preschool | 15 | 5.4% |
| Kindergarten | 20 | 7.2% |
| Elementary School | 64 | 23.2% |
| Middle School | 52 | 18.8% |
| High School | 65 | 23.5% |
| College / Undergraduate | 56 | 20.3% |
| Graduate / Professional | 4 | 1.5% |
| Total | 276 | 100.0% |
School Enrollment by Age by Funding Source in West Carthage
Out of a total of 276 students who are enrolled in schools in West Carthage, 37 (13.4%) attend a private institution, while the remaining 239 (86.6%) are enrolled in public schools. The age group of 18 to 19 year olds has the highest likelihood of being enrolled in private schools, with 25 (48.1% in the age bracket) enrolled. Conversely, the age group of 3 to 4 year olds has the lowest likelihood of being enrolled in a private school, with 11 (100.0% in the age bracket) attending a public institution.
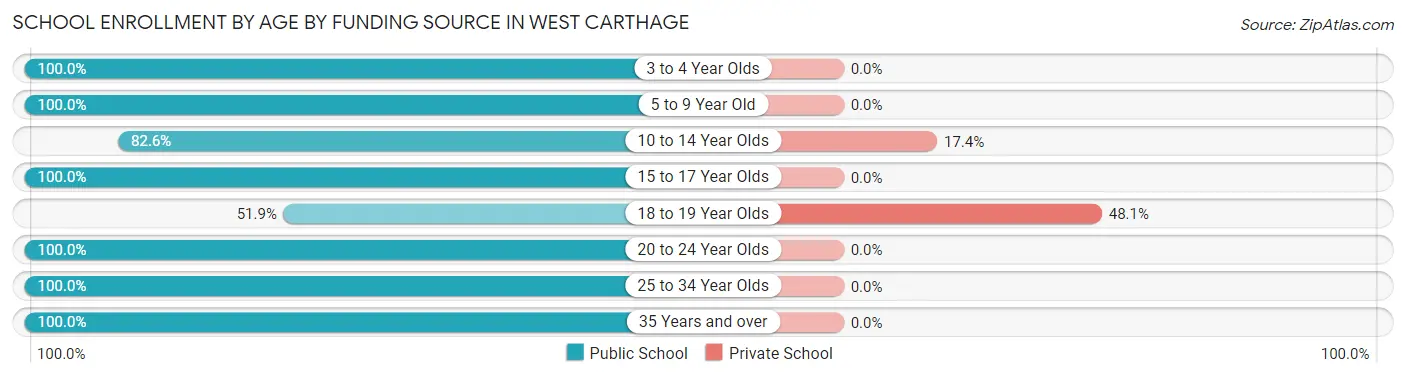
| Age Bracket | Public School | Private School |
| 3 to 4 Year Olds | 11 (100.0%) | 0 (0.0%) |
| 5 to 9 Year Old | 79 (100.0%) | 0 (0.0%) |
| 10 to 14 Year Olds | 57 (82.6%) | 12 (17.4%) |
| 15 to 17 Year Olds | 17 (100.0%) | 0 (0.0%) |
| 18 to 19 Year Olds | 27 (51.9%) | 25 (48.1%) |
| 20 to 24 Year Olds | 20 (100.0%) | 0 (0.0%) |
| 25 to 34 Year Olds | 20 (100.0%) | 0 (0.0%) |
| 35 Years and over | 8 (100.0%) | 0 (0.0%) |
| Total | 239 (86.6%) | 37 (13.4%) |
Educational Attainment by Field of Study in West Carthage
Education (74 | 27.5%), liberal arts & history (49 | 18.2%), business (26 | 9.7%), social sciences (25 | 9.3%), and science & technology (25 | 9.3%) are the most common fields of study among 269 individuals in West Carthage who have obtained a bachelor's degree or higher.
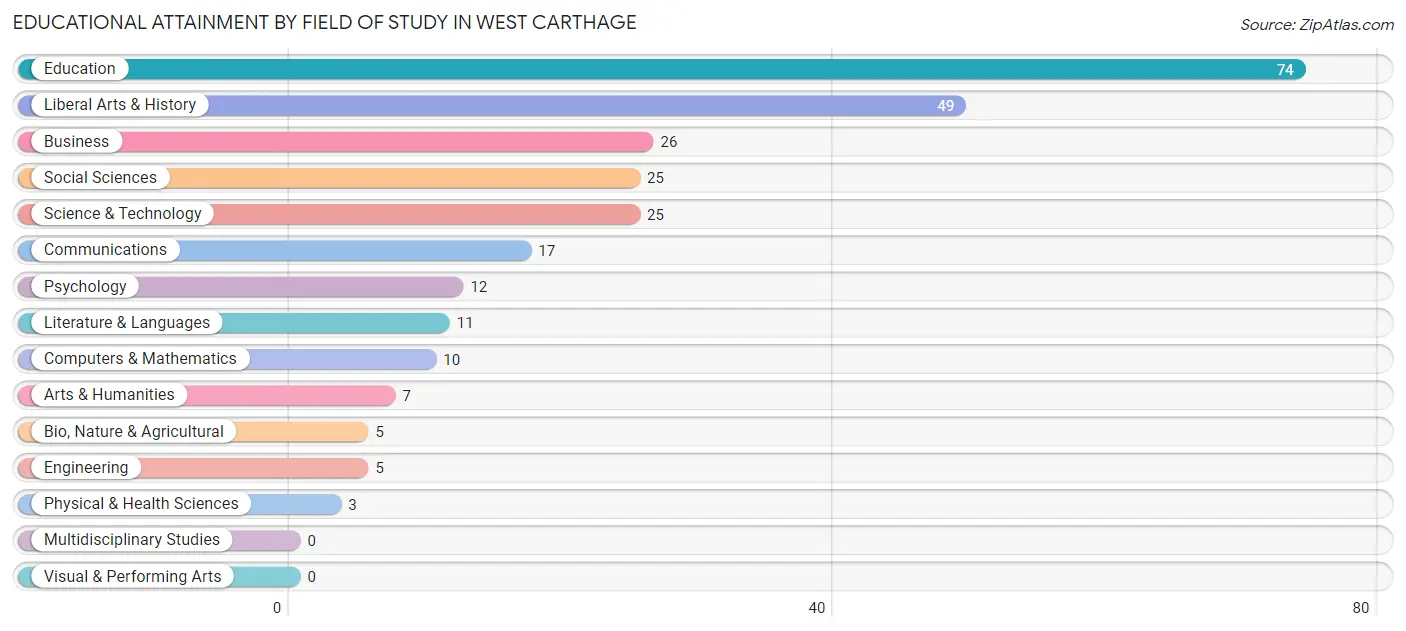
| Field of Study | # Graduates | % Graduates |
| Computers & Mathematics | 10 | 3.7% |
| Bio, Nature & Agricultural | 5 | 1.9% |
| Physical & Health Sciences | 3 | 1.1% |
| Psychology | 12 | 4.5% |
| Social Sciences | 25 | 9.3% |
| Engineering | 5 | 1.9% |
| Multidisciplinary Studies | 0 | 0.0% |
| Science & Technology | 25 | 9.3% |
| Business | 26 | 9.7% |
| Education | 74 | 27.5% |
| Literature & Languages | 11 | 4.1% |
| Liberal Arts & History | 49 | 18.2% |
| Visual & Performing Arts | 0 | 0.0% |
| Communications | 17 | 6.3% |
| Arts & Humanities | 7 | 2.6% |
| Total | 269 | 100.0% |
Transportation & Commute in West Carthage
Vehicle Availability by Sex in West Carthage
The most prevalent vehicle ownership categories in West Carthage are males with 2 vehicles (169, accounting for 40.3%) and females with 2 vehicles (166, making up 43.9%).
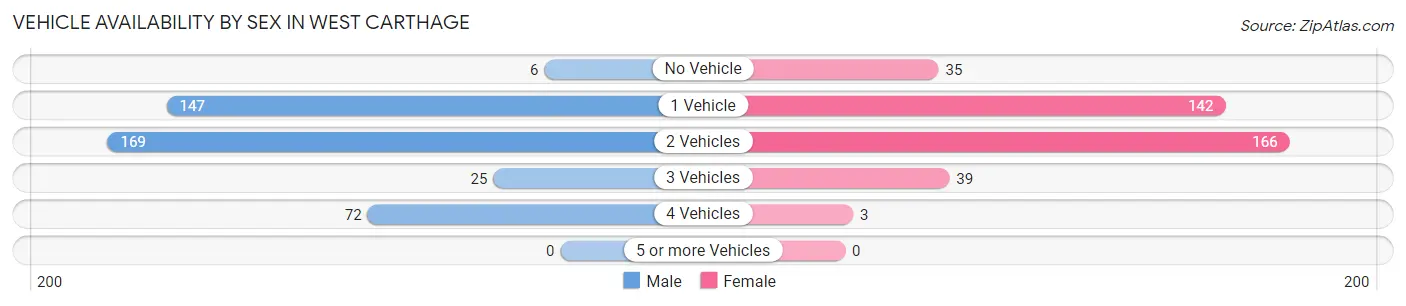
| Vehicles Available | Male | Female |
| No Vehicle | 6 (1.4%) | 35 (9.1%) |
| 1 Vehicle | 147 (35.1%) | 142 (36.9%) |
| 2 Vehicles | 169 (40.3%) | 166 (43.1%) |
| 3 Vehicles | 25 (6.0%) | 39 (10.1%) |
| 4 Vehicles | 72 (17.2%) | 3 (0.8%) |
| 5 or more Vehicles | 0 (0.0%) | 0 (0.0%) |
| Total | 419 (100.0%) | 385 (100.0%) |
Commute Time in West Carthage
The most frequently occuring commute durations in West Carthage are 20 to 24 minutes (183 commuters, 24.2%), 5 to 9 minutes (116 commuters, 15.3%), and 30 to 34 minutes (107 commuters, 14.1%).
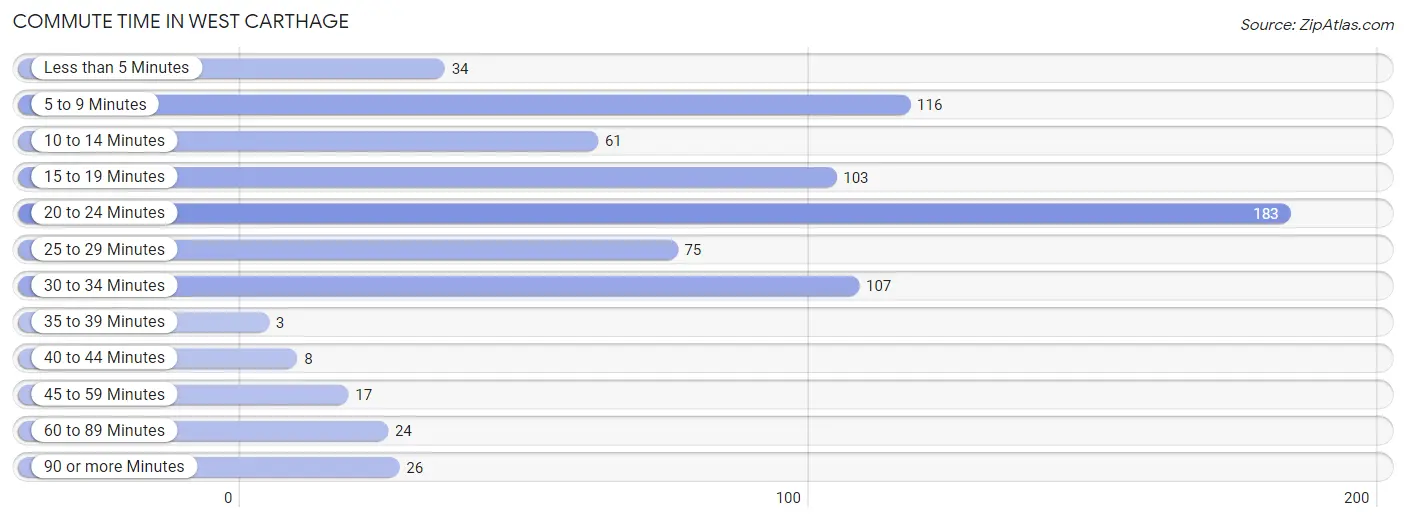
| Commute Time | # Commuters | % Commuters |
| Less than 5 Minutes | 34 | 4.5% |
| 5 to 9 Minutes | 116 | 15.3% |
| 10 to 14 Minutes | 61 | 8.1% |
| 15 to 19 Minutes | 103 | 13.6% |
| 20 to 24 Minutes | 183 | 24.2% |
| 25 to 29 Minutes | 75 | 9.9% |
| 30 to 34 Minutes | 107 | 14.1% |
| 35 to 39 Minutes | 3 | 0.4% |
| 40 to 44 Minutes | 8 | 1.1% |
| 45 to 59 Minutes | 17 | 2.2% |
| 60 to 89 Minutes | 24 | 3.2% |
| 90 or more Minutes | 26 | 3.4% |
Commute Time by Sex in West Carthage
The most common commute times in West Carthage are 20 to 24 minutes (154 commuters, 38.1%) for males and 5 to 9 minutes (100 commuters, 28.3%) for females.
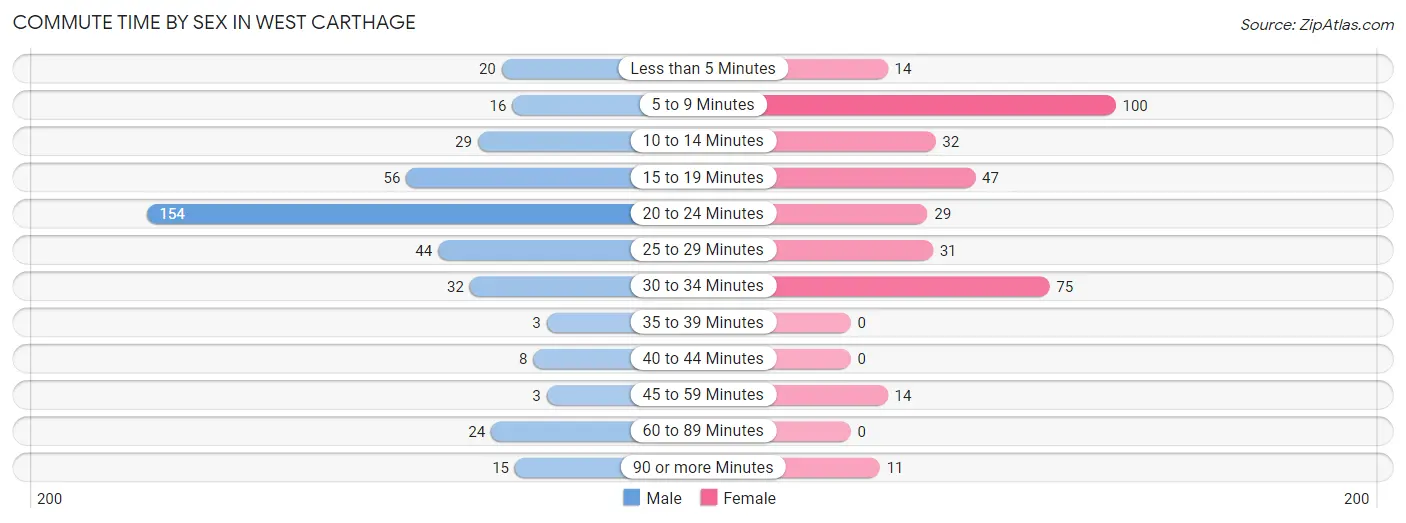
| Commute Time | Male | Female |
| Less than 5 Minutes | 20 (5.0%) | 14 (4.0%) |
| 5 to 9 Minutes | 16 (4.0%) | 100 (28.3%) |
| 10 to 14 Minutes | 29 (7.2%) | 32 (9.1%) |
| 15 to 19 Minutes | 56 (13.9%) | 47 (13.3%) |
| 20 to 24 Minutes | 154 (38.1%) | 29 (8.2%) |
| 25 to 29 Minutes | 44 (10.9%) | 31 (8.8%) |
| 30 to 34 Minutes | 32 (7.9%) | 75 (21.2%) |
| 35 to 39 Minutes | 3 (0.7%) | 0 (0.0%) |
| 40 to 44 Minutes | 8 (2.0%) | 0 (0.0%) |
| 45 to 59 Minutes | 3 (0.7%) | 14 (4.0%) |
| 60 to 89 Minutes | 24 (5.9%) | 0 (0.0%) |
| 90 or more Minutes | 15 (3.7%) | 11 (3.1%) |
Time of Departure to Work by Sex in West Carthage
The most frequent times of departure to work in West Carthage are 5:00 AM to 5:29 AM (86, 21.3%) for males and 7:00 AM to 7:29 AM (76, 21.5%) for females.
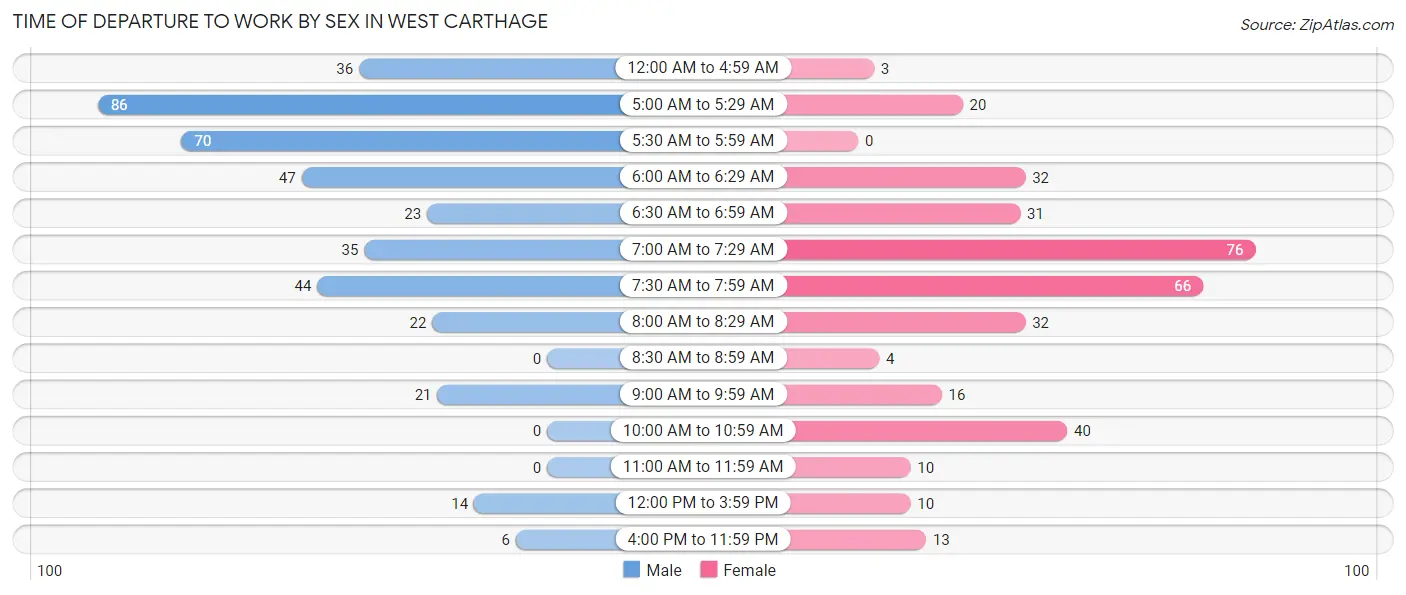
| Time of Departure | Male | Female |
| 12:00 AM to 4:59 AM | 36 (8.9%) | 3 (0.9%) |
| 5:00 AM to 5:29 AM | 86 (21.3%) | 20 (5.7%) |
| 5:30 AM to 5:59 AM | 70 (17.3%) | 0 (0.0%) |
| 6:00 AM to 6:29 AM | 47 (11.6%) | 32 (9.1%) |
| 6:30 AM to 6:59 AM | 23 (5.7%) | 31 (8.8%) |
| 7:00 AM to 7:29 AM | 35 (8.7%) | 76 (21.5%) |
| 7:30 AM to 7:59 AM | 44 (10.9%) | 66 (18.7%) |
| 8:00 AM to 8:29 AM | 22 (5.4%) | 32 (9.1%) |
| 8:30 AM to 8:59 AM | 0 (0.0%) | 4 (1.1%) |
| 9:00 AM to 9:59 AM | 21 (5.2%) | 16 (4.5%) |
| 10:00 AM to 10:59 AM | 0 (0.0%) | 40 (11.3%) |
| 11:00 AM to 11:59 AM | 0 (0.0%) | 10 (2.8%) |
| 12:00 PM to 3:59 PM | 14 (3.5%) | 10 (2.8%) |
| 4:00 PM to 11:59 PM | 6 (1.5%) | 13 (3.7%) |
| Total | 404 (100.0%) | 353 (100.0%) |
Housing Occupancy in West Carthage
Occupancy by Ownership in West Carthage
Of the total 845 dwellings in West Carthage, owner-occupied units account for 318 (37.6%), while renter-occupied units make up 527 (62.4%).
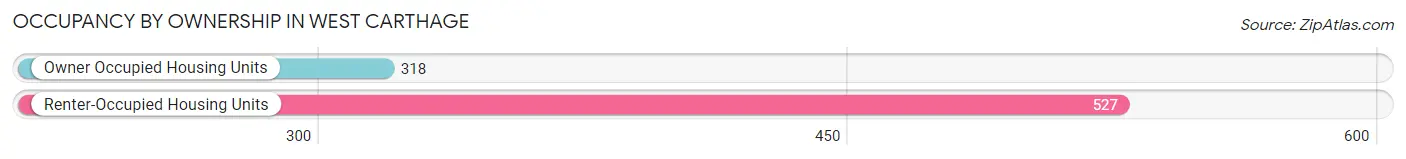
| Occupancy | # Housing Units | % Housing Units |
| Owner Occupied Housing Units | 318 | 37.6% |
| Renter-Occupied Housing Units | 527 | 62.4% |
| Total Occupied Housing Units | 845 | 100.0% |
Occupancy by Household Size in West Carthage
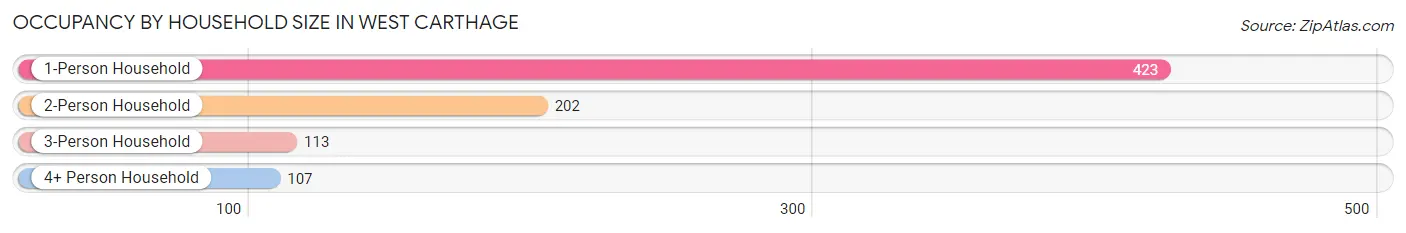
| Household Size | # Housing Units | % Housing Units |
| 1-Person Household | 423 | 50.1% |
| 2-Person Household | 202 | 23.9% |
| 3-Person Household | 113 | 13.4% |
| 4+ Person Household | 107 | 12.7% |
| Total Housing Units | 845 | 100.0% |
Occupancy by Ownership by Household Size in West Carthage
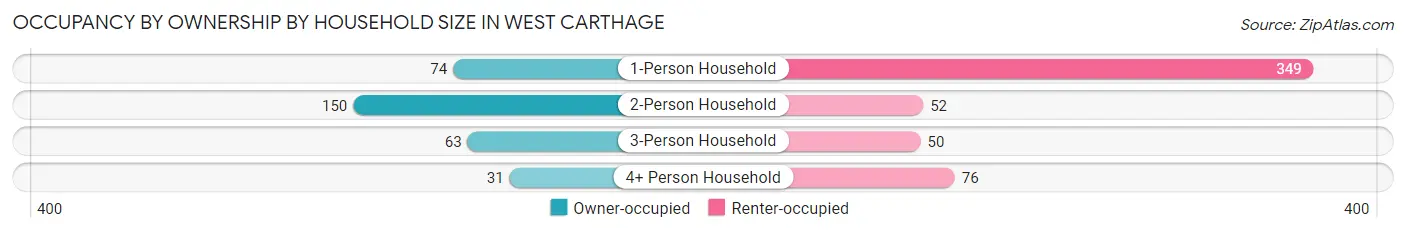
| Household Size | Owner-occupied | Renter-occupied |
| 1-Person Household | 74 (17.5%) | 349 (82.5%) |
| 2-Person Household | 150 (74.3%) | 52 (25.7%) |
| 3-Person Household | 63 (55.7%) | 50 (44.3%) |
| 4+ Person Household | 31 (29.0%) | 76 (71.0%) |
| Total Housing Units | 318 (37.6%) | 527 (62.4%) |
Occupancy by Educational Attainment in West Carthage
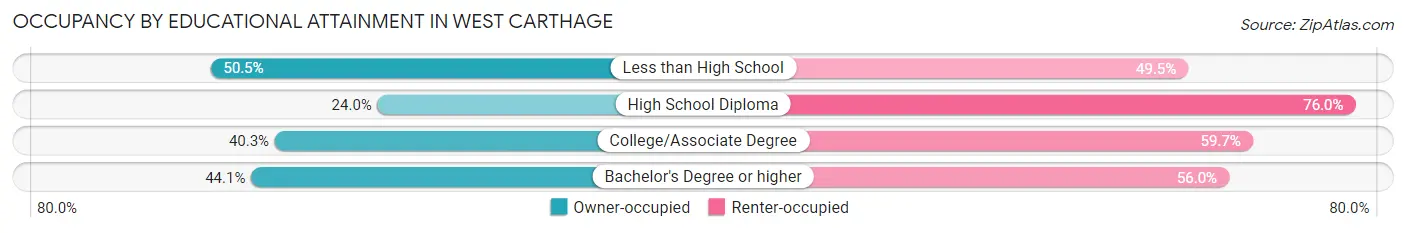
| Household Size | Owner-occupied | Renter-occupied |
| Less than High School | 48 (50.5%) | 47 (49.5%) |
| High School Diploma | 60 (24.0%) | 190 (76.0%) |
| College/Associate Degree | 110 (40.3%) | 163 (59.7%) |
| Bachelor's Degree or higher | 100 (44.1%) | 127 (55.9%) |
Occupancy by Age of Householder in West Carthage
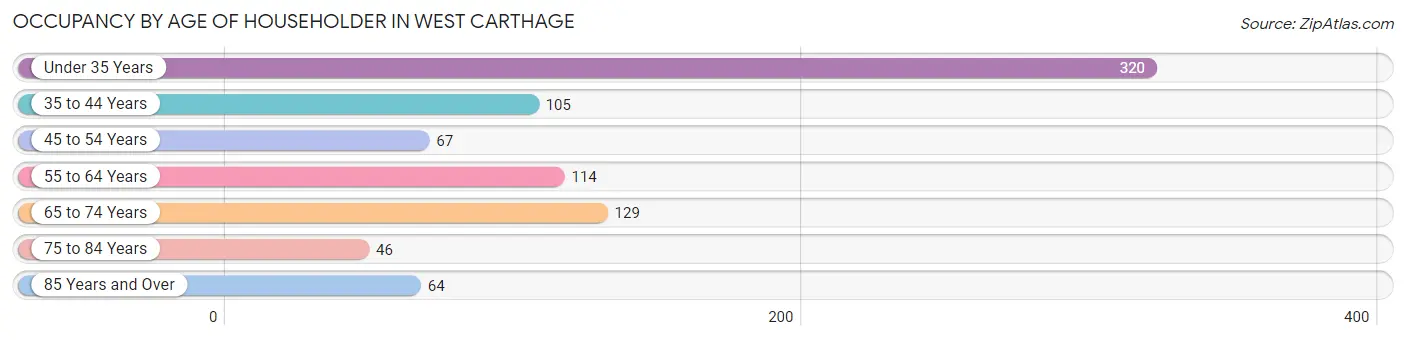
| Age Bracket | # Households | % Households |
| Under 35 Years | 320 | 37.9% |
| 35 to 44 Years | 105 | 12.4% |
| 45 to 54 Years | 67 | 7.9% |
| 55 to 64 Years | 114 | 13.5% |
| 65 to 74 Years | 129 | 15.3% |
| 75 to 84 Years | 46 | 5.4% |
| 85 Years and Over | 64 | 7.6% |
| Total | 845 | 100.0% |
Housing Finances in West Carthage
Median Income by Occupancy in West Carthage
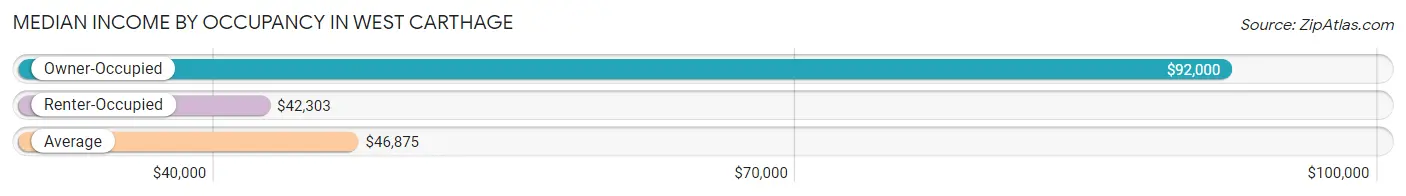
| Occupancy Type | # Households | Median Income |
| Owner-Occupied | 318 (37.6%) | $92,000 |
| Renter-Occupied | 527 (62.4%) | $42,303 |
| Average | 845 (100.0%) | $46,875 |
Occupancy by Householder Income Bracket in West Carthage
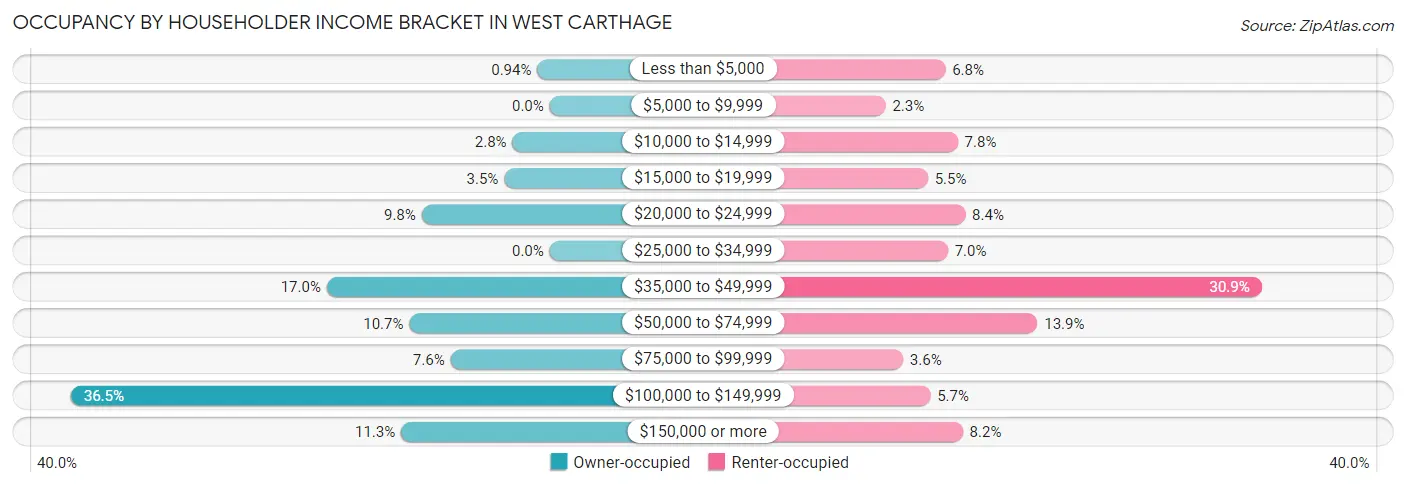
| Income Bracket | Owner-occupied | Renter-occupied |
| Less than $5,000 | 3 (0.9%) | 36 (6.8%) |
| $5,000 to $9,999 | 0 (0.0%) | 12 (2.3%) |
| $10,000 to $14,999 | 9 (2.8%) | 41 (7.8%) |
| $15,000 to $19,999 | 11 (3.5%) | 29 (5.5%) |
| $20,000 to $24,999 | 31 (9.8%) | 44 (8.4%) |
| $25,000 to $34,999 | 0 (0.0%) | 37 (7.0%) |
| $35,000 to $49,999 | 54 (17.0%) | 163 (30.9%) |
| $50,000 to $74,999 | 34 (10.7%) | 73 (13.9%) |
| $75,000 to $99,999 | 24 (7.5%) | 19 (3.6%) |
| $100,000 to $149,999 | 116 (36.5%) | 30 (5.7%) |
| $150,000 or more | 36 (11.3%) | 43 (8.2%) |
| Total | 318 (100.0%) | 527 (100.0%) |
Monthly Housing Cost Tiers in West Carthage
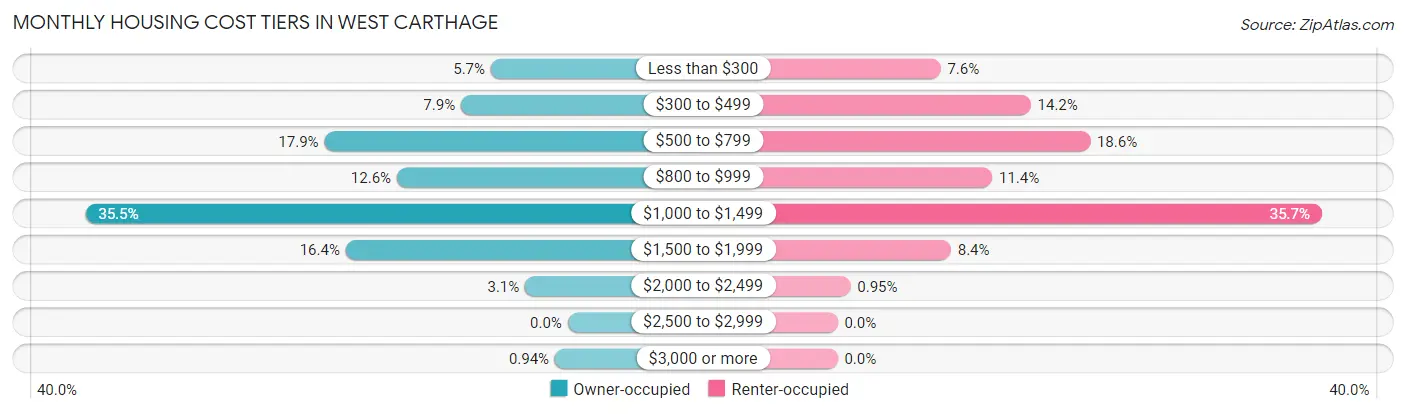
| Monthly Cost | Owner-occupied | Renter-occupied |
| Less than $300 | 18 (5.7%) | 40 (7.6%) |
| $300 to $499 | 25 (7.9%) | 75 (14.2%) |
| $500 to $799 | 57 (17.9%) | 98 (18.6%) |
| $800 to $999 | 40 (12.6%) | 60 (11.4%) |
| $1,000 to $1,499 | 113 (35.5%) | 188 (35.7%) |
| $1,500 to $1,999 | 52 (16.4%) | 44 (8.4%) |
| $2,000 to $2,499 | 10 (3.1%) | 5 (0.9%) |
| $2,500 to $2,999 | 0 (0.0%) | 0 (0.0%) |
| $3,000 or more | 3 (0.9%) | 0 (0.0%) |
| Total | 318 (100.0%) | 527 (100.0%) |
Physical Housing Characteristics in West Carthage
Housing Structures in West Carthage
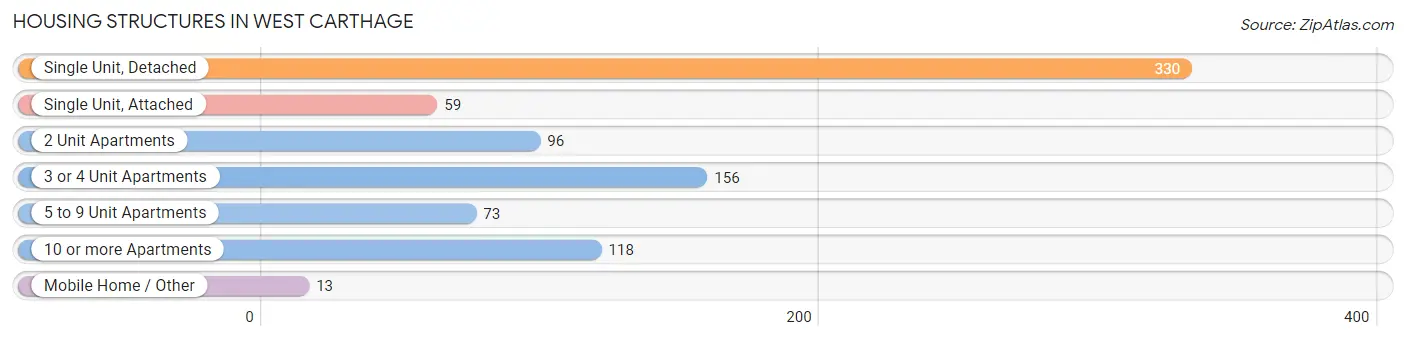
| Structure Type | # Housing Units | % Housing Units |
| Single Unit, Detached | 330 | 39.1% |
| Single Unit, Attached | 59 | 7.0% |
| 2 Unit Apartments | 96 | 11.4% |
| 3 or 4 Unit Apartments | 156 | 18.5% |
| 5 to 9 Unit Apartments | 73 | 8.6% |
| 10 or more Apartments | 118 | 14.0% |
| Mobile Home / Other | 13 | 1.5% |
| Total | 845 | 100.0% |
Housing Structures by Occupancy in West Carthage
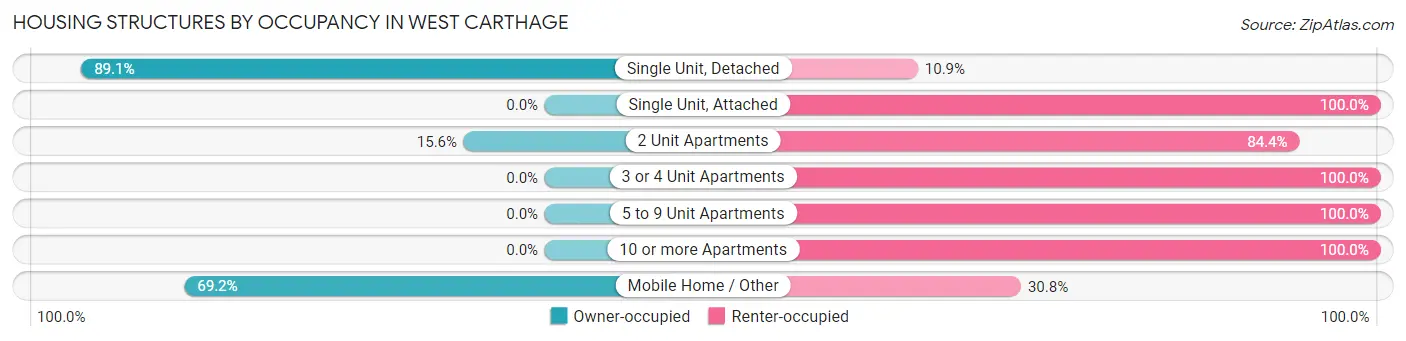
| Structure Type | Owner-occupied | Renter-occupied |
| Single Unit, Detached | 294 (89.1%) | 36 (10.9%) |
| Single Unit, Attached | 0 (0.0%) | 59 (100.0%) |
| 2 Unit Apartments | 15 (15.6%) | 81 (84.4%) |
| 3 or 4 Unit Apartments | 0 (0.0%) | 156 (100.0%) |
| 5 to 9 Unit Apartments | 0 (0.0%) | 73 (100.0%) |
| 10 or more Apartments | 0 (0.0%) | 118 (100.0%) |
| Mobile Home / Other | 9 (69.2%) | 4 (30.8%) |
| Total | 318 (37.6%) | 527 (62.4%) |
Housing Structures by Number of Rooms in West Carthage
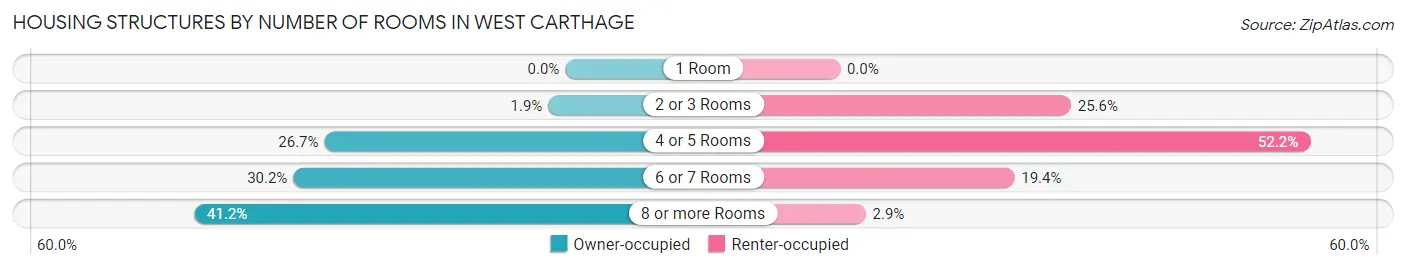
| Number of Rooms | Owner-occupied | Renter-occupied |
| 1 Room | 0 (0.0%) | 0 (0.0%) |
| 2 or 3 Rooms | 6 (1.9%) | 135 (25.6%) |
| 4 or 5 Rooms | 85 (26.7%) | 275 (52.2%) |
| 6 or 7 Rooms | 96 (30.2%) | 102 (19.4%) |
| 8 or more Rooms | 131 (41.2%) | 15 (2.9%) |
| Total | 318 (100.0%) | 527 (100.0%) |
Housing Structure by Heating Type in West Carthage
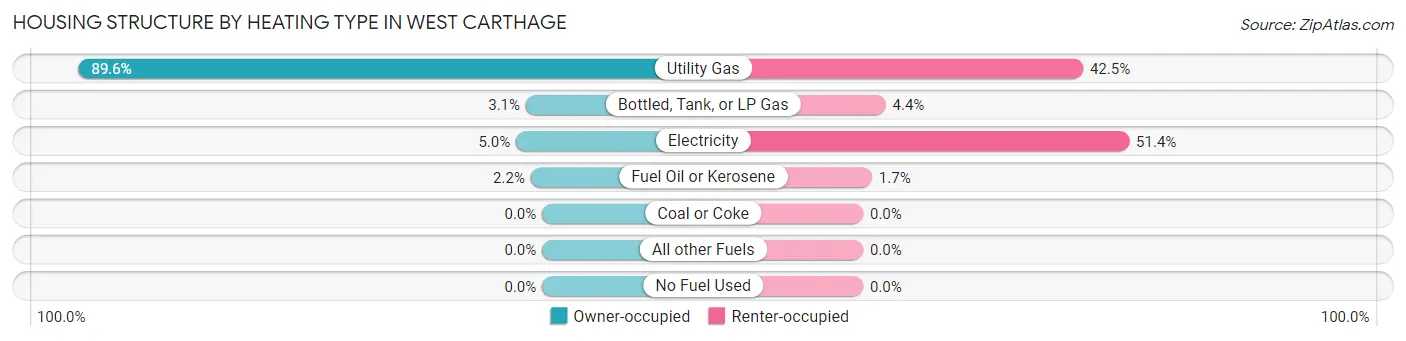
| Heating Type | Owner-occupied | Renter-occupied |
| Utility Gas | 285 (89.6%) | 224 (42.5%) |
| Bottled, Tank, or LP Gas | 10 (3.1%) | 23 (4.4%) |
| Electricity | 16 (5.0%) | 271 (51.4%) |
| Fuel Oil or Kerosene | 7 (2.2%) | 9 (1.7%) |
| Coal or Coke | 0 (0.0%) | 0 (0.0%) |
| All other Fuels | 0 (0.0%) | 0 (0.0%) |
| No Fuel Used | 0 (0.0%) | 0 (0.0%) |
| Total | 318 (100.0%) | 527 (100.0%) |
Household Vehicle Usage in West Carthage
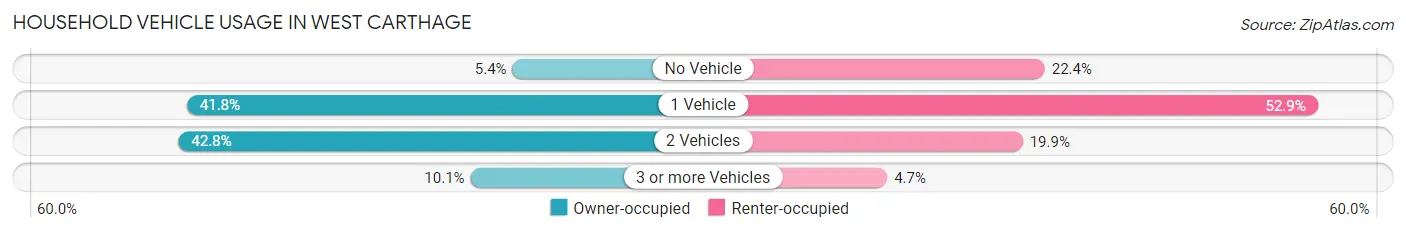
| Vehicles per Household | Owner-occupied | Renter-occupied |
| No Vehicle | 17 (5.3%) | 118 (22.4%) |
| 1 Vehicle | 133 (41.8%) | 279 (52.9%) |
| 2 Vehicles | 136 (42.8%) | 105 (19.9%) |
| 3 or more Vehicles | 32 (10.1%) | 25 (4.7%) |
| Total | 318 (100.0%) | 527 (100.0%) |
Real Estate & Mortgages in West Carthage
Real Estate and Mortgage Overview in West Carthage
| Characteristic | Without Mortgage | With Mortgage |
| Housing Units | 144 | 174 |
| Median Property Value | $162,500 | $160,300 |
| Median Household Income | $61,250 | $23 |
| Monthly Housing Costs | $741 | $3 |
| Real Estate Taxes | $3,239 | $8 |
Property Value by Mortgage Status in West Carthage
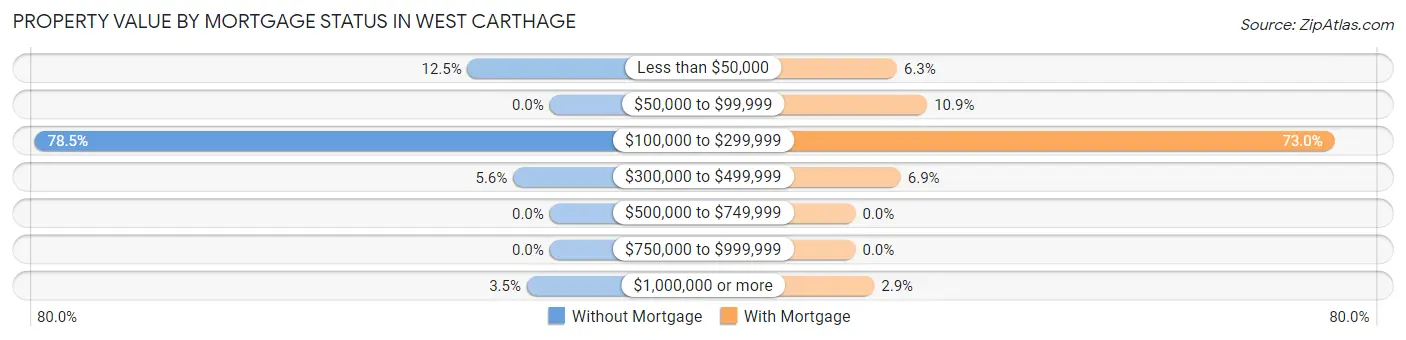
| Property Value | Without Mortgage | With Mortgage |
| Less than $50,000 | 18 (12.5%) | 11 (6.3%) |
| $50,000 to $99,999 | 0 (0.0%) | 19 (10.9%) |
| $100,000 to $299,999 | 113 (78.5%) | 127 (73.0%) |
| $300,000 to $499,999 | 8 (5.6%) | 12 (6.9%) |
| $500,000 to $749,999 | 0 (0.0%) | 0 (0.0%) |
| $750,000 to $999,999 | 0 (0.0%) | 0 (0.0%) |
| $1,000,000 or more | 5 (3.5%) | 5 (2.9%) |
| Total | 144 (100.0%) | 174 (100.0%) |
Household Income by Mortgage Status in West Carthage
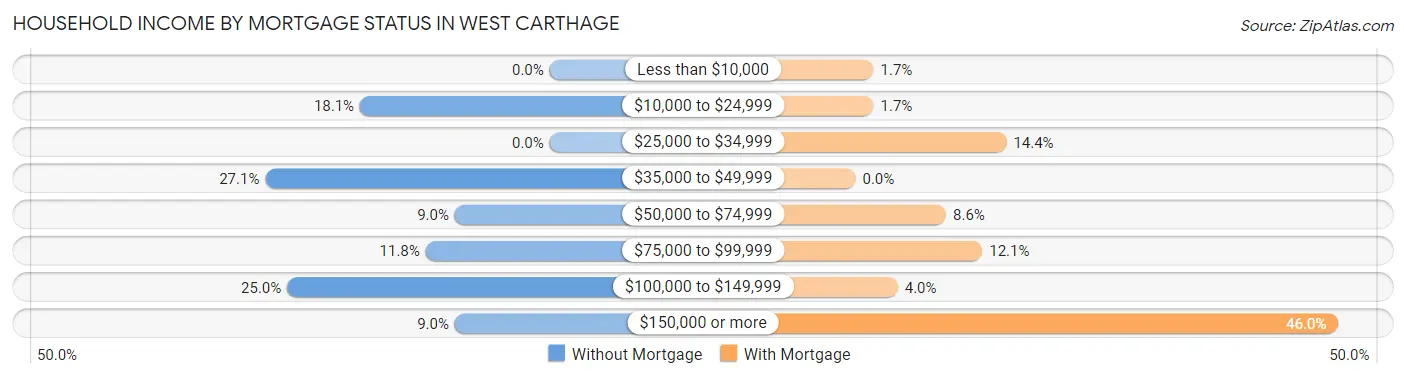
| Household Income | Without Mortgage | With Mortgage |
| Less than $10,000 | 0 (0.0%) | 3 (1.7%) |
| $10,000 to $24,999 | 26 (18.1%) | 3 (1.7%) |
| $25,000 to $34,999 | 0 (0.0%) | 25 (14.4%) |
| $35,000 to $49,999 | 39 (27.1%) | 0 (0.0%) |
| $50,000 to $74,999 | 13 (9.0%) | 15 (8.6%) |
| $75,000 to $99,999 | 17 (11.8%) | 21 (12.1%) |
| $100,000 to $149,999 | 36 (25.0%) | 7 (4.0%) |
| $150,000 or more | 13 (9.0%) | 80 (46.0%) |
| Total | 144 (100.0%) | 174 (100.0%) |
Property Value to Household Income Ratio in West Carthage
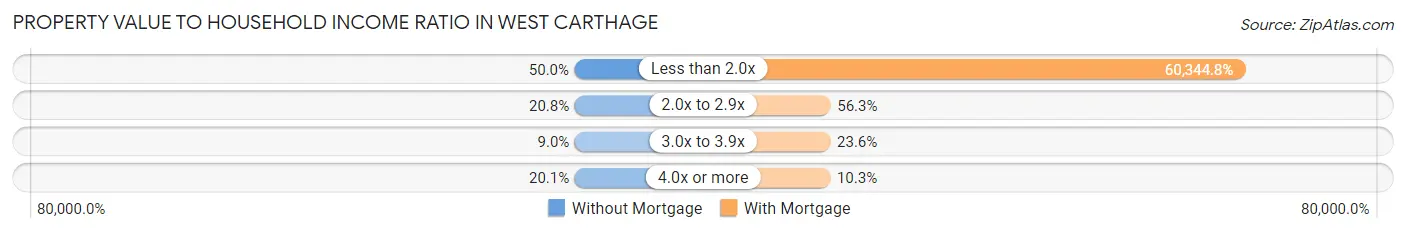
| Value-to-Income Ratio | Without Mortgage | With Mortgage |
| Less than 2.0x | 72 (50.0%) | 105,000 (60,344.8%) |
| 2.0x to 2.9x | 30 (20.8%) | 98 (56.3%) |
| 3.0x to 3.9x | 13 (9.0%) | 41 (23.6%) |
| 4.0x or more | 29 (20.1%) | 18 (10.3%) |
| Total | 144 (100.0%) | 174 (100.0%) |
Real Estate Taxes by Mortgage Status in West Carthage
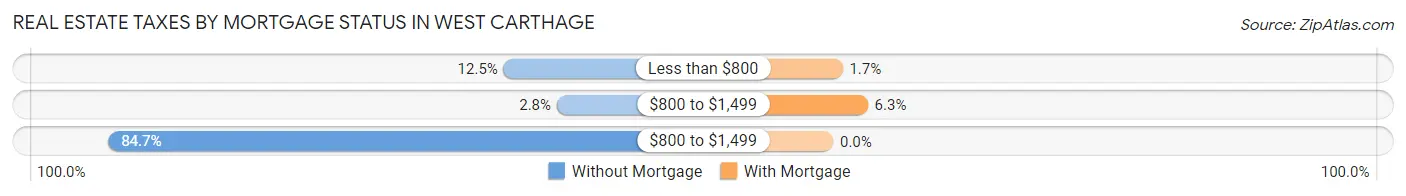
| Property Taxes | Without Mortgage | With Mortgage |
| Less than $800 | 18 (12.5%) | 3 (1.7%) |
| $800 to $1,499 | 4 (2.8%) | 11 (6.3%) |
| $800 to $1,499 | 122 (84.7%) | 0 (0.0%) |
| Total | 144 (100.0%) | 174 (100.0%) |
Health & Disability in West Carthage
Health Insurance Coverage by Age in West Carthage
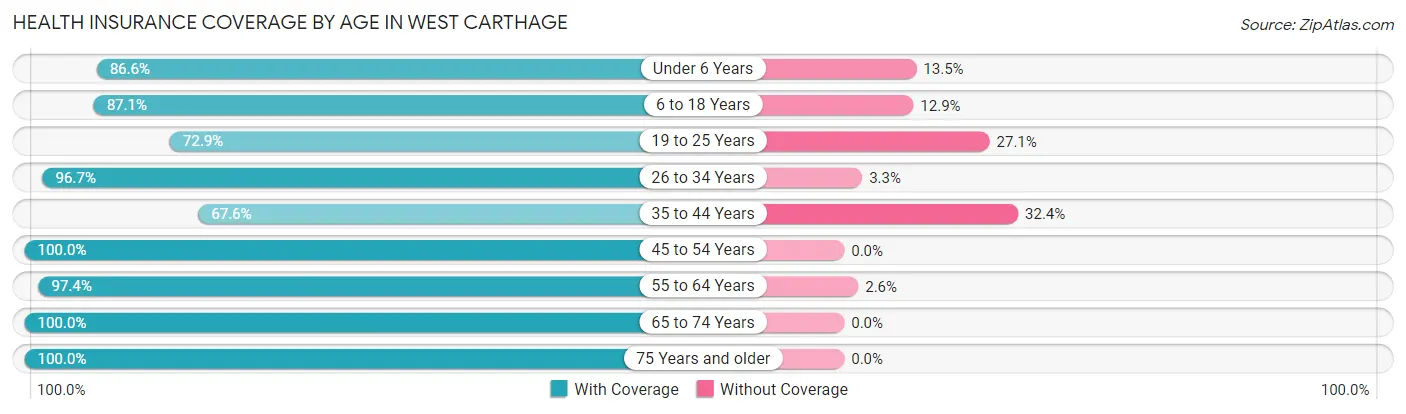
| Age Bracket | With Coverage | Without Coverage |
| Under 6 Years | 103 (86.6%) | 16 (13.5%) |
| 6 to 18 Years | 169 (87.1%) | 25 (12.9%) |
| 19 to 25 Years | 113 (72.9%) | 42 (27.1%) |
| 26 to 34 Years | 289 (96.7%) | 10 (3.3%) |
| 35 to 44 Years | 98 (67.6%) | 47 (32.4%) |
| 45 to 54 Years | 113 (100.0%) | 0 (0.0%) |
| 55 to 64 Years | 149 (97.4%) | 4 (2.6%) |
| 65 to 74 Years | 183 (100.0%) | 0 (0.0%) |
| 75 Years and older | 122 (100.0%) | 0 (0.0%) |
| Total | 1,339 (90.3%) | 144 (9.7%) |
Health Insurance Coverage by Citizenship Status in West Carthage
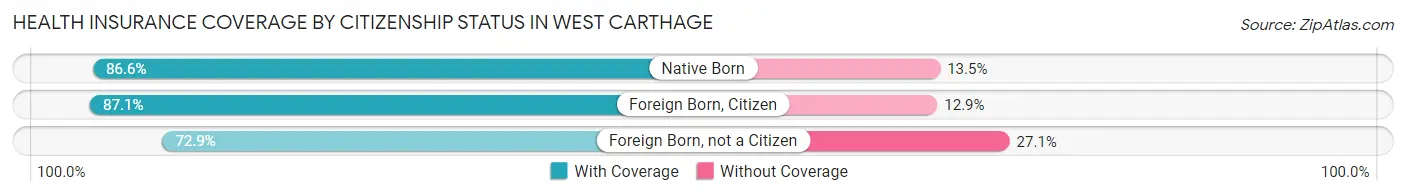
| Citizenship Status | With Coverage | Without Coverage |
| Native Born | 103 (86.6%) | 16 (13.5%) |
| Foreign Born, Citizen | 169 (87.1%) | 25 (12.9%) |
| Foreign Born, not a Citizen | 113 (72.9%) | 42 (27.1%) |
Health Insurance Coverage by Household Income in West Carthage
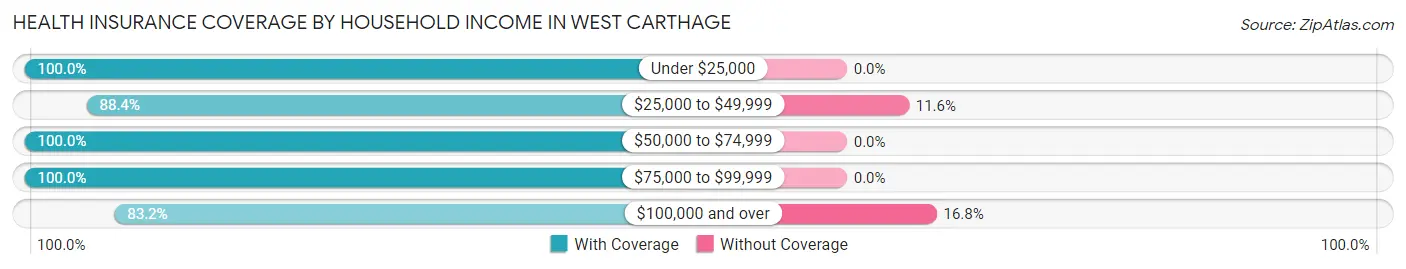
| Household Income | With Coverage | Without Coverage |
| Under $25,000 | 231 (100.0%) | 0 (0.0%) |
| $25,000 to $49,999 | 388 (88.4%) | 51 (11.6%) |
| $50,000 to $74,999 | 173 (100.0%) | 0 (0.0%) |
| $75,000 to $99,999 | 77 (100.0%) | 0 (0.0%) |
| $100,000 and over | 460 (83.2%) | 93 (16.8%) |
Public vs Private Health Insurance Coverage by Age in West Carthage
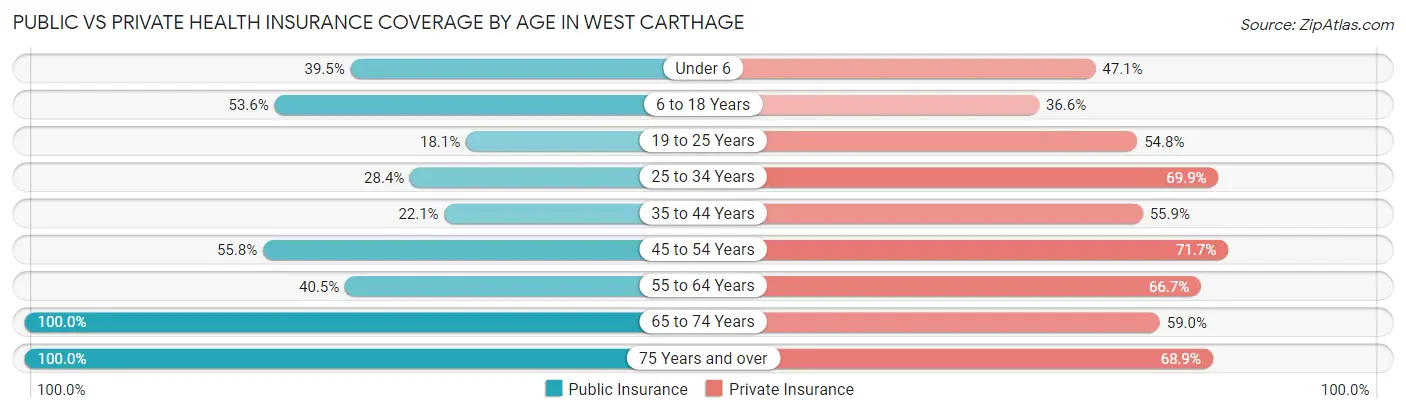
| Age Bracket | Public Insurance | Private Insurance |
| Under 6 | 47 (39.5%) | 56 (47.1%) |
| 6 to 18 Years | 104 (53.6%) | 71 (36.6%) |
| 19 to 25 Years | 28 (18.1%) | 85 (54.8%) |
| 25 to 34 Years | 85 (28.4%) | 209 (69.9%) |
| 35 to 44 Years | 32 (22.1%) | 81 (55.9%) |
| 45 to 54 Years | 63 (55.7%) | 81 (71.7%) |
| 55 to 64 Years | 62 (40.5%) | 102 (66.7%) |
| 65 to 74 Years | 183 (100.0%) | 108 (59.0%) |
| 75 Years and over | 122 (100.0%) | 84 (68.9%) |
| Total | 726 (48.9%) | 877 (59.1%) |
Disability Status by Sex by Age in West Carthage
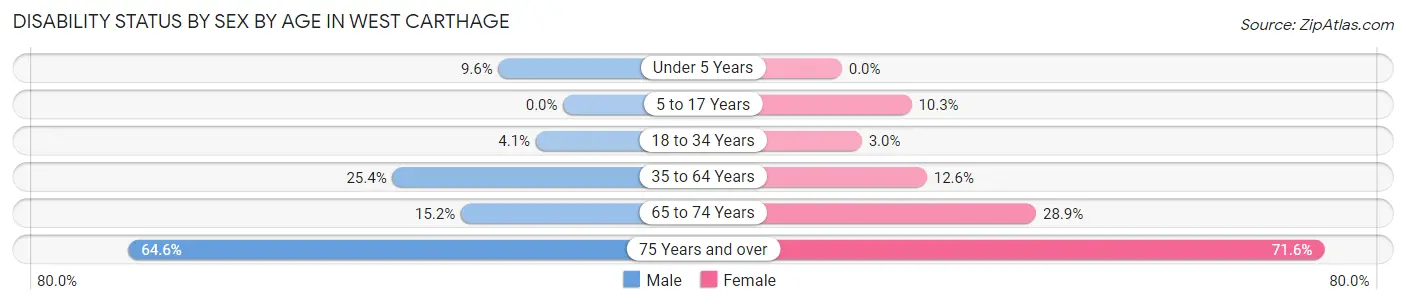
| Age Bracket | Male | Female |
| Under 5 Years | 5 (9.6%) | 0 (0.0%) |
| 5 to 17 Years | 0 (0.0%) | 9 (10.3%) |
| 18 to 34 Years | 7 (4.1%) | 9 (3.0%) |
| 35 to 64 Years | 52 (25.4%) | 26 (12.6%) |
| 65 to 74 Years | 12 (15.2%) | 30 (28.8%) |
| 75 Years and over | 31 (64.6%) | 53 (71.6%) |
Disability Class by Sex by Age in West Carthage
Disability Class: Hearing Difficulty
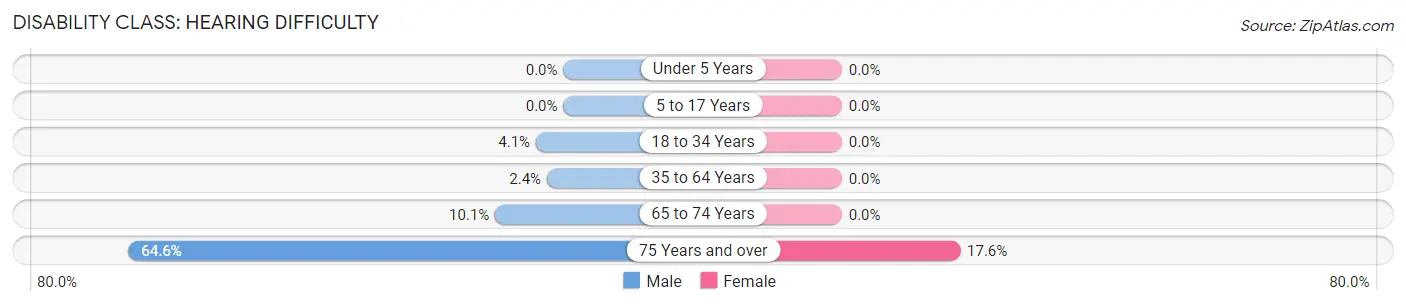
| Age Bracket | Male | Female |
| Under 5 Years | 0 (0.0%) | 0 (0.0%) |
| 5 to 17 Years | 0 (0.0%) | 0 (0.0%) |
| 18 to 34 Years | 7 (4.1%) | 0 (0.0%) |
| 35 to 64 Years | 5 (2.4%) | 0 (0.0%) |
| 65 to 74 Years | 8 (10.1%) | 0 (0.0%) |
| 75 Years and over | 31 (64.6%) | 13 (17.6%) |
Disability Class: Vision Difficulty
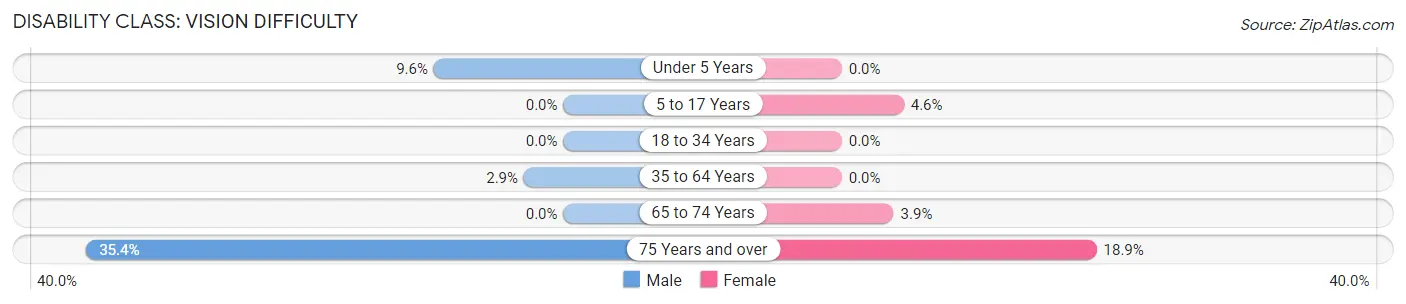
| Age Bracket | Male | Female |
| Under 5 Years | 5 (9.6%) | 0 (0.0%) |
| 5 to 17 Years | 0 (0.0%) | 4 (4.6%) |
| 18 to 34 Years | 0 (0.0%) | 0 (0.0%) |
| 35 to 64 Years | 6 (2.9%) | 0 (0.0%) |
| 65 to 74 Years | 0 (0.0%) | 4 (3.8%) |
| 75 Years and over | 17 (35.4%) | 14 (18.9%) |
Disability Class: Cognitive Difficulty
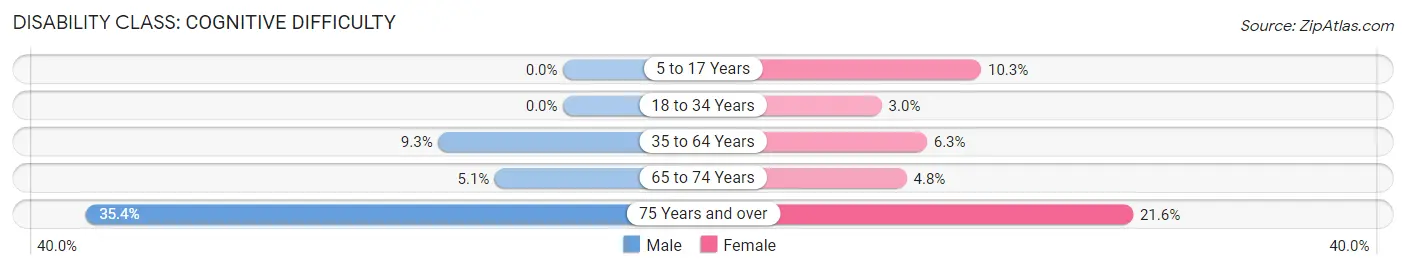
| Age Bracket | Male | Female |
| 5 to 17 Years | 0 (0.0%) | 9 (10.3%) |
| 18 to 34 Years | 0 (0.0%) | 9 (3.0%) |
| 35 to 64 Years | 19 (9.3%) | 13 (6.3%) |
| 65 to 74 Years | 4 (5.1%) | 5 (4.8%) |
| 75 Years and over | 17 (35.4%) | 16 (21.6%) |
Disability Class: Ambulatory Difficulty
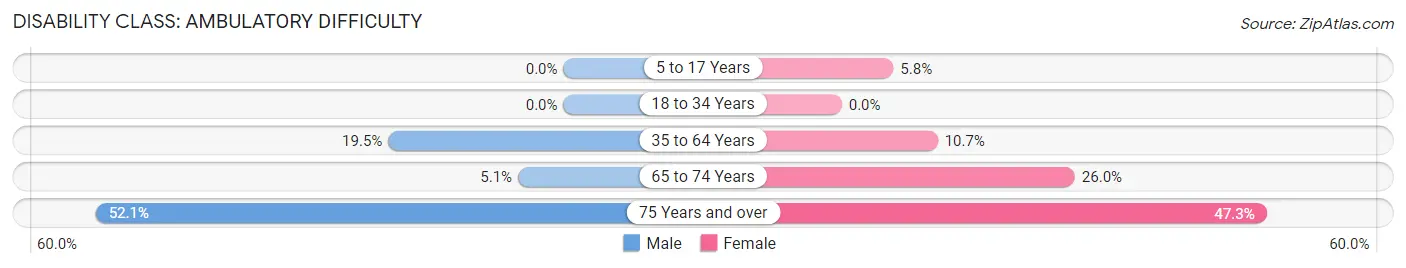
| Age Bracket | Male | Female |
| 5 to 17 Years | 0 (0.0%) | 5 (5.8%) |
| 18 to 34 Years | 0 (0.0%) | 0 (0.0%) |
| 35 to 64 Years | 40 (19.5%) | 22 (10.7%) |
| 65 to 74 Years | 4 (5.1%) | 27 (26.0%) |
| 75 Years and over | 25 (52.1%) | 35 (47.3%) |
Disability Class: Self-Care Difficulty
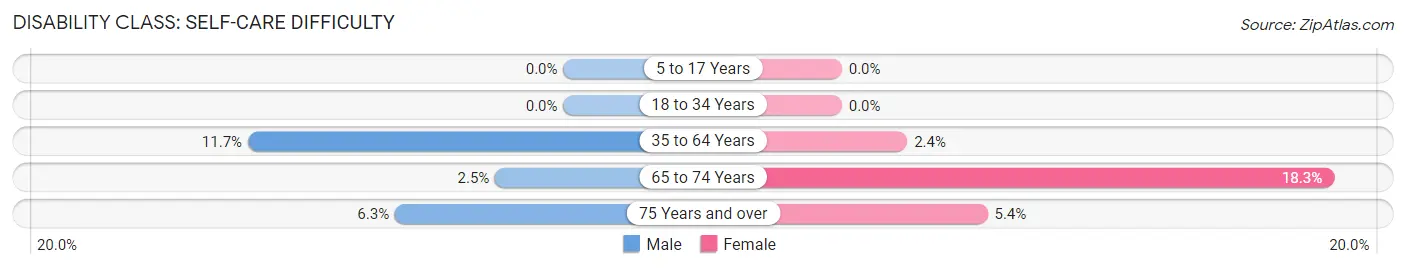
| Age Bracket | Male | Female |
| 5 to 17 Years | 0 (0.0%) | 0 (0.0%) |
| 18 to 34 Years | 0 (0.0%) | 0 (0.0%) |
| 35 to 64 Years | 24 (11.7%) | 5 (2.4%) |
| 65 to 74 Years | 2 (2.5%) | 19 (18.3%) |
| 75 Years and over | 3 (6.2%) | 4 (5.4%) |
Technology Access in West Carthage
Computing Device Access in West Carthage
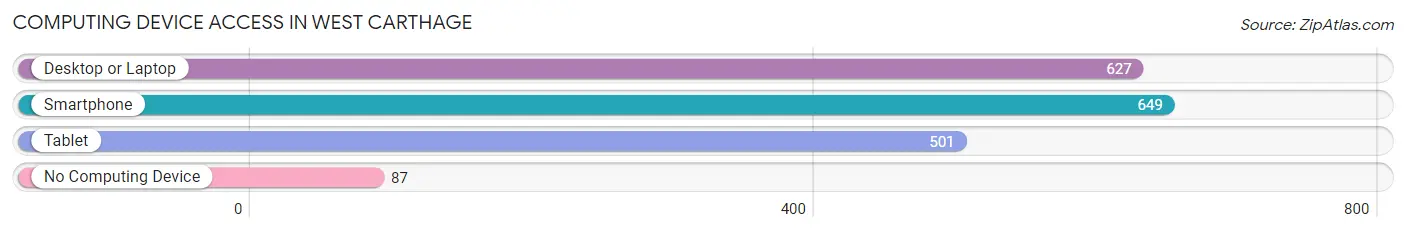
| Device Type | # Households | % Households |
| Desktop or Laptop | 627 | 74.2% |
| Smartphone | 649 | 76.8% |
| Tablet | 501 | 59.3% |
| No Computing Device | 87 | 10.3% |
| Total | 845 | 100.0% |
Internet Access in West Carthage
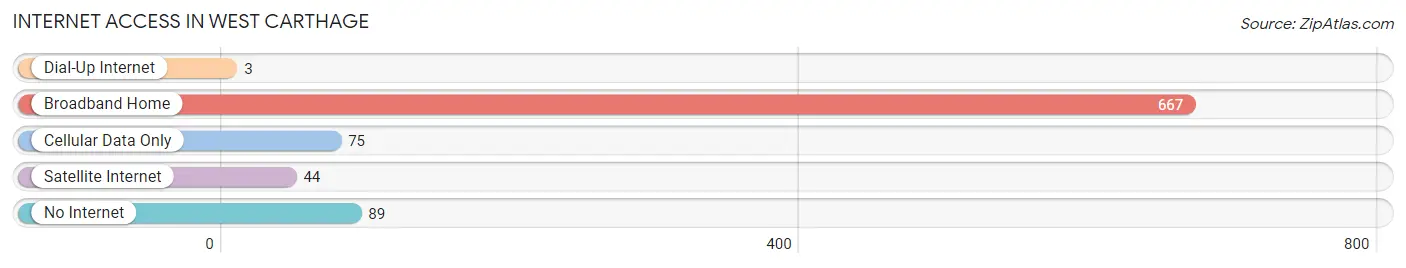
| Internet Type | # Households | % Households |
| Dial-Up Internet | 3 | 0.4% |
| Broadband Home | 667 | 78.9% |
| Cellular Data Only | 75 | 8.9% |
| Satellite Internet | 44 | 5.2% |
| No Internet | 89 | 10.5% |
| Total | 845 | 100.0% |
West Carthage Summary
West Carthage is a village located in the town of Wilna in Jefferson County, New York. It is situated on the Black River, which is a tributary of Lake Ontario. The village is located approximately 20 miles north of Watertown, the county seat. The population of West Carthage was 1,845 at the 2010 census.
Geography
West Carthage is located at 43°59'N 75°48'W (43.983, -75.800). According to the United States Census Bureau, the village has a total area of 1.2 square miles (3.1 km2), all of it land.
History
The area that is now West Carthage was first settled in the early 19th century by settlers from New England. The village was originally known as "Carthage Falls" due to the presence of a waterfall on the Black River. The name was changed to "West Carthage" in 1825.
The village was incorporated in 1851. The economy of the village was based on the lumber industry, which was a major source of employment for many of the residents. The village also had a number of small businesses, including a grist mill, a saw mill, a tannery, and a blacksmith shop.
In the late 19th century, the village was a popular tourist destination due to its proximity to the Black River and the nearby Thousand Islands. The village was also home to a number of summer resorts, which attracted visitors from all over the country.
Economy
The economy of West Carthage is largely based on tourism and manufacturing. The village is home to a number of small businesses, including restaurants, retail stores, and service providers. The village is also home to a number of manufacturing companies, including a paper mill, a plastics factory, and a metal fabrication plant.
The village is also home to a number of recreational activities, including fishing, boating, and camping. The nearby Black River is a popular destination for kayaking and canoeing.
Demographics
As of the 2010 census, the population of West Carthage was 1,845. The racial makeup of the village was 97.2% White, 0.7% African American, 0.3% Native American, 0.2% Asian, 0.1% Pacific Islander, 0.3% from other races, and 1.3% from two or more races. Hispanic or Latino of any race were 1.3% of the population.
The median income for a household in the village was $37,917, and the median income for a family was $45,000. The per capita income for the village was $19,945. About 11.2% of families and 14.2% of the population were below the poverty line, including 19.2% of those under age 18 and 8.2% of those age 65 or over.
West Carthage is served by the Carthage Central School District. The village is also home to a number of churches, including the First Presbyterian Church, the United Methodist Church, and the Church of the Nazarene.
Common Questions
What is Per Capita Income in West Carthage?
Per Capita income in West Carthage is $39,909.
What is the Median Family Income in West Carthage?
Median Family Income in West Carthage is $90,375.
What is the Median Household income in West Carthage?
Median Household Income in West Carthage is $46,875.
What is Income or Wage Gap in West Carthage?
Income or Wage Gap in West Carthage is 34.0%.
Women in West Carthage earn 66.0 cents for every dollar earned by a man.
What is Inequality or Gini Index in West Carthage?
Inequality or Gini Index in West Carthage is 0.51.
What is the Total Population of West Carthage?
Total Population of West Carthage is 1,632.
What is the Total Male Population of West Carthage?
Total Male Population of West Carthage is 803.
What is the Total Female Population of West Carthage?
Total Female Population of West Carthage is 829.
What is the Ratio of Males per 100 Females in West Carthage?
There are 96.86 Males per 100 Females in West Carthage.
What is the Ratio of Females per 100 Males in West Carthage?
There are 103.24 Females per 100 Males in West Carthage.
What is the Median Population Age in West Carthage?
Median Population Age in West Carthage is 33.1 Years.
What is the Average Family Size in West Carthage
Average Family Size in West Carthage is 2.8 People.
What is the Average Household Size in West Carthage
Average Household Size in West Carthage is 1.9 People.
How Large is the Labor Force in West Carthage?
There are 822 People in the Labor Forcein in West Carthage.
What is the Percentage of People in the Labor Force in West Carthage?
60.5% of People are in the Labor Force in West Carthage.
What is the Unemployment Rate in West Carthage?
Unemployment Rate in West Carthage is 0.9%.