Hoosick Falls, NY Map & Demographics
Hoosick Falls Map
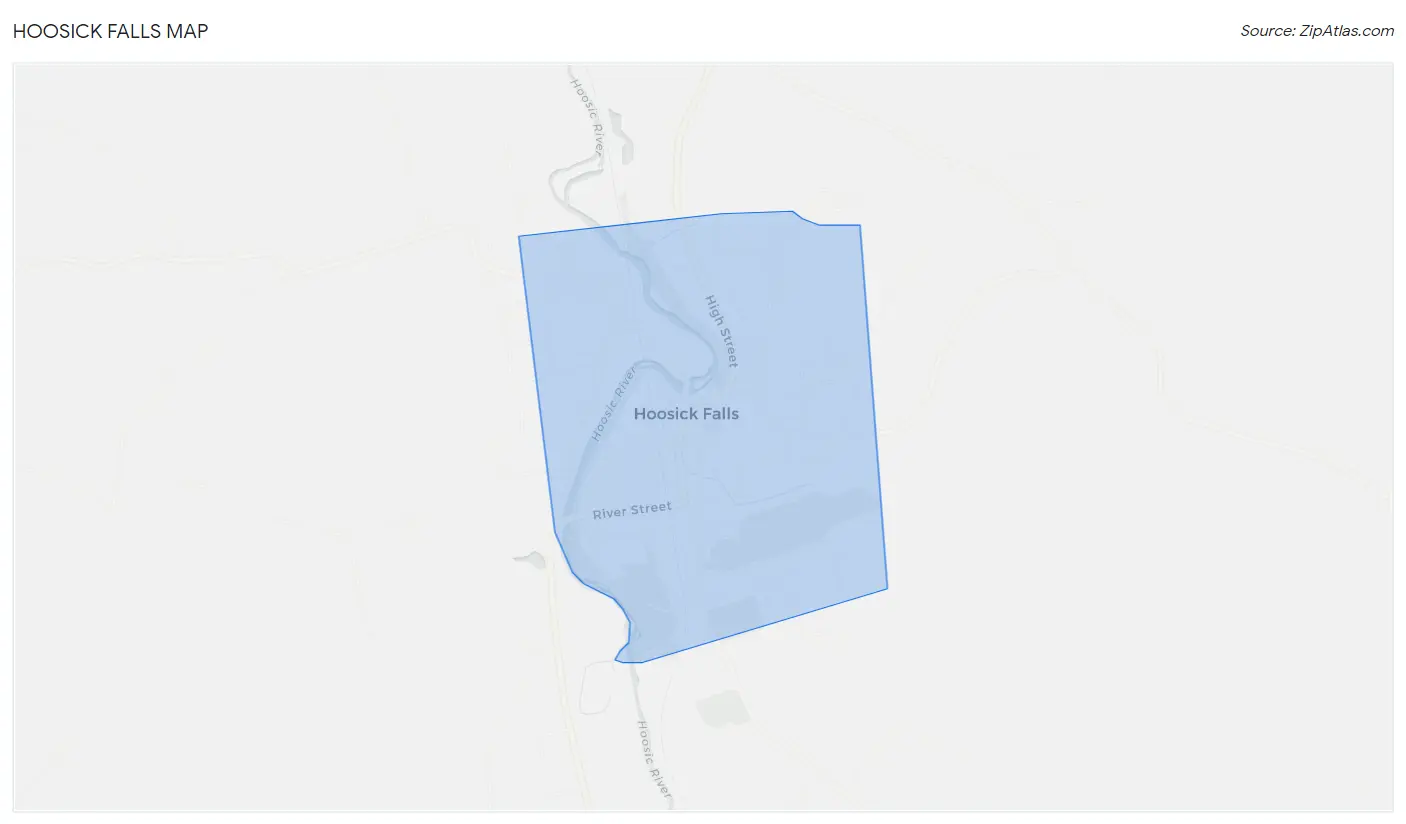
Hoosick Falls Overview
$34,846
PER CAPITA INCOME
$78,924
AVG FAMILY INCOME
$63,811
AVG HOUSEHOLD INCOME
25.2%
WAGE / INCOME GAP [ % ]
74.8¢/ $1
WAGE / INCOME GAP [ $ ]
0.46
INEQUALITY / GINI INDEX
3,225
TOTAL POPULATION
1,306
MALE POPULATION
1,919
FEMALE POPULATION
68.06
MALES / 100 FEMALES
146.94
FEMALES / 100 MALES
46.4
MEDIAN AGE
3.0
AVG FAMILY SIZE
2.4
AVG HOUSEHOLD SIZE
1,326
LABOR FORCE [ PEOPLE ]
53.7%
PERCENT IN LABOR FORCE
1.2%
UNEMPLOYMENT RATE
Hoosick Falls Zip Codes
Hoosick Falls Area Codes
Income in Hoosick Falls
Income Overview in Hoosick Falls
Per Capita Income in Hoosick Falls is $34,846, while median incomes of families and households are $78,924 and $63,811 respectively.
| Characteristic | Number | Measure |
| Per Capita Income | 3,225 | $34,846 |
| Median Family Income | 783 | $78,924 |
| Mean Family Income | 783 | $106,488 |
| Median Household Income | 1,314 | $63,811 |
| Mean Household Income | 1,314 | $84,964 |
| Income Deficit | 783 | $0 |
| Wage / Income Gap (%) | 3,225 | 25.24% |
| Wage / Income Gap ($) | 3,225 | 74.76¢ per $1 |
| Gini / Inequality Index | 3,225 | 0.46 |
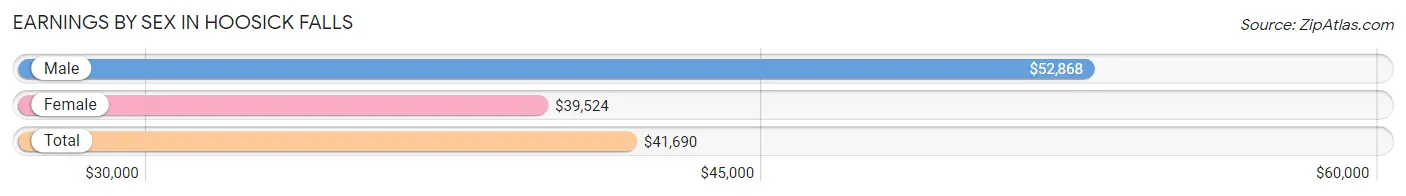
Earnings by Sex in Hoosick Falls
Average Earnings in Hoosick Falls are $41,690, $52,868 for men and $39,524 for women, a difference of 25.2%.
| Sex | Number | Average Earnings |
| Male | 585 (41.7%) | $52,868 |
| Female | 818 (58.3%) | $39,524 |
| Total | 1,403 (100.0%) | $41,690 |
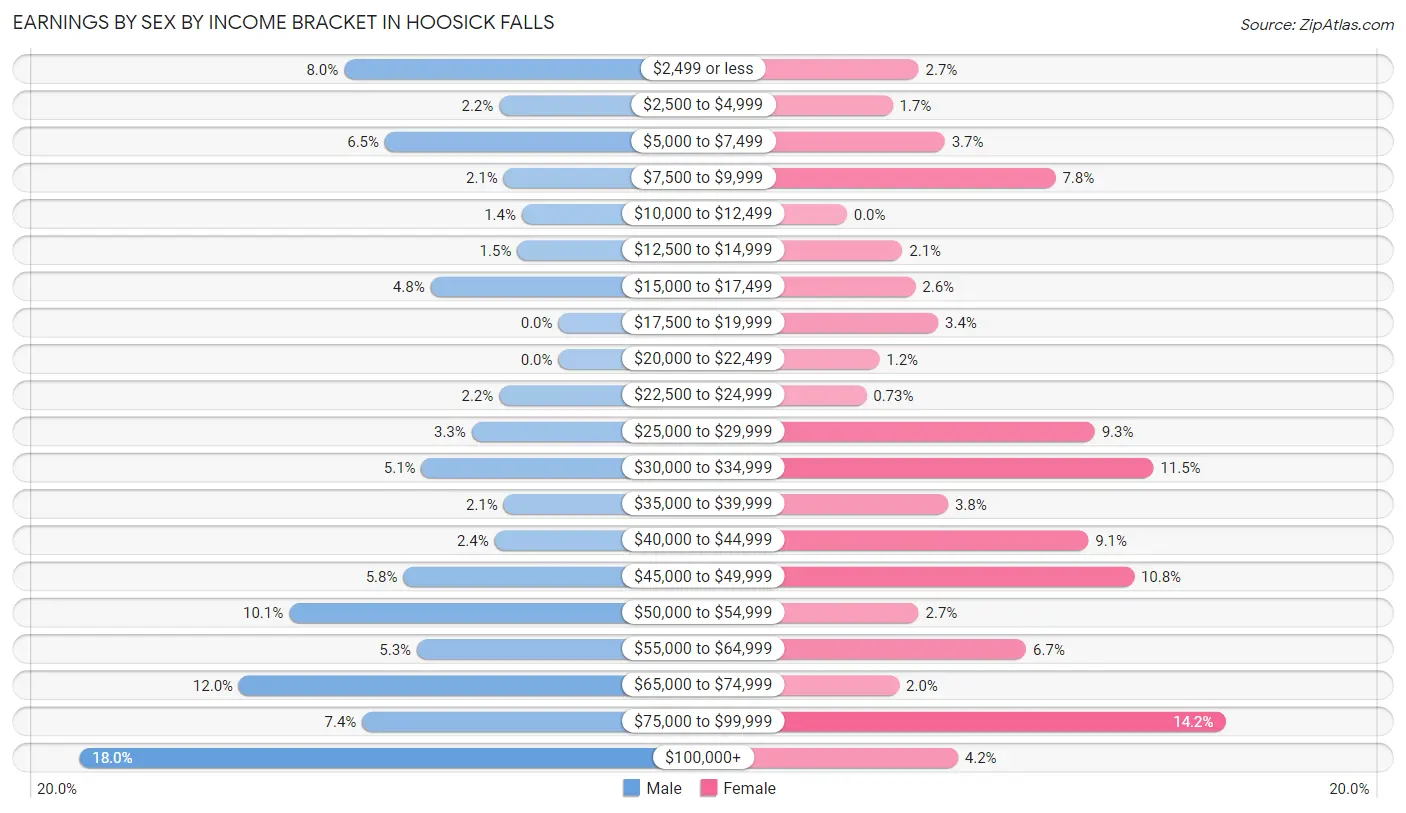
Earnings by Sex by Income Bracket in Hoosick Falls
The most common earnings brackets in Hoosick Falls are $100,000+ for men (105 | 17.9%) and $75,000 to $99,999 for women (116 | 14.2%).
| Income | Male | Female |
| $2,499 or less | 47 (8.0%) | 22 (2.7%) |
| $2,500 to $4,999 | 13 (2.2%) | 14 (1.7%) |
| $5,000 to $7,499 | 38 (6.5%) | 30 (3.7%) |
| $7,500 to $9,999 | 12 (2.1%) | 64 (7.8%) |
| $10,000 to $12,499 | 8 (1.4%) | 0 (0.0%) |
| $12,500 to $14,999 | 9 (1.5%) | 17 (2.1%) |
| $15,000 to $17,499 | 28 (4.8%) | 21 (2.6%) |
| $17,500 to $19,999 | 0 (0.0%) | 28 (3.4%) |
| $20,000 to $22,499 | 0 (0.0%) | 10 (1.2%) |
| $22,500 to $24,999 | 13 (2.2%) | 6 (0.7%) |
| $25,000 to $29,999 | 19 (3.3%) | 76 (9.3%) |
| $30,000 to $34,999 | 30 (5.1%) | 94 (11.5%) |
| $35,000 to $39,999 | 12 (2.1%) | 31 (3.8%) |
| $40,000 to $44,999 | 14 (2.4%) | 74 (9.0%) |
| $45,000 to $49,999 | 34 (5.8%) | 88 (10.8%) |
| $50,000 to $54,999 | 59 (10.1%) | 22 (2.7%) |
| $55,000 to $64,999 | 31 (5.3%) | 55 (6.7%) |
| $65,000 to $74,999 | 70 (12.0%) | 16 (2.0%) |
| $75,000 to $99,999 | 43 (7.3%) | 116 (14.2%) |
| $100,000+ | 105 (17.9%) | 34 (4.2%) |
| Total | 585 (100.0%) | 818 (100.0%) |
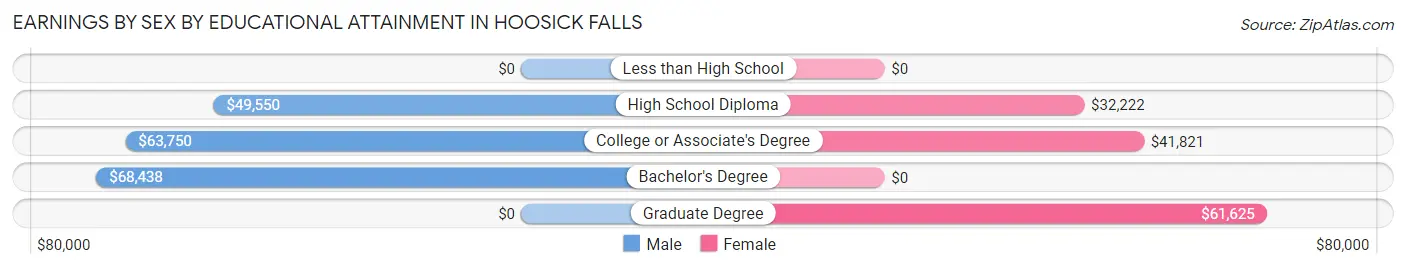
Earnings by Sex by Educational Attainment in Hoosick Falls
Average earnings in Hoosick Falls are $54,338 for men and $40,490 for women, a difference of 25.5%. Men with an educational attainment of bachelor's degree enjoy the highest average annual earnings of $68,438, while those with high school diploma education earn the least with $49,550. Women with an educational attainment of graduate degree earn the most with the average annual earnings of $61,625, while those with high school diploma education have the smallest earnings of $32,222.
| Educational Attainment | Male Income | Female Income |
| Less than High School | - | - |
| High School Diploma | $49,550 | $32,222 |
| College or Associate's Degree | $63,750 | $41,821 |
| Bachelor's Degree | $68,438 | $0 |
| Graduate Degree | - | - |
| Total | $54,338 | $40,490 |
Family Income in Hoosick Falls
Family Income Brackets in Hoosick Falls
According to the Hoosick Falls family income data, there are 171 families falling into the $100,000 to $149,999 income range, which is the most common income bracket and makes up 21.8% of all families.
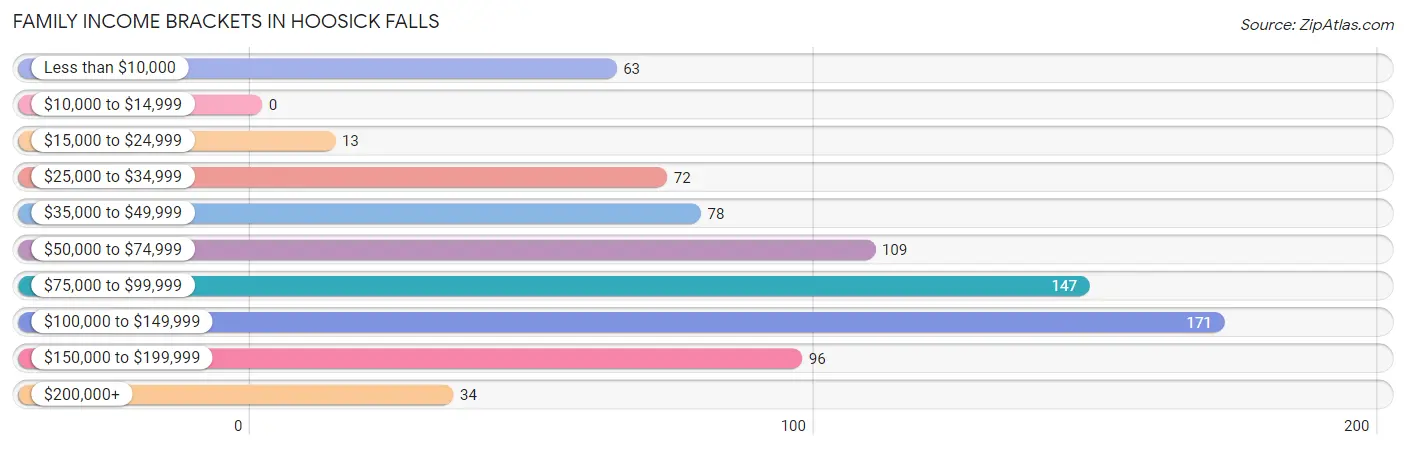
| Income Bracket | # Families | % Families |
| Less than $10,000 | 63 | 8.0% |
| $10,000 to $14,999 | 0 | 0.0% |
| $15,000 to $24,999 | 13 | 1.7% |
| $25,000 to $34,999 | 72 | 9.2% |
| $35,000 to $49,999 | 78 | 10.0% |
| $50,000 to $74,999 | 109 | 13.9% |
| $75,000 to $99,999 | 147 | 18.8% |
| $100,000 to $149,999 | 171 | 21.8% |
| $150,000 to $199,999 | 96 | 12.3% |
| $200,000+ | 34 | 4.3% |
Family Income by Famaliy Size in Hoosick Falls
4-person families (147 | 18.8%) account for the highest median family income in Hoosick Falls with $136,094 per family, while 2-person families (400 | 51.1%) have the highest median income of $35,625 per family member.
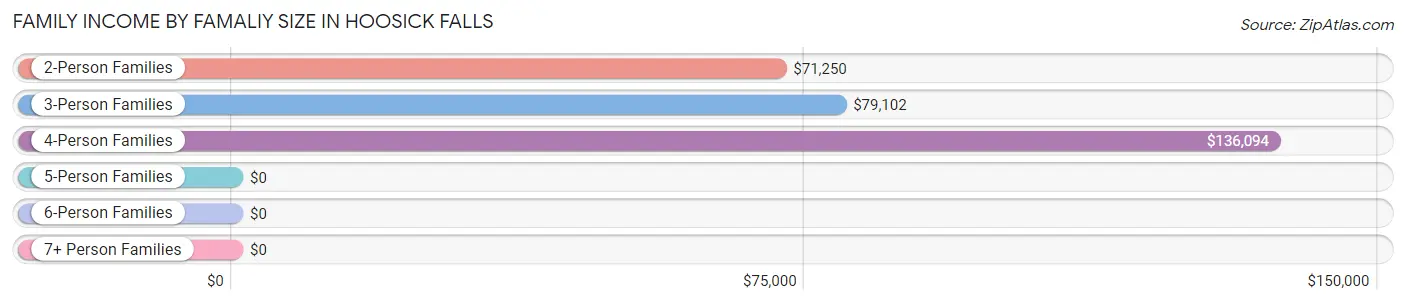
| Income Bracket | # Families | Median Income |
| 2-Person Families | 400 (51.1%) | $71,250 |
| 3-Person Families | 145 (18.5%) | $79,102 |
| 4-Person Families | 147 (18.8%) | $136,094 |
| 5-Person Families | 59 (7.5%) | $0 |
| 6-Person Families | 0 (0.0%) | $0 |
| 7+ Person Families | 32 (4.1%) | $0 |
| Total | 783 (100.0%) | $78,924 |
Family Income by Number of Earners in Hoosick Falls
The median family income in Hoosick Falls is $78,924, with families comprising 3+ earners (82) having the highest median family income of $156,538, while families with no earners (138) have the lowest median family income of $33,750, accounting for 10.5% and 17.6% of families, respectively.
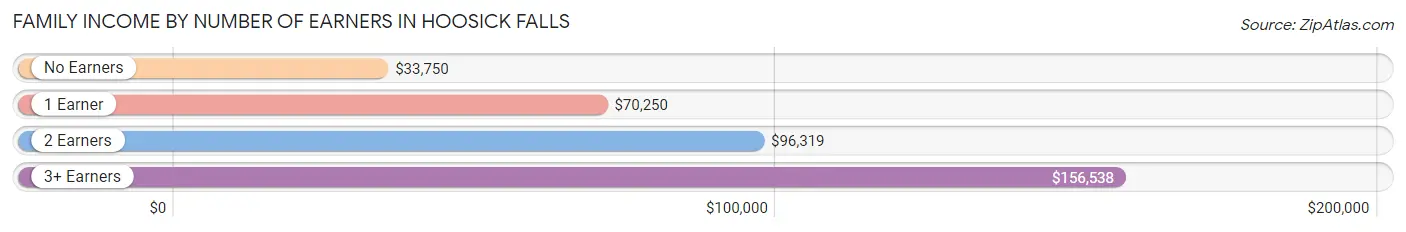
| Number of Earners | # Families | Median Income |
| No Earners | 138 (17.6%) | $33,750 |
| 1 Earner | 306 (39.1%) | $70,250 |
| 2 Earners | 257 (32.8%) | $96,319 |
| 3+ Earners | 82 (10.5%) | $156,538 |
| Total | 783 (100.0%) | $78,924 |
Household Income in Hoosick Falls
Household Income Brackets in Hoosick Falls
With 271 households falling in the category, the $50,000 to $74,999 income range is the most frequent in Hoosick Falls, accounting for 20.6% of all households. In contrast, only 49 households (3.7%) fall into the $10,000 to $14,999 income bracket, making it the least populous group.
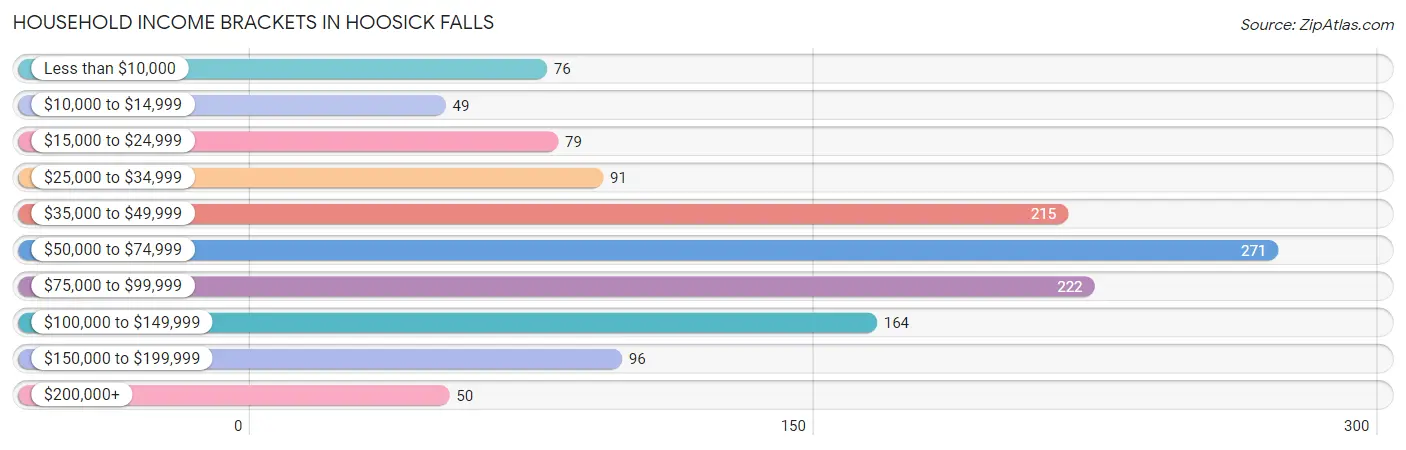
| Income Bracket | # Households | % Households |
| Less than $10,000 | 76 | 5.8% |
| $10,000 to $14,999 | 49 | 3.7% |
| $15,000 to $24,999 | 79 | 6.0% |
| $25,000 to $34,999 | 91 | 6.9% |
| $35,000 to $49,999 | 215 | 16.4% |
| $50,000 to $74,999 | 271 | 20.6% |
| $75,000 to $99,999 | 222 | 16.9% |
| $100,000 to $149,999 | 164 | 12.5% |
| $150,000 to $199,999 | 96 | 7.3% |
| $200,000+ | 50 | 3.8% |
Household Income by Householder Age in Hoosick Falls
The median household income in Hoosick Falls is $63,811, with the highest median household income of $82,500 found in the 25 to 44 years age bracket for the primary householder. A total of 326 households (24.8%) fall into this category.
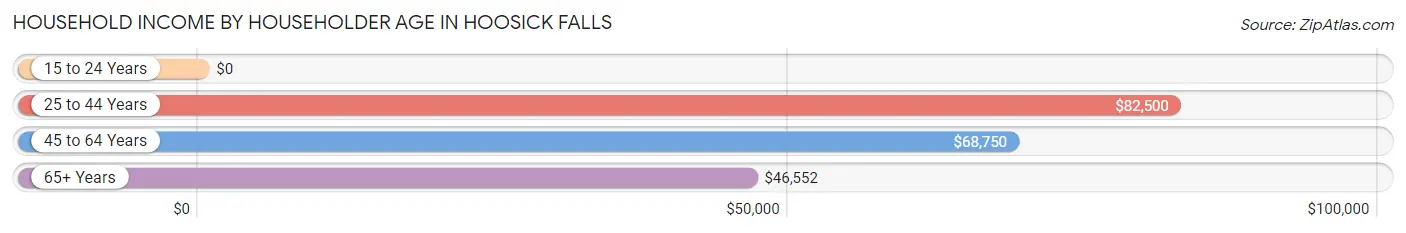
| Income Bracket | # Households | Median Income |
| 15 to 24 Years | 0 (0.0%) | $0 |
| 25 to 44 Years | 326 (24.8%) | $82,500 |
| 45 to 64 Years | 486 (37.0%) | $68,750 |
| 65+ Years | 502 (38.2%) | $46,552 |
| Total | 1,314 (100.0%) | $63,811 |
Poverty in Hoosick Falls
Income Below Poverty by Sex and Age in Hoosick Falls
With 7.2% poverty level for males and 13.7% for females among the residents of Hoosick Falls, 5 year old males and under 5 year old females are the most vulnerable to poverty, with 31 males (100.0%) and 40 females (30.5%) in their respective age groups living below the poverty level.
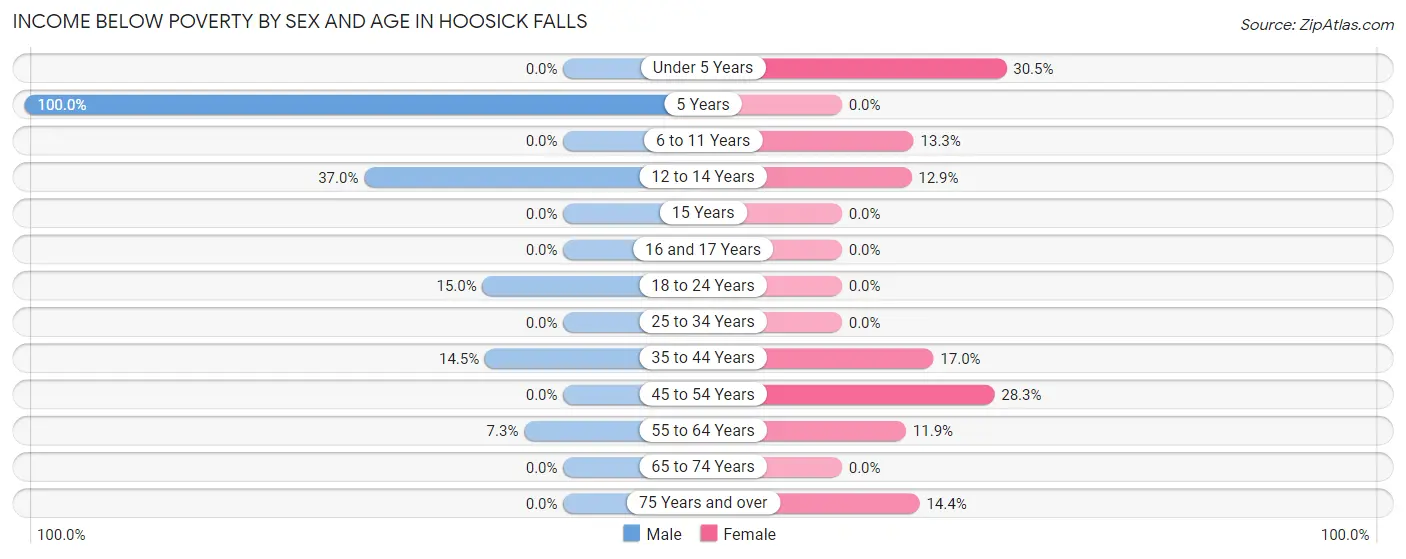
| Age Bracket | Male | Female |
| Under 5 Years | 0 (0.0%) | 40 (30.5%) |
| 5 Years | 31 (100.0%) | 0 (0.0%) |
| 6 to 11 Years | 0 (0.0%) | 14 (13.3%) |
| 12 to 14 Years | 17 (37.0%) | 12 (12.9%) |
| 15 Years | 0 (0.0%) | 0 (0.0%) |
| 16 and 17 Years | 0 (0.0%) | 0 (0.0%) |
| 18 to 24 Years | 12 (15.0%) | 0 (0.0%) |
| 25 to 34 Years | 0 (0.0%) | 0 (0.0%) |
| 35 to 44 Years | 25 (14.5%) | 42 (17.0%) |
| 45 to 54 Years | 0 (0.0%) | 60 (28.3%) |
| 55 to 64 Years | 9 (7.3%) | 37 (11.9%) |
| 65 to 74 Years | 0 (0.0%) | 0 (0.0%) |
| 75 Years and over | 0 (0.0%) | 46 (14.4%) |
| Total | 94 (7.2%) | 251 (13.7%) |
Income Above Poverty by Sex and Age in Hoosick Falls
According to the poverty statistics in Hoosick Falls, males aged under 5 years and females aged 15 years are the age groups that are most secure financially, with 100.0% of males and 100.0% of females in these age groups living above the poverty line.
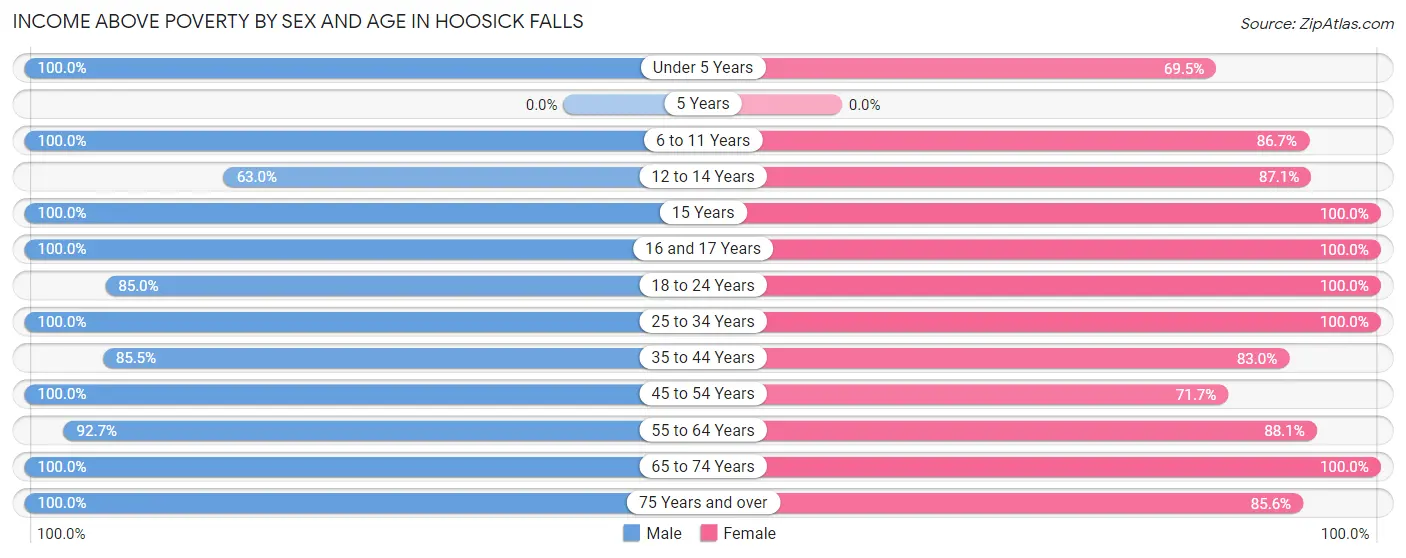
| Age Bracket | Male | Female |
| Under 5 Years | 110 (100.0%) | 91 (69.5%) |
| 5 Years | 0 (0.0%) | 0 (0.0%) |
| 6 to 11 Years | 166 (100.0%) | 91 (86.7%) |
| 12 to 14 Years | 29 (63.0%) | 81 (87.1%) |
| 15 Years | 10 (100.0%) | 33 (100.0%) |
| 16 and 17 Years | 23 (100.0%) | 16 (100.0%) |
| 18 to 24 Years | 68 (85.0%) | 37 (100.0%) |
| 25 to 34 Years | 82 (100.0%) | 149 (100.0%) |
| 35 to 44 Years | 147 (85.5%) | 205 (83.0%) |
| 45 to 54 Years | 195 (100.0%) | 152 (71.7%) |
| 55 to 64 Years | 115 (92.7%) | 274 (88.1%) |
| 65 to 74 Years | 121 (100.0%) | 179 (100.0%) |
| 75 Years and over | 146 (100.0%) | 273 (85.6%) |
| Total | 1,212 (92.8%) | 1,581 (86.3%) |
Income Below Poverty Among Married-Couple Families in Hoosick Falls
The poverty statistics for married-couple families in Hoosick Falls show that 1.7% or 9 of the total 522 families live below the poverty line. Families with no children have the highest poverty rate of 2.8%, comprising of 9 families. On the other hand, families with 1 or 2 children have the lowest poverty rate of 0.0%, which includes 0 families.
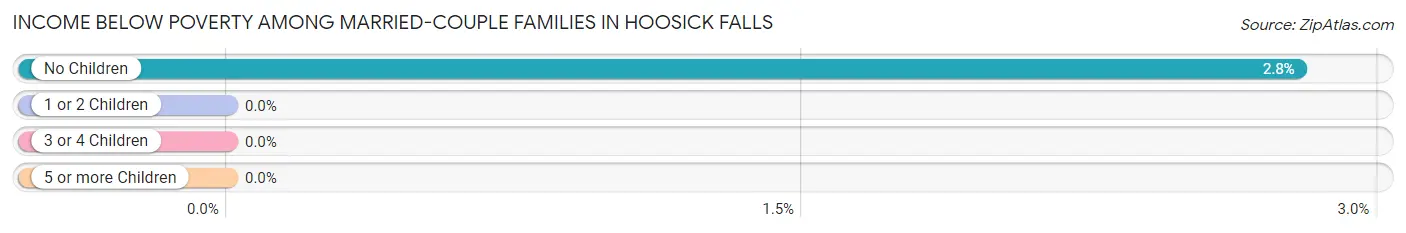
| Children | Above Poverty | Below Poverty |
| No Children | 314 (97.2%) | 9 (2.8%) |
| 1 or 2 Children | 141 (100.0%) | 0 (0.0%) |
| 3 or 4 Children | 26 (100.0%) | 0 (0.0%) |
| 5 or more Children | 32 (100.0%) | 0 (0.0%) |
| Total | 513 (98.3%) | 9 (1.7%) |
Income Below Poverty Among Single-Parent Households in Hoosick Falls
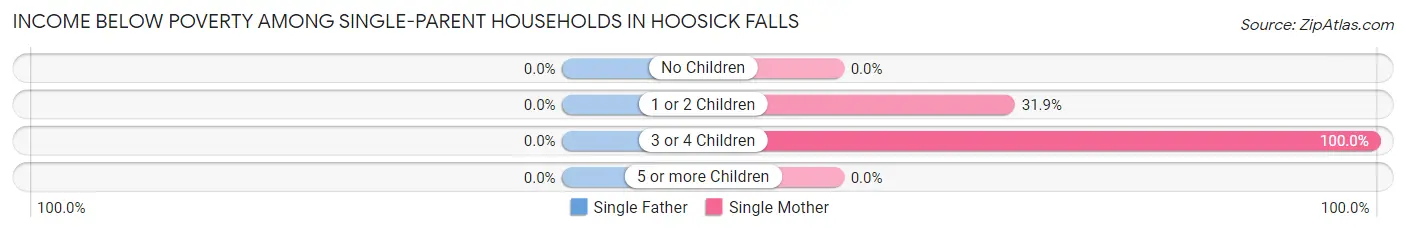
| Children | Single Father | Single Mother |
| No Children | 0 (0.0%) | 0 (0.0%) |
| 1 or 2 Children | 0 (0.0%) | 51 (31.9%) |
| 3 or 4 Children | 0 (0.0%) | 16 (100.0%) |
| 5 or more Children | 0 (0.0%) | 0 (0.0%) |
| Total | 0 (0.0%) | 67 (27.1%) |
Income Below Poverty Among Married-Couple vs Single-Parent Households in Hoosick Falls
The poverty data for Hoosick Falls shows that 9 of the married-couple family households (1.7%) and 67 of the single-parent households (25.7%) are living below the poverty level. Within the married-couple family households, those with no children have the highest poverty rate, with 9 households (2.8%) falling below the poverty line. Among the single-parent households, those with 3 or 4 children have the highest poverty rate, with 16 household (100.0%) living below poverty.
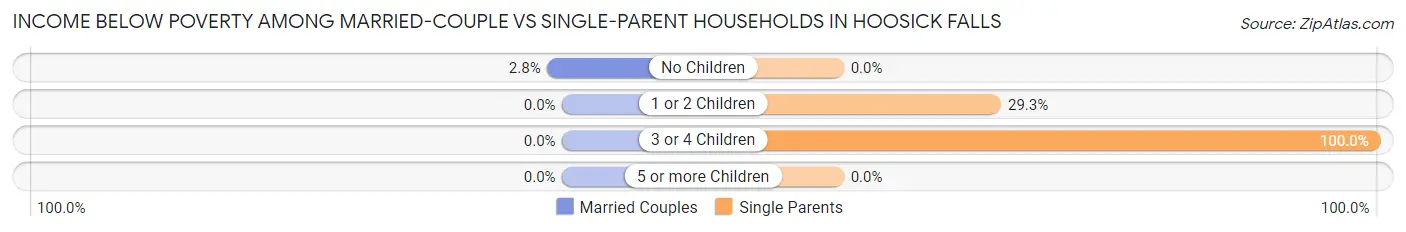
| Children | Married-Couple Families | Single-Parent Households |
| No Children | 9 (2.8%) | 0 (0.0%) |
| 1 or 2 Children | 0 (0.0%) | 51 (29.3%) |
| 3 or 4 Children | 0 (0.0%) | 16 (100.0%) |
| 5 or more Children | 0 (0.0%) | 0 (0.0%) |
| Total | 9 (1.7%) | 67 (25.7%) |
Race in Hoosick Falls
The most populous races in Hoosick Falls are White / Caucasian (3,017 | 93.5%), Hispanic or Latino (125 | 3.9%), and Some other Race (123 | 3.8%).
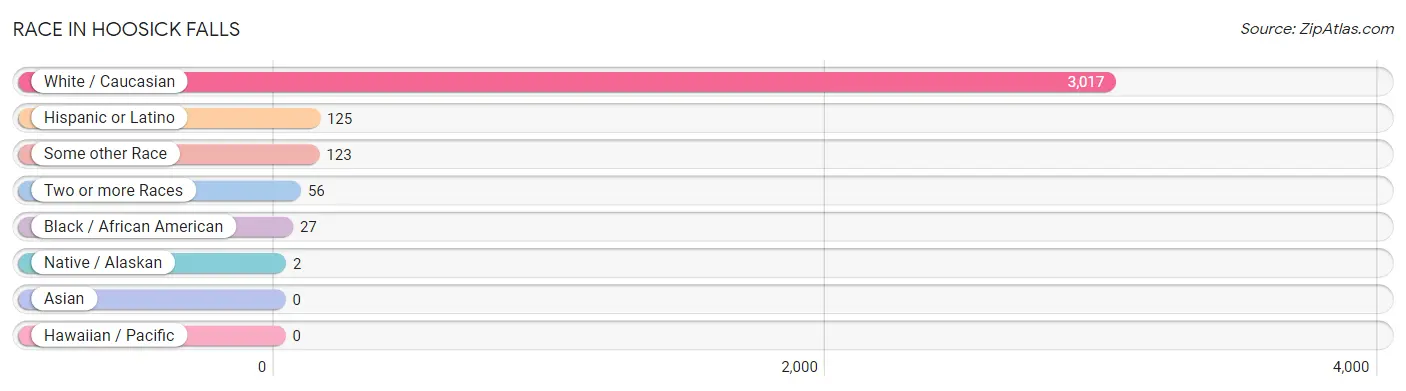
| Race | # Population | % Population |
| Asian | 0 | 0.0% |
| Black / African American | 27 | 0.8% |
| Hawaiian / Pacific | 0 | 0.0% |
| Hispanic or Latino | 125 | 3.9% |
| Native / Alaskan | 2 | 0.1% |
| White / Caucasian | 3,017 | 93.5% |
| Two or more Races | 56 | 1.7% |
| Some other Race | 123 | 3.8% |
| Total | 3,225 | 100.0% |
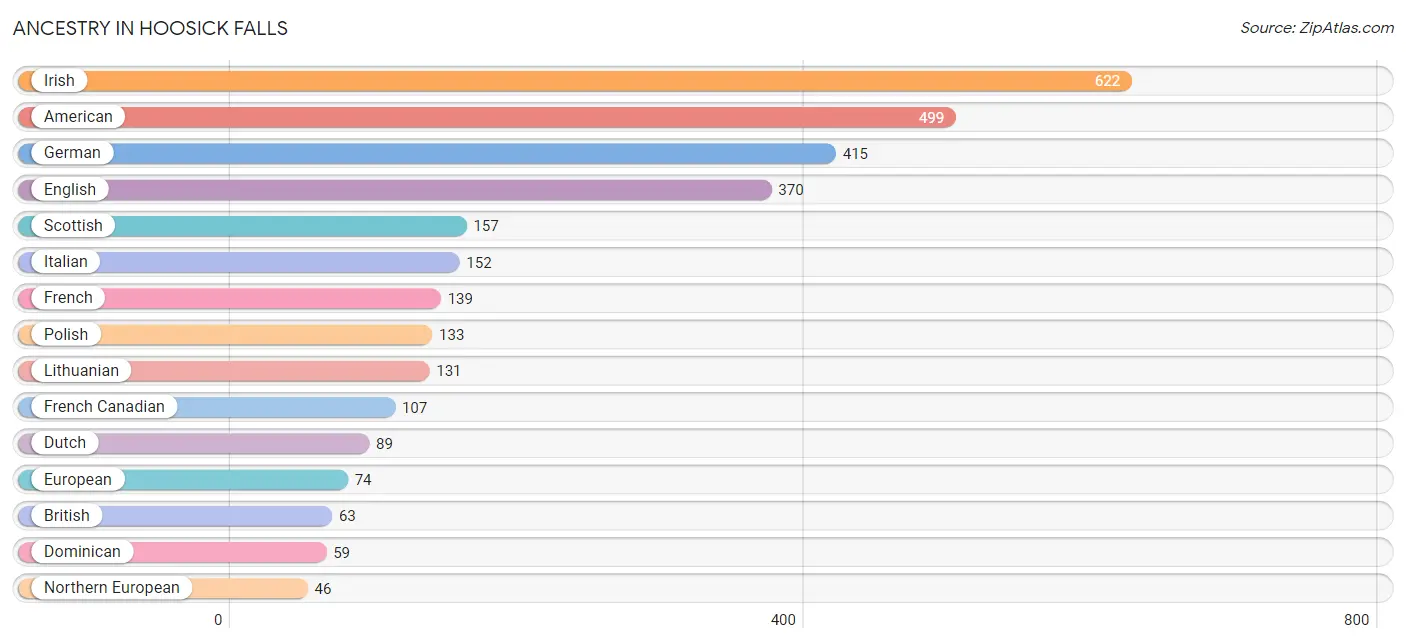
Ancestry in Hoosick Falls
The most populous ancestries reported in Hoosick Falls are Irish (622 | 19.3%), American (499 | 15.5%), German (415 | 12.9%), English (370 | 11.5%), and Scottish (157 | 4.9%), together accounting for 64.0% of all Hoosick Falls residents.
| Ancestry | # Population | % Population |
| American | 499 | 15.5% |
| Argentinean | 7 | 0.2% |
| Austrian | 25 | 0.8% |
| British | 63 | 1.9% |
| Dominican | 59 | 1.8% |
| Dutch | 89 | 2.8% |
| English | 370 | 11.5% |
| European | 74 | 2.3% |
| French | 139 | 4.3% |
| French Canadian | 107 | 3.3% |
| German | 415 | 12.9% |
| Irish | 622 | 19.3% |
| Italian | 152 | 4.7% |
| Lithuanian | 131 | 4.1% |
| Mexican | 14 | 0.4% |
| Northern European | 46 | 1.4% |
| Polish | 133 | 4.1% |
| Portuguese | 32 | 1.0% |
| Puerto Rican | 36 | 1.1% |
| Russian | 13 | 0.4% |
| Scotch-Irish | 11 | 0.3% |
| Scottish | 157 | 4.9% |
| South American | 7 | 0.2% |
| Spanish | 9 | 0.3% |
| Swedish | 4 | 0.1% |
| Welsh | 11 | 0.3% | View All 26 Rows |
Immigrants in Hoosick Falls

| Immigration Origin | # Population | % Population | View All 0 Rows |
Sex and Age in Hoosick Falls
Sex and Age in Hoosick Falls
The most populous age groups in Hoosick Falls are 5 to 9 Years (197 | 15.1%) for men and 60 to 64 Years (194 | 10.1%) for women.
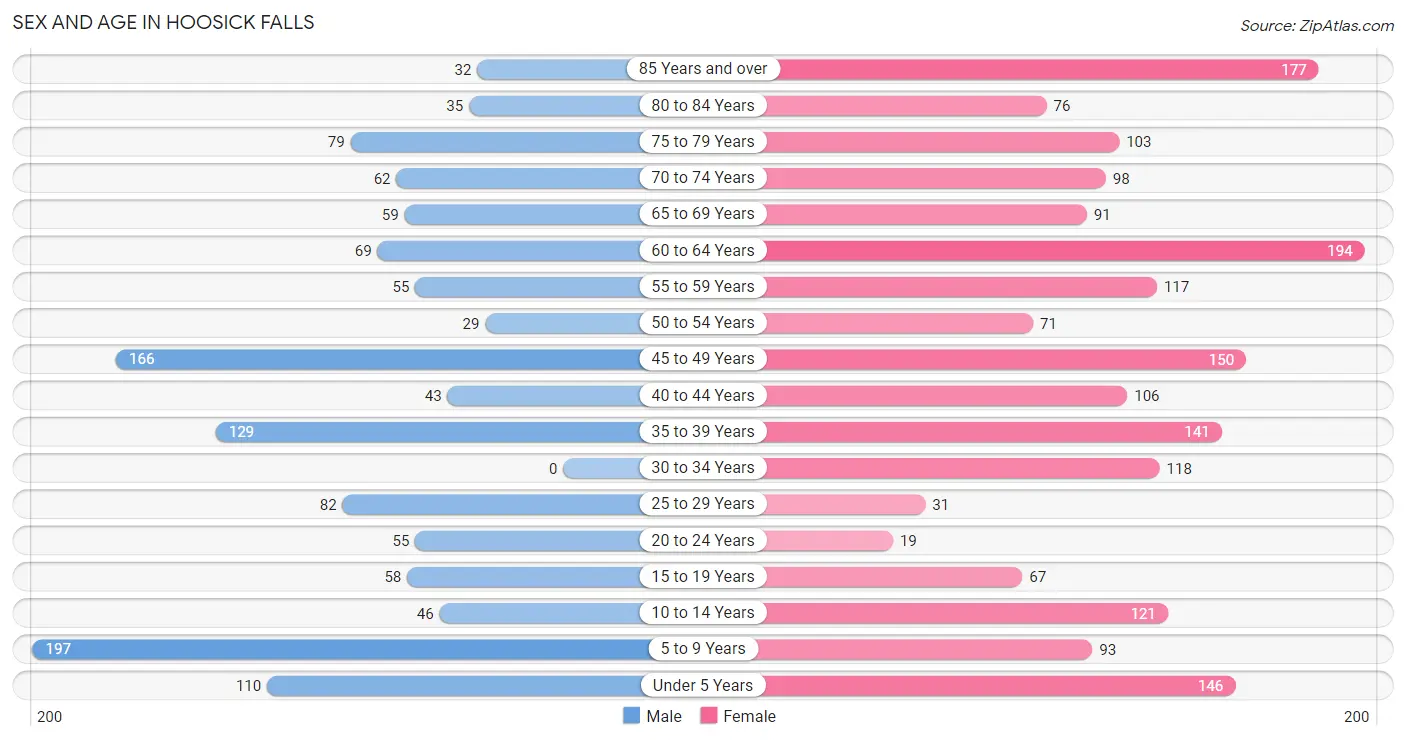
| Age Bracket | Male | Female |
| Under 5 Years | 110 (8.4%) | 146 (7.6%) |
| 5 to 9 Years | 197 (15.1%) | 93 (4.9%) |
| 10 to 14 Years | 46 (3.5%) | 121 (6.3%) |
| 15 to 19 Years | 58 (4.4%) | 67 (3.5%) |
| 20 to 24 Years | 55 (4.2%) | 19 (1.0%) |
| 25 to 29 Years | 82 (6.3%) | 31 (1.6%) |
| 30 to 34 Years | 0 (0.0%) | 118 (6.1%) |
| 35 to 39 Years | 129 (9.9%) | 141 (7.3%) |
| 40 to 44 Years | 43 (3.3%) | 106 (5.5%) |
| 45 to 49 Years | 166 (12.7%) | 150 (7.8%) |
| 50 to 54 Years | 29 (2.2%) | 71 (3.7%) |
| 55 to 59 Years | 55 (4.2%) | 117 (6.1%) |
| 60 to 64 Years | 69 (5.3%) | 194 (10.1%) |
| 65 to 69 Years | 59 (4.5%) | 91 (4.7%) |
| 70 to 74 Years | 62 (4.8%) | 98 (5.1%) |
| 75 to 79 Years | 79 (6.0%) | 103 (5.4%) |
| 80 to 84 Years | 35 (2.7%) | 76 (4.0%) |
| 85 Years and over | 32 (2.5%) | 177 (9.2%) |
| Total | 1,306 (100.0%) | 1,919 (100.0%) |
Families and Households in Hoosick Falls
Median Family Size in Hoosick Falls
The median family size in Hoosick Falls is 2.97 persons per family, with married-couple families (522 | 66.7%) accounting for the largest median family size of 3.13 persons per family. On the other hand, single female/mother families (247 | 31.6%) represent the smallest median family size with 2.64 persons per family.
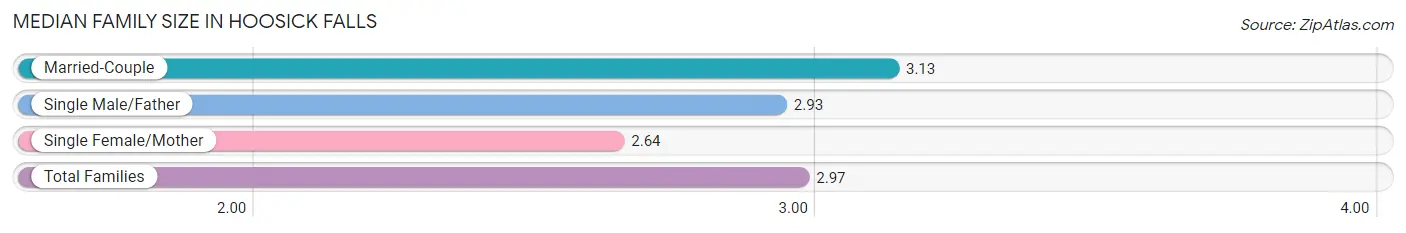
| Family Type | # Families | Family Size |
| Married-Couple | 522 (66.7%) | 3.13 |
| Single Male/Father | 14 (1.8%) | 2.93 |
| Single Female/Mother | 247 (31.6%) | 2.64 |
| Total Families | 783 (100.0%) | 2.97 |
Median Household Size in Hoosick Falls
The median household size in Hoosick Falls is 2.41 persons per household, with single male/father households (14 | 1.1%) accounting for the largest median household size of 4 persons per household. non-family households (531 | 40.4%) represent the smallest median household size with 1.34 persons per household.
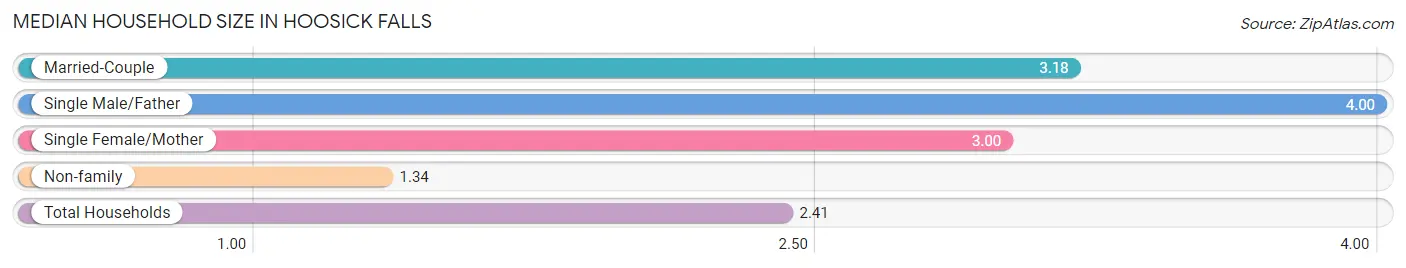
| Household Type | # Households | Household Size |
| Married-Couple | 522 (39.7%) | 3.18 |
| Single Male/Father | 14 (1.1%) | 4.00 |
| Single Female/Mother | 247 (18.8%) | 3.00 |
| Non-family | 531 (40.4%) | 1.34 |
| Total Households | 1,314 (100.0%) | 2.41 |
Household Size by Marriage Status in Hoosick Falls
Out of a total of 1,314 households in Hoosick Falls, 783 (59.6%) are family households, while 531 (40.4%) are nonfamily households. The most numerous type of family households are 2-person households, comprising 324, and the most common type of nonfamily households are 1-person households, comprising 383.
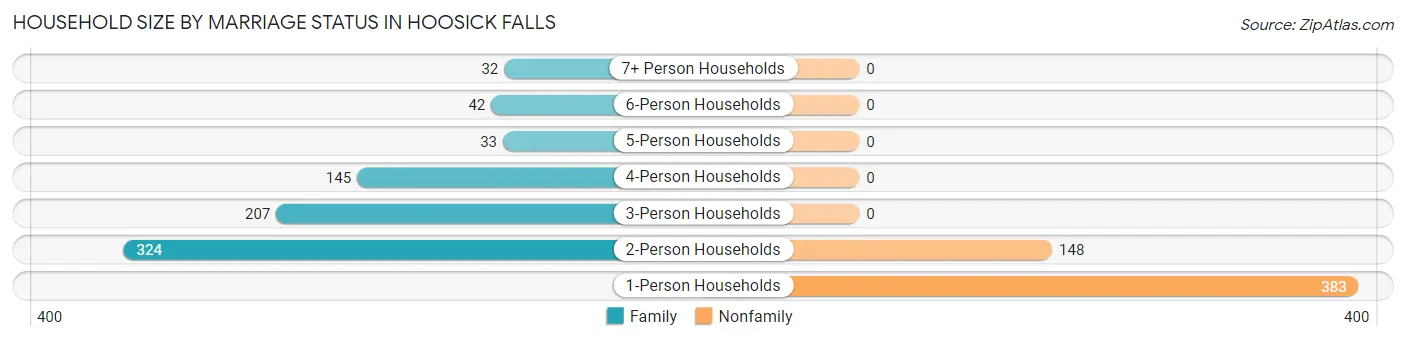
| Household Size | Family Households | Nonfamily Households |
| 1-Person Households | - | 383 (29.1%) |
| 2-Person Households | 324 (24.7%) | 148 (11.3%) |
| 3-Person Households | 207 (15.8%) | 0 (0.0%) |
| 4-Person Households | 145 (11.0%) | 0 (0.0%) |
| 5-Person Households | 33 (2.5%) | 0 (0.0%) |
| 6-Person Households | 42 (3.2%) | 0 (0.0%) |
| 7+ Person Households | 32 (2.4%) | 0 (0.0%) |
| Total | 783 (59.6%) | 531 (40.4%) |
Female Fertility in Hoosick Falls
Fertility by Age in Hoosick Falls
Average fertility rate in Hoosick Falls is 47.0 births per 1,000 women. Women in the age bracket of 35 to 50 years have the highest fertility rate with 76.0 births per 1,000 women. Women in the age bracket of 35 to 50 years acount for 100.0% of all women with births.
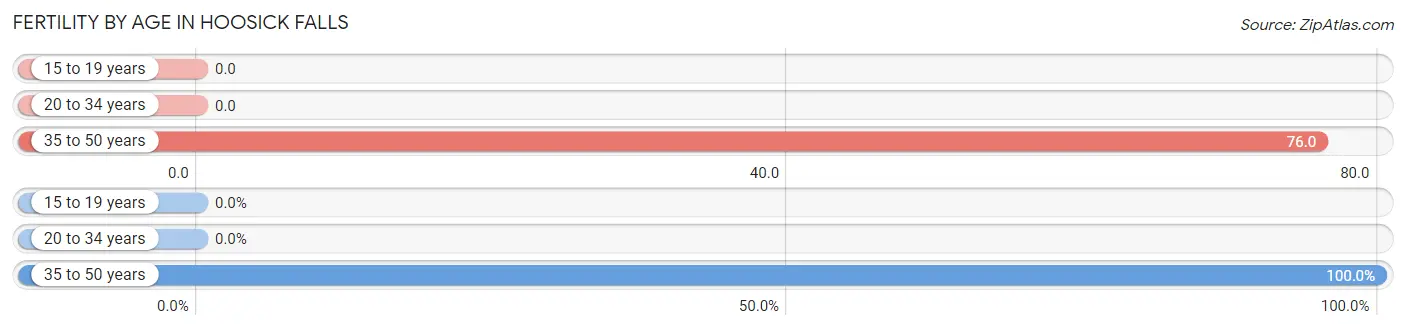
| Age Bracket | Women with Births | Births / 1,000 Women |
| 15 to 19 years | 0 (0.0%) | 0.0 |
| 20 to 34 years | 0 (0.0%) | 0.0 |
| 35 to 50 years | 30 (100.0%) | 76.0 |
| Total | 30 (100.0%) | 47.0 |
Fertility by Age by Marriage Status in Hoosick Falls
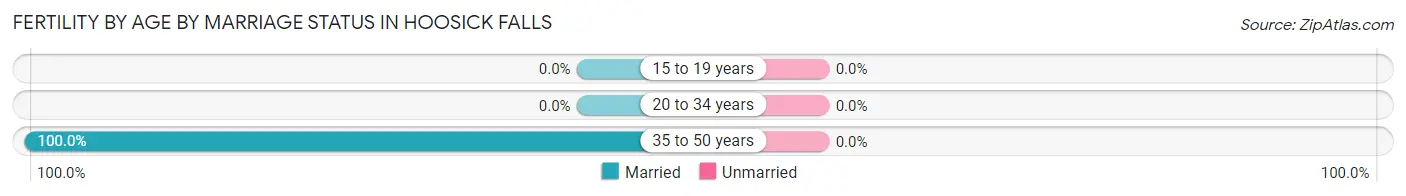
| Age Bracket | Married | Unmarried |
| 15 to 19 years | 0 (0.0%) | 0 (0.0%) |
| 20 to 34 years | 0 (0.0%) | 0 (0.0%) |
| 35 to 50 years | 30 (100.0%) | 0 (0.0%) |
| Total | 30 (100.0%) | 0 (0.0%) |
Fertility by Education in Hoosick Falls
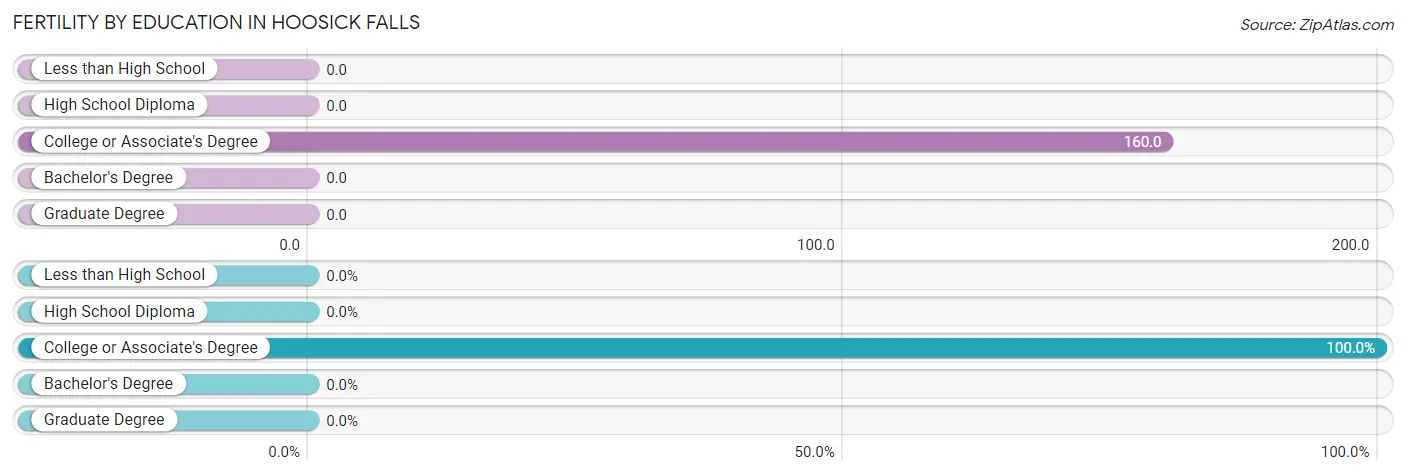
| Educational Attainment | Women with Births | Births / 1,000 Women |
| Less than High School | 0 (0.0%) | 0.0 |
| High School Diploma | 0 (0.0%) | 0.0 |
| College or Associate's Degree | 30 (100.0%) | 160.0 |
| Bachelor's Degree | 0 (0.0%) | 0.0 |
| Graduate Degree | 0 (0.0%) | 0.0 |
| Total | 30 (100.0%) | 47.0 |
Fertility by Education by Marriage Status in Hoosick Falls
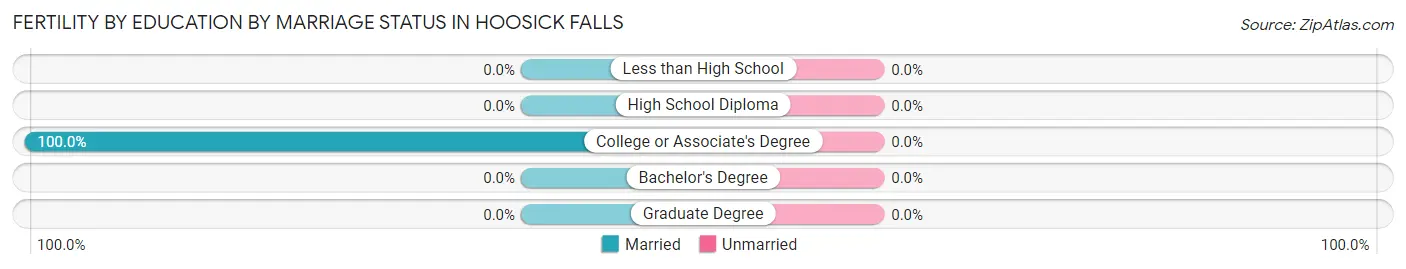
| Educational Attainment | Married | Unmarried |
| Less than High School | 0 (0.0%) | 0 (0.0%) |
| High School Diploma | 0 (0.0%) | 0 (0.0%) |
| College or Associate's Degree | 30 (100.0%) | 0 (0.0%) |
| Bachelor's Degree | 0 (0.0%) | 0 (0.0%) |
| Graduate Degree | 0 (0.0%) | 0 (0.0%) |
| Total | 30 (100.0%) | 0 (0.0%) |
Employment Characteristics in Hoosick Falls
Employment by Class of Employer in Hoosick Falls
Among the 1,255 employed individuals in Hoosick Falls, private company employees (773 | 61.6%), not-for-profit organizations (201 | 16.0%), and local government employees (133 | 10.6%) make up the most common classes of employment.
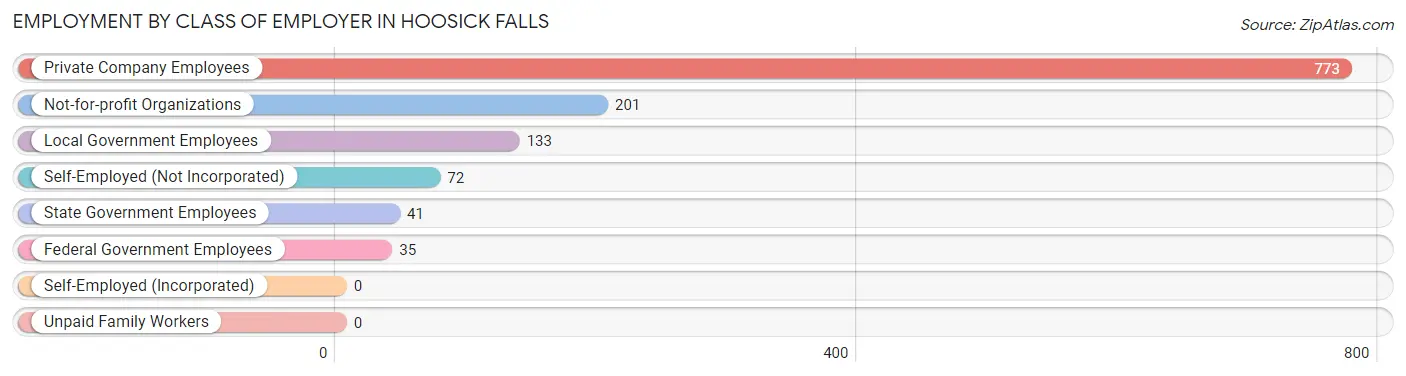
| Employer Class | # Employees | % Employees |
| Private Company Employees | 773 | 61.6% |
| Self-Employed (Incorporated) | 0 | 0.0% |
| Self-Employed (Not Incorporated) | 72 | 5.7% |
| Not-for-profit Organizations | 201 | 16.0% |
| Local Government Employees | 133 | 10.6% |
| State Government Employees | 41 | 3.3% |
| Federal Government Employees | 35 | 2.8% |
| Unpaid Family Workers | 0 | 0.0% |
| Total | 1,255 | 100.0% |
Employment Status by Age in Hoosick Falls
According to the labor force statistics for Hoosick Falls, out of the total population over 16 years of age (2,469), 53.7% or 1,326 individuals are in the labor force, with 1.2% or 16 of them unemployed. The age group with the highest labor force participation rate is 30 to 34 years, with 100.0% or 118 individuals in the labor force. Within the labor force, the 35 to 44 years age range has the highest percentage of unemployed individuals, with 5.0% or 16 of them being unemployed.

| Age Bracket | In Labor Force | Unemployed |
| 16 to 19 Years | 41 (50.0%) | 0 (0.0%) |
| 20 to 24 Years | 52 (70.3%) | 0 (0.0%) |
| 25 to 29 Years | 62 (54.9%) | 0 (0.0%) |
| 30 to 34 Years | 118 (100.0%) | 0 (0.0%) |
| 35 to 44 Years | 319 (76.1%) | 16 (5.0%) |
| 45 to 54 Years | 363 (87.3%) | 0 (0.0%) |
| 55 to 59 Years | 113 (65.7%) | 0 (0.0%) |
| 60 to 64 Years | 171 (65.0%) | 0 (0.0%) |
| 65 to 74 Years | 73 (23.5%) | 0 (0.0%) |
| 75 Years and over | 13 (2.6%) | 0 (0.0%) |
| Total | 1,326 (53.7%) | 16 (1.2%) |
Employment Status by Educational Attainment in Hoosick Falls
According to labor force statistics for Hoosick Falls, 76.3% of individuals (1,145) out of the total population between 25 and 64 years of age (1,501) are in the labor force, with 1.4% or 16 of them being unemployed. The group with the highest labor force participation rate are those with the educational attainment of college / associate degree, with 93.5% or 401 individuals in the labor force. Within the labor force, individuals with less than high school education have the highest percentage of unemployment, with 22.2% or 16 of them being unemployed.
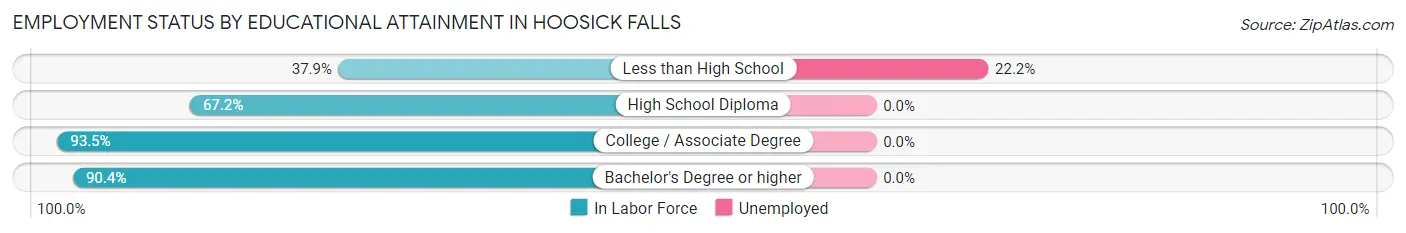
| Educational Attainment | In Labor Force | Unemployed |
| Less than High School | 72 (37.9%) | 42 (22.2%) |
| High School Diploma | 361 (67.2%) | 0 (0.0%) |
| College / Associate Degree | 401 (93.5%) | 0 (0.0%) |
| Bachelor's Degree or higher | 312 (90.4%) | 0 (0.0%) |
| Total | 1,145 (76.3%) | 21 (1.4%) |
Employment Occupations by Sex in Hoosick Falls
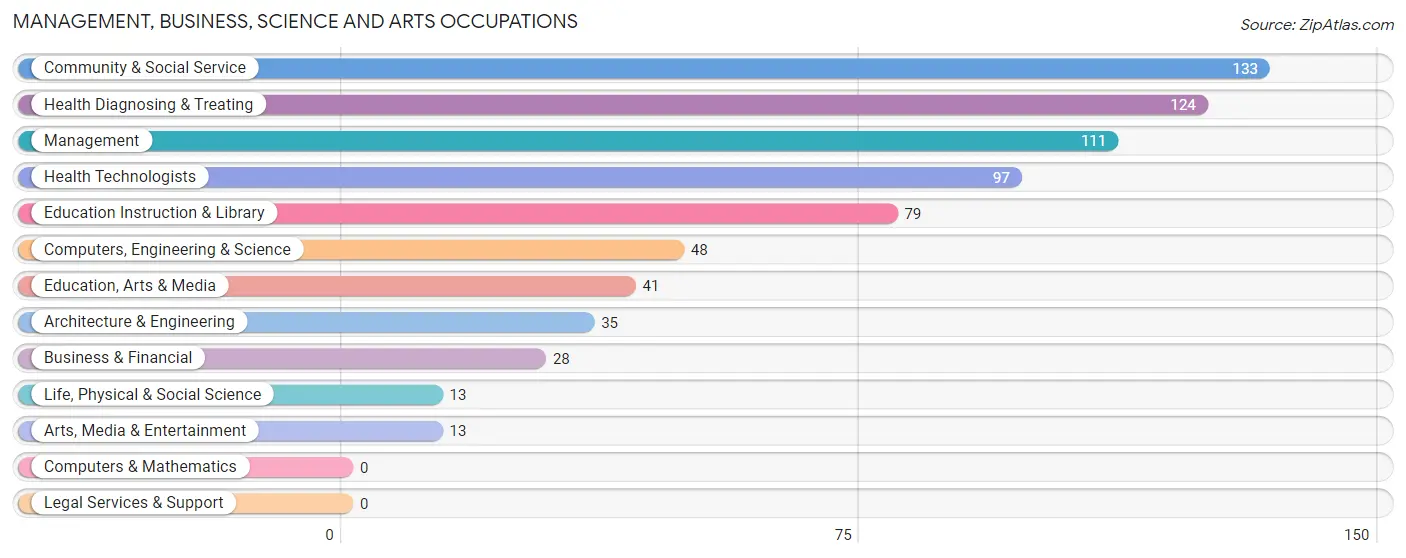
Management, Business, Science and Arts Occupations
The most common Management, Business, Science and Arts occupations in Hoosick Falls are Community & Social Service (133 | 10.2%), Health Diagnosing & Treating (124 | 9.5%), Management (111 | 8.5%), Health Technologists (97 | 7.4%), and Education Instruction & Library (79 | 6.0%).
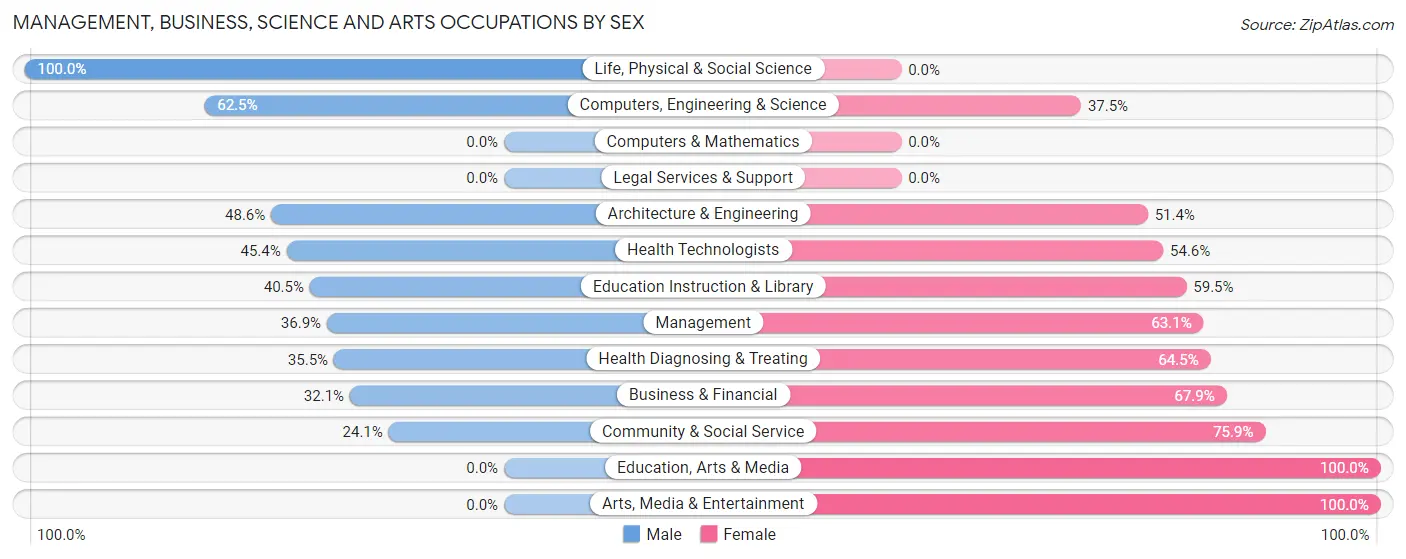
Management, Business, Science and Arts Occupations by Sex
Within the Management, Business, Science and Arts occupations in Hoosick Falls, the most male-oriented occupations are Life, Physical & Social Science (100.0%), Computers, Engineering & Science (62.5%), and Architecture & Engineering (48.6%), while the most female-oriented occupations are Education, Arts & Media (100.0%), Arts, Media & Entertainment (100.0%), and Community & Social Service (75.9%).
| Occupation | Male | Female |
| Management | 41 (36.9%) | 70 (63.1%) |
| Business & Financial | 9 (32.1%) | 19 (67.9%) |
| Computers, Engineering & Science | 30 (62.5%) | 18 (37.5%) |
| Computers & Mathematics | 0 (0.0%) | 0 (0.0%) |
| Architecture & Engineering | 17 (48.6%) | 18 (51.4%) |
| Life, Physical & Social Science | 13 (100.0%) | 0 (0.0%) |
| Community & Social Service | 32 (24.1%) | 101 (75.9%) |
| Education, Arts & Media | 0 (0.0%) | 41 (100.0%) |
| Legal Services & Support | 0 (0.0%) | 0 (0.0%) |
| Education Instruction & Library | 32 (40.5%) | 47 (59.5%) |
| Arts, Media & Entertainment | 0 (0.0%) | 13 (100.0%) |
| Health Diagnosing & Treating | 44 (35.5%) | 80 (64.5%) |
| Health Technologists | 44 (45.4%) | 53 (54.6%) |
| Total (Category) | 156 (35.1%) | 288 (64.9%) |
| Total (Overall) | 520 (39.7%) | 789 (60.3%) |
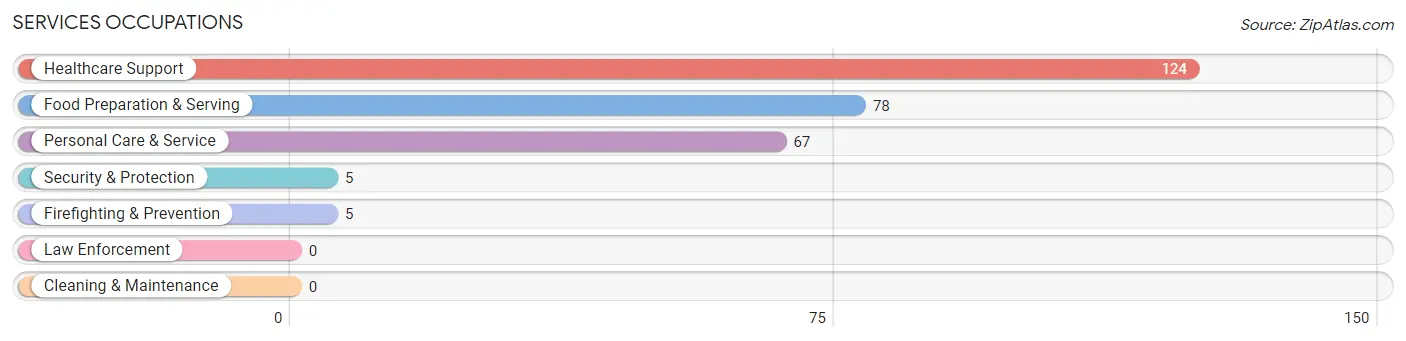
Services Occupations
The most common Services occupations in Hoosick Falls are Healthcare Support (124 | 9.5%), Food Preparation & Serving (78 | 6.0%), Personal Care & Service (67 | 5.1%), Security & Protection (5 | 0.4%), and Firefighting & Prevention (5 | 0.4%).
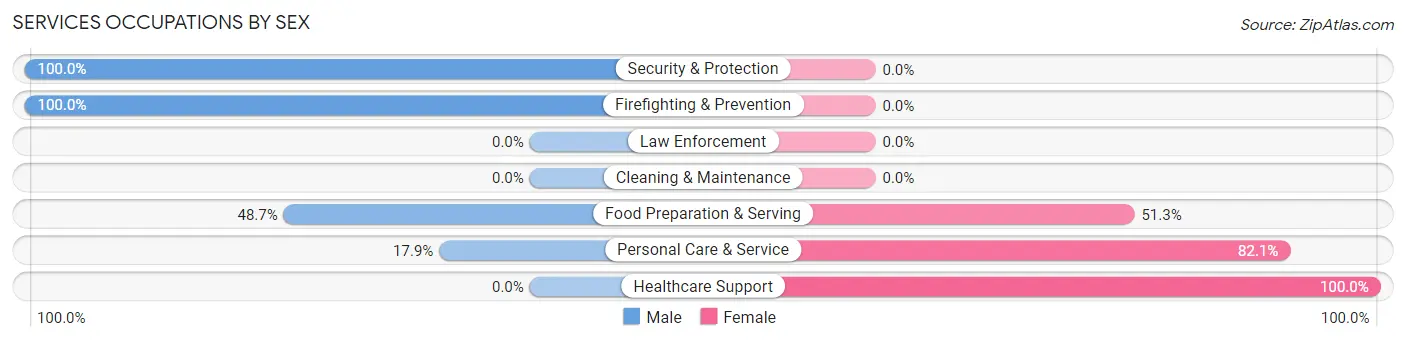
Services Occupations by Sex
Within the Services occupations in Hoosick Falls, the most male-oriented occupations are Security & Protection (100.0%), Firefighting & Prevention (100.0%), and Food Preparation & Serving (48.7%), while the most female-oriented occupations are Healthcare Support (100.0%), Personal Care & Service (82.1%), and Food Preparation & Serving (51.3%).
| Occupation | Male | Female |
| Healthcare Support | 0 (0.0%) | 124 (100.0%) |
| Security & Protection | 5 (100.0%) | 0 (0.0%) |
| Firefighting & Prevention | 5 (100.0%) | 0 (0.0%) |
| Law Enforcement | 0 (0.0%) | 0 (0.0%) |
| Food Preparation & Serving | 38 (48.7%) | 40 (51.3%) |
| Cleaning & Maintenance | 0 (0.0%) | 0 (0.0%) |
| Personal Care & Service | 12 (17.9%) | 55 (82.1%) |
| Total (Category) | 55 (20.1%) | 219 (79.9%) |
| Total (Overall) | 520 (39.7%) | 789 (60.3%) |
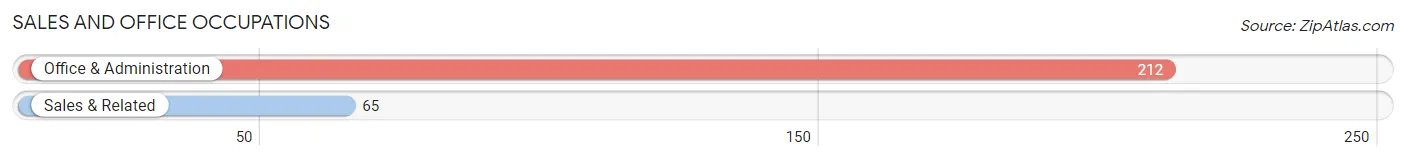
Sales and Office Occupations
The most common Sales and Office occupations in Hoosick Falls are Office & Administration (212 | 16.2%), and Sales & Related (65 | 5.0%).
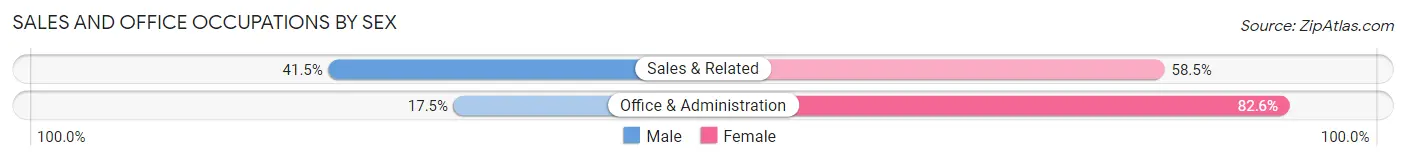
Sales and Office Occupations by Sex
| Occupation | Male | Female |
| Sales & Related | 27 (41.5%) | 38 (58.5%) |
| Office & Administration | 37 (17.4%) | 175 (82.6%) |
| Total (Category) | 64 (23.1%) | 213 (76.9%) |
| Total (Overall) | 520 (39.7%) | 789 (60.3%) |
Natural Resources, Construction and Maintenance Occupations
The most common Natural Resources, Construction and Maintenance occupations in Hoosick Falls are Construction & Extraction (54 | 4.1%), and Installation, Maintenance & Repair (11 | 0.8%).
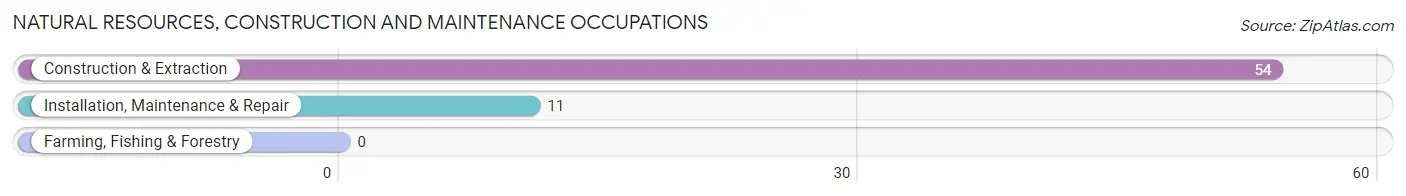
Natural Resources, Construction and Maintenance Occupations by Sex
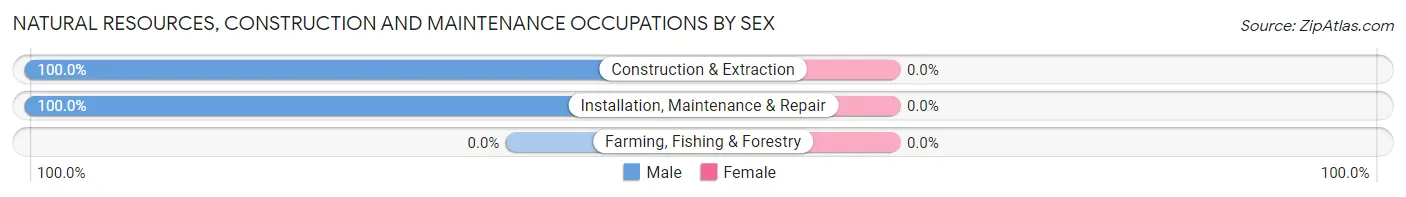
| Occupation | Male | Female |
| Farming, Fishing & Forestry | 0 (0.0%) | 0 (0.0%) |
| Construction & Extraction | 54 (100.0%) | 0 (0.0%) |
| Installation, Maintenance & Repair | 11 (100.0%) | 0 (0.0%) |
| Total (Category) | 65 (100.0%) | 0 (0.0%) |
| Total (Overall) | 520 (39.7%) | 789 (60.3%) |
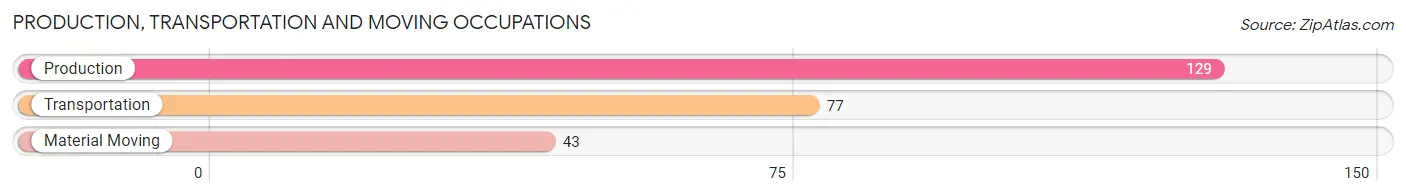
Production, Transportation and Moving Occupations
The most common Production, Transportation and Moving occupations in Hoosick Falls are Production (129 | 9.9%), Transportation (77 | 5.9%), and Material Moving (43 | 3.3%).
Production, Transportation and Moving Occupations by Sex
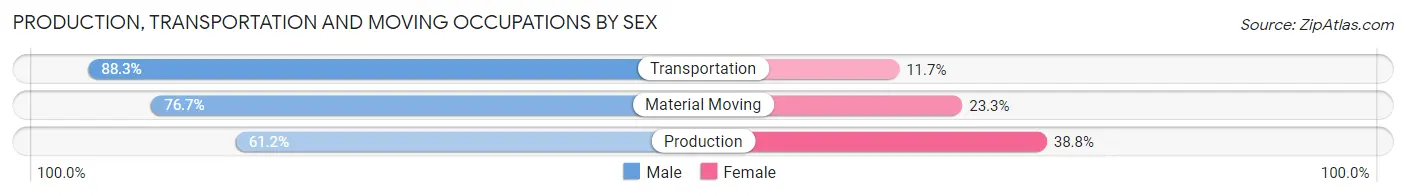
| Occupation | Male | Female |
| Production | 79 (61.2%) | 50 (38.8%) |
| Transportation | 68 (88.3%) | 9 (11.7%) |
| Material Moving | 33 (76.7%) | 10 (23.3%) |
| Total (Category) | 180 (72.3%) | 69 (27.7%) |
| Total (Overall) | 520 (39.7%) | 789 (60.3%) |
Employment Industries by Sex in Hoosick Falls
Employment Industries in Hoosick Falls
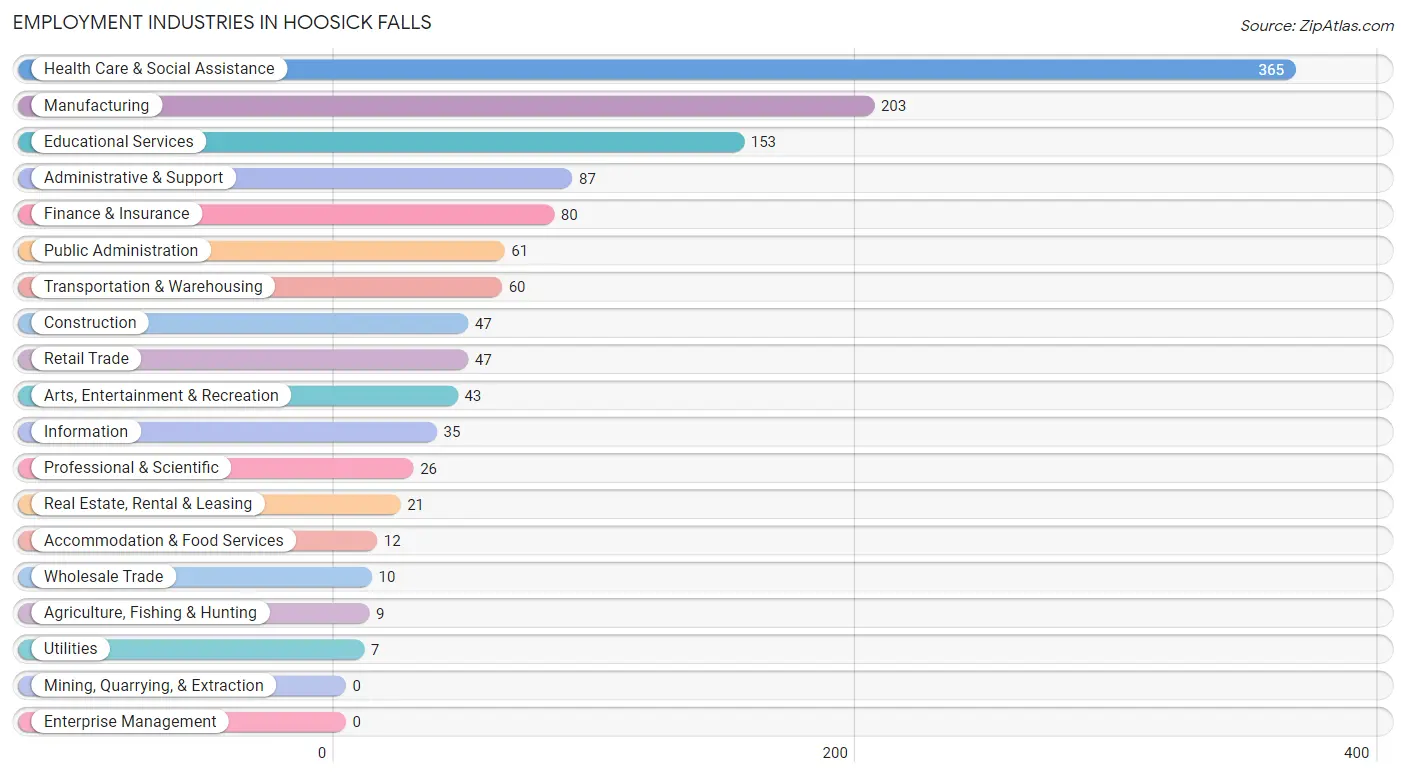
The major employment industries in Hoosick Falls include Health Care & Social Assistance (365 | 27.9%), Manufacturing (203 | 15.5%), Educational Services (153 | 11.7%), Administrative & Support (87 | 6.7%), and Finance & Insurance (80 | 6.1%).
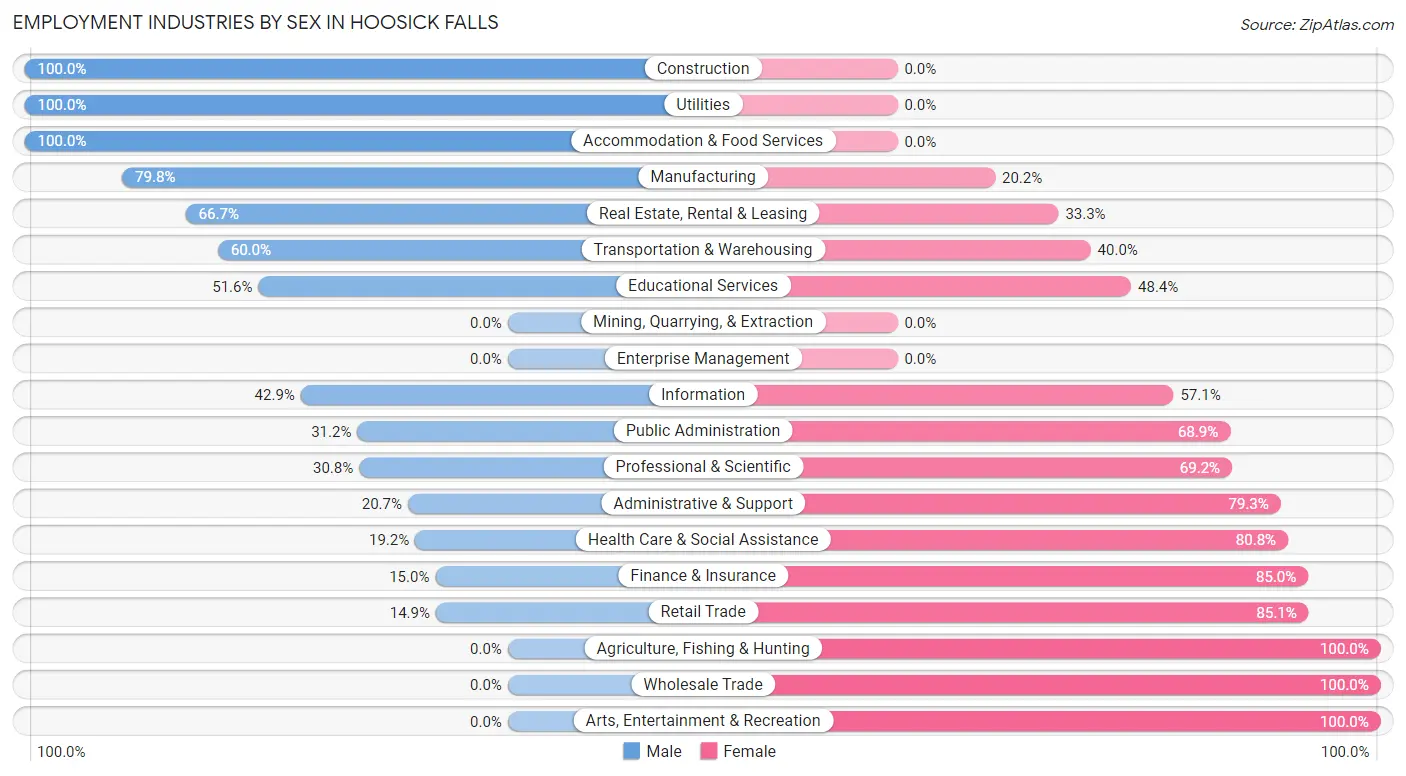
Employment Industries by Sex in Hoosick Falls
The Hoosick Falls industries that see more men than women are Construction (100.0%), Utilities (100.0%), and Accommodation & Food Services (100.0%), whereas the industries that tend to have a higher number of women are Agriculture, Fishing & Hunting (100.0%), Wholesale Trade (100.0%), and Arts, Entertainment & Recreation (100.0%).
| Industry | Male | Female |
| Agriculture, Fishing & Hunting | 0 (0.0%) | 9 (100.0%) |
| Mining, Quarrying, & Extraction | 0 (0.0%) | 0 (0.0%) |
| Construction | 47 (100.0%) | 0 (0.0%) |
| Manufacturing | 162 (79.8%) | 41 (20.2%) |
| Wholesale Trade | 0 (0.0%) | 10 (100.0%) |
| Retail Trade | 7 (14.9%) | 40 (85.1%) |
| Transportation & Warehousing | 36 (60.0%) | 24 (40.0%) |
| Utilities | 7 (100.0%) | 0 (0.0%) |
| Information | 15 (42.9%) | 20 (57.1%) |
| Finance & Insurance | 12 (15.0%) | 68 (85.0%) |
| Real Estate, Rental & Leasing | 14 (66.7%) | 7 (33.3%) |
| Professional & Scientific | 8 (30.8%) | 18 (69.2%) |
| Enterprise Management | 0 (0.0%) | 0 (0.0%) |
| Administrative & Support | 18 (20.7%) | 69 (79.3%) |
| Educational Services | 79 (51.6%) | 74 (48.4%) |
| Health Care & Social Assistance | 70 (19.2%) | 295 (80.8%) |
| Arts, Entertainment & Recreation | 0 (0.0%) | 43 (100.0%) |
| Accommodation & Food Services | 12 (100.0%) | 0 (0.0%) |
| Public Administration | 19 (31.1%) | 42 (68.9%) |
| Total | 520 (39.7%) | 789 (60.3%) |
Education in Hoosick Falls
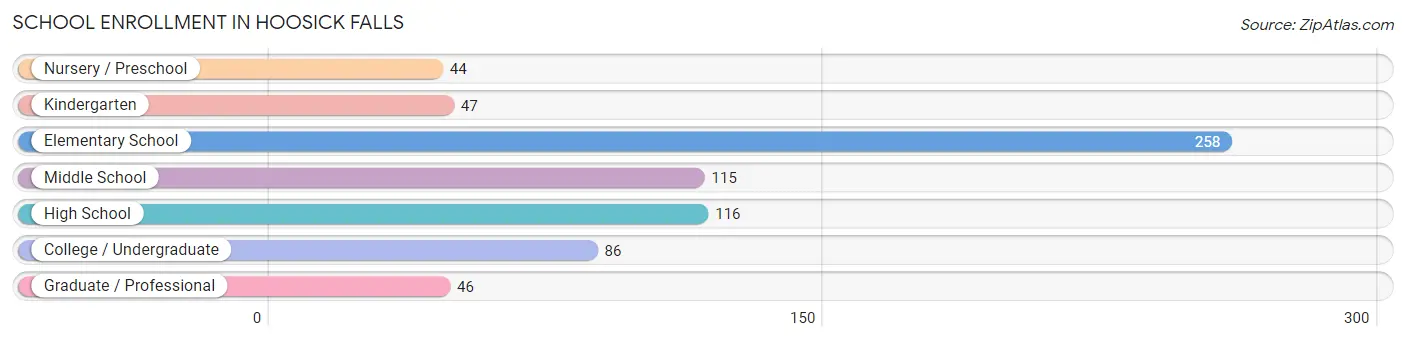
School Enrollment in Hoosick Falls
The most common levels of schooling among the 712 students in Hoosick Falls are elementary school (258 | 36.2%), high school (116 | 16.3%), and middle school (115 | 16.2%).
| School Level | # Students | % Students |
| Nursery / Preschool | 44 | 6.2% |
| Kindergarten | 47 | 6.6% |
| Elementary School | 258 | 36.2% |
| Middle School | 115 | 16.2% |
| High School | 116 | 16.3% |
| College / Undergraduate | 86 | 12.1% |
| Graduate / Professional | 46 | 6.5% |
| Total | 712 | 100.0% |
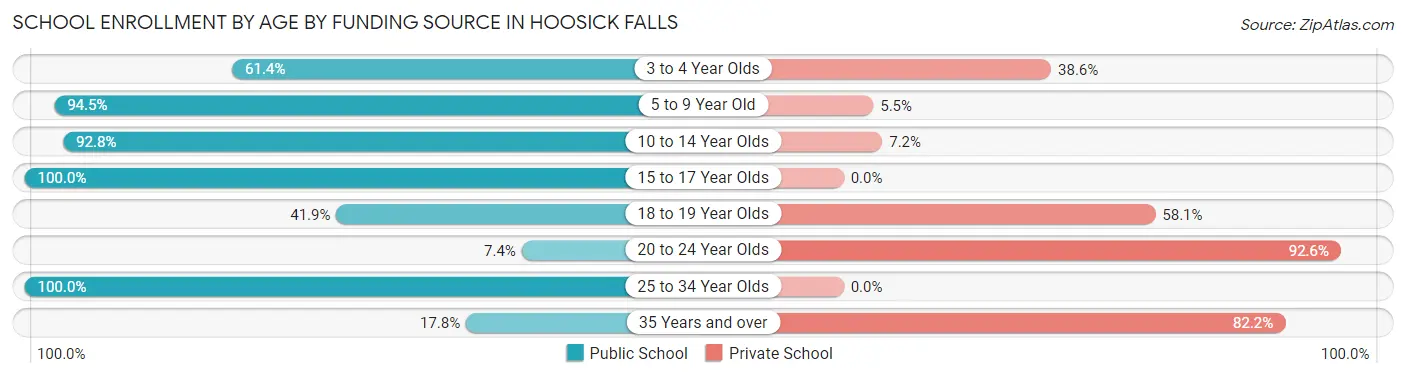
School Enrollment by Age by Funding Source in Hoosick Falls
Out of a total of 712 students who are enrolled in schools in Hoosick Falls, 125 (17.6%) attend a private institution, while the remaining 587 (82.4%) are enrolled in public schools. The age group of 20 to 24 year olds has the highest likelihood of being enrolled in private schools, with 25 (92.6% in the age bracket) enrolled. Conversely, the age group of 15 to 17 year olds has the lowest likelihood of being enrolled in a private school, with 82 (100.0% in the age bracket) attending a public institution.
| Age Bracket | Public School | Private School |
| 3 to 4 Year Olds | 27 (61.4%) | 17 (38.6%) |
| 5 to 9 Year Old | 274 (94.5%) | 16 (5.5%) |
| 10 to 14 Year Olds | 155 (92.8%) | 12 (7.2%) |
| 15 to 17 Year Olds | 82 (100.0%) | 0 (0.0%) |
| 18 to 19 Year Olds | 13 (41.9%) | 18 (58.1%) |
| 20 to 24 Year Olds | 2 (7.4%) | 25 (92.6%) |
| 25 to 34 Year Olds | 26 (100.0%) | 0 (0.0%) |
| 35 Years and over | 8 (17.8%) | 37 (82.2%) |
| Total | 587 (82.4%) | 125 (17.6%) |
Educational Attainment by Field of Study in Hoosick Falls
Education (155 | 25.1%), social sciences (133 | 21.5%), liberal arts & history (86 | 13.9%), science & technology (61 | 9.9%), and physical & health sciences (45 | 7.3%) are the most common fields of study among 618 individuals in Hoosick Falls who have obtained a bachelor's degree or higher.
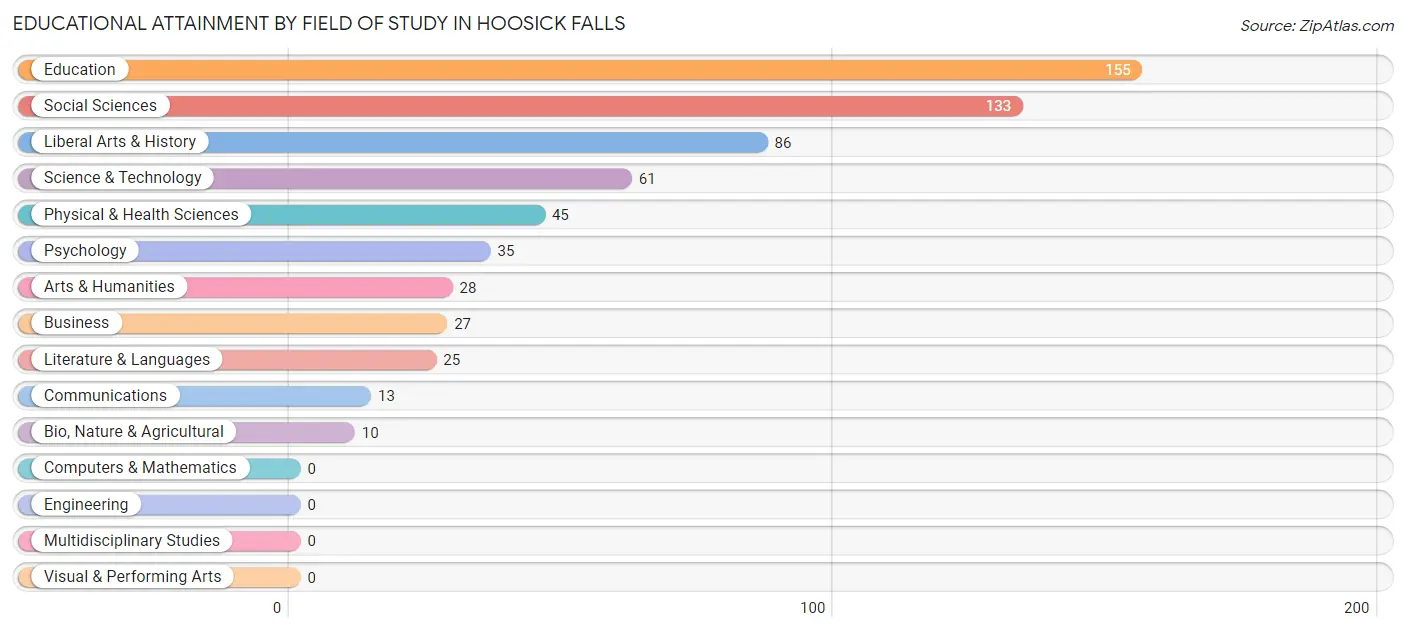
| Field of Study | # Graduates | % Graduates |
| Computers & Mathematics | 0 | 0.0% |
| Bio, Nature & Agricultural | 10 | 1.6% |
| Physical & Health Sciences | 45 | 7.3% |
| Psychology | 35 | 5.7% |
| Social Sciences | 133 | 21.5% |
| Engineering | 0 | 0.0% |
| Multidisciplinary Studies | 0 | 0.0% |
| Science & Technology | 61 | 9.9% |
| Business | 27 | 4.4% |
| Education | 155 | 25.1% |
| Literature & Languages | 25 | 4.1% |
| Liberal Arts & History | 86 | 13.9% |
| Visual & Performing Arts | 0 | 0.0% |
| Communications | 13 | 2.1% |
| Arts & Humanities | 28 | 4.5% |
| Total | 618 | 100.0% |
Transportation & Commute in Hoosick Falls
Vehicle Availability by Sex in Hoosick Falls
The most prevalent vehicle ownership categories in Hoosick Falls are males with 2 vehicles (246, accounting for 47.3%) and females with 2 vehicles (356, making up 33.5%).
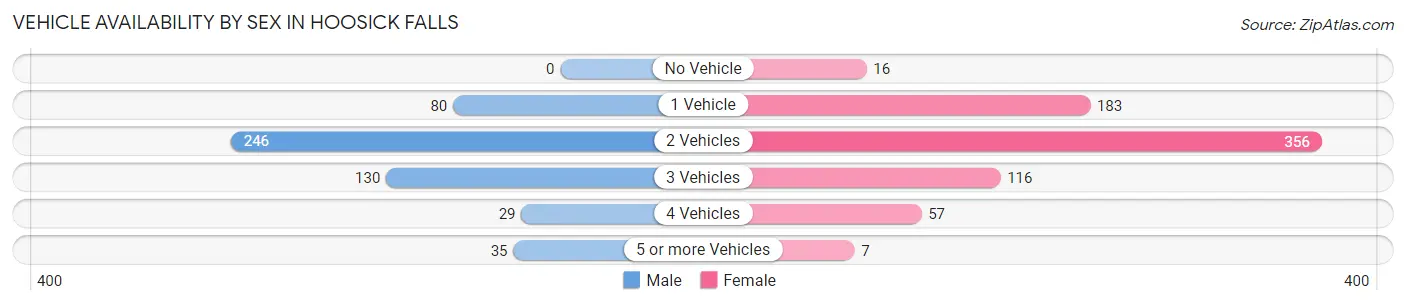
| Vehicles Available | Male | Female |
| No Vehicle | 0 (0.0%) | 16 (2.2%) |
| 1 Vehicle | 80 (15.4%) | 183 (24.9%) |
| 2 Vehicles | 246 (47.3%) | 356 (48.4%) |
| 3 Vehicles | 130 (25.0%) | 116 (15.8%) |
| 4 Vehicles | 29 (5.6%) | 57 (7.8%) |
| 5 or more Vehicles | 35 (6.7%) | 7 (0.9%) |
| Total | 520 (100.0%) | 735 (100.0%) |
Commute Time in Hoosick Falls
The most frequently occuring commute durations in Hoosick Falls are 20 to 24 minutes (184 commuters, 16.0%), 5 to 9 minutes (166 commuters, 14.4%), and 45 to 59 minutes (145 commuters, 12.6%).
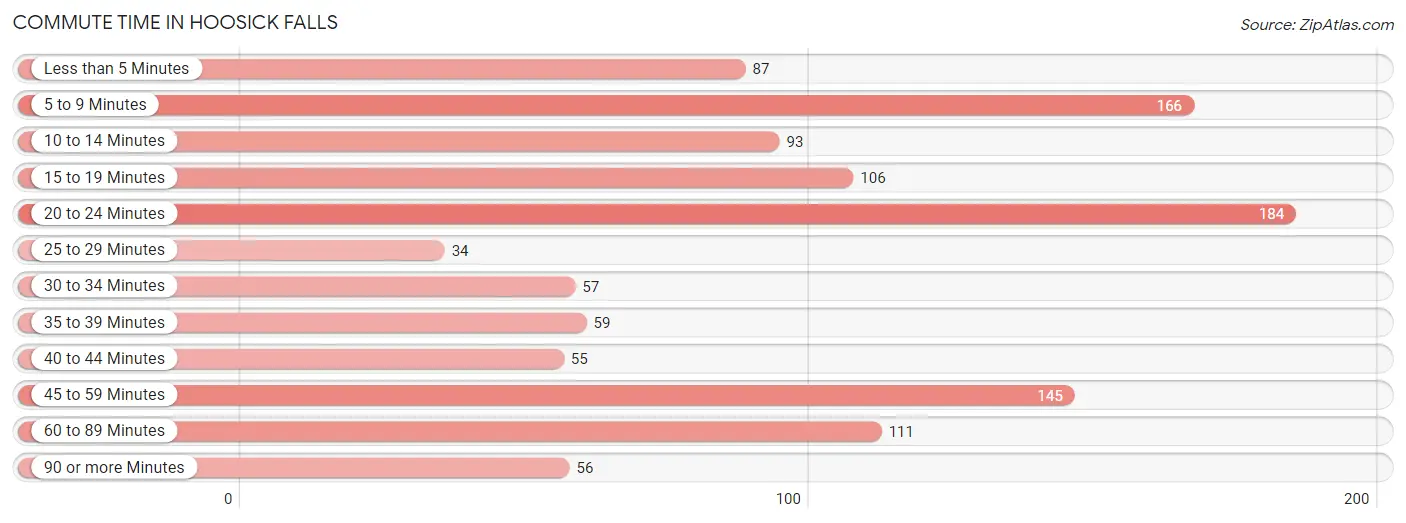
| Commute Time | # Commuters | % Commuters |
| Less than 5 Minutes | 87 | 7.5% |
| 5 to 9 Minutes | 166 | 14.4% |
| 10 to 14 Minutes | 93 | 8.1% |
| 15 to 19 Minutes | 106 | 9.2% |
| 20 to 24 Minutes | 184 | 16.0% |
| 25 to 29 Minutes | 34 | 2.9% |
| 30 to 34 Minutes | 57 | 4.9% |
| 35 to 39 Minutes | 59 | 5.1% |
| 40 to 44 Minutes | 55 | 4.8% |
| 45 to 59 Minutes | 145 | 12.6% |
| 60 to 89 Minutes | 111 | 9.6% |
| 90 or more Minutes | 56 | 4.9% |
Commute Time by Sex in Hoosick Falls
The most common commute times in Hoosick Falls are 45 to 59 minutes (100 commuters, 19.7%) for males and 20 to 24 minutes (113 commuters, 17.5%) for females.
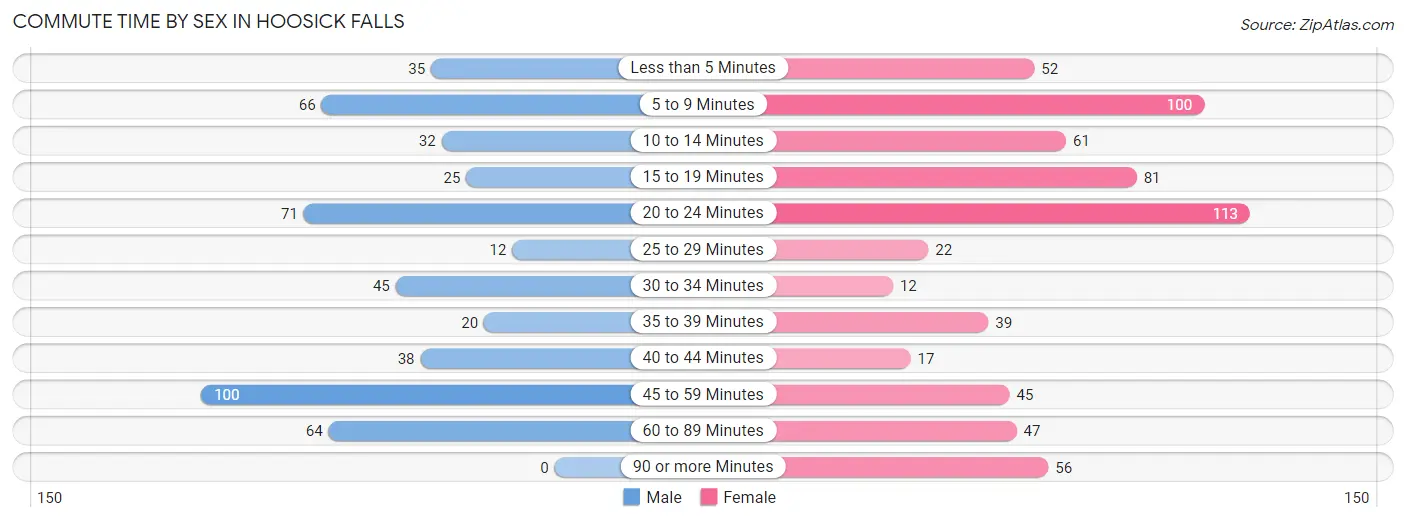
| Commute Time | Male | Female |
| Less than 5 Minutes | 35 (6.9%) | 52 (8.1%) |
| 5 to 9 Minutes | 66 (13.0%) | 100 (15.5%) |
| 10 to 14 Minutes | 32 (6.3%) | 61 (9.5%) |
| 15 to 19 Minutes | 25 (4.9%) | 81 (12.6%) |
| 20 to 24 Minutes | 71 (14.0%) | 113 (17.5%) |
| 25 to 29 Minutes | 12 (2.4%) | 22 (3.4%) |
| 30 to 34 Minutes | 45 (8.9%) | 12 (1.9%) |
| 35 to 39 Minutes | 20 (3.9%) | 39 (6.0%) |
| 40 to 44 Minutes | 38 (7.5%) | 17 (2.6%) |
| 45 to 59 Minutes | 100 (19.7%) | 45 (7.0%) |
| 60 to 89 Minutes | 64 (12.6%) | 47 (7.3%) |
| 90 or more Minutes | 0 (0.0%) | 56 (8.7%) |
Time of Departure to Work by Sex in Hoosick Falls
The most frequent times of departure to work in Hoosick Falls are 7:00 AM to 7:29 AM (125, 24.6%) for males and 7:00 AM to 7:29 AM (169, 26.2%) for females.
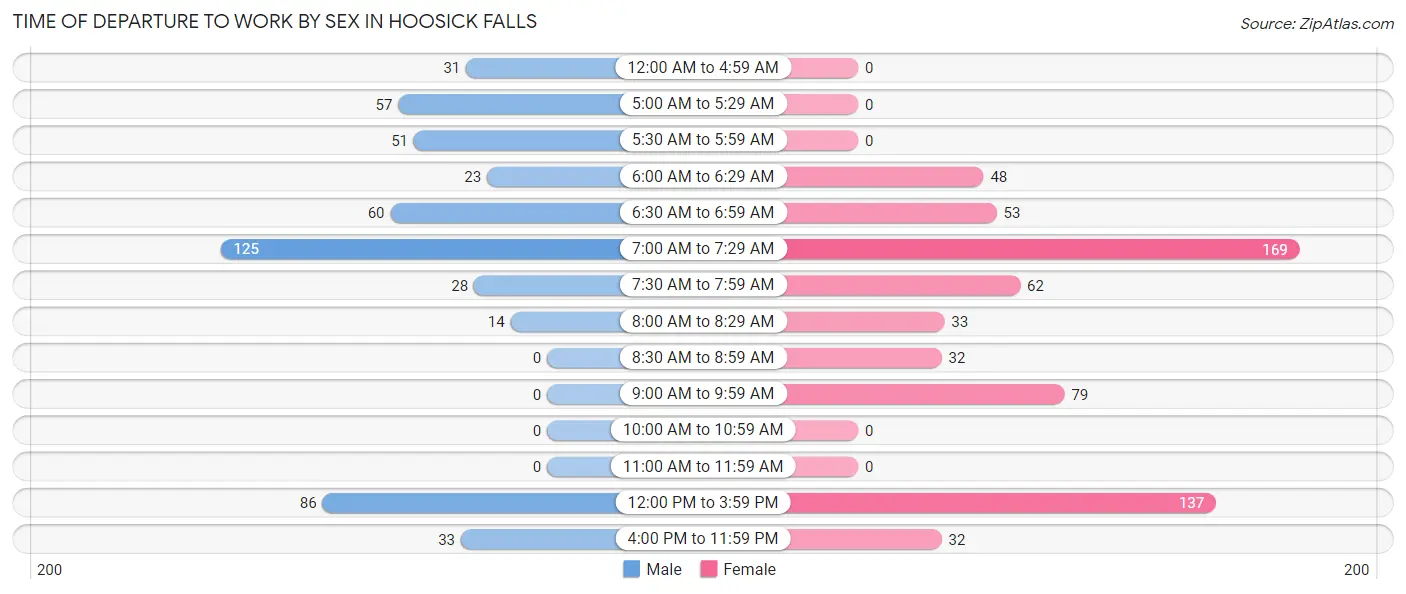
| Time of Departure | Male | Female |
| 12:00 AM to 4:59 AM | 31 (6.1%) | 0 (0.0%) |
| 5:00 AM to 5:29 AM | 57 (11.2%) | 0 (0.0%) |
| 5:30 AM to 5:59 AM | 51 (10.0%) | 0 (0.0%) |
| 6:00 AM to 6:29 AM | 23 (4.5%) | 48 (7.4%) |
| 6:30 AM to 6:59 AM | 60 (11.8%) | 53 (8.2%) |
| 7:00 AM to 7:29 AM | 125 (24.6%) | 169 (26.2%) |
| 7:30 AM to 7:59 AM | 28 (5.5%) | 62 (9.6%) |
| 8:00 AM to 8:29 AM | 14 (2.8%) | 33 (5.1%) |
| 8:30 AM to 8:59 AM | 0 (0.0%) | 32 (5.0%) |
| 9:00 AM to 9:59 AM | 0 (0.0%) | 79 (12.2%) |
| 10:00 AM to 10:59 AM | 0 (0.0%) | 0 (0.0%) |
| 11:00 AM to 11:59 AM | 0 (0.0%) | 0 (0.0%) |
| 12:00 PM to 3:59 PM | 86 (16.9%) | 137 (21.2%) |
| 4:00 PM to 11:59 PM | 33 (6.5%) | 32 (5.0%) |
| Total | 508 (100.0%) | 645 (100.0%) |
Housing Occupancy in Hoosick Falls
Occupancy by Ownership in Hoosick Falls
Of the total 1,314 dwellings in Hoosick Falls, owner-occupied units account for 827 (62.9%), while renter-occupied units make up 487 (37.1%).
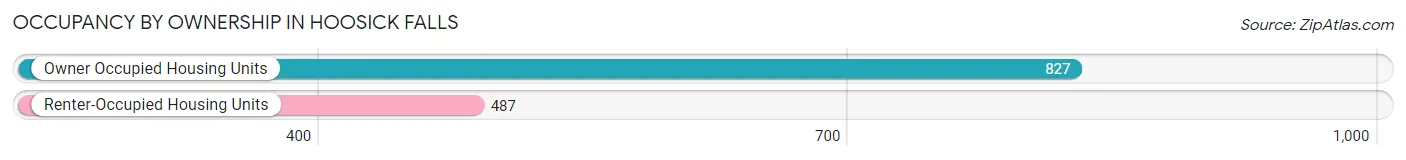
| Occupancy | # Housing Units | % Housing Units |
| Owner Occupied Housing Units | 827 | 62.9% |
| Renter-Occupied Housing Units | 487 | 37.1% |
| Total Occupied Housing Units | 1,314 | 100.0% |
Occupancy by Household Size in Hoosick Falls
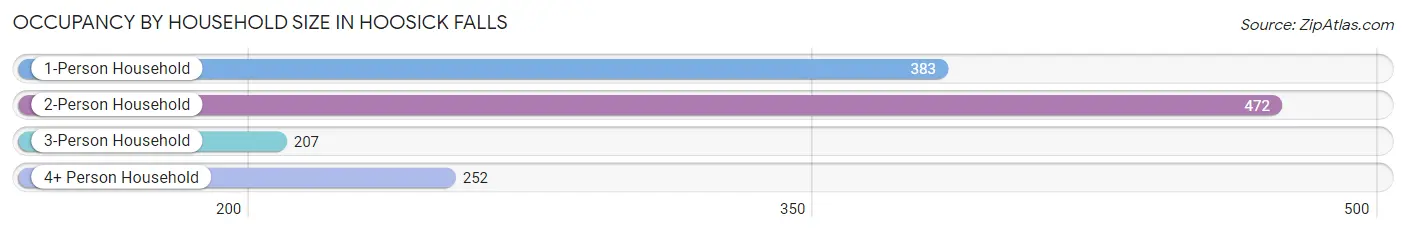
| Household Size | # Housing Units | % Housing Units |
| 1-Person Household | 383 | 29.1% |
| 2-Person Household | 472 | 35.9% |
| 3-Person Household | 207 | 15.8% |
| 4+ Person Household | 252 | 19.2% |
| Total Housing Units | 1,314 | 100.0% |
Occupancy by Ownership by Household Size in Hoosick Falls
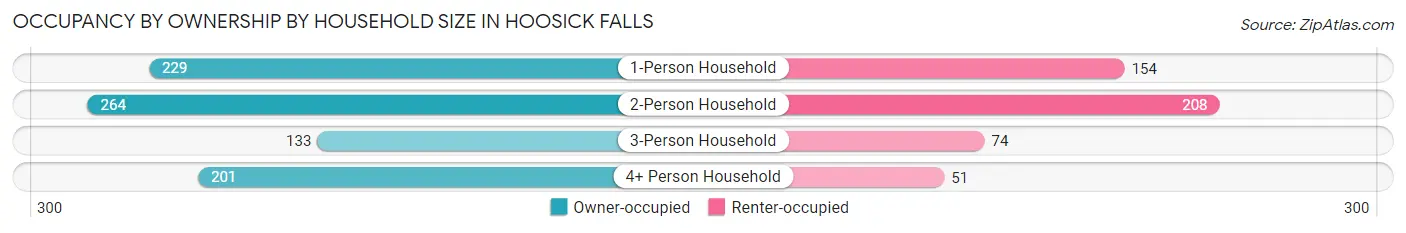
| Household Size | Owner-occupied | Renter-occupied |
| 1-Person Household | 229 (59.8%) | 154 (40.2%) |
| 2-Person Household | 264 (55.9%) | 208 (44.1%) |
| 3-Person Household | 133 (64.2%) | 74 (35.7%) |
| 4+ Person Household | 201 (79.8%) | 51 (20.2%) |
| Total Housing Units | 827 (62.9%) | 487 (37.1%) |
Occupancy by Educational Attainment in Hoosick Falls
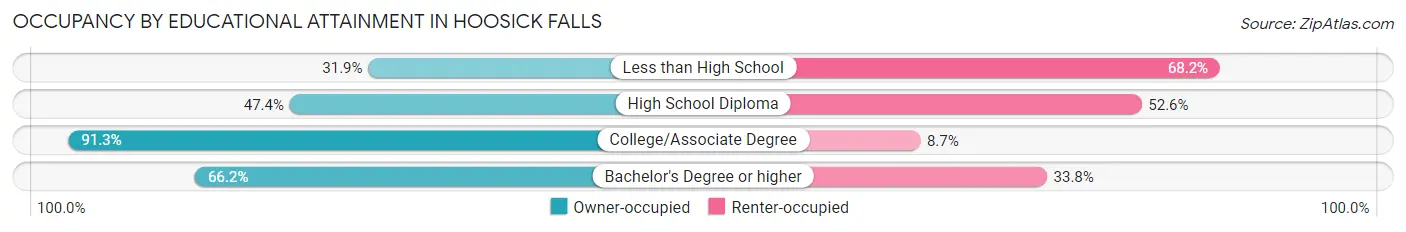
| Household Size | Owner-occupied | Renter-occupied |
| Less than High School | 50 (31.9%) | 107 (68.1%) |
| High School Diploma | 184 (47.4%) | 204 (52.6%) |
| College/Associate Degree | 305 (91.3%) | 29 (8.7%) |
| Bachelor's Degree or higher | 288 (66.2%) | 147 (33.8%) |
Occupancy by Age of Householder in Hoosick Falls
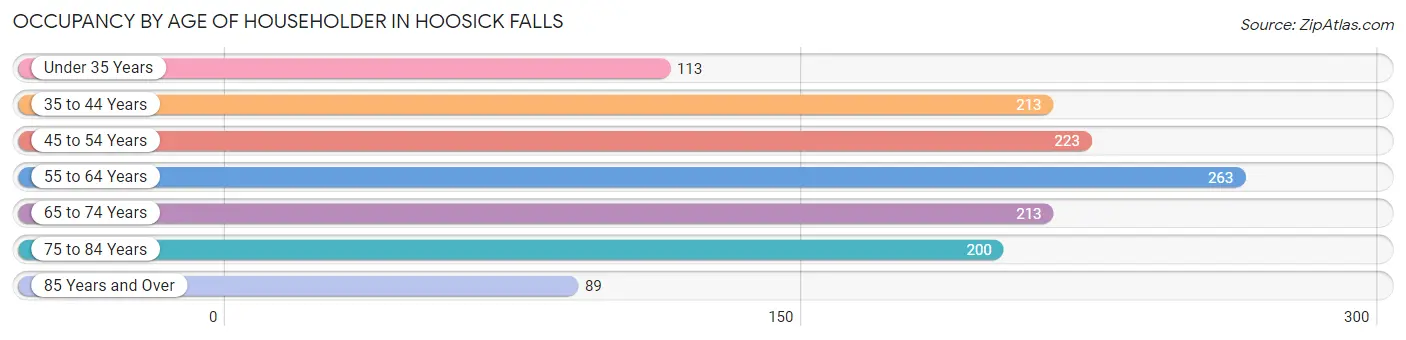
| Age Bracket | # Households | % Households |
| Under 35 Years | 113 | 8.6% |
| 35 to 44 Years | 213 | 16.2% |
| 45 to 54 Years | 223 | 17.0% |
| 55 to 64 Years | 263 | 20.0% |
| 65 to 74 Years | 213 | 16.2% |
| 75 to 84 Years | 200 | 15.2% |
| 85 Years and Over | 89 | 6.8% |
| Total | 1,314 | 100.0% |
Housing Finances in Hoosick Falls
Median Income by Occupancy in Hoosick Falls
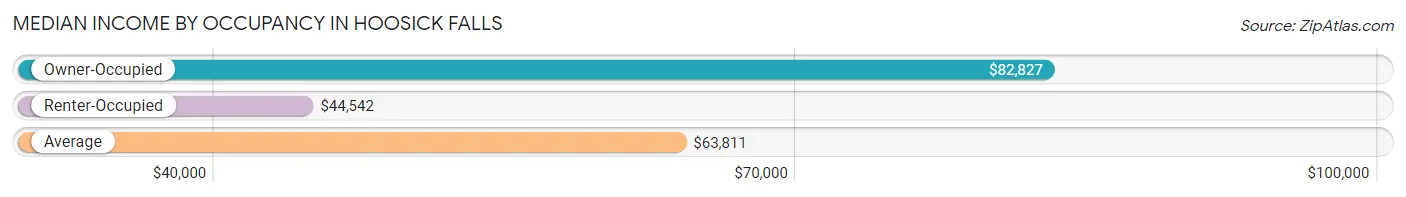
| Occupancy Type | # Households | Median Income |
| Owner-Occupied | 827 (62.9%) | $82,827 |
| Renter-Occupied | 487 (37.1%) | $44,542 |
| Average | 1,314 (100.0%) | $63,811 |
Occupancy by Householder Income Bracket in Hoosick Falls
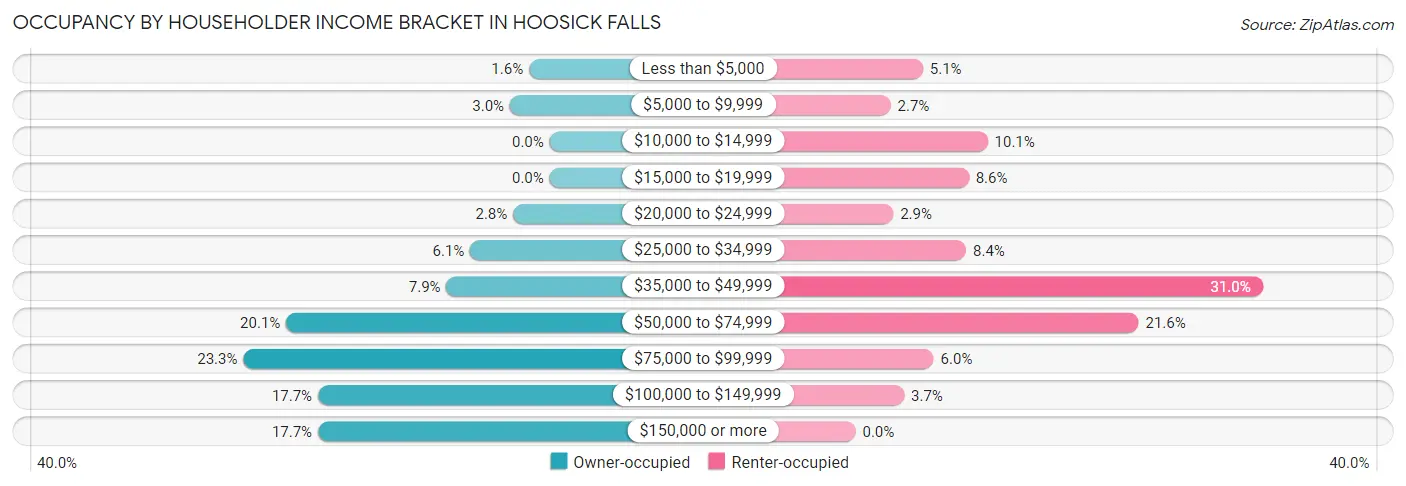
| Income Bracket | Owner-occupied | Renter-occupied |
| Less than $5,000 | 13 (1.6%) | 25 (5.1%) |
| $5,000 to $9,999 | 25 (3.0%) | 13 (2.7%) |
| $10,000 to $14,999 | 0 (0.0%) | 49 (10.1%) |
| $15,000 to $19,999 | 0 (0.0%) | 42 (8.6%) |
| $20,000 to $24,999 | 23 (2.8%) | 14 (2.9%) |
| $25,000 to $34,999 | 50 (6.0%) | 41 (8.4%) |
| $35,000 to $49,999 | 65 (7.9%) | 151 (31.0%) |
| $50,000 to $74,999 | 166 (20.1%) | 105 (21.6%) |
| $75,000 to $99,999 | 193 (23.3%) | 29 (5.9%) |
| $100,000 to $149,999 | 146 (17.6%) | 18 (3.7%) |
| $150,000 or more | 146 (17.6%) | 0 (0.0%) |
| Total | 827 (100.0%) | 487 (100.0%) |
Monthly Housing Cost Tiers in Hoosick Falls
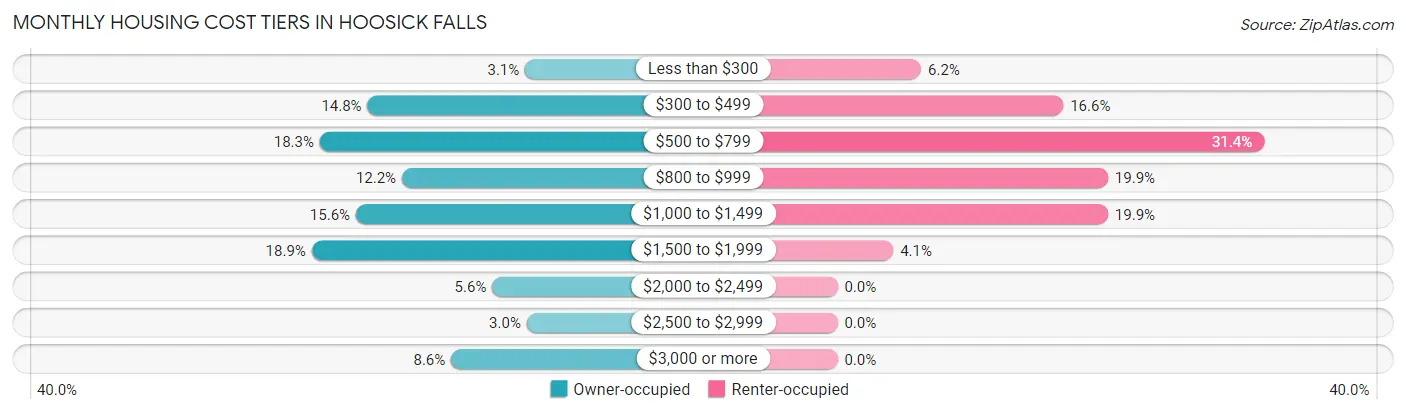
| Monthly Cost | Owner-occupied | Renter-occupied |
| Less than $300 | 26 (3.1%) | 30 (6.2%) |
| $300 to $499 | 122 (14.7%) | 81 (16.6%) |
| $500 to $799 | 151 (18.3%) | 153 (31.4%) |
| $800 to $999 | 101 (12.2%) | 97 (19.9%) |
| $1,000 to $1,499 | 129 (15.6%) | 97 (19.9%) |
| $1,500 to $1,999 | 156 (18.9%) | 20 (4.1%) |
| $2,000 to $2,499 | 46 (5.6%) | 0 (0.0%) |
| $2,500 to $2,999 | 25 (3.0%) | 0 (0.0%) |
| $3,000 or more | 71 (8.6%) | 0 (0.0%) |
| Total | 827 (100.0%) | 487 (100.0%) |
Physical Housing Characteristics in Hoosick Falls
Housing Structures in Hoosick Falls
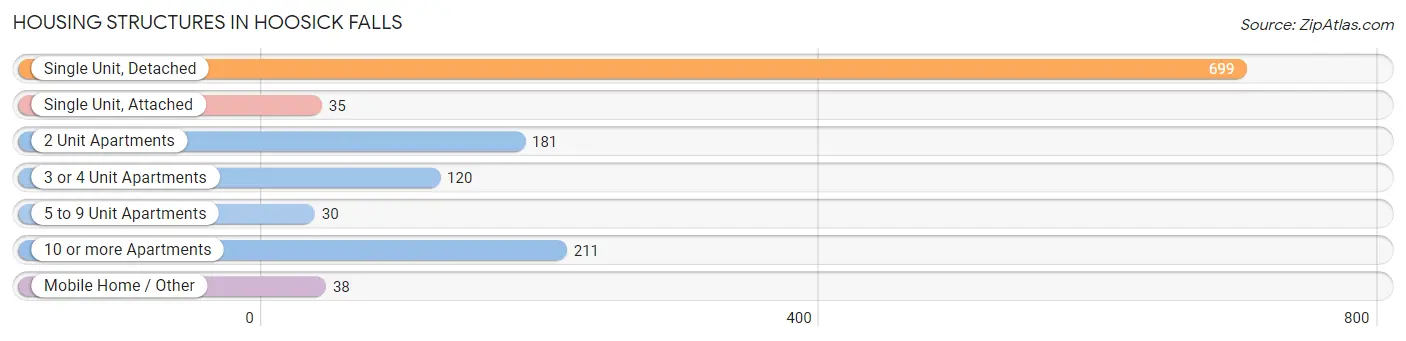
| Structure Type | # Housing Units | % Housing Units |
| Single Unit, Detached | 699 | 53.2% |
| Single Unit, Attached | 35 | 2.7% |
| 2 Unit Apartments | 181 | 13.8% |
| 3 or 4 Unit Apartments | 120 | 9.1% |
| 5 to 9 Unit Apartments | 30 | 2.3% |
| 10 or more Apartments | 211 | 16.1% |
| Mobile Home / Other | 38 | 2.9% |
| Total | 1,314 | 100.0% |
Housing Structures by Occupancy in Hoosick Falls
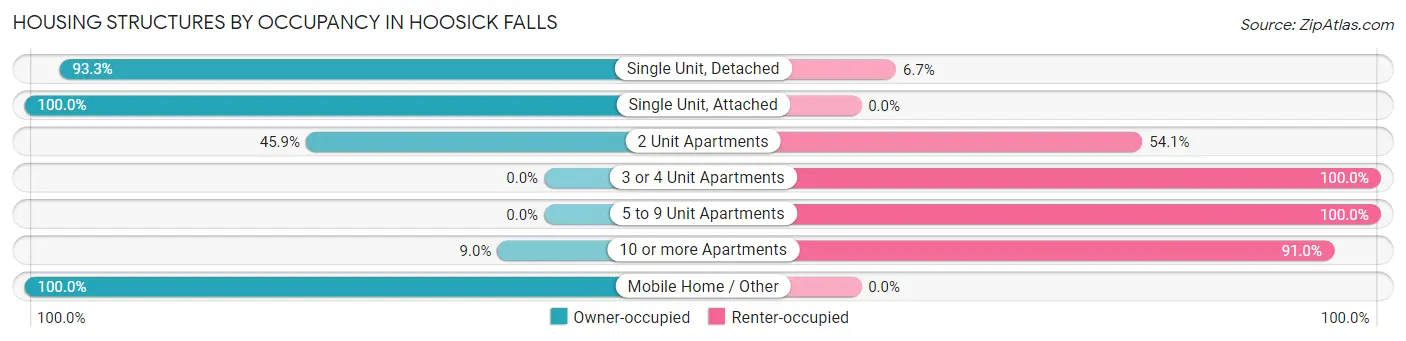
| Structure Type | Owner-occupied | Renter-occupied |
| Single Unit, Detached | 652 (93.3%) | 47 (6.7%) |
| Single Unit, Attached | 35 (100.0%) | 0 (0.0%) |
| 2 Unit Apartments | 83 (45.9%) | 98 (54.1%) |
| 3 or 4 Unit Apartments | 0 (0.0%) | 120 (100.0%) |
| 5 to 9 Unit Apartments | 0 (0.0%) | 30 (100.0%) |
| 10 or more Apartments | 19 (9.0%) | 192 (91.0%) |
| Mobile Home / Other | 38 (100.0%) | 0 (0.0%) |
| Total | 827 (62.9%) | 487 (37.1%) |
Housing Structures by Number of Rooms in Hoosick Falls
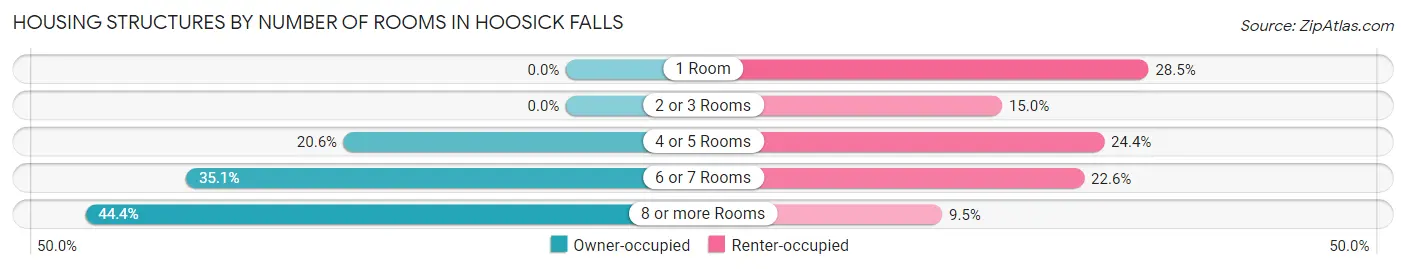
| Number of Rooms | Owner-occupied | Renter-occupied |
| 1 Room | 0 (0.0%) | 139 (28.5%) |
| 2 or 3 Rooms | 0 (0.0%) | 73 (15.0%) |
| 4 or 5 Rooms | 170 (20.6%) | 119 (24.4%) |
| 6 or 7 Rooms | 290 (35.1%) | 110 (22.6%) |
| 8 or more Rooms | 367 (44.4%) | 46 (9.5%) |
| Total | 827 (100.0%) | 487 (100.0%) |
Housing Structure by Heating Type in Hoosick Falls
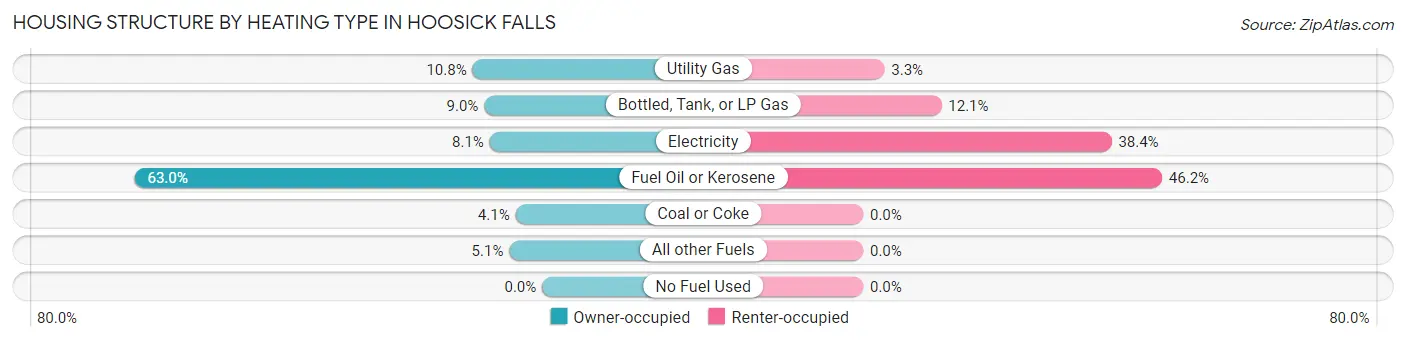
| Heating Type | Owner-occupied | Renter-occupied |
| Utility Gas | 89 (10.8%) | 16 (3.3%) |
| Bottled, Tank, or LP Gas | 74 (8.9%) | 59 (12.1%) |
| Electricity | 67 (8.1%) | 187 (38.4%) |
| Fuel Oil or Kerosene | 521 (63.0%) | 225 (46.2%) |
| Coal or Coke | 34 (4.1%) | 0 (0.0%) |
| All other Fuels | 42 (5.1%) | 0 (0.0%) |
| No Fuel Used | 0 (0.0%) | 0 (0.0%) |
| Total | 827 (100.0%) | 487 (100.0%) |
Household Vehicle Usage in Hoosick Falls
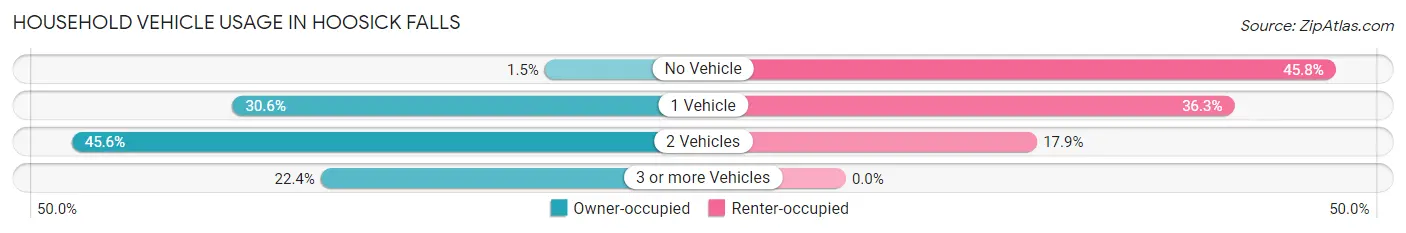
| Vehicles per Household | Owner-occupied | Renter-occupied |
| No Vehicle | 12 (1.5%) | 223 (45.8%) |
| 1 Vehicle | 253 (30.6%) | 177 (36.3%) |
| 2 Vehicles | 377 (45.6%) | 87 (17.9%) |
| 3 or more Vehicles | 185 (22.4%) | 0 (0.0%) |
| Total | 827 (100.0%) | 487 (100.0%) |
Real Estate & Mortgages in Hoosick Falls
Real Estate and Mortgage Overview in Hoosick Falls
| Characteristic | Without Mortgage | With Mortgage |
| Housing Units | 304 | 523 |
| Median Property Value | $165,700 | $137,500 |
| Median Household Income | $76,364 | $98 |
| Monthly Housing Costs | $517 | $57 |
| Real Estate Taxes | $1,830 | $14 |
Property Value by Mortgage Status in Hoosick Falls
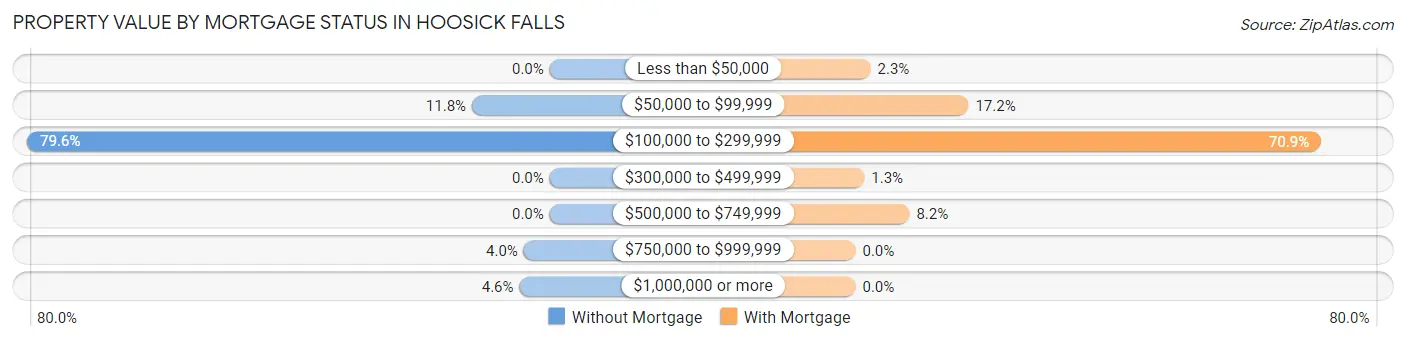
| Property Value | Without Mortgage | With Mortgage |
| Less than $50,000 | 0 (0.0%) | 12 (2.3%) |
| $50,000 to $99,999 | 36 (11.8%) | 90 (17.2%) |
| $100,000 to $299,999 | 242 (79.6%) | 371 (70.9%) |
| $300,000 to $499,999 | 0 (0.0%) | 7 (1.3%) |
| $500,000 to $749,999 | 0 (0.0%) | 43 (8.2%) |
| $750,000 to $999,999 | 12 (4.0%) | 0 (0.0%) |
| $1,000,000 or more | 14 (4.6%) | 0 (0.0%) |
| Total | 304 (100.0%) | 523 (100.0%) |
Household Income by Mortgage Status in Hoosick Falls
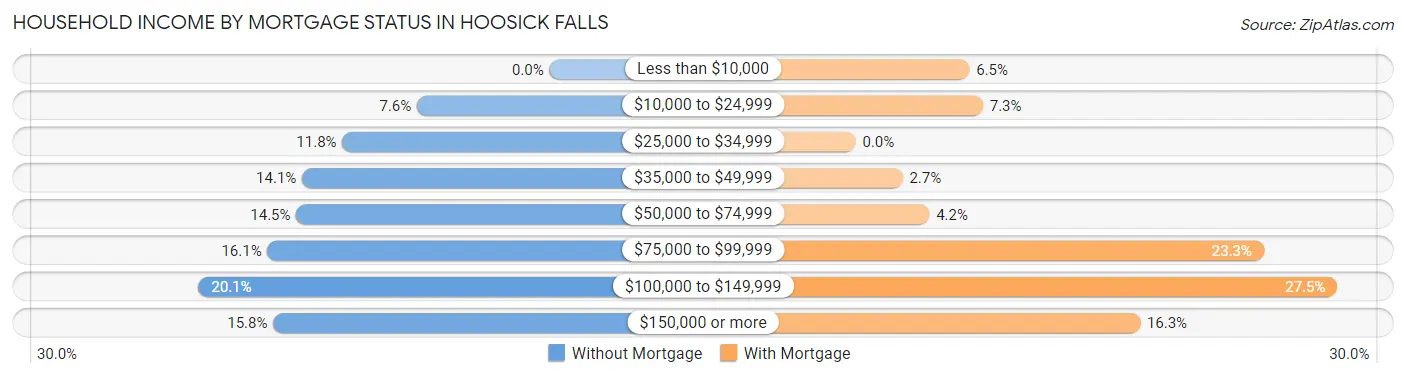
| Household Income | Without Mortgage | With Mortgage |
| Less than $10,000 | 0 (0.0%) | 34 (6.5%) |
| $10,000 to $24,999 | 23 (7.6%) | 38 (7.3%) |
| $25,000 to $34,999 | 36 (11.8%) | 0 (0.0%) |
| $35,000 to $49,999 | 43 (14.1%) | 14 (2.7%) |
| $50,000 to $74,999 | 44 (14.5%) | 22 (4.2%) |
| $75,000 to $99,999 | 49 (16.1%) | 122 (23.3%) |
| $100,000 to $149,999 | 61 (20.1%) | 144 (27.5%) |
| $150,000 or more | 48 (15.8%) | 85 (16.3%) |
| Total | 304 (100.0%) | 523 (100.0%) |
Property Value to Household Income Ratio in Hoosick Falls
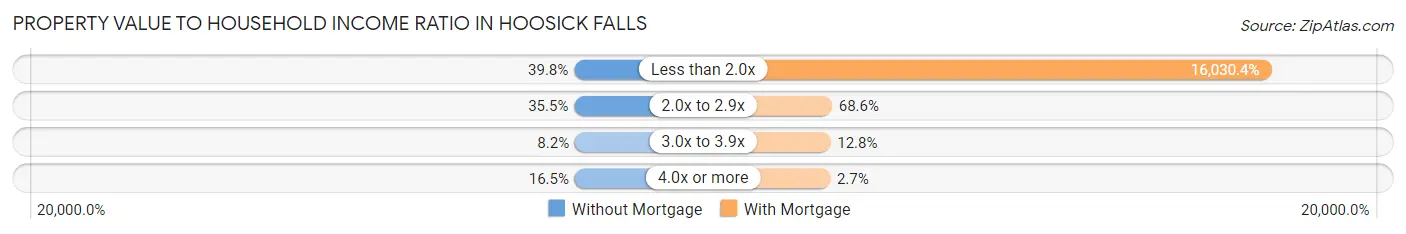
| Value-to-Income Ratio | Without Mortgage | With Mortgage |
| Less than 2.0x | 121 (39.8%) | 83,839 (16,030.4%) |
| 2.0x to 2.9x | 108 (35.5%) | 359 (68.6%) |
| 3.0x to 3.9x | 25 (8.2%) | 67 (12.8%) |
| 4.0x or more | 50 (16.5%) | 14 (2.7%) |
| Total | 304 (100.0%) | 523 (100.0%) |
Real Estate Taxes by Mortgage Status in Hoosick Falls
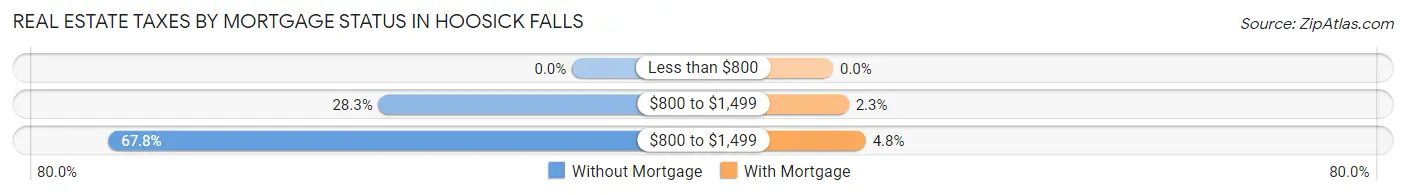
| Property Taxes | Without Mortgage | With Mortgage |
| Less than $800 | 0 (0.0%) | 0 (0.0%) |
| $800 to $1,499 | 86 (28.3%) | 12 (2.3%) |
| $800 to $1,499 | 206 (67.8%) | 25 (4.8%) |
| Total | 304 (100.0%) | 523 (100.0%) |
Health & Disability in Hoosick Falls
Health Insurance Coverage by Age in Hoosick Falls
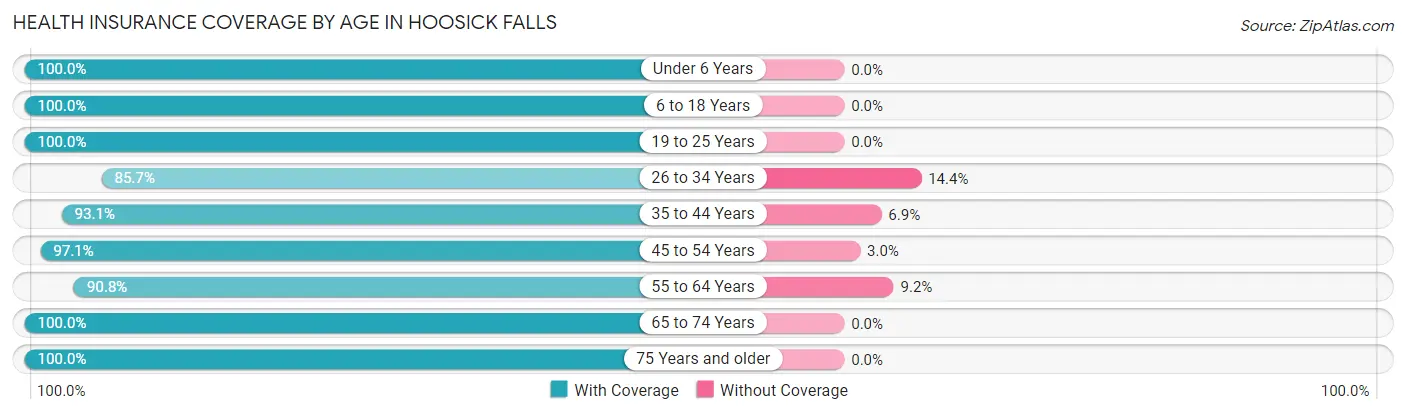
| Age Bracket | With Coverage | Without Coverage |
| Under 6 Years | 303 (100.0%) | 0 (0.0%) |
| 6 to 18 Years | 517 (100.0%) | 0 (0.0%) |
| 19 to 25 Years | 107 (100.0%) | 0 (0.0%) |
| 26 to 34 Years | 185 (85.7%) | 31 (14.3%) |
| 35 to 44 Years | 390 (93.1%) | 29 (6.9%) |
| 45 to 54 Years | 395 (97.1%) | 12 (2.9%) |
| 55 to 64 Years | 395 (90.8%) | 40 (9.2%) |
| 65 to 74 Years | 300 (100.0%) | 0 (0.0%) |
| 75 Years and older | 465 (100.0%) | 0 (0.0%) |
| Total | 3,057 (96.5%) | 112 (3.5%) |
Health Insurance Coverage by Citizenship Status in Hoosick Falls
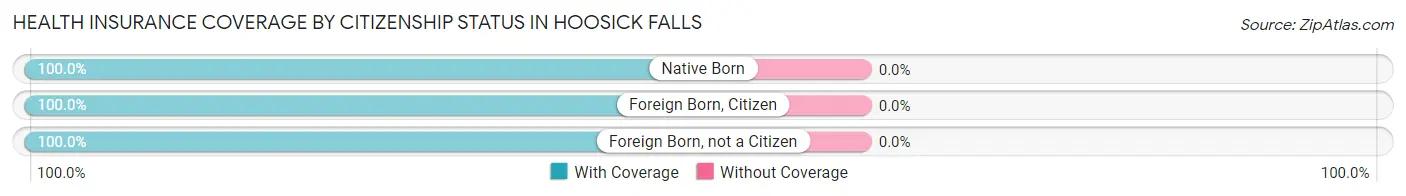
| Citizenship Status | With Coverage | Without Coverage |
| Native Born | 303 (100.0%) | 0 (0.0%) |
| Foreign Born, Citizen | 517 (100.0%) | 0 (0.0%) |
| Foreign Born, not a Citizen | 107 (100.0%) | 0 (0.0%) |
Health Insurance Coverage by Household Income in Hoosick Falls
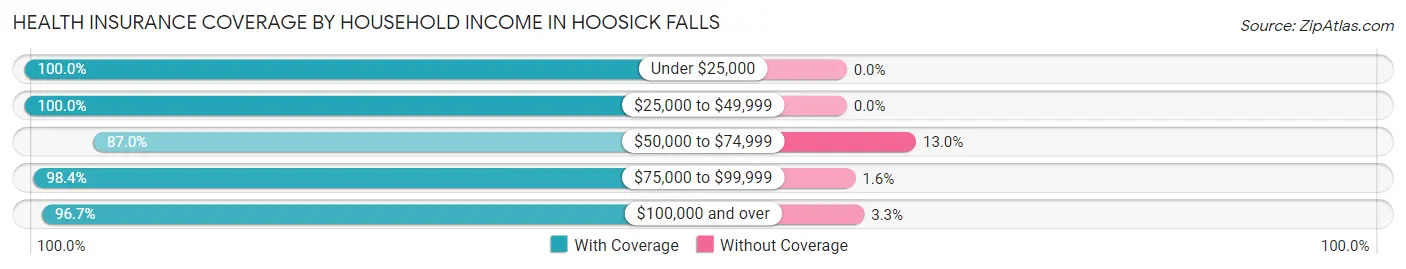
| Household Income | With Coverage | Without Coverage |
| Under $25,000 | 366 (100.0%) | 0 (0.0%) |
| $25,000 to $49,999 | 590 (100.0%) | 0 (0.0%) |
| $50,000 to $74,999 | 462 (87.0%) | 69 (13.0%) |
| $75,000 to $99,999 | 724 (98.4%) | 12 (1.6%) |
| $100,000 and over | 915 (96.7%) | 31 (3.3%) |
Public vs Private Health Insurance Coverage by Age in Hoosick Falls
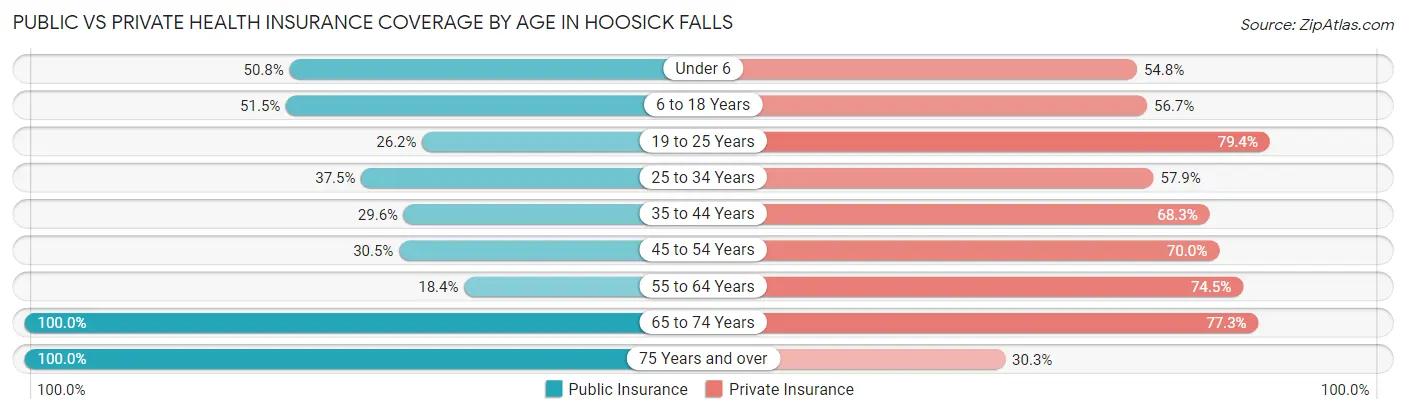
| Age Bracket | Public Insurance | Private Insurance |
| Under 6 | 154 (50.8%) | 166 (54.8%) |
| 6 to 18 Years | 266 (51.4%) | 293 (56.7%) |
| 19 to 25 Years | 28 (26.2%) | 85 (79.4%) |
| 25 to 34 Years | 81 (37.5%) | 125 (57.9%) |
| 35 to 44 Years | 124 (29.6%) | 286 (68.3%) |
| 45 to 54 Years | 124 (30.5%) | 285 (70.0%) |
| 55 to 64 Years | 80 (18.4%) | 324 (74.5%) |
| 65 to 74 Years | 300 (100.0%) | 232 (77.3%) |
| 75 Years and over | 465 (100.0%) | 141 (30.3%) |
| Total | 1,622 (51.2%) | 1,937 (61.1%) |
Disability Status by Sex by Age in Hoosick Falls
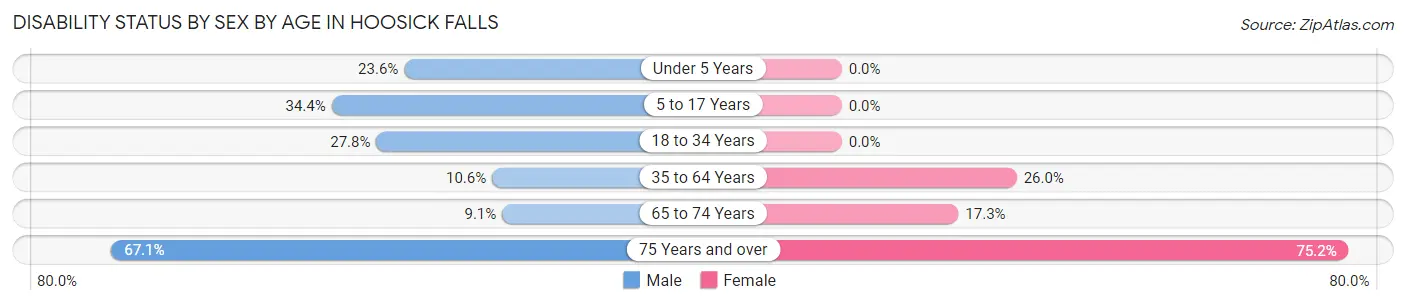
| Age Bracket | Male | Female |
| Under 5 Years | 26 (23.6%) | 0 (0.0%) |
| 5 to 17 Years | 95 (34.4%) | 0 (0.0%) |
| 18 to 34 Years | 45 (27.8%) | 0 (0.0%) |
| 35 to 64 Years | 52 (10.6%) | 200 (26.0%) |
| 65 to 74 Years | 11 (9.1%) | 31 (17.3%) |
| 75 Years and over | 98 (67.1%) | 240 (75.2%) |
Disability Class by Sex by Age in Hoosick Falls
Disability Class: Hearing Difficulty
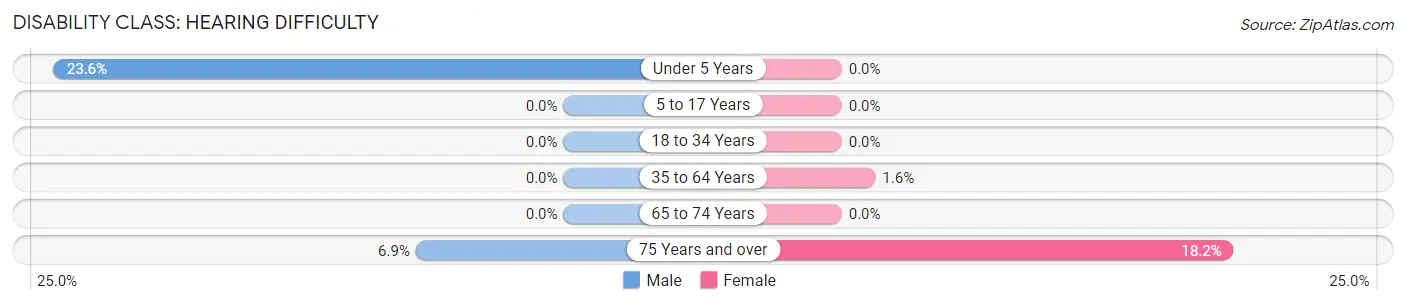
| Age Bracket | Male | Female |
| Under 5 Years | 26 (23.6%) | 0 (0.0%) |
| 5 to 17 Years | 0 (0.0%) | 0 (0.0%) |
| 18 to 34 Years | 0 (0.0%) | 0 (0.0%) |
| 35 to 64 Years | 0 (0.0%) | 12 (1.6%) |
| 65 to 74 Years | 0 (0.0%) | 0 (0.0%) |
| 75 Years and over | 10 (6.9%) | 58 (18.2%) |
Disability Class: Vision Difficulty
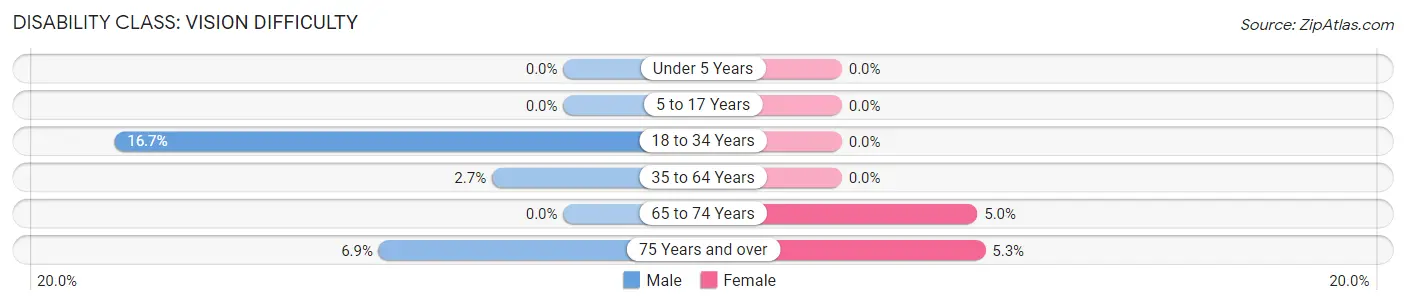
| Age Bracket | Male | Female |
| Under 5 Years | 0 (0.0%) | 0 (0.0%) |
| 5 to 17 Years | 0 (0.0%) | 0 (0.0%) |
| 18 to 34 Years | 27 (16.7%) | 0 (0.0%) |
| 35 to 64 Years | 13 (2.6%) | 0 (0.0%) |
| 65 to 74 Years | 0 (0.0%) | 9 (5.0%) |
| 75 Years and over | 10 (6.9%) | 17 (5.3%) |
Disability Class: Cognitive Difficulty
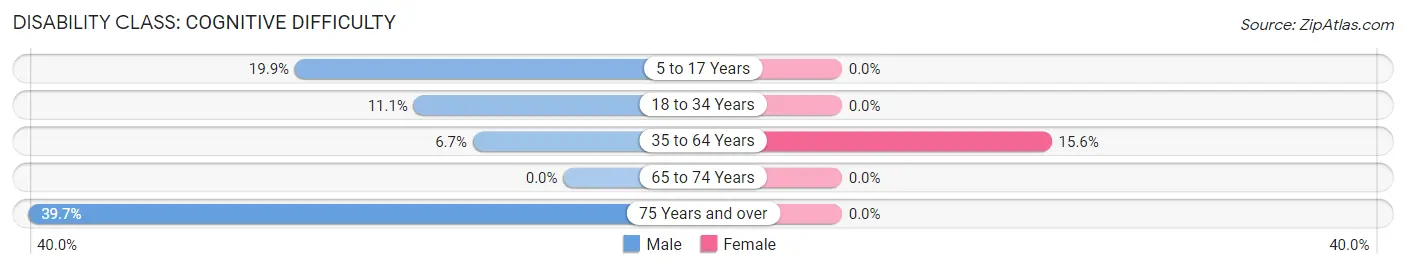
| Age Bracket | Male | Female |
| 5 to 17 Years | 55 (19.9%) | 0 (0.0%) |
| 18 to 34 Years | 18 (11.1%) | 0 (0.0%) |
| 35 to 64 Years | 33 (6.7%) | 120 (15.6%) |
| 65 to 74 Years | 0 (0.0%) | 0 (0.0%) |
| 75 Years and over | 58 (39.7%) | 0 (0.0%) |
Disability Class: Ambulatory Difficulty
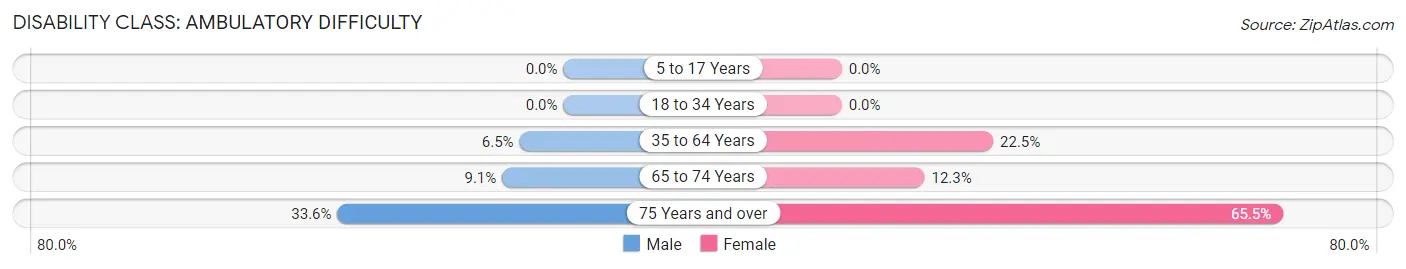
| Age Bracket | Male | Female |
| 5 to 17 Years | 0 (0.0%) | 0 (0.0%) |
| 18 to 34 Years | 0 (0.0%) | 0 (0.0%) |
| 35 to 64 Years | 32 (6.5%) | 173 (22.5%) |
| 65 to 74 Years | 11 (9.1%) | 22 (12.3%) |
| 75 Years and over | 49 (33.6%) | 209 (65.5%) |
Disability Class: Self-Care Difficulty
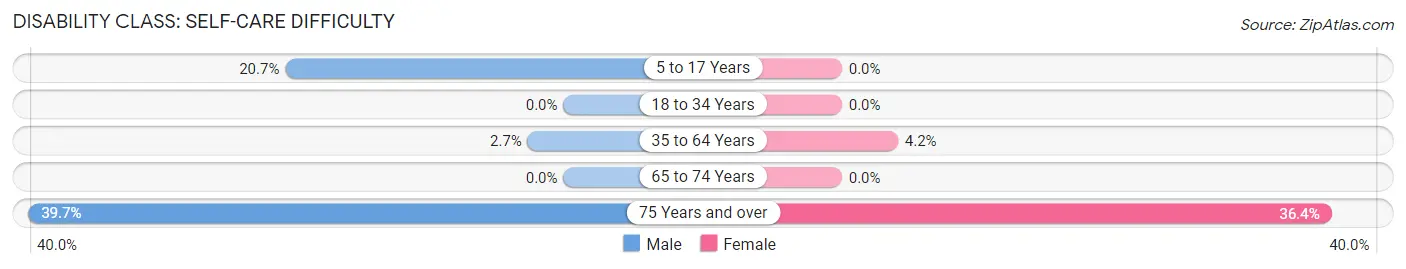
| Age Bracket | Male | Female |
| 5 to 17 Years | 57 (20.6%) | 0 (0.0%) |
| 18 to 34 Years | 0 (0.0%) | 0 (0.0%) |
| 35 to 64 Years | 13 (2.6%) | 32 (4.2%) |
| 65 to 74 Years | 0 (0.0%) | 0 (0.0%) |
| 75 Years and over | 58 (39.7%) | 116 (36.4%) |
Technology Access in Hoosick Falls
Computing Device Access in Hoosick Falls
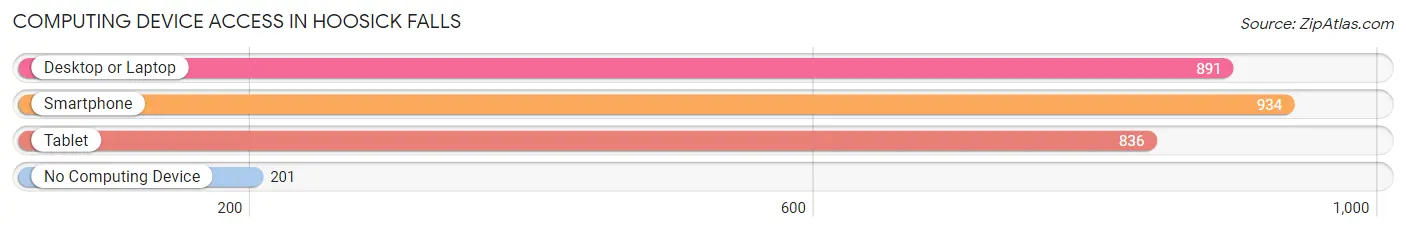
| Device Type | # Households | % Households |
| Desktop or Laptop | 891 | 67.8% |
| Smartphone | 934 | 71.1% |
| Tablet | 836 | 63.6% |
| No Computing Device | 201 | 15.3% |
| Total | 1,314 | 100.0% |
Internet Access in Hoosick Falls
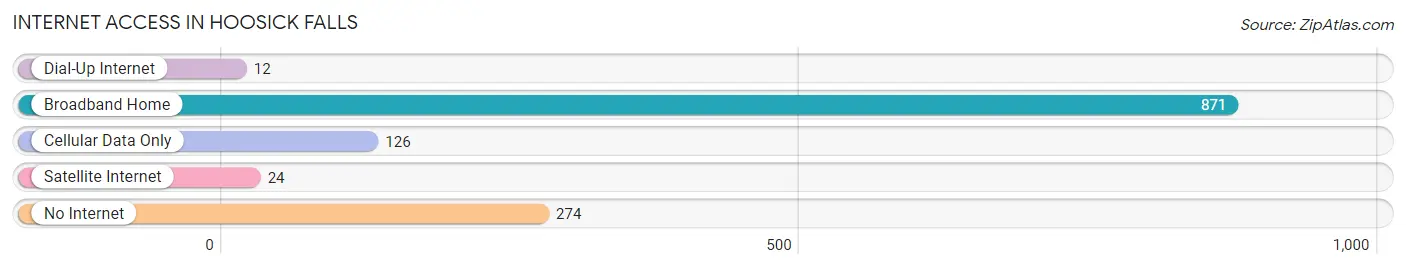
| Internet Type | # Households | % Households |
| Dial-Up Internet | 12 | 0.9% |
| Broadband Home | 871 | 66.3% |
| Cellular Data Only | 126 | 9.6% |
| Satellite Internet | 24 | 1.8% |
| No Internet | 274 | 20.8% |
| Total | 1,314 | 100.0% |
Hoosick Falls Summary
Hoosick Falls is a village located in Rensselaer County, New York, United States. It is situated on the Hoosic River, which forms the border between Rensselaer and Washington counties. The population was 3,501 at the 2010 census. The village is named after the Hoosic River, which was originally called the Hoosick.
History
Hoosick Falls was first settled in 1765 by Dutch and English settlers. The village was incorporated in 1827. The village was an important industrial center in the 19th century, with several mills and factories located along the Hoosic River. The village was also home to several tanneries, which produced leather goods for the local market.
The village was the site of a major battle during the American Revolution, known as the Battle of Bennington. The battle was fought on August 16, 1777, and resulted in a decisive victory for the American forces.
Geography
Hoosick Falls is located at 42°45'N 73°20'W (42.75, -73.33). According to the United States Census Bureau, the village has a total area of 1.2 square miles (3.1 km2), all of it land.
Economy
Hoosick Falls is home to several small businesses, including a grocery store, a hardware store, a pharmacy, and several restaurants. The village is also home to several manufacturing companies, including a paper mill, a plastics manufacturer, and a metal fabricator.
Demographics
As of the census of 2010, there were 3,501 people, 1,521 households, and 890 families residing in the village. The population density was 2,917.5 people per square mile (1,125.3/km2). There were 1,637 housing units at an average density of 1,346.7 per square mile (519.3/km2). The racial makeup of the village was 97.2% White, 0.7% African American, 0.2% Native American, 0.4% Asian, 0.1% Pacific Islander, 0.3% from other races, and 1.1% from two or more races. Hispanic or Latino of any race were 1.7% of the population.
There were 1,521 households, out of which 28.2% had children under the age of 18 living with them, 43.2% were married couples living together, 12.7% had a female householder with no husband present, and 39.2% were non-families. 33.2% of all households were made up of individuals, and 14.2% had someone living alone who was 65 years of age or older. The average household size was 2.30 and the average family size was 2.93.
In the village, the population was spread out, with 24.2% under the age of 18, 7.2% from 18 to 24, 28.2% from 25 to 44, 24.2% from 45 to 64, and 16.2% who were 65 years of age or older. The median age was 38 years. For every 100 females, there were 91.2 males. For every 100 females age 18 and over, there were 87.2 males.
The median income for a household in the village was $37,917, and the median income for a family was $45,000. Males had a median income of $35,000 versus $25,000 for females. The per capita income for the village was $19,945. About 8.2% of families and 10.2% of the population were below the poverty line, including 14.2% of those under age 18 and 8.2% of those age 65 or over.
Common Questions
What is Per Capita Income in Hoosick Falls?
Per Capita income in Hoosick Falls is $34,846.
What is the Median Family Income in Hoosick Falls?
Median Family Income in Hoosick Falls is $78,924.
What is the Median Household income in Hoosick Falls?
Median Household Income in Hoosick Falls is $63,811.
What is Income or Wage Gap in Hoosick Falls?
Income or Wage Gap in Hoosick Falls is 25.2%.
Women in Hoosick Falls earn 74.8 cents for every dollar earned by a man.
What is Inequality or Gini Index in Hoosick Falls?
Inequality or Gini Index in Hoosick Falls is 0.46.
What is the Total Population of Hoosick Falls?
Total Population of Hoosick Falls is 3,225.
What is the Total Male Population of Hoosick Falls?
Total Male Population of Hoosick Falls is 1,306.
What is the Total Female Population of Hoosick Falls?
Total Female Population of Hoosick Falls is 1,919.
What is the Ratio of Males per 100 Females in Hoosick Falls?
There are 68.06 Males per 100 Females in Hoosick Falls.
What is the Ratio of Females per 100 Males in Hoosick Falls?
There are 146.94 Females per 100 Males in Hoosick Falls.
What is the Median Population Age in Hoosick Falls?
Median Population Age in Hoosick Falls is 46.4 Years.
What is the Average Family Size in Hoosick Falls
Average Family Size in Hoosick Falls is 3.0 People.
What is the Average Household Size in Hoosick Falls
Average Household Size in Hoosick Falls is 2.4 People.
How Large is the Labor Force in Hoosick Falls?
There are 1,326 People in the Labor Forcein in Hoosick Falls.
What is the Percentage of People in the Labor Force in Hoosick Falls?
53.7% of People are in the Labor Force in Hoosick Falls.
What is the Unemployment Rate in Hoosick Falls?
Unemployment Rate in Hoosick Falls is 1.2%.