Bath, NY Map & Demographics
Bath Map
Bath Overview
$29,133
PER CAPITA INCOME
$59,194
AVG FAMILY INCOME
$42,832
AVG HOUSEHOLD INCOME
25.3%
WAGE / INCOME GAP [ % ]
74.7¢/ $1
WAGE / INCOME GAP [ $ ]
0.44
INEQUALITY / GINI INDEX
5,606
TOTAL POPULATION
2,560
MALE POPULATION
3,046
FEMALE POPULATION
84.04
MALES / 100 FEMALES
118.98
FEMALES / 100 MALES
46.7
MEDIAN AGE
2.7
AVG FAMILY SIZE
1.9
AVG HOUSEHOLD SIZE
2,564
LABOR FORCE [ PEOPLE ]
54.3%
PERCENT IN LABOR FORCE
6.9%
UNEMPLOYMENT RATE
Bath Zip Codes
Bath Area Codes
Income in Bath
Income Overview in Bath
Per Capita Income in Bath is $29,133, while median incomes of families and households are $59,194 and $42,832 respectively.
| Characteristic | Number | Measure |
| Per Capita Income | 5,606 | $29,133 |
| Median Family Income | 1,387 | $59,194 |
| Mean Family Income | 1,387 | $77,200 |
| Median Household Income | 2,824 | $42,832 |
| Mean Household Income | 2,824 | $56,262 |
| Income Deficit | 1,387 | $0 |
| Wage / Income Gap (%) | 5,606 | 25.27% |
| Wage / Income Gap ($) | 5,606 | 74.73¢ per $1 |
| Gini / Inequality Index | 5,606 | 0.44 |
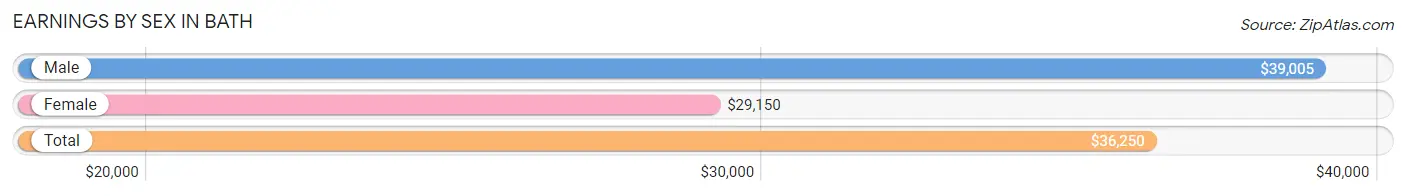
Earnings by Sex in Bath
Average Earnings in Bath are $36,250, $39,005 for men and $29,150 for women, a difference of 25.3%.
| Sex | Number | Average Earnings |
| Male | 1,250 (46.8%) | $39,005 |
| Female | 1,421 (53.2%) | $29,150 |
| Total | 2,671 (100.0%) | $36,250 |
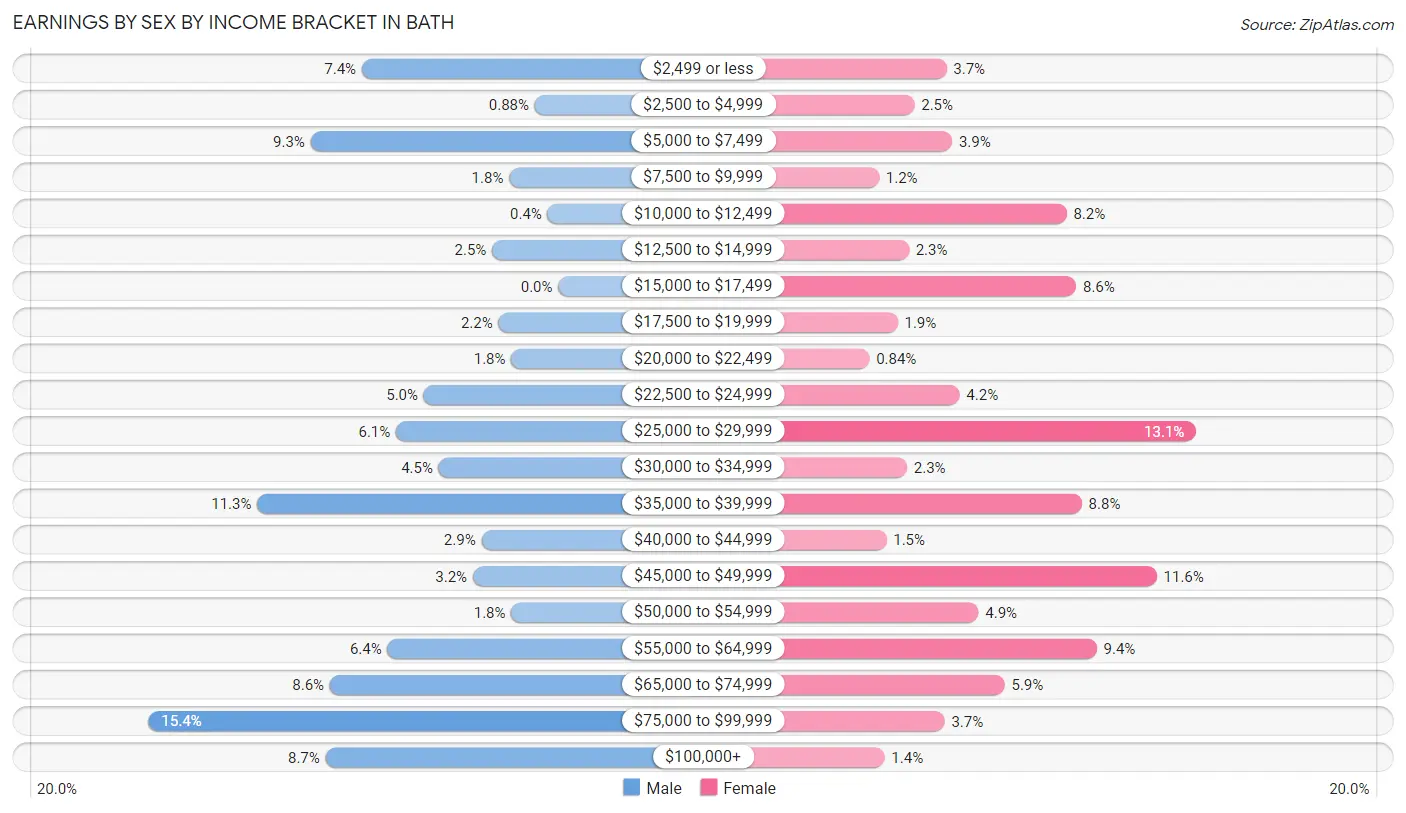
Earnings by Sex by Income Bracket in Bath
The most common earnings brackets in Bath are $75,000 to $99,999 for men (192 | 15.4%) and $25,000 to $29,999 for women (186 | 13.1%).
| Income | Male | Female |
| $2,499 or less | 92 (7.4%) | 53 (3.7%) |
| $2,500 to $4,999 | 11 (0.9%) | 36 (2.5%) |
| $5,000 to $7,499 | 116 (9.3%) | 56 (3.9%) |
| $7,500 to $9,999 | 23 (1.8%) | 17 (1.2%) |
| $10,000 to $12,499 | 5 (0.4%) | 117 (8.2%) |
| $12,500 to $14,999 | 31 (2.5%) | 33 (2.3%) |
| $15,000 to $17,499 | 0 (0.0%) | 122 (8.6%) |
| $17,500 to $19,999 | 28 (2.2%) | 27 (1.9%) |
| $20,000 to $22,499 | 22 (1.8%) | 12 (0.8%) |
| $22,500 to $24,999 | 63 (5.0%) | 60 (4.2%) |
| $25,000 to $29,999 | 76 (6.1%) | 186 (13.1%) |
| $30,000 to $34,999 | 56 (4.5%) | 32 (2.2%) |
| $35,000 to $39,999 | 141 (11.3%) | 125 (8.8%) |
| $40,000 to $44,999 | 36 (2.9%) | 21 (1.5%) |
| $45,000 to $49,999 | 40 (3.2%) | 165 (11.6%) |
| $50,000 to $54,999 | 22 (1.8%) | 70 (4.9%) |
| $55,000 to $64,999 | 80 (6.4%) | 133 (9.4%) |
| $65,000 to $74,999 | 107 (8.6%) | 84 (5.9%) |
| $75,000 to $99,999 | 192 (15.4%) | 52 (3.7%) |
| $100,000+ | 109 (8.7%) | 20 (1.4%) |
| Total | 1,250 (100.0%) | 1,421 (100.0%) |
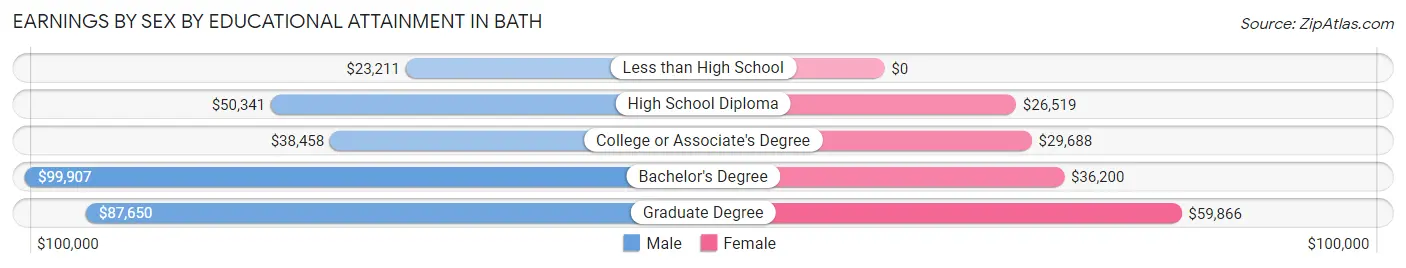
Earnings by Sex by Educational Attainment in Bath
Average earnings in Bath are $42,679 for men and $34,511 for women, a difference of 19.1%. Men with an educational attainment of bachelor's degree enjoy the highest average annual earnings of $99,907, while those with less than high school education earn the least with $23,211. Women with an educational attainment of graduate degree earn the most with the average annual earnings of $59,866, while those with high school diploma education have the smallest earnings of $26,519.
| Educational Attainment | Male Income | Female Income |
| Less than High School | $23,211 | $0 |
| High School Diploma | $50,341 | $26,519 |
| College or Associate's Degree | $38,458 | $29,688 |
| Bachelor's Degree | $99,907 | $36,200 |
| Graduate Degree | $87,650 | $59,866 |
| Total | $42,679 | $34,511 |
Family Income in Bath
Family Income Brackets in Bath
According to the Bath family income data, there are 257 families falling into the $100,000 to $149,999 income range, which is the most common income bracket and makes up 18.5% of all families. Conversely, the $10,000 to $14,999 income bracket is the least frequent group with only 10 families (0.7%) belonging to this category.
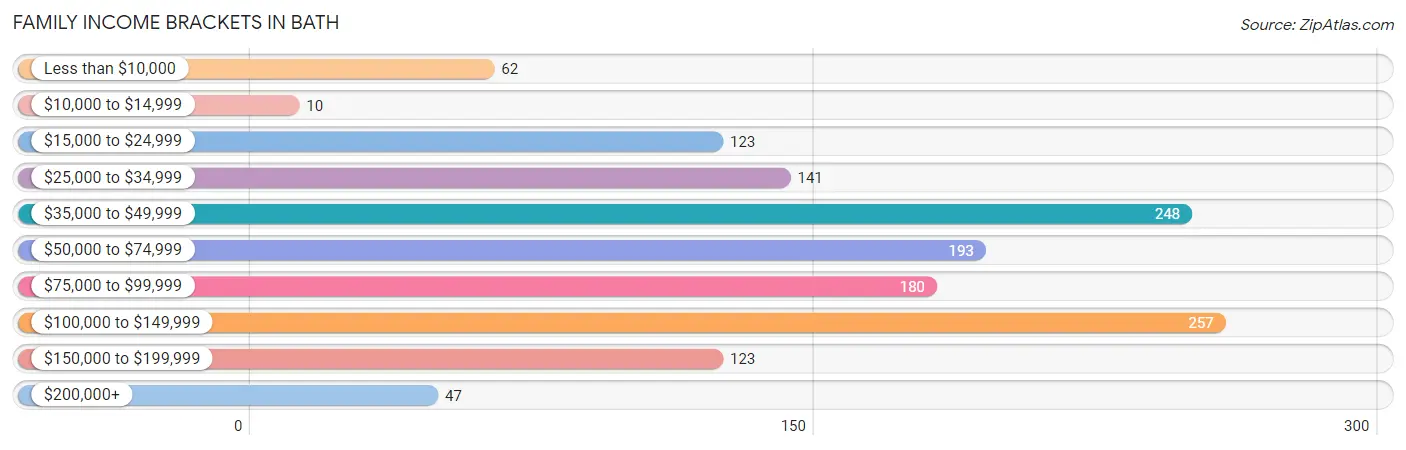
| Income Bracket | # Families | % Families |
| Less than $10,000 | 62 | 4.5% |
| $10,000 to $14,999 | 10 | 0.7% |
| $15,000 to $24,999 | 123 | 8.9% |
| $25,000 to $34,999 | 141 | 10.2% |
| $35,000 to $49,999 | 248 | 17.9% |
| $50,000 to $74,999 | 193 | 13.9% |
| $75,000 to $99,999 | 180 | 13.0% |
| $100,000 to $149,999 | 257 | 18.5% |
| $150,000 to $199,999 | 123 | 8.9% |
| $200,000+ | 47 | 3.4% |
Family Income by Famaliy Size in Bath
4-person families (183 | 13.2%) account for the highest median family income in Bath with $123,533 per family, while 4-person families (183 | 13.2%) have the highest median income of $30,883 per family member.
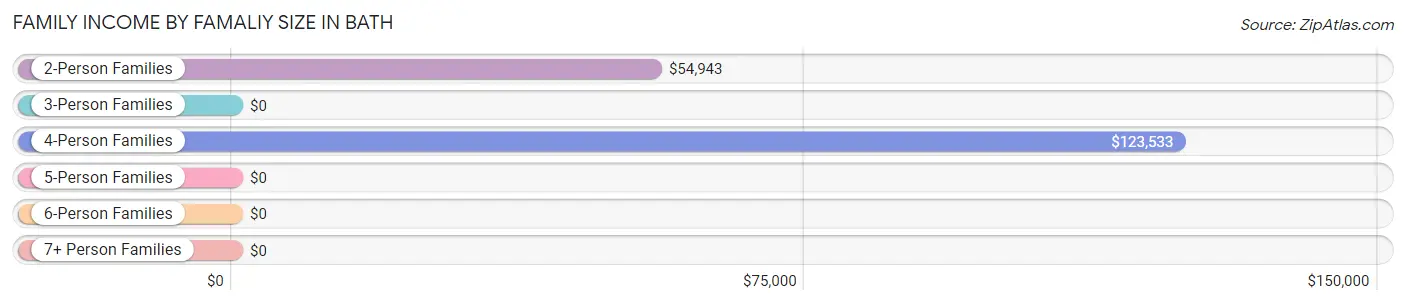
| Income Bracket | # Families | Median Income |
| 2-Person Families | 853 (61.5%) | $54,943 |
| 3-Person Families | 253 (18.2%) | $0 |
| 4-Person Families | 183 (13.2%) | $123,533 |
| 5-Person Families | 14 (1.0%) | $0 |
| 6-Person Families | 74 (5.3%) | $0 |
| 7+ Person Families | 10 (0.7%) | $0 |
| Total | 1,387 (100.0%) | $59,194 |
Family Income by Number of Earners in Bath
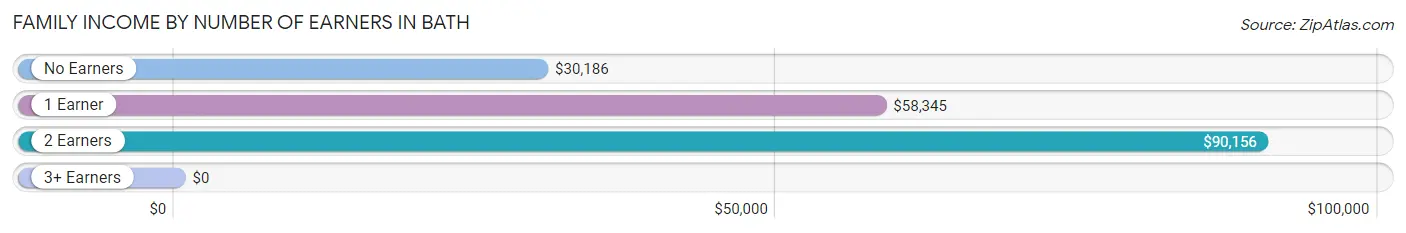
| Number of Earners | # Families | Median Income |
| No Earners | 371 (26.8%) | $30,186 |
| 1 Earner | 387 (27.9%) | $58,345 |
| 2 Earners | 585 (42.2%) | $90,156 |
| 3+ Earners | 44 (3.2%) | $0 |
| Total | 1,387 (100.0%) | $59,194 |
Household Income in Bath
Household Income Brackets in Bath
With 596 households falling in the category, the $35,000 to $49,999 income range is the most frequent in Bath, accounting for 21.1% of all households. In contrast, only 48 households (1.7%) fall into the $200,000+ income bracket, making it the least populous group.
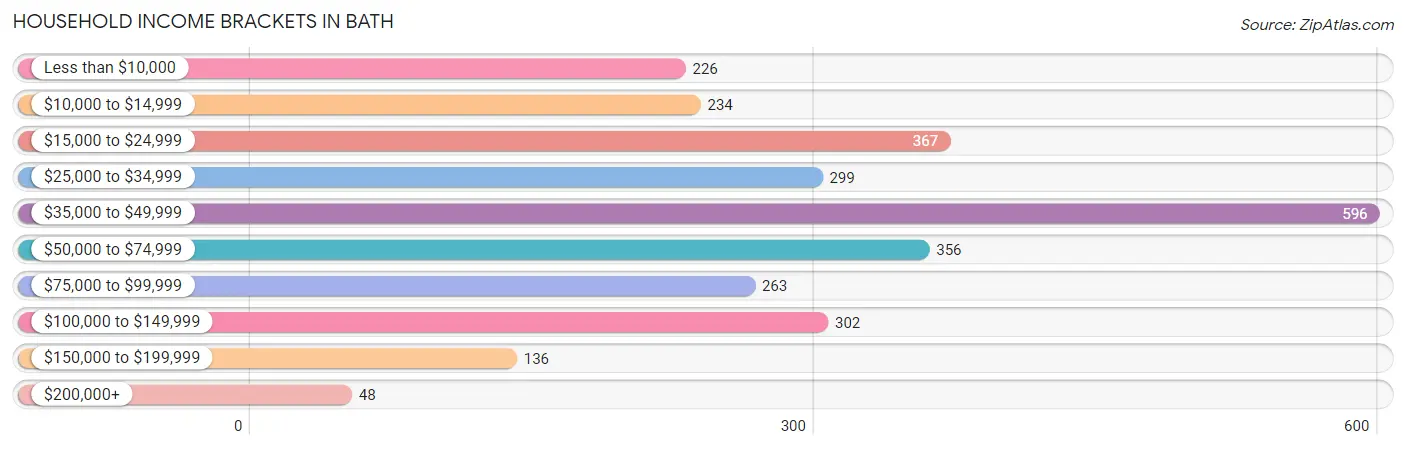
| Income Bracket | # Households | % Households |
| Less than $10,000 | 226 | 8.0% |
| $10,000 to $14,999 | 234 | 8.3% |
| $15,000 to $24,999 | 367 | 13.0% |
| $25,000 to $34,999 | 299 | 10.6% |
| $35,000 to $49,999 | 596 | 21.1% |
| $50,000 to $74,999 | 356 | 12.6% |
| $75,000 to $99,999 | 263 | 9.3% |
| $100,000 to $149,999 | 302 | 10.7% |
| $150,000 to $199,999 | 136 | 4.8% |
| $200,000+ | 48 | 1.7% |
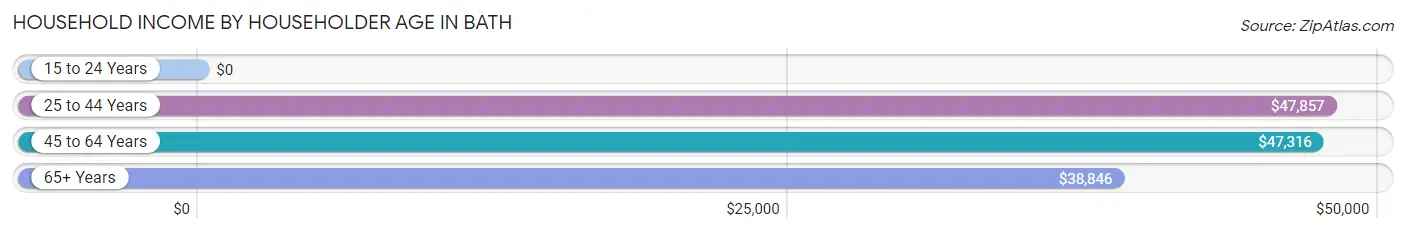
Household Income by Householder Age in Bath
The median household income in Bath is $42,832, with the highest median household income of $47,857 found in the 25 to 44 years age bracket for the primary householder. A total of 804 households (28.5%) fall into this category. Meanwhile, the 15 to 24 years age bracket for the primary householder has the lowest median household income of $0, with 171 households (6.1%) in this group.
| Income Bracket | # Households | Median Income |
| 15 to 24 Years | 171 (6.1%) | $0 |
| 25 to 44 Years | 804 (28.5%) | $47,857 |
| 45 to 64 Years | 927 (32.8%) | $47,316 |
| 65+ Years | 922 (32.7%) | $38,846 |
| Total | 2,824 (100.0%) | $42,832 |
Poverty in Bath
Income Below Poverty by Sex and Age in Bath
With 18.2% poverty level for males and 18.1% for females among the residents of Bath, 18 to 24 year old males and 5 year old females are the most vulnerable to poverty, with 97 males (66.9%) and 22 females (100.0%) in their respective age groups living below the poverty level.
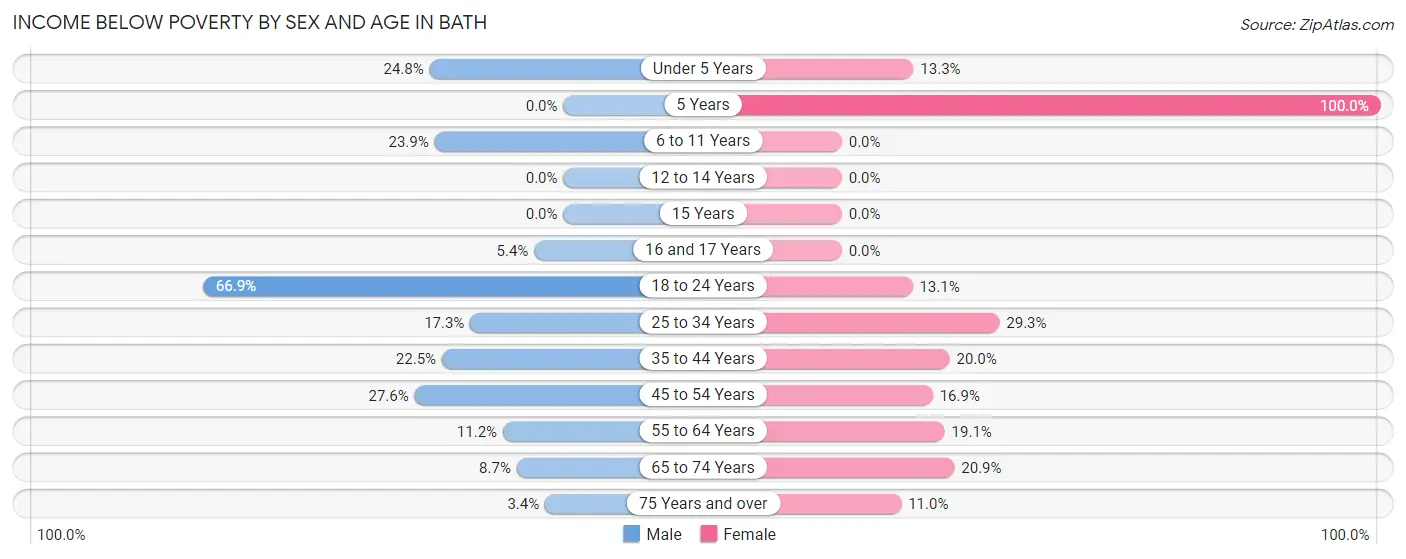
| Age Bracket | Male | Female |
| Under 5 Years | 40 (24.8%) | 23 (13.3%) |
| 5 Years | 0 (0.0%) | 22 (100.0%) |
| 6 to 11 Years | 33 (23.9%) | 0 (0.0%) |
| 12 to 14 Years | 0 (0.0%) | 0 (0.0%) |
| 15 Years | 0 (0.0%) | 0 (0.0%) |
| 16 and 17 Years | 2 (5.4%) | 0 (0.0%) |
| 18 to 24 Years | 97 (66.9%) | 37 (13.1%) |
| 25 to 34 Years | 60 (17.3%) | 141 (29.2%) |
| 35 to 44 Years | 64 (22.5%) | 49 (20.0%) |
| 45 to 54 Years | 79 (27.6%) | 53 (16.9%) |
| 55 to 64 Years | 56 (11.2%) | 96 (19.1%) |
| 65 to 74 Years | 25 (8.6%) | 99 (20.9%) |
| 75 Years and over | 8 (3.4%) | 29 (11.0%) |
| Total | 464 (18.2%) | 549 (18.1%) |
Income Above Poverty by Sex and Age in Bath
According to the poverty statistics in Bath, males aged 5 years and females aged 6 to 11 years are the age groups that are most secure financially, with 100.0% of males and 100.0% of females in these age groups living above the poverty line.
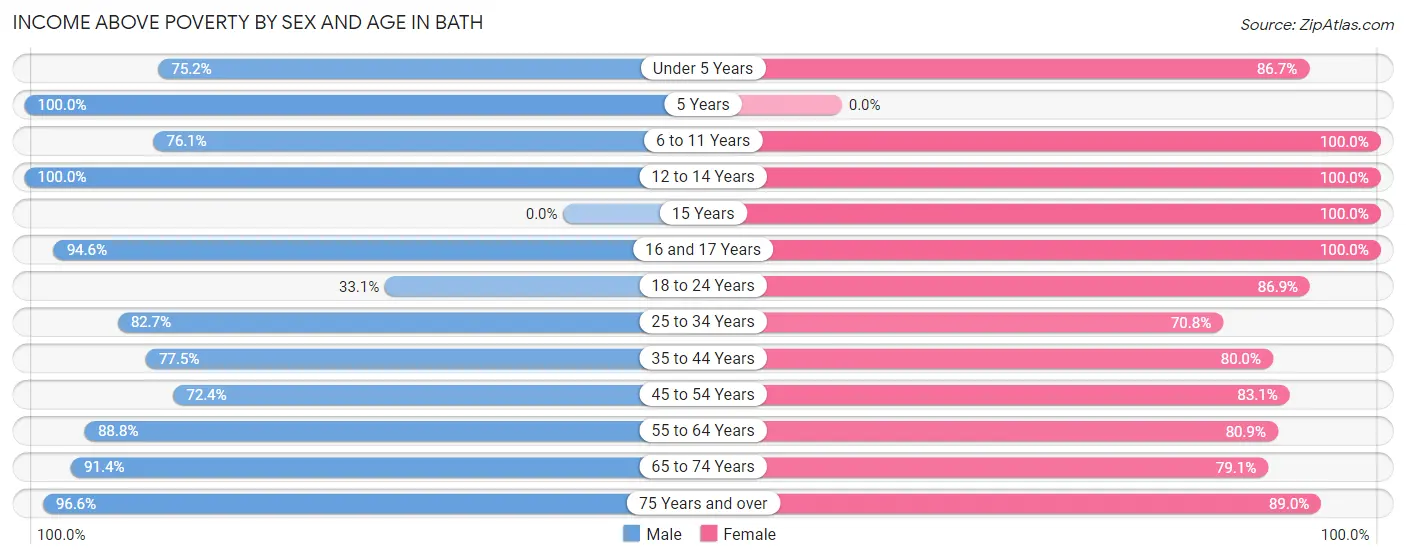
| Age Bracket | Male | Female |
| Under 5 Years | 121 (75.2%) | 150 (86.7%) |
| 5 Years | 52 (100.0%) | 0 (0.0%) |
| 6 to 11 Years | 105 (76.1%) | 181 (100.0%) |
| 12 to 14 Years | 73 (100.0%) | 56 (100.0%) |
| 15 Years | 0 (0.0%) | 27 (100.0%) |
| 16 and 17 Years | 35 (94.6%) | 11 (100.0%) |
| 18 to 24 Years | 48 (33.1%) | 245 (86.9%) |
| 25 to 34 Years | 287 (82.7%) | 341 (70.8%) |
| 35 to 44 Years | 220 (77.5%) | 196 (80.0%) |
| 45 to 54 Years | 207 (72.4%) | 261 (83.1%) |
| 55 to 64 Years | 443 (88.8%) | 407 (80.9%) |
| 65 to 74 Years | 264 (91.3%) | 375 (79.1%) |
| 75 Years and over | 228 (96.6%) | 234 (89.0%) |
| Total | 2,083 (81.8%) | 2,484 (81.9%) |
Income Below Poverty Among Married-Couple Families in Bath
The poverty statistics for married-couple families in Bath show that 6.9% or 66 of the total 956 families live below the poverty line. Families with no children have the highest poverty rate of 9.2%, comprising of 66 families. On the other hand, families with 1 or 2 children have the lowest poverty rate of 0.0%, which includes 0 families.
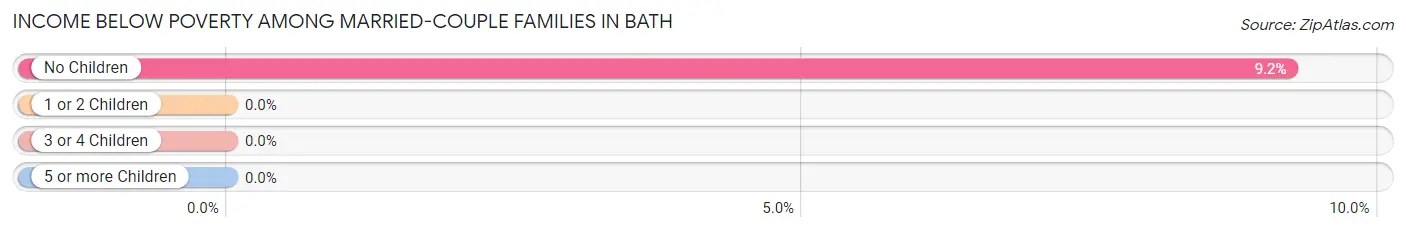
| Children | Above Poverty | Below Poverty |
| No Children | 649 (90.8%) | 66 (9.2%) |
| 1 or 2 Children | 167 (100.0%) | 0 (0.0%) |
| 3 or 4 Children | 74 (100.0%) | 0 (0.0%) |
| 5 or more Children | 0 (0.0%) | 0 (0.0%) |
| Total | 890 (93.1%) | 66 (6.9%) |
Income Below Poverty Among Single-Parent Households in Bath
According to the poverty data in Bath, 6.7% or 10 single-father households and 25.9% or 73 single-mother households are living below the poverty line. Among single-father households, those with 1 or 2 children have the highest poverty rate, with 10 households (14.5%) experiencing poverty. Likewise, among single-mother households, those with 3 or 4 children have the highest poverty rate, with 20 households (51.3%) falling below the poverty line.
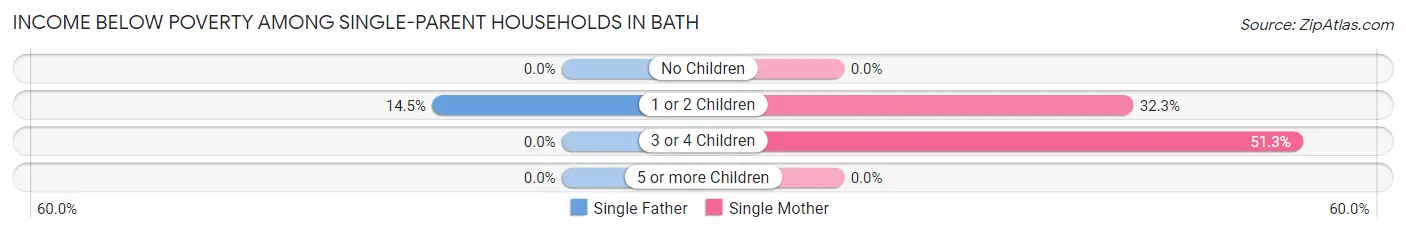
| Children | Single Father | Single Mother |
| No Children | 0 (0.0%) | 0 (0.0%) |
| 1 or 2 Children | 10 (14.5%) | 53 (32.3%) |
| 3 or 4 Children | 0 (0.0%) | 20 (51.3%) |
| 5 or more Children | 0 (0.0%) | 0 (0.0%) |
| Total | 10 (6.7%) | 73 (25.9%) |
Income Below Poverty Among Married-Couple vs Single-Parent Households in Bath
The poverty data for Bath shows that 66 of the married-couple family households (6.9%) and 83 of the single-parent households (19.3%) are living below the poverty level. Within the married-couple family households, those with no children have the highest poverty rate, with 66 households (9.2%) falling below the poverty line. Among the single-parent households, those with 3 or 4 children have the highest poverty rate, with 20 household (33.3%) living below poverty.
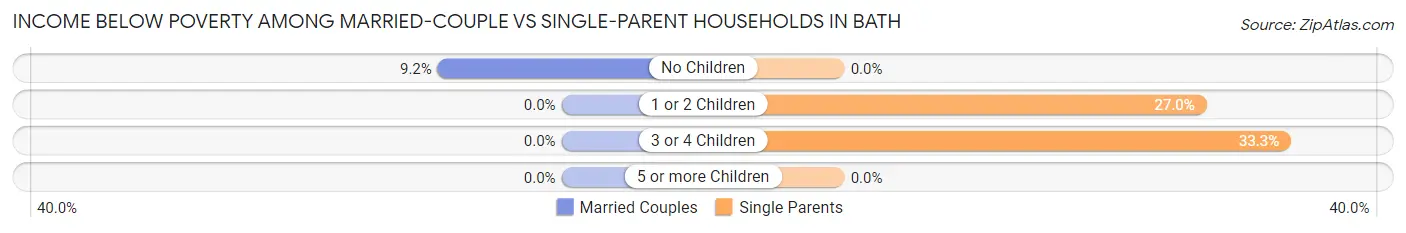
| Children | Married-Couple Families | Single-Parent Households |
| No Children | 66 (9.2%) | 0 (0.0%) |
| 1 or 2 Children | 0 (0.0%) | 63 (27.0%) |
| 3 or 4 Children | 0 (0.0%) | 20 (33.3%) |
| 5 or more Children | 0 (0.0%) | 0 (0.0%) |
| Total | 66 (6.9%) | 83 (19.3%) |
Race in Bath
The most populous races in Bath are White / Caucasian (5,237 | 93.4%), Black / African American (196 | 3.5%), and Two or more Races (153 | 2.7%).
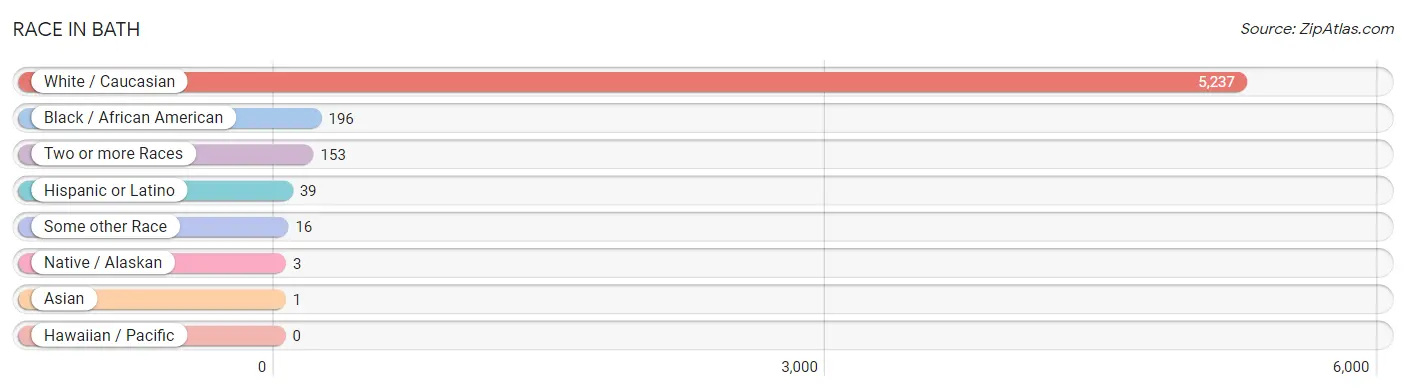
| Race | # Population | % Population |
| Asian | 1 | 0.0% |
| Black / African American | 196 | 3.5% |
| Hawaiian / Pacific | 0 | 0.0% |
| Hispanic or Latino | 39 | 0.7% |
| Native / Alaskan | 3 | 0.1% |
| White / Caucasian | 5,237 | 93.4% |
| Two or more Races | 153 | 2.7% |
| Some other Race | 16 | 0.3% |
| Total | 5,606 | 100.0% |
Ancestry in Bath
The most populous ancestries reported in Bath are English (984 | 17.5%), Irish (928 | 16.6%), German (724 | 12.9%), American (365 | 6.5%), and Polish (356 | 6.4%), together accounting for 59.9% of all Bath residents.
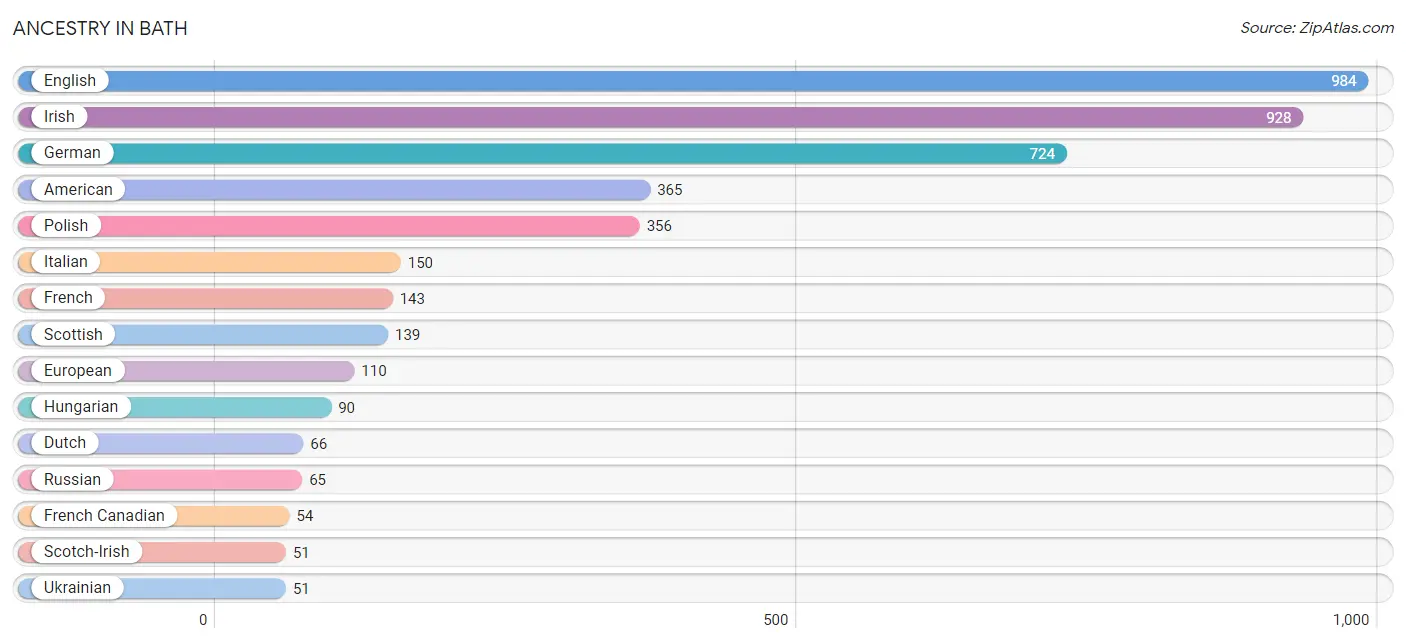
| Ancestry | # Population | % Population |
| African | 6 | 0.1% |
| American | 365 | 6.5% |
| Arab | 6 | 0.1% |
| Barbadian | 5 | 0.1% |
| British | 7 | 0.1% |
| Central American | 1 | 0.0% |
| Dutch | 66 | 1.2% |
| English | 984 | 17.5% |
| European | 110 | 2.0% |
| French | 143 | 2.5% |
| French Canadian | 54 | 1.0% |
| German | 724 | 12.9% |
| Guatemalan | 1 | 0.0% |
| Hungarian | 90 | 1.6% |
| Irish | 928 | 16.6% |
| Iroquois | 13 | 0.2% |
| Italian | 150 | 2.7% |
| Lebanese | 6 | 0.1% |
| Mexican | 31 | 0.5% |
| Northern European | 17 | 0.3% |
| Norwegian | 8 | 0.1% |
| Pennsylvania German | 17 | 0.3% |
| Polish | 356 | 6.4% |
| Russian | 65 | 1.2% |
| Scandinavian | 25 | 0.4% |
| Scotch-Irish | 51 | 0.9% |
| Scottish | 139 | 2.5% |
| Subsaharan African | 6 | 0.1% |
| Swedish | 8 | 0.1% |
| Thai | 1 | 0.0% |
| Ukrainian | 51 | 0.9% |
| Welsh | 11 | 0.2% | View All 32 Rows |
Immigrants in Bath
The most numerous immigrant groups reported in Bath came from Europe (37 | 0.7%), Western Europe (37 | 0.7%), Germany (25 | 0.4%), Netherlands (12 | 0.2%), and Central America (1 | 0.0%), together accounting for 2.0% of all Bath residents.
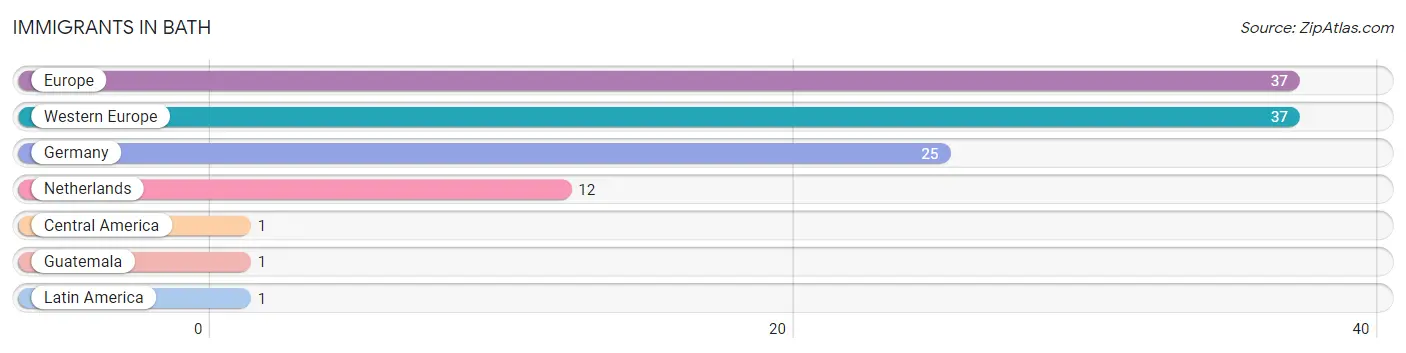
| Immigration Origin | # Population | % Population |
| Central America | 1 | 0.0% |
| Europe | 37 | 0.7% |
| Germany | 25 | 0.4% |
| Guatemala | 1 | 0.0% |
| Latin America | 1 | 0.0% |
| Netherlands | 12 | 0.2% |
| Western Europe | 37 | 0.7% | View All 7 Rows |
Sex and Age in Bath
Sex and Age in Bath
The most populous age groups in Bath are 60 to 64 Years (326 | 12.7%) for men and 65 to 69 Years (301 | 9.9%) for women.
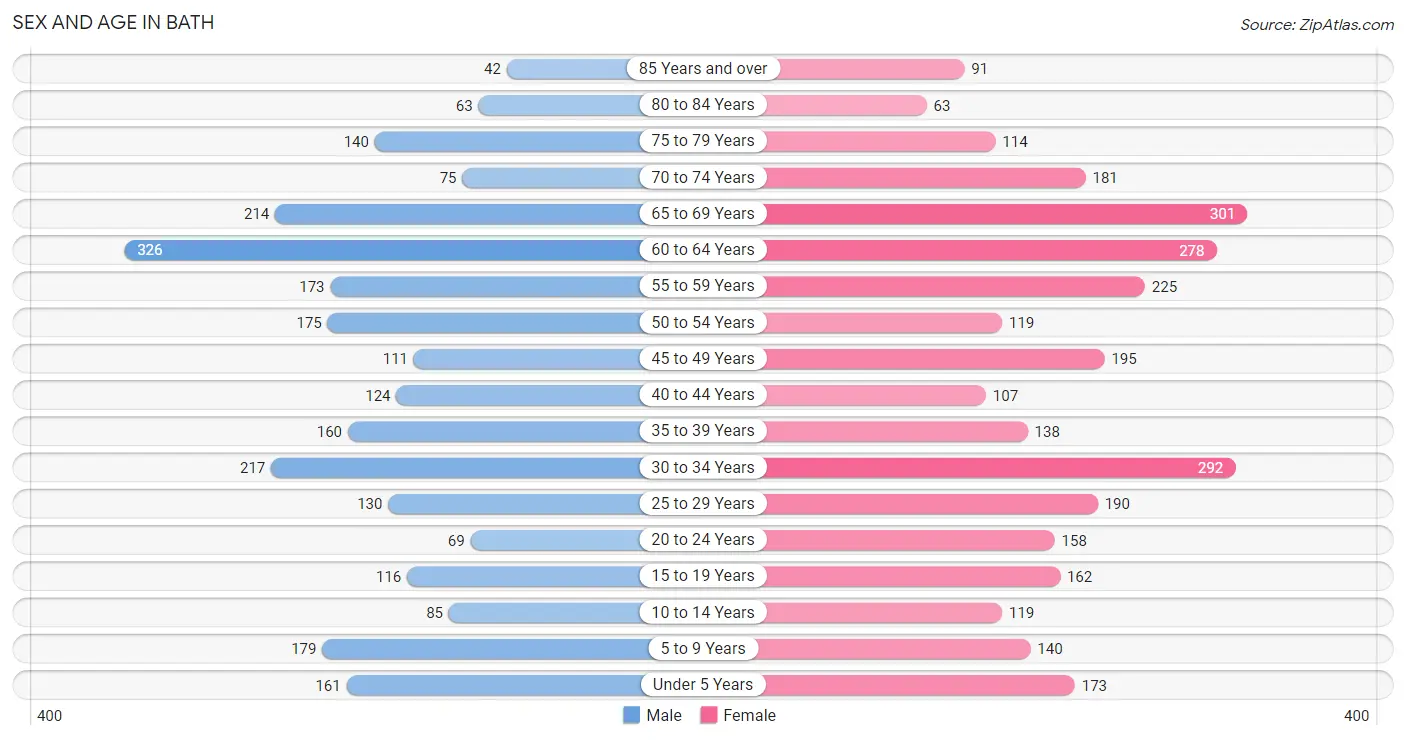
| Age Bracket | Male | Female |
| Under 5 Years | 161 (6.3%) | 173 (5.7%) |
| 5 to 9 Years | 179 (7.0%) | 140 (4.6%) |
| 10 to 14 Years | 85 (3.3%) | 119 (3.9%) |
| 15 to 19 Years | 116 (4.5%) | 162 (5.3%) |
| 20 to 24 Years | 69 (2.7%) | 158 (5.2%) |
| 25 to 29 Years | 130 (5.1%) | 190 (6.2%) |
| 30 to 34 Years | 217 (8.5%) | 292 (9.6%) |
| 35 to 39 Years | 160 (6.2%) | 138 (4.5%) |
| 40 to 44 Years | 124 (4.8%) | 107 (3.5%) |
| 45 to 49 Years | 111 (4.3%) | 195 (6.4%) |
| 50 to 54 Years | 175 (6.8%) | 119 (3.9%) |
| 55 to 59 Years | 173 (6.8%) | 225 (7.4%) |
| 60 to 64 Years | 326 (12.7%) | 278 (9.1%) |
| 65 to 69 Years | 214 (8.4%) | 301 (9.9%) |
| 70 to 74 Years | 75 (2.9%) | 181 (5.9%) |
| 75 to 79 Years | 140 (5.5%) | 114 (3.7%) |
| 80 to 84 Years | 63 (2.5%) | 63 (2.1%) |
| 85 Years and over | 42 (1.6%) | 91 (3.0%) |
| Total | 2,560 (100.0%) | 3,046 (100.0%) |
Families and Households in Bath
Median Family Size in Bath
The median family size in Bath is 2.72 persons per family, with single female/mother families (282 | 20.3%) accounting for the largest median family size of 2.85 persons per family. On the other hand, single male/father families (149 | 10.7%) represent the smallest median family size with 2.62 persons per family.
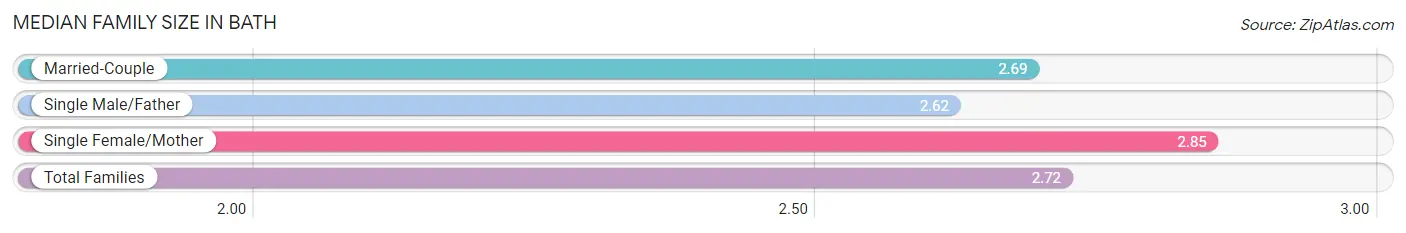
| Family Type | # Families | Family Size |
| Married-Couple | 956 (68.9%) | 2.69 |
| Single Male/Father | 149 (10.7%) | 2.62 |
| Single Female/Mother | 282 (20.3%) | 2.85 |
| Total Families | 1,387 (100.0%) | 2.72 |
Median Household Size in Bath
The median household size in Bath is 1.95 persons per household, with single female/mother households (282 | 10.0%) accounting for the largest median household size of 3.12 persons per household. non-family households (1,437 | 50.9%) represent the smallest median household size with 1.14 persons per household.
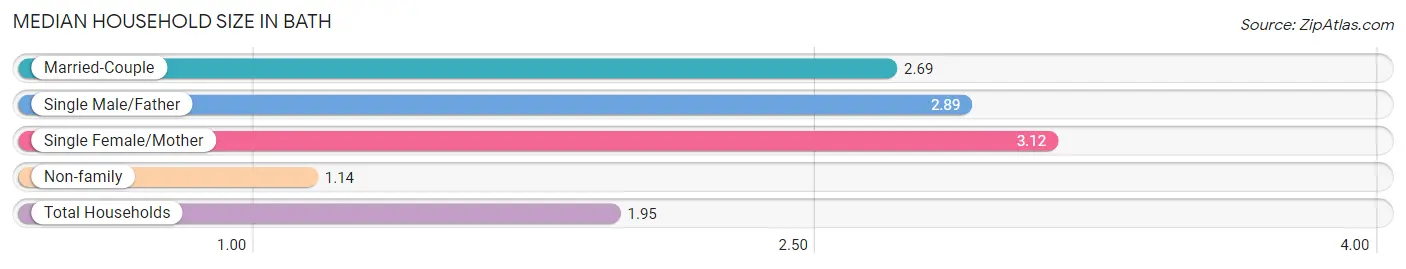
| Household Type | # Households | Household Size |
| Married-Couple | 956 (33.9%) | 2.69 |
| Single Male/Father | 149 (5.3%) | 2.89 |
| Single Female/Mother | 282 (10.0%) | 3.12 |
| Non-family | 1,437 (50.9%) | 1.14 |
| Total Households | 2,824 (100.0%) | 1.95 |
Household Size by Marriage Status in Bath
Out of a total of 2,824 households in Bath, 1,387 (49.1%) are family households, while 1,437 (50.9%) are nonfamily households. The most numerous type of family households are 2-person households, comprising 813, and the most common type of nonfamily households are 1-person households, comprising 1,240.
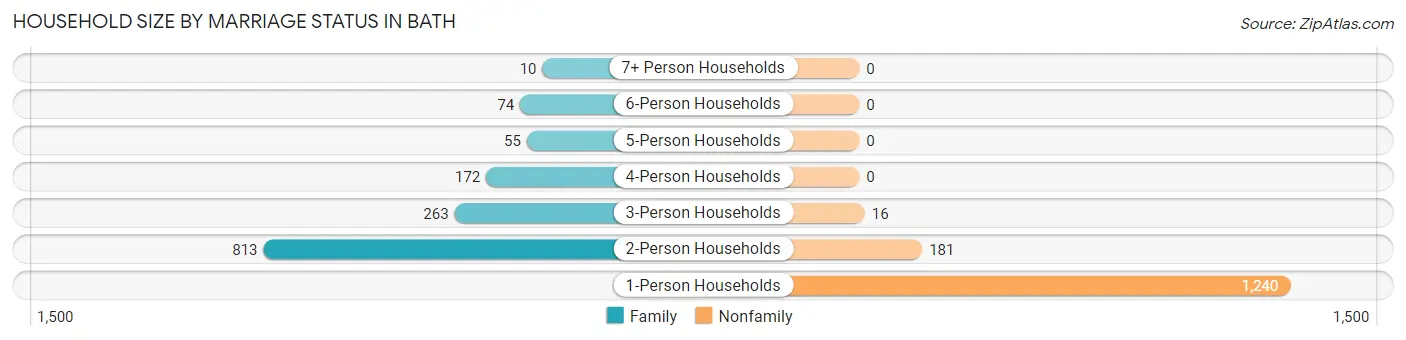
| Household Size | Family Households | Nonfamily Households |
| 1-Person Households | - | 1,240 (43.9%) |
| 2-Person Households | 813 (28.8%) | 181 (6.4%) |
| 3-Person Households | 263 (9.3%) | 16 (0.6%) |
| 4-Person Households | 172 (6.1%) | 0 (0.0%) |
| 5-Person Households | 55 (1.9%) | 0 (0.0%) |
| 6-Person Households | 74 (2.6%) | 0 (0.0%) |
| 7+ Person Households | 10 (0.4%) | 0 (0.0%) |
| Total | 1,387 (49.1%) | 1,437 (50.9%) |
Female Fertility in Bath
Fertility by Age in Bath
Average fertility rate in Bath is 45.0 births per 1,000 women. Women in the age bracket of 35 to 50 years have the highest fertility rate with 72.0 births per 1,000 women. Women in the age bracket of 35 to 50 years acount for 60.3% of all women with births.
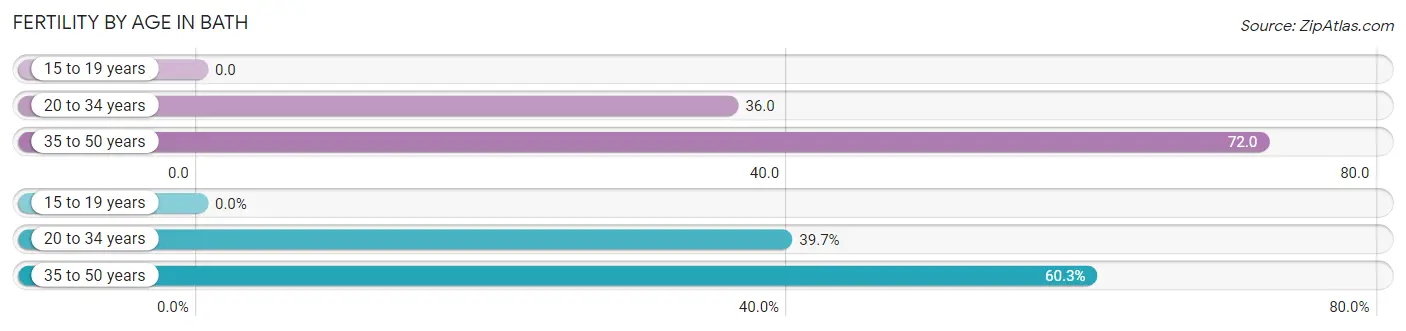
| Age Bracket | Women with Births | Births / 1,000 Women |
| 15 to 19 years | 0 (0.0%) | 0.0 |
| 20 to 34 years | 23 (39.7%) | 36.0 |
| 35 to 50 years | 35 (60.3%) | 72.0 |
| Total | 58 (100.0%) | 45.0 |
Fertility by Age by Marriage Status in Bath
79.3% of women with births (58) in Bath are married. The highest percentage of unmarried women with births falls into 20 to 34 years age bracket with 52.2% of them unmarried at the time of birth, while the lowest percentage of unmarried women with births belong to 35 to 50 years age bracket with 0.0% of them unmarried.
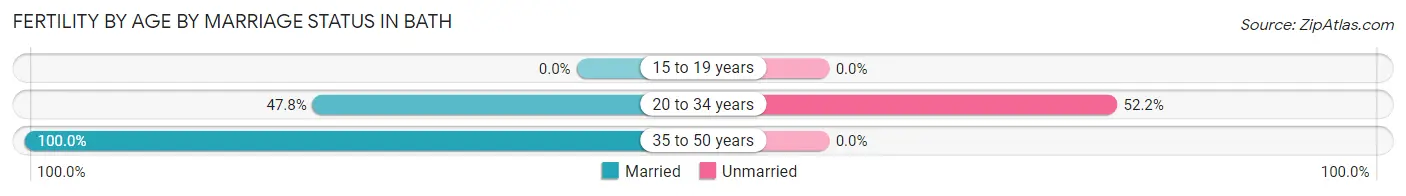
| Age Bracket | Married | Unmarried |
| 15 to 19 years | 0 (0.0%) | 0 (0.0%) |
| 20 to 34 years | 11 (47.8%) | 12 (52.2%) |
| 35 to 50 years | 35 (100.0%) | 0 (0.0%) |
| Total | 46 (79.3%) | 12 (20.7%) |
Fertility by Education in Bath
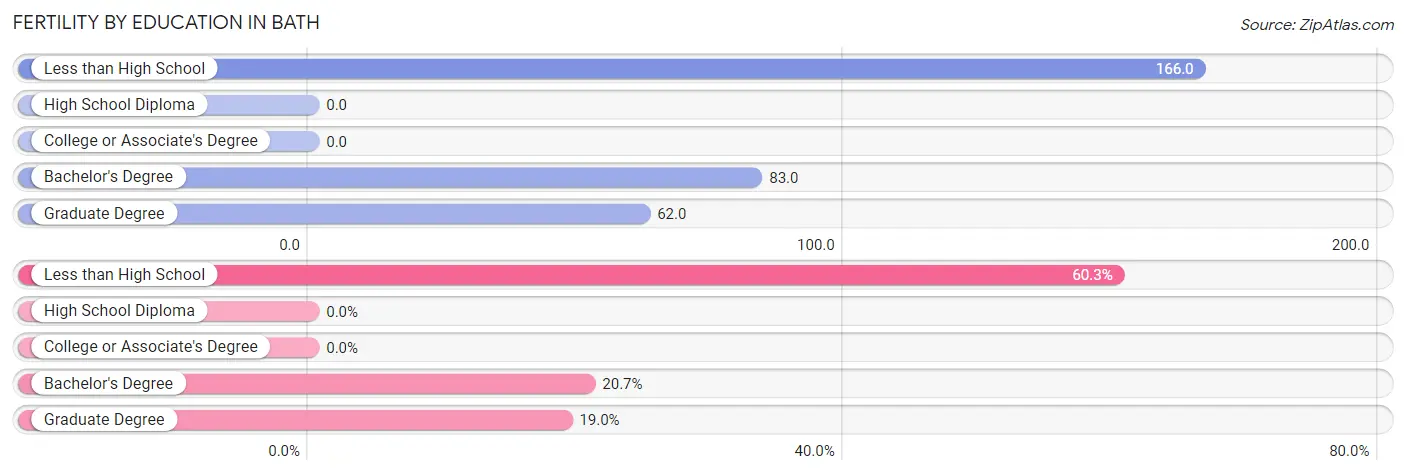
| Educational Attainment | Women with Births | Births / 1,000 Women |
| Less than High School | 35 (60.3%) | 166.0 |
| High School Diploma | 0 (0.0%) | 0.0 |
| College or Associate's Degree | 0 (0.0%) | 0.0 |
| Bachelor's Degree | 12 (20.7%) | 83.0 |
| Graduate Degree | 11 (19.0%) | 62.0 |
| Total | 58 (100.0%) | 45.0 |
Fertility by Education by Marriage Status in Bath
20.7% of women with births in Bath are unmarried. Women with the educational attainment of less than high school are most likely to be married with 100.0% of them married at childbirth, while women with the educational attainment of bachelor's degree are least likely to be married with 100.0% of them unmarried at childbirth.
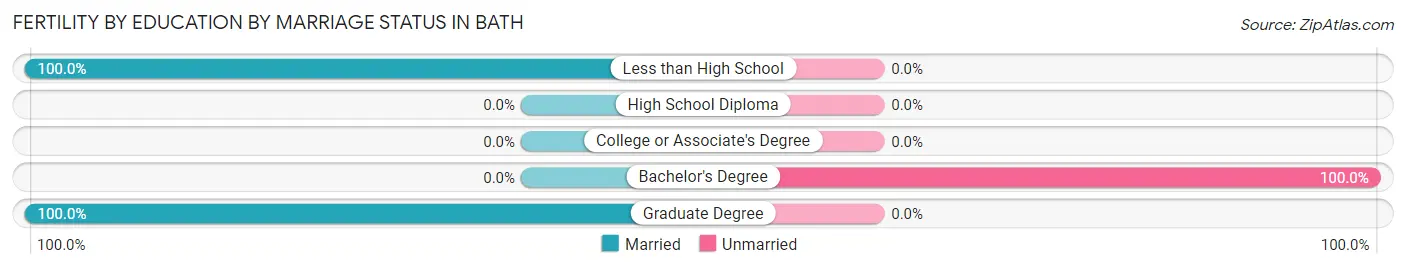
| Educational Attainment | Married | Unmarried |
| Less than High School | 35 (100.0%) | 0 (0.0%) |
| High School Diploma | 0 (0.0%) | 0 (0.0%) |
| College or Associate's Degree | 0 (0.0%) | 0 (0.0%) |
| Bachelor's Degree | 0 (0.0%) | 12 (100.0%) |
| Graduate Degree | 11 (100.0%) | 0 (0.0%) |
| Total | 46 (79.3%) | 12 (20.7%) |
Employment Characteristics in Bath
Employment by Class of Employer in Bath
Among the 2,320 employed individuals in Bath, private company employees (1,400 | 60.3%), not-for-profit organizations (331 | 14.3%), and local government employees (255 | 11.0%) make up the most common classes of employment.
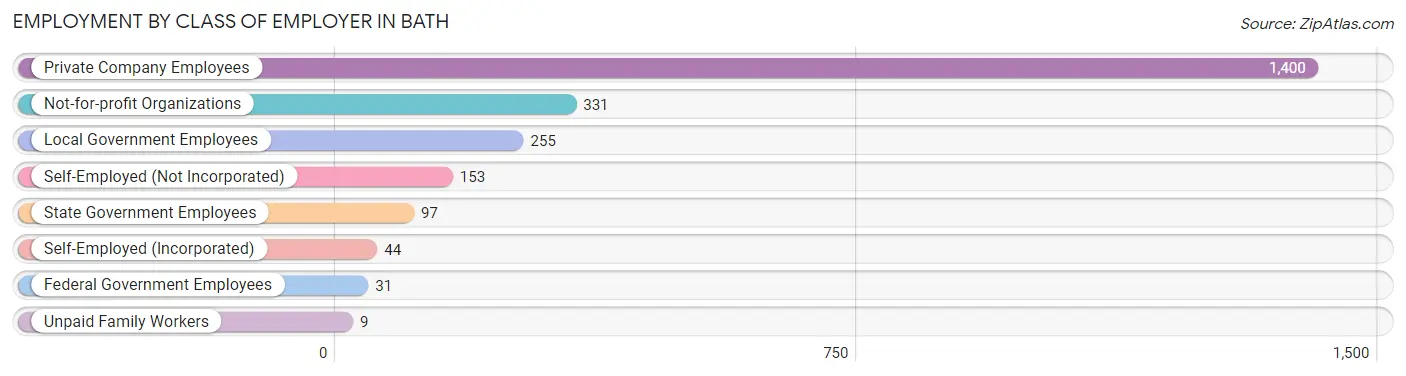
| Employer Class | # Employees | % Employees |
| Private Company Employees | 1,400 | 60.3% |
| Self-Employed (Incorporated) | 44 | 1.9% |
| Self-Employed (Not Incorporated) | 153 | 6.6% |
| Not-for-profit Organizations | 331 | 14.3% |
| Local Government Employees | 255 | 11.0% |
| State Government Employees | 97 | 4.2% |
| Federal Government Employees | 31 | 1.3% |
| Unpaid Family Workers | 9 | 0.4% |
| Total | 2,320 | 100.0% |
Employment Status by Age in Bath
According to the labor force statistics for Bath, out of the total population over 16 years of age (4,722), 54.3% or 2,564 individuals are in the labor force, with 6.9% or 177 of them unemployed. The age group with the highest labor force participation rate is 20 to 24 years, with 94.3% or 214 individuals in the labor force. Within the labor force, the 16 to 19 years age range has the highest percentage of unemployed individuals, with 17.3% or 26 of them being unemployed.
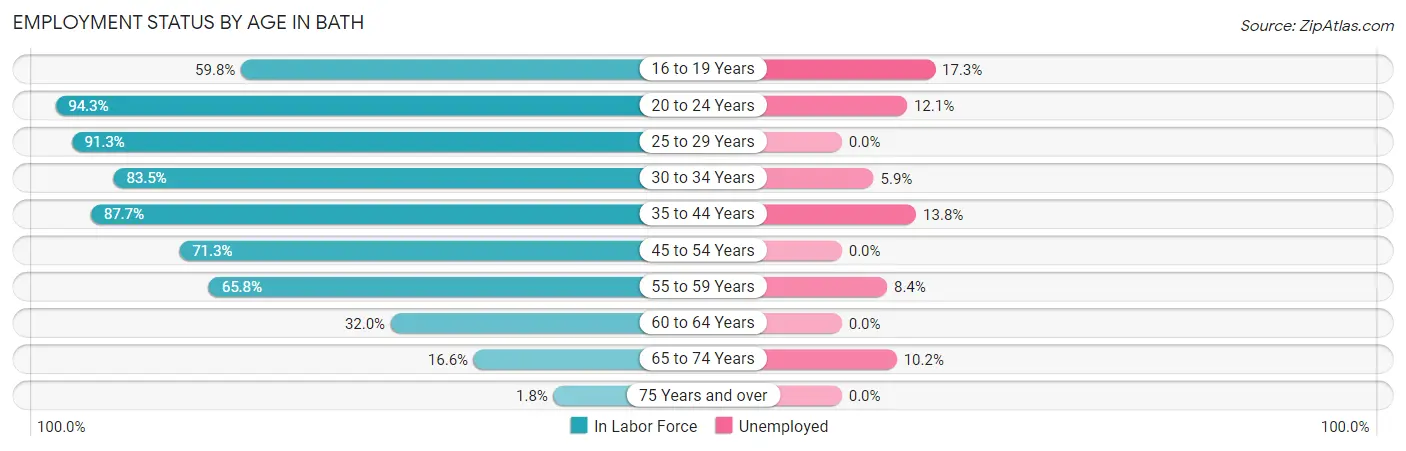
| Age Bracket | In Labor Force | Unemployed |
| 16 to 19 Years | 150 (59.8%) | 26 (17.3%) |
| 20 to 24 Years | 214 (94.3%) | 26 (12.1%) |
| 25 to 29 Years | 292 (91.3%) | 0 (0.0%) |
| 30 to 34 Years | 425 (83.5%) | 25 (5.9%) |
| 35 to 44 Years | 464 (87.7%) | 64 (13.8%) |
| 45 to 54 Years | 428 (71.3%) | 0 (0.0%) |
| 55 to 59 Years | 262 (65.8%) | 22 (8.4%) |
| 60 to 64 Years | 193 (32.0%) | 0 (0.0%) |
| 65 to 74 Years | 128 (16.6%) | 13 (10.2%) |
| 75 Years and over | 9 (1.8%) | 0 (0.0%) |
| Total | 2,564 (54.3%) | 177 (6.9%) |
Employment Status by Educational Attainment in Bath
According to labor force statistics for Bath, 69.7% of individuals (2,063) out of the total population between 25 and 64 years of age (2,960) are in the labor force, with 5.4% or 111 of them being unemployed. The group with the highest labor force participation rate are those with the educational attainment of bachelor's degree or higher, with 84.1% or 493 individuals in the labor force. Within the labor force, individuals with less than high school education have the highest percentage of unemployment, with 22.6% or 24 of them being unemployed.
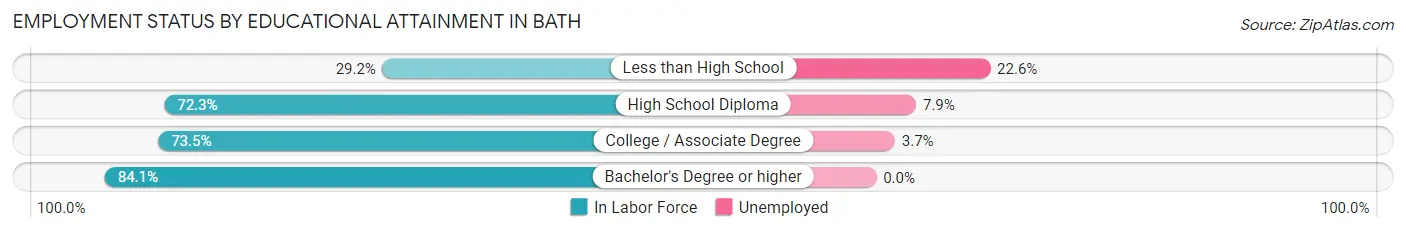
| Educational Attainment | In Labor Force | Unemployed |
| Less than High School | 106 (29.2%) | 82 (22.6%) |
| High School Diploma | 784 (72.3%) | 86 (7.9%) |
| College / Associate Degree | 681 (73.5%) | 34 (3.7%) |
| Bachelor's Degree or higher | 493 (84.1%) | 0 (0.0%) |
| Total | 2,063 (69.7%) | 160 (5.4%) |
Employment Occupations by Sex in Bath
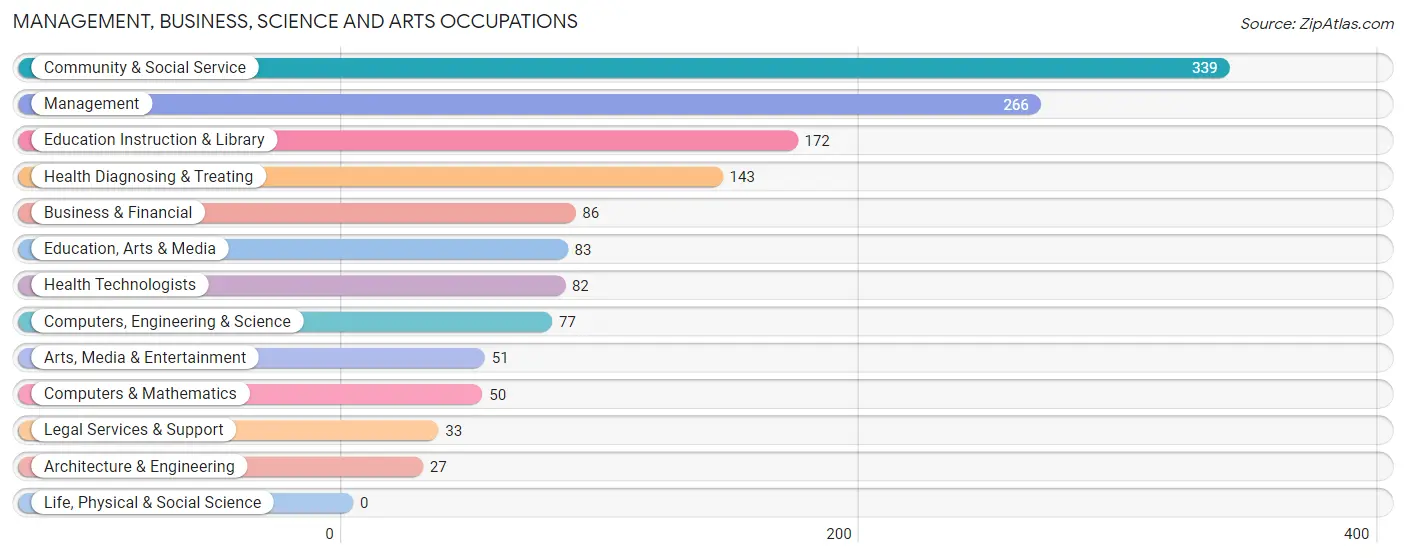
Management, Business, Science and Arts Occupations
The most common Management, Business, Science and Arts occupations in Bath are Community & Social Service (339 | 14.2%), Management (266 | 11.1%), Education Instruction & Library (172 | 7.2%), Health Diagnosing & Treating (143 | 6.0%), and Business & Financial (86 | 3.6%).
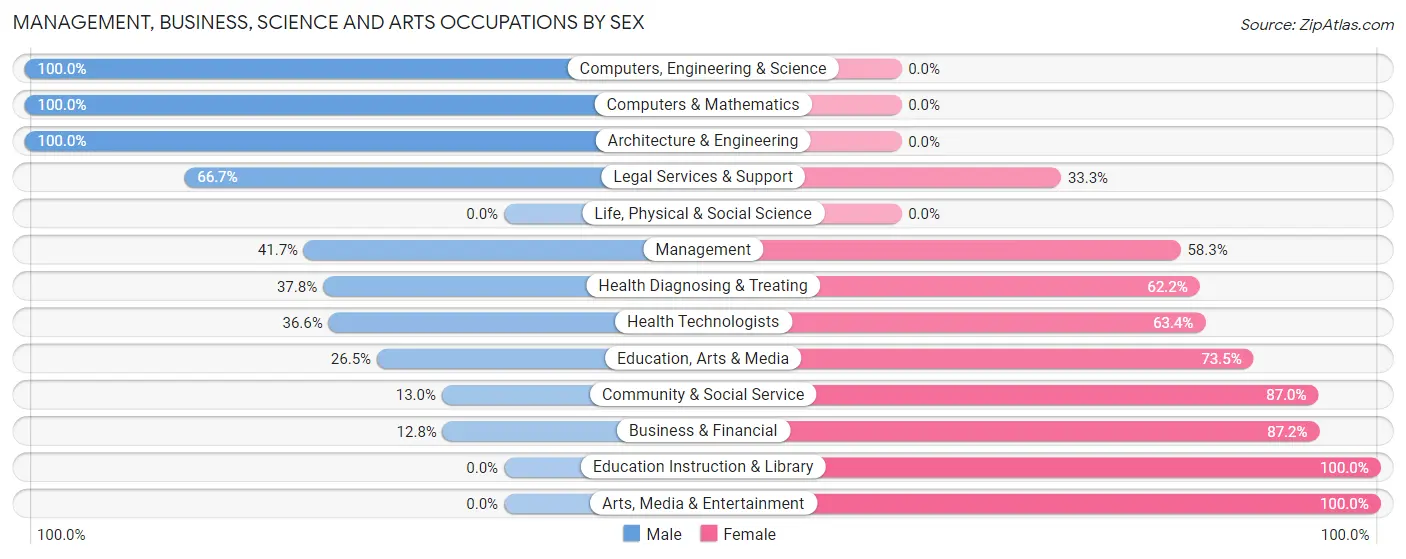
Management, Business, Science and Arts Occupations by Sex
Within the Management, Business, Science and Arts occupations in Bath, the most male-oriented occupations are Computers, Engineering & Science (100.0%), Computers & Mathematics (100.0%), and Architecture & Engineering (100.0%), while the most female-oriented occupations are Education Instruction & Library (100.0%), Arts, Media & Entertainment (100.0%), and Business & Financial (87.2%).
| Occupation | Male | Female |
| Management | 111 (41.7%) | 155 (58.3%) |
| Business & Financial | 11 (12.8%) | 75 (87.2%) |
| Computers, Engineering & Science | 77 (100.0%) | 0 (0.0%) |
| Computers & Mathematics | 50 (100.0%) | 0 (0.0%) |
| Architecture & Engineering | 27 (100.0%) | 0 (0.0%) |
| Life, Physical & Social Science | 0 (0.0%) | 0 (0.0%) |
| Community & Social Service | 44 (13.0%) | 295 (87.0%) |
| Education, Arts & Media | 22 (26.5%) | 61 (73.5%) |
| Legal Services & Support | 22 (66.7%) | 11 (33.3%) |
| Education Instruction & Library | 0 (0.0%) | 172 (100.0%) |
| Arts, Media & Entertainment | 0 (0.0%) | 51 (100.0%) |
| Health Diagnosing & Treating | 54 (37.8%) | 89 (62.2%) |
| Health Technologists | 30 (36.6%) | 52 (63.4%) |
| Total (Category) | 297 (32.6%) | 614 (67.4%) |
| Total (Overall) | 1,102 (46.1%) | 1,287 (53.9%) |
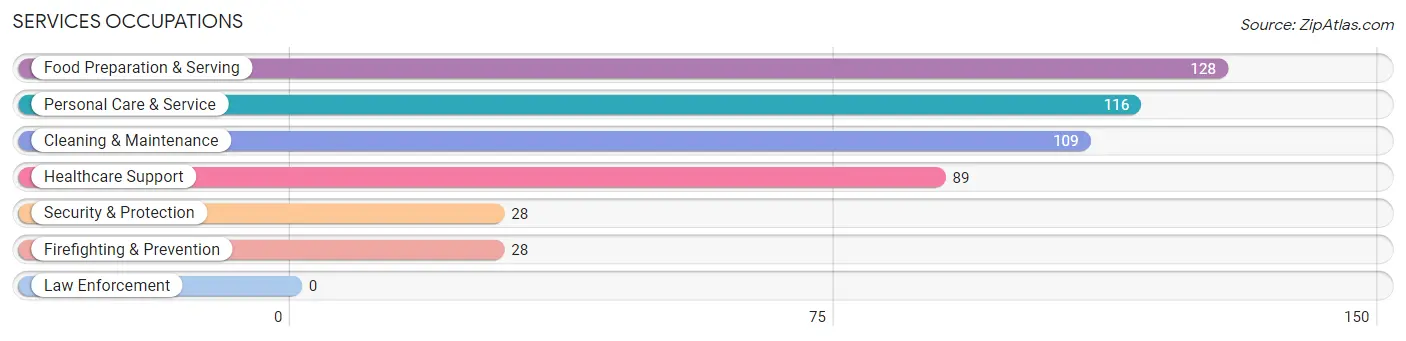
Services Occupations
The most common Services occupations in Bath are Food Preparation & Serving (128 | 5.4%), Personal Care & Service (116 | 4.9%), Cleaning & Maintenance (109 | 4.6%), Healthcare Support (89 | 3.7%), and Security & Protection (28 | 1.2%).
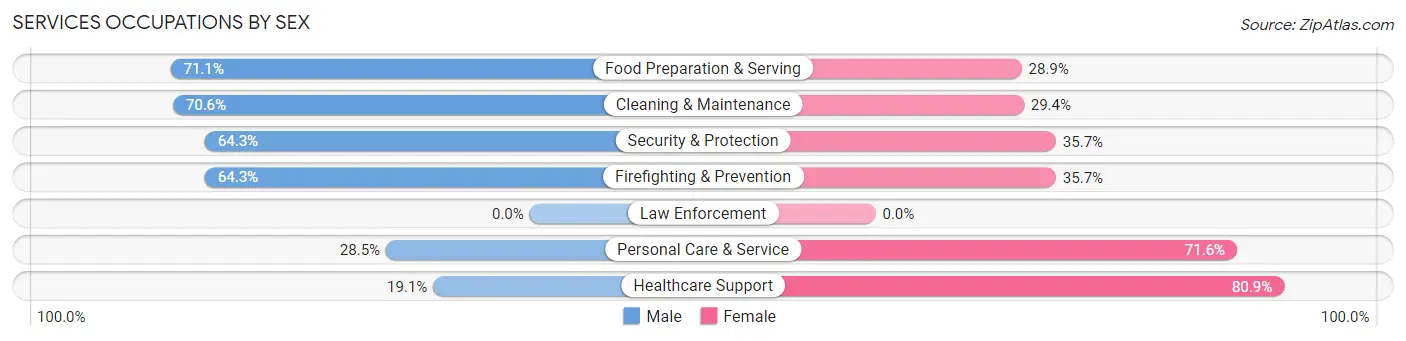
Services Occupations by Sex
Within the Services occupations in Bath, the most male-oriented occupations are Food Preparation & Serving (71.1%), Cleaning & Maintenance (70.6%), and Security & Protection (64.3%), while the most female-oriented occupations are Healthcare Support (80.9%), Personal Care & Service (71.6%), and Security & Protection (35.7%).
| Occupation | Male | Female |
| Healthcare Support | 17 (19.1%) | 72 (80.9%) |
| Security & Protection | 18 (64.3%) | 10 (35.7%) |
| Firefighting & Prevention | 18 (64.3%) | 10 (35.7%) |
| Law Enforcement | 0 (0.0%) | 0 (0.0%) |
| Food Preparation & Serving | 91 (71.1%) | 37 (28.9%) |
| Cleaning & Maintenance | 77 (70.6%) | 32 (29.4%) |
| Personal Care & Service | 33 (28.4%) | 83 (71.6%) |
| Total (Category) | 236 (50.2%) | 234 (49.8%) |
| Total (Overall) | 1,102 (46.1%) | 1,287 (53.9%) |
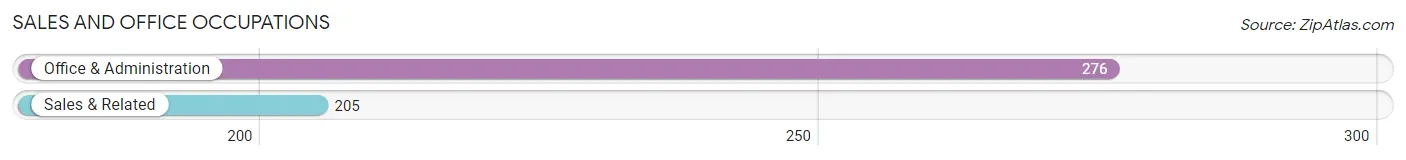
Sales and Office Occupations
The most common Sales and Office occupations in Bath are Office & Administration (276 | 11.6%), and Sales & Related (205 | 8.6%).
Sales and Office Occupations by Sex
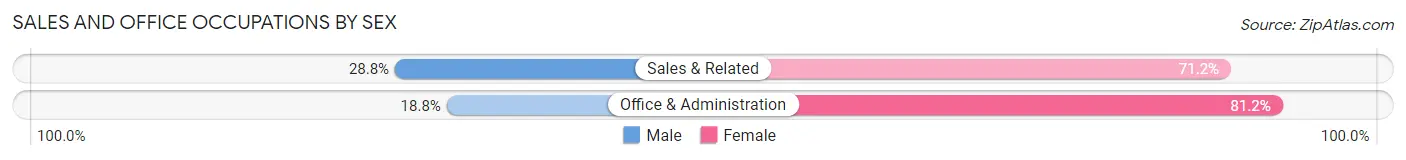
| Occupation | Male | Female |
| Sales & Related | 59 (28.8%) | 146 (71.2%) |
| Office & Administration | 52 (18.8%) | 224 (81.2%) |
| Total (Category) | 111 (23.1%) | 370 (76.9%) |
| Total (Overall) | 1,102 (46.1%) | 1,287 (53.9%) |
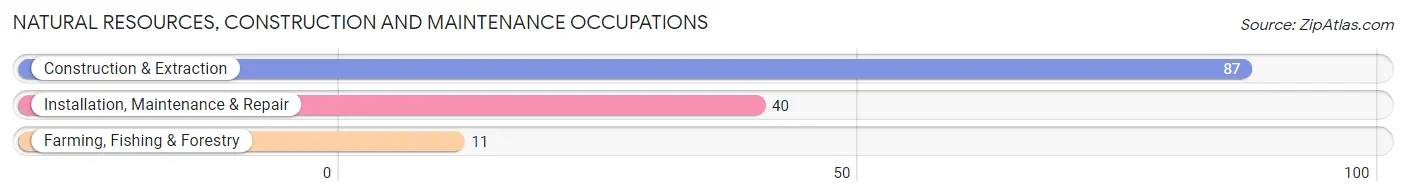
Natural Resources, Construction and Maintenance Occupations
The most common Natural Resources, Construction and Maintenance occupations in Bath are Construction & Extraction (87 | 3.6%), Installation, Maintenance & Repair (40 | 1.7%), and Farming, Fishing & Forestry (11 | 0.5%).
Natural Resources, Construction and Maintenance Occupations by Sex
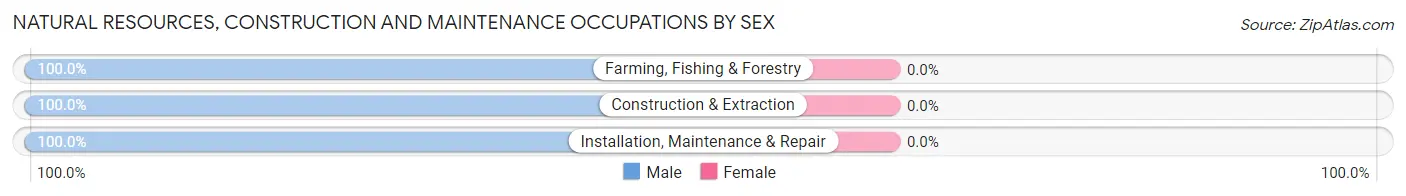
| Occupation | Male | Female |
| Farming, Fishing & Forestry | 11 (100.0%) | 0 (0.0%) |
| Construction & Extraction | 87 (100.0%) | 0 (0.0%) |
| Installation, Maintenance & Repair | 40 (100.0%) | 0 (0.0%) |
| Total (Category) | 138 (100.0%) | 0 (0.0%) |
| Total (Overall) | 1,102 (46.1%) | 1,287 (53.9%) |
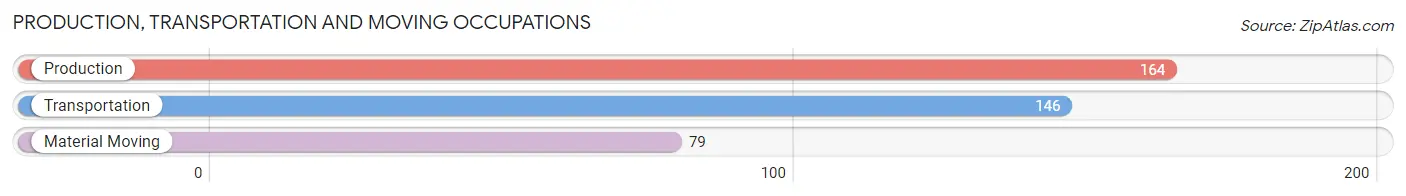
Production, Transportation and Moving Occupations
The most common Production, Transportation and Moving occupations in Bath are Production (164 | 6.9%), Transportation (146 | 6.1%), and Material Moving (79 | 3.3%).
Production, Transportation and Moving Occupations by Sex
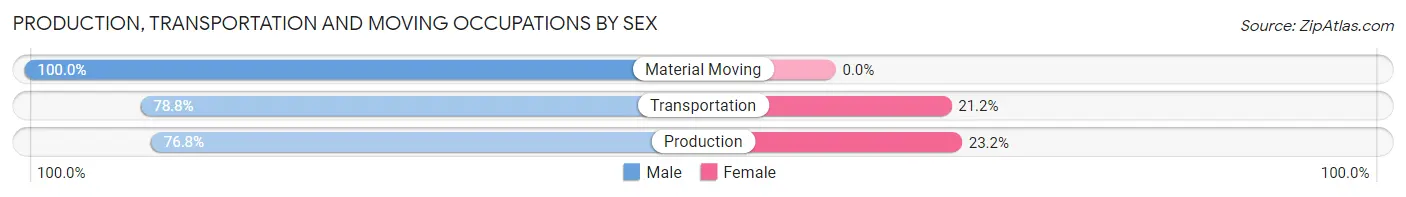
| Occupation | Male | Female |
| Production | 126 (76.8%) | 38 (23.2%) |
| Transportation | 115 (78.8%) | 31 (21.2%) |
| Material Moving | 79 (100.0%) | 0 (0.0%) |
| Total (Category) | 320 (82.3%) | 69 (17.7%) |
| Total (Overall) | 1,102 (46.1%) | 1,287 (53.9%) |
Employment Industries by Sex in Bath
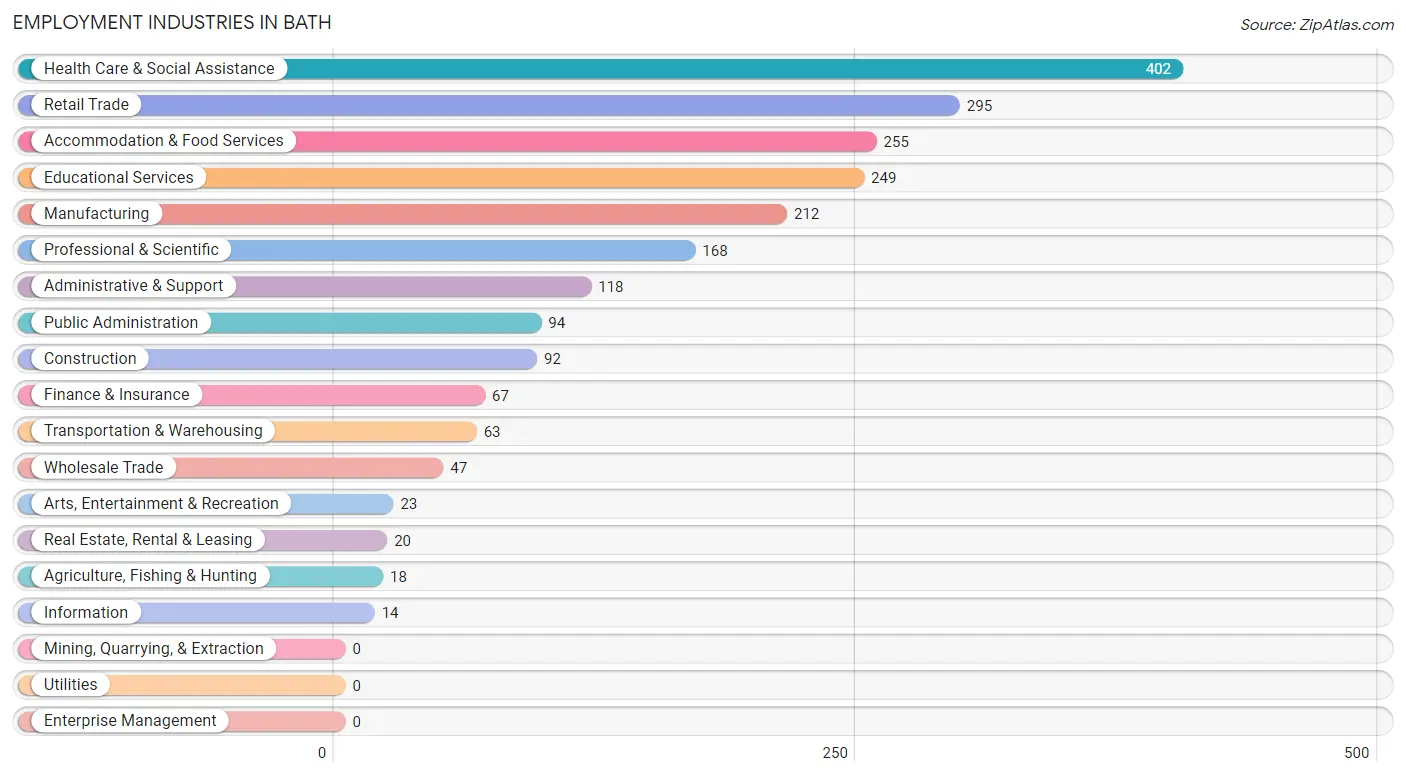
Employment Industries in Bath
The major employment industries in Bath include Health Care & Social Assistance (402 | 16.8%), Retail Trade (295 | 12.3%), Accommodation & Food Services (255 | 10.7%), Educational Services (249 | 10.4%), and Manufacturing (212 | 8.9%).
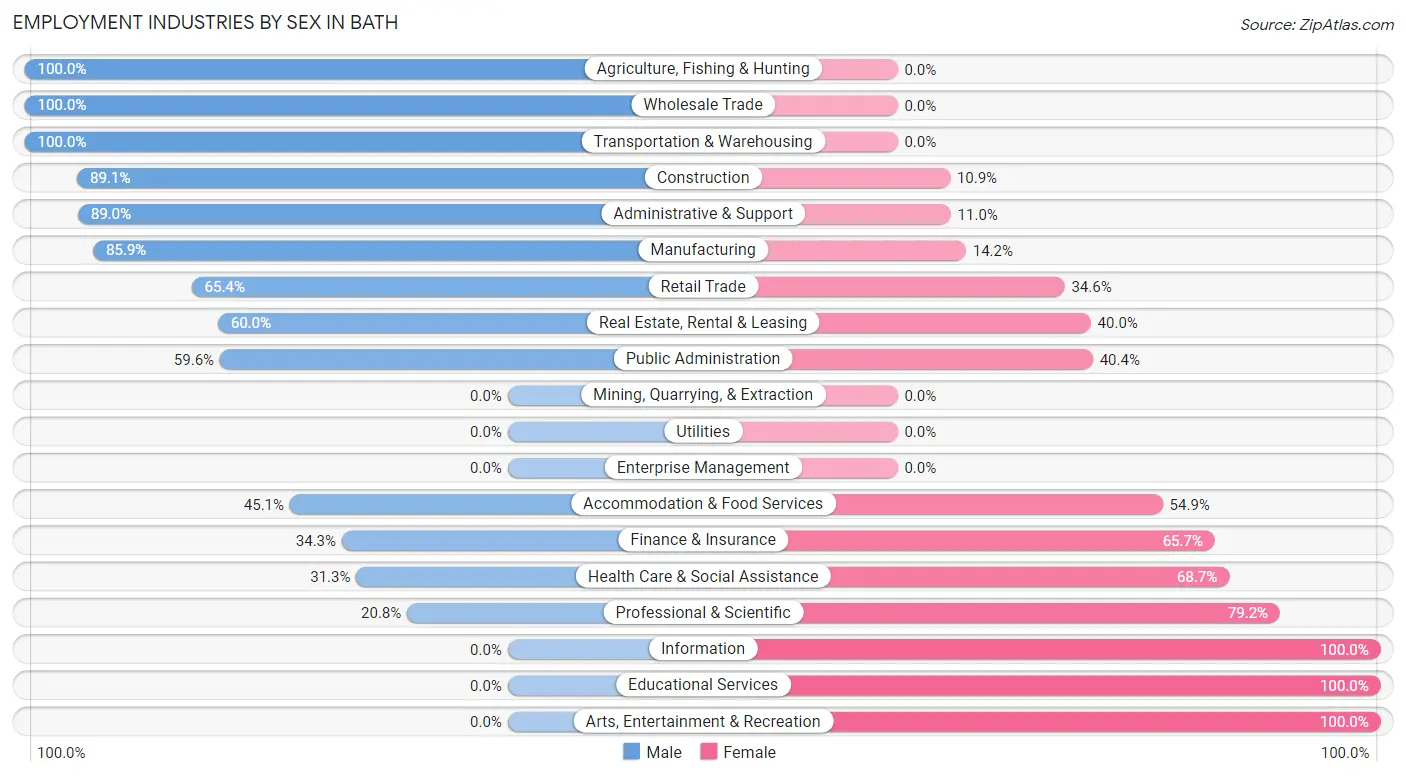
Employment Industries by Sex in Bath
The Bath industries that see more men than women are Agriculture, Fishing & Hunting (100.0%), Wholesale Trade (100.0%), and Transportation & Warehousing (100.0%), whereas the industries that tend to have a higher number of women are Information (100.0%), Educational Services (100.0%), and Arts, Entertainment & Recreation (100.0%).
| Industry | Male | Female |
| Agriculture, Fishing & Hunting | 18 (100.0%) | 0 (0.0%) |
| Mining, Quarrying, & Extraction | 0 (0.0%) | 0 (0.0%) |
| Construction | 82 (89.1%) | 10 (10.9%) |
| Manufacturing | 182 (85.9%) | 30 (14.1%) |
| Wholesale Trade | 47 (100.0%) | 0 (0.0%) |
| Retail Trade | 193 (65.4%) | 102 (34.6%) |
| Transportation & Warehousing | 63 (100.0%) | 0 (0.0%) |
| Utilities | 0 (0.0%) | 0 (0.0%) |
| Information | 0 (0.0%) | 14 (100.0%) |
| Finance & Insurance | 23 (34.3%) | 44 (65.7%) |
| Real Estate, Rental & Leasing | 12 (60.0%) | 8 (40.0%) |
| Professional & Scientific | 35 (20.8%) | 133 (79.2%) |
| Enterprise Management | 0 (0.0%) | 0 (0.0%) |
| Administrative & Support | 105 (89.0%) | 13 (11.0%) |
| Educational Services | 0 (0.0%) | 249 (100.0%) |
| Health Care & Social Assistance | 126 (31.3%) | 276 (68.7%) |
| Arts, Entertainment & Recreation | 0 (0.0%) | 23 (100.0%) |
| Accommodation & Food Services | 115 (45.1%) | 140 (54.9%) |
| Public Administration | 56 (59.6%) | 38 (40.4%) |
| Total | 1,102 (46.1%) | 1,287 (53.9%) |
Education in Bath
School Enrollment in Bath
The most common levels of schooling among the 793 students in Bath are elementary school (242 | 30.5%), middle school (182 | 23.0%), and high school (150 | 18.9%).
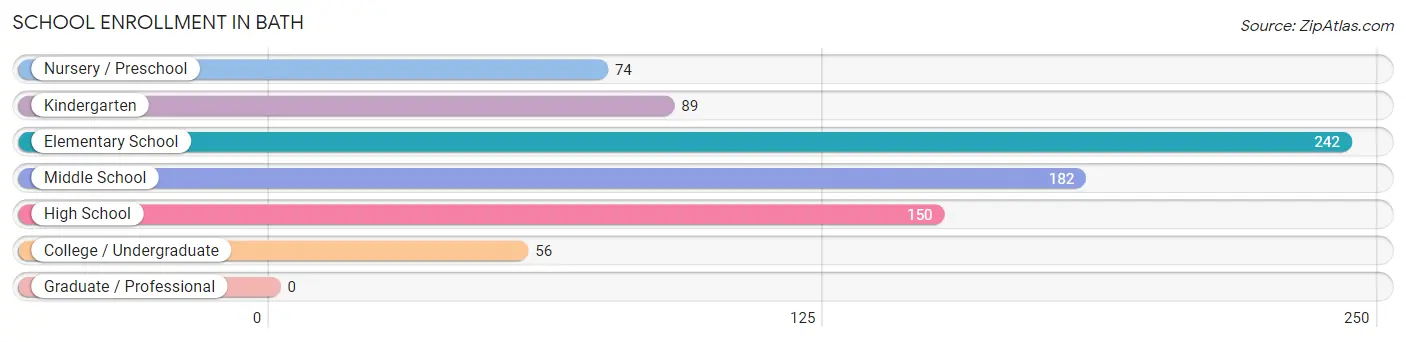
| School Level | # Students | % Students |
| Nursery / Preschool | 74 | 9.3% |
| Kindergarten | 89 | 11.2% |
| Elementary School | 242 | 30.5% |
| Middle School | 182 | 23.0% |
| High School | 150 | 18.9% |
| College / Undergraduate | 56 | 7.1% |
| Graduate / Professional | 0 | 0.0% |
| Total | 793 | 100.0% |
School Enrollment by Age by Funding Source in Bath
Out of a total of 793 students who are enrolled in schools in Bath, 78 (9.8%) attend a private institution, while the remaining 715 (90.2%) are enrolled in public schools. The age group of 18 to 19 year olds has the highest likelihood of being enrolled in private schools, with 15 (19.5% in the age bracket) enrolled. Conversely, the age group of 3 to 4 year olds has the lowest likelihood of being enrolled in a private school, with 67 (100.0% in the age bracket) attending a public institution.
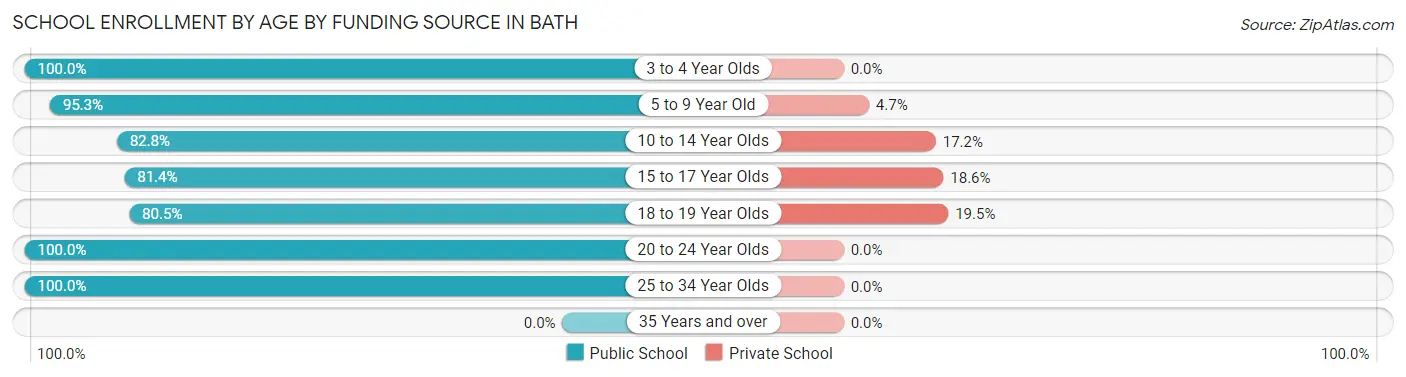
| Age Bracket | Public School | Private School |
| 3 to 4 Year Olds | 67 (100.0%) | 0 (0.0%) |
| 5 to 9 Year Old | 304 (95.3%) | 15 (4.7%) |
| 10 to 14 Year Olds | 169 (82.8%) | 35 (17.2%) |
| 15 to 17 Year Olds | 57 (81.4%) | 13 (18.6%) |
| 18 to 19 Year Olds | 62 (80.5%) | 15 (19.5%) |
| 20 to 24 Year Olds | 27 (100.0%) | 0 (0.0%) |
| 25 to 34 Year Olds | 29 (100.0%) | 0 (0.0%) |
| 35 Years and over | 0 (0.0%) | 0 (0.0%) |
| Total | 715 (90.2%) | 78 (9.8%) |
Educational Attainment by Field of Study in Bath
Education (173 | 22.7%), business (93 | 12.2%), computers & mathematics (73 | 9.6%), science & technology (71 | 9.3%), and arts & humanities (58 | 7.6%) are the most common fields of study among 763 individuals in Bath who have obtained a bachelor's degree or higher.
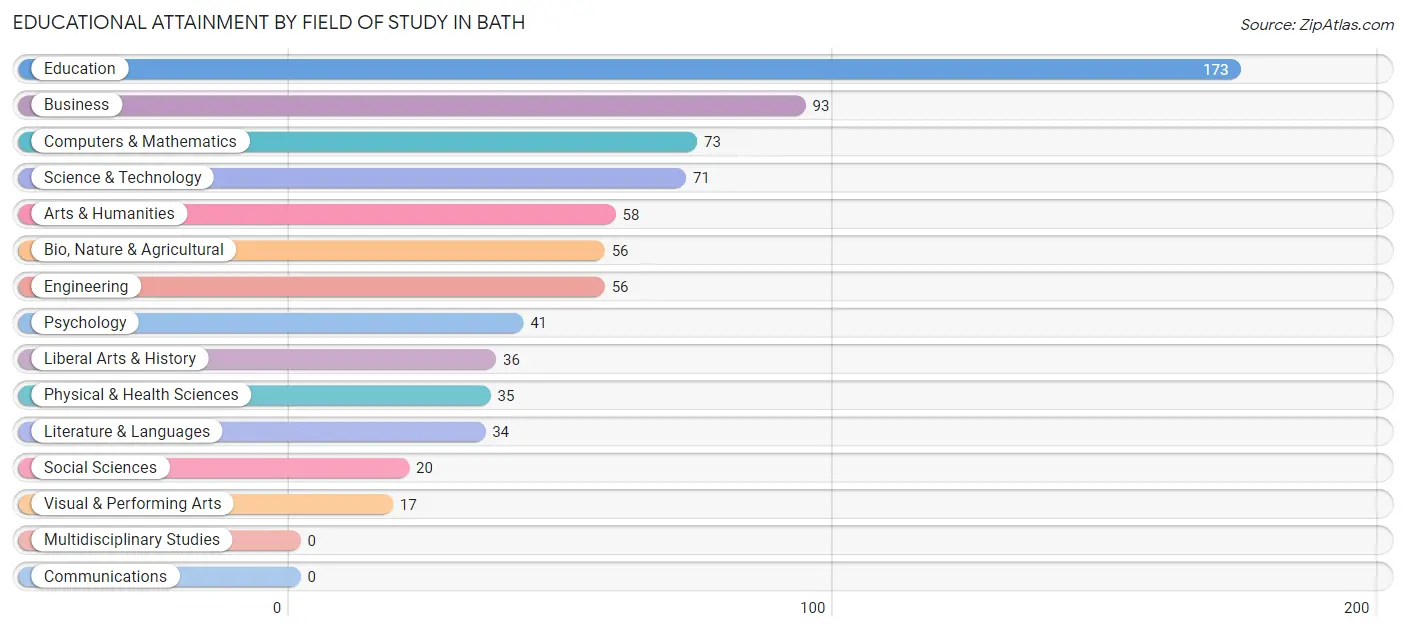
| Field of Study | # Graduates | % Graduates |
| Computers & Mathematics | 73 | 9.6% |
| Bio, Nature & Agricultural | 56 | 7.3% |
| Physical & Health Sciences | 35 | 4.6% |
| Psychology | 41 | 5.4% |
| Social Sciences | 20 | 2.6% |
| Engineering | 56 | 7.3% |
| Multidisciplinary Studies | 0 | 0.0% |
| Science & Technology | 71 | 9.3% |
| Business | 93 | 12.2% |
| Education | 173 | 22.7% |
| Literature & Languages | 34 | 4.5% |
| Liberal Arts & History | 36 | 4.7% |
| Visual & Performing Arts | 17 | 2.2% |
| Communications | 0 | 0.0% |
| Arts & Humanities | 58 | 7.6% |
| Total | 763 | 100.0% |
Transportation & Commute in Bath
Vehicle Availability by Sex in Bath
The most prevalent vehicle ownership categories in Bath are males with 2 vehicles (511, accounting for 47.5%) and females with 2 vehicles (473, making up 41.4%).
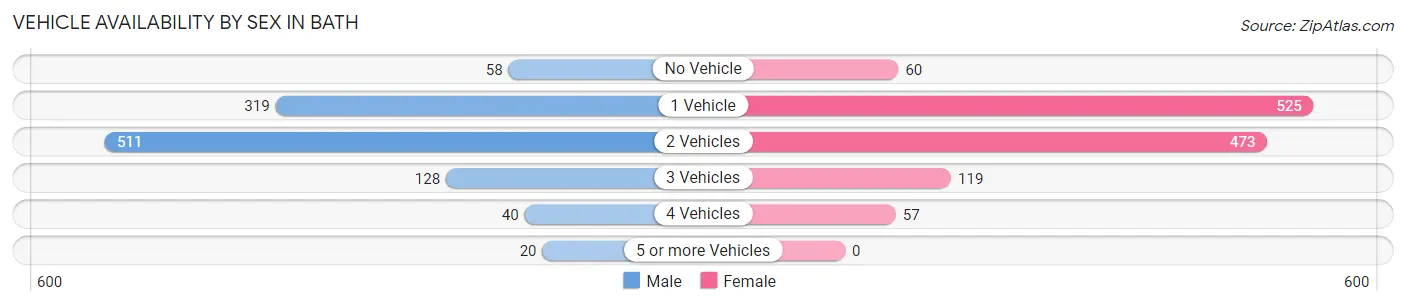
| Vehicles Available | Male | Female |
| No Vehicle | 58 (5.4%) | 60 (4.9%) |
| 1 Vehicle | 319 (29.6%) | 525 (42.5%) |
| 2 Vehicles | 511 (47.5%) | 473 (38.3%) |
| 3 Vehicles | 128 (11.9%) | 119 (9.6%) |
| 4 Vehicles | 40 (3.7%) | 57 (4.6%) |
| 5 or more Vehicles | 20 (1.9%) | 0 (0.0%) |
| Total | 1,076 (100.0%) | 1,234 (100.0%) |
Commute Time in Bath
The most frequently occuring commute durations in Bath are 5 to 9 minutes (512 commuters, 24.5%), 30 to 34 minutes (268 commuters, 12.8%), and 20 to 24 minutes (263 commuters, 12.6%).
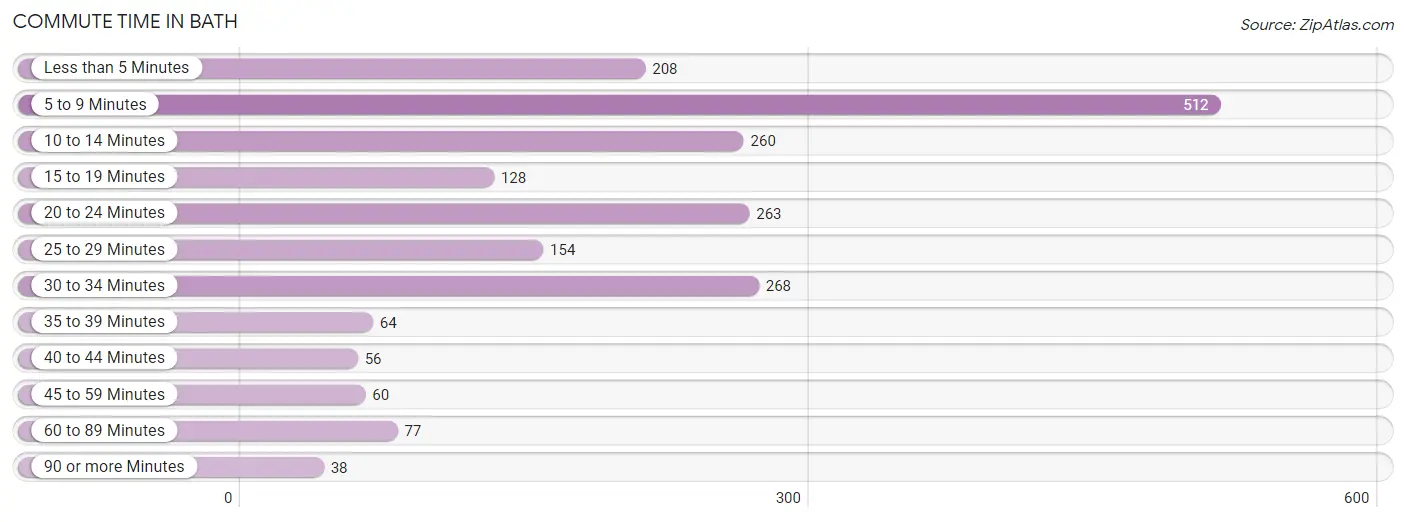
| Commute Time | # Commuters | % Commuters |
| Less than 5 Minutes | 208 | 10.0% |
| 5 to 9 Minutes | 512 | 24.5% |
| 10 to 14 Minutes | 260 | 12.4% |
| 15 to 19 Minutes | 128 | 6.1% |
| 20 to 24 Minutes | 263 | 12.6% |
| 25 to 29 Minutes | 154 | 7.4% |
| 30 to 34 Minutes | 268 | 12.8% |
| 35 to 39 Minutes | 64 | 3.1% |
| 40 to 44 Minutes | 56 | 2.7% |
| 45 to 59 Minutes | 60 | 2.9% |
| 60 to 89 Minutes | 77 | 3.7% |
| 90 or more Minutes | 38 | 1.8% |
Commute Time by Sex in Bath
The most common commute times in Bath are 30 to 34 minutes (183 commuters, 18.2%) for males and 5 to 9 minutes (345 commuters, 31.8%) for females.
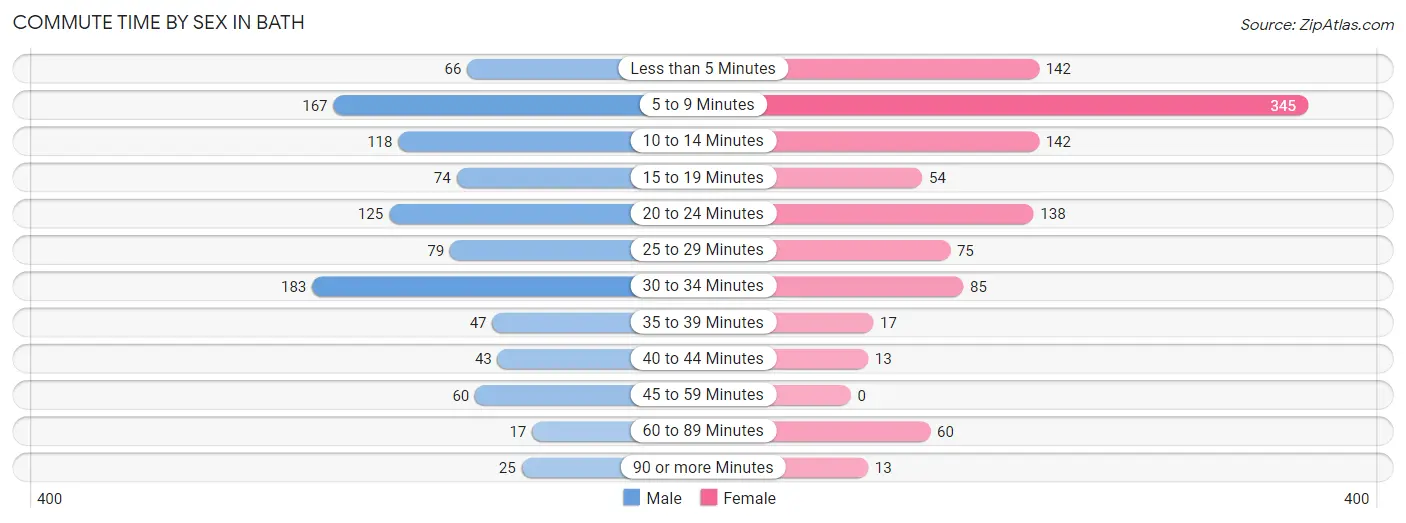
| Commute Time | Male | Female |
| Less than 5 Minutes | 66 (6.6%) | 142 (13.1%) |
| 5 to 9 Minutes | 167 (16.6%) | 345 (31.8%) |
| 10 to 14 Minutes | 118 (11.7%) | 142 (13.1%) |
| 15 to 19 Minutes | 74 (7.4%) | 54 (5.0%) |
| 20 to 24 Minutes | 125 (12.4%) | 138 (12.7%) |
| 25 to 29 Minutes | 79 (7.9%) | 75 (6.9%) |
| 30 to 34 Minutes | 183 (18.2%) | 85 (7.8%) |
| 35 to 39 Minutes | 47 (4.7%) | 17 (1.6%) |
| 40 to 44 Minutes | 43 (4.3%) | 13 (1.2%) |
| 45 to 59 Minutes | 60 (6.0%) | 0 (0.0%) |
| 60 to 89 Minutes | 17 (1.7%) | 60 (5.5%) |
| 90 or more Minutes | 25 (2.5%) | 13 (1.2%) |
Time of Departure to Work by Sex in Bath
The most frequent times of departure to work in Bath are 7:00 AM to 7:29 AM (175, 17.4%) for males and 7:30 AM to 7:59 AM (192, 17.7%) for females.
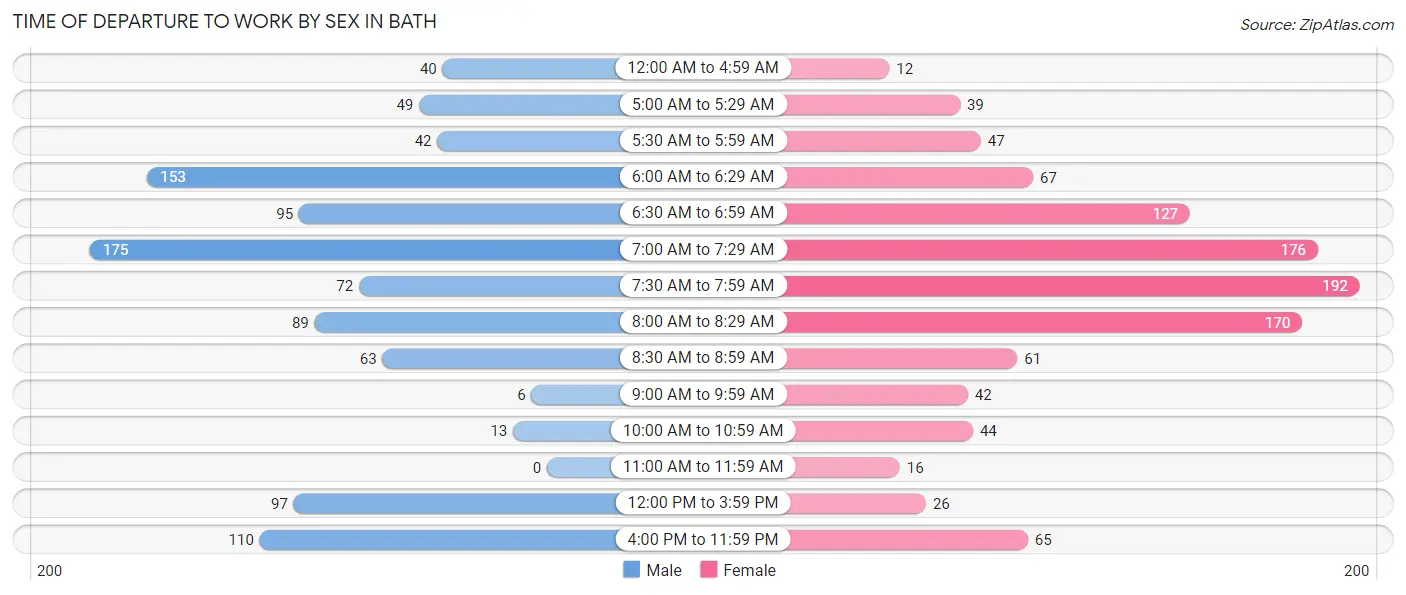
| Time of Departure | Male | Female |
| 12:00 AM to 4:59 AM | 40 (4.0%) | 12 (1.1%) |
| 5:00 AM to 5:29 AM | 49 (4.9%) | 39 (3.6%) |
| 5:30 AM to 5:59 AM | 42 (4.2%) | 47 (4.3%) |
| 6:00 AM to 6:29 AM | 153 (15.2%) | 67 (6.2%) |
| 6:30 AM to 6:59 AM | 95 (9.5%) | 127 (11.7%) |
| 7:00 AM to 7:29 AM | 175 (17.4%) | 176 (16.2%) |
| 7:30 AM to 7:59 AM | 72 (7.2%) | 192 (17.7%) |
| 8:00 AM to 8:29 AM | 89 (8.9%) | 170 (15.7%) |
| 8:30 AM to 8:59 AM | 63 (6.3%) | 61 (5.6%) |
| 9:00 AM to 9:59 AM | 6 (0.6%) | 42 (3.9%) |
| 10:00 AM to 10:59 AM | 13 (1.3%) | 44 (4.1%) |
| 11:00 AM to 11:59 AM | 0 (0.0%) | 16 (1.5%) |
| 12:00 PM to 3:59 PM | 97 (9.7%) | 26 (2.4%) |
| 4:00 PM to 11:59 PM | 110 (11.0%) | 65 (6.0%) |
| Total | 1,004 (100.0%) | 1,084 (100.0%) |
Housing Occupancy in Bath
Occupancy by Ownership in Bath
Of the total 2,824 dwellings in Bath, owner-occupied units account for 1,481 (52.4%), while renter-occupied units make up 1,343 (47.6%).
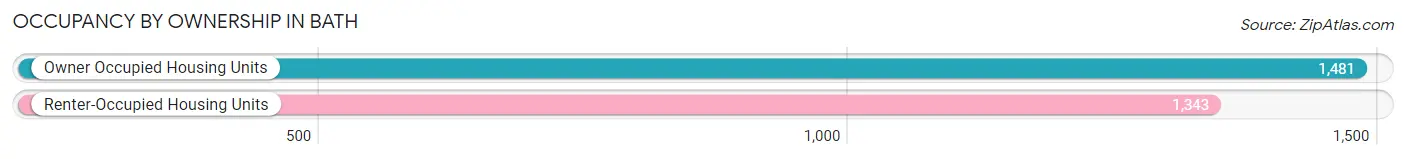
| Occupancy | # Housing Units | % Housing Units |
| Owner Occupied Housing Units | 1,481 | 52.4% |
| Renter-Occupied Housing Units | 1,343 | 47.6% |
| Total Occupied Housing Units | 2,824 | 100.0% |
Occupancy by Household Size in Bath
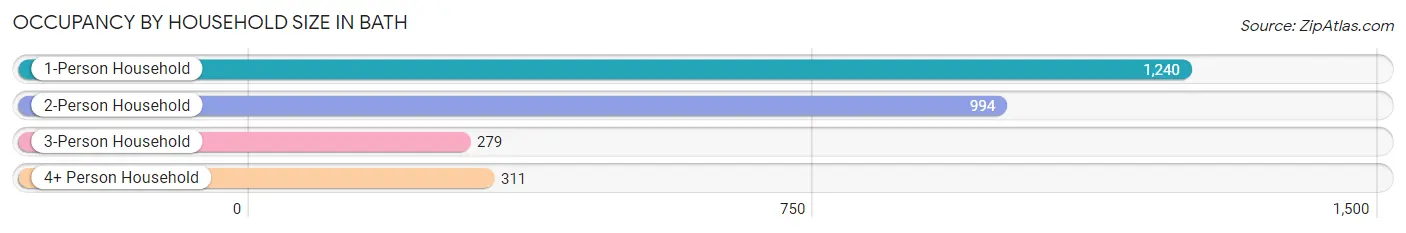
| Household Size | # Housing Units | % Housing Units |
| 1-Person Household | 1,240 | 43.9% |
| 2-Person Household | 994 | 35.2% |
| 3-Person Household | 279 | 9.9% |
| 4+ Person Household | 311 | 11.0% |
| Total Housing Units | 2,824 | 100.0% |
Occupancy by Ownership by Household Size in Bath
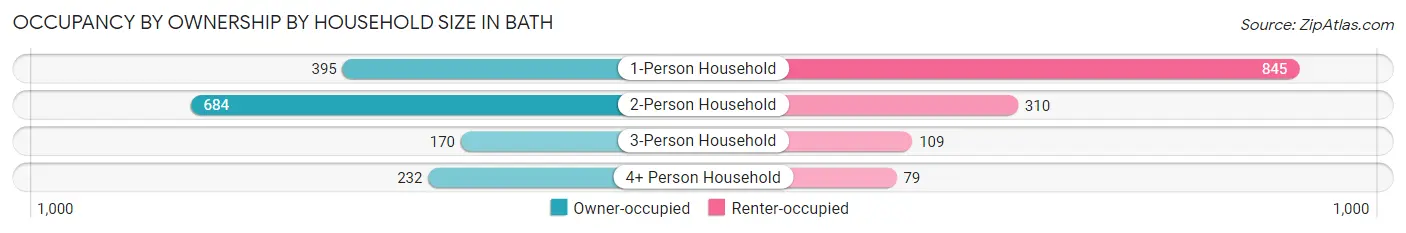
| Household Size | Owner-occupied | Renter-occupied |
| 1-Person Household | 395 (31.9%) | 845 (68.1%) |
| 2-Person Household | 684 (68.8%) | 310 (31.2%) |
| 3-Person Household | 170 (60.9%) | 109 (39.1%) |
| 4+ Person Household | 232 (74.6%) | 79 (25.4%) |
| Total Housing Units | 1,481 (52.4%) | 1,343 (47.6%) |
Occupancy by Educational Attainment in Bath
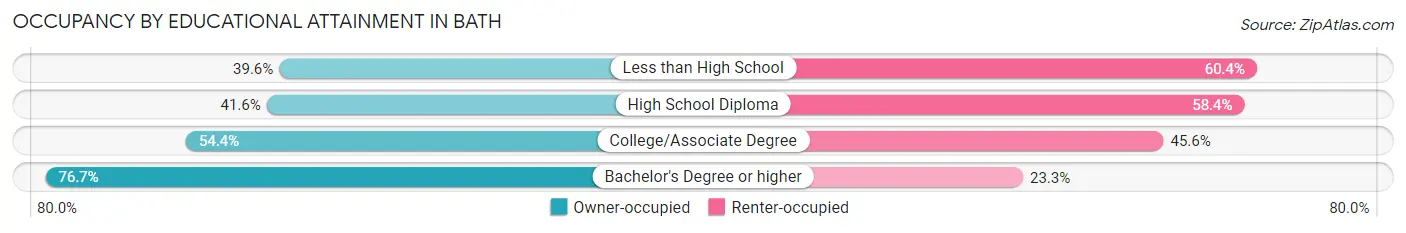
| Household Size | Owner-occupied | Renter-occupied |
| Less than High School | 149 (39.6%) | 227 (60.4%) |
| High School Diploma | 405 (41.6%) | 568 (58.4%) |
| College/Associate Degree | 499 (54.4%) | 418 (45.6%) |
| Bachelor's Degree or higher | 428 (76.7%) | 130 (23.3%) |
Occupancy by Age of Householder in Bath
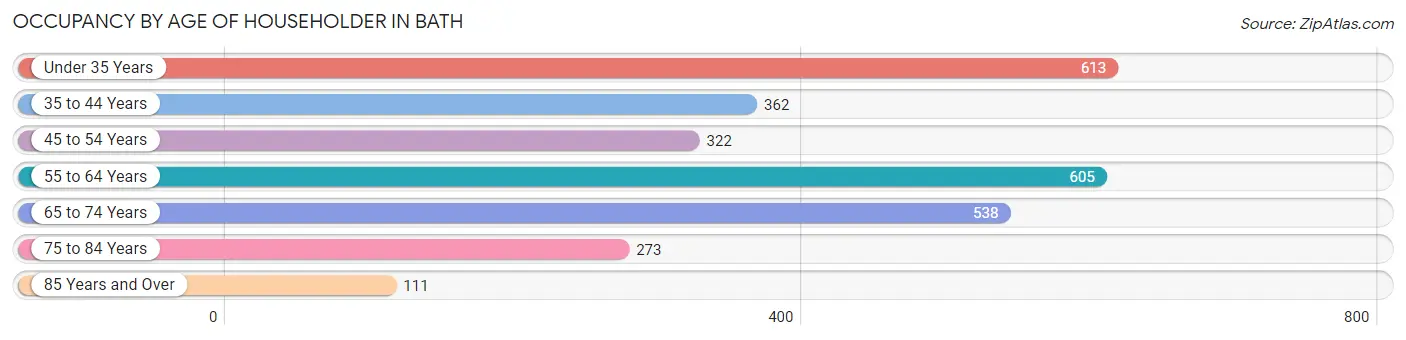
| Age Bracket | # Households | % Households |
| Under 35 Years | 613 | 21.7% |
| 35 to 44 Years | 362 | 12.8% |
| 45 to 54 Years | 322 | 11.4% |
| 55 to 64 Years | 605 | 21.4% |
| 65 to 74 Years | 538 | 19.1% |
| 75 to 84 Years | 273 | 9.7% |
| 85 Years and Over | 111 | 3.9% |
| Total | 2,824 | 100.0% |
Housing Finances in Bath
Median Income by Occupancy in Bath
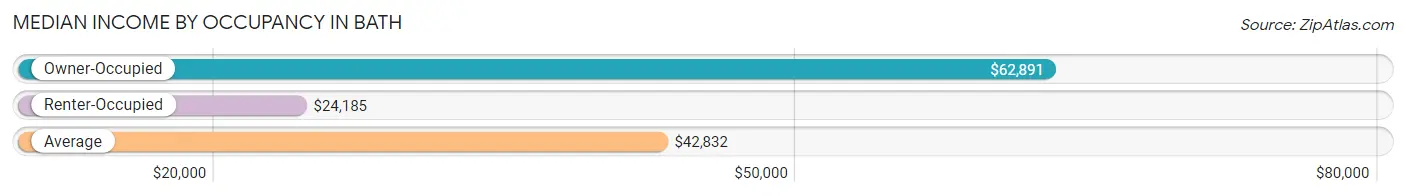
| Occupancy Type | # Households | Median Income |
| Owner-Occupied | 1,481 (52.4%) | $62,891 |
| Renter-Occupied | 1,343 (47.6%) | $24,185 |
| Average | 2,824 (100.0%) | $42,832 |
Occupancy by Householder Income Bracket in Bath
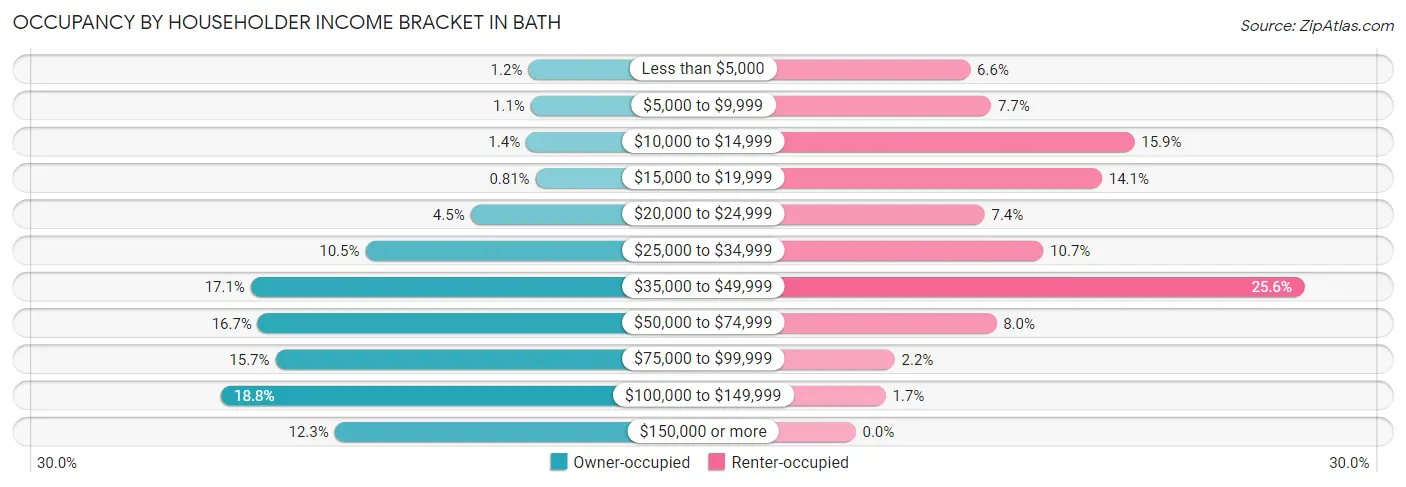
| Income Bracket | Owner-occupied | Renter-occupied |
| Less than $5,000 | 18 (1.2%) | 88 (6.6%) |
| $5,000 to $9,999 | 16 (1.1%) | 104 (7.7%) |
| $10,000 to $14,999 | 20 (1.3%) | 214 (15.9%) |
| $15,000 to $19,999 | 12 (0.8%) | 189 (14.1%) |
| $20,000 to $24,999 | 67 (4.5%) | 99 (7.4%) |
| $25,000 to $34,999 | 156 (10.5%) | 144 (10.7%) |
| $35,000 to $49,999 | 253 (17.1%) | 344 (25.6%) |
| $50,000 to $74,999 | 247 (16.7%) | 108 (8.0%) |
| $75,000 to $99,999 | 232 (15.7%) | 30 (2.2%) |
| $100,000 to $149,999 | 278 (18.8%) | 23 (1.7%) |
| $150,000 or more | 182 (12.3%) | 0 (0.0%) |
| Total | 1,481 (100.0%) | 1,343 (100.0%) |
Monthly Housing Cost Tiers in Bath
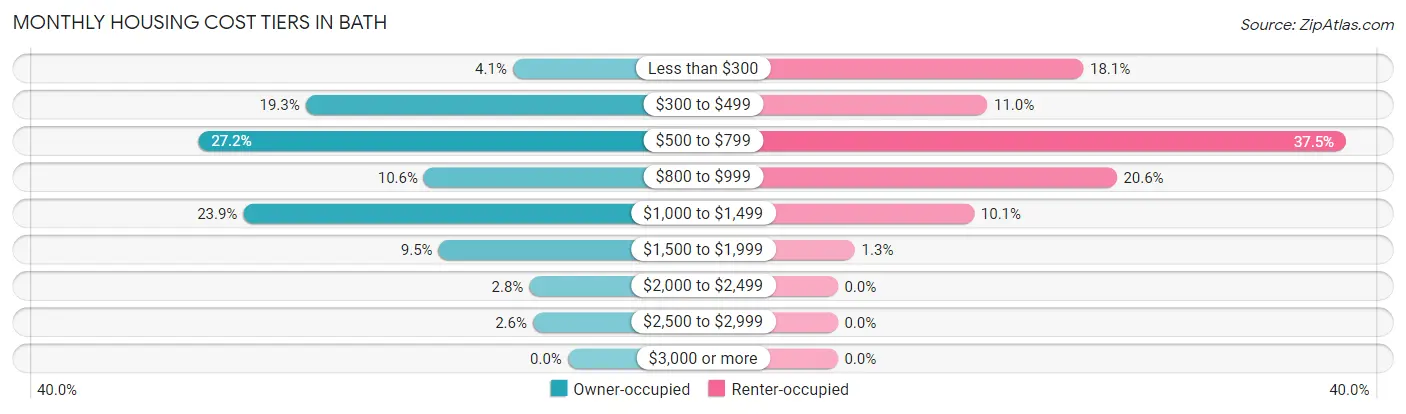
| Monthly Cost | Owner-occupied | Renter-occupied |
| Less than $300 | 60 (4.1%) | 243 (18.1%) |
| $300 to $499 | 286 (19.3%) | 148 (11.0%) |
| $500 to $799 | 403 (27.2%) | 503 (37.4%) |
| $800 to $999 | 157 (10.6%) | 276 (20.5%) |
| $1,000 to $1,499 | 354 (23.9%) | 135 (10.1%) |
| $1,500 to $1,999 | 141 (9.5%) | 17 (1.3%) |
| $2,000 to $2,499 | 42 (2.8%) | 0 (0.0%) |
| $2,500 to $2,999 | 38 (2.6%) | 0 (0.0%) |
| $3,000 or more | 0 (0.0%) | 0 (0.0%) |
| Total | 1,481 (100.0%) | 1,343 (100.0%) |
Physical Housing Characteristics in Bath
Housing Structures in Bath
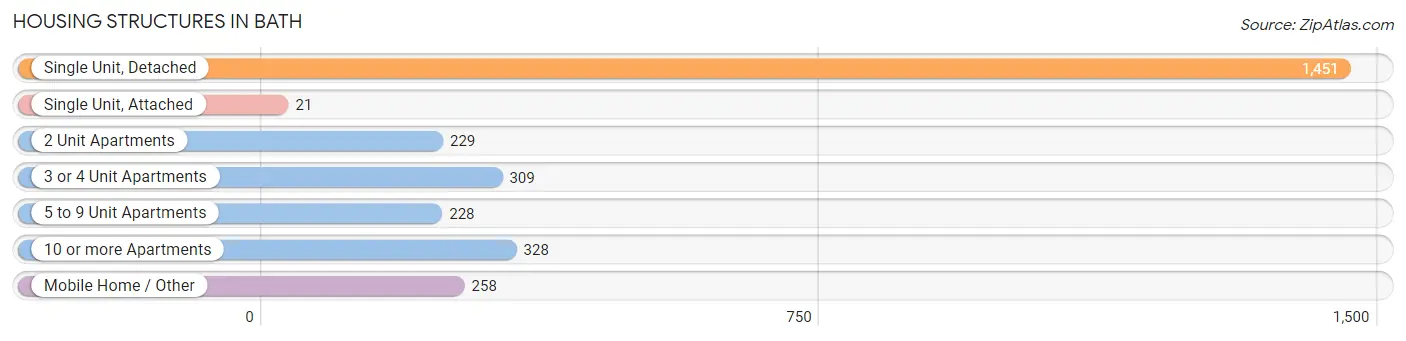
| Structure Type | # Housing Units | % Housing Units |
| Single Unit, Detached | 1,451 | 51.4% |
| Single Unit, Attached | 21 | 0.7% |
| 2 Unit Apartments | 229 | 8.1% |
| 3 or 4 Unit Apartments | 309 | 10.9% |
| 5 to 9 Unit Apartments | 228 | 8.1% |
| 10 or more Apartments | 328 | 11.6% |
| Mobile Home / Other | 258 | 9.1% |
| Total | 2,824 | 100.0% |
Housing Structures by Occupancy in Bath
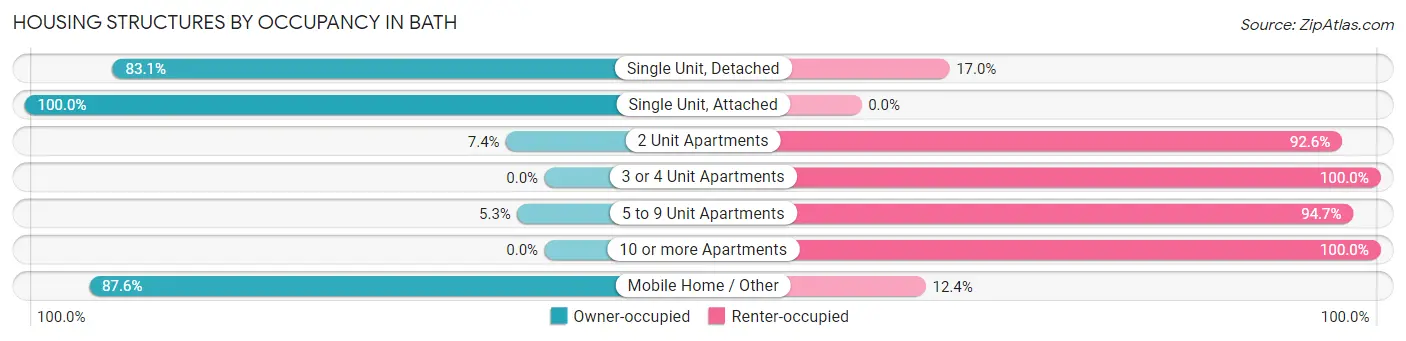
| Structure Type | Owner-occupied | Renter-occupied |
| Single Unit, Detached | 1,205 (83.1%) | 246 (17.0%) |
| Single Unit, Attached | 21 (100.0%) | 0 (0.0%) |
| 2 Unit Apartments | 17 (7.4%) | 212 (92.6%) |
| 3 or 4 Unit Apartments | 0 (0.0%) | 309 (100.0%) |
| 5 to 9 Unit Apartments | 12 (5.3%) | 216 (94.7%) |
| 10 or more Apartments | 0 (0.0%) | 328 (100.0%) |
| Mobile Home / Other | 226 (87.6%) | 32 (12.4%) |
| Total | 1,481 (52.4%) | 1,343 (47.6%) |
Housing Structures by Number of Rooms in Bath
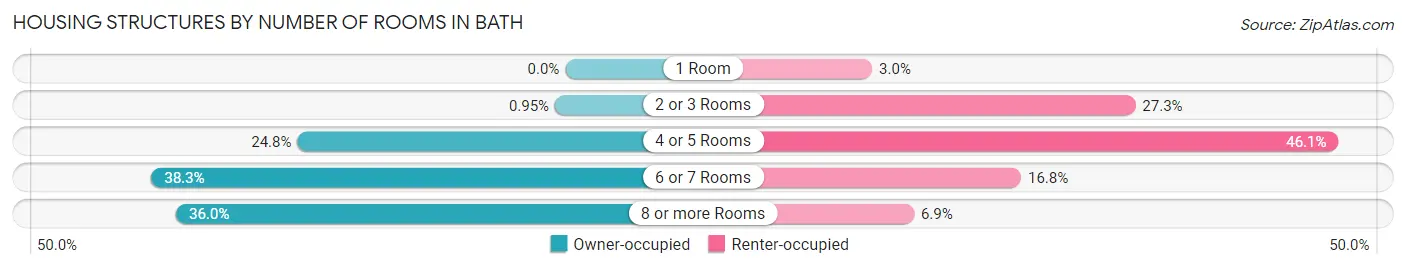
| Number of Rooms | Owner-occupied | Renter-occupied |
| 1 Room | 0 (0.0%) | 40 (3.0%) |
| 2 or 3 Rooms | 14 (0.9%) | 367 (27.3%) |
| 4 or 5 Rooms | 367 (24.8%) | 619 (46.1%) |
| 6 or 7 Rooms | 567 (38.3%) | 225 (16.8%) |
| 8 or more Rooms | 533 (36.0%) | 92 (6.9%) |
| Total | 1,481 (100.0%) | 1,343 (100.0%) |
Housing Structure by Heating Type in Bath
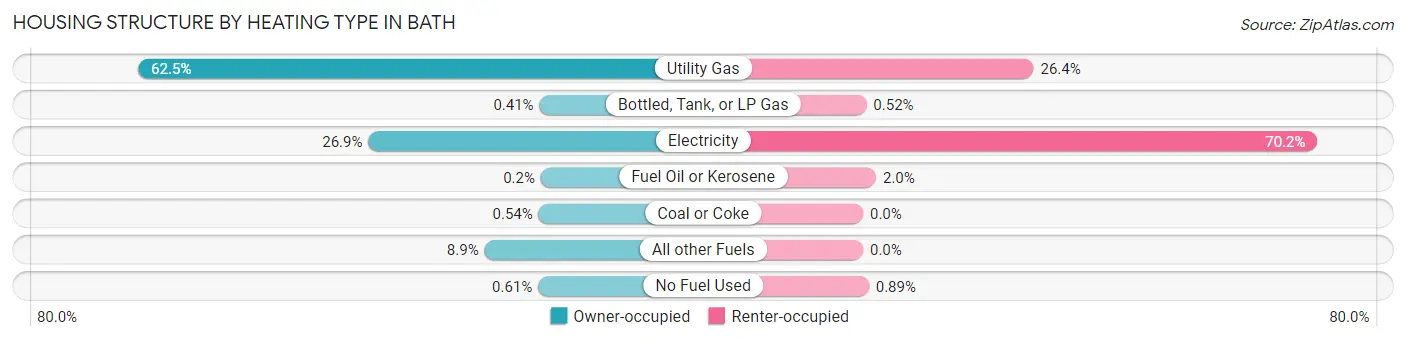
| Heating Type | Owner-occupied | Renter-occupied |
| Utility Gas | 925 (62.5%) | 354 (26.4%) |
| Bottled, Tank, or LP Gas | 6 (0.4%) | 7 (0.5%) |
| Electricity | 398 (26.9%) | 943 (70.2%) |
| Fuel Oil or Kerosene | 3 (0.2%) | 27 (2.0%) |
| Coal or Coke | 8 (0.5%) | 0 (0.0%) |
| All other Fuels | 132 (8.9%) | 0 (0.0%) |
| No Fuel Used | 9 (0.6%) | 12 (0.9%) |
| Total | 1,481 (100.0%) | 1,343 (100.0%) |
Household Vehicle Usage in Bath
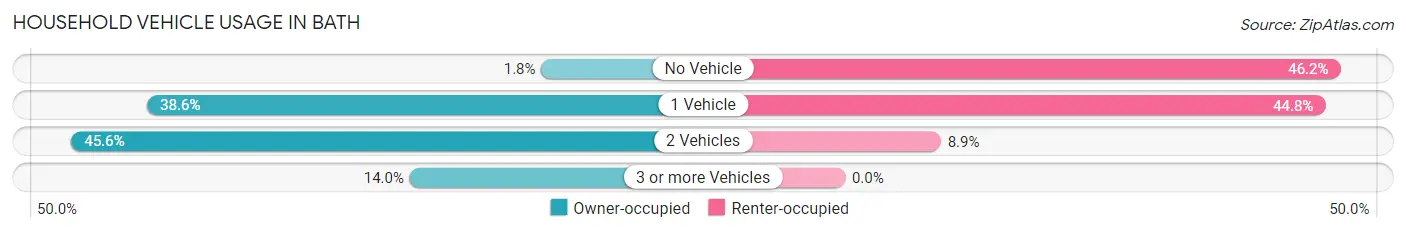
| Vehicles per Household | Owner-occupied | Renter-occupied |
| No Vehicle | 26 (1.8%) | 621 (46.2%) |
| 1 Vehicle | 571 (38.6%) | 602 (44.8%) |
| 2 Vehicles | 676 (45.6%) | 120 (8.9%) |
| 3 or more Vehicles | 208 (14.0%) | 0 (0.0%) |
| Total | 1,481 (100.0%) | 1,343 (100.0%) |
Real Estate & Mortgages in Bath
Real Estate and Mortgage Overview in Bath
| Characteristic | Without Mortgage | With Mortgage |
| Housing Units | 667 | 814 |
| Median Property Value | $89,600 | $107,100 |
| Median Household Income | $49,345 | $154 |
| Monthly Housing Costs | $498 | $0 |
| Real Estate Taxes | $2,724 | $43 |
Property Value by Mortgage Status in Bath
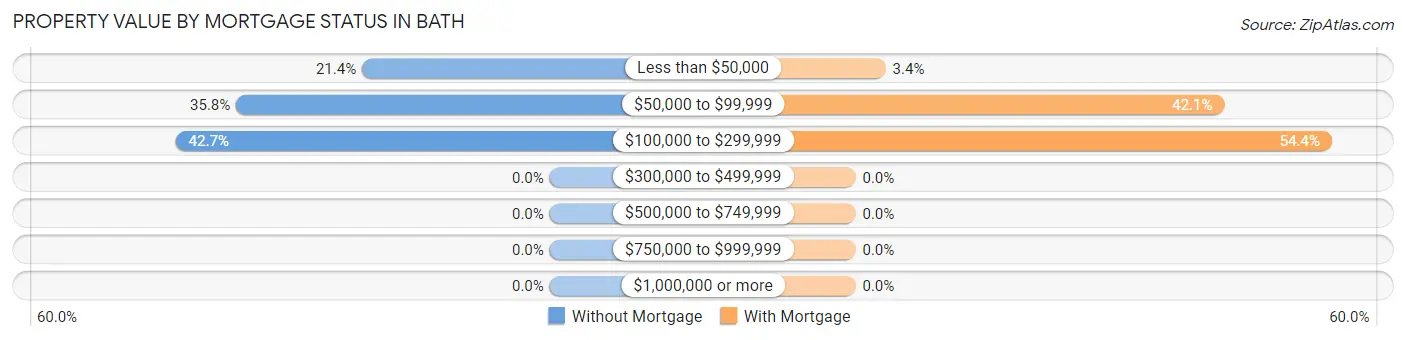
| Property Value | Without Mortgage | With Mortgage |
| Less than $50,000 | 143 (21.4%) | 28 (3.4%) |
| $50,000 to $99,999 | 239 (35.8%) | 343 (42.1%) |
| $100,000 to $299,999 | 285 (42.7%) | 443 (54.4%) |
| $300,000 to $499,999 | 0 (0.0%) | 0 (0.0%) |
| $500,000 to $749,999 | 0 (0.0%) | 0 (0.0%) |
| $750,000 to $999,999 | 0 (0.0%) | 0 (0.0%) |
| $1,000,000 or more | 0 (0.0%) | 0 (0.0%) |
| Total | 667 (100.0%) | 814 (100.0%) |
Household Income by Mortgage Status in Bath
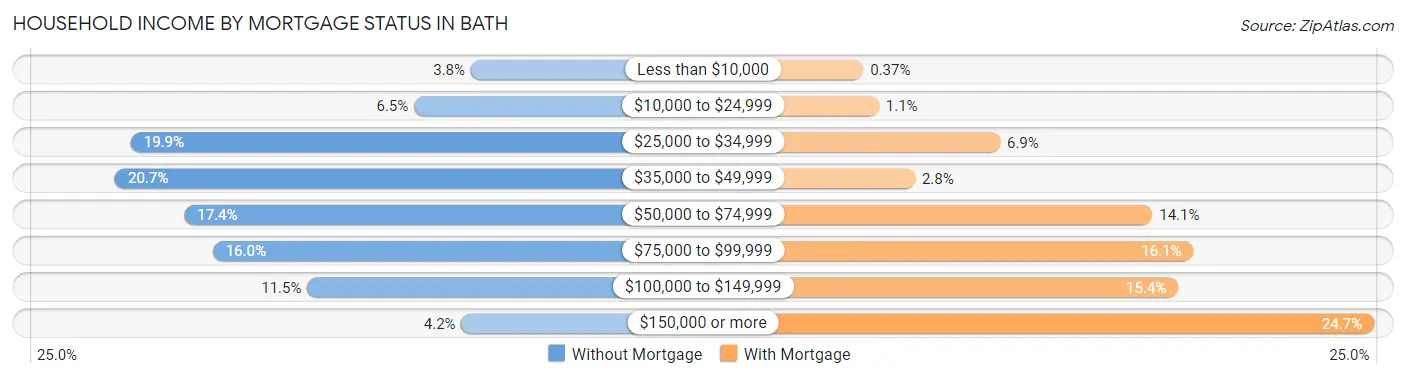
| Household Income | Without Mortgage | With Mortgage |
| Less than $10,000 | 25 (3.7%) | 3 (0.4%) |
| $10,000 to $24,999 | 43 (6.5%) | 9 (1.1%) |
| $25,000 to $34,999 | 133 (19.9%) | 56 (6.9%) |
| $35,000 to $49,999 | 138 (20.7%) | 23 (2.8%) |
| $50,000 to $74,999 | 116 (17.4%) | 115 (14.1%) |
| $75,000 to $99,999 | 107 (16.0%) | 131 (16.1%) |
| $100,000 to $149,999 | 77 (11.5%) | 125 (15.4%) |
| $150,000 or more | 28 (4.2%) | 201 (24.7%) |
| Total | 667 (100.0%) | 814 (100.0%) |
Property Value to Household Income Ratio in Bath
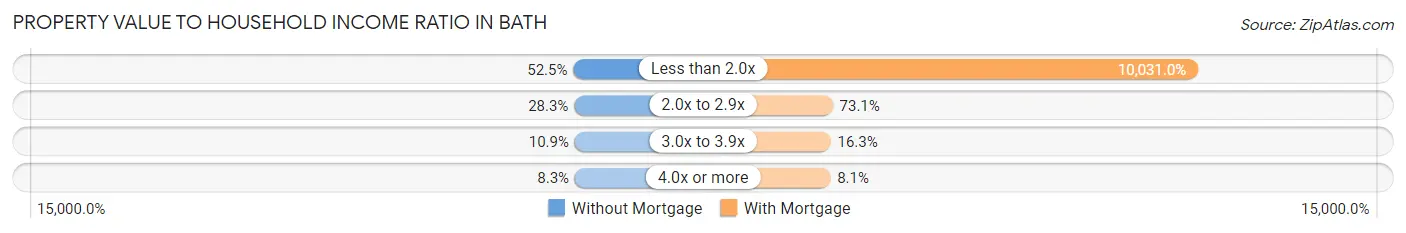
| Value-to-Income Ratio | Without Mortgage | With Mortgage |
| Less than 2.0x | 350 (52.5%) | 81,652 (10,031.0%) |
| 2.0x to 2.9x | 189 (28.3%) | 595 (73.1%) |
| 3.0x to 3.9x | 73 (10.9%) | 133 (16.3%) |
| 4.0x or more | 55 (8.3%) | 66 (8.1%) |
| Total | 667 (100.0%) | 814 (100.0%) |
Real Estate Taxes by Mortgage Status in Bath
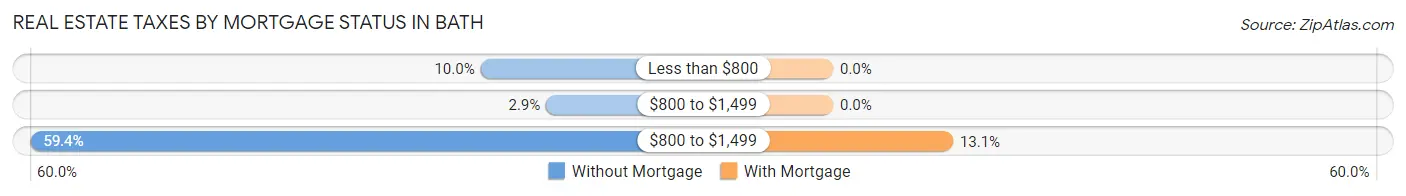
| Property Taxes | Without Mortgage | With Mortgage |
| Less than $800 | 67 (10.0%) | 0 (0.0%) |
| $800 to $1,499 | 19 (2.9%) | 0 (0.0%) |
| $800 to $1,499 | 396 (59.4%) | 107 (13.1%) |
| Total | 667 (100.0%) | 814 (100.0%) |
Health & Disability in Bath
Health Insurance Coverage by Age in Bath
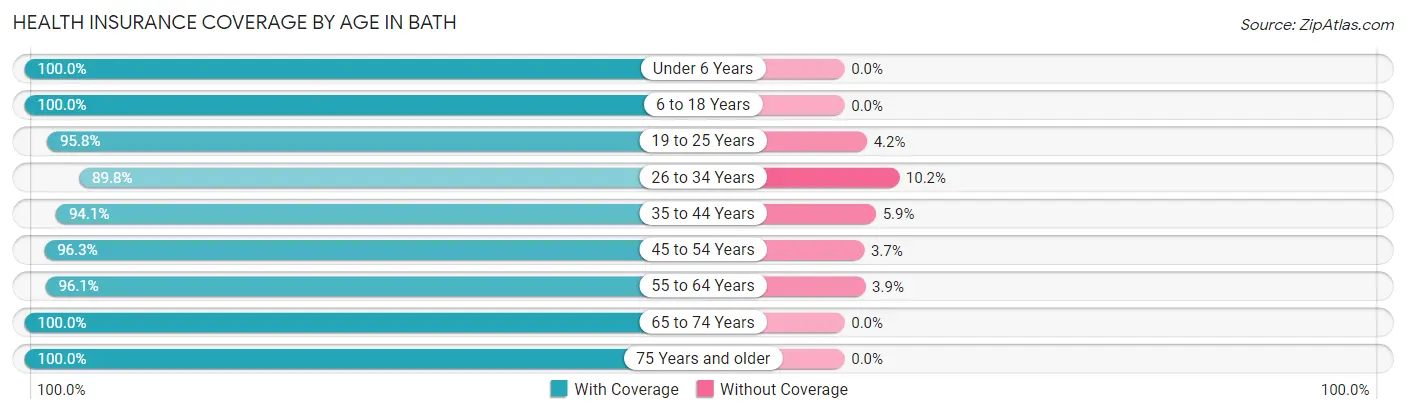
| Age Bracket | With Coverage | Without Coverage |
| Under 6 Years | 408 (100.0%) | 0 (0.0%) |
| 6 to 18 Years | 657 (100.0%) | 0 (0.0%) |
| 19 to 25 Years | 321 (95.8%) | 14 (4.2%) |
| 26 to 34 Years | 707 (89.8%) | 80 (10.2%) |
| 35 to 44 Years | 498 (94.1%) | 31 (5.9%) |
| 45 to 54 Years | 578 (96.3%) | 22 (3.7%) |
| 55 to 64 Years | 963 (96.1%) | 39 (3.9%) |
| 65 to 74 Years | 763 (100.0%) | 0 (0.0%) |
| 75 Years and older | 499 (100.0%) | 0 (0.0%) |
| Total | 5,394 (96.7%) | 186 (3.3%) |
Health Insurance Coverage by Citizenship Status in Bath
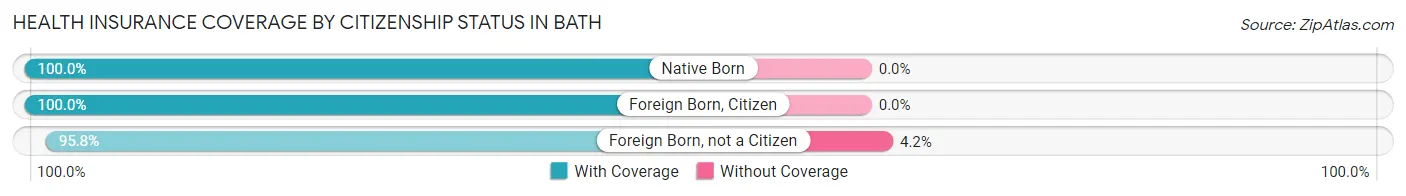
| Citizenship Status | With Coverage | Without Coverage |
| Native Born | 408 (100.0%) | 0 (0.0%) |
| Foreign Born, Citizen | 657 (100.0%) | 0 (0.0%) |
| Foreign Born, not a Citizen | 321 (95.8%) | 14 (4.2%) |
Health Insurance Coverage by Household Income in Bath
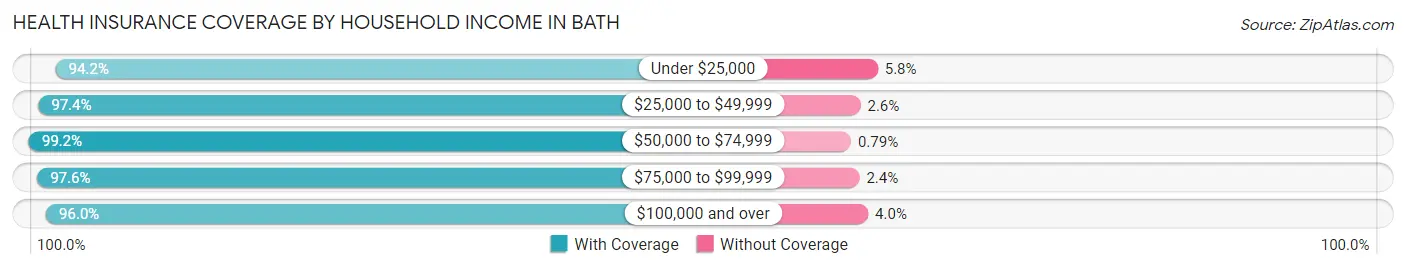
| Household Income | With Coverage | Without Coverage |
| Under $25,000 | 1,087 (94.2%) | 67 (5.8%) |
| $25,000 to $49,999 | 1,514 (97.4%) | 40 (2.6%) |
| $50,000 to $74,999 | 751 (99.2%) | 6 (0.8%) |
| $75,000 to $99,999 | 536 (97.6%) | 13 (2.4%) |
| $100,000 and over | 1,441 (96.0%) | 60 (4.0%) |
Public vs Private Health Insurance Coverage by Age in Bath
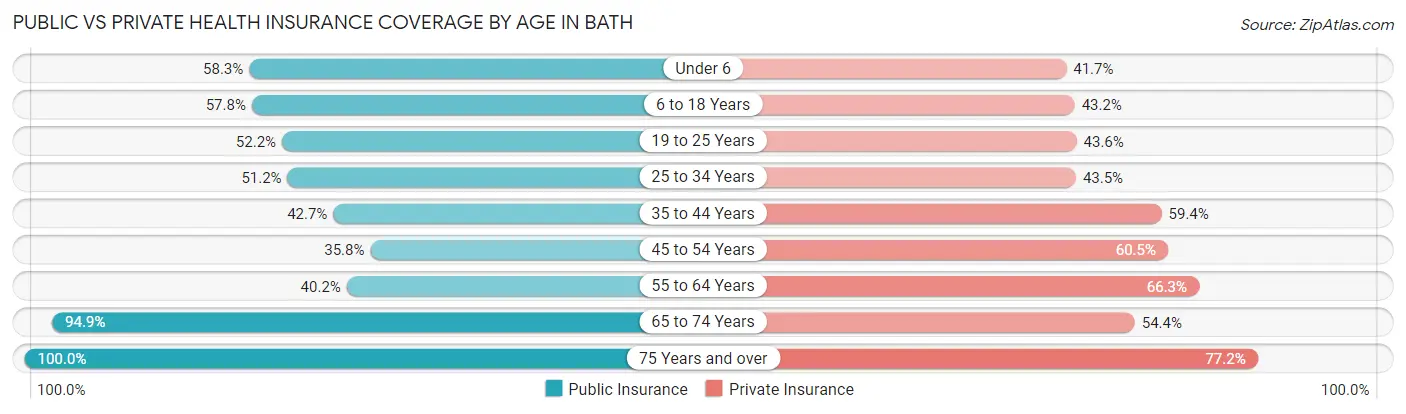
| Age Bracket | Public Insurance | Private Insurance |
| Under 6 | 238 (58.3%) | 170 (41.7%) |
| 6 to 18 Years | 380 (57.8%) | 284 (43.2%) |
| 19 to 25 Years | 175 (52.2%) | 146 (43.6%) |
| 25 to 34 Years | 403 (51.2%) | 342 (43.5%) |
| 35 to 44 Years | 226 (42.7%) | 314 (59.4%) |
| 45 to 54 Years | 215 (35.8%) | 363 (60.5%) |
| 55 to 64 Years | 403 (40.2%) | 664 (66.3%) |
| 65 to 74 Years | 724 (94.9%) | 415 (54.4%) |
| 75 Years and over | 499 (100.0%) | 385 (77.1%) |
| Total | 3,263 (58.5%) | 3,083 (55.2%) |
Disability Status by Sex by Age in Bath
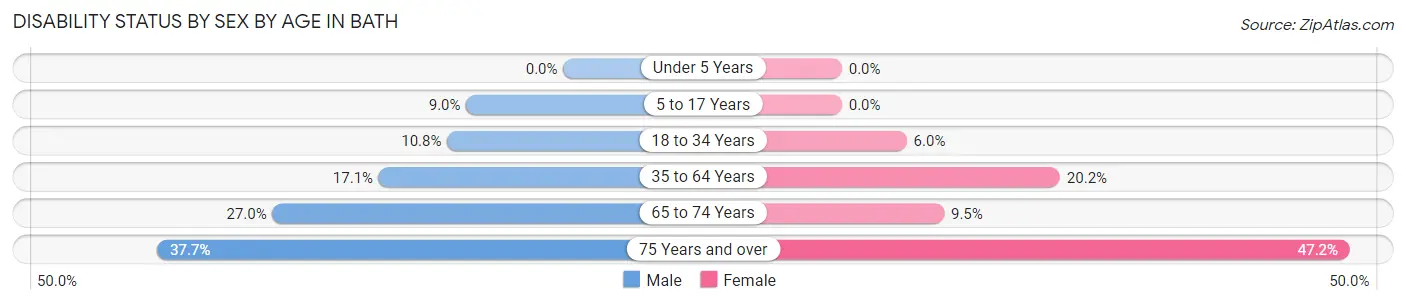
| Age Bracket | Male | Female |
| Under 5 Years | 0 (0.0%) | 0 (0.0%) |
| 5 to 17 Years | 27 (9.0%) | 0 (0.0%) |
| 18 to 34 Years | 53 (10.8%) | 46 (6.0%) |
| 35 to 64 Years | 183 (17.1%) | 215 (20.2%) |
| 65 to 74 Years | 78 (27.0%) | 45 (9.5%) |
| 75 Years and over | 89 (37.7%) | 124 (47.1%) |
Disability Class by Sex by Age in Bath
Disability Class: Hearing Difficulty
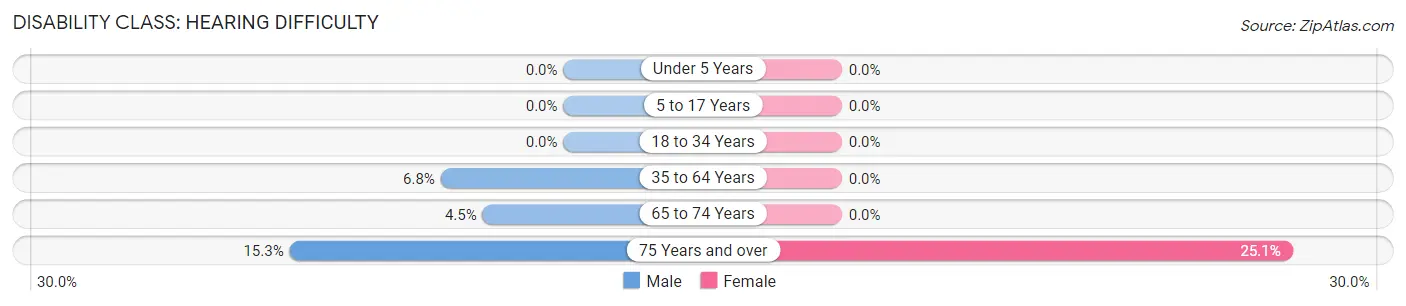
| Age Bracket | Male | Female |
| Under 5 Years | 0 (0.0%) | 0 (0.0%) |
| 5 to 17 Years | 0 (0.0%) | 0 (0.0%) |
| 18 to 34 Years | 0 (0.0%) | 0 (0.0%) |
| 35 to 64 Years | 73 (6.8%) | 0 (0.0%) |
| 65 to 74 Years | 13 (4.5%) | 0 (0.0%) |
| 75 Years and over | 36 (15.2%) | 66 (25.1%) |
Disability Class: Vision Difficulty
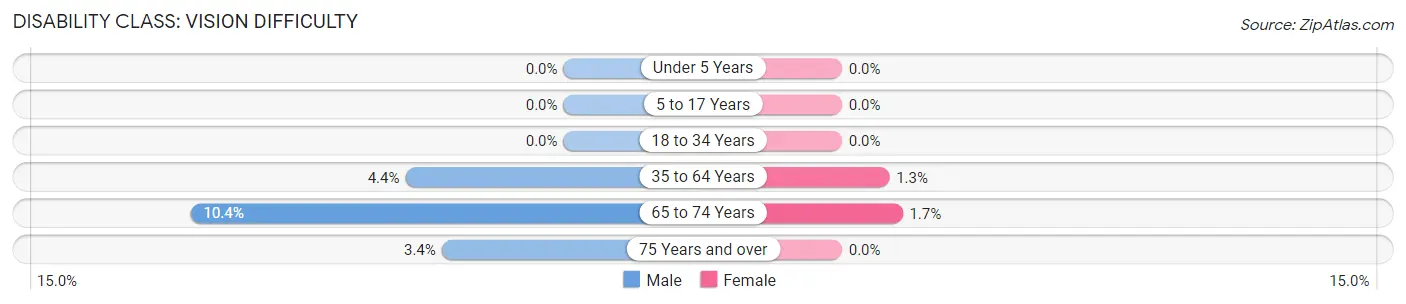
| Age Bracket | Male | Female |
| Under 5 Years | 0 (0.0%) | 0 (0.0%) |
| 5 to 17 Years | 0 (0.0%) | 0 (0.0%) |
| 18 to 34 Years | 0 (0.0%) | 0 (0.0%) |
| 35 to 64 Years | 47 (4.4%) | 14 (1.3%) |
| 65 to 74 Years | 30 (10.4%) | 8 (1.7%) |
| 75 Years and over | 8 (3.4%) | 0 (0.0%) |
Disability Class: Cognitive Difficulty
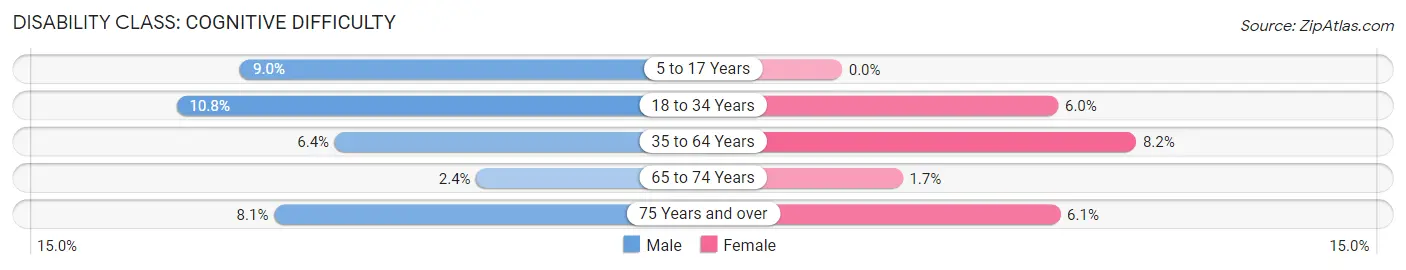
| Age Bracket | Male | Female |
| 5 to 17 Years | 27 (9.0%) | 0 (0.0%) |
| 18 to 34 Years | 53 (10.8%) | 46 (6.0%) |
| 35 to 64 Years | 68 (6.4%) | 87 (8.2%) |
| 65 to 74 Years | 7 (2.4%) | 8 (1.7%) |
| 75 Years and over | 19 (8.1%) | 16 (6.1%) |
Disability Class: Ambulatory Difficulty
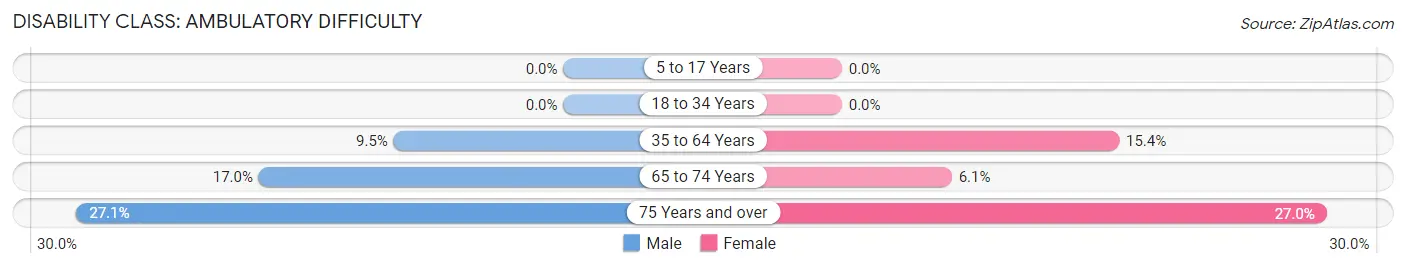
| Age Bracket | Male | Female |
| 5 to 17 Years | 0 (0.0%) | 0 (0.0%) |
| 18 to 34 Years | 0 (0.0%) | 0 (0.0%) |
| 35 to 64 Years | 101 (9.5%) | 164 (15.4%) |
| 65 to 74 Years | 49 (17.0%) | 29 (6.1%) |
| 75 Years and over | 64 (27.1%) | 71 (27.0%) |
Disability Class: Self-Care Difficulty
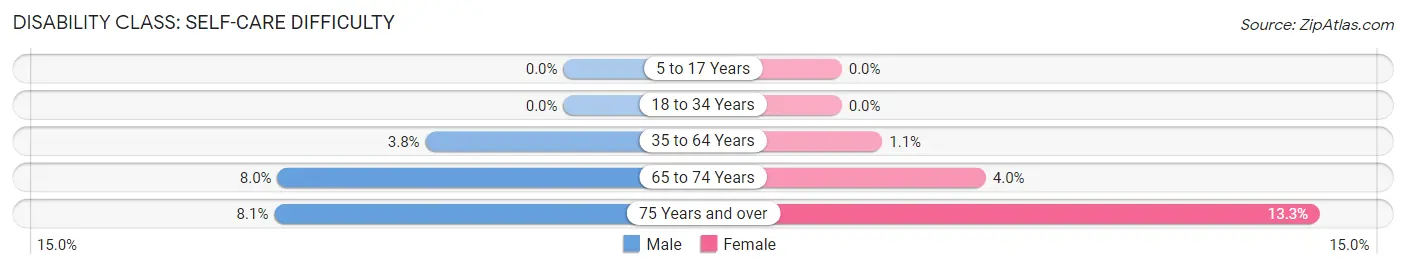
| Age Bracket | Male | Female |
| 5 to 17 Years | 0 (0.0%) | 0 (0.0%) |
| 18 to 34 Years | 0 (0.0%) | 0 (0.0%) |
| 35 to 64 Years | 41 (3.8%) | 12 (1.1%) |
| 65 to 74 Years | 23 (8.0%) | 19 (4.0%) |
| 75 Years and over | 19 (8.1%) | 35 (13.3%) |
Technology Access in Bath
Computing Device Access in Bath
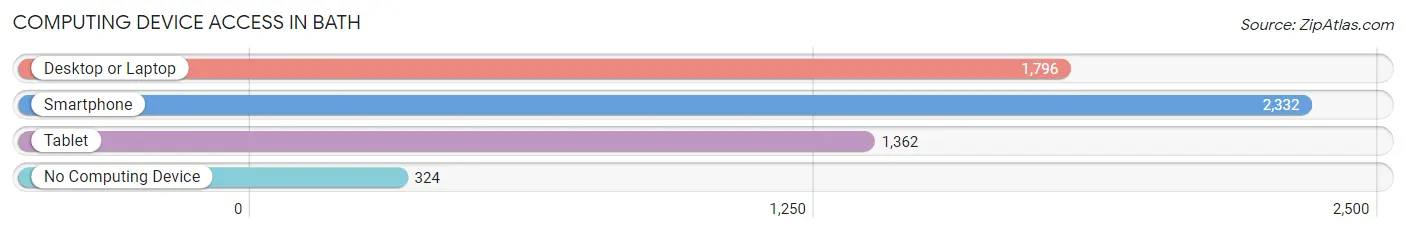
| Device Type | # Households | % Households |
| Desktop or Laptop | 1,796 | 63.6% |
| Smartphone | 2,332 | 82.6% |
| Tablet | 1,362 | 48.2% |
| No Computing Device | 324 | 11.5% |
| Total | 2,824 | 100.0% |
Internet Access in Bath
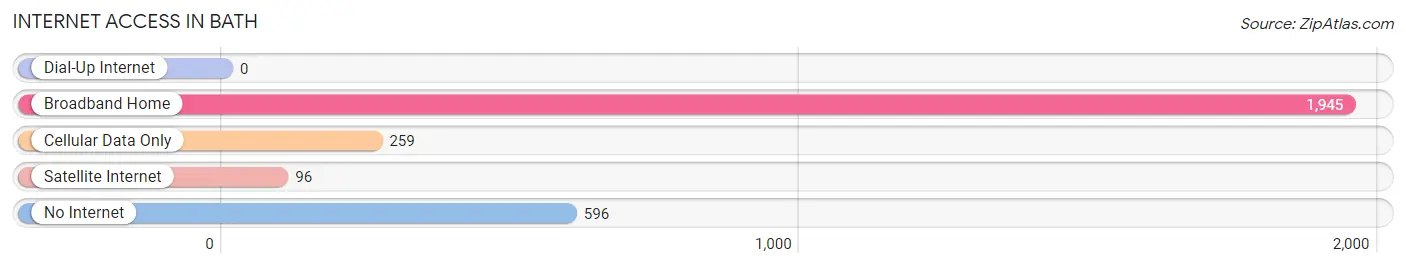
| Internet Type | # Households | % Households |
| Dial-Up Internet | 0 | 0.0% |
| Broadband Home | 1,945 | 68.9% |
| Cellular Data Only | 259 | 9.2% |
| Satellite Internet | 96 | 3.4% |
| No Internet | 596 | 21.1% |
| Total | 2,824 | 100.0% |
Bath Summary
Bath, NY is a small town located in Steuben County, New York. It is situated on the east side of the Finger Lakes region, and is bordered by the towns of Campbell, Cohocton, and Prattsburgh. The town was first settled in 1793, and was officially incorporated in 1808. The town is named after the city of Bath, England.
Geography
Bath is located in the Finger Lakes region of New York, and is situated on the east side of the region. The town is bordered by the towns of Campbell, Cohocton, and Prattsburgh. The town is located in the Southern Tier region of New York, and is approximately 30 miles south of Rochester. The town is situated on the east side of the Finger Lakes region, and is bordered by the towns of Campbell, Cohocton, and Prattsburgh. The town is located in the Southern Tier region of New York, and is approximately 30 miles south of Rochester. The town is situated on the east side of the Finger Lakes region, and is bordered by the towns of Campbell, Cohocton, and Prattsburgh. The town is located in the Southern Tier region of New York, and is approximately 30 miles south of Rochester.
The town of Bath is located in the Finger Lakes region of New York, and is situated on the east side of the region. The town is bordered by the towns of Campbell, Cohocton, and Prattsburgh. The town is located in the Southern Tier region of New York, and is approximately 30 miles south of Rochester. The town is situated on the east side of the Finger Lakes region, and is bordered by the towns of Campbell, Cohocton, and Prattsburgh. The town is located in the Southern Tier region of New York, and is approximately 30 miles south of Rochester.
The town of Bath is located in the Finger Lakes region of New York, and is situated on the east side of the region. The town is bordered by the towns of Campbell, Cohocton, and Prattsburgh. The town is located in the Southern Tier region of New York, and is approximately 30 miles south of Rochester. The town is situated on the east side of the Finger Lakes region, and is bordered by the towns of Campbell, Cohocton, and Prattsburgh. The town is located in the Southern Tier region of New York, and is approximately 30 miles south of Rochester.
The town of Bath is located in the Finger Lakes region of New York, and is situated on the east side of the region. The town is bordered by the towns of Campbell, Cohocton, and Prattsburgh. The town is located in the Southern Tier region of New York, and is approximately 30 miles south of Rochester. The town is situated on the east side of the Finger Lakes region, and is bordered by the towns of Campbell, Cohocton, and Prattsburgh. The town is located in the Southern Tier region of New York, and is approximately 30 miles south of Rochester.
The town of Bath is located in the Finger Lakes region of New York, and is situated on the east side of the region. The town is bordered by the towns of Campbell, Cohocton, and Prattsburgh. The town is located in the Southern Tier region of New York, and is approximately 30 miles south of Rochester. The town is situated on the east side of the Finger Lakes region, and is bordered by the towns of Campbell, Cohocton, and Prattsburgh. The town is located in the Southern Tier region of New York, and is approximately 30 miles south of Rochester.
Economy
The economy of Bath is largely based on agriculture and tourism. The town is home to several farms, which produce a variety of crops, including corn, soybeans, hay, and apples. The town is also home to several wineries, which produce a variety of wines. The town is also home to several small businesses, including restaurants, retail stores, and service providers.
The town of Bath is also home to several tourist attractions, including the Finger Lakes National Forest, the Corning Museum of Glass, and the Finger Lakes Wine Trail. The town is also home to several festivals and events, including the Bath Strawberry Festival, the Bath Apple Festival, and the Bath Harvest Festival.
Demographics
As of the 2010 census, the town of Bath had a population of 2,845. The population is largely white (96.2%), with a small percentage of African Americans (1.2%), Asians (0.7%), and Native Americans (0.2%). The median household income in the town is $45,938, and the median age is 43.7 years.
Conclusion
Bath, NY is a small town located in Steuben County, New York. It is situated on the east side of the Finger Lakes region, and is bordered by the towns of Campbell, Cohocton, and Prattsburgh. The town was first settled in 1793, and was officially incorporated in 1808. The town is named after the city of Bath, England. The economy of Bath is largely based on agriculture and tourism, and the town is home to several farms, wineries, and small businesses. The population of the town is largely white, with a median household income of $45,938 and a median age of 43.7 years.
Common Questions
What is Per Capita Income in Bath?
Per Capita income in Bath is $29,133.
What is the Median Family Income in Bath?
Median Family Income in Bath is $59,194.
What is the Median Household income in Bath?
Median Household Income in Bath is $42,832.
What is Income or Wage Gap in Bath?
Income or Wage Gap in Bath is 25.3%.
Women in Bath earn 74.7 cents for every dollar earned by a man.
What is Inequality or Gini Index in Bath?
Inequality or Gini Index in Bath is 0.44.
What is the Total Population of Bath?
Total Population of Bath is 5,606.
What is the Total Male Population of Bath?
Total Male Population of Bath is 2,560.
What is the Total Female Population of Bath?
Total Female Population of Bath is 3,046.
What is the Ratio of Males per 100 Females in Bath?
There are 84.04 Males per 100 Females in Bath.
What is the Ratio of Females per 100 Males in Bath?
There are 118.98 Females per 100 Males in Bath.
What is the Median Population Age in Bath?
Median Population Age in Bath is 46.7 Years.
What is the Average Family Size in Bath
Average Family Size in Bath is 2.7 People.
What is the Average Household Size in Bath
Average Household Size in Bath is 1.9 People.
How Large is the Labor Force in Bath?
There are 2,564 People in the Labor Forcein in Bath.
What is the Percentage of People in the Labor Force in Bath?
54.3% of People are in the Labor Force in Bath.
What is the Unemployment Rate in Bath?
Unemployment Rate in Bath is 6.9%.