Zip Codes with the Highest Percentage of Population with a Degree in Computers and Mathematics in Brooklyn, NY

RELATED REPORTS & OPTIONS

Computers and Mathematics
Population
Families and Households
Female Fertility
Female Fertility (Unmarried)
Race (Community Size)
Race (Percentage)
Ancestry (Community Size)
AfghanAfricanAlbanianAlsatianAmericanApacheArabArgentineanArmenianAssyrian / Chaldean / SyriacAustralianAustrianBahamianBangladeshiBarbadianBasqueBelgianBelizeanBermudanBhutaneseBlackfeetBolivianBrazilianBritishBritish West IndianBulgarianBurmeseCajunCambodianCanadianCape VerdeanCarpatho RusynCelticCentral AmericanCentral American IndianCherokeeChickasawChileanChippewaChoctawColombianCosta RicanCreekCroatianCrowCubanCypriotCzechCzechoslovakianDanishDominicanDutchDutch West IndianEastern EuropeanEcuadorianEgyptianEnglishEstonianEthiopianEuropeanFilipinoFinnishFrenchFrench American IndianFrench CanadianGermanGerman RussianGhanaianGreekGuamanian / ChamorroGuatemalanGuyaneseHaitianHonduranHungarianIcelanderIndian (Asian)IndonesianIranianIraqiIrishIroquoisIsraeliItalianJamaicanJapaneseJordanianKenyanKoreanLaotianLatvianLebaneseLiberianLithuanianLumbeeLuxembourgerMacedonianMalaysianMalteseMexicanMexican American IndianMongolianMoroccanNative HawaiianNavajoNew ZealanderNicaraguanNigerianNorthern EuropeanNorwegianOkinawanPakistaniPalestinianPanamanianParaguayanPennsylvania GermanPeruvianPolishPortuguesePuebloPuerto RicanRomanianRussianSalvadoranSamoanScandinavianScotch-IrishScottishSeminoleSenegaleseSerbianSierra LeoneanSiouxSlavicSlovakSloveneSomaliSouth AfricanSouth AmericanSouth American IndianSoviet UnionSpaniardSpanishSpanish AmericanSpanish American IndianSri LankanSubsaharan AfricanSudaneseSwedishSwissSyrianThaiTrinidadian and TobagonianTurkishU.S. Virgin IslanderUgandanUkrainianUruguayanVenezuelanVietnameseWelshWest IndianYugoslavian
Ancestry (Percentage)
AfghanAfricanAlbanianAlsatianAmericanApacheArabArgentineanArmenianAssyrian / Chaldean / SyriacAustralianAustrianBahamianBangladeshiBarbadianBasqueBelgianBelizeanBermudanBhutaneseBlackfeetBolivianBrazilianBritishBritish West IndianBulgarianBurmeseCajunCambodianCanadianCape VerdeanCarpatho RusynCelticCentral AmericanCentral American IndianCherokeeChickasawChileanChippewaChoctawColombianCosta RicanCreekCroatianCrowCubanCypriotCzechCzechoslovakianDanishDominicanDutchDutch West IndianEastern EuropeanEcuadorianEgyptianEnglishEstonianEthiopianEuropeanFilipinoFinnishFrenchFrench American IndianFrench CanadianGermanGerman RussianGhanaianGreekGuamanian / ChamorroGuatemalanGuyaneseHaitianHonduranHungarianIcelanderIndian (Asian)IndonesianIranianIraqiIrishIroquoisIsraeliItalianJamaicanJapaneseJordanianKenyanKoreanLaotianLatvianLebaneseLiberianLithuanianLumbeeLuxembourgerMacedonianMalaysianMalteseMexicanMexican American IndianMongolianMoroccanNative HawaiianNavajoNew ZealanderNicaraguanNigerianNorthern EuropeanNorwegianOkinawanPakistaniPalestinianPanamanianParaguayanPennsylvania GermanPeruvianPolishPortuguesePuebloPuerto RicanRomanianRussianSalvadoranSamoanScandinavianScotch-IrishScottishSeminoleSenegaleseSerbianSierra LeoneanSiouxSlavicSlovakSloveneSomaliSouth AfricanSouth AmericanSouth American IndianSoviet UnionSpaniardSpanishSpanish AmericanSpanish American IndianSri LankanSubsaharan AfricanSudaneseSwedishSwissSyrianThaiTrinidadian and TobagonianTurkishU.S. Virgin IslanderUgandanUkrainianUruguayanVenezuelanVietnameseWelshWest IndianYugoslavian
Immigrant Origin (Total)
AfghanistanAfricaAlbaniaArgentinaArmeniaAsiaAustraliaAustriaBahamasBangladeshBarbadosBelarusBelgiumBelizeBoliviaBosnia and HerzegovinaBrazilBulgariaBurma / MyanmarCambodiaCameroonCanadaCaribbeanCentral AmericaChileChinaColombiaCongoCosta RicaCroatiaCubaCzechoslovakiaDenmarkDominicaDominican RepublicEastern AfricaEastern AsiaEastern EuropeEcuadorEgyptEl SalvadorEnglandEritreaEthiopiaEuropeFranceGermanyGhanaGreeceGrenadaGuatemalaGuyanaHaitiHondurasHong KongHungaryIndiaIndonesiaIranIraqIrelandIsraelItalyJamaicaJapanJordanKazakhstanKenyaKoreaKuwaitLaosLatin AmericaLatviaLebanonLiberiaLithuaniaMalaysiaMexicoMicronesiaMiddle AfricaMoldovaMoroccoNepalNetherlandsNicaraguaNigeriaNorth MacedoniaNorthern AfricaNorthern EuropeNorwayOceaniaPakistanPanamaPeruPhilippinesPolandPortugalRomaniaRussiaSaudi ArabiaScotlandSenegalSerbiaSierra LeoneSingaporeSomaliaSouth AfricaSouth AmericaSouth Central AsiaSouth Eastern AsiaSouthern EuropeSpainSri LankaSt. Vincent and the GrenadinesSudanSwedenSwitzerlandSyriaTaiwanThailandTrinidad and TobagoTurkeyUgandaUkraineUruguayUzbekistanVenezuelaVietnamWest IndiesWestern AfricaWestern AsiaWestern EuropeYemenZaireZimbabwe
Immigrant Origin (Percentage)
AfghanistanAfricaAlbaniaArgentinaArmeniaAsiaAustraliaAustriaBahamasBangladeshBarbadosBelarusBelgiumBelizeBoliviaBosnia and HerzegovinaBrazilBulgariaBurma / MyanmarCambodiaCameroonCanadaCaribbeanCentral AmericaChileChinaColombiaCongoCosta RicaCroatiaCubaCzechoslovakiaDenmarkDominicaDominican RepublicEastern AfricaEastern AsiaEastern EuropeEcuadorEgyptEl SalvadorEnglandEritreaEthiopiaEuropeFranceGermanyGhanaGreeceGrenadaGuatemalaGuyanaHaitiHondurasHong KongHungaryIndiaIndonesiaIranIraqIrelandIsraelItalyJamaicaJapanJordanKazakhstanKenyaKoreaKuwaitLaosLatin AmericaLatviaLebanonLiberiaLithuaniaMalaysiaMexicoMicronesiaMiddle AfricaMoldovaMoroccoNepalNetherlandsNicaraguaNigeriaNorth MacedoniaNorthern AfricaNorthern EuropeNorwayOceaniaPakistanPanamaPeruPhilippinesPolandPortugalRomaniaRussiaSaudi ArabiaScotlandSenegalSerbiaSierra LeoneSingaporeSomaliaSouth AfricaSouth AmericaSouth Central AsiaSouth Eastern AsiaSouthern EuropeSpainSri LankaSt. Vincent and the GrenadinesSudanSwedenSwitzerlandSyriaTaiwanThailandTrinidad and TobagoTurkeyUgandaUkraineUruguayUzbekistanVenezuelaVietnamWest IndiesWestern AfricaWestern AsiaWestern EuropeYemenZaireZimbabwe
Income
Income (Families)
Income (Households)
Poverty
Poverty (Families)
Unemployment
Employment Occupations
Employment Industries
Employer Class
Commute Time
Commute Means
School Enrollment
Education by Degree Field
Occupancy
Finances
Physical Characteristics
Brooklyn
Compare Zip Codes
Comparison Subject

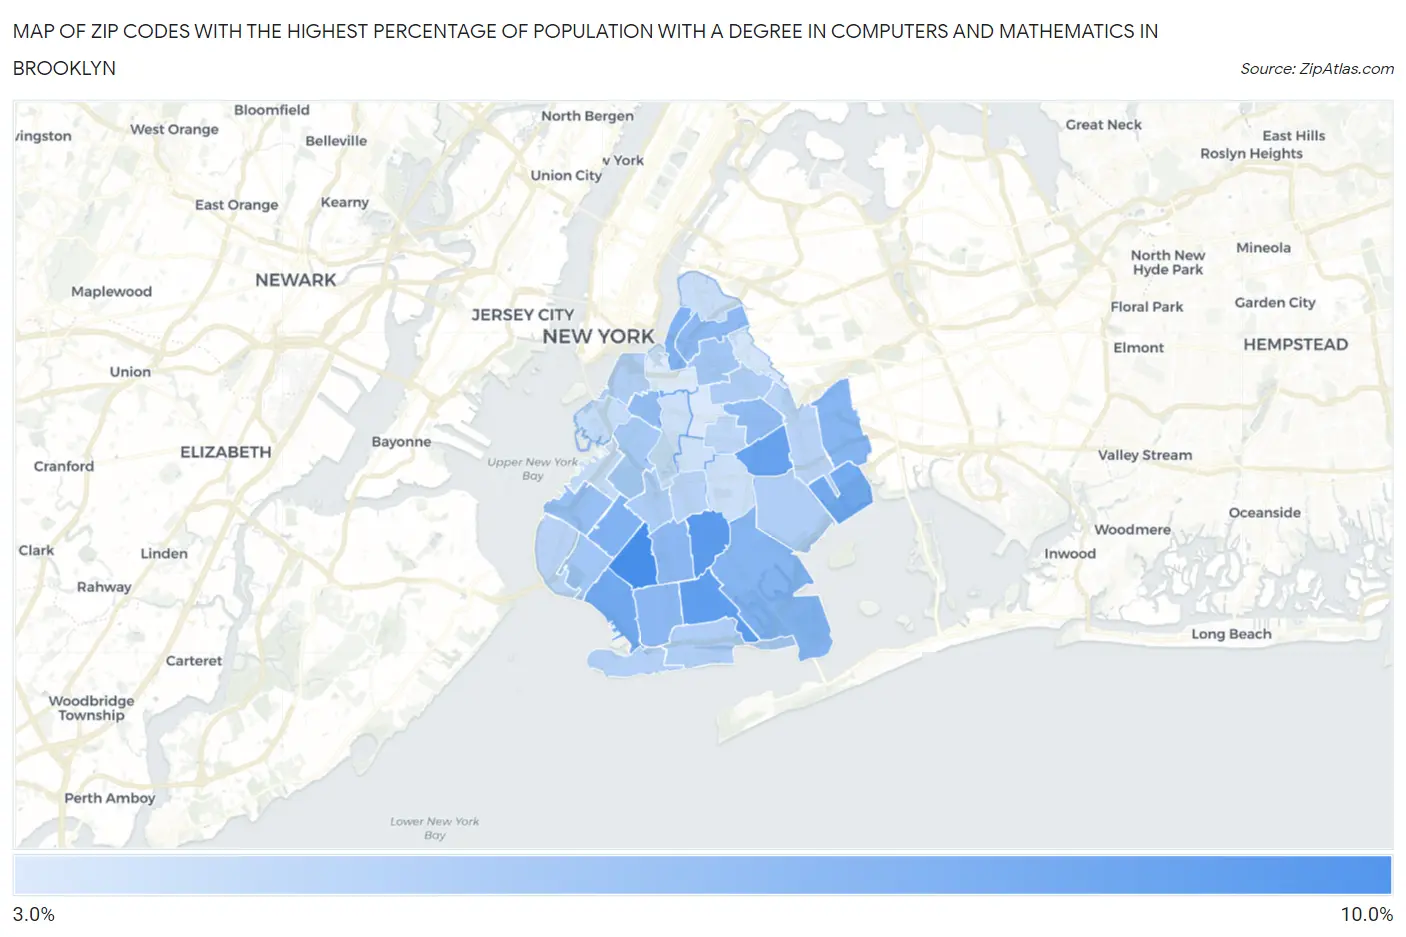
Map of Zip Codes with the Highest Percentage of Population with a Degree in Computers and Mathematics in Brooklyn

0.0%
10.0%
Zip Codes with the Highest Percentage of Population with a Degree in Computers and Mathematics in Brooklyn Map

Zip Codes with the Highest Percentage of Population with a Degree in Computers and Mathematics in Brooklyn, NY

Zip Code % Graduates vs State vs National
1.112049.2%4.7%(+4.45)#1074.9%(+4.28)#2,136
2.112108.4%4.7%(+3.64)#1444.9%(+3.47)#2,613
3.112298.1%4.7%(+3.37)#1584.9%(+3.20)#2,828
4.112127.9%4.7%(+3.13)#1684.9%(+2.96)#3,025
5.112147.3%4.7%(+2.60)#2074.9%(+2.43)#3,504
6.112397.3%4.7%(+2.58)#2094.9%(+2.41)#3,522
7.112196.8%4.7%(+2.09)#2504.9%(+1.92)#4,056
8.112496.7%4.7%(+1.98)#2574.9%(+1.81)#4,189
9.112346.5%4.7%(+1.80)#2764.9%(+1.63)#4,420
10.112086.5%4.7%(+1.79)#2784.9%(+1.62)#4,444
11.112306.3%4.7%(+1.62)#2974.9%(+1.45)#4,703
12.112236.3%4.7%(+1.61)#2984.9%(+1.44)#4,713
13.112116.2%4.7%(+1.49)#3174.9%(+1.32)#4,915
14.112336.1%4.7%(+1.38)#3294.9%(+1.21)#5,111
15.112176.1%4.7%(+1.38)#3304.9%(+1.21)#5,122
16.112205.8%4.7%(+1.12)#3604.9%(+0.946)#5,605
17.112065.4%4.7%(+0.705)#4104.9%(+0.534)#6,448
18.112285.4%4.7%(+0.645)#4194.9%(+0.474)#6,586
19.112155.3%4.7%(+0.530)#4424.9%(+0.359)#6,876
20.112185.1%4.7%(+0.358)#4734.9%(+0.187)#7,255
21.112214.9%4.7%(+0.214)#4894.9%(+0.044)#7,597
22.112354.9%4.7%(+0.155)#5064.9%(-0.016)#7,762
23.112014.8%4.7%(+0.101)#5194.9%(-0.069)#7,914
24.112364.8%4.7%(+0.097)#5214.9%(-0.073)#7,930
25.112244.7%4.7%(+0.008)#5434.9%(-0.163)#8,180
26.112074.6%4.7%(-0.116)#5674.9%(-0.287)#8,547
27.112264.6%4.7%(-0.140)#5724.9%(-0.311)#8,609
28.112094.5%4.7%(-0.181)#5804.9%(-0.351)#8,738
29.112134.3%4.7%(-0.438)#6364.9%(-0.609)#9,576
30.112324.1%4.7%(-0.635)#6854.9%(-0.805)#10,178
31.112314.1%4.7%(-0.652)#6924.9%(-0.822)#10,241
32.112223.9%4.7%(-0.774)#7104.9%(-0.945)#10,619
33.112033.7%4.7%(-0.980)#7654.9%(-1.15)#11,388
34.112383.7%4.7%(-0.993)#7684.9%(-1.16)#11,434
35.112253.6%4.7%(-1.10)#7944.9%(-1.27)#11,788
36.112373.5%4.7%(-1.26)#8414.9%(-1.43)#12,435
37.112163.3%4.7%(-1.46)#8904.9%(-1.64)#13,156
38.112053.1%4.7%(-1.60)#9174.9%(-1.77)#13,630

Common Questions

What are the Top 10 Zip Codes with the Highest Percentage of Population with a Degree in Computers and Mathematics in Brooklyn, NY?
Top 10 Zip Codes with the Highest Percentage of Population with a Degree in Computers and Mathematics in Brooklyn, NY are:
#1
9.2%
#2
8.4%
#3
8.1%
#4
7.9%
#5
7.3%
#6
7.3%
#7
6.8%
#8
6.7%
#9
6.5%
#10
6.5%
What zip code has the Highest Percentage of Population with a Degree in Computers and Mathematics in Brooklyn, NY?
11204 has the Highest Percentage of Population with a Degree in Computers and Mathematics in Brooklyn, NY with 9.2%.
What is the Percentage of Population with a Degree in Computers and Mathematics in New York?
Percentage of Population with a Degree in Computers and Mathematics in New York is 4.7%.
What is the Percentage of Population with a Degree in Computers and Mathematics in the United States?
Percentage of Population with a Degree in Computers and Mathematics in the United States is 4.9%.