Central Bridge, NY Map & Demographics
Central Bridge Map
Central Bridge Overview
$33,631
PER CAPITA INCOME
$82,716
AVG FAMILY INCOME
$77,303
AVG HOUSEHOLD INCOME
27.1%
WAGE / INCOME GAP [ % ]
72.9¢/ $1
WAGE / INCOME GAP [ $ ]
0.28
INEQUALITY / GINI INDEX
561
TOTAL POPULATION
300
MALE POPULATION
261
FEMALE POPULATION
114.94
MALES / 100 FEMALES
87.00
FEMALES / 100 MALES
35.9
MEDIAN AGE
2.5
AVG FAMILY SIZE
2.3
AVG HOUSEHOLD SIZE
352
LABOR FORCE [ PEOPLE ]
72.3%
PERCENT IN LABOR FORCE
4.5%
UNEMPLOYMENT RATE
Central Bridge Zip Codes
Central Bridge Area Codes
Income in Central Bridge
Income Overview in Central Bridge
Per Capita Income in Central Bridge is $33,631, while median incomes of families and households are $82,716 and $77,303 respectively.
| Characteristic | Number | Measure |
| Per Capita Income | 561 | $33,631 |
| Median Family Income | 187 | $82,716 |
| Mean Family Income | 187 | $72,669 |
| Median Household Income | 246 | $77,303 |
| Mean Household Income | 246 | $75,483 |
| Income Deficit | 187 | $0 |
| Wage / Income Gap (%) | 561 | 27.15% |
| Wage / Income Gap ($) | 561 | 72.85¢ per $1 |
| Gini / Inequality Index | 561 | 0.28 |
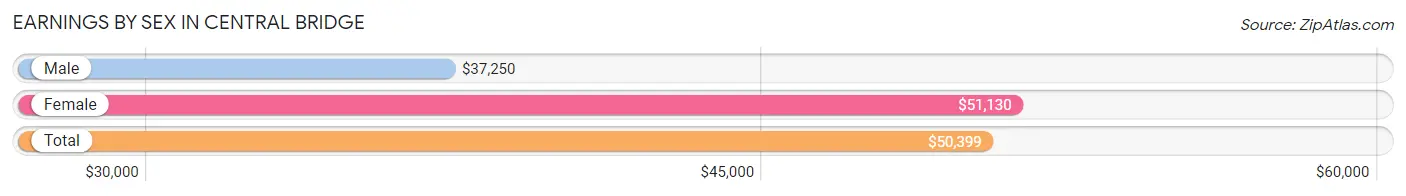
Earnings by Sex in Central Bridge
Average Earnings in Central Bridge are $50,399, $37,250 for men and $51,130 for women, a difference of 27.2%.
| Sex | Number | Average Earnings |
| Male | 213 (55.5%) | $37,250 |
| Female | 171 (44.5%) | $51,130 |
| Total | 384 (100.0%) | $50,399 |
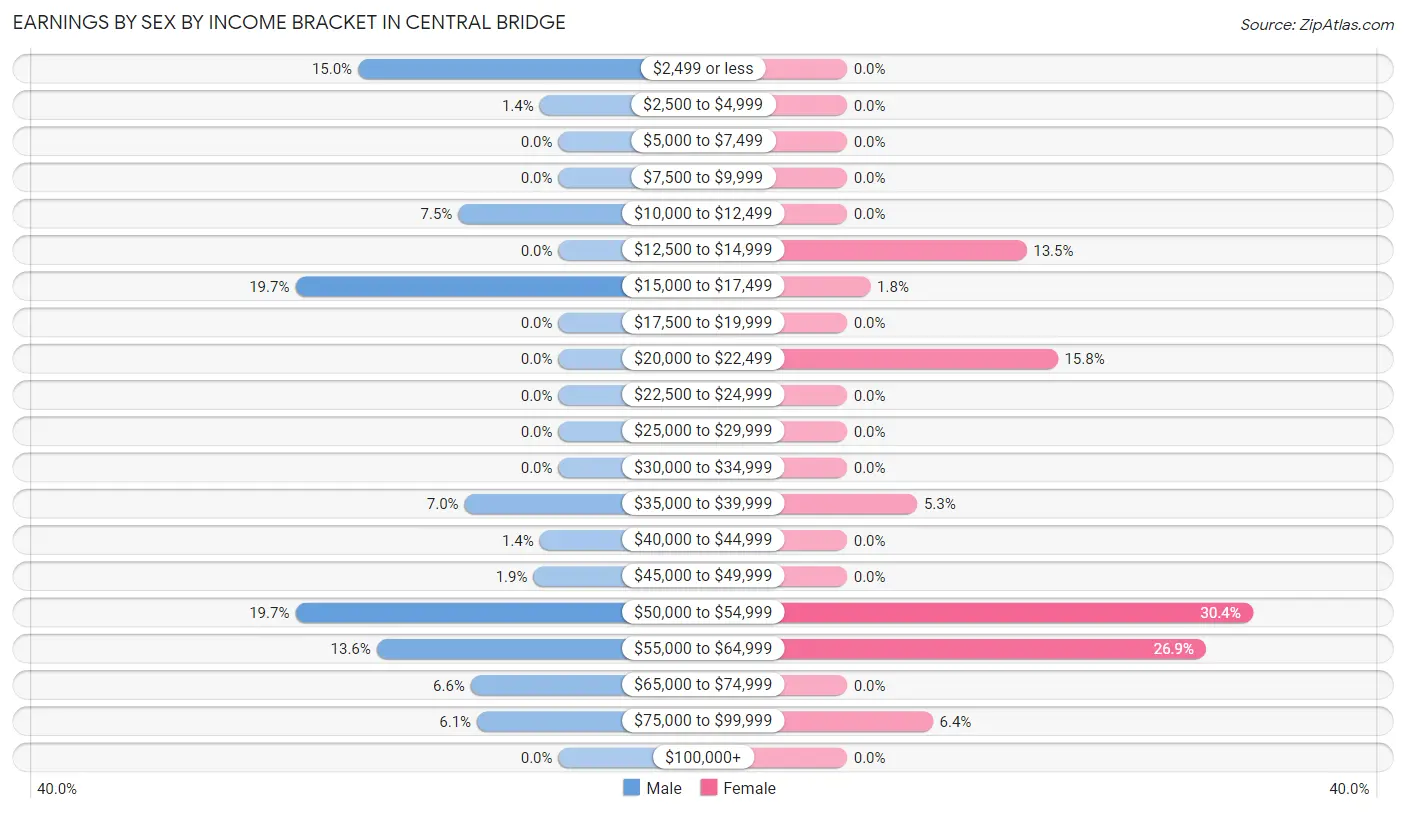
Earnings by Sex by Income Bracket in Central Bridge
The most common earnings brackets in Central Bridge are $15,000 to $17,499 for men (42 | 19.7%) and $50,000 to $54,999 for women (52 | 30.4%).
| Income | Male | Female |
| $2,499 or less | 32 (15.0%) | 0 (0.0%) |
| $2,500 to $4,999 | 3 (1.4%) | 0 (0.0%) |
| $5,000 to $7,499 | 0 (0.0%) | 0 (0.0%) |
| $7,500 to $9,999 | 0 (0.0%) | 0 (0.0%) |
| $10,000 to $12,499 | 16 (7.5%) | 0 (0.0%) |
| $12,500 to $14,999 | 0 (0.0%) | 23 (13.5%) |
| $15,000 to $17,499 | 42 (19.7%) | 3 (1.8%) |
| $17,500 to $19,999 | 0 (0.0%) | 0 (0.0%) |
| $20,000 to $22,499 | 0 (0.0%) | 27 (15.8%) |
| $22,500 to $24,999 | 0 (0.0%) | 0 (0.0%) |
| $25,000 to $29,999 | 0 (0.0%) | 0 (0.0%) |
| $30,000 to $34,999 | 0 (0.0%) | 0 (0.0%) |
| $35,000 to $39,999 | 15 (7.0%) | 9 (5.3%) |
| $40,000 to $44,999 | 3 (1.4%) | 0 (0.0%) |
| $45,000 to $49,999 | 4 (1.9%) | 0 (0.0%) |
| $50,000 to $54,999 | 42 (19.7%) | 52 (30.4%) |
| $55,000 to $64,999 | 29 (13.6%) | 46 (26.9%) |
| $65,000 to $74,999 | 14 (6.6%) | 0 (0.0%) |
| $75,000 to $99,999 | 13 (6.1%) | 11 (6.4%) |
| $100,000+ | 0 (0.0%) | 0 (0.0%) |
| Total | 213 (100.0%) | 171 (100.0%) |
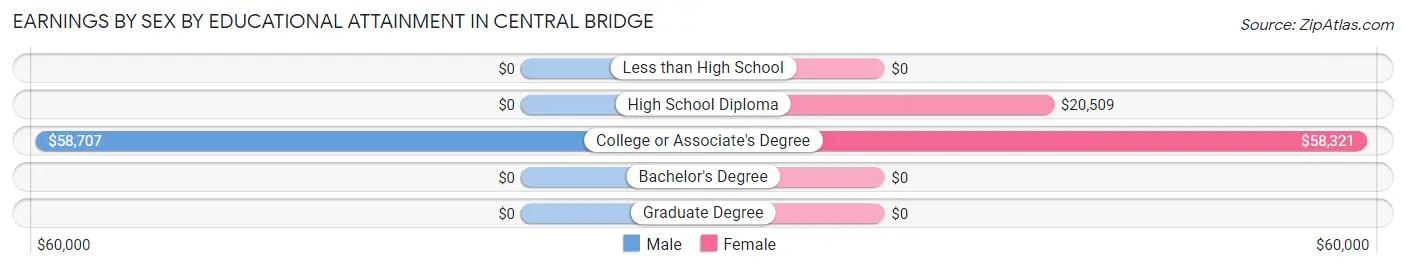
Earnings by Sex by Educational Attainment in Central Bridge
Average earnings in Central Bridge are $51,935 for men and $51,130 for women, a difference of 1.5%. Men with an educational attainment of college or associate's degree enjoy the highest average annual earnings of $58,707, while those with college or associate's degree education earn the least with $58,707. Women with an educational attainment of college or associate's degree earn the most with the average annual earnings of $58,321, while those with high school diploma education have the smallest earnings of $20,509.
| Educational Attainment | Male Income | Female Income |
| Less than High School | - | - |
| High School Diploma | - | - |
| College or Associate's Degree | $58,707 | $58,321 |
| Bachelor's Degree | - | - |
| Graduate Degree | - | - |
| Total | $51,935 | $51,130 |
Family Income in Central Bridge
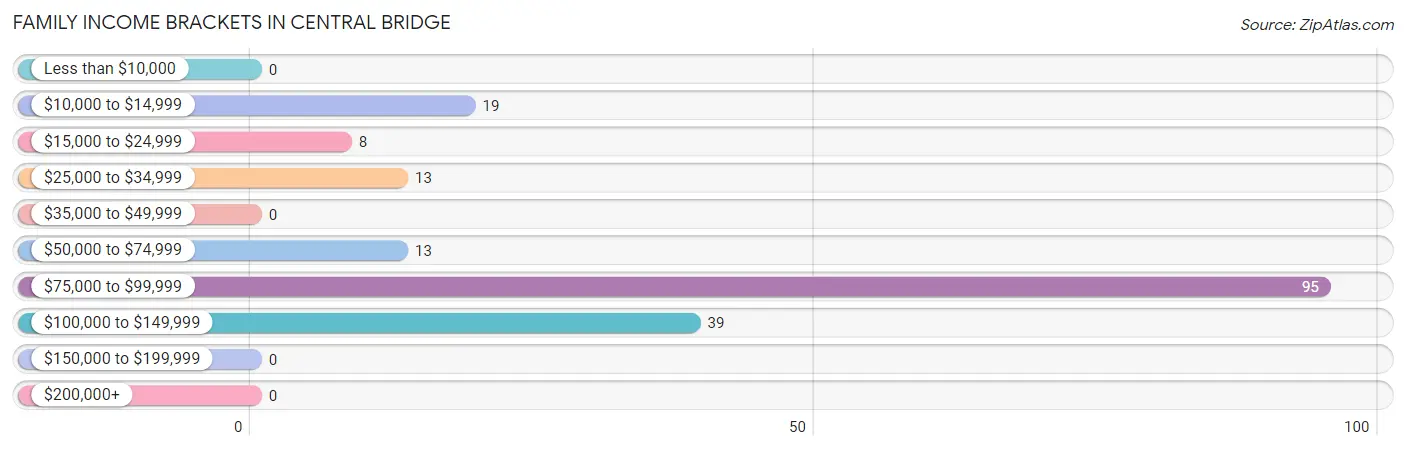
Family Income Brackets in Central Bridge
According to the Central Bridge family income data, there are 95 families falling into the $75,000 to $99,999 income range, which is the most common income bracket and makes up 50.8% of all families.
| Income Bracket | # Families | % Families |
| Less than $10,000 | 0 | 0.0% |
| $10,000 to $14,999 | 19 | 10.2% |
| $15,000 to $24,999 | 8 | 4.3% |
| $25,000 to $34,999 | 13 | 7.0% |
| $35,000 to $49,999 | 0 | 0.0% |
| $50,000 to $74,999 | 13 | 7.0% |
| $75,000 to $99,999 | 95 | 50.8% |
| $100,000 to $149,999 | 39 | 20.9% |
| $150,000 to $199,999 | 0 | 0.0% |
| $200,000+ | 0 | 0.0% |
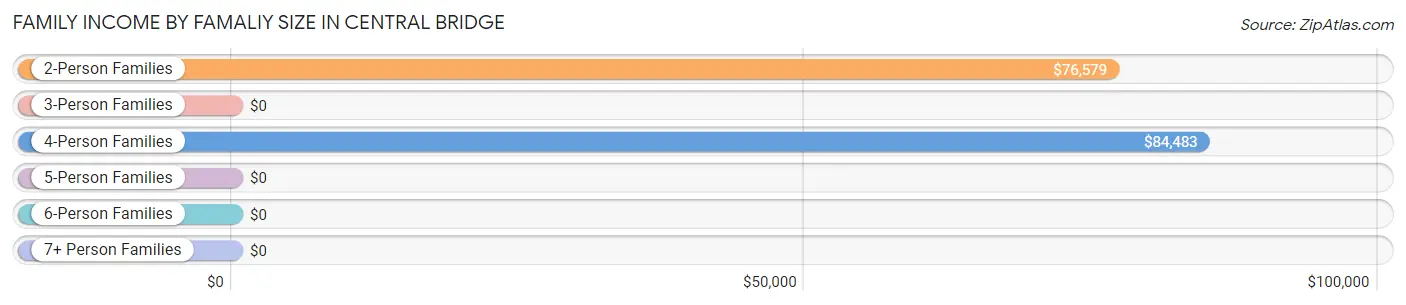
Family Income by Famaliy Size in Central Bridge
4-person families (46 | 24.6%) account for the highest median family income in Central Bridge with $84,483 per family, while 2-person families (128 | 68.4%) have the highest median income of $38,290 per family member.
| Income Bracket | # Families | Median Income |
| 2-Person Families | 128 (68.4%) | $76,579 |
| 3-Person Families | 13 (7.0%) | $0 |
| 4-Person Families | 46 (24.6%) | $84,483 |
| 5-Person Families | 0 (0.0%) | $0 |
| 6-Person Families | 0 (0.0%) | $0 |
| 7+ Person Families | 0 (0.0%) | $0 |
| Total | 187 (100.0%) | $82,716 |
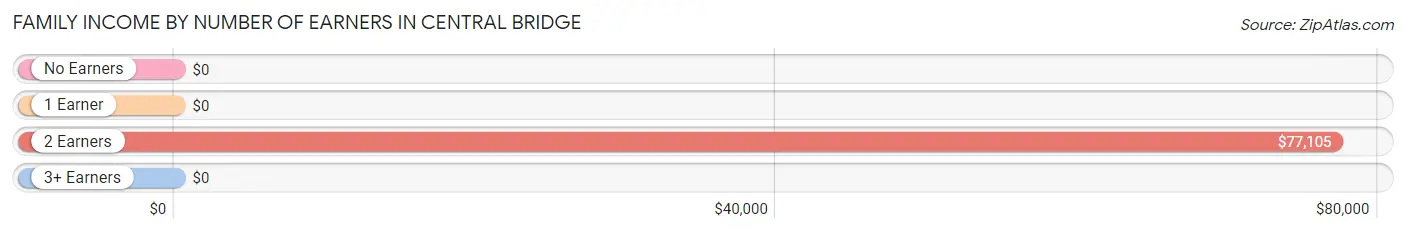
Family Income by Number of Earners in Central Bridge
| Number of Earners | # Families | Median Income |
| No Earners | 21 (11.2%) | $0 |
| 1 Earner | 43 (23.0%) | $0 |
| 2 Earners | 90 (48.1%) | $77,105 |
| 3+ Earners | 33 (17.6%) | $0 |
| Total | 187 (100.0%) | $82,716 |
Household Income in Central Bridge
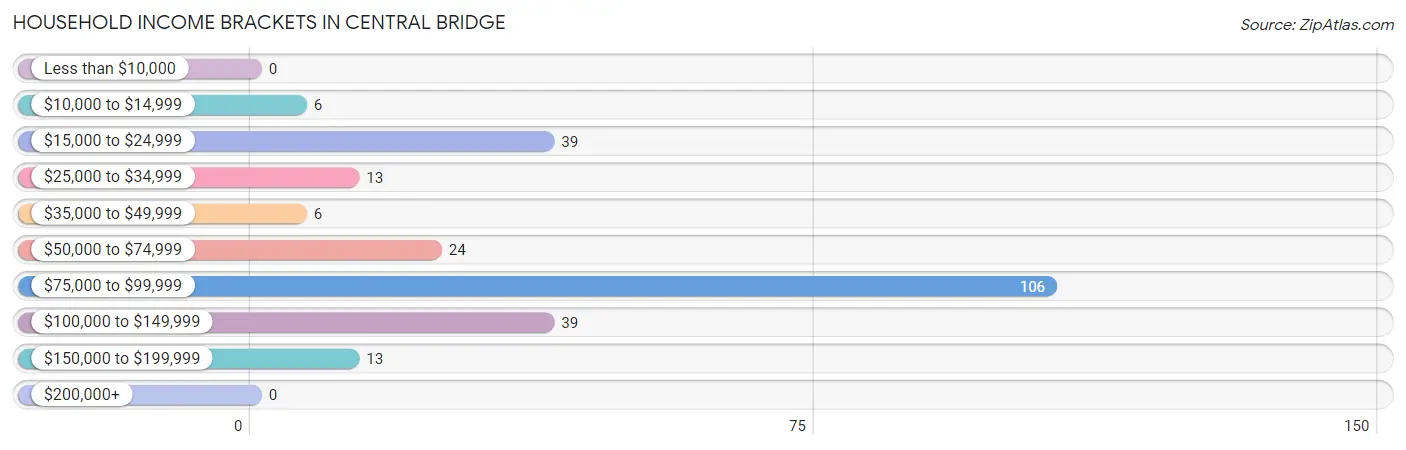
Household Income Brackets in Central Bridge
With 106 households falling in the category, the $75,000 to $99,999 income range is the most frequent in Central Bridge, accounting for 43.1% of all households.
| Income Bracket | # Households | % Households |
| Less than $10,000 | 0 | 0.0% |
| $10,000 to $14,999 | 6 | 2.4% |
| $15,000 to $24,999 | 39 | 15.9% |
| $25,000 to $34,999 | 13 | 5.3% |
| $35,000 to $49,999 | 6 | 2.4% |
| $50,000 to $74,999 | 24 | 9.8% |
| $75,000 to $99,999 | 106 | 43.1% |
| $100,000 to $149,999 | 39 | 15.9% |
| $150,000 to $199,999 | 13 | 5.3% |
| $200,000+ | 0 | 0.0% |
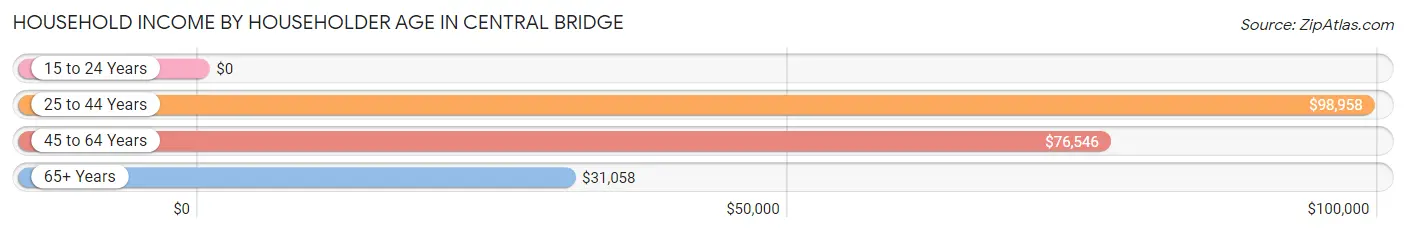
Household Income by Householder Age in Central Bridge
The median household income in Central Bridge is $77,303, with the highest median household income of $98,958 found in the 25 to 44 years age bracket for the primary householder. A total of 124 households (50.4%) fall into this category.
| Income Bracket | # Households | Median Income |
| 15 to 24 Years | 0 (0.0%) | $0 |
| 25 to 44 Years | 124 (50.4%) | $98,958 |
| 45 to 64 Years | 59 (24.0%) | $76,546 |
| 65+ Years | 63 (25.6%) | $31,058 |
| Total | 246 (100.0%) | $77,303 |
Poverty in Central Bridge
Income Below Poverty by Sex and Age in Central Bridge
With 10.3% poverty level for males and 7.3% for females among the residents of Central Bridge, 6 to 11 year old males and 25 to 34 year old females are the most vulnerable to poverty, with 9 males (100.0%) and 19 females (52.8%) in their respective age groups living below the poverty level.
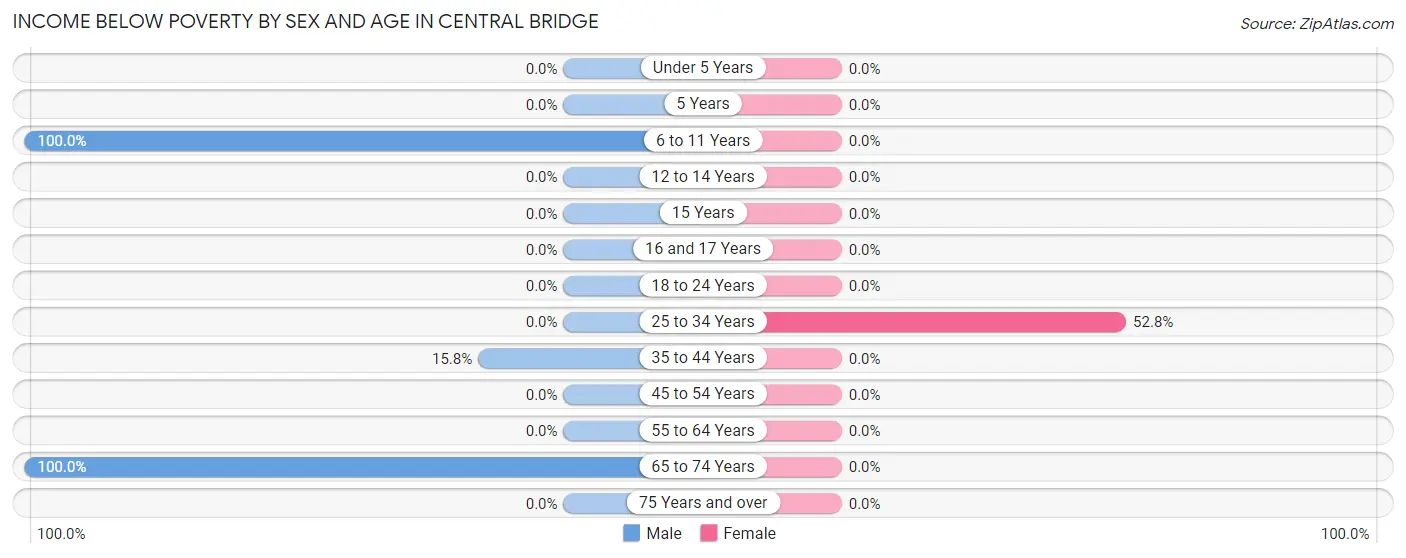
| Age Bracket | Male | Female |
| Under 5 Years | 0 (0.0%) | 0 (0.0%) |
| 5 Years | 0 (0.0%) | 0 (0.0%) |
| 6 to 11 Years | 9 (100.0%) | 0 (0.0%) |
| 12 to 14 Years | 0 (0.0%) | 0 (0.0%) |
| 15 Years | 0 (0.0%) | 0 (0.0%) |
| 16 and 17 Years | 0 (0.0%) | 0 (0.0%) |
| 18 to 24 Years | 0 (0.0%) | 0 (0.0%) |
| 25 to 34 Years | 0 (0.0%) | 19 (52.8%) |
| 35 to 44 Years | 16 (15.8%) | 0 (0.0%) |
| 45 to 54 Years | 0 (0.0%) | 0 (0.0%) |
| 55 to 64 Years | 0 (0.0%) | 0 (0.0%) |
| 65 to 74 Years | 6 (100.0%) | 0 (0.0%) |
| 75 Years and over | 0 (0.0%) | 0 (0.0%) |
| Total | 31 (10.3%) | 19 (7.3%) |
Income Above Poverty by Sex and Age in Central Bridge
According to the poverty statistics in Central Bridge, males aged 5 years and females aged under 5 years are the age groups that are most secure financially, with 100.0% of males and 100.0% of females in these age groups living above the poverty line.
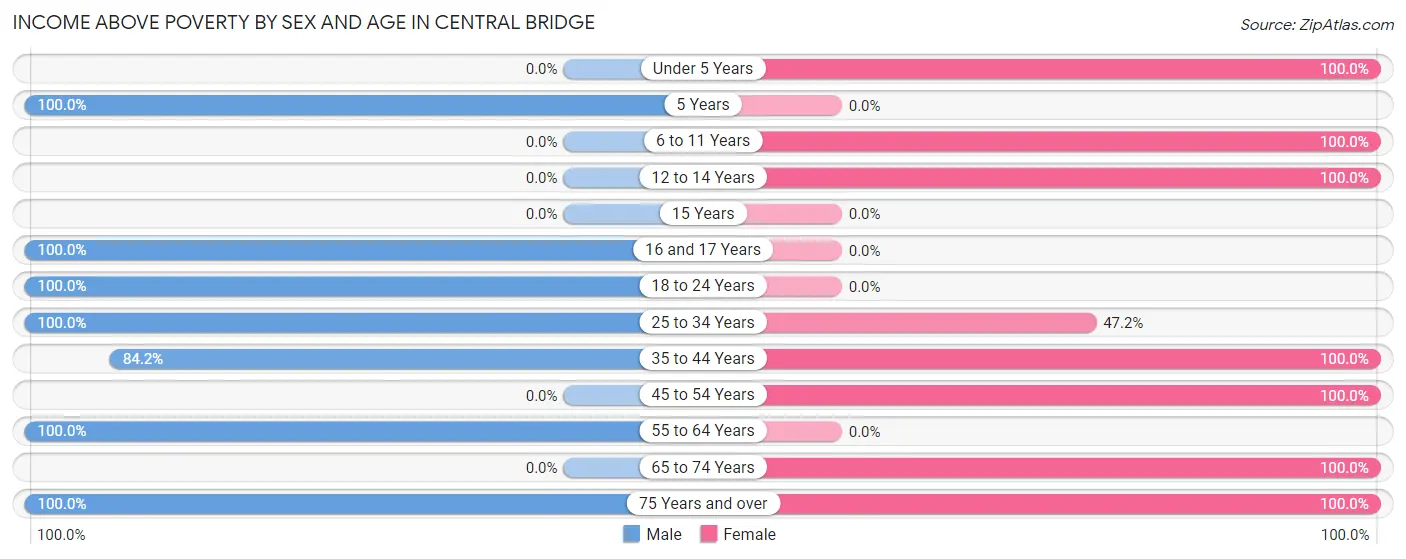
| Age Bracket | Male | Female |
| Under 5 Years | 0 (0.0%) | 14 (100.0%) |
| 5 Years | 15 (100.0%) | 0 (0.0%) |
| 6 to 11 Years | 0 (0.0%) | 11 (100.0%) |
| 12 to 14 Years | 0 (0.0%) | 25 (100.0%) |
| 15 Years | 0 (0.0%) | 0 (0.0%) |
| 16 and 17 Years | 35 (100.0%) | 0 (0.0%) |
| 18 to 24 Years | 63 (100.0%) | 0 (0.0%) |
| 25 to 34 Years | 23 (100.0%) | 17 (47.2%) |
| 35 to 44 Years | 85 (84.2%) | 79 (100.0%) |
| 45 to 54 Years | 0 (0.0%) | 59 (100.0%) |
| 55 to 64 Years | 7 (100.0%) | 0 (0.0%) |
| 65 to 74 Years | 0 (0.0%) | 18 (100.0%) |
| 75 Years and over | 41 (100.0%) | 19 (100.0%) |
| Total | 269 (89.7%) | 242 (92.7%) |
Income Below Poverty Among Married-Couple Families in Central Bridge
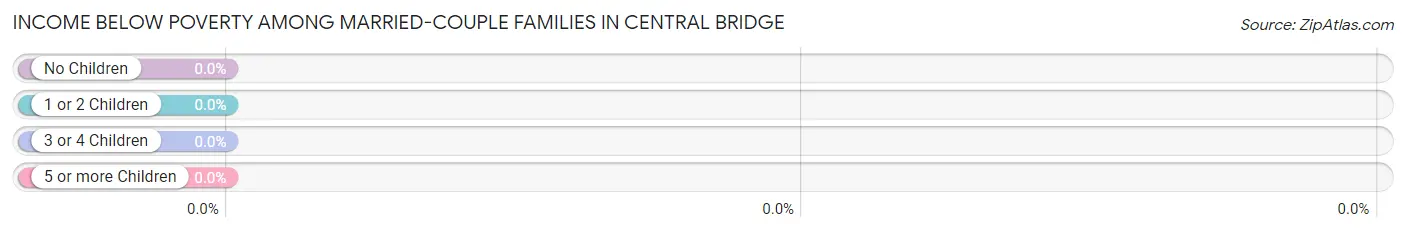
| Children | Above Poverty | Below Poverty |
| No Children | 63 (100.0%) | 0 (0.0%) |
| 1 or 2 Children | 46 (100.0%) | 0 (0.0%) |
| 3 or 4 Children | 0 (0.0%) | 0 (0.0%) |
| 5 or more Children | 0 (0.0%) | 0 (0.0%) |
| Total | 109 (100.0%) | 0 (0.0%) |
Income Below Poverty Among Single-Parent Households in Central Bridge
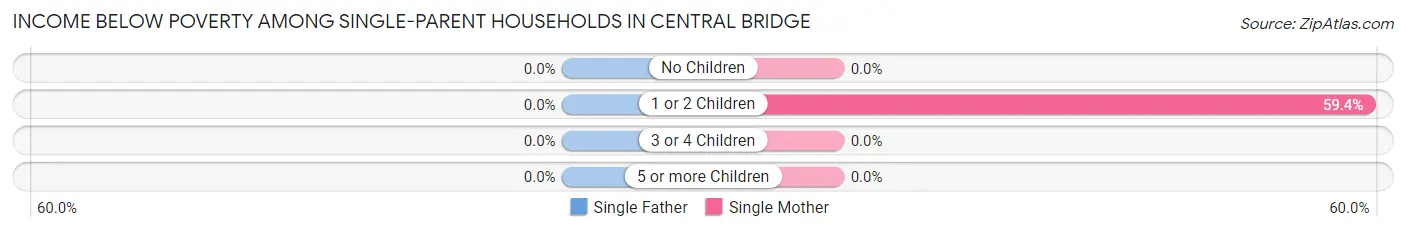
| Children | Single Father | Single Mother |
| No Children | 0 (0.0%) | 0 (0.0%) |
| 1 or 2 Children | 0 (0.0%) | 19 (59.4%) |
| 3 or 4 Children | 0 (0.0%) | 0 (0.0%) |
| 5 or more Children | 0 (0.0%) | 0 (0.0%) |
| Total | 0 (0.0%) | 19 (24.4%) |
Income Below Poverty Among Married-Couple vs Single-Parent Households in Central Bridge
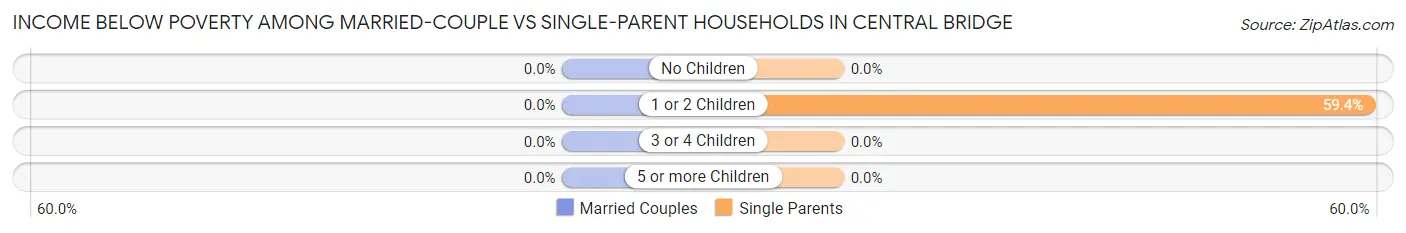
| Children | Married-Couple Families | Single-Parent Households |
| No Children | 0 (0.0%) | 0 (0.0%) |
| 1 or 2 Children | 0 (0.0%) | 19 (59.4%) |
| 3 or 4 Children | 0 (0.0%) | 0 (0.0%) |
| 5 or more Children | 0 (0.0%) | 0 (0.0%) |
| Total | 0 (0.0%) | 19 (24.4%) |
Race in Central Bridge
The most populous races in Central Bridge are White / Caucasian (540 | 96.3%), Two or more Races (15 | 2.7%), and Hawaiian / Pacific (6 | 1.1%).
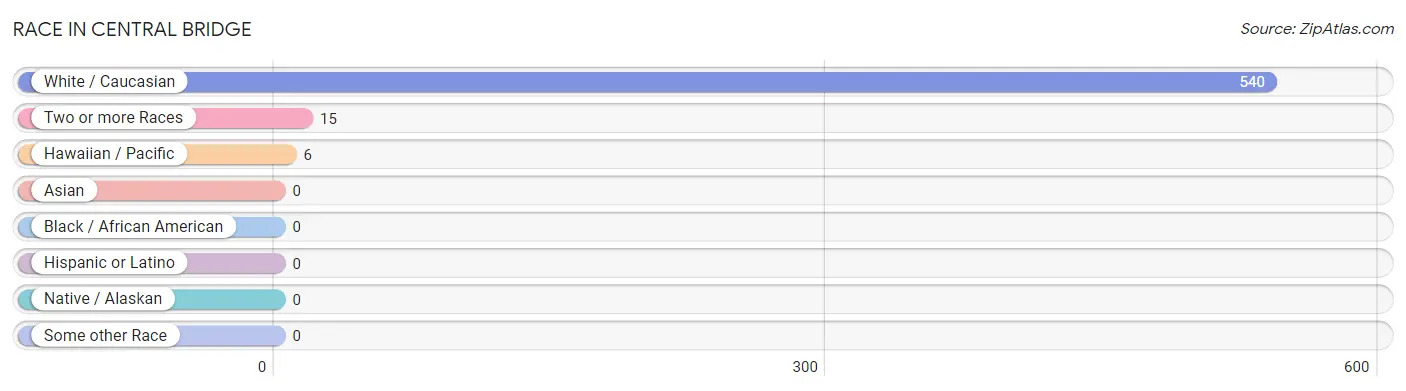
| Race | # Population | % Population |
| Asian | 0 | 0.0% |
| Black / African American | 0 | 0.0% |
| Hawaiian / Pacific | 6 | 1.1% |
| Hispanic or Latino | 0 | 0.0% |
| Native / Alaskan | 0 | 0.0% |
| White / Caucasian | 540 | 96.3% |
| Two or more Races | 15 | 2.7% |
| Some other Race | 0 | 0.0% |
| Total | 561 | 100.0% |
Ancestry in Central Bridge
The most populous ancestries reported in Central Bridge are German (127 | 22.6%), French (79 | 14.1%), Polish (78 | 13.9%), European (77 | 13.7%), and Irish (59 | 10.5%), together accounting for 74.9% of all Central Bridge residents.
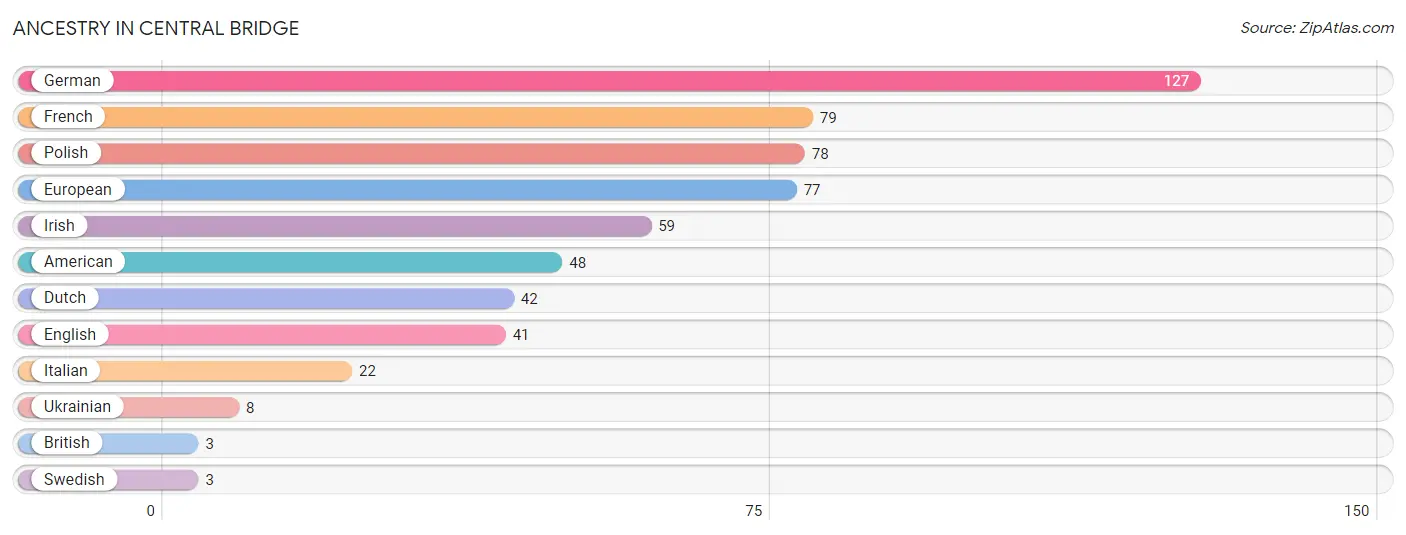
| Ancestry | # Population | % Population |
| American | 48 | 8.6% |
| British | 3 | 0.5% |
| Dutch | 42 | 7.5% |
| English | 41 | 7.3% |
| European | 77 | 13.7% |
| French | 79 | 14.1% |
| German | 127 | 22.6% |
| Irish | 59 | 10.5% |
| Italian | 22 | 3.9% |
| Polish | 78 | 13.9% |
| Swedish | 3 | 0.5% |
| Ukrainian | 8 | 1.4% | View All 12 Rows |
Immigrants in Central Bridge
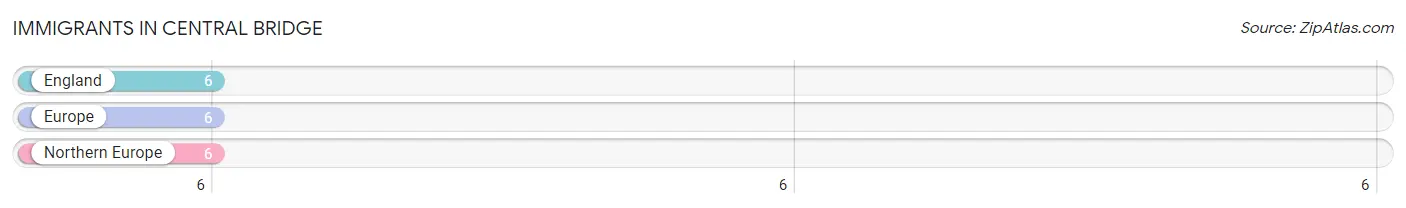
The most numerous immigrant groups reported in Central Bridge came from England (6 | 1.1%), Europe (6 | 1.1%), and Northern Europe (6 | 1.1%), together accounting for 3.2% of all Central Bridge residents.
| Immigration Origin | # Population | % Population |
| England | 6 | 1.1% |
| Europe | 6 | 1.1% |
| Northern Europe | 6 | 1.1% | View All 3 Rows |
Sex and Age in Central Bridge
Sex and Age in Central Bridge
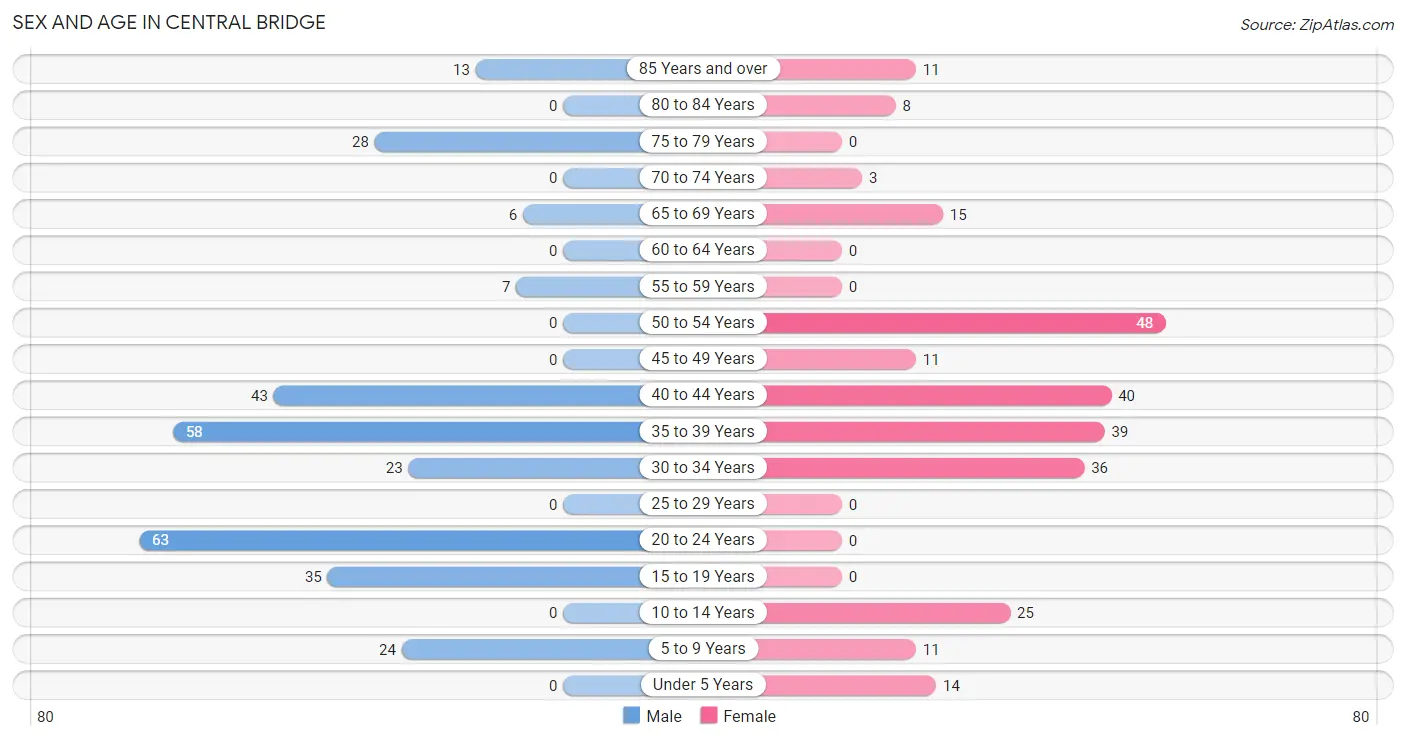
The most populous age groups in Central Bridge are 20 to 24 Years (63 | 21.0%) for men and 50 to 54 Years (48 | 18.4%) for women.
| Age Bracket | Male | Female |
| Under 5 Years | 0 (0.0%) | 14 (5.4%) |
| 5 to 9 Years | 24 (8.0%) | 11 (4.2%) |
| 10 to 14 Years | 0 (0.0%) | 25 (9.6%) |
| 15 to 19 Years | 35 (11.7%) | 0 (0.0%) |
| 20 to 24 Years | 63 (21.0%) | 0 (0.0%) |
| 25 to 29 Years | 0 (0.0%) | 0 (0.0%) |
| 30 to 34 Years | 23 (7.7%) | 36 (13.8%) |
| 35 to 39 Years | 58 (19.3%) | 39 (14.9%) |
| 40 to 44 Years | 43 (14.3%) | 40 (15.3%) |
| 45 to 49 Years | 0 (0.0%) | 11 (4.2%) |
| 50 to 54 Years | 0 (0.0%) | 48 (18.4%) |
| 55 to 59 Years | 7 (2.3%) | 0 (0.0%) |
| 60 to 64 Years | 0 (0.0%) | 0 (0.0%) |
| 65 to 69 Years | 6 (2.0%) | 15 (5.8%) |
| 70 to 74 Years | 0 (0.0%) | 3 (1.1%) |
| 75 to 79 Years | 28 (9.3%) | 0 (0.0%) |
| 80 to 84 Years | 0 (0.0%) | 8 (3.1%) |
| 85 Years and over | 13 (4.3%) | 11 (4.2%) |
| Total | 300 (100.0%) | 261 (100.0%) |
Families and Households in Central Bridge
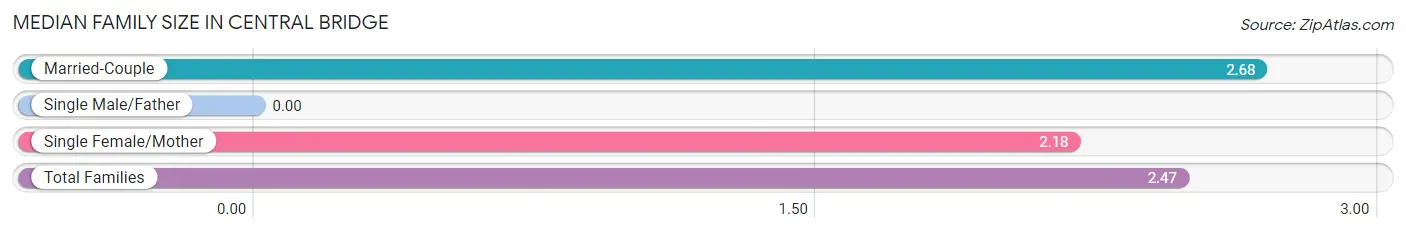
Median Family Size in Central Bridge
| Family Type | # Families | Family Size |
| Married-Couple | 109 (58.3%) | 2.68 |
| Single Male/Father | 0 (0.0%) | - |
| Single Female/Mother | 78 (41.7%) | 2.18 |
| Total Families | 187 (100.0%) | 2.47 |
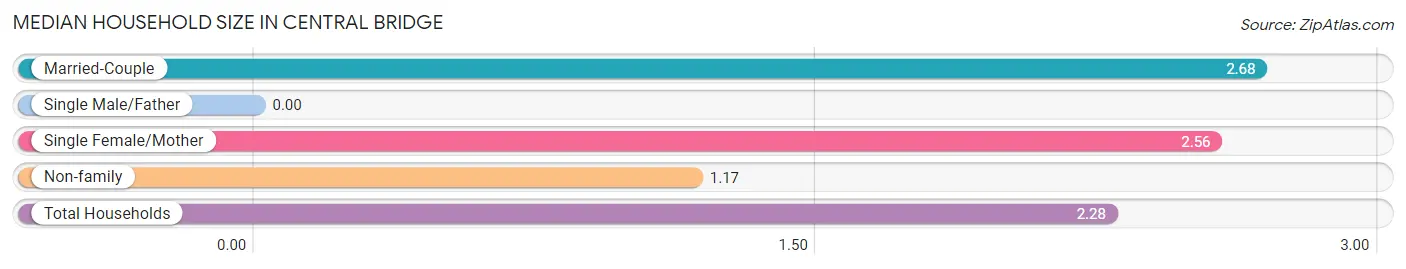
Median Household Size in Central Bridge
| Household Type | # Households | Household Size |
| Married-Couple | 109 (44.3%) | 2.68 |
| Single Male/Father | 0 (0.0%) | - |
| Single Female/Mother | 78 (31.7%) | 2.56 |
| Non-family | 59 (24.0%) | 1.17 |
| Total Households | 246 (100.0%) | 2.28 |
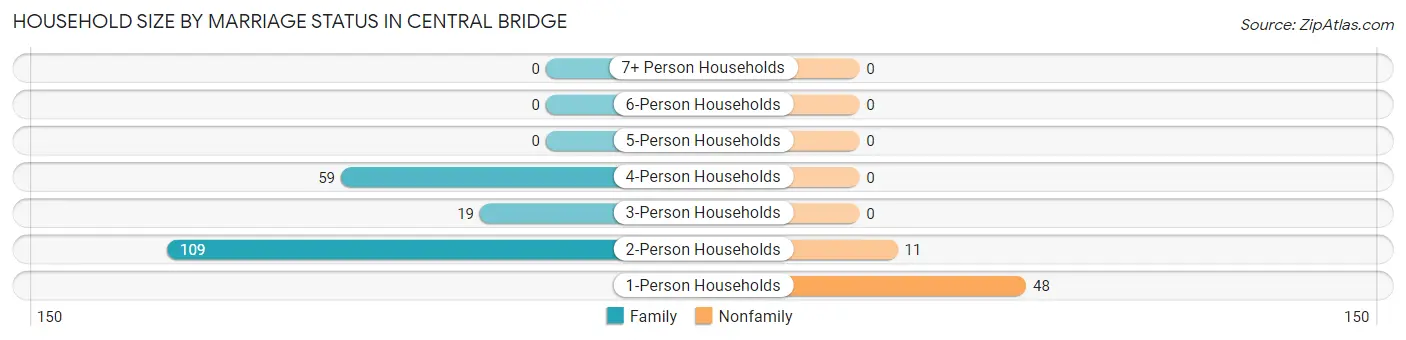
Household Size by Marriage Status in Central Bridge
Out of a total of 246 households in Central Bridge, 187 (76.0%) are family households, while 59 (24.0%) are nonfamily households. The most numerous type of family households are 2-person households, comprising 109, and the most common type of nonfamily households are 1-person households, comprising 48.
| Household Size | Family Households | Nonfamily Households |
| 1-Person Households | - | 48 (19.5%) |
| 2-Person Households | 109 (44.3%) | 11 (4.5%) |
| 3-Person Households | 19 (7.7%) | 0 (0.0%) |
| 4-Person Households | 59 (24.0%) | 0 (0.0%) |
| 5-Person Households | 0 (0.0%) | 0 (0.0%) |
| 6-Person Households | 0 (0.0%) | 0 (0.0%) |
| 7+ Person Households | 0 (0.0%) | 0 (0.0%) |
| Total | 187 (76.0%) | 59 (24.0%) |
Female Fertility in Central Bridge
Fertility by Age in Central Bridge
| Age Bracket | Women with Births | Births / 1,000 Women |
| 15 to 19 years | 0 (0.0%) | 0.0 |
| 20 to 34 years | 0 (0.0%) | 0.0 |
| 35 to 50 years | 0 (0.0%) | 0.0 |
| Total | 0 (0.0%) | 0.0 |
Fertility by Age by Marriage Status in Central Bridge
| Age Bracket | Married | Unmarried |
| 15 to 19 years | 0 (0.0%) | 0 (0.0%) |
| 20 to 34 years | 0 (0.0%) | 0 (0.0%) |
| 35 to 50 years | 0 (0.0%) | 0 (0.0%) |
| Total | 0 (0.0%) | 0 (0.0%) |
Fertility by Education in Central Bridge
| Educational Attainment | Women with Births | Births / 1,000 Women |
| Less than High School | 0 (0.0%) | 0.0 |
| High School Diploma | 0 (0.0%) | 0.0 |
| College or Associate's Degree | 0 (0.0%) | 0.0 |
| Bachelor's Degree | 0 (0.0%) | 0.0 |
| Graduate Degree | 0 (0.0%) | 0.0 |
| Total | 0 (0.0%) | 0.0 |
Fertility by Education by Marriage Status in Central Bridge
| Educational Attainment | Married | Unmarried |
| Less than High School | 0 (0.0%) | 0 (0.0%) |
| High School Diploma | 0 (0.0%) | 0 (0.0%) |
| College or Associate's Degree | 0 (0.0%) | 0 (0.0%) |
| Bachelor's Degree | 0 (0.0%) | 0 (0.0%) |
| Graduate Degree | 0 (0.0%) | 0 (0.0%) |
| Total | 0 (0.0%) | 0 (0.0%) |
Employment Characteristics in Central Bridge
Employment by Class of Employer in Central Bridge
Among the 336 employed individuals in Central Bridge, private company employees (181 | 53.9%), not-for-profit organizations (74 | 22.0%), and local government employees (69 | 20.5%) make up the most common classes of employment.
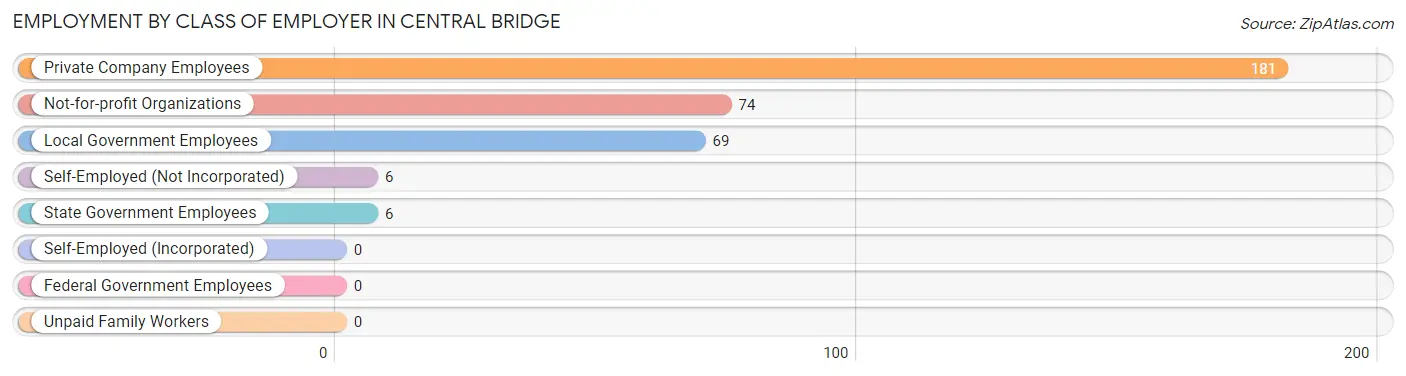
| Employer Class | # Employees | % Employees |
| Private Company Employees | 181 | 53.9% |
| Self-Employed (Incorporated) | 0 | 0.0% |
| Self-Employed (Not Incorporated) | 6 | 1.8% |
| Not-for-profit Organizations | 74 | 22.0% |
| Local Government Employees | 69 | 20.5% |
| State Government Employees | 6 | 1.8% |
| Federal Government Employees | 0 | 0.0% |
| Unpaid Family Workers | 0 | 0.0% |
| Total | 336 | 100.0% |
Employment Status by Age in Central Bridge
According to the labor force statistics for Central Bridge, out of the total population over 16 years of age (487), 72.3% or 352 individuals are in the labor force, with 4.5% or 16 of them unemployed. The age group with the highest labor force participation rate is 35 to 44 years, with 100.0% or 180 individuals in the labor force. Within the labor force, the 35 to 44 years age range has the highest percentage of unemployed individuals, with 8.9% or 16 of them being unemployed.
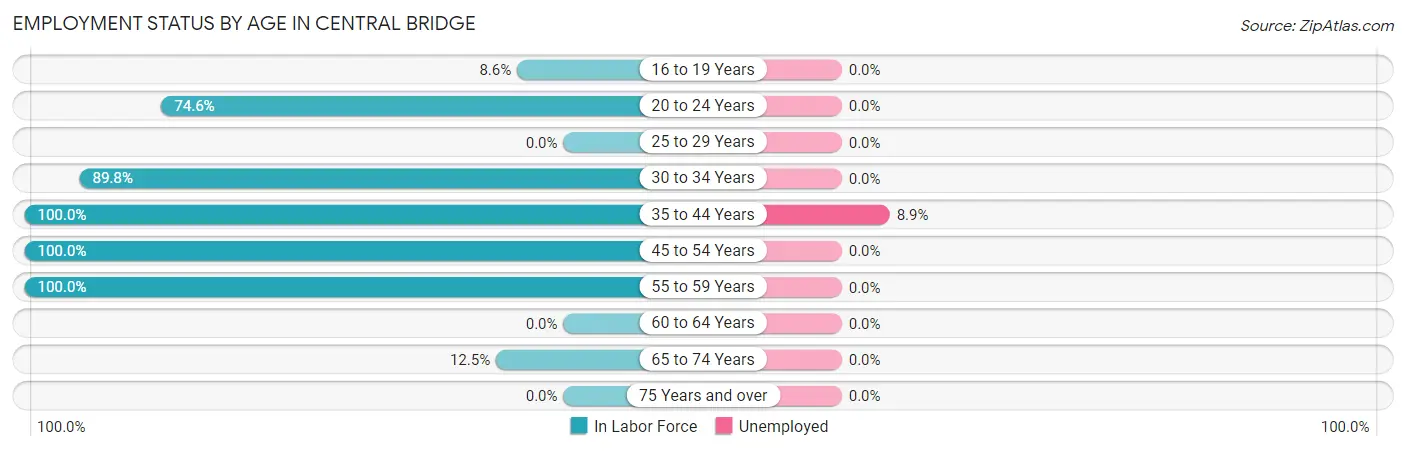
| Age Bracket | In Labor Force | Unemployed |
| 16 to 19 Years | 3 (8.6%) | 0 (0.0%) |
| 20 to 24 Years | 47 (74.6%) | 0 (0.0%) |
| 25 to 29 Years | 0 (0.0%) | 0 (0.0%) |
| 30 to 34 Years | 53 (89.8%) | 0 (0.0%) |
| 35 to 44 Years | 180 (100.0%) | 16 (8.9%) |
| 45 to 54 Years | 59 (100.0%) | 0 (0.0%) |
| 55 to 59 Years | 7 (100.0%) | 0 (0.0%) |
| 60 to 64 Years | 0 (0.0%) | 0 (0.0%) |
| 65 to 74 Years | 3 (12.5%) | 0 (0.0%) |
| 75 Years and over | 0 (0.0%) | 0 (0.0%) |
| Total | 352 (72.3%) | 16 (4.5%) |
Employment Status by Educational Attainment in Central Bridge
According to labor force statistics for Central Bridge, 98.0% of individuals (299) out of the total population between 25 and 64 years of age (305) are in the labor force, with 5.4% or 16 of them being unemployed. The group with the highest labor force participation rate are those with the educational attainment of college / associate degree, with 100.0% or 125 individuals in the labor force. Within the labor force, individuals with high school diploma education have the highest percentage of unemployment, with 19.5% or 16 of them being unemployed.
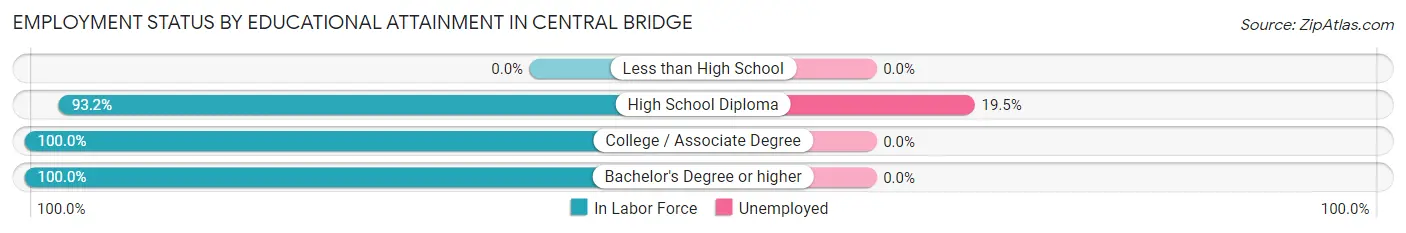
| Educational Attainment | In Labor Force | Unemployed |
| Less than High School | 0 (0.0%) | 0 (0.0%) |
| High School Diploma | 82 (93.2%) | 17 (19.5%) |
| College / Associate Degree | 125 (100.0%) | 0 (0.0%) |
| Bachelor's Degree or higher | 92 (100.0%) | 0 (0.0%) |
| Total | 299 (98.0%) | 16 (5.4%) |
Employment Occupations by Sex in Central Bridge
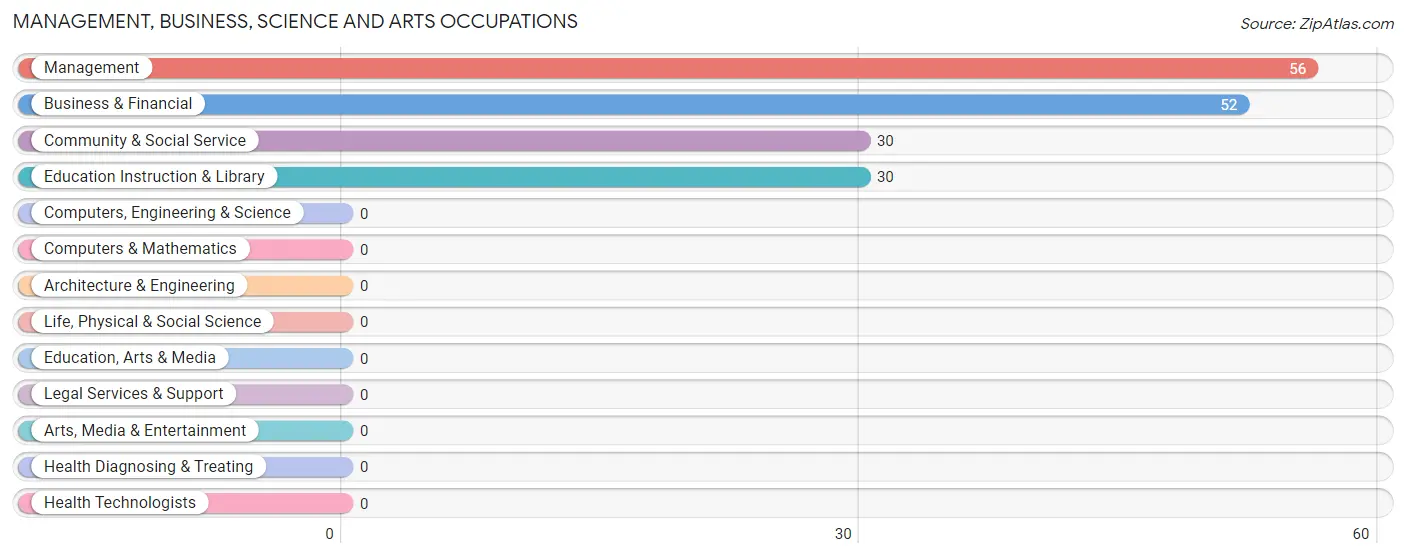
Management, Business, Science and Arts Occupations
The most common Management, Business, Science and Arts occupations in Central Bridge are Management (56 | 16.7%), Business & Financial (52 | 15.5%), Community & Social Service (30 | 8.9%), and Education Instruction & Library (30 | 8.9%).
Management, Business, Science and Arts Occupations by Sex
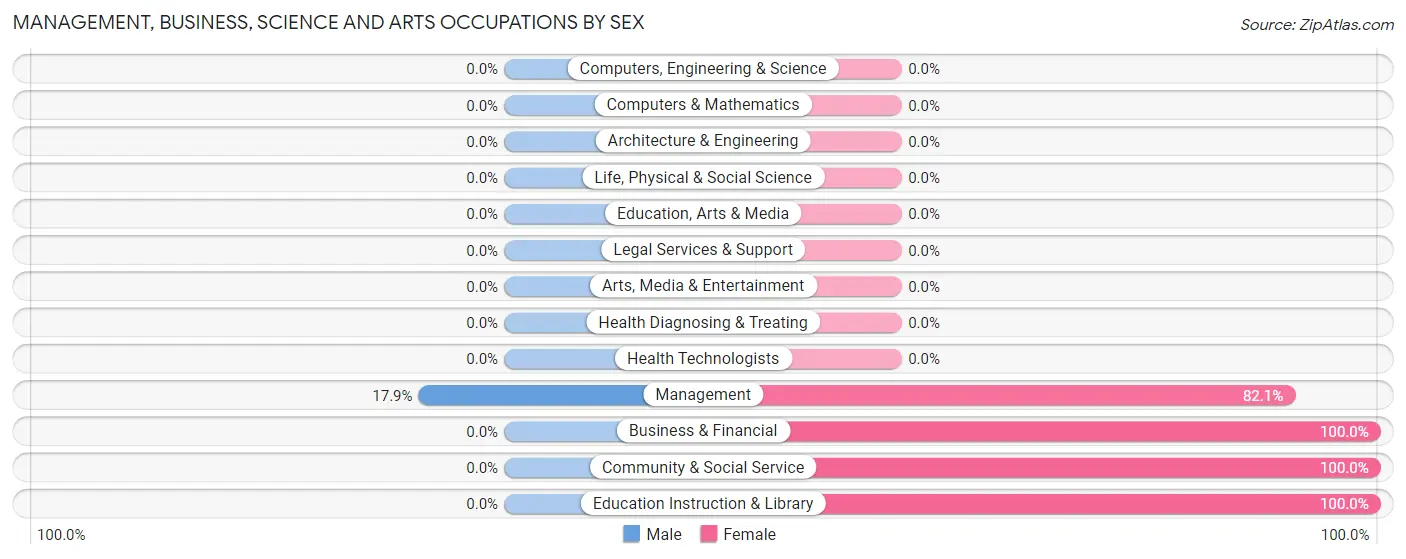
| Occupation | Male | Female |
| Management | 10 (17.9%) | 46 (82.1%) |
| Business & Financial | 0 (0.0%) | 52 (100.0%) |
| Computers, Engineering & Science | 0 (0.0%) | 0 (0.0%) |
| Computers & Mathematics | 0 (0.0%) | 0 (0.0%) |
| Architecture & Engineering | 0 (0.0%) | 0 (0.0%) |
| Life, Physical & Social Science | 0 (0.0%) | 0 (0.0%) |
| Community & Social Service | 0 (0.0%) | 30 (100.0%) |
| Education, Arts & Media | 0 (0.0%) | 0 (0.0%) |
| Legal Services & Support | 0 (0.0%) | 0 (0.0%) |
| Education Instruction & Library | 0 (0.0%) | 30 (100.0%) |
| Arts, Media & Entertainment | 0 (0.0%) | 0 (0.0%) |
| Health Diagnosing & Treating | 0 (0.0%) | 0 (0.0%) |
| Health Technologists | 0 (0.0%) | 0 (0.0%) |
| Total (Category) | 10 (7.2%) | 128 (92.7%) |
| Total (Overall) | 165 (49.1%) | 171 (50.9%) |
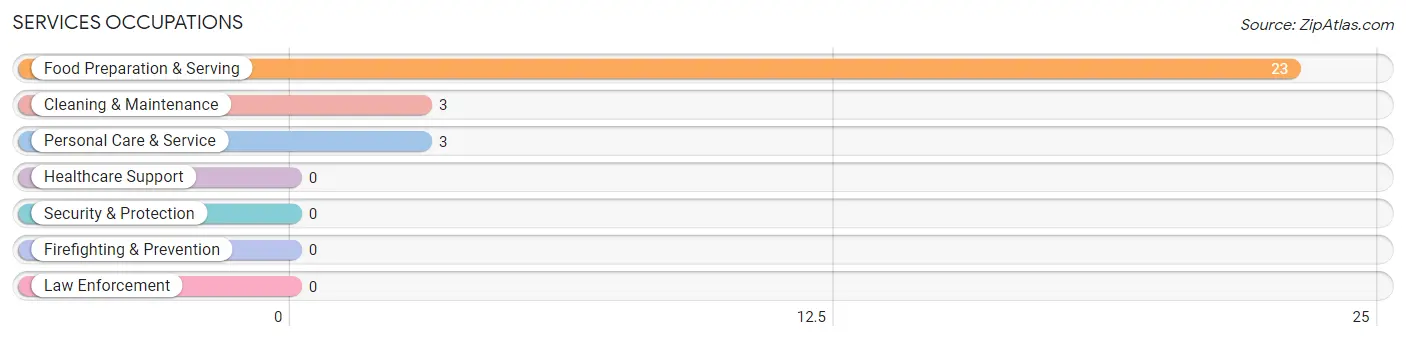
Services Occupations
The most common Services occupations in Central Bridge are Food Preparation & Serving (23 | 6.9%), Cleaning & Maintenance (3 | 0.9%), and Personal Care & Service (3 | 0.9%).
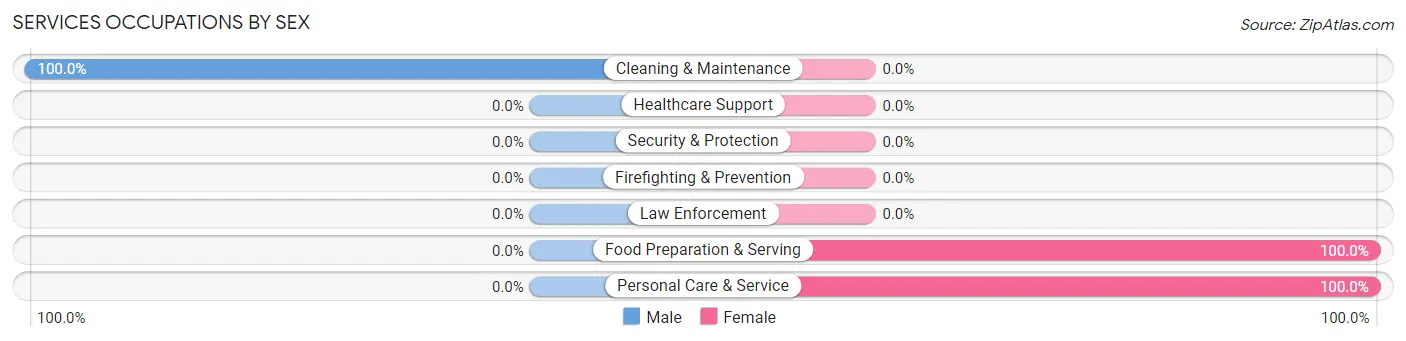
Services Occupations by Sex
| Occupation | Male | Female |
| Healthcare Support | 0 (0.0%) | 0 (0.0%) |
| Security & Protection | 0 (0.0%) | 0 (0.0%) |
| Firefighting & Prevention | 0 (0.0%) | 0 (0.0%) |
| Law Enforcement | 0 (0.0%) | 0 (0.0%) |
| Food Preparation & Serving | 0 (0.0%) | 23 (100.0%) |
| Cleaning & Maintenance | 3 (100.0%) | 0 (0.0%) |
| Personal Care & Service | 0 (0.0%) | 3 (100.0%) |
| Total (Category) | 3 (10.3%) | 26 (89.7%) |
| Total (Overall) | 165 (49.1%) | 171 (50.9%) |
Sales and Office Occupations
The most common Sales and Office occupations in Central Bridge are Sales & Related (18 | 5.4%), and Office & Administration (6 | 1.8%).
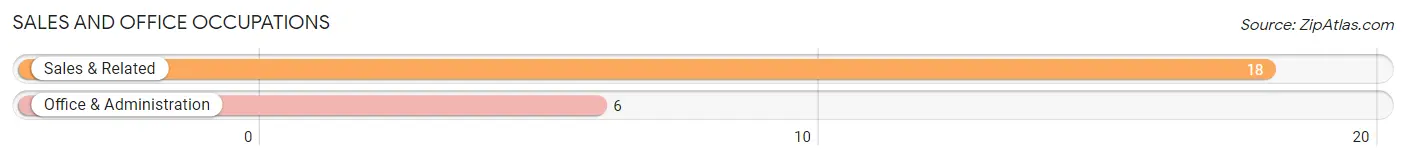
Sales and Office Occupations by Sex

| Occupation | Male | Female |
| Sales & Related | 7 (38.9%) | 11 (61.1%) |
| Office & Administration | 0 (0.0%) | 6 (100.0%) |
| Total (Category) | 7 (29.2%) | 17 (70.8%) |
| Total (Overall) | 165 (49.1%) | 171 (50.9%) |
Natural Resources, Construction and Maintenance Occupations
The most common Natural Resources, Construction and Maintenance occupations in Central Bridge are Construction & Extraction (85 | 25.3%), and Farming, Fishing & Forestry (42 | 12.5%).
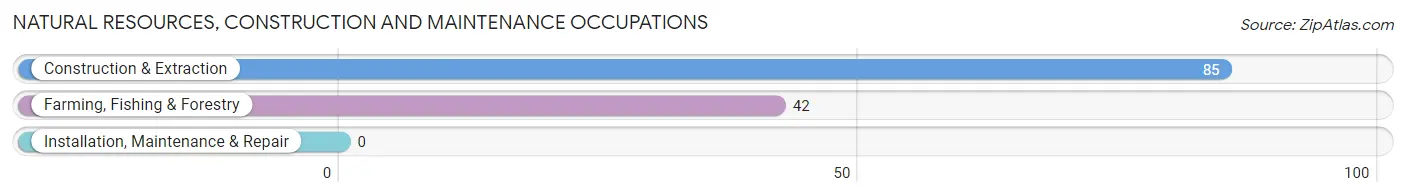
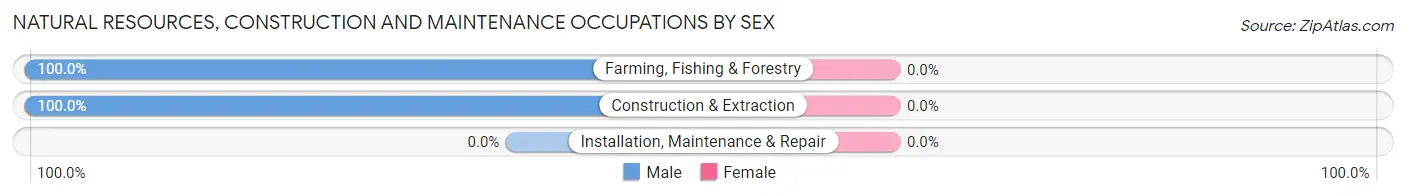
Natural Resources, Construction and Maintenance Occupations by Sex
| Occupation | Male | Female |
| Farming, Fishing & Forestry | 42 (100.0%) | 0 (0.0%) |
| Construction & Extraction | 85 (100.0%) | 0 (0.0%) |
| Installation, Maintenance & Repair | 0 (0.0%) | 0 (0.0%) |
| Total (Category) | 127 (100.0%) | 0 (0.0%) |
| Total (Overall) | 165 (49.1%) | 171 (50.9%) |
Production, Transportation and Moving Occupations
The most common Production, Transportation and Moving occupations in Central Bridge are , and Production (18 | 5.4%).
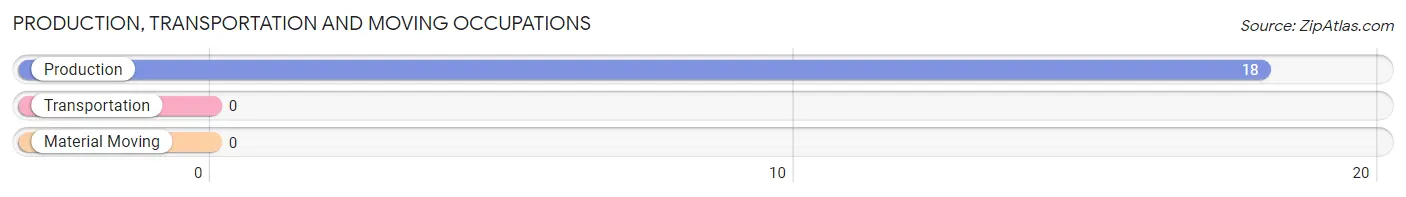
Production, Transportation and Moving Occupations by Sex
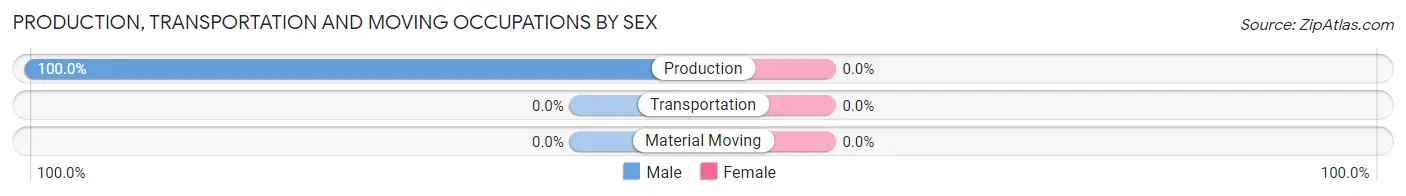
| Occupation | Male | Female |
| Production | 18 (100.0%) | 0 (0.0%) |
| Transportation | 0 (0.0%) | 0 (0.0%) |
| Material Moving | 0 (0.0%) | 0 (0.0%) |
| Total (Category) | 18 (100.0%) | 0 (0.0%) |
| Total (Overall) | 165 (49.1%) | 171 (50.9%) |
Employment Industries by Sex in Central Bridge
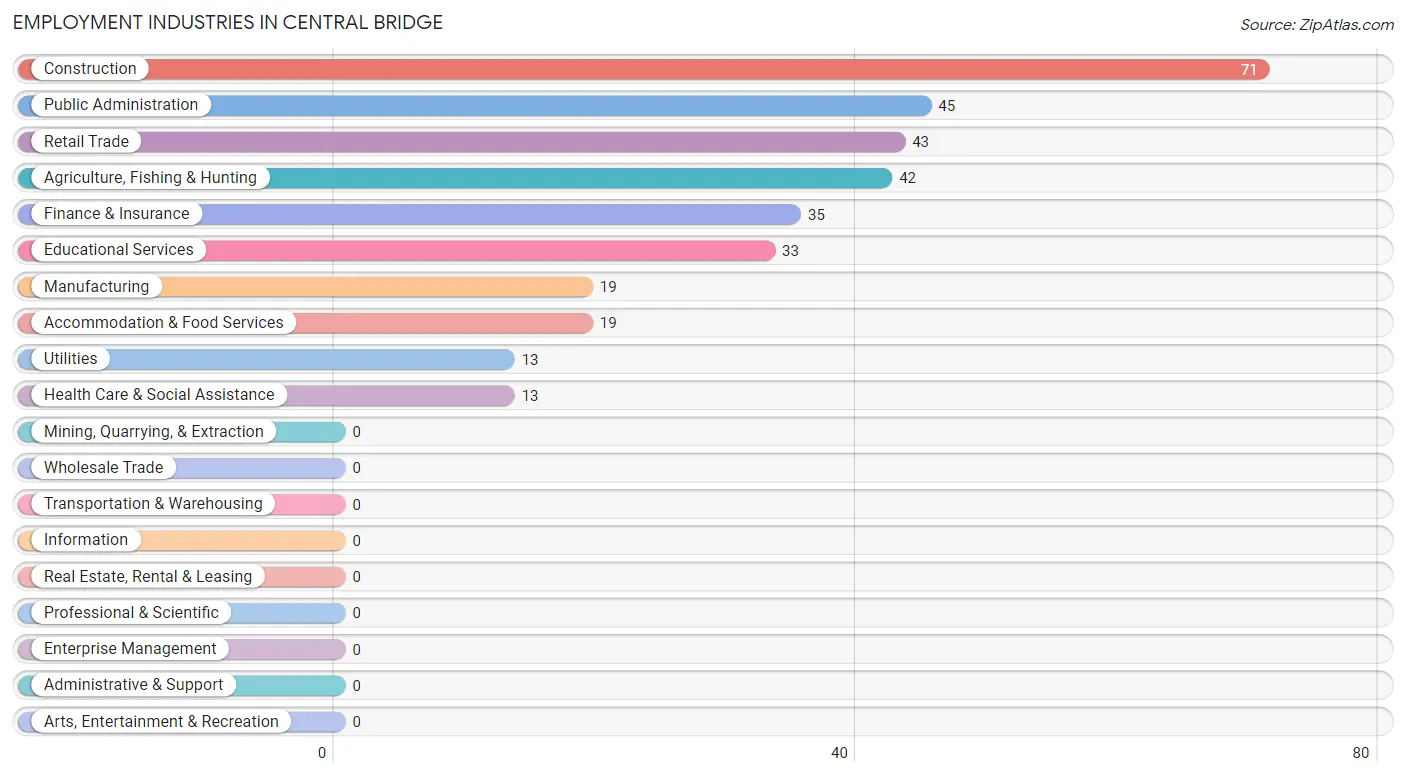
Employment Industries in Central Bridge
The major employment industries in Central Bridge include Construction (71 | 21.1%), Public Administration (45 | 13.4%), Retail Trade (43 | 12.8%), Agriculture, Fishing & Hunting (42 | 12.5%), and Finance & Insurance (35 | 10.4%).
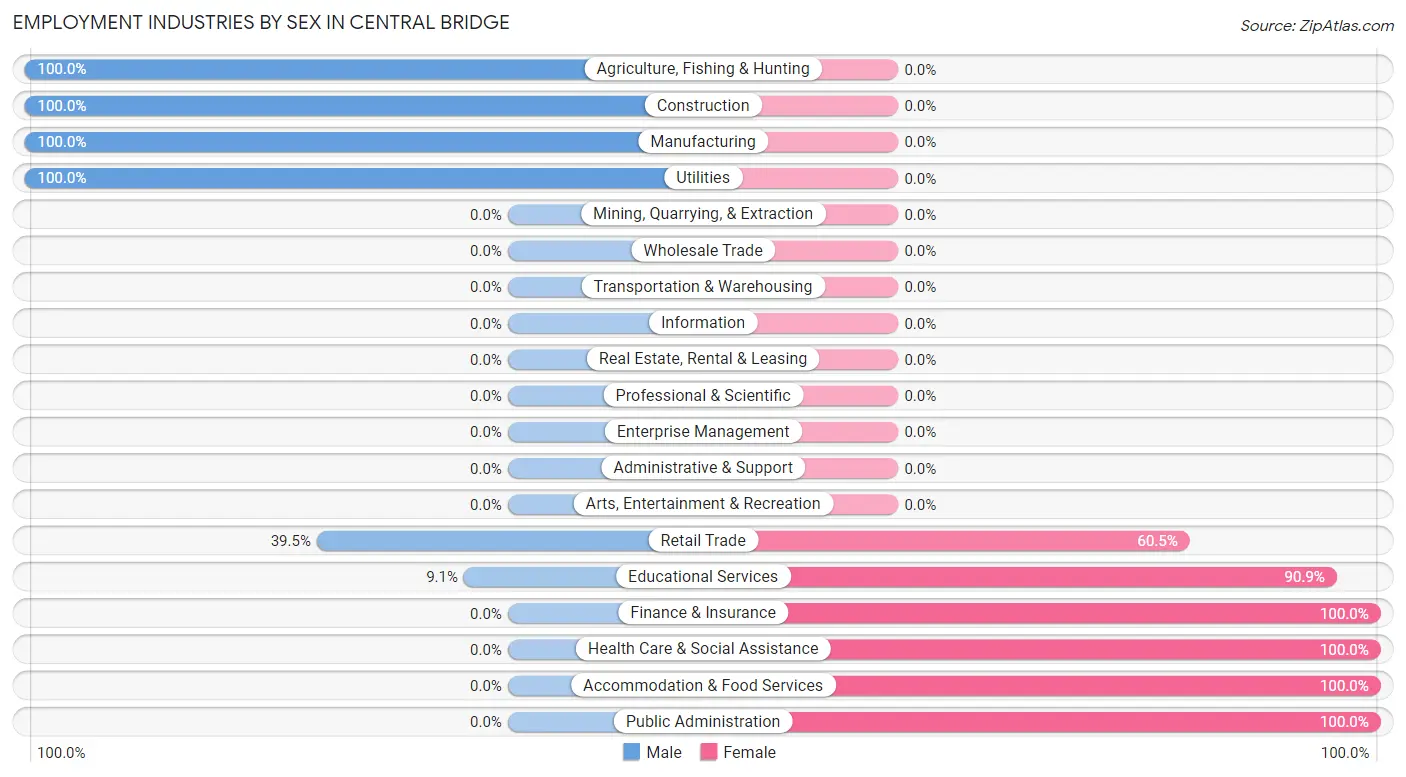
Employment Industries by Sex in Central Bridge
The Central Bridge industries that see more men than women are Agriculture, Fishing & Hunting (100.0%), Construction (100.0%), and Manufacturing (100.0%), whereas the industries that tend to have a higher number of women are Finance & Insurance (100.0%), Health Care & Social Assistance (100.0%), and Accommodation & Food Services (100.0%).
| Industry | Male | Female |
| Agriculture, Fishing & Hunting | 42 (100.0%) | 0 (0.0%) |
| Mining, Quarrying, & Extraction | 0 (0.0%) | 0 (0.0%) |
| Construction | 71 (100.0%) | 0 (0.0%) |
| Manufacturing | 19 (100.0%) | 0 (0.0%) |
| Wholesale Trade | 0 (0.0%) | 0 (0.0%) |
| Retail Trade | 17 (39.5%) | 26 (60.5%) |
| Transportation & Warehousing | 0 (0.0%) | 0 (0.0%) |
| Utilities | 13 (100.0%) | 0 (0.0%) |
| Information | 0 (0.0%) | 0 (0.0%) |
| Finance & Insurance | 0 (0.0%) | 35 (100.0%) |
| Real Estate, Rental & Leasing | 0 (0.0%) | 0 (0.0%) |
| Professional & Scientific | 0 (0.0%) | 0 (0.0%) |
| Enterprise Management | 0 (0.0%) | 0 (0.0%) |
| Administrative & Support | 0 (0.0%) | 0 (0.0%) |
| Educational Services | 3 (9.1%) | 30 (90.9%) |
| Health Care & Social Assistance | 0 (0.0%) | 13 (100.0%) |
| Arts, Entertainment & Recreation | 0 (0.0%) | 0 (0.0%) |
| Accommodation & Food Services | 0 (0.0%) | 19 (100.0%) |
| Public Administration | 0 (0.0%) | 45 (100.0%) |
| Total | 165 (49.1%) | 171 (50.9%) |
Education in Central Bridge
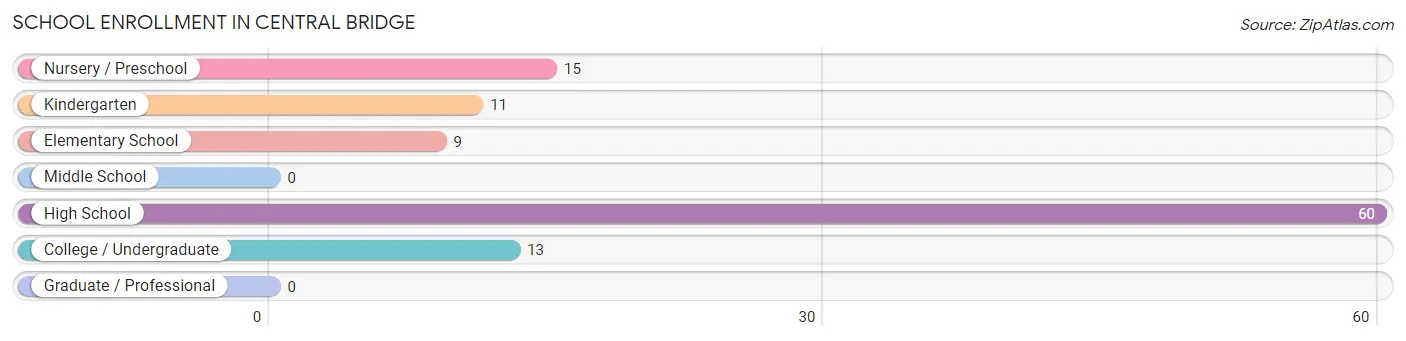
School Enrollment in Central Bridge
The most common levels of schooling among the 108 students in Central Bridge are high school (60 | 55.6%), nursery / preschool (15 | 13.9%), and college / undergraduate (13 | 12.0%).
| School Level | # Students | % Students |
| Nursery / Preschool | 15 | 13.9% |
| Kindergarten | 11 | 10.2% |
| Elementary School | 9 | 8.3% |
| Middle School | 0 | 0.0% |
| High School | 60 | 55.6% |
| College / Undergraduate | 13 | 12.0% |
| Graduate / Professional | 0 | 0.0% |
| Total | 108 | 100.0% |
School Enrollment by Age by Funding Source in Central Bridge
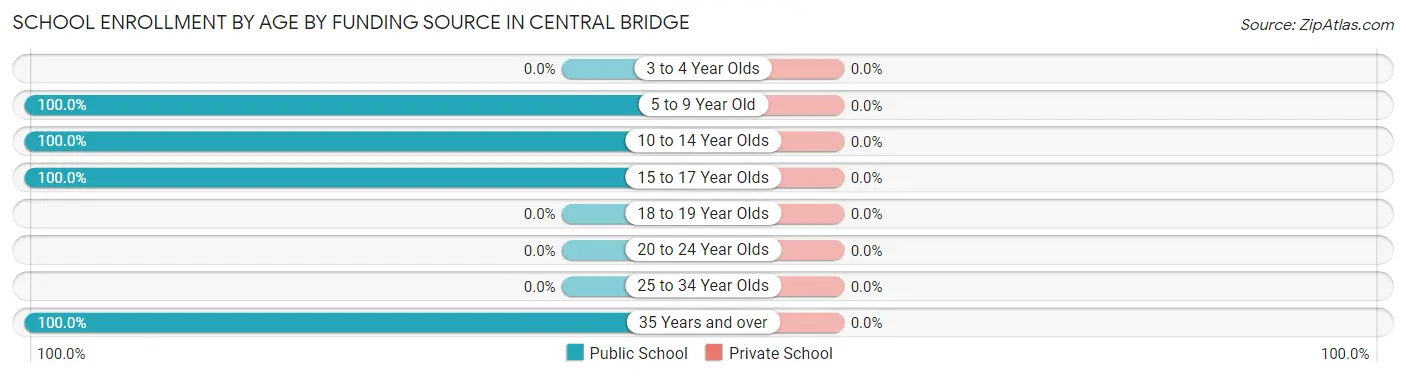
| Age Bracket | Public School | Private School |
| 3 to 4 Year Olds | 0 (0.0%) | 0 (0.0%) |
| 5 to 9 Year Old | 35 (100.0%) | 0 (0.0%) |
| 10 to 14 Year Olds | 25 (100.0%) | 0 (0.0%) |
| 15 to 17 Year Olds | 35 (100.0%) | 0 (0.0%) |
| 18 to 19 Year Olds | 0 (0.0%) | 0 (0.0%) |
| 20 to 24 Year Olds | 0 (0.0%) | 0 (0.0%) |
| 25 to 34 Year Olds | 0 (0.0%) | 0 (0.0%) |
| 35 Years and over | 13 (100.0%) | 0 (0.0%) |
| Total | 108 (100.0%) | 0 (0.0%) |
Educational Attainment by Field of Study in Central Bridge
Communications (50 | 42.0%), education (45 | 37.8%), computers & mathematics (11 | 9.2%), business (10 | 8.4%), and visual & performing arts (3 | 2.5%) are the most common fields of study among 119 individuals in Central Bridge who have obtained a bachelor's degree or higher.
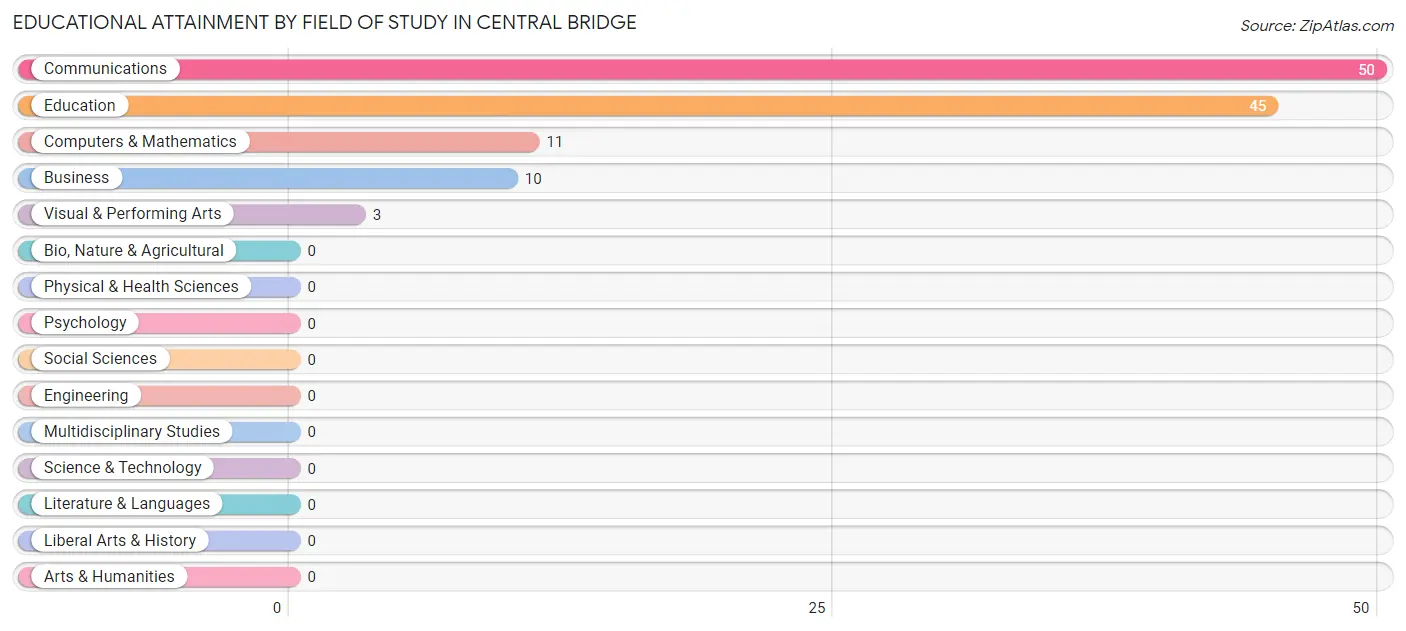
| Field of Study | # Graduates | % Graduates |
| Computers & Mathematics | 11 | 9.2% |
| Bio, Nature & Agricultural | 0 | 0.0% |
| Physical & Health Sciences | 0 | 0.0% |
| Psychology | 0 | 0.0% |
| Social Sciences | 0 | 0.0% |
| Engineering | 0 | 0.0% |
| Multidisciplinary Studies | 0 | 0.0% |
| Science & Technology | 0 | 0.0% |
| Business | 10 | 8.4% |
| Education | 45 | 37.8% |
| Literature & Languages | 0 | 0.0% |
| Liberal Arts & History | 0 | 0.0% |
| Visual & Performing Arts | 3 | 2.5% |
| Communications | 50 | 42.0% |
| Arts & Humanities | 0 | 0.0% |
| Total | 119 | 100.0% |
Transportation & Commute in Central Bridge
Vehicle Availability by Sex in Central Bridge
The most prevalent vehicle ownership categories in Central Bridge are males with 2 vehicles (108, accounting for 65.4%) and females with 2 vehicles (117, making up 63.2%).
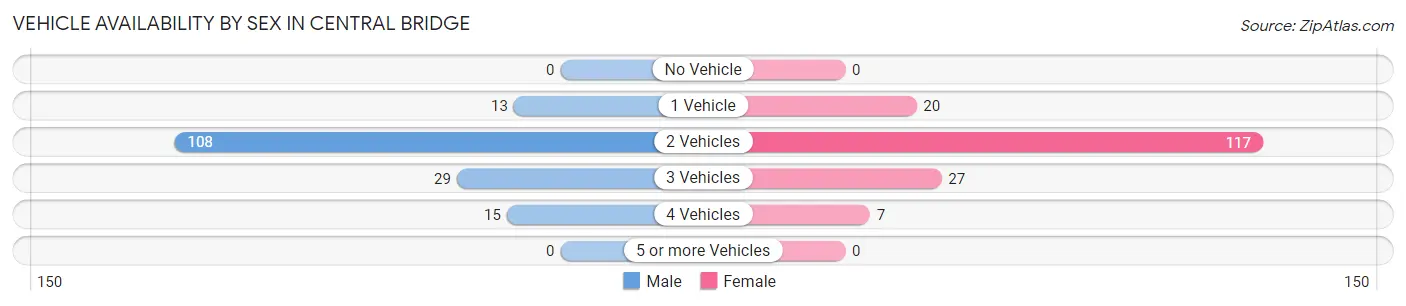
| Vehicles Available | Male | Female |
| No Vehicle | 0 (0.0%) | 0 (0.0%) |
| 1 Vehicle | 13 (7.9%) | 20 (11.7%) |
| 2 Vehicles | 108 (65.4%) | 117 (68.4%) |
| 3 Vehicles | 29 (17.6%) | 27 (15.8%) |
| 4 Vehicles | 15 (9.1%) | 7 (4.1%) |
| 5 or more Vehicles | 0 (0.0%) | 0 (0.0%) |
| Total | 165 (100.0%) | 171 (100.0%) |
Commute Time in Central Bridge
The most frequently occuring commute durations in Central Bridge are 20 to 24 minutes (104 commuters, 34.9%), 10 to 14 minutes (90 commuters, 30.2%), and 15 to 19 minutes (50 commuters, 16.8%).
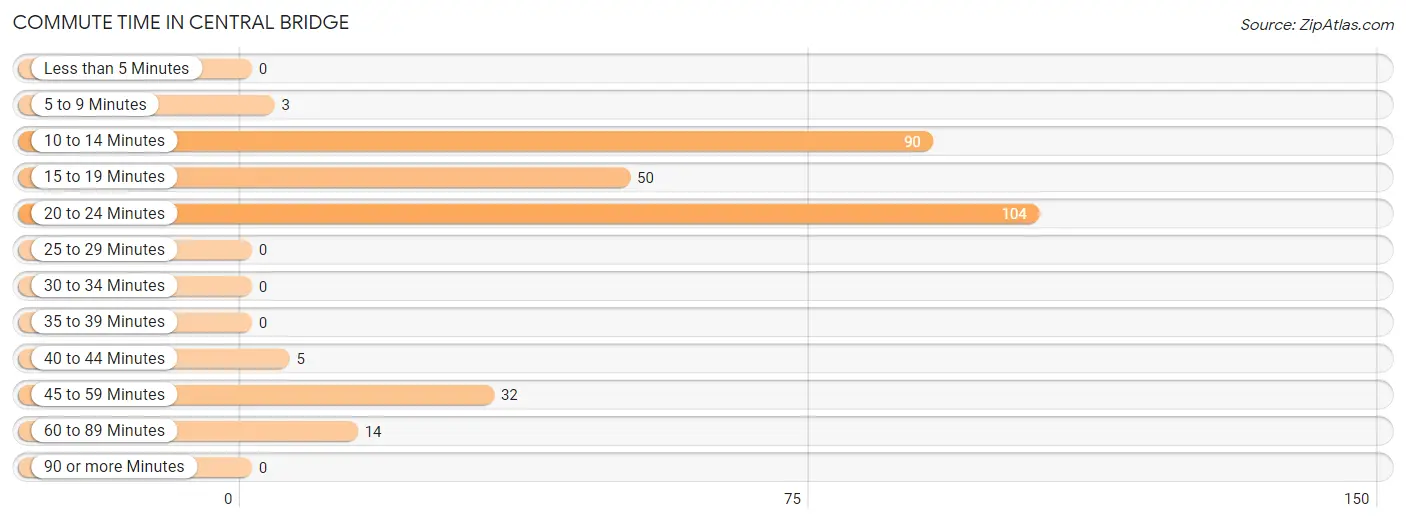
| Commute Time | # Commuters | % Commuters |
| Less than 5 Minutes | 0 | 0.0% |
| 5 to 9 Minutes | 3 | 1.0% |
| 10 to 14 Minutes | 90 | 30.2% |
| 15 to 19 Minutes | 50 | 16.8% |
| 20 to 24 Minutes | 104 | 34.9% |
| 25 to 29 Minutes | 0 | 0.0% |
| 30 to 34 Minutes | 0 | 0.0% |
| 35 to 39 Minutes | 0 | 0.0% |
| 40 to 44 Minutes | 5 | 1.7% |
| 45 to 59 Minutes | 32 | 10.7% |
| 60 to 89 Minutes | 14 | 4.7% |
| 90 or more Minutes | 0 | 0.0% |
Commute Time by Sex in Central Bridge
The most common commute times in Central Bridge are 20 to 24 minutes (85 commuters, 51.5%) for males and 15 to 19 minutes (43 commuters, 32.3%) for females.
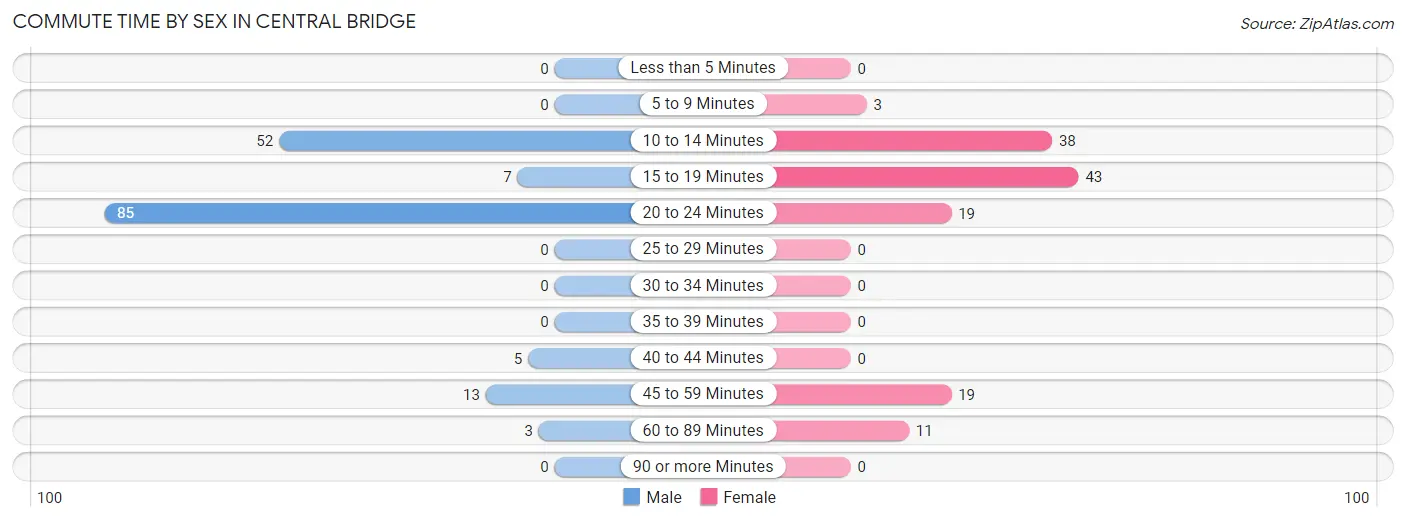
| Commute Time | Male | Female |
| Less than 5 Minutes | 0 (0.0%) | 0 (0.0%) |
| 5 to 9 Minutes | 0 (0.0%) | 3 (2.3%) |
| 10 to 14 Minutes | 52 (31.5%) | 38 (28.6%) |
| 15 to 19 Minutes | 7 (4.2%) | 43 (32.3%) |
| 20 to 24 Minutes | 85 (51.5%) | 19 (14.3%) |
| 25 to 29 Minutes | 0 (0.0%) | 0 (0.0%) |
| 30 to 34 Minutes | 0 (0.0%) | 0 (0.0%) |
| 35 to 39 Minutes | 0 (0.0%) | 0 (0.0%) |
| 40 to 44 Minutes | 5 (3.0%) | 0 (0.0%) |
| 45 to 59 Minutes | 13 (7.9%) | 19 (14.3%) |
| 60 to 89 Minutes | 3 (1.8%) | 11 (8.3%) |
| 90 or more Minutes | 0 (0.0%) | 0 (0.0%) |
Time of Departure to Work by Sex in Central Bridge
The most frequent times of departure to work in Central Bridge are 12:00 AM to 4:59 AM (94, 57.0%) for males and 8:00 AM to 8:29 AM (39, 29.3%) for females.
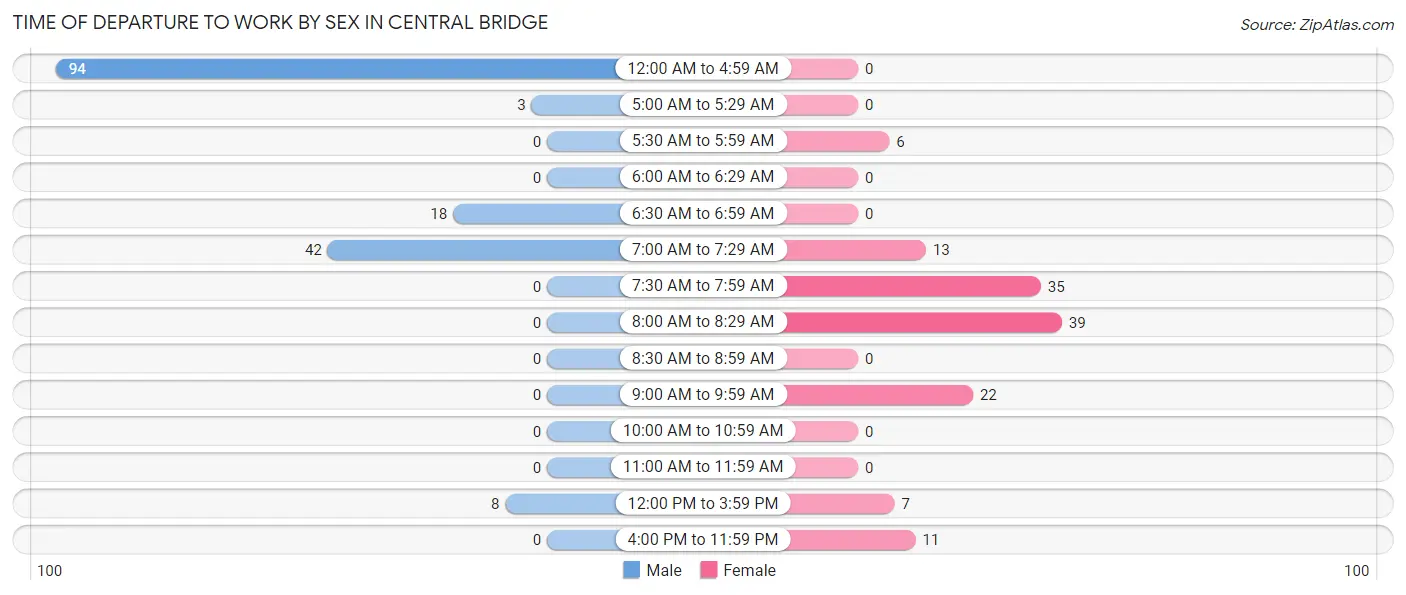
| Time of Departure | Male | Female |
| 12:00 AM to 4:59 AM | 94 (57.0%) | 0 (0.0%) |
| 5:00 AM to 5:29 AM | 3 (1.8%) | 0 (0.0%) |
| 5:30 AM to 5:59 AM | 0 (0.0%) | 6 (4.5%) |
| 6:00 AM to 6:29 AM | 0 (0.0%) | 0 (0.0%) |
| 6:30 AM to 6:59 AM | 18 (10.9%) | 0 (0.0%) |
| 7:00 AM to 7:29 AM | 42 (25.5%) | 13 (9.8%) |
| 7:30 AM to 7:59 AM | 0 (0.0%) | 35 (26.3%) |
| 8:00 AM to 8:29 AM | 0 (0.0%) | 39 (29.3%) |
| 8:30 AM to 8:59 AM | 0 (0.0%) | 0 (0.0%) |
| 9:00 AM to 9:59 AM | 0 (0.0%) | 22 (16.5%) |
| 10:00 AM to 10:59 AM | 0 (0.0%) | 0 (0.0%) |
| 11:00 AM to 11:59 AM | 0 (0.0%) | 0 (0.0%) |
| 12:00 PM to 3:59 PM | 8 (4.9%) | 7 (5.3%) |
| 4:00 PM to 11:59 PM | 0 (0.0%) | 11 (8.3%) |
| Total | 165 (100.0%) | 133 (100.0%) |
Housing Occupancy in Central Bridge
Occupancy by Ownership in Central Bridge
Of the total 246 dwellings in Central Bridge, owner-occupied units account for 168 (68.3%), while renter-occupied units make up 78 (31.7%).
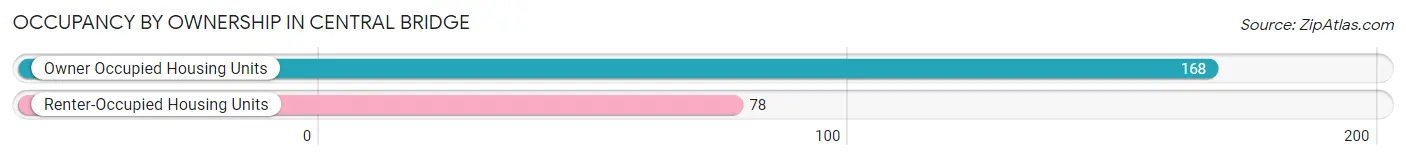
| Occupancy | # Housing Units | % Housing Units |
| Owner Occupied Housing Units | 168 | 68.3% |
| Renter-Occupied Housing Units | 78 | 31.7% |
| Total Occupied Housing Units | 246 | 100.0% |
Occupancy by Household Size in Central Bridge
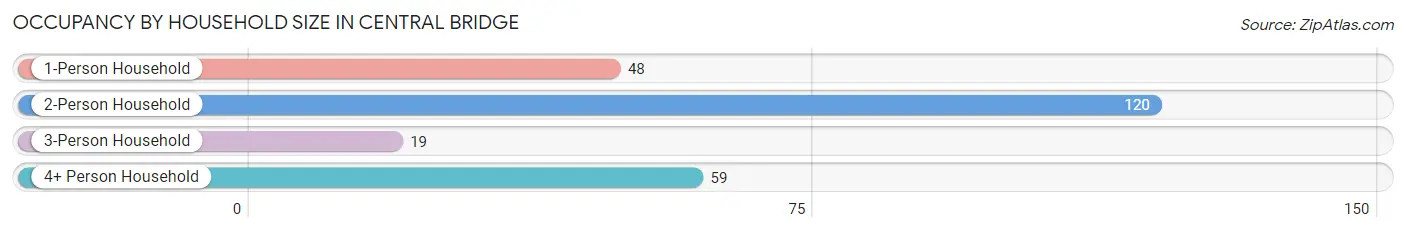
| Household Size | # Housing Units | % Housing Units |
| 1-Person Household | 48 | 19.5% |
| 2-Person Household | 120 | 48.8% |
| 3-Person Household | 19 | 7.7% |
| 4+ Person Household | 59 | 24.0% |
| Total Housing Units | 246 | 100.0% |
Occupancy by Ownership by Household Size in Central Bridge
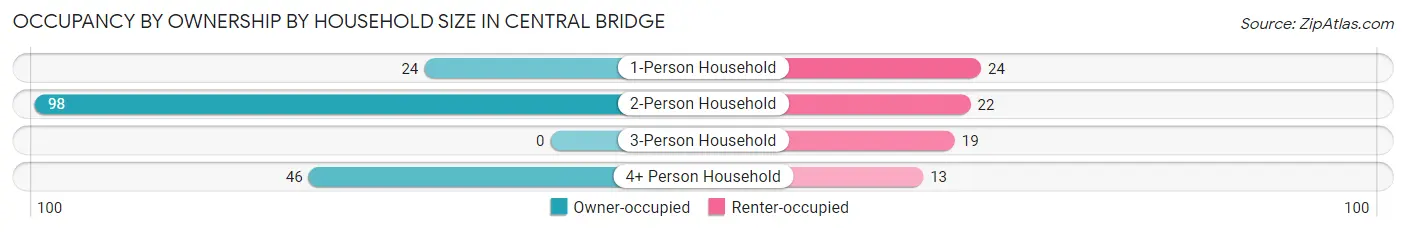
| Household Size | Owner-occupied | Renter-occupied |
| 1-Person Household | 24 (50.0%) | 24 (50.0%) |
| 2-Person Household | 98 (81.7%) | 22 (18.3%) |
| 3-Person Household | 0 (0.0%) | 19 (100.0%) |
| 4+ Person Household | 46 (78.0%) | 13 (22.0%) |
| Total Housing Units | 168 (68.3%) | 78 (31.7%) |
Occupancy by Educational Attainment in Central Bridge
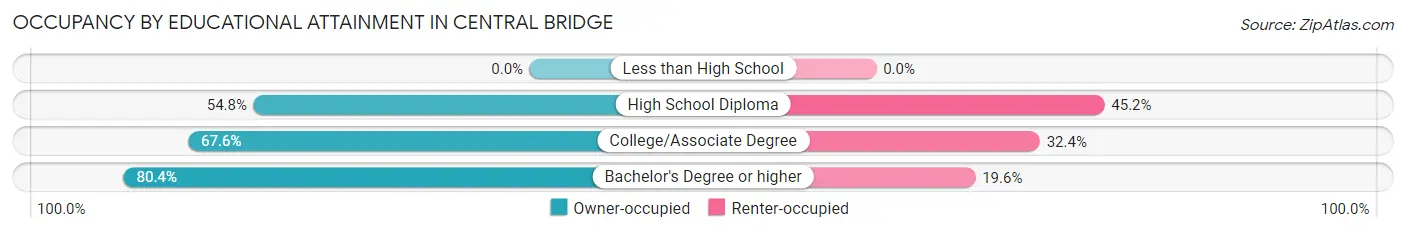
| Household Size | Owner-occupied | Renter-occupied |
| Less than High School | 0 (0.0%) | 0 (0.0%) |
| High School Diploma | 23 (54.8%) | 19 (45.2%) |
| College/Associate Degree | 100 (67.6%) | 48 (32.4%) |
| Bachelor's Degree or higher | 45 (80.4%) | 11 (19.6%) |
Occupancy by Age of Householder in Central Bridge
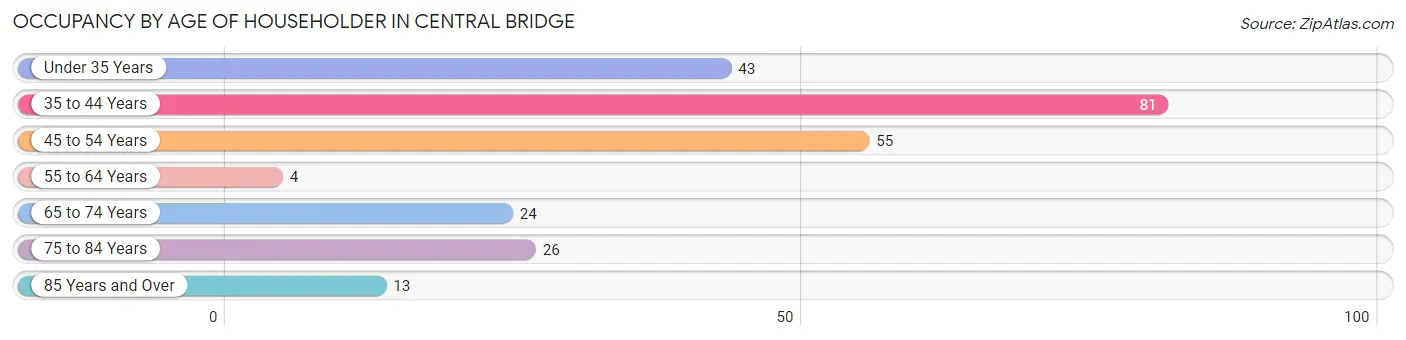
| Age Bracket | # Households | % Households |
| Under 35 Years | 43 | 17.5% |
| 35 to 44 Years | 81 | 32.9% |
| 45 to 54 Years | 55 | 22.4% |
| 55 to 64 Years | 4 | 1.6% |
| 65 to 74 Years | 24 | 9.8% |
| 75 to 84 Years | 26 | 10.6% |
| 85 Years and Over | 13 | 5.3% |
| Total | 246 | 100.0% |
Housing Finances in Central Bridge
Median Income by Occupancy in Central Bridge
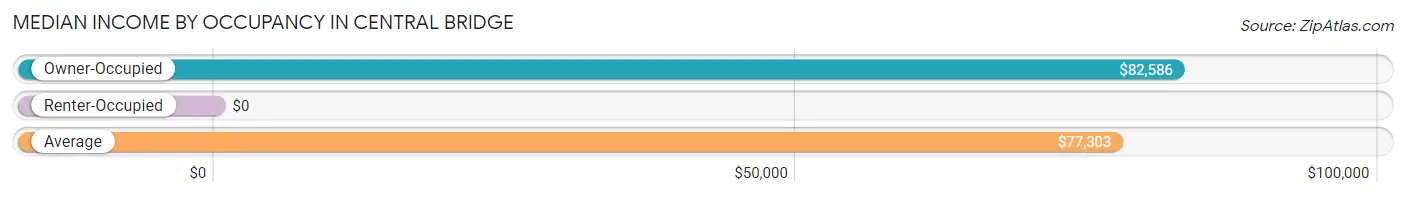
| Occupancy Type | # Households | Median Income |
| Owner-Occupied | 168 (68.3%) | $82,586 |
| Renter-Occupied | 78 (31.7%) | $0 |
| Average | 246 (100.0%) | $77,303 |
Occupancy by Householder Income Bracket in Central Bridge
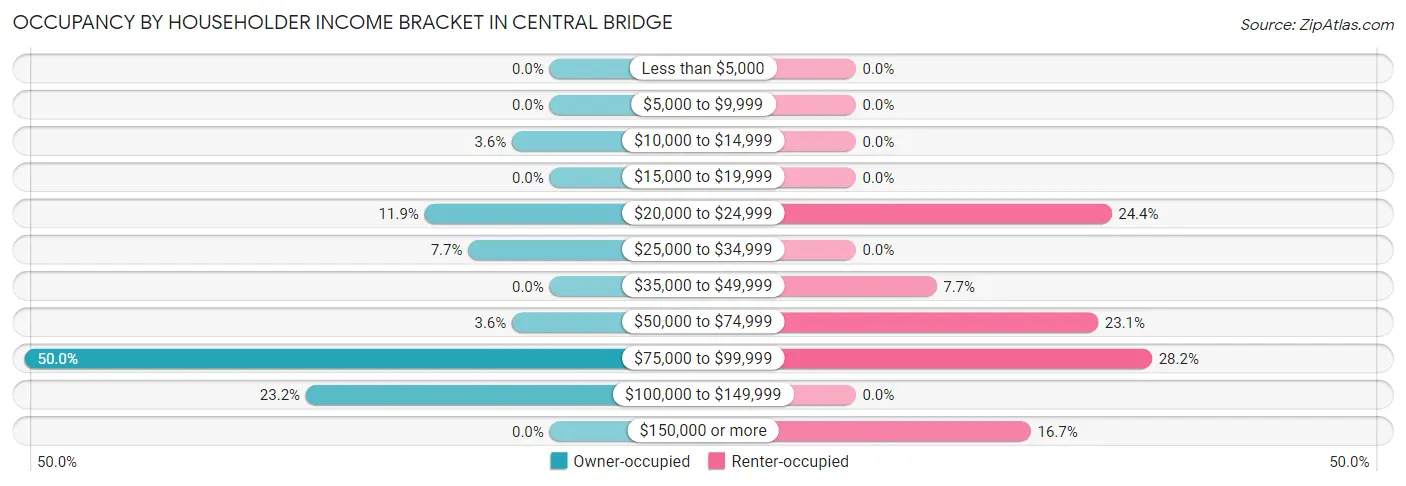
| Income Bracket | Owner-occupied | Renter-occupied |
| Less than $5,000 | 0 (0.0%) | 0 (0.0%) |
| $5,000 to $9,999 | 0 (0.0%) | 0 (0.0%) |
| $10,000 to $14,999 | 6 (3.6%) | 0 (0.0%) |
| $15,000 to $19,999 | 0 (0.0%) | 0 (0.0%) |
| $20,000 to $24,999 | 20 (11.9%) | 19 (24.4%) |
| $25,000 to $34,999 | 13 (7.7%) | 0 (0.0%) |
| $35,000 to $49,999 | 0 (0.0%) | 6 (7.7%) |
| $50,000 to $74,999 | 6 (3.6%) | 18 (23.1%) |
| $75,000 to $99,999 | 84 (50.0%) | 22 (28.2%) |
| $100,000 to $149,999 | 39 (23.2%) | 0 (0.0%) |
| $150,000 or more | 0 (0.0%) | 13 (16.7%) |
| Total | 168 (100.0%) | 78 (100.0%) |
Monthly Housing Cost Tiers in Central Bridge
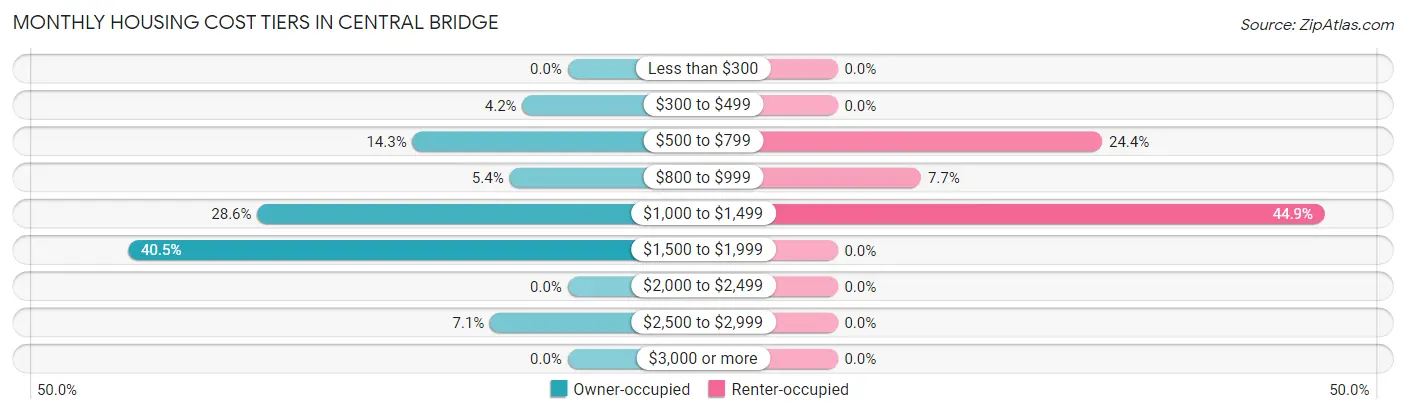
| Monthly Cost | Owner-occupied | Renter-occupied |
| Less than $300 | 0 (0.0%) | 0 (0.0%) |
| $300 to $499 | 7 (4.2%) | 0 (0.0%) |
| $500 to $799 | 24 (14.3%) | 19 (24.4%) |
| $800 to $999 | 9 (5.4%) | 6 (7.7%) |
| $1,000 to $1,499 | 48 (28.6%) | 35 (44.9%) |
| $1,500 to $1,999 | 68 (40.5%) | 0 (0.0%) |
| $2,000 to $2,499 | 0 (0.0%) | 0 (0.0%) |
| $2,500 to $2,999 | 12 (7.1%) | 0 (0.0%) |
| $3,000 or more | 0 (0.0%) | 0 (0.0%) |
| Total | 168 (100.0%) | 78 (100.0%) |
Physical Housing Characteristics in Central Bridge
Housing Structures in Central Bridge
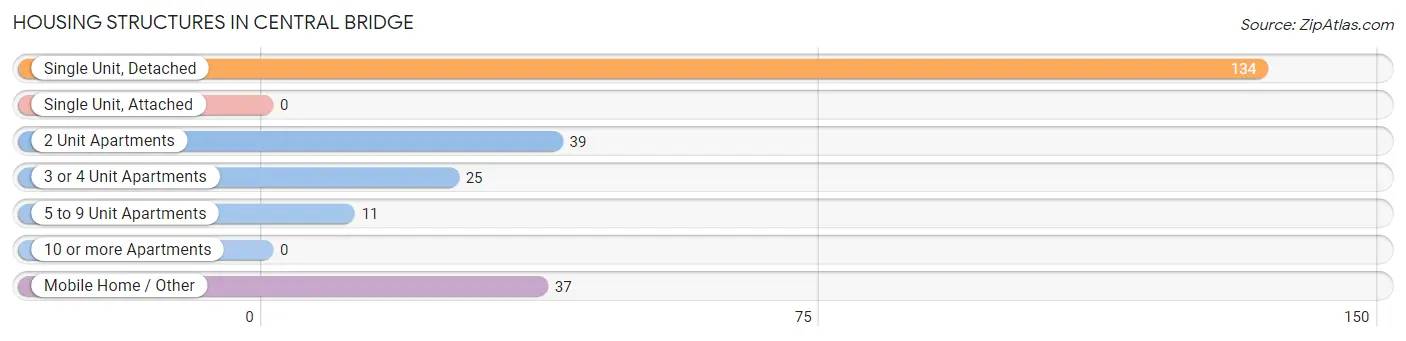
| Structure Type | # Housing Units | % Housing Units |
| Single Unit, Detached | 134 | 54.5% |
| Single Unit, Attached | 0 | 0.0% |
| 2 Unit Apartments | 39 | 15.9% |
| 3 or 4 Unit Apartments | 25 | 10.2% |
| 5 to 9 Unit Apartments | 11 | 4.5% |
| 10 or more Apartments | 0 | 0.0% |
| Mobile Home / Other | 37 | 15.0% |
| Total | 246 | 100.0% |
Housing Structures by Occupancy in Central Bridge
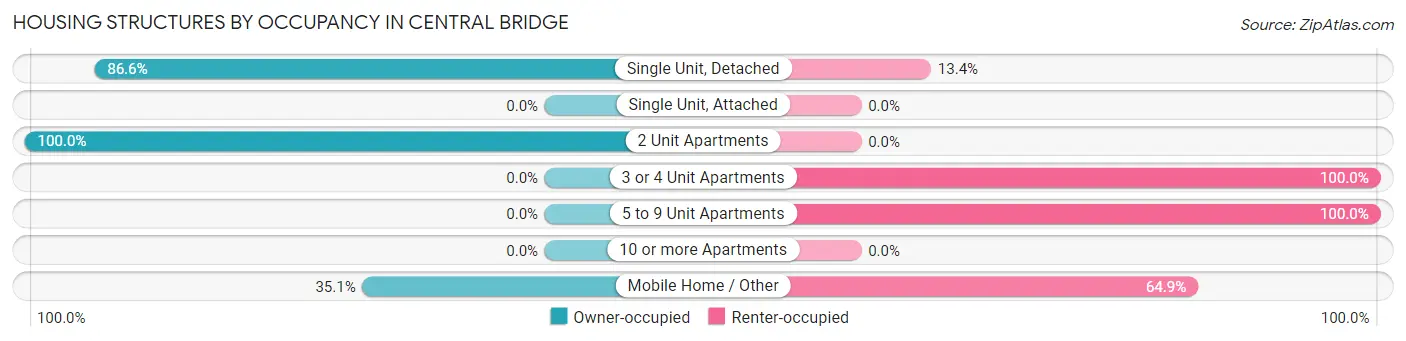
| Structure Type | Owner-occupied | Renter-occupied |
| Single Unit, Detached | 116 (86.6%) | 18 (13.4%) |
| Single Unit, Attached | 0 (0.0%) | 0 (0.0%) |
| 2 Unit Apartments | 39 (100.0%) | 0 (0.0%) |
| 3 or 4 Unit Apartments | 0 (0.0%) | 25 (100.0%) |
| 5 to 9 Unit Apartments | 0 (0.0%) | 11 (100.0%) |
| 10 or more Apartments | 0 (0.0%) | 0 (0.0%) |
| Mobile Home / Other | 13 (35.1%) | 24 (64.9%) |
| Total | 168 (68.3%) | 78 (31.7%) |
Housing Structures by Number of Rooms in Central Bridge
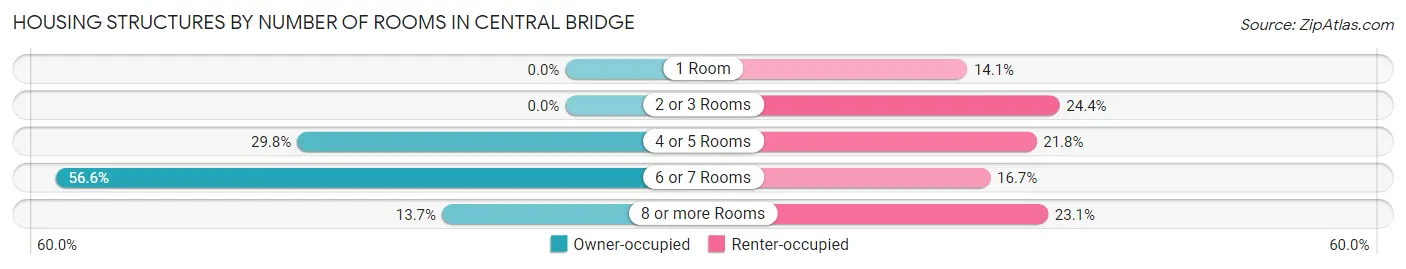
| Number of Rooms | Owner-occupied | Renter-occupied |
| 1 Room | 0 (0.0%) | 11 (14.1%) |
| 2 or 3 Rooms | 0 (0.0%) | 19 (24.4%) |
| 4 or 5 Rooms | 50 (29.8%) | 17 (21.8%) |
| 6 or 7 Rooms | 95 (56.6%) | 13 (16.7%) |
| 8 or more Rooms | 23 (13.7%) | 18 (23.1%) |
| Total | 168 (100.0%) | 78 (100.0%) |
Housing Structure by Heating Type in Central Bridge
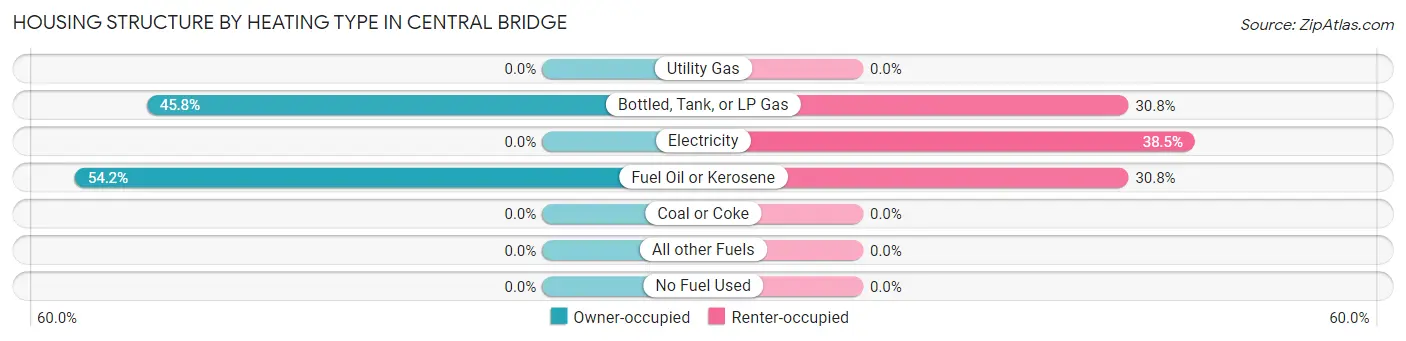
| Heating Type | Owner-occupied | Renter-occupied |
| Utility Gas | 0 (0.0%) | 0 (0.0%) |
| Bottled, Tank, or LP Gas | 77 (45.8%) | 24 (30.8%) |
| Electricity | 0 (0.0%) | 30 (38.5%) |
| Fuel Oil or Kerosene | 91 (54.2%) | 24 (30.8%) |
| Coal or Coke | 0 (0.0%) | 0 (0.0%) |
| All other Fuels | 0 (0.0%) | 0 (0.0%) |
| No Fuel Used | 0 (0.0%) | 0 (0.0%) |
| Total | 168 (100.0%) | 78 (100.0%) |
Household Vehicle Usage in Central Bridge
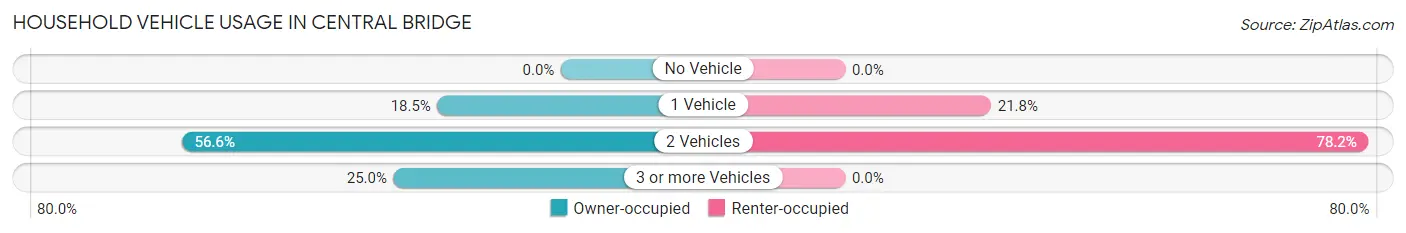
| Vehicles per Household | Owner-occupied | Renter-occupied |
| No Vehicle | 0 (0.0%) | 0 (0.0%) |
| 1 Vehicle | 31 (18.4%) | 17 (21.8%) |
| 2 Vehicles | 95 (56.6%) | 61 (78.2%) |
| 3 or more Vehicles | 42 (25.0%) | 0 (0.0%) |
| Total | 168 (100.0%) | 78 (100.0%) |
Real Estate & Mortgages in Central Bridge
Real Estate and Mortgage Overview in Central Bridge
| Characteristic | Without Mortgage | With Mortgage |
| Housing Units | 48 | 120 |
| Median Property Value | - | - |
| Median Household Income | $24,583 | $0 |
| Monthly Housing Costs | $773 | $0 |
| Real Estate Taxes | $6,500 | $0 |
Property Value by Mortgage Status in Central Bridge
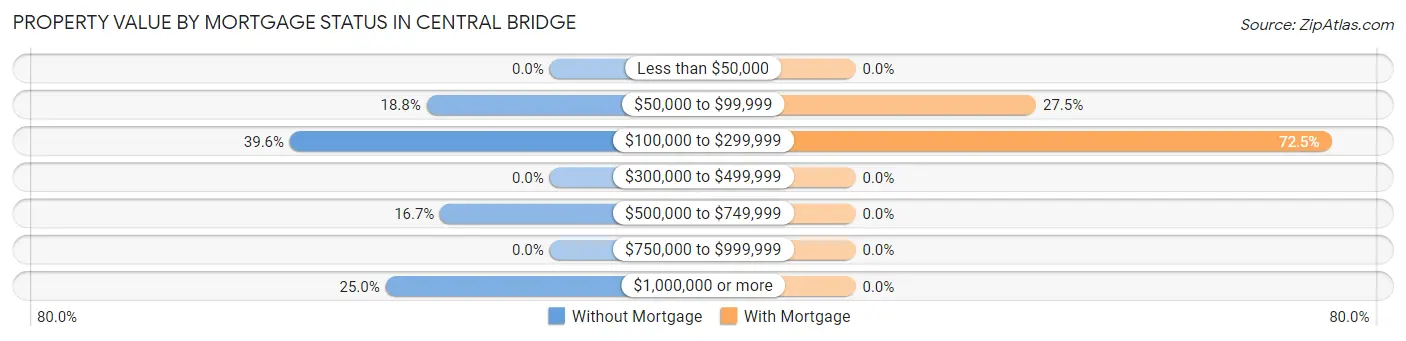
| Property Value | Without Mortgage | With Mortgage |
| Less than $50,000 | 0 (0.0%) | 0 (0.0%) |
| $50,000 to $99,999 | 9 (18.8%) | 33 (27.5%) |
| $100,000 to $299,999 | 19 (39.6%) | 87 (72.5%) |
| $300,000 to $499,999 | 0 (0.0%) | 0 (0.0%) |
| $500,000 to $749,999 | 8 (16.7%) | 0 (0.0%) |
| $750,000 to $999,999 | 0 (0.0%) | 0 (0.0%) |
| $1,000,000 or more | 12 (25.0%) | 0 (0.0%) |
| Total | 48 (100.0%) | 120 (100.0%) |
Household Income by Mortgage Status in Central Bridge
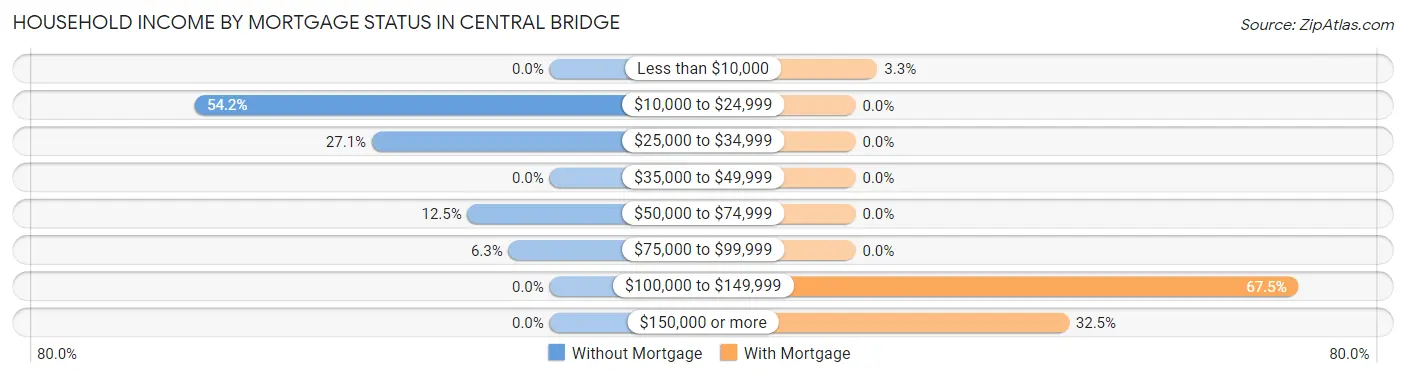
| Household Income | Without Mortgage | With Mortgage |
| Less than $10,000 | 0 (0.0%) | 4 (3.3%) |
| $10,000 to $24,999 | 26 (54.2%) | 0 (0.0%) |
| $25,000 to $34,999 | 13 (27.1%) | 0 (0.0%) |
| $35,000 to $49,999 | 0 (0.0%) | 0 (0.0%) |
| $50,000 to $74,999 | 6 (12.5%) | 0 (0.0%) |
| $75,000 to $99,999 | 3 (6.2%) | 0 (0.0%) |
| $100,000 to $149,999 | 0 (0.0%) | 81 (67.5%) |
| $150,000 or more | 0 (0.0%) | 39 (32.5%) |
| Total | 48 (100.0%) | 120 (100.0%) |
Property Value to Household Income Ratio in Central Bridge
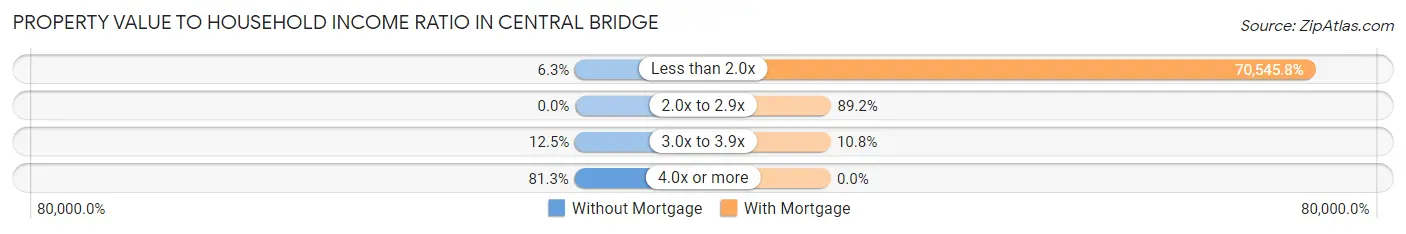
| Value-to-Income Ratio | Without Mortgage | With Mortgage |
| Less than 2.0x | 3 (6.2%) | 84,655 (70,545.8%) |
| 2.0x to 2.9x | 0 (0.0%) | 107 (89.2%) |
| 3.0x to 3.9x | 6 (12.5%) | 13 (10.8%) |
| 4.0x or more | 39 (81.2%) | 0 (0.0%) |
| Total | 48 (100.0%) | 120 (100.0%) |
Real Estate Taxes by Mortgage Status in Central Bridge
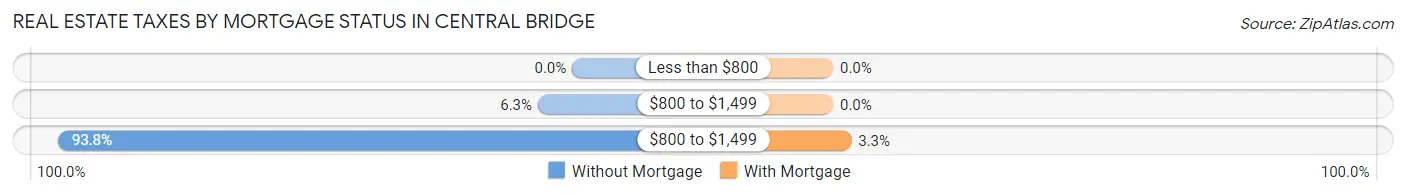
| Property Taxes | Without Mortgage | With Mortgage |
| Less than $800 | 0 (0.0%) | 0 (0.0%) |
| $800 to $1,499 | 3 (6.2%) | 0 (0.0%) |
| $800 to $1,499 | 45 (93.8%) | 4 (3.3%) |
| Total | 48 (100.0%) | 120 (100.0%) |
Health & Disability in Central Bridge
Health Insurance Coverage by Age in Central Bridge
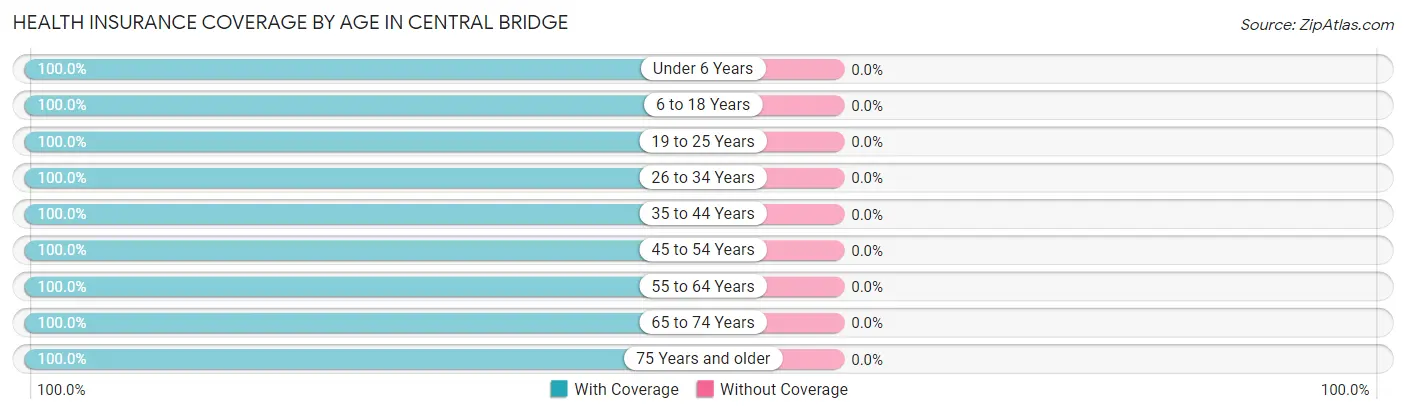
| Age Bracket | With Coverage | Without Coverage |
| Under 6 Years | 29 (100.0%) | 0 (0.0%) |
| 6 to 18 Years | 80 (100.0%) | 0 (0.0%) |
| 19 to 25 Years | 63 (100.0%) | 0 (0.0%) |
| 26 to 34 Years | 59 (100.0%) | 0 (0.0%) |
| 35 to 44 Years | 180 (100.0%) | 0 (0.0%) |
| 45 to 54 Years | 59 (100.0%) | 0 (0.0%) |
| 55 to 64 Years | 7 (100.0%) | 0 (0.0%) |
| 65 to 74 Years | 24 (100.0%) | 0 (0.0%) |
| 75 Years and older | 60 (100.0%) | 0 (0.0%) |
| Total | 561 (100.0%) | 0 (0.0%) |
Health Insurance Coverage by Citizenship Status in Central Bridge
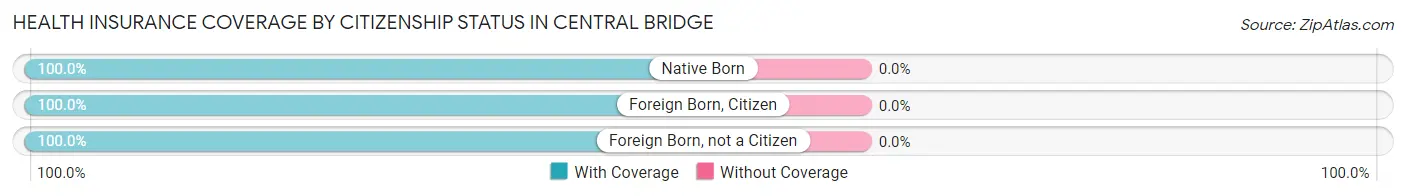
| Citizenship Status | With Coverage | Without Coverage |
| Native Born | 29 (100.0%) | 0 (0.0%) |
| Foreign Born, Citizen | 80 (100.0%) | 0 (0.0%) |
| Foreign Born, not a Citizen | 63 (100.0%) | 0 (0.0%) |
Health Insurance Coverage by Household Income in Central Bridge
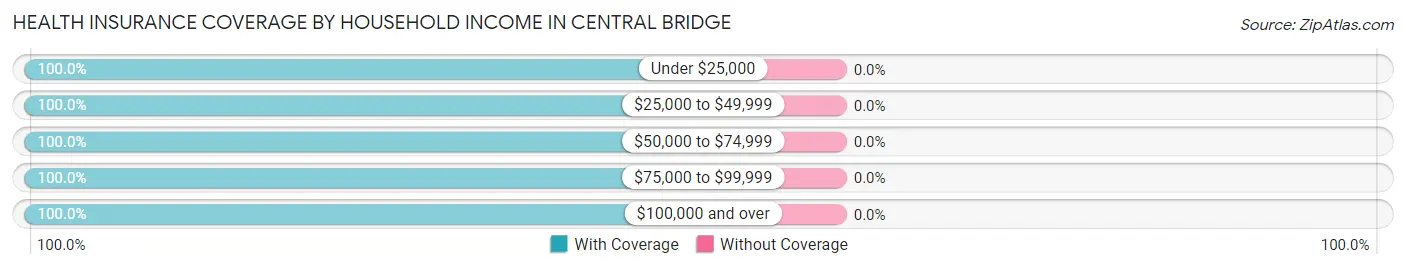
| Household Income | With Coverage | Without Coverage |
| Under $25,000 | 80 (100.0%) | 0 (0.0%) |
| $25,000 to $49,999 | 30 (100.0%) | 0 (0.0%) |
| $50,000 to $74,999 | 24 (100.0%) | 0 (0.0%) |
| $75,000 to $99,999 | 294 (100.0%) | 0 (0.0%) |
| $100,000 and over | 133 (100.0%) | 0 (0.0%) |
Public vs Private Health Insurance Coverage by Age in Central Bridge
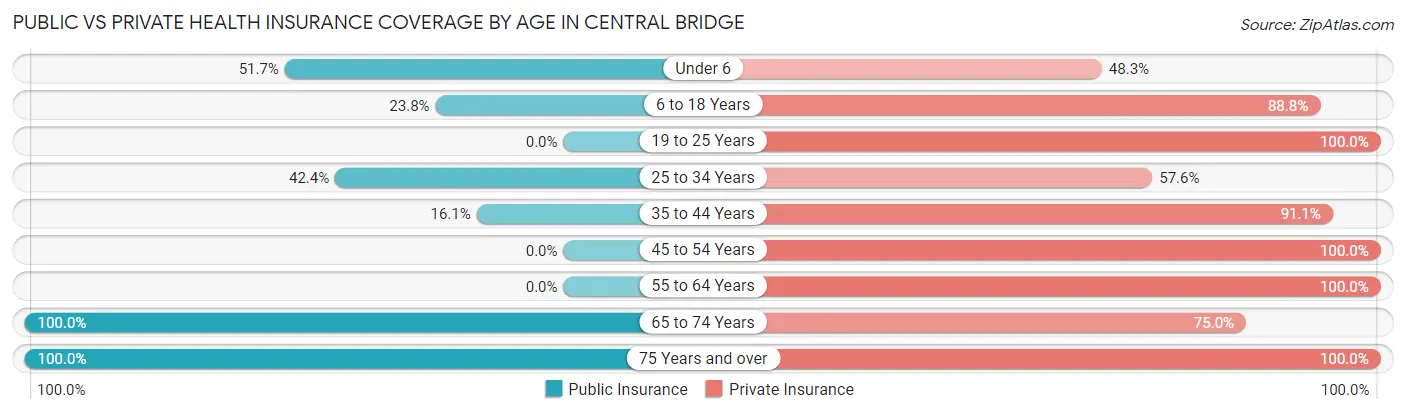
| Age Bracket | Public Insurance | Private Insurance |
| Under 6 | 15 (51.7%) | 14 (48.3%) |
| 6 to 18 Years | 19 (23.7%) | 71 (88.7%) |
| 19 to 25 Years | 0 (0.0%) | 63 (100.0%) |
| 25 to 34 Years | 25 (42.4%) | 34 (57.6%) |
| 35 to 44 Years | 29 (16.1%) | 164 (91.1%) |
| 45 to 54 Years | 0 (0.0%) | 59 (100.0%) |
| 55 to 64 Years | 0 (0.0%) | 7 (100.0%) |
| 65 to 74 Years | 24 (100.0%) | 18 (75.0%) |
| 75 Years and over | 60 (100.0%) | 60 (100.0%) |
| Total | 172 (30.7%) | 490 (87.3%) |
Disability Status by Sex by Age in Central Bridge
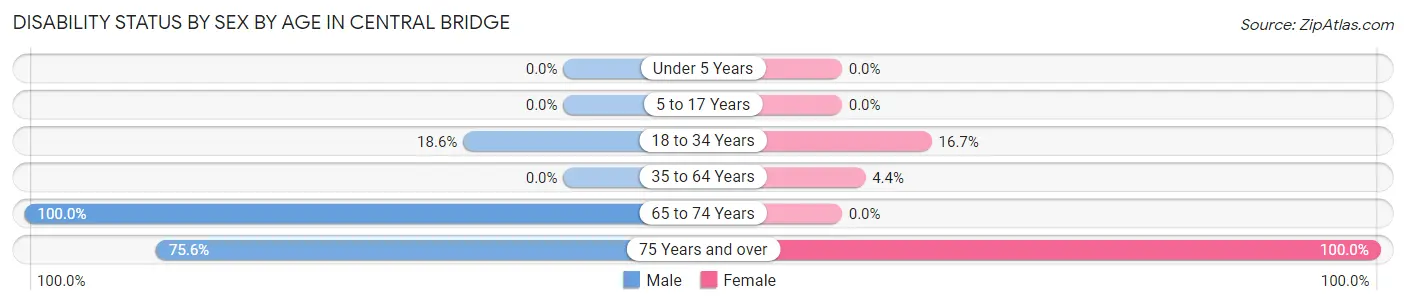
| Age Bracket | Male | Female |
| Under 5 Years | 0 (0.0%) | 0 (0.0%) |
| 5 to 17 Years | 0 (0.0%) | 0 (0.0%) |
| 18 to 34 Years | 16 (18.6%) | 6 (16.7%) |
| 35 to 64 Years | 0 (0.0%) | 6 (4.3%) |
| 65 to 74 Years | 6 (100.0%) | 0 (0.0%) |
| 75 Years and over | 31 (75.6%) | 19 (100.0%) |
Disability Class by Sex by Age in Central Bridge
Disability Class: Hearing Difficulty
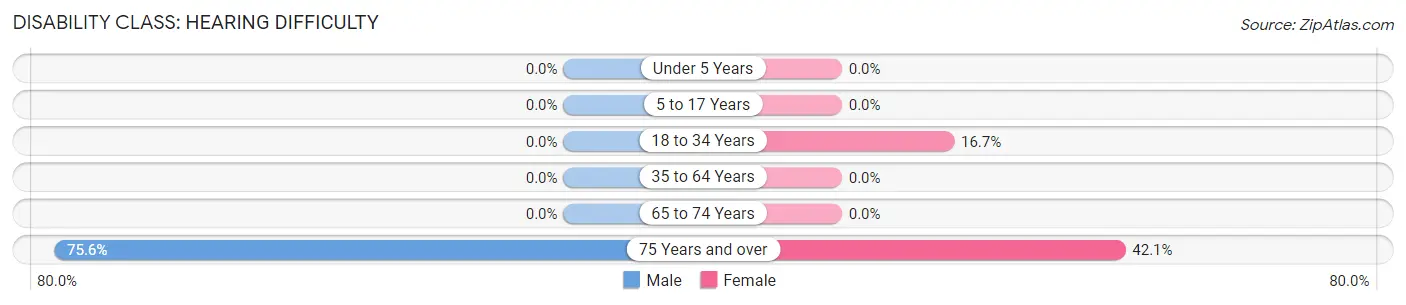
| Age Bracket | Male | Female |
| Under 5 Years | 0 (0.0%) | 0 (0.0%) |
| 5 to 17 Years | 0 (0.0%) | 0 (0.0%) |
| 18 to 34 Years | 0 (0.0%) | 6 (16.7%) |
| 35 to 64 Years | 0 (0.0%) | 0 (0.0%) |
| 65 to 74 Years | 0 (0.0%) | 0 (0.0%) |
| 75 Years and over | 31 (75.6%) | 8 (42.1%) |
Disability Class: Vision Difficulty
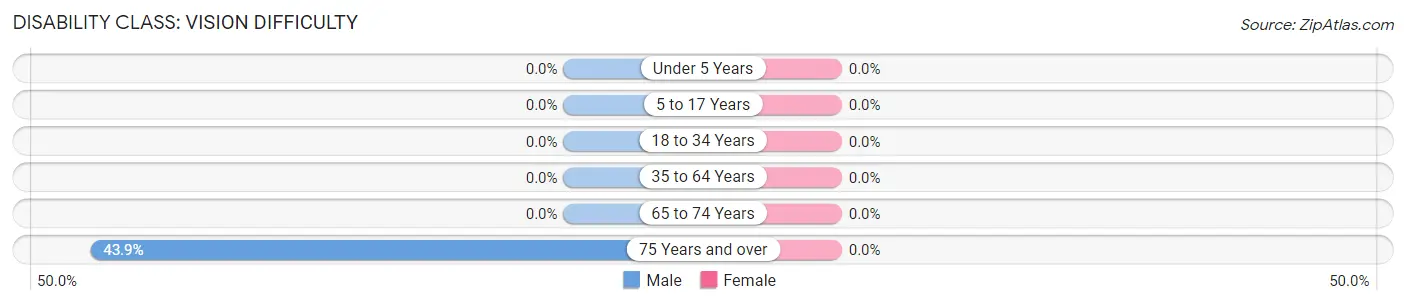
| Age Bracket | Male | Female |
| Under 5 Years | 0 (0.0%) | 0 (0.0%) |
| 5 to 17 Years | 0 (0.0%) | 0 (0.0%) |
| 18 to 34 Years | 0 (0.0%) | 0 (0.0%) |
| 35 to 64 Years | 0 (0.0%) | 0 (0.0%) |
| 65 to 74 Years | 0 (0.0%) | 0 (0.0%) |
| 75 Years and over | 18 (43.9%) | 0 (0.0%) |
Disability Class: Cognitive Difficulty
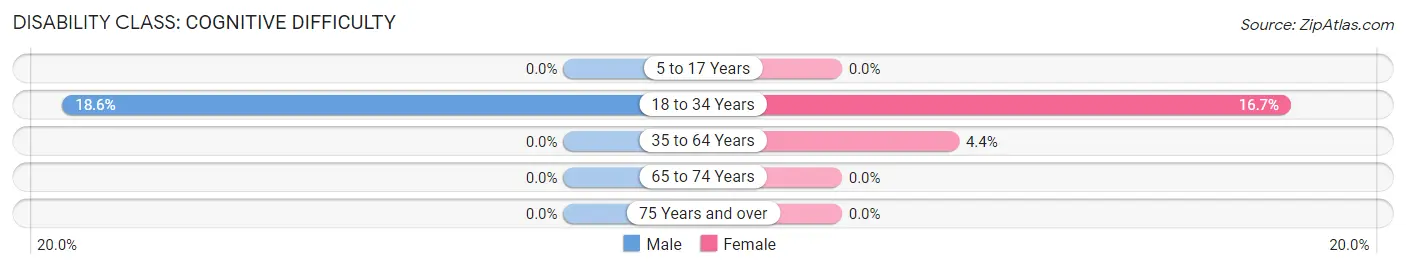
| Age Bracket | Male | Female |
| 5 to 17 Years | 0 (0.0%) | 0 (0.0%) |
| 18 to 34 Years | 16 (18.6%) | 6 (16.7%) |
| 35 to 64 Years | 0 (0.0%) | 6 (4.3%) |
| 65 to 74 Years | 0 (0.0%) | 0 (0.0%) |
| 75 Years and over | 0 (0.0%) | 0 (0.0%) |
Disability Class: Ambulatory Difficulty
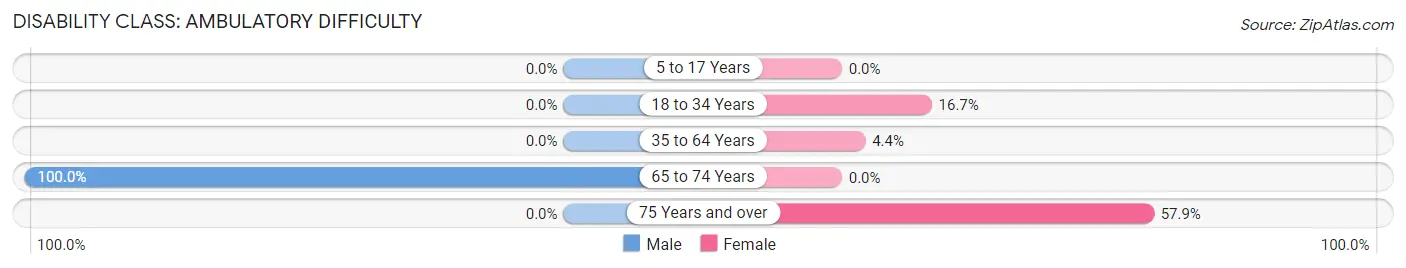
| Age Bracket | Male | Female |
| 5 to 17 Years | 0 (0.0%) | 0 (0.0%) |
| 18 to 34 Years | 0 (0.0%) | 6 (16.7%) |
| 35 to 64 Years | 0 (0.0%) | 6 (4.3%) |
| 65 to 74 Years | 6 (100.0%) | 0 (0.0%) |
| 75 Years and over | 0 (0.0%) | 11 (57.9%) |
Disability Class: Self-Care Difficulty
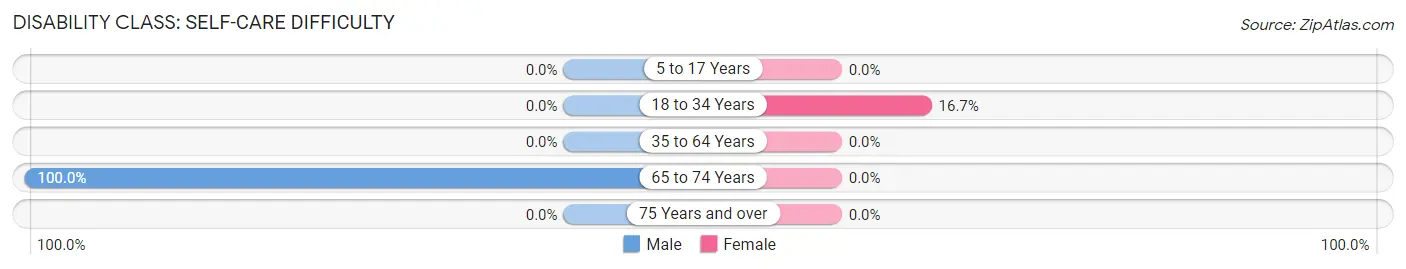
| Age Bracket | Male | Female |
| 5 to 17 Years | 0 (0.0%) | 0 (0.0%) |
| 18 to 34 Years | 0 (0.0%) | 6 (16.7%) |
| 35 to 64 Years | 0 (0.0%) | 0 (0.0%) |
| 65 to 74 Years | 6 (100.0%) | 0 (0.0%) |
| 75 Years and over | 0 (0.0%) | 0 (0.0%) |
Technology Access in Central Bridge
Computing Device Access in Central Bridge
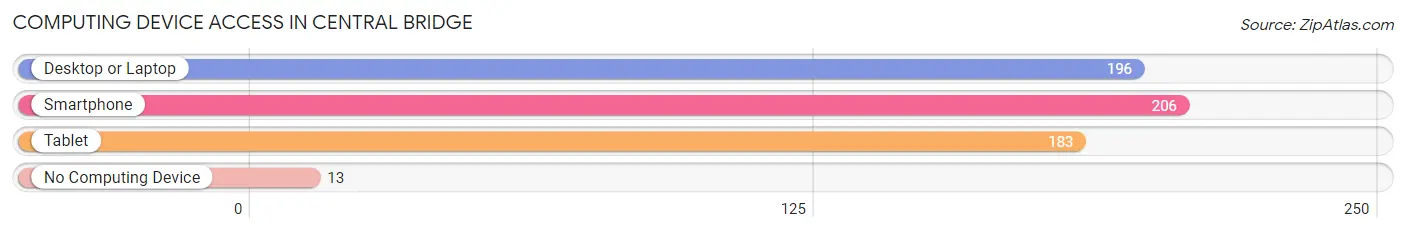
| Device Type | # Households | % Households |
| Desktop or Laptop | 196 | 79.7% |
| Smartphone | 206 | 83.7% |
| Tablet | 183 | 74.4% |
| No Computing Device | 13 | 5.3% |
| Total | 246 | 100.0% |
Internet Access in Central Bridge
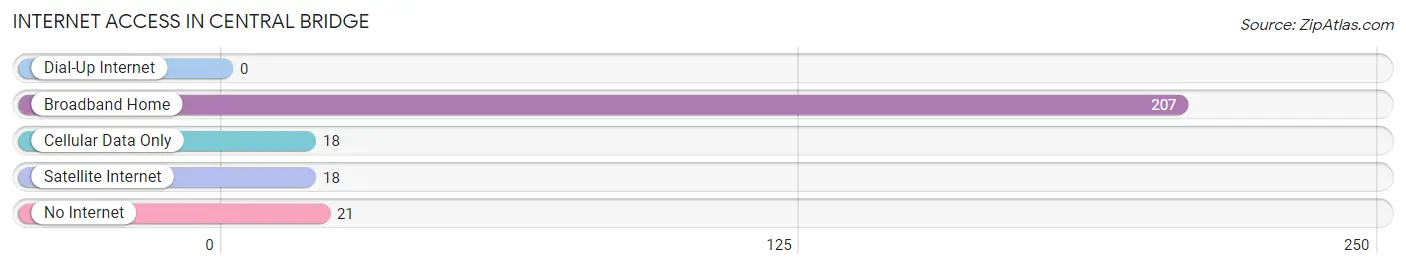
| Internet Type | # Households | % Households |
| Dial-Up Internet | 0 | 0.0% |
| Broadband Home | 207 | 84.2% |
| Cellular Data Only | 18 | 7.3% |
| Satellite Internet | 18 | 7.3% |
| No Internet | 21 | 8.5% |
| Total | 246 | 100.0% |
Central Bridge Summary
Central Bridge is a small hamlet located in the town of Schoharie in Schoharie County, New York. It is situated on the Schoharie Creek, which is a tributary of the Mohawk River. The hamlet is located approximately 20 miles west of Albany, the state capital. Central Bridge has a population of approximately 500 people and is a rural community with a strong agricultural heritage.
History
Central Bridge was first settled in the late 1700s by German immigrants who were attracted to the area by its fertile soil and abundant natural resources. The hamlet was originally known as “Schoharie Bridge” and was the site of a bridge that crossed the Schoharie Creek. The bridge was built in 1802 and was the first bridge to span the creek. The hamlet was renamed “Central Bridge” in 1820 when a post office was established in the area.
The hamlet grew slowly over the years and by the mid-1800s, it had become a thriving agricultural community. The hamlet was home to several mills, including a grist mill, a saw mill, and a woolen mill. The hamlet also had a blacksmith shop, a general store, and a school.
In the late 1800s, the hamlet began to decline as the railroad bypassed the area and the mills closed. The hamlet was further impacted by the Great Depression and World War II. In the 1950s, the hamlet began to experience a resurgence as new businesses opened and the population began to grow.
Geography
Central Bridge is located in the foothills of the Catskill Mountains in the Schoharie Valley. The hamlet is situated on the Schoharie Creek, which is a tributary of the Mohawk River. The hamlet is located approximately 20 miles west of Albany, the state capital.
The hamlet is surrounded by rolling hills and farmland. The area is known for its scenic beauty and is a popular destination for outdoor recreation. The hamlet is home to several parks, including the Schoharie Creek State Park and the Schoharie Valley Rail Trail.
Economy
Central Bridge is a rural community with a strong agricultural heritage. The hamlet is home to several farms, including dairy farms, vegetable farms, and fruit farms. The hamlet is also home to several small businesses, including a general store, a hardware store, and a restaurant.
The hamlet is also home to several manufacturing companies, including a furniture manufacturer and a metal fabrication company. The hamlet is also home to several service-based businesses, including a plumbing and heating company and a landscaping company.
Demographics
As of the 2010 census, the population of Central Bridge was 498. The population is predominantly white (97.2%) and the median age is 44. The median household income is $45,000 and the median home value is $150,000.
The hamlet is home to a diverse religious community, with the largest denominations being Catholic (25.2%), Lutheran (17.2%), and Methodist (14.2%). The hamlet is also home to a small Jewish community (1.2%).
Conclusion
Central Bridge is a small hamlet located in the town of Schoharie in Schoharie County, New York. It is situated on the Schoharie Creek, which is a tributary of the Mohawk River. The hamlet is located approximately 20 miles west of Albany, the state capital. Central Bridge has a population of approximately 500 people and is a rural community with a strong agricultural heritage. The hamlet is home to several farms, small businesses, and manufacturing companies. The population is predominantly white and the median age is 44. The hamlet is home to a diverse religious community and is a popular destination for outdoor recreation.
Common Questions
What is Per Capita Income in Central Bridge?
Per Capita income in Central Bridge is $33,631.
What is the Median Family Income in Central Bridge?
Median Family Income in Central Bridge is $82,716.
What is the Median Household income in Central Bridge?
Median Household Income in Central Bridge is $77,303.
What is Income or Wage Gap in Central Bridge?
Income or Wage Gap in Central Bridge is 27.1%.
Women in Central Bridge earn 72.9 cents for every dollar earned by a man.
What is Inequality or Gini Index in Central Bridge?
Inequality or Gini Index in Central Bridge is 0.28.
What is the Total Population of Central Bridge?
Total Population of Central Bridge is 561.
What is the Total Male Population of Central Bridge?
Total Male Population of Central Bridge is 300.
What is the Total Female Population of Central Bridge?
Total Female Population of Central Bridge is 261.
What is the Ratio of Males per 100 Females in Central Bridge?
There are 114.94 Males per 100 Females in Central Bridge.
What is the Ratio of Females per 100 Males in Central Bridge?
There are 87.00 Females per 100 Males in Central Bridge.
What is the Median Population Age in Central Bridge?
Median Population Age in Central Bridge is 35.9 Years.
What is the Average Family Size in Central Bridge
Average Family Size in Central Bridge is 2.5 People.
What is the Average Household Size in Central Bridge
Average Household Size in Central Bridge is 2.3 People.
How Large is the Labor Force in Central Bridge?
There are 352 People in the Labor Forcein in Central Bridge.
What is the Percentage of People in the Labor Force in Central Bridge?
72.3% of People are in the Labor Force in Central Bridge.
What is the Unemployment Rate in Central Bridge?
Unemployment Rate in Central Bridge is 4.5%.