Zip Codes with the Highest Percentage of Population with a Degree in Computers and Mathematics in Buffalo, NY

RELATED REPORTS & OPTIONS

Computers and Mathematics
Population
Families and Households
Female Fertility
Female Fertility (Unmarried)
Race (Community Size)
Race (Percentage)
Ancestry (Community Size)
AfghanAfricanAlbanianAlsatianAmericanArabArgentineanArmenianAustralianAustrianBahamianBarbadianBelgianBelizeanBhutaneseBlackfeetBolivianBrazilianBritishBritish West IndianBulgarianBurmeseCajunCambodianCanadianCarpatho RusynCelticCentral AmericanCentral American IndianCherokeeChileanChippewaColombianCosta RicanCreekCroatianCubanCzechCzechoslovakianDanishDominicanDutchDutch West IndianEastern EuropeanEcuadorianEgyptianEnglishEstonianEthiopianEuropeanFilipinoFinnishFrenchFrench American IndianFrench CanadianGermanGerman RussianGhanaianGreekGuamanian / ChamorroGuatemalanGuyaneseHaitianHonduranHungarianIcelanderIndian (Asian)IndonesianIranianIraqiIrishIroquoisIsraeliItalianJamaicanJapaneseJordanianKenyanKoreanLaotianLatvianLebaneseLithuanianMacedonianMalaysianMalteseMexicanMexican American IndianMongolianMoroccanNative HawaiianNavajoNicaraguanNigerianNorthern EuropeanNorwegianOkinawanPakistaniPalestinianPanamanianPennsylvania GermanPeruvianPolishPortuguesePuerto RicanRomanianRussianSalvadoranSamoanScandinavianScotch-IrishScottishSerbianSiouxSlavicSlovakSloveneSomaliSouth AfricanSouth AmericanSouth American IndianSpaniardSpanishSri LankanSubsaharan AfricanSudaneseSwedishSwissSyrianTaiwaneseThaiTrinidadian and TobagonianTurkishUkrainianVenezuelanVietnameseWelshWest IndianYugoslavian
Ancestry (Percentage)
AfghanAfricanAlbanianAlsatianAmericanArabArgentineanArmenianAustralianAustrianBahamianBarbadianBelgianBelizeanBhutaneseBlackfeetBolivianBrazilianBritishBritish West IndianBulgarianBurmeseCajunCambodianCanadianCarpatho RusynCelticCentral AmericanCentral American IndianCherokeeChileanChippewaColombianCosta RicanCreekCroatianCubanCzechCzechoslovakianDanishDominicanDutchDutch West IndianEastern EuropeanEcuadorianEgyptianEnglishEstonianEthiopianEuropeanFilipinoFinnishFrenchFrench American IndianFrench CanadianGermanGerman RussianGhanaianGreekGuamanian / ChamorroGuatemalanGuyaneseHaitianHonduranHungarianIcelanderIndian (Asian)IndonesianIranianIraqiIrishIroquoisIsraeliItalianJamaicanJapaneseJordanianKenyanKoreanLaotianLatvianLebaneseLithuanianMacedonianMalaysianMalteseMexicanMexican American IndianMongolianMoroccanNative HawaiianNavajoNicaraguanNigerianNorthern EuropeanNorwegianOkinawanPakistaniPalestinianPanamanianPennsylvania GermanPeruvianPolishPortuguesePuerto RicanRomanianRussianSalvadoranSamoanScandinavianScotch-IrishScottishSerbianSiouxSlavicSlovakSloveneSomaliSouth AfricanSouth AmericanSouth American IndianSpaniardSpanishSri LankanSubsaharan AfricanSudaneseSwedishSwissSyrianTaiwaneseThaiTrinidadian and TobagonianTurkishUkrainianVenezuelanVietnameseWelshWest IndianYugoslavian
Immigrant Origin (Total)
AfghanistanAfricaAlbaniaArgentinaAsiaAustraliaAustriaBangladeshBarbadosBelarusBosnia and HerzegovinaBrazilBulgariaBurma / MyanmarCameroonCanadaCaribbeanCentral AmericaChinaColombiaCongoCosta RicaCroatiaCubaCzechoslovakiaDominican RepublicEastern AfricaEastern AsiaEastern EuropeEcuadorEgyptEl SalvadorEnglandEritreaEthiopiaEuropeFranceGermanyGhanaGreeceGuatemalaGuyanaHaitiHondurasHong KongHungaryIndiaIndonesiaIranIraqIrelandIsraelItalyJamaicaJapanJordanKazakhstanKenyaKoreaKuwaitLaosLatin AmericaLatviaLebanonLiberiaLithuaniaMalaysiaMexicoMiddle AfricaMoldovaMoroccoNepalNetherlandsNigeriaNorth MacedoniaNorthern AfricaNorthern EuropeNorwayOceaniaPakistanPanamaPeruPhilippinesPolandRomaniaRussiaSaudi ArabiaScotlandSerbiaSierra LeoneSingaporeSomaliaSouth AfricaSouth AmericaSouth Central AsiaSouth Eastern AsiaSouthern EuropeSpainSri LankaSt. Vincent and the GrenadinesSudanSwedenSwitzerlandSyriaTaiwanThailandTrinidad and TobagoTurkeyUgandaUkraineUzbekistanVenezuelaVietnamWest IndiesWestern AfricaWestern AsiaWestern EuropeYemenZaire
Immigrant Origin (Percentage)
AfghanistanAfricaAlbaniaArgentinaAsiaAustraliaAustriaBangladeshBarbadosBelarusBosnia and HerzegovinaBrazilBulgariaBurma / MyanmarCameroonCanadaCaribbeanCentral AmericaChinaColombiaCongoCosta RicaCroatiaCubaCzechoslovakiaDominican RepublicEastern AfricaEastern AsiaEastern EuropeEcuadorEgyptEl SalvadorEnglandEritreaEthiopiaEuropeFranceGermanyGhanaGreeceGuatemalaGuyanaHaitiHondurasHong KongHungaryIndiaIndonesiaIranIraqIrelandIsraelItalyJamaicaJapanJordanKazakhstanKenyaKoreaKuwaitLaosLatin AmericaLatviaLebanonLiberiaLithuaniaMalaysiaMexicoMiddle AfricaMoldovaMoroccoNepalNetherlandsNigeriaNorth MacedoniaNorthern AfricaNorthern EuropeNorwayOceaniaPakistanPanamaPeruPhilippinesPolandRomaniaRussiaSaudi ArabiaScotlandSerbiaSierra LeoneSingaporeSomaliaSouth AfricaSouth AmericaSouth Central AsiaSouth Eastern AsiaSouthern EuropeSpainSri LankaSt. Vincent and the GrenadinesSudanSwedenSwitzerlandSyriaTaiwanThailandTrinidad and TobagoTurkeyUgandaUkraineUzbekistanVenezuelaVietnamWest IndiesWestern AfricaWestern AsiaWestern EuropeYemenZaire
Income
Income (Families)
Income (Households)
Poverty
Poverty (Families)
Unemployment
Employment Occupations
Employment Industries
Employer Class
Commute Time
Commute Means
School Enrollment
Education by Degree Field
Occupancy
Finances
Physical Characteristics
Buffalo
Compare Zip Codes
Comparison Subject

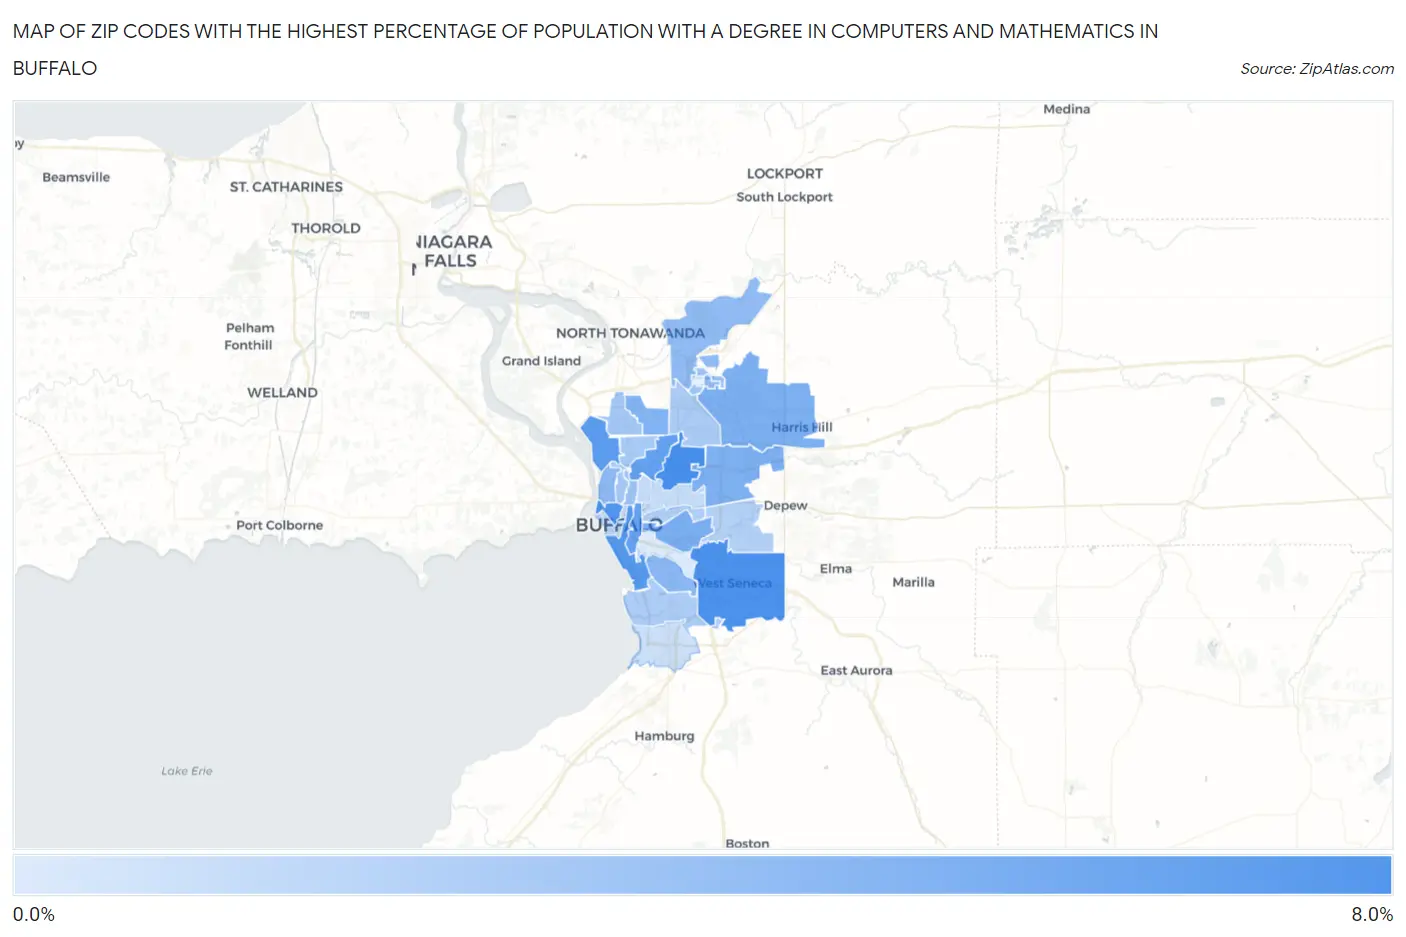
Map of Zip Codes with the Highest Percentage of Population with a Degree in Computers and Mathematics in Buffalo

0.0%
8.0%
Zip Codes with the Highest Percentage of Population with a Degree in Computers and Mathematics in Buffalo Map

Zip Codes with the Highest Percentage of Population with a Degree in Computers and Mathematics in Buffalo, NY

Zip Code % Graduates vs State vs National
1.142157.5%4.7%(+2.81)#1884.9%(+2.63)#3,308
2.142247.3%4.7%(+2.60)#2054.9%(+2.43)#3,493
3.142017.0%4.7%(+2.31)#2284.9%(+2.14)#3,785
4.142036.7%4.7%(+1.97)#2594.9%(+1.80)#4,205
5.142076.6%4.7%(+1.90)#2704.9%(+1.73)#4,314
6.142146.1%4.7%(+1.40)#3264.9%(+1.23)#5,068
7.142046.0%4.7%(+1.32)#3374.9%(+1.15)#5,229
8.142064.9%4.7%(+0.212)#4904.9%(+0.042)#7,602
9.142214.9%4.7%(+0.200)#4934.9%(+0.029)#7,633
10.142254.8%4.7%(+0.057)#5334.9%(-0.114)#8,050
11.142234.6%4.7%(-0.108)#5654.9%(-0.278)#8,520
12.142204.2%4.7%(-0.553)#6584.9%(-0.724)#9,926
13.142134.1%4.7%(-0.595)#6684.9%(-0.765)#10,058
14.142283.9%4.7%(-0.856)#7354.9%(-1.03)#10,920
15.142093.3%4.7%(-1.44)#8824.9%(-1.61)#13,082
16.142613.1%4.7%(-1.60)#9184.9%(-1.77)#13,637
17.142172.9%4.7%(-1.80)#9544.9%(-1.97)#14,335
18.142222.8%4.7%(-1.89)#9774.9%(-2.06)#14,683
19.142162.7%4.7%(-2.02)#9964.9%(-2.19)#15,134
20.142262.6%4.7%(-2.08)#1,0144.9%(-2.25)#15,389
21.142182.6%4.7%(-2.17)#1,0284.9%(-2.34)#15,712
22.142122.2%4.7%(-2.50)#1,0884.9%(-2.67)#16,866
23.142272.2%4.7%(-2.51)#1,0914.9%(-2.69)#16,937
24.142081.3%4.7%(-3.37)#1,2124.9%(-3.54)#19,565
25.142111.2%4.7%(-3.50)#1,2324.9%(-3.67)#19,926
26.142021.2%4.7%(-3.50)#1,2344.9%(-3.67)#19,940
27.142190.92%4.7%(-3.80)#1,2614.9%(-3.97)#20,700
28.142100.19%4.7%(-4.54)#1,3074.9%(-4.71)#21,774

Common Questions

What are the Top 10 Zip Codes with the Highest Percentage of Population with a Degree in Computers and Mathematics in Buffalo, NY?
Top 10 Zip Codes with the Highest Percentage of Population with a Degree in Computers and Mathematics in Buffalo, NY are:
#1
7.5%
#2
7.3%
#3
7.0%
#4
6.7%
#5
6.6%
#6
6.1%
#7
6.0%
#8
4.9%
#9
4.9%
#10
4.8%
What zip code has the Highest Percentage of Population with a Degree in Computers and Mathematics in Buffalo, NY?
14215 has the Highest Percentage of Population with a Degree in Computers and Mathematics in Buffalo, NY with 7.5%.
What is the Percentage of Population with a Degree in Computers and Mathematics in Buffalo, NY?
Percentage of Population with a Degree in Computers and Mathematics in Buffalo is 4.1%.
What is the Percentage of Population with a Degree in Computers and Mathematics in New York?
Percentage of Population with a Degree in Computers and Mathematics in New York is 4.7%.
What is the Percentage of Population with a Degree in Computers and Mathematics in the United States?
Percentage of Population with a Degree in Computers and Mathematics in the United States is 4.9%.