Zip Codes with the Highest Percentage of Population with a Degree in Computers and Mathematics in New York
RELATED REPORTS & OPTIONS
Computers and Mathematics
New York
Compare Zip Codes
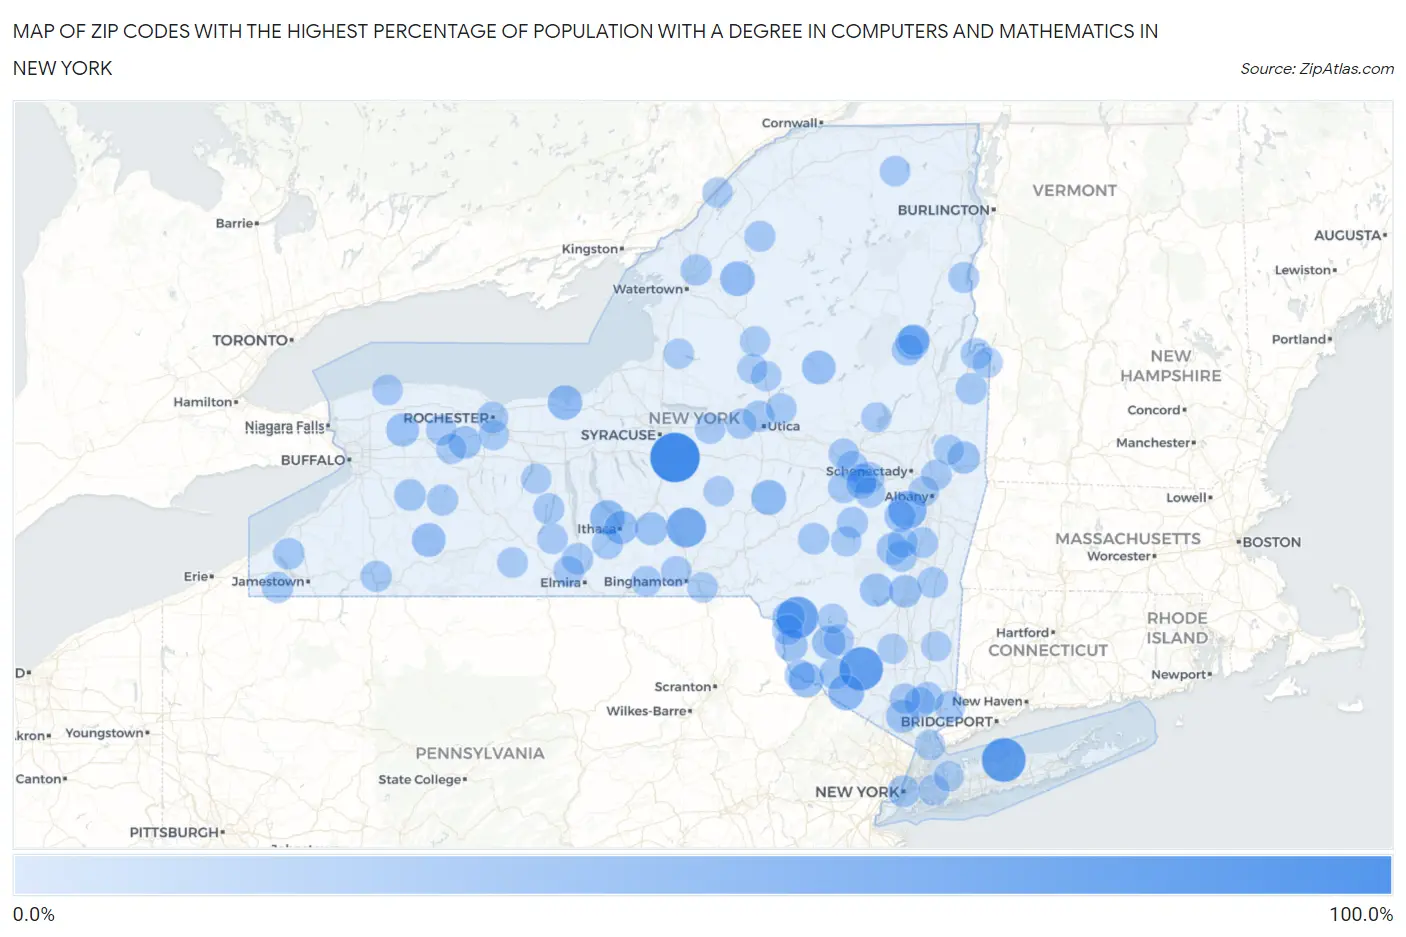
Map of Zip Codes with the Highest Percentage of Population with a Degree in Computers and Mathematics in New York
0.0%
100.0%
Zip Codes with the Highest Percentage of Population with a Degree in Computers and Mathematics in New York
| Zip Code | % Graduates | vs State | vs National | |
| 1. | 13138 | 100.0% | 4.7%(+95.3)#1 | 4.9%(+95.1)#13 |
| 2. | 11794 | 72.5% | 4.7%(+67.8)#2 | 4.9%(+67.7)#32 |
| 3. | 10919 | 70.9% | 4.7%(+66.2)#3 | 4.9%(+66.0)#34 |
| 4. | 12724 | 62.5% | 4.7%(+57.8)#4 | 4.9%(+57.6)#44 |
| 5. | 13863 | 53.1% | 4.7%(+48.3)#5 | 4.9%(+48.2)#65 |
| 6. | 12041 | 45.3% | 4.7%(+40.6)#6 | 4.9%(+40.4)#106 |
| 7. | 10933 | 33.7% | 4.7%(+29.0)#7 | 4.9%(+28.8)#181 |
| 8. | 13342 | 30.8% | 4.7%(+26.0)#8 | 4.9%(+25.9)#215 |
| 9. | 14854 | 30.2% | 4.7%(+25.5)#9 | 4.9%(+25.3)#219 |
| 10. | 12770 | 30.0% | 4.7%(+25.3)#10 | 4.9%(+25.1)#226 |
| 11. | 13665 | 29.7% | 4.7%(+25.0)#11 | 4.9%(+24.8)#232 |
| 12. | 14555 | 29.0% | 4.7%(+24.3)#12 | 4.9%(+24.1)#238 |
| 13. | 12886 | 26.7% | 4.7%(+22.0)#13 | 4.9%(+21.8)#273 |
| 14. | 14717 | 25.2% | 4.7%(+20.4)#14 | 4.9%(+20.3)#294 |
| 15. | 13353 | 25.0% | 4.7%(+20.3)#15 | 4.9%(+20.1)#308 |
| 16. | 12751 | 23.6% | 4.7%(+18.9)#16 | 4.9%(+18.7)#346 |
| 17. | 14853 | 23.1% | 4.7%(+18.4)#17 | 4.9%(+18.2)#357 |
| 18. | 14013 | 22.5% | 4.7%(+17.8)#18 | 4.9%(+17.6)#378 |
| 19. | 12457 | 21.9% | 4.7%(+17.2)#19 | 4.9%(+17.0)#396 |
| 20. | 13784 | 21.4% | 4.7%(+16.7)#20 | 4.9%(+16.5)#414 |
| 21. | 12736 | 21.2% | 4.7%(+16.4)#21 | 4.9%(+16.3)#424 |
| 22. | 10984 | 20.9% | 4.7%(+16.2)#22 | 4.9%(+16.0)#431 |
| 23. | 14511 | 20.0% | 4.7%(+15.3)#23 | 4.9%(+15.1)#465 |
| 24. | 12752 | 19.6% | 4.7%(+14.9)#24 | 4.9%(+14.7)#479 |
| 25. | 12456 | 19.4% | 4.7%(+14.7)#25 | 4.9%(+14.5)#491 |
| 26. | 12094 | 19.3% | 4.7%(+14.6)#26 | 4.9%(+14.5)#492 |
| 27. | 12405 | 17.5% | 4.7%(+12.8)#27 | 4.9%(+12.6)#587 |
| 28. | 10279 | 17.4% | 4.7%(+12.7)#28 | 4.9%(+12.5)#600 |
| 29. | 14113 | 15.7% | 4.7%(+11.0)#29 | 4.9%(+10.8)#730 |
| 30. | 14728 | 15.2% | 4.7%(+10.5)#30 | 4.9%(+10.3)#768 |
| 31. | 13739 | 15.0% | 4.7%(+10.3)#31 | 4.9%(+10.1)#785 |
| 32. | 12838 | 15.0% | 4.7%(+10.3)#32 | 4.9%(+10.1)#789 |
| 33. | 12729 | 14.9% | 4.7%(+10.2)#33 | 4.9%(+9.99)#801 |
| 34. | 14614 | 14.8% | 4.7%(+10.1)#34 | 4.9%(+9.95)#803 |
| 35. | 12193 | 14.8% | 4.7%(+10.1)#35 | 4.9%(+9.89)#813 |
| 36. | 12473 | 14.7% | 4.7%(+9.96)#36 | 4.9%(+9.78)#823 |
| 37. | 12843 | 14.5% | 4.7%(+9.82)#37 | 4.9%(+9.65)#839 |
| 38. | 13403 | 14.5% | 4.7%(+9.78)#38 | 4.9%(+9.61)#845 |
| 39. | 12043 | 14.4% | 4.7%(+9.69)#39 | 4.9%(+9.52)#852 |
| 40. | 12066 | 14.2% | 4.7%(+9.47)#40 | 4.9%(+9.30)#892 |
| 41. | 13637 | 14.1% | 4.7%(+9.42)#41 | 4.9%(+9.25)#895 |
| 42. | 14872 | 14.1% | 4.7%(+9.39)#42 | 4.9%(+9.22)#897 |
| 43. | 14748 | 13.7% | 4.7%(+9.00)#43 | 4.9%(+8.83)#942 |
| 44. | 12862 | 13.7% | 4.7%(+8.99)#44 | 4.9%(+8.82)#944 |
| 45. | 10535 | 13.7% | 4.7%(+8.96)#45 | 4.9%(+8.79)#946 |
| 46. | 14427 | 13.6% | 4.7%(+8.87)#46 | 4.9%(+8.70)#964 |
| 47. | 14767 | 13.6% | 4.7%(+8.84)#47 | 4.9%(+8.67)#970 |
| 48. | 12131 | 13.5% | 4.7%(+8.79)#48 | 4.9%(+8.62)#978 |
| 49. | 14478 | 13.2% | 4.7%(+8.51)#49 | 4.9%(+8.34)#1,015 |
| 50. | 12887 | 13.1% | 4.7%(+8.39)#50 | 4.9%(+8.22)#1,035 |
| 51. | 12523 | 13.0% | 4.7%(+8.30)#51 | 4.9%(+8.13)#1,055 |
| 52. | 12974 | 12.8% | 4.7%(+8.11)#52 | 4.9%(+7.94)#1,075 |
| 53. | 14867 | 12.6% | 4.7%(+7.90)#53 | 4.9%(+7.73)#1,105 |
| 54. | 13635 | 12.5% | 4.7%(+7.78)#54 | 4.9%(+7.61)#1,128 |
| 55. | 12051 | 12.3% | 4.7%(+7.61)#55 | 4.9%(+7.44)#1,158 |
| 56. | 10517 | 12.3% | 4.7%(+7.61)#56 | 4.9%(+7.43)#1,162 |
| 57. | 13431 | 12.1% | 4.7%(+7.41)#57 | 4.9%(+7.24)#1,192 |
| 58. | 11428 | 11.9% | 4.7%(+7.21)#58 | 4.9%(+7.04)#1,226 |
| 59. | 14819 | 11.8% | 4.7%(+7.04)#59 | 4.9%(+6.87)#1,267 |
| 60. | 12166 | 11.7% | 4.7%(+7.02)#60 | 4.9%(+6.85)#1,276 |
| 61. | 12723 | 11.7% | 4.7%(+6.96)#61 | 4.9%(+6.79)#1,284 |
| 62. | 10922 | 11.6% | 4.7%(+6.88)#62 | 4.9%(+6.71)#1,305 |
| 63. | 14814 | 11.5% | 4.7%(+6.81)#63 | 4.9%(+6.64)#1,325 |
| 64. | 12160 | 11.5% | 4.7%(+6.78)#64 | 4.9%(+6.61)#1,329 |
| 65. | 14012 | 11.3% | 4.7%(+6.61)#65 | 4.9%(+6.44)#1,368 |
| 66. | 13163 | 11.3% | 4.7%(+6.60)#66 | 4.9%(+6.43)#1,371 |
| 67. | 14815 | 11.3% | 4.7%(+6.57)#67 | 4.9%(+6.40)#1,383 |
| 68. | 12789 | 11.1% | 4.7%(+6.39)#68 | 4.9%(+6.22)#1,419 |
| 69. | 12719 | 11.1% | 4.7%(+6.39)#69 | 4.9%(+6.22)#1,422 |
| 70. | 10518 | 11.1% | 4.7%(+6.39)#70 | 4.9%(+6.22)#1,425 |
| 71. | 13790 | 10.9% | 4.7%(+6.18)#71 | 4.9%(+6.01)#1,480 |
| 72. | 14422 | 10.9% | 4.7%(+6.17)#72 | 4.9%(+6.00)#1,482 |
| 73. | 13490 | 10.9% | 4.7%(+6.15)#73 | 4.9%(+5.98)#1,487 |
| 74. | 13827 | 10.8% | 4.7%(+6.03)#74 | 4.9%(+5.86)#1,512 |
| 75. | 13428 | 10.7% | 4.7%(+6.00)#75 | 4.9%(+5.83)#1,519 |
| 76. | 12969 | 10.7% | 4.7%(+5.94)#76 | 4.9%(+5.77)#1,535 |
| 77. | 12157 | 10.6% | 4.7%(+5.90)#77 | 4.9%(+5.73)#1,547 |
| 78. | 12434 | 10.5% | 4.7%(+5.80)#78 | 4.9%(+5.63)#1,578 |
| 79. | 14482 | 10.4% | 4.7%(+5.69)#79 | 4.9%(+5.52)#1,609 |
| 80. | 12047 | 10.3% | 4.7%(+5.61)#80 | 4.9%(+5.44)#1,642 |
| 81. | 13795 | 10.3% | 4.7%(+5.60)#81 | 4.9%(+5.43)#1,645 |
| 82. | 11548 | 10.3% | 4.7%(+5.57)#82 | 4.9%(+5.40)#1,654 |
| 83. | 12035 | 10.3% | 4.7%(+5.56)#83 | 4.9%(+5.39)#1,657 |
| 84. | 12540 | 10.3% | 4.7%(+5.53)#84 | 4.9%(+5.36)#1,672 |
| 85. | 12431 | 10.2% | 4.7%(+5.53)#85 | 4.9%(+5.36)#1,673 |
| 86. | 14544 | 10.0% | 4.7%(+5.31)#86 | 4.9%(+5.14)#1,740 |
| 87. | 12765 | 9.9% | 4.7%(+5.18)#87 | 4.9%(+5.01)#1,791 |
| 88. | 12154 | 9.9% | 4.7%(+5.15)#88 | 4.9%(+4.98)#1,803 |
| 89. | 13464 | 9.9% | 4.7%(+5.14)#89 | 4.9%(+4.97)#1,810 |
| 90. | 13144 | 9.8% | 4.7%(+5.11)#90 | 4.9%(+4.94)#1,817 |
| 91. | 14467 | 9.8% | 4.7%(+5.05)#91 | 4.9%(+4.88)#1,847 |
| 92. | 12222 | 9.8% | 4.7%(+5.03)#92 | 4.9%(+4.86)#1,851 |
| 93. | 13301 | 9.8% | 4.7%(+5.03)#93 | 4.9%(+4.86)#1,857 |
| 94. | 12837 | 9.7% | 4.7%(+4.99)#94 | 4.9%(+4.81)#1,881 |
| 95. | 13368 | 9.7% | 4.7%(+4.93)#95 | 4.9%(+4.76)#1,901 |
| 96. | 13664 | 9.6% | 4.7%(+4.87)#96 | 4.9%(+4.70)#1,931 |
| 97. | 12548 | 9.5% | 4.7%(+4.76)#97 | 4.9%(+4.59)#1,975 |
| 98. | 10606 | 9.5% | 4.7%(+4.76)#98 | 4.9%(+4.59)#1,976 |
| 99. | 12117 | 9.4% | 4.7%(+4.64)#99 | 4.9%(+4.47)#2,032 |
| 100. | 13309 | 9.3% | 4.7%(+4.62)#100 | 4.9%(+4.45)#2,037 |
Common Questions
What are the Top 10 Zip Codes with the Highest Percentage of Population with a Degree in Computers and Mathematics in New York?
Top 10 Zip Codes with the Highest Percentage of Population with a Degree in Computers and Mathematics in New York are:
What zip code has the Highest Percentage of Population with a Degree in Computers and Mathematics in New York?
13138 has the Highest Percentage of Population with a Degree in Computers and Mathematics in New York with 100.0%.
What is the Percentage of Population with a Degree in Computers and Mathematics in the State of New York?
Percentage of Population with a Degree in Computers and Mathematics in New York is 4.7%.
What is the Percentage of Population with a Degree in Computers and Mathematics in the United States?
Percentage of Population with a Degree in Computers and Mathematics in the United States is 4.9%.