Greenville CDP Greene County, NY Map & Demographics
Greenville CDP Greene County Overview
$29,897
PER CAPITA INCOME
$96,250
AVG FAMILY INCOME
0.39
INEQUALITY / GINI INDEX
746
TOTAL POPULATION
408
MALE POPULATION
338
FEMALE POPULATION
120.71
MALES / 100 FEMALES
82.84
FEMALES / 100 MALES
49.9
MEDIAN AGE
2.5
AVG FAMILY SIZE
2.7
AVG HOUSEHOLD SIZE
245
LABOR FORCE [ PEOPLE ]
47.4%
PERCENT IN LABOR FORCE
Income in Greenville CDP Greene County
Income Overview in Greenville CDP Greene County
| Characteristic | Number | Measure |
| Per Capita Income | 746 | $29,897 |
| Median Family Income | 167 | $96,250 |
| Mean Family Income | 167 | $82,738 |
| Median Household Income | 277 | $0 |
| Mean Household Income | 277 | $73,354 |
| Income Deficit | 167 | $0 |
| Wage / Income Gap (%) | 746 | 0.00% |
| Wage / Income Gap ($) | 746 | 100.00¢ per $1 |
| Gini / Inequality Index | 746 | 0.39 |
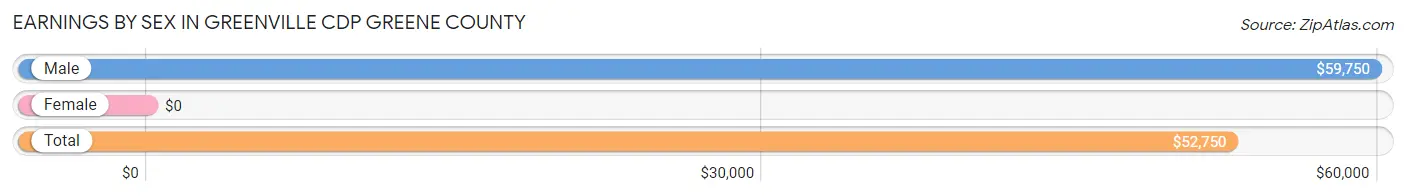
Earnings by Sex in Greenville CDP Greene County
| Sex | Number | Average Earnings |
| Male | 104 (40.8%) | $59,750 |
| Female | 151 (59.2%) | $0 |
| Total | 255 (100.0%) | $52,750 |
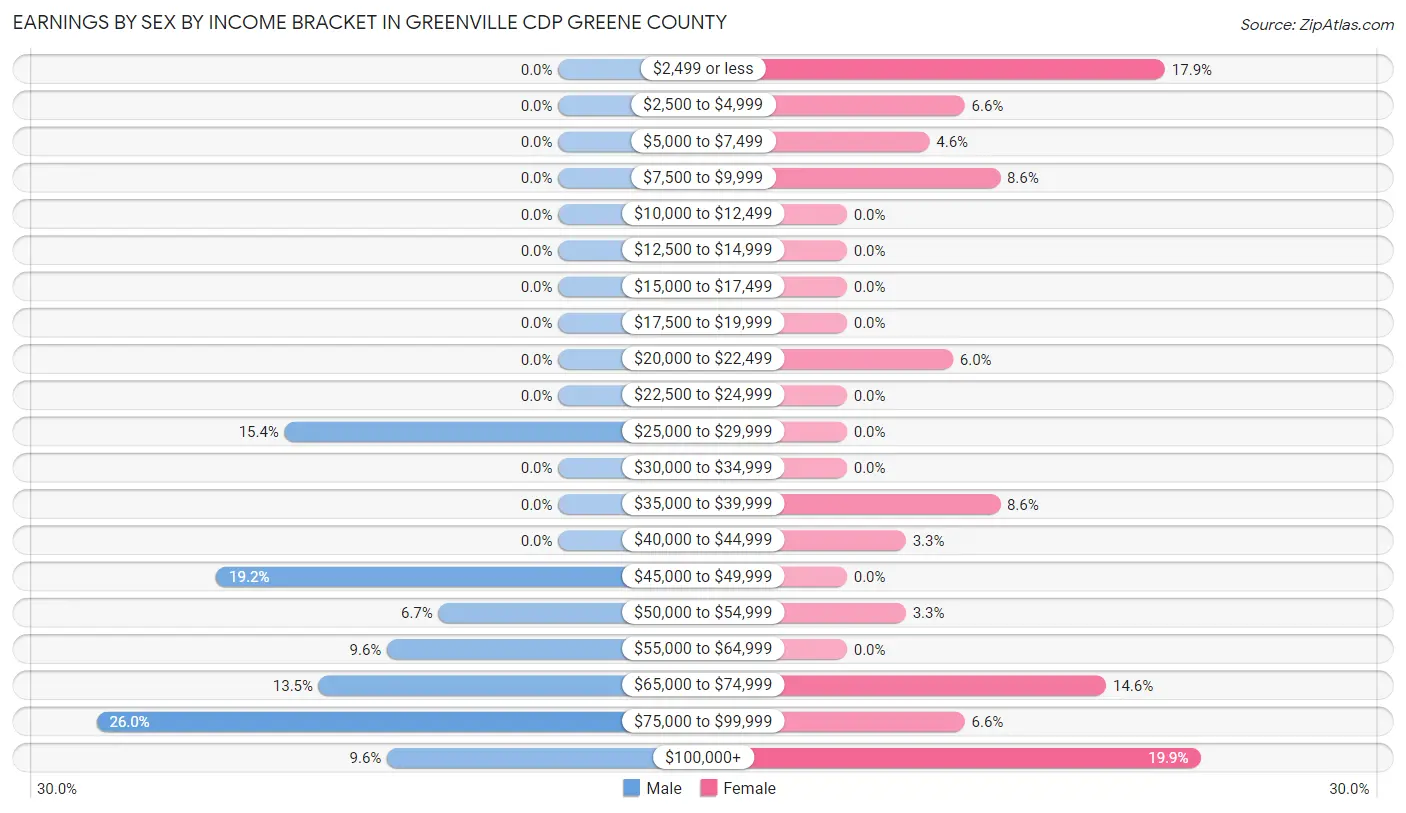
Earnings by Sex by Income Bracket in Greenville CDP Greene County
The most common earnings brackets in Greenville CDP Greene County are $75,000 to $99,999 for men (27 | 26.0%) and $100,000+ for women (30 | 19.9%).
| Income | Male | Female |
| $2,499 or less | 0 (0.0%) | 27 (17.9%) |
| $2,500 to $4,999 | 0 (0.0%) | 10 (6.6%) |
| $5,000 to $7,499 | 0 (0.0%) | 7 (4.6%) |
| $7,500 to $9,999 | 0 (0.0%) | 13 (8.6%) |
| $10,000 to $12,499 | 0 (0.0%) | 0 (0.0%) |
| $12,500 to $14,999 | 0 (0.0%) | 0 (0.0%) |
| $15,000 to $17,499 | 0 (0.0%) | 0 (0.0%) |
| $17,500 to $19,999 | 0 (0.0%) | 0 (0.0%) |
| $20,000 to $22,499 | 0 (0.0%) | 9 (6.0%) |
| $22,500 to $24,999 | 0 (0.0%) | 0 (0.0%) |
| $25,000 to $29,999 | 16 (15.4%) | 0 (0.0%) |
| $30,000 to $34,999 | 0 (0.0%) | 0 (0.0%) |
| $35,000 to $39,999 | 0 (0.0%) | 13 (8.6%) |
| $40,000 to $44,999 | 0 (0.0%) | 5 (3.3%) |
| $45,000 to $49,999 | 20 (19.2%) | 0 (0.0%) |
| $50,000 to $54,999 | 7 (6.7%) | 5 (3.3%) |
| $55,000 to $64,999 | 10 (9.6%) | 0 (0.0%) |
| $65,000 to $74,999 | 14 (13.5%) | 22 (14.6%) |
| $75,000 to $99,999 | 27 (26.0%) | 10 (6.6%) |
| $100,000+ | 10 (9.6%) | 30 (19.9%) |
| Total | 104 (100.0%) | 151 (100.0%) |
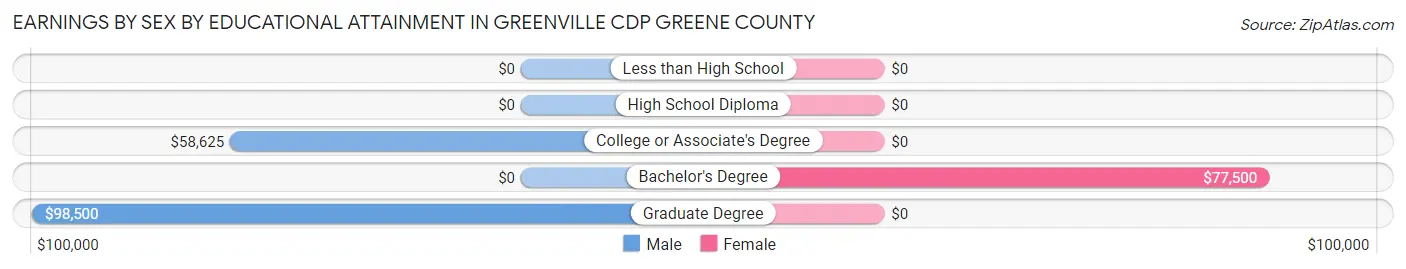
Earnings by Sex by Educational Attainment in Greenville CDP Greene County
| Educational Attainment | Male Income | Female Income |
| Less than High School | - | - |
| High School Diploma | - | - |
| College or Associate's Degree | $58,625 | $0 |
| Bachelor's Degree | - | - |
| Graduate Degree | $98,500 | $0 |
| Total | $59,750 | $0 |
Family Income in Greenville CDP Greene County
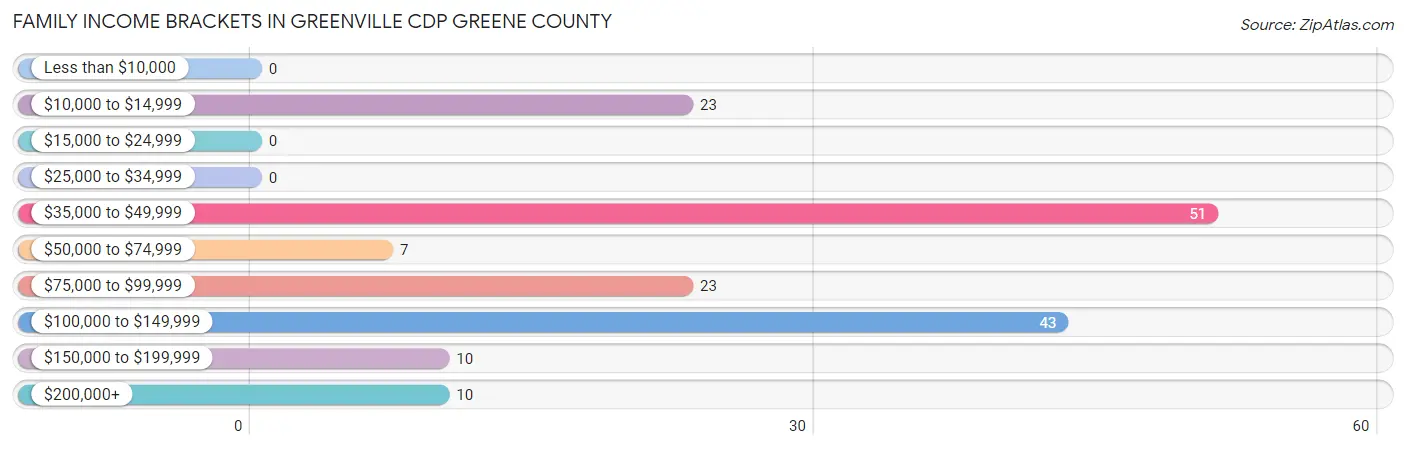
Family Income Brackets in Greenville CDP Greene County
According to the Greenville CDP Greene County family income data, there are 51 families falling into the $35,000 to $49,999 income range, which is the most common income bracket and makes up 30.5% of all families.
| Income Bracket | # Families | % Families |
| Less than $10,000 | 0 | 0.0% |
| $10,000 to $14,999 | 23 | 13.8% |
| $15,000 to $24,999 | 0 | 0.0% |
| $25,000 to $34,999 | 0 | 0.0% |
| $35,000 to $49,999 | 51 | 30.5% |
| $50,000 to $74,999 | 7 | 4.2% |
| $75,000 to $99,999 | 23 | 13.8% |
| $100,000 to $149,999 | 43 | 25.7% |
| $150,000 to $199,999 | 10 | 6.0% |
| $200,000+ | 10 | 6.0% |
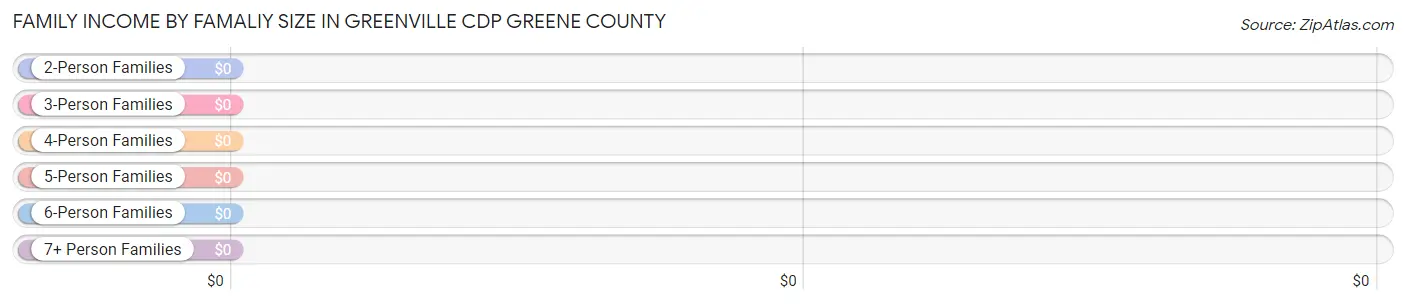
Family Income by Famaliy Size in Greenville CDP Greene County
| Income Bracket | # Families | Median Income |
| 2-Person Families | 147 (88.0%) | $0 |
| 3-Person Families | 5 (3.0%) | $0 |
| 4-Person Families | 14 (8.4%) | $0 |
| 5-Person Families | 1 (0.6%) | $0 |
| 6-Person Families | 0 (0.0%) | $0 |
| 7+ Person Families | 0 (0.0%) | $0 |
| Total | 167 (100.0%) | $96,250 |
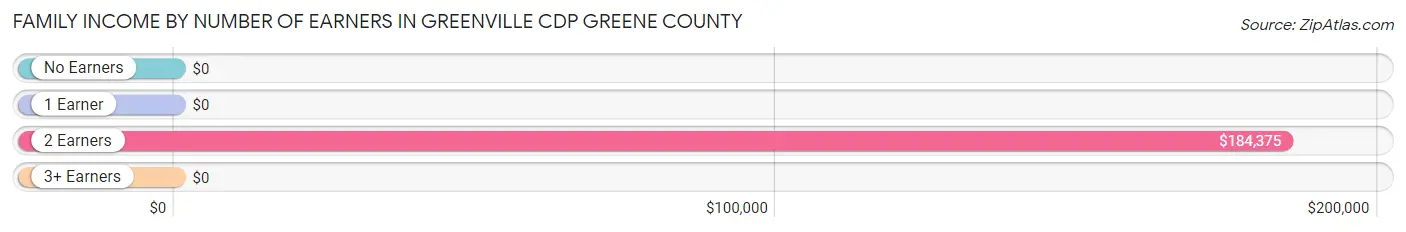
Family Income by Number of Earners in Greenville CDP Greene County
| Number of Earners | # Families | Median Income |
| No Earners | 47 (28.1%) | $0 |
| 1 Earner | 90 (53.9%) | $0 |
| 2 Earners | 25 (15.0%) | $184,375 |
| 3+ Earners | 5 (3.0%) | $0 |
| Total | 167 (100.0%) | $96,250 |
Household Income in Greenville CDP Greene County
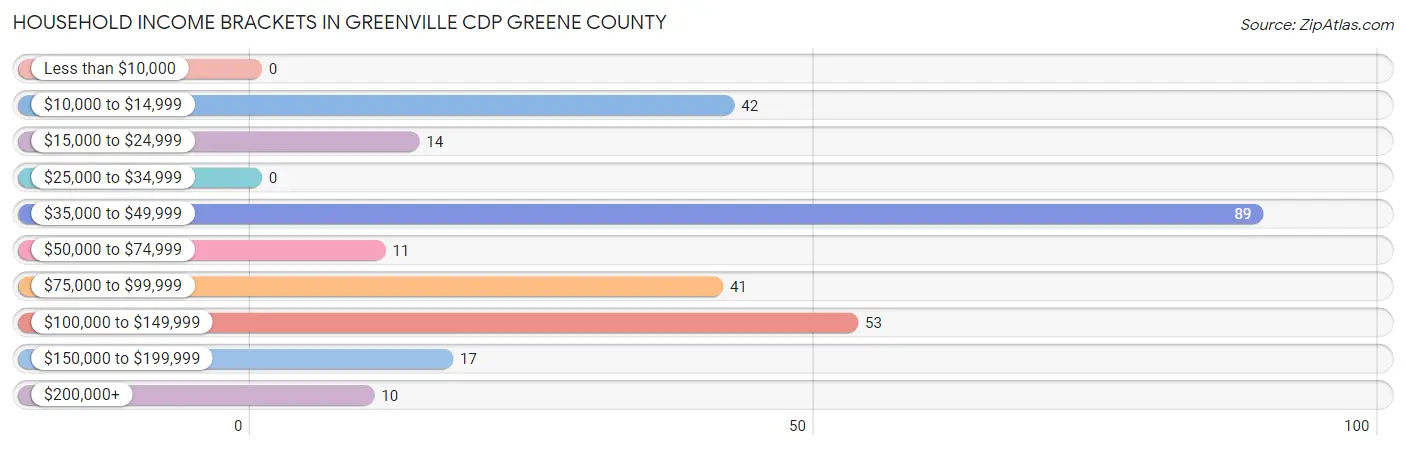
Household Income Brackets in Greenville CDP Greene County
With 89 households falling in the category, the $35,000 to $49,999 income range is the most frequent in Greenville CDP Greene County, accounting for 32.1% of all households.
| Income Bracket | # Households | % Households |
| Less than $10,000 | 0 | 0.0% |
| $10,000 to $14,999 | 42 | 15.2% |
| $15,000 to $24,999 | 14 | 5.1% |
| $25,000 to $34,999 | 0 | 0.0% |
| $35,000 to $49,999 | 89 | 32.1% |
| $50,000 to $74,999 | 11 | 4.0% |
| $75,000 to $99,999 | 41 | 14.8% |
| $100,000 to $149,999 | 53 | 19.1% |
| $150,000 to $199,999 | 17 | 6.1% |
| $200,000+ | 10 | 3.6% |
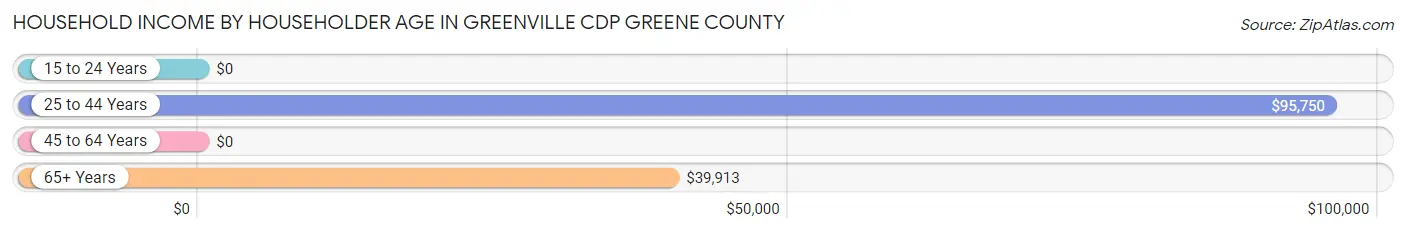
Household Income by Householder Age in Greenville CDP Greene County
The median household income in Greenville CDP Greene County is $0, with the highest median household income of $95,750 found in the 25 to 44 years age bracket for the primary householder. A total of 43 households (15.5%) fall into this category.
| Income Bracket | # Households | Median Income |
| 15 to 24 Years | 0 (0.0%) | $0 |
| 25 to 44 Years | 43 (15.5%) | $95,750 |
| 45 to 64 Years | 63 (22.7%) | $0 |
| 65+ Years | 171 (61.7%) | $39,913 |
| Total | 277 (100.0%) | $0 |
Poverty in Greenville CDP Greene County
Income Below Poverty by Sex and Age in Greenville CDP Greene County
With 15.5% poverty level for males and 10.3% for females among the residents of Greenville CDP Greene County, 16 and 17 year old males and 55 to 64 year old females are the most vulnerable to poverty, with 9 males (56.2%) and 23 females (76.7%) in their respective age groups living below the poverty level.
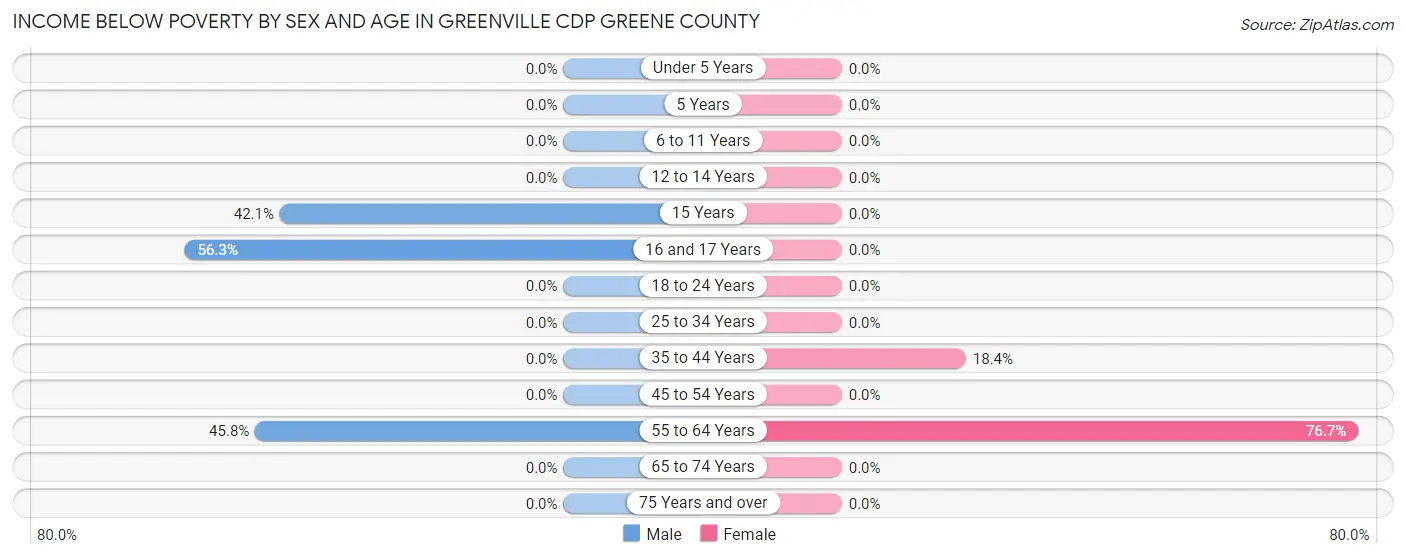
| Age Bracket | Male | Female |
| Under 5 Years | 0 (0.0%) | 0 (0.0%) |
| 5 Years | 0 (0.0%) | 0 (0.0%) |
| 6 to 11 Years | 0 (0.0%) | 0 (0.0%) |
| 12 to 14 Years | 0 (0.0%) | 0 (0.0%) |
| 15 Years | 8 (42.1%) | 0 (0.0%) |
| 16 and 17 Years | 9 (56.2%) | 0 (0.0%) |
| 18 to 24 Years | 0 (0.0%) | 0 (0.0%) |
| 25 to 34 Years | 0 (0.0%) | 0 (0.0%) |
| 35 to 44 Years | 0 (0.0%) | 7 (18.4%) |
| 45 to 54 Years | 0 (0.0%) | 0 (0.0%) |
| 55 to 64 Years | 27 (45.8%) | 23 (76.7%) |
| 65 to 74 Years | 0 (0.0%) | 0 (0.0%) |
| 75 Years and over | 0 (0.0%) | 0 (0.0%) |
| Total | 44 (15.5%) | 30 (10.3%) |
Income Above Poverty by Sex and Age in Greenville CDP Greene County
According to the poverty statistics in Greenville CDP Greene County, males aged under 5 years and females aged under 5 years are the age groups that are most secure financially, with 100.0% of males and 100.0% of females in these age groups living above the poverty line.
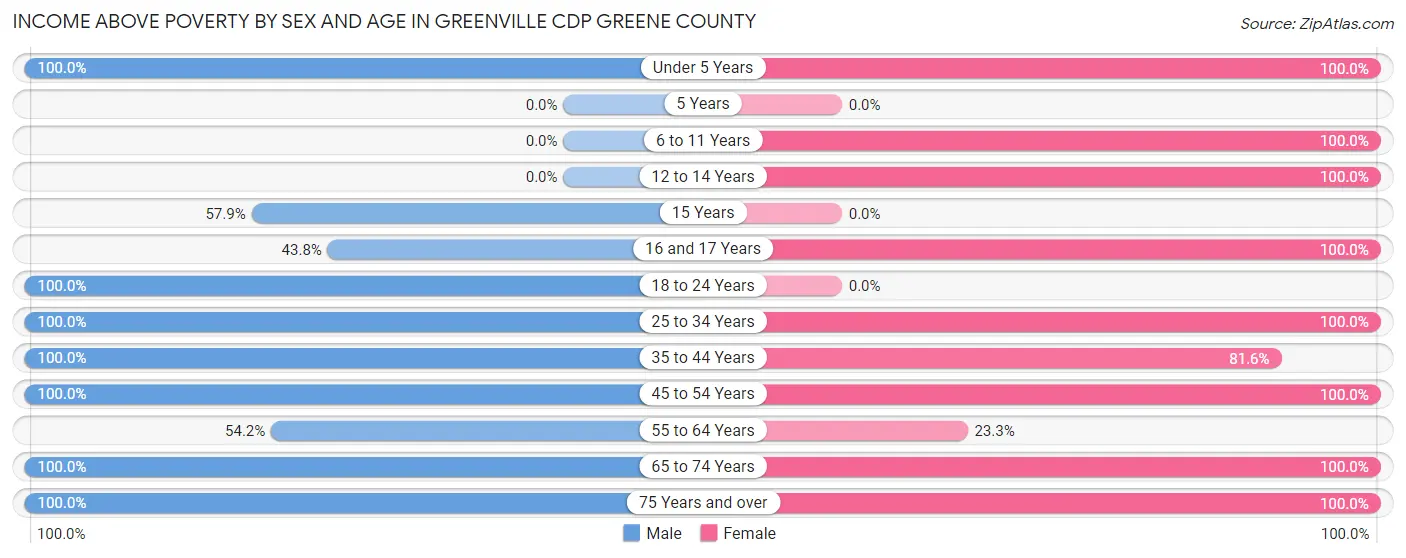
| Age Bracket | Male | Female |
| Under 5 Years | 15 (100.0%) | 7 (100.0%) |
| 5 Years | 0 (0.0%) | 0 (0.0%) |
| 6 to 11 Years | 0 (0.0%) | 8 (100.0%) |
| 12 to 14 Years | 0 (0.0%) | 8 (100.0%) |
| 15 Years | 11 (57.9%) | 0 (0.0%) |
| 16 and 17 Years | 7 (43.8%) | 9 (100.0%) |
| 18 to 24 Years | 9 (100.0%) | 0 (0.0%) |
| 25 to 34 Years | 10 (100.0%) | 22 (100.0%) |
| 35 to 44 Years | 7 (100.0%) | 31 (81.6%) |
| 45 to 54 Years | 42 (100.0%) | 32 (100.0%) |
| 55 to 64 Years | 32 (54.2%) | 7 (23.3%) |
| 65 to 74 Years | 51 (100.0%) | 76 (100.0%) |
| 75 Years and over | 55 (100.0%) | 61 (100.0%) |
| Total | 239 (84.5%) | 261 (89.7%) |
Income Below Poverty Among Married-Couple Families in Greenville CDP Greene County
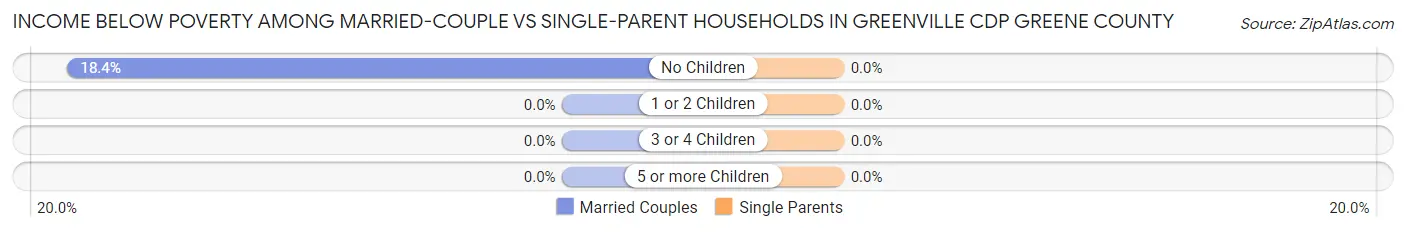
The poverty statistics for married-couple families in Greenville CDP Greene County show that 15.9% or 23 of the total 145 families live below the poverty line. Families with no children have the highest poverty rate of 18.4%, comprising of 23 families. On the other hand, families with 1 or 2 children have the lowest poverty rate of 0.0%, which includes 0 families.
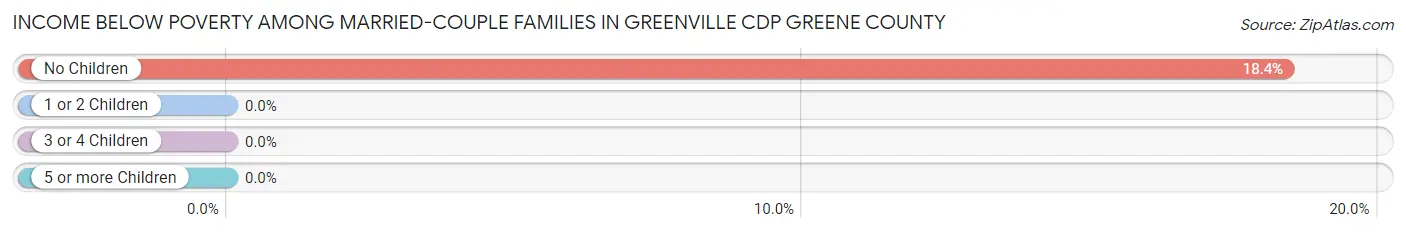
| Children | Above Poverty | Below Poverty |
| No Children | 102 (81.6%) | 23 (18.4%) |
| 1 or 2 Children | 19 (100.0%) | 0 (0.0%) |
| 3 or 4 Children | 1 (100.0%) | 0 (0.0%) |
| 5 or more Children | 0 (0.0%) | 0 (0.0%) |
| Total | 122 (84.1%) | 23 (15.9%) |
Income Below Poverty Among Single-Parent Households in Greenville CDP Greene County
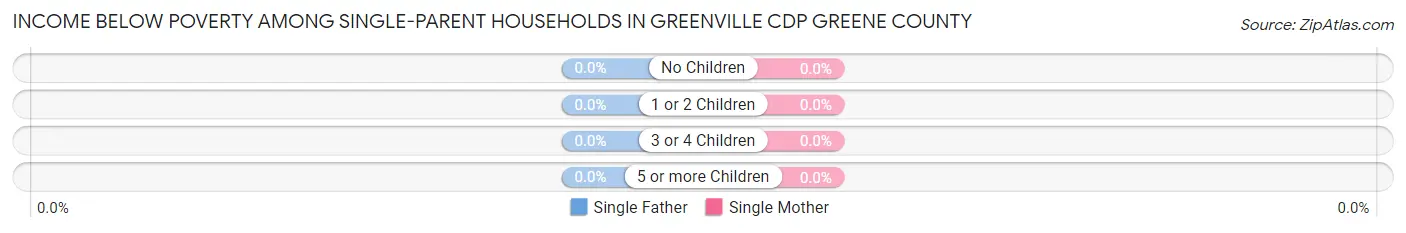
| Children | Single Father | Single Mother |
| No Children | 0 (0.0%) | 0 (0.0%) |
| 1 or 2 Children | 0 (0.0%) | 0 (0.0%) |
| 3 or 4 Children | 0 (0.0%) | 0 (0.0%) |
| 5 or more Children | 0 (0.0%) | 0 (0.0%) |
| Total | 0 (0.0%) | 0 (0.0%) |
Income Below Poverty Among Married-Couple vs Single-Parent Households in Greenville CDP Greene County
| Children | Married-Couple Families | Single-Parent Households |
| No Children | 23 (18.4%) | 0 (0.0%) |
| 1 or 2 Children | 0 (0.0%) | 0 (0.0%) |
| 3 or 4 Children | 0 (0.0%) | 0 (0.0%) |
| 5 or more Children | 0 (0.0%) | 0 (0.0%) |
| Total | 23 (15.9%) | 0 (0.0%) |
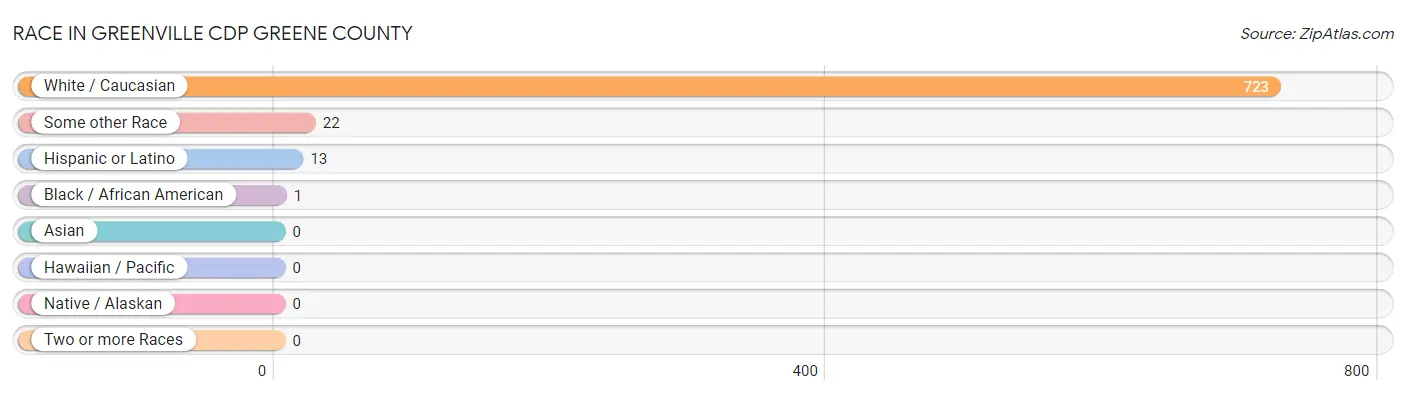
Race in Greenville CDP Greene County
The most populous races in Greenville CDP Greene County are White / Caucasian (723 | 96.9%), Some other Race (22 | 2.9%), and Hispanic or Latino (13 | 1.7%).
| Race | # Population | % Population |
| Asian | 0 | 0.0% |
| Black / African American | 1 | 0.1% |
| Hawaiian / Pacific | 0 | 0.0% |
| Hispanic or Latino | 13 | 1.7% |
| Native / Alaskan | 0 | 0.0% |
| White / Caucasian | 723 | 96.9% |
| Two or more Races | 0 | 0.0% |
| Some other Race | 22 | 2.9% |
| Total | 746 | 100.0% |
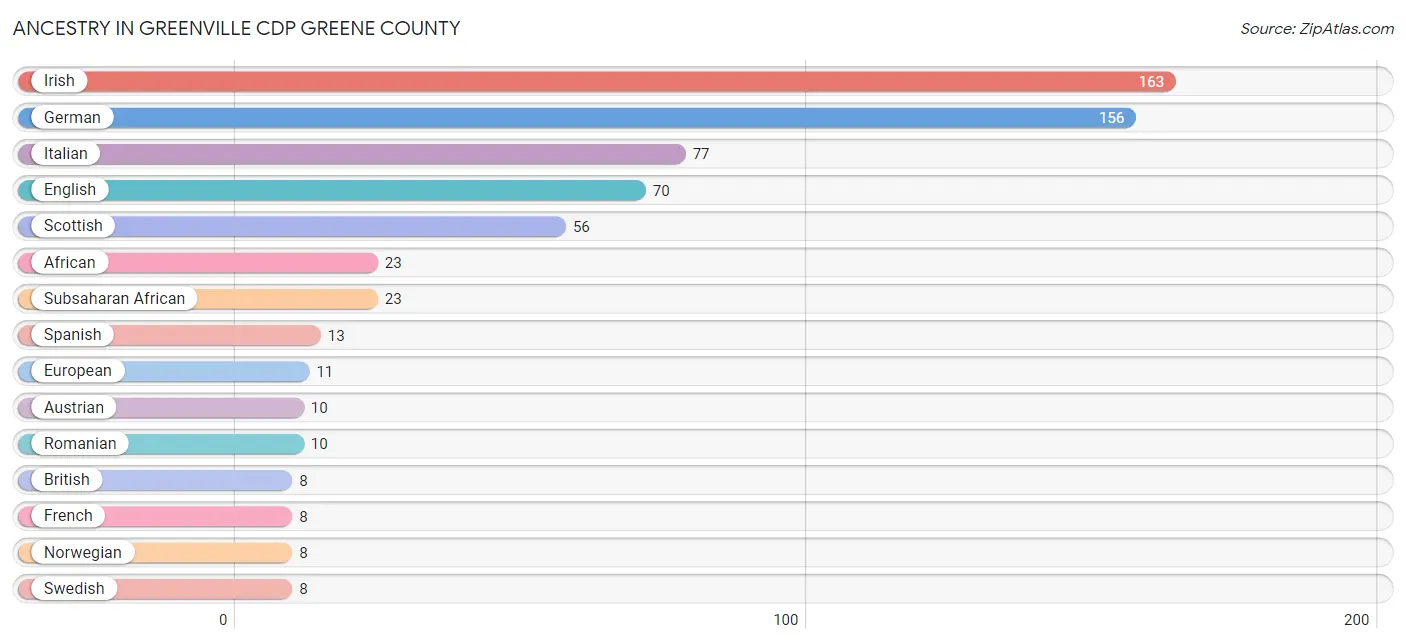
Ancestry in Greenville CDP Greene County
The most populous ancestries reported in Greenville CDP Greene County are Irish (163 | 21.8%), German (156 | 20.9%), Italian (77 | 10.3%), English (70 | 9.4%), and Scottish (56 | 7.5%), together accounting for 70.0% of all Greenville CDP Greene County residents.
| Ancestry | # Population | % Population |
| African | 23 | 3.1% |
| American | 7 | 0.9% |
| Austrian | 10 | 1.3% |
| British | 8 | 1.1% |
| English | 70 | 9.4% |
| European | 11 | 1.5% |
| French | 8 | 1.1% |
| German | 156 | 20.9% |
| Irish | 163 | 21.8% |
| Italian | 77 | 10.3% |
| Norwegian | 8 | 1.1% |
| Polish | 4 | 0.5% |
| Romanian | 10 | 1.3% |
| Scottish | 56 | 7.5% |
| Spanish | 13 | 1.7% |
| Subsaharan African | 23 | 3.1% |
| Swedish | 8 | 1.1% | View All 17 Rows |
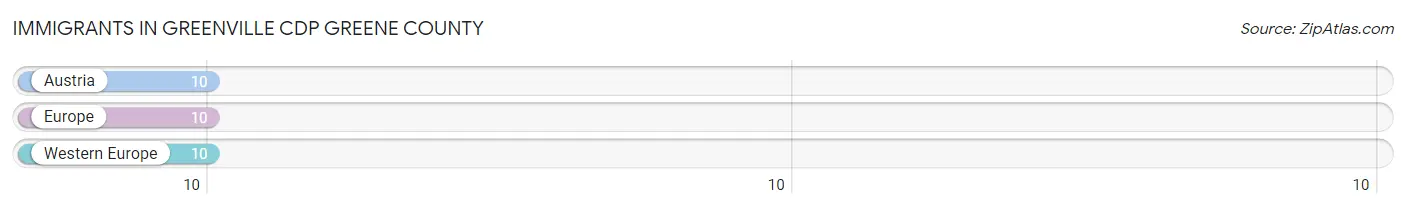
Immigrants in Greenville CDP Greene County
The most numerous immigrant groups reported in Greenville CDP Greene County came from Austria (10 | 1.3%), Europe (10 | 1.3%), and Western Europe (10 | 1.3%), together accounting for 4.0% of all Greenville CDP Greene County residents.
| Immigration Origin | # Population | % Population |
| Austria | 10 | 1.3% |
| Europe | 10 | 1.3% |
| Western Europe | 10 | 1.3% | View All 3 Rows |
Sex and Age in Greenville CDP Greene County
Sex and Age in Greenville CDP Greene County
The most populous age groups in Greenville CDP Greene County are 10 to 14 Years (100 | 24.5%) for men and 10 to 14 Years (55 | 16.3%) for women.
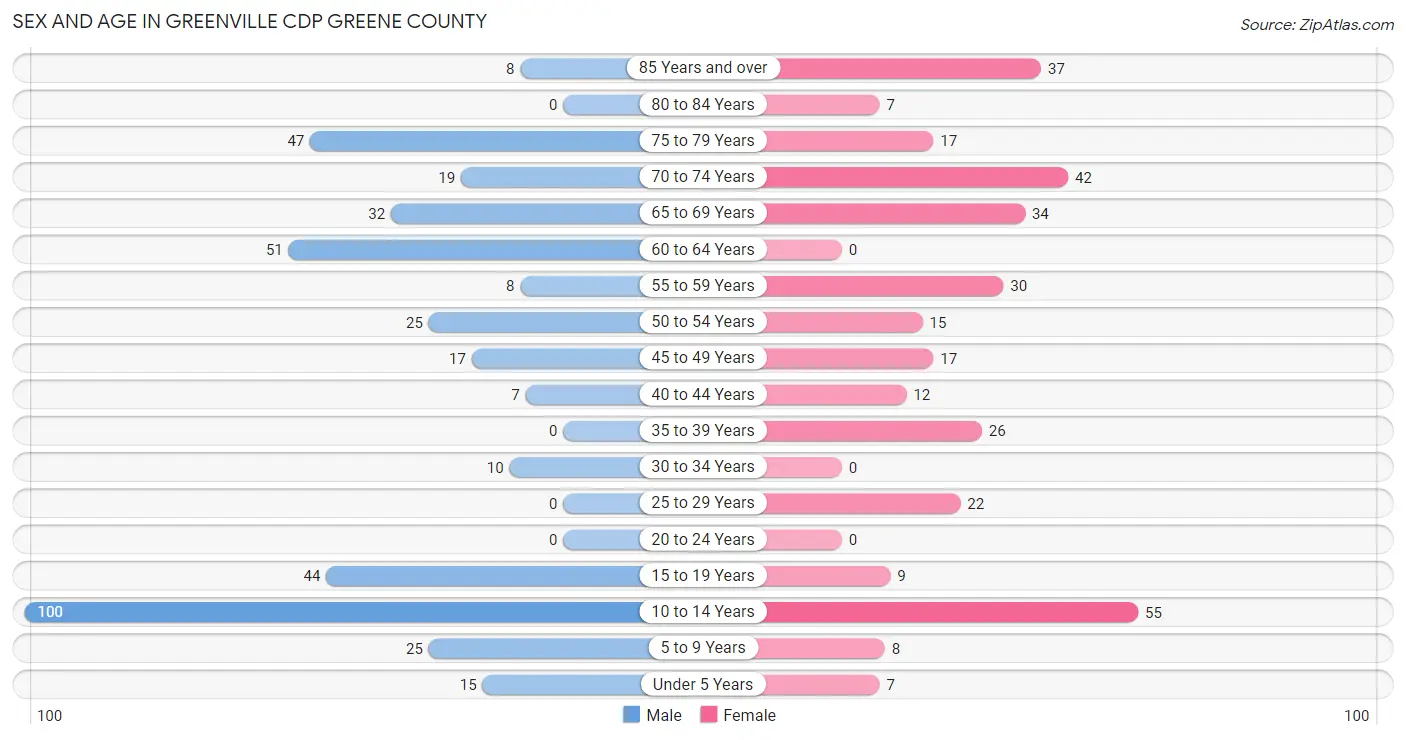
| Age Bracket | Male | Female |
| Under 5 Years | 15 (3.7%) | 7 (2.1%) |
| 5 to 9 Years | 25 (6.1%) | 8 (2.4%) |
| 10 to 14 Years | 100 (24.5%) | 55 (16.3%) |
| 15 to 19 Years | 44 (10.8%) | 9 (2.7%) |
| 20 to 24 Years | 0 (0.0%) | 0 (0.0%) |
| 25 to 29 Years | 0 (0.0%) | 22 (6.5%) |
| 30 to 34 Years | 10 (2.5%) | 0 (0.0%) |
| 35 to 39 Years | 0 (0.0%) | 26 (7.7%) |
| 40 to 44 Years | 7 (1.7%) | 12 (3.5%) |
| 45 to 49 Years | 17 (4.2%) | 17 (5.0%) |
| 50 to 54 Years | 25 (6.1%) | 15 (4.4%) |
| 55 to 59 Years | 8 (2.0%) | 30 (8.9%) |
| 60 to 64 Years | 51 (12.5%) | 0 (0.0%) |
| 65 to 69 Years | 32 (7.8%) | 34 (10.1%) |
| 70 to 74 Years | 19 (4.7%) | 42 (12.4%) |
| 75 to 79 Years | 47 (11.5%) | 17 (5.0%) |
| 80 to 84 Years | 0 (0.0%) | 7 (2.1%) |
| 85 Years and over | 8 (2.0%) | 37 (11.0%) |
| Total | 408 (100.0%) | 338 (100.0%) |
Families and Households in Greenville CDP Greene County
Median Family Size in Greenville CDP Greene County
The median family size in Greenville CDP Greene County is 2.46 persons per family, with single female/mother families (15 | 9.0%) accounting for the largest median family size of 2.6 persons per family. On the other hand, single male/father families (7 | 4.2%) represent the smallest median family size with 2.14 persons per family.
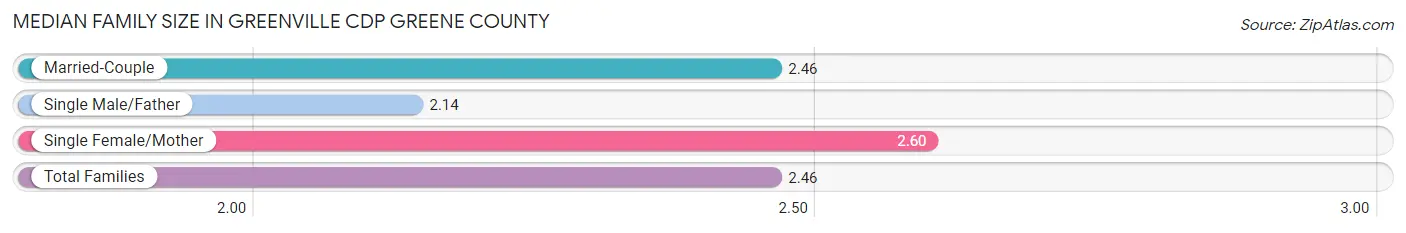
| Family Type | # Families | Family Size |
| Married-Couple | 145 (86.8%) | 2.46 |
| Single Male/Father | 7 (4.2%) | 2.14 |
| Single Female/Mother | 15 (9.0%) | 2.60 |
| Total Families | 167 (100.0%) | 2.46 |
Median Household Size in Greenville CDP Greene County
The median household size in Greenville CDP Greene County is 2.69 persons per household, with single male/father households (7 | 2.5%) accounting for the largest median household size of 5.71 persons per household. non-family households (110 | 39.7%) represent the smallest median household size with 1.26 persons per household.
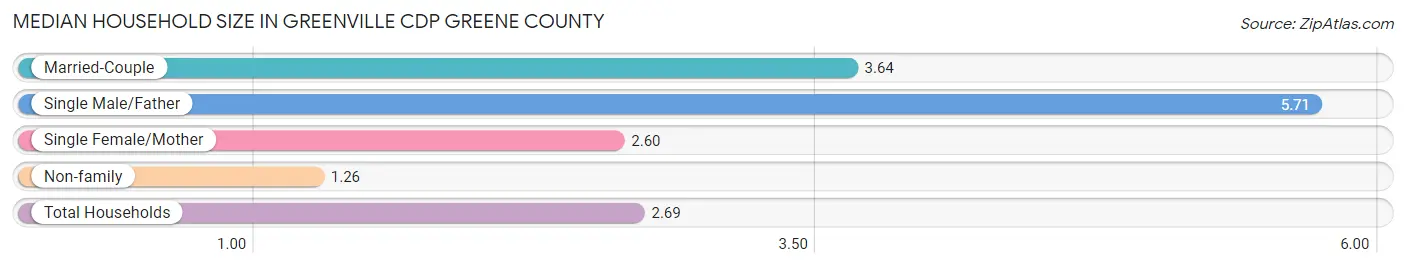
| Household Type | # Households | Household Size |
| Married-Couple | 145 (52.3%) | 3.64 |
| Single Male/Father | 7 (2.5%) | 5.71 |
| Single Female/Mother | 15 (5.4%) | 2.60 |
| Non-family | 110 (39.7%) | 1.26 |
| Total Households | 277 (100.0%) | 2.69 |
Household Size by Marriage Status in Greenville CDP Greene County
Out of a total of 277 households in Greenville CDP Greene County, 167 (60.3%) are family households, while 110 (39.7%) are nonfamily households. The most numerous type of family households are 2-person households, comprising 117, and the most common type of nonfamily households are 1-person households, comprising 93.
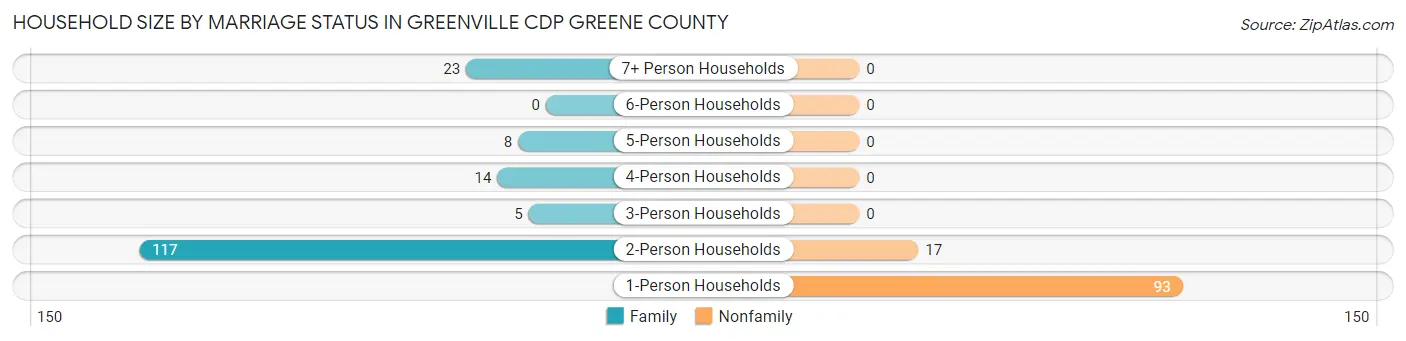
| Household Size | Family Households | Nonfamily Households |
| 1-Person Households | - | 93 (33.6%) |
| 2-Person Households | 117 (42.2%) | 17 (6.1%) |
| 3-Person Households | 5 (1.8%) | 0 (0.0%) |
| 4-Person Households | 14 (5.1%) | 0 (0.0%) |
| 5-Person Households | 8 (2.9%) | 0 (0.0%) |
| 6-Person Households | 0 (0.0%) | 0 (0.0%) |
| 7+ Person Households | 23 (8.3%) | 0 (0.0%) |
| Total | 167 (60.3%) | 110 (39.7%) |
Female Fertility in Greenville CDP Greene County
Fertility by Age in Greenville CDP Greene County
Average fertility rate in Greenville CDP Greene County is 52.0 births per 1,000 women. Women in the age bracket of 35 to 50 years have the highest fertility rate with 77.0 births per 1,000 women. Women in the age bracket of 35 to 50 years acount for 100.0% of all women with births.
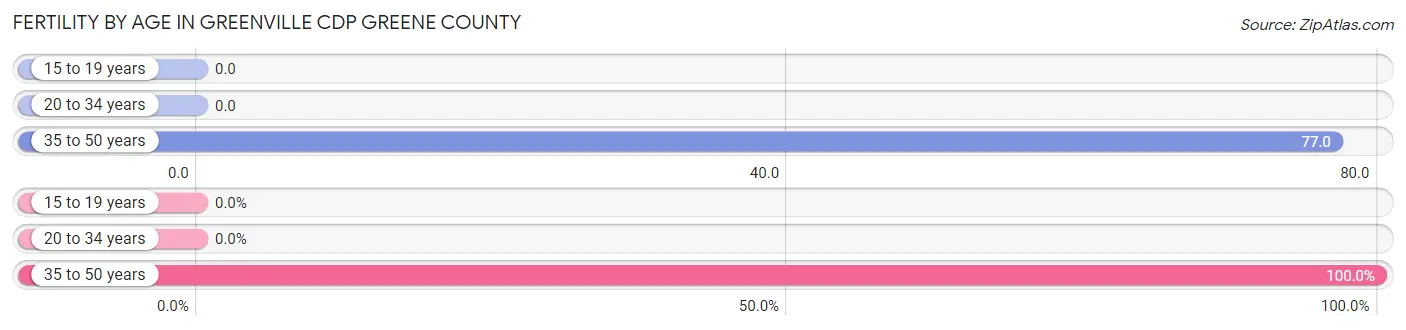
| Age Bracket | Women with Births | Births / 1,000 Women |
| 15 to 19 years | 0 (0.0%) | 0.0 |
| 20 to 34 years | 0 (0.0%) | 0.0 |
| 35 to 50 years | 5 (100.0%) | 77.0 |
| Total | 5 (100.0%) | 52.0 |
Fertility by Age by Marriage Status in Greenville CDP Greene County
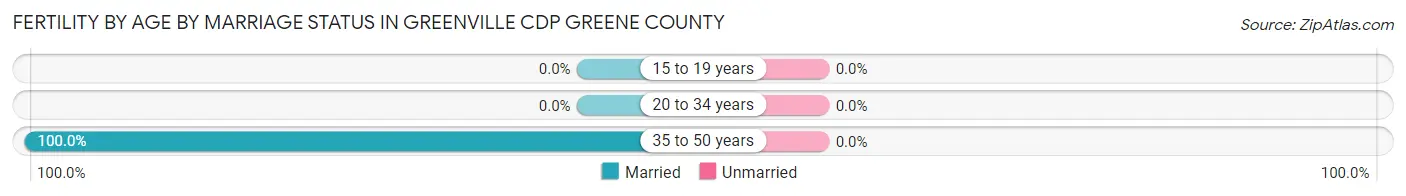
| Age Bracket | Married | Unmarried |
| 15 to 19 years | 0 (0.0%) | 0 (0.0%) |
| 20 to 34 years | 0 (0.0%) | 0 (0.0%) |
| 35 to 50 years | 5 (100.0%) | 0 (0.0%) |
| Total | 5 (100.0%) | 0 (0.0%) |
Fertility by Education in Greenville CDP Greene County
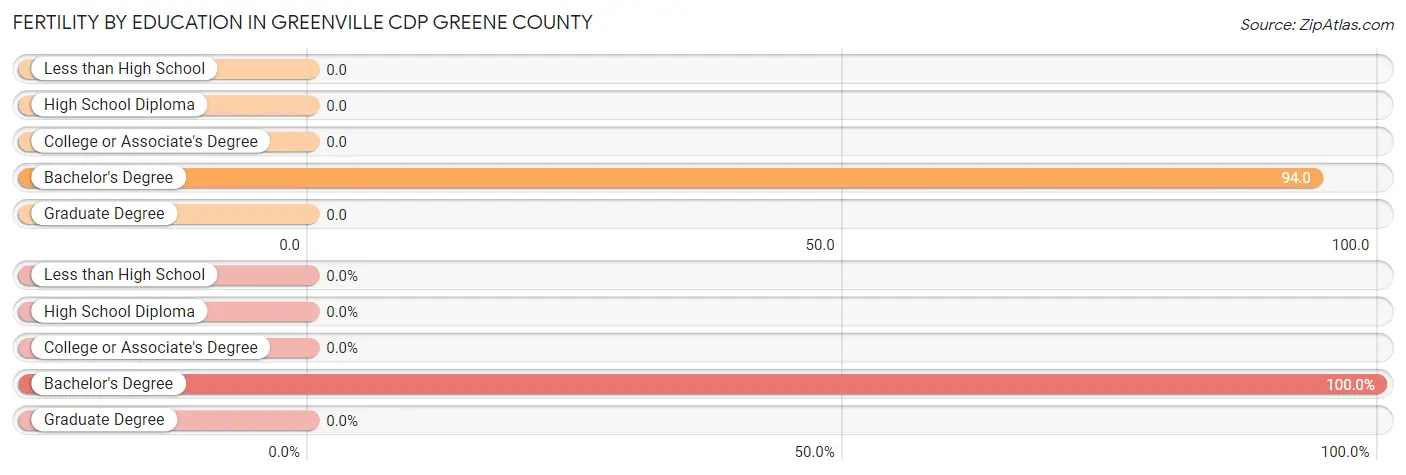
| Educational Attainment | Women with Births | Births / 1,000 Women |
| Less than High School | 0 (0.0%) | 0.0 |
| High School Diploma | 0 (0.0%) | 0.0 |
| College or Associate's Degree | 0 (0.0%) | 0.0 |
| Bachelor's Degree | 5 (100.0%) | 94.0 |
| Graduate Degree | 0 (0.0%) | 0.0 |
| Total | 5 (100.0%) | 52.0 |
Fertility by Education by Marriage Status in Greenville CDP Greene County
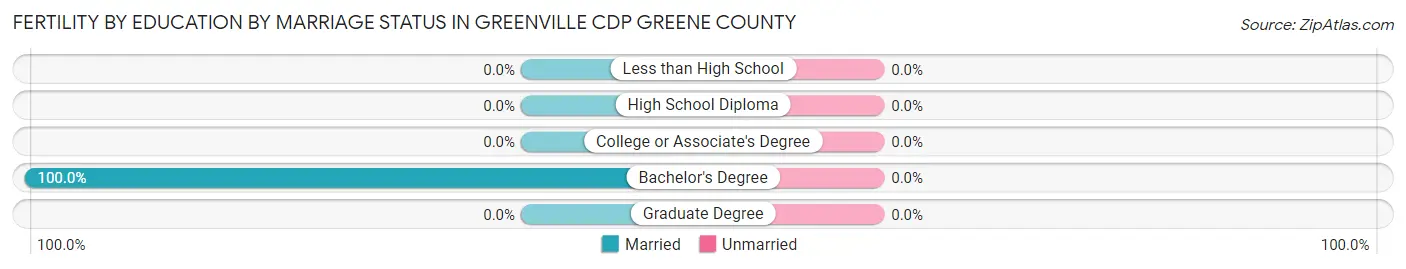
| Educational Attainment | Married | Unmarried |
| Less than High School | 0 (0.0%) | 0 (0.0%) |
| High School Diploma | 0 (0.0%) | 0 (0.0%) |
| College or Associate's Degree | 0 (0.0%) | 0 (0.0%) |
| Bachelor's Degree | 5 (100.0%) | 0 (0.0%) |
| Graduate Degree | 0 (0.0%) | 0 (0.0%) |
| Total | 5 (100.0%) | 0 (0.0%) |
Employment Characteristics in Greenville CDP Greene County
Employment by Class of Employer in Greenville CDP Greene County
Among the 245 employed individuals in Greenville CDP Greene County, private company employees (149 | 60.8%), self-employed (not incorporated) (36 | 14.7%), and local government employees (19 | 7.8%) make up the most common classes of employment.
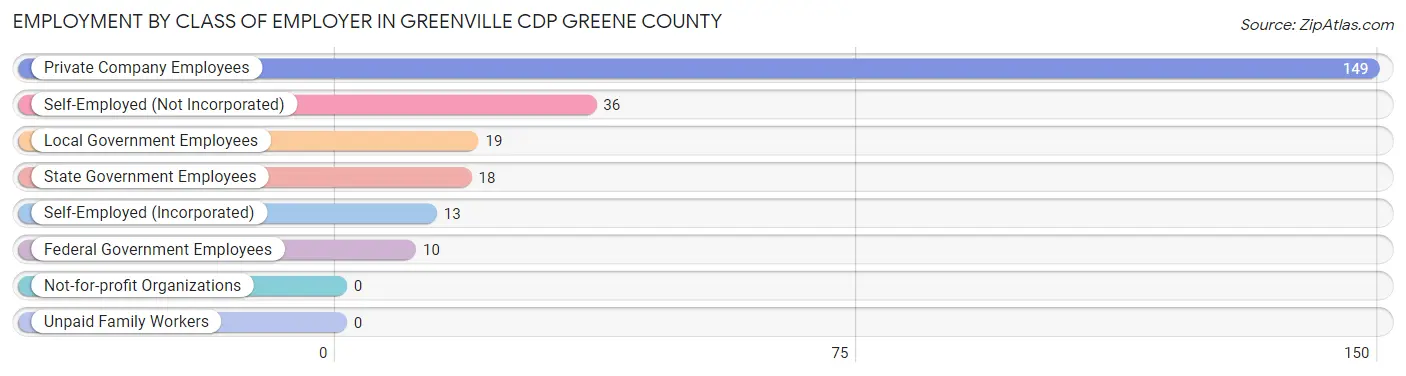
| Employer Class | # Employees | % Employees |
| Private Company Employees | 149 | 60.8% |
| Self-Employed (Incorporated) | 13 | 5.3% |
| Self-Employed (Not Incorporated) | 36 | 14.7% |
| Not-for-profit Organizations | 0 | 0.0% |
| Local Government Employees | 19 | 7.8% |
| State Government Employees | 18 | 7.3% |
| Federal Government Employees | 10 | 4.1% |
| Unpaid Family Workers | 0 | 0.0% |
| Total | 245 | 100.0% |
Employment Status by Age in Greenville CDP Greene County
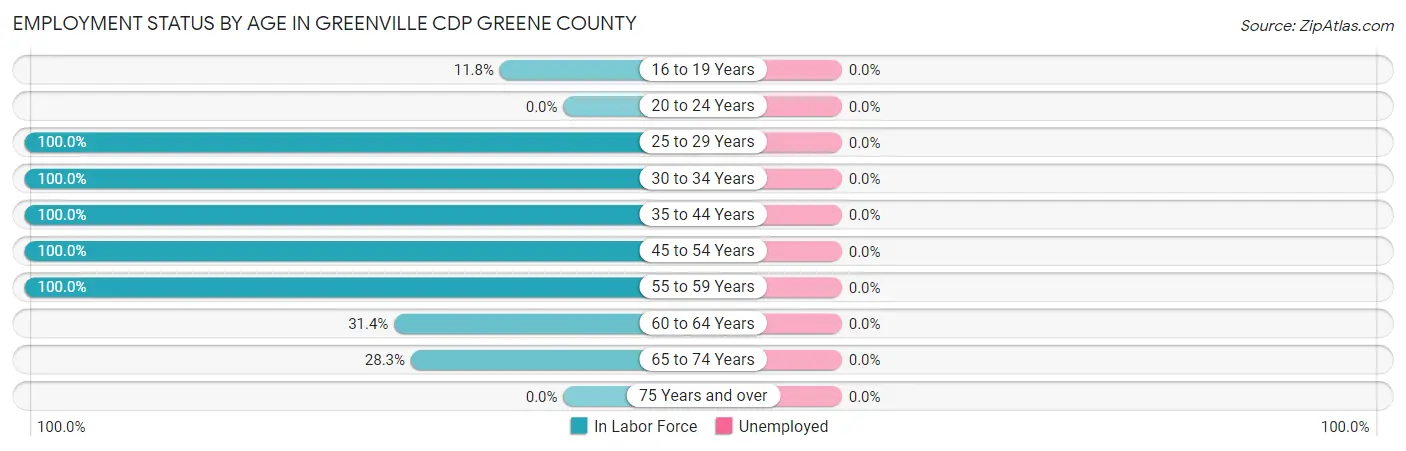
| Age Bracket | In Labor Force | Unemployed |
| 16 to 19 Years | 4 (11.8%) | 0 (0.0%) |
| 20 to 24 Years | 0 (0.0%) | 0 (0.0%) |
| 25 to 29 Years | 22 (100.0%) | 0 (0.0%) |
| 30 to 34 Years | 10 (100.0%) | 0 (0.0%) |
| 35 to 44 Years | 45 (100.0%) | 0 (0.0%) |
| 45 to 54 Years | 74 (100.0%) | 0 (0.0%) |
| 55 to 59 Years | 38 (100.0%) | 0 (0.0%) |
| 60 to 64 Years | 16 (31.4%) | 0 (0.0%) |
| 65 to 74 Years | 36 (28.3%) | 0 (0.0%) |
| 75 Years and over | 0 (0.0%) | 0 (0.0%) |
| Total | 245 (47.4%) | 0 (0.0%) |
Employment Status by Educational Attainment in Greenville CDP Greene County
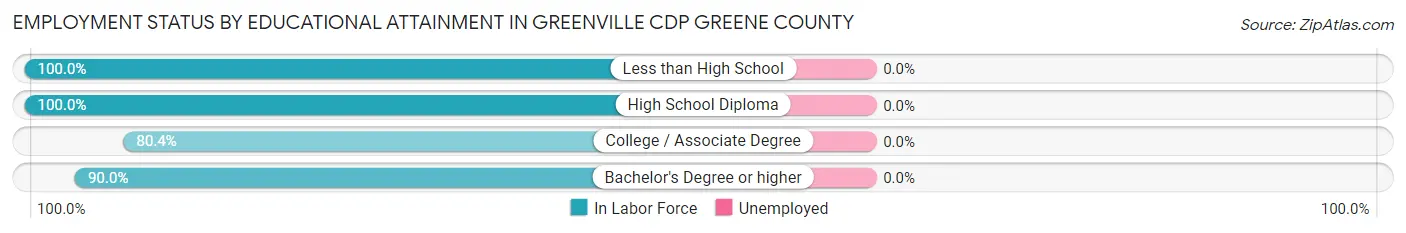
| Educational Attainment | In Labor Force | Unemployed |
| Less than High School | 13 (100.0%) | 0 (0.0%) |
| High School Diploma | 9 (100.0%) | 0 (0.0%) |
| College / Associate Degree | 111 (80.4%) | 0 (0.0%) |
| Bachelor's Degree or higher | 72 (90.0%) | 0 (0.0%) |
| Total | 205 (85.4%) | 0 (0.0%) |
Employment Occupations by Sex in Greenville CDP Greene County
Management, Business, Science and Arts Occupations
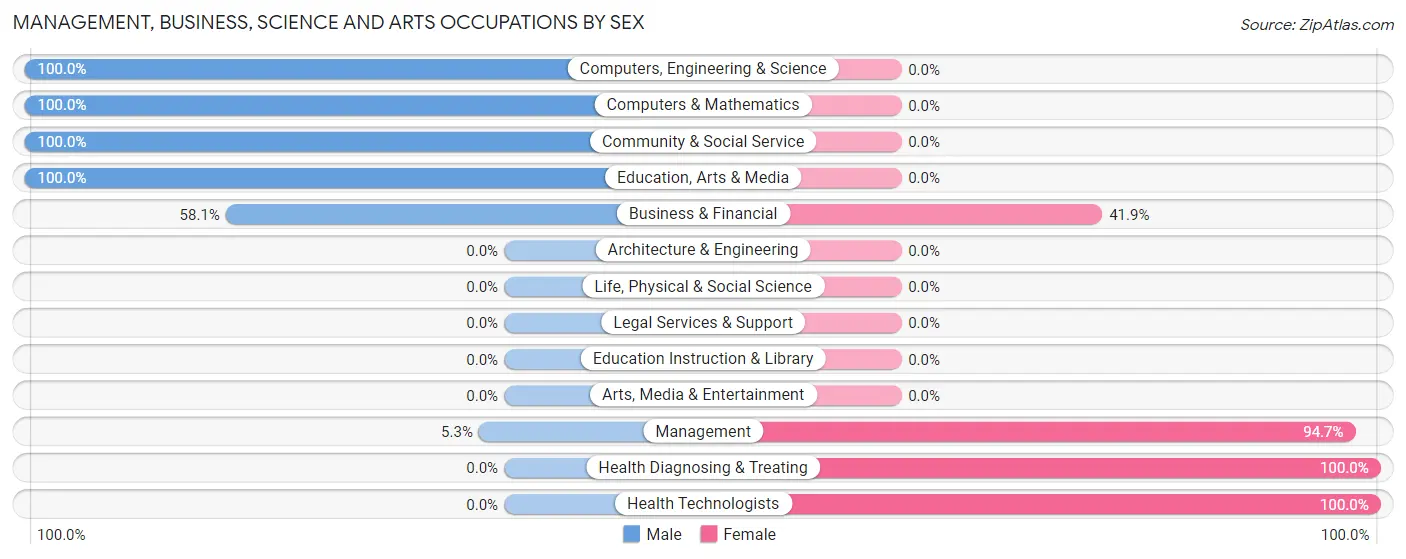
The most common Management, Business, Science and Arts occupations in Greenville CDP Greene County are Business & Financial (31 | 12.7%), Management (19 | 7.8%), Health Diagnosing & Treating (18 | 7.3%), Community & Social Service (10 | 4.1%), and Education, Arts & Media (10 | 4.1%).
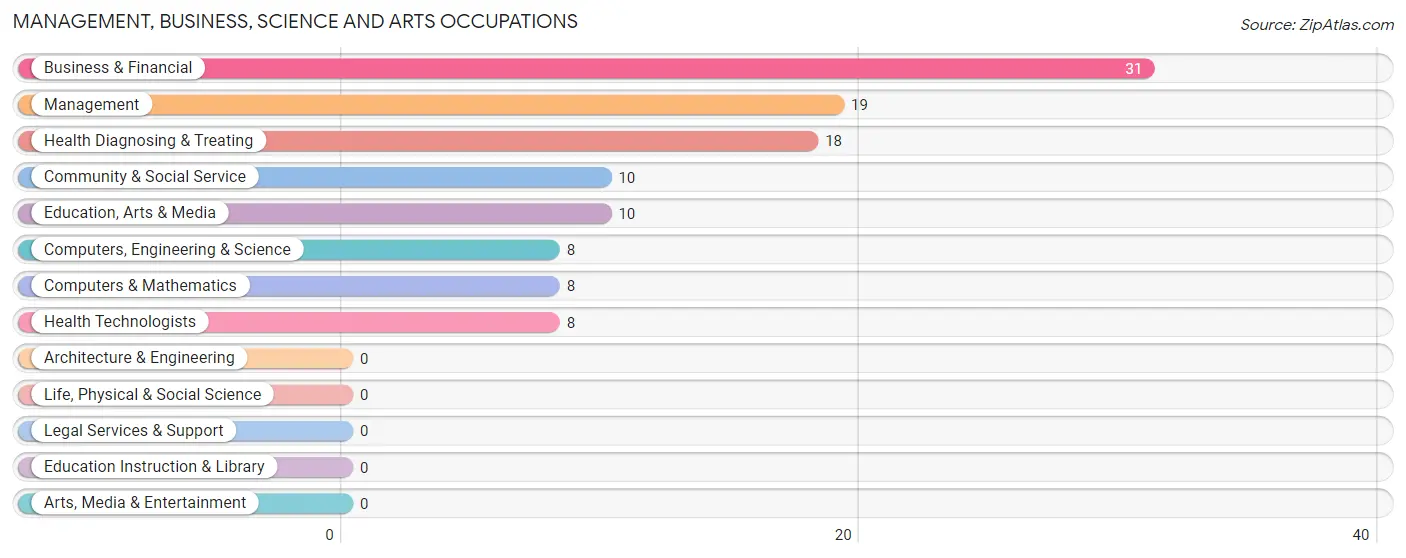
Management, Business, Science and Arts Occupations by Sex
Within the Management, Business, Science and Arts occupations in Greenville CDP Greene County, the most male-oriented occupations are Computers, Engineering & Science (100.0%), Computers & Mathematics (100.0%), and Community & Social Service (100.0%), while the most female-oriented occupations are Health Diagnosing & Treating (100.0%), Health Technologists (100.0%), and Management (94.7%).
| Occupation | Male | Female |
| Management | 1 (5.3%) | 18 (94.7%) |
| Business & Financial | 18 (58.1%) | 13 (41.9%) |
| Computers, Engineering & Science | 8 (100.0%) | 0 (0.0%) |
| Computers & Mathematics | 8 (100.0%) | 0 (0.0%) |
| Architecture & Engineering | 0 (0.0%) | 0 (0.0%) |
| Life, Physical & Social Science | 0 (0.0%) | 0 (0.0%) |
| Community & Social Service | 10 (100.0%) | 0 (0.0%) |
| Education, Arts & Media | 10 (100.0%) | 0 (0.0%) |
| Legal Services & Support | 0 (0.0%) | 0 (0.0%) |
| Education Instruction & Library | 0 (0.0%) | 0 (0.0%) |
| Arts, Media & Entertainment | 0 (0.0%) | 0 (0.0%) |
| Health Diagnosing & Treating | 0 (0.0%) | 18 (100.0%) |
| Health Technologists | 0 (0.0%) | 8 (100.0%) |
| Total (Category) | 37 (43.0%) | 49 (57.0%) |
| Total (Overall) | 104 (42.4%) | 141 (57.6%) |
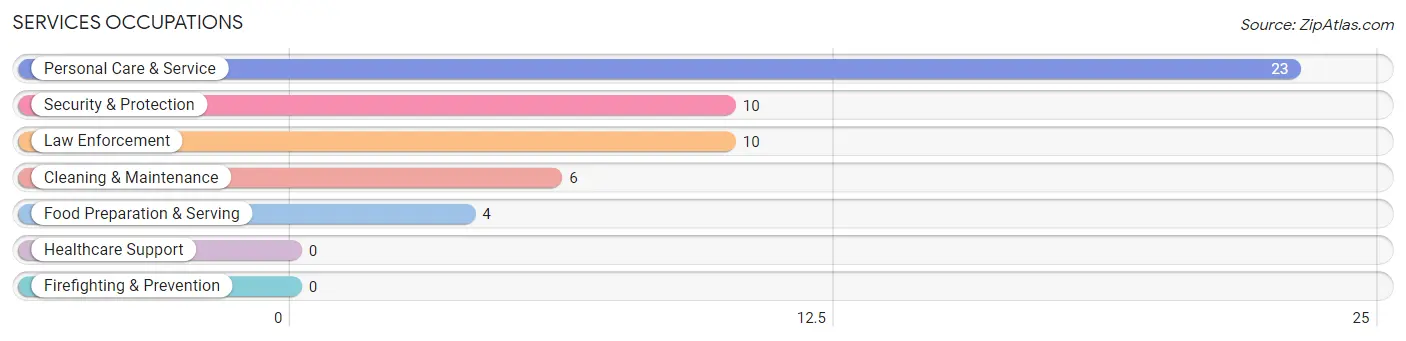
Services Occupations
The most common Services occupations in Greenville CDP Greene County are Personal Care & Service (23 | 9.4%), Security & Protection (10 | 4.1%), Law Enforcement (10 | 4.1%), Cleaning & Maintenance (6 | 2.5%), and Food Preparation & Serving (4 | 1.6%).
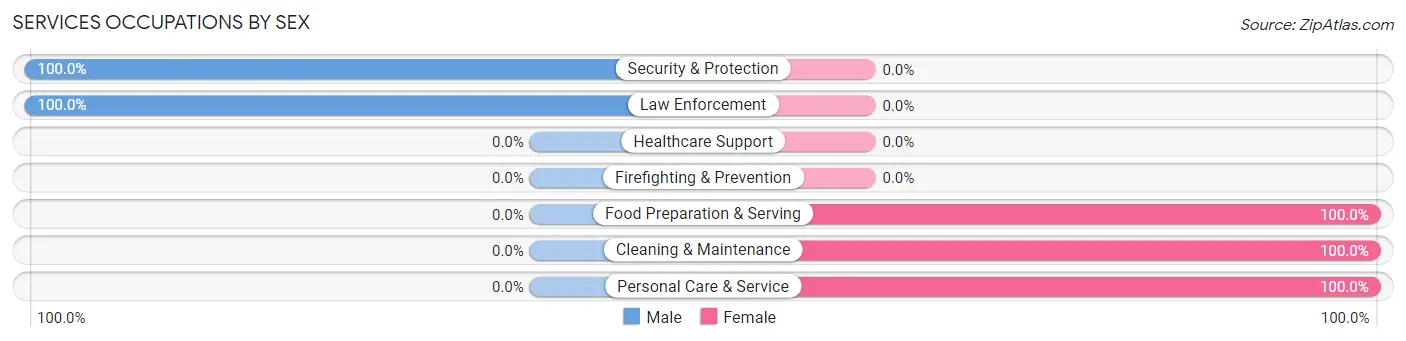
Services Occupations by Sex
Within the Services occupations in Greenville CDP Greene County, the most male-oriented occupations are Security & Protection (100.0%), and Law Enforcement (100.0%), while the most female-oriented occupations are Food Preparation & Serving (100.0%), Cleaning & Maintenance (100.0%), and Personal Care & Service (100.0%).
| Occupation | Male | Female |
| Healthcare Support | 0 (0.0%) | 0 (0.0%) |
| Security & Protection | 10 (100.0%) | 0 (0.0%) |
| Firefighting & Prevention | 0 (0.0%) | 0 (0.0%) |
| Law Enforcement | 10 (100.0%) | 0 (0.0%) |
| Food Preparation & Serving | 0 (0.0%) | 4 (100.0%) |
| Cleaning & Maintenance | 0 (0.0%) | 6 (100.0%) |
| Personal Care & Service | 0 (0.0%) | 23 (100.0%) |
| Total (Category) | 10 (23.3%) | 33 (76.7%) |
| Total (Overall) | 104 (42.4%) | 141 (57.6%) |
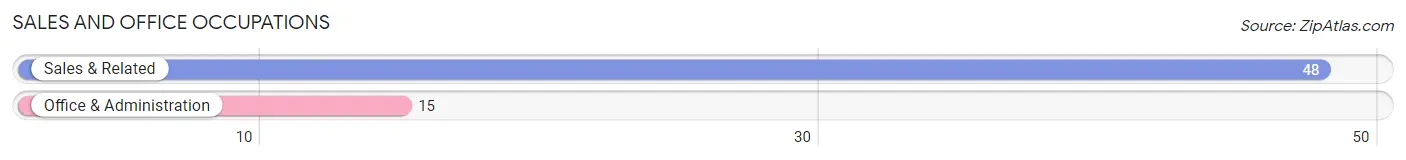
Sales and Office Occupations
The most common Sales and Office occupations in Greenville CDP Greene County are Sales & Related (48 | 19.6%), and Office & Administration (15 | 6.1%).
Sales and Office Occupations by Sex
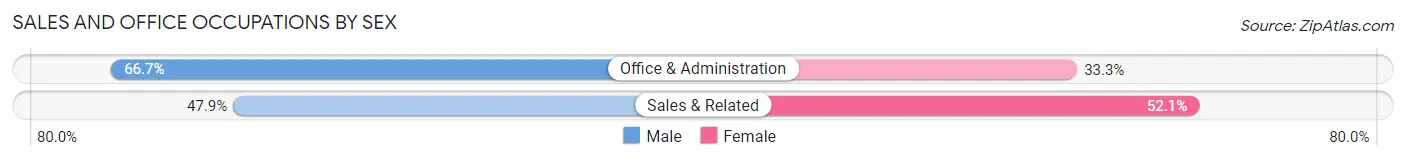
| Occupation | Male | Female |
| Sales & Related | 23 (47.9%) | 25 (52.1%) |
| Office & Administration | 10 (66.7%) | 5 (33.3%) |
| Total (Category) | 33 (52.4%) | 30 (47.6%) |
| Total (Overall) | 104 (42.4%) | 141 (57.6%) |
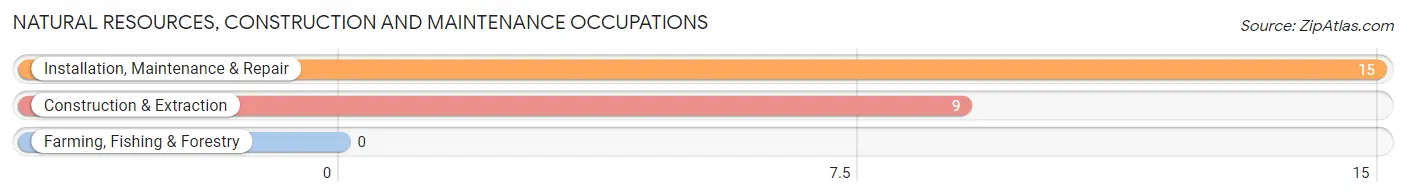
Natural Resources, Construction and Maintenance Occupations
The most common Natural Resources, Construction and Maintenance occupations in Greenville CDP Greene County are Installation, Maintenance & Repair (15 | 6.1%), and Construction & Extraction (9 | 3.7%).
Natural Resources, Construction and Maintenance Occupations by Sex
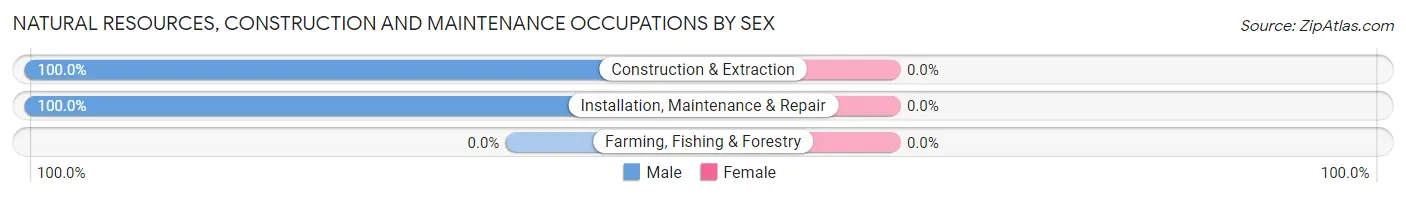
| Occupation | Male | Female |
| Farming, Fishing & Forestry | 0 (0.0%) | 0 (0.0%) |
| Construction & Extraction | 9 (100.0%) | 0 (0.0%) |
| Installation, Maintenance & Repair | 15 (100.0%) | 0 (0.0%) |
| Total (Category) | 24 (100.0%) | 0 (0.0%) |
| Total (Overall) | 104 (42.4%) | 141 (57.6%) |
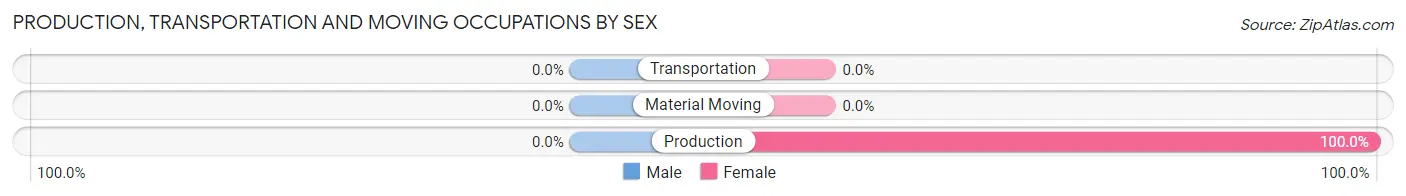
Production, Transportation and Moving Occupations
The most common Production, Transportation and Moving occupations in Greenville CDP Greene County are , and Production (29 | 11.8%).
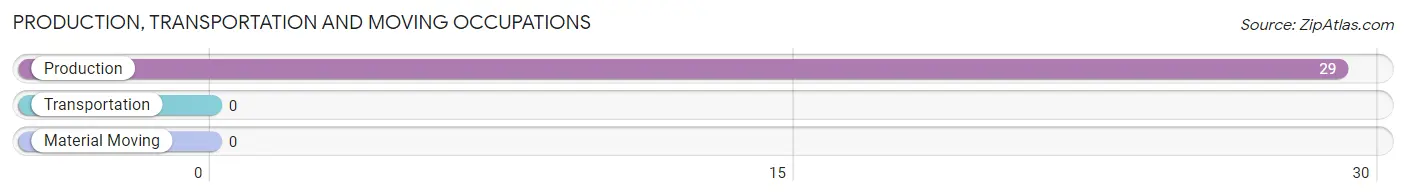
Production, Transportation and Moving Occupations by Sex
| Occupation | Male | Female |
| Production | 0 (0.0%) | 29 (100.0%) |
| Transportation | 0 (0.0%) | 0 (0.0%) |
| Material Moving | 0 (0.0%) | 0 (0.0%) |
| Total (Category) | 0 (0.0%) | 29 (100.0%) |
| Total (Overall) | 104 (42.4%) | 141 (57.6%) |
Employment Industries by Sex in Greenville CDP Greene County
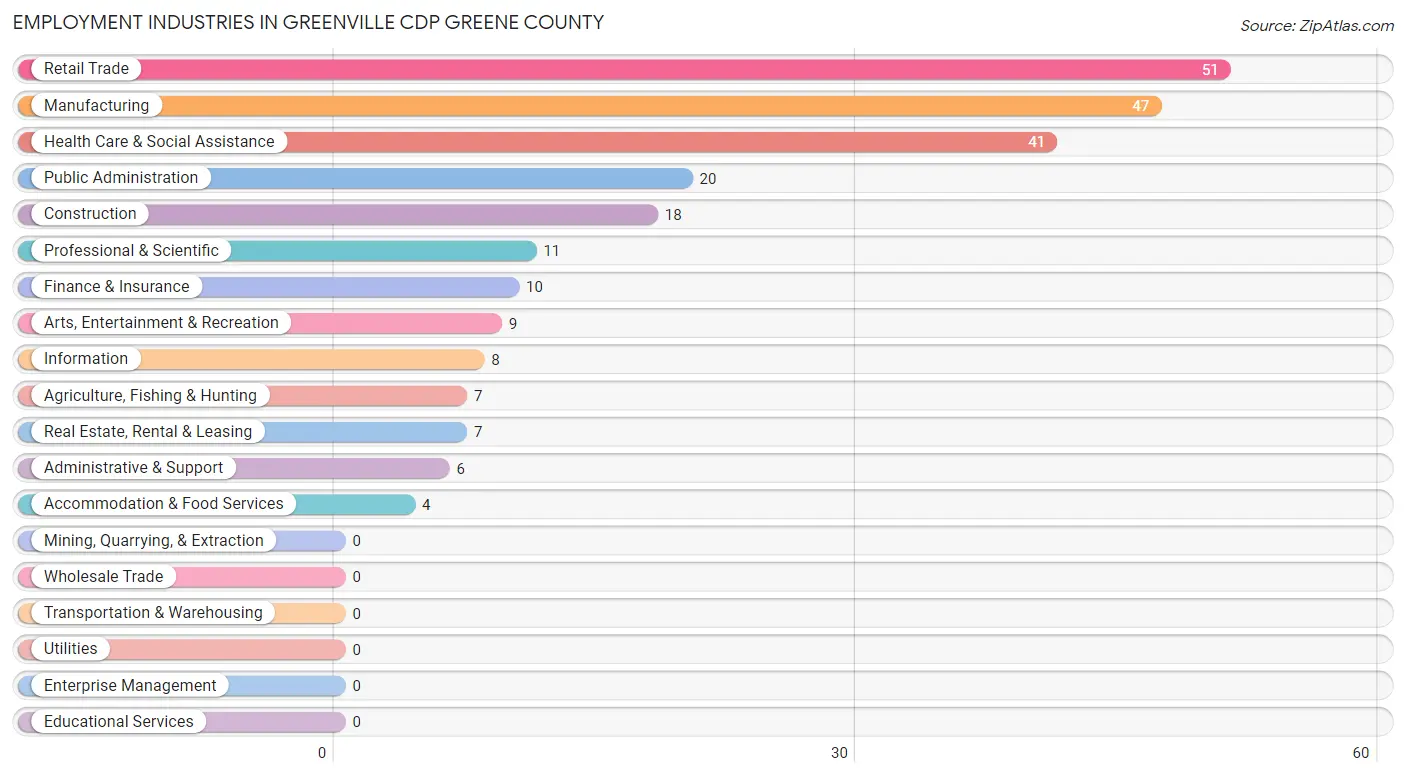
Employment Industries in Greenville CDP Greene County
The major employment industries in Greenville CDP Greene County include Retail Trade (51 | 20.8%), Manufacturing (47 | 19.2%), Health Care & Social Assistance (41 | 16.7%), Public Administration (20 | 8.2%), and Construction (18 | 7.3%).
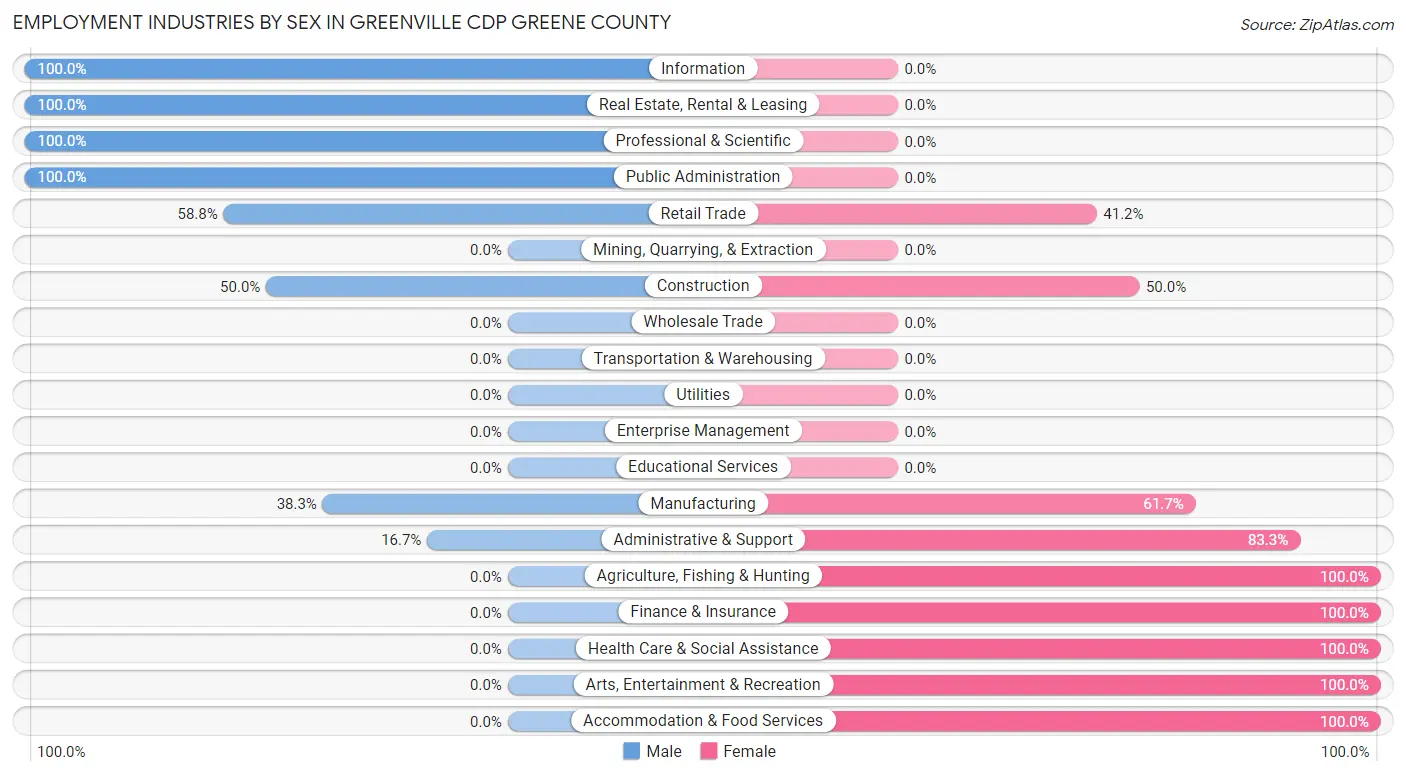
Employment Industries by Sex in Greenville CDP Greene County
The Greenville CDP Greene County industries that see more men than women are Information (100.0%), Real Estate, Rental & Leasing (100.0%), and Professional & Scientific (100.0%), whereas the industries that tend to have a higher number of women are Agriculture, Fishing & Hunting (100.0%), Finance & Insurance (100.0%), and Health Care & Social Assistance (100.0%).
| Industry | Male | Female |
| Agriculture, Fishing & Hunting | 0 (0.0%) | 7 (100.0%) |
| Mining, Quarrying, & Extraction | 0 (0.0%) | 0 (0.0%) |
| Construction | 9 (50.0%) | 9 (50.0%) |
| Manufacturing | 18 (38.3%) | 29 (61.7%) |
| Wholesale Trade | 0 (0.0%) | 0 (0.0%) |
| Retail Trade | 30 (58.8%) | 21 (41.2%) |
| Transportation & Warehousing | 0 (0.0%) | 0 (0.0%) |
| Utilities | 0 (0.0%) | 0 (0.0%) |
| Information | 8 (100.0%) | 0 (0.0%) |
| Finance & Insurance | 0 (0.0%) | 10 (100.0%) |
| Real Estate, Rental & Leasing | 7 (100.0%) | 0 (0.0%) |
| Professional & Scientific | 11 (100.0%) | 0 (0.0%) |
| Enterprise Management | 0 (0.0%) | 0 (0.0%) |
| Administrative & Support | 1 (16.7%) | 5 (83.3%) |
| Educational Services | 0 (0.0%) | 0 (0.0%) |
| Health Care & Social Assistance | 0 (0.0%) | 41 (100.0%) |
| Arts, Entertainment & Recreation | 0 (0.0%) | 9 (100.0%) |
| Accommodation & Food Services | 0 (0.0%) | 4 (100.0%) |
| Public Administration | 20 (100.0%) | 0 (0.0%) |
| Total | 104 (42.4%) | 141 (57.6%) |
Education in Greenville CDP Greene County
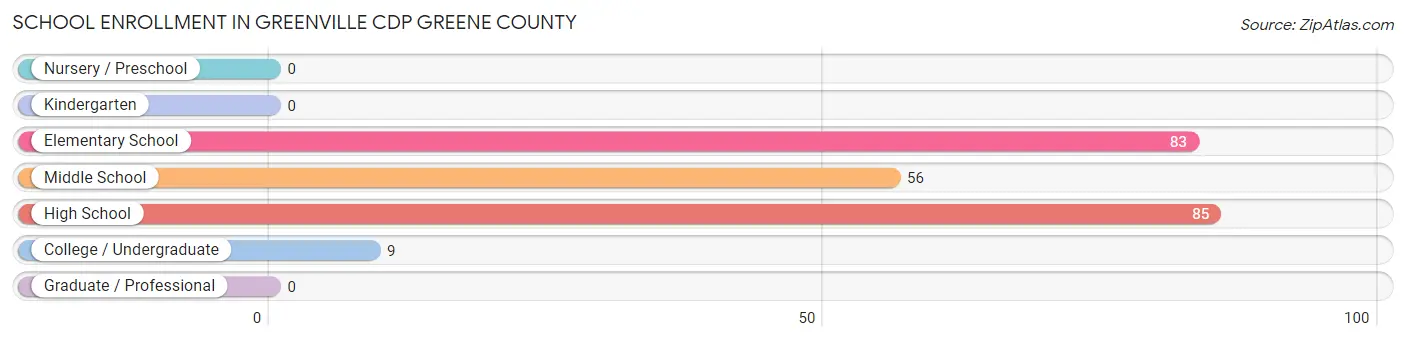
School Enrollment in Greenville CDP Greene County
The most common levels of schooling among the 233 students in Greenville CDP Greene County are high school (85 | 36.5%), elementary school (83 | 35.6%), and middle school (56 | 24.0%).
| School Level | # Students | % Students |
| Nursery / Preschool | 0 | 0.0% |
| Kindergarten | 0 | 0.0% |
| Elementary School | 83 | 35.6% |
| Middle School | 56 | 24.0% |
| High School | 85 | 36.5% |
| College / Undergraduate | 9 | 3.9% |
| Graduate / Professional | 0 | 0.0% |
| Total | 233 | 100.0% |
School Enrollment by Age by Funding Source in Greenville CDP Greene County
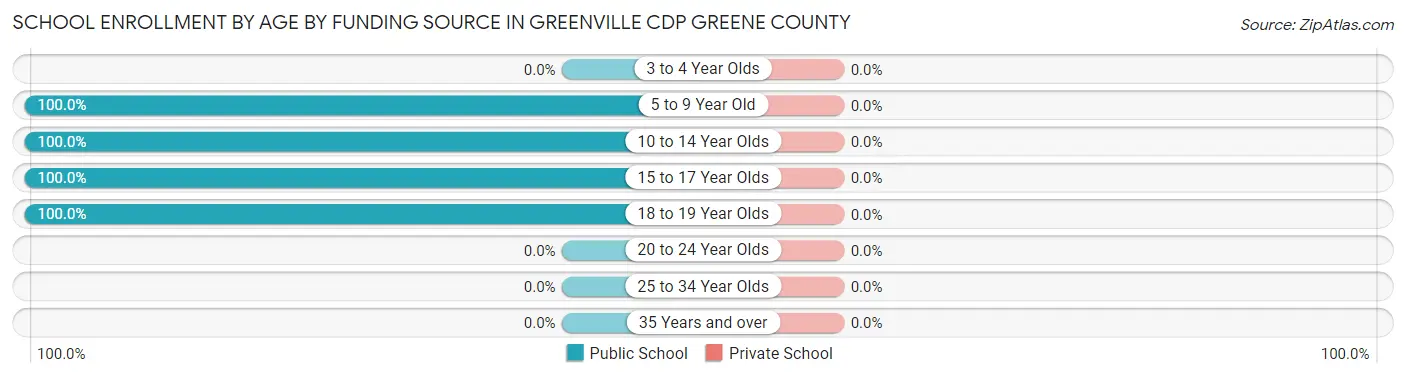
| Age Bracket | Public School | Private School |
| 3 to 4 Year Olds | 0 (0.0%) | 0 (0.0%) |
| 5 to 9 Year Old | 33 (100.0%) | 0 (0.0%) |
| 10 to 14 Year Olds | 155 (100.0%) | 0 (0.0%) |
| 15 to 17 Year Olds | 36 (100.0%) | 0 (0.0%) |
| 18 to 19 Year Olds | 9 (100.0%) | 0 (0.0%) |
| 20 to 24 Year Olds | 0 (0.0%) | 0 (0.0%) |
| 25 to 34 Year Olds | 0 (0.0%) | 0 (0.0%) |
| 35 Years and over | 0 (0.0%) | 0 (0.0%) |
| Total | 233 (100.0%) | 0 (0.0%) |
Educational Attainment by Field of Study in Greenville CDP Greene County
Business (51 | 31.1%), psychology (43 | 26.2%), bio, nature & agricultural (18 | 11.0%), engineering (18 | 11.0%), and physical & health sciences (16 | 9.8%) are the most common fields of study among 164 individuals in Greenville CDP Greene County who have obtained a bachelor's degree or higher.
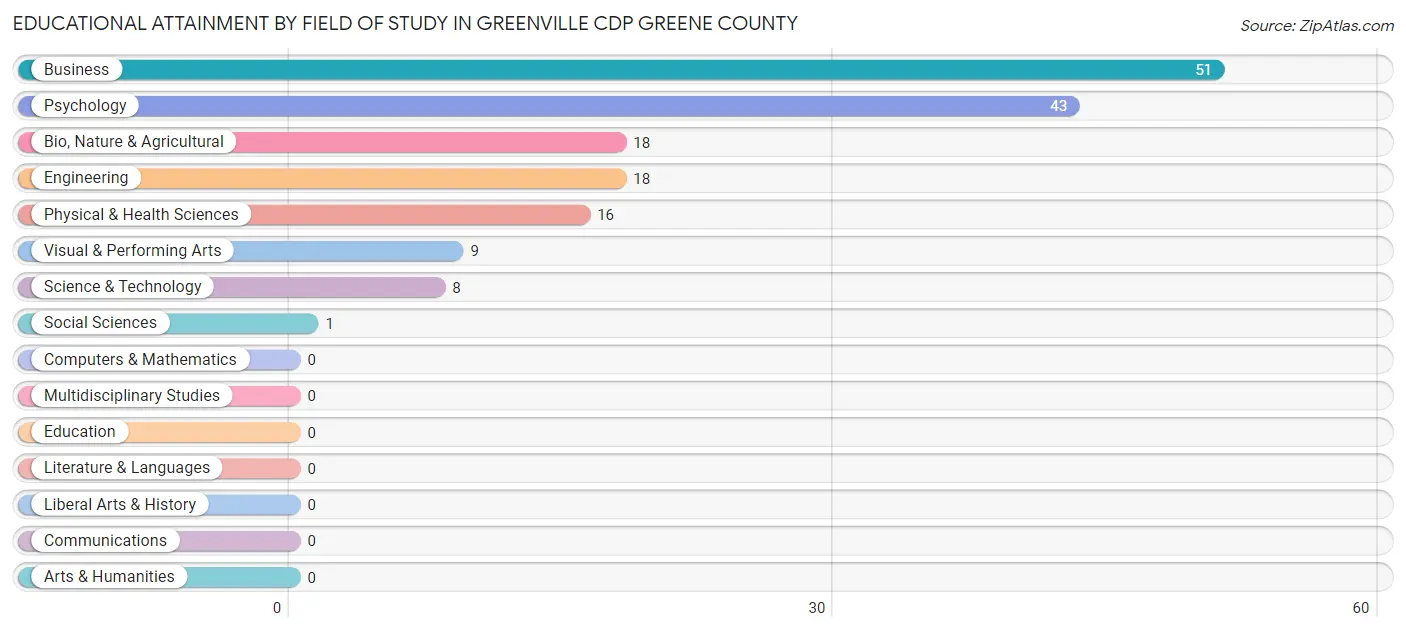
| Field of Study | # Graduates | % Graduates |
| Computers & Mathematics | 0 | 0.0% |
| Bio, Nature & Agricultural | 18 | 11.0% |
| Physical & Health Sciences | 16 | 9.8% |
| Psychology | 43 | 26.2% |
| Social Sciences | 1 | 0.6% |
| Engineering | 18 | 11.0% |
| Multidisciplinary Studies | 0 | 0.0% |
| Science & Technology | 8 | 4.9% |
| Business | 51 | 31.1% |
| Education | 0 | 0.0% |
| Literature & Languages | 0 | 0.0% |
| Liberal Arts & History | 0 | 0.0% |
| Visual & Performing Arts | 9 | 5.5% |
| Communications | 0 | 0.0% |
| Arts & Humanities | 0 | 0.0% |
| Total | 164 | 100.0% |
Transportation & Commute in Greenville CDP Greene County
Vehicle Availability by Sex in Greenville CDP Greene County
The most prevalent vehicle ownership categories in Greenville CDP Greene County are males with 2 vehicles (80, accounting for 76.9%) and females with 2 vehicles (92, making up 56.7%).
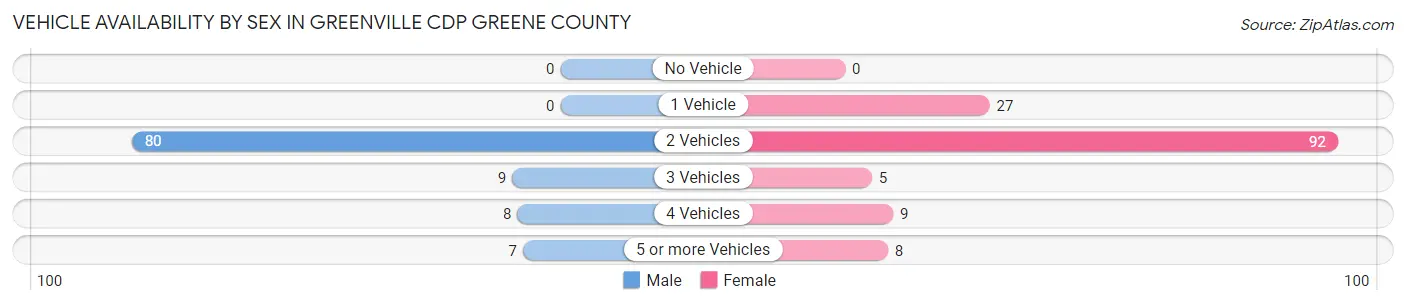
| Vehicles Available | Male | Female |
| No Vehicle | 0 (0.0%) | 0 (0.0%) |
| 1 Vehicle | 0 (0.0%) | 27 (19.2%) |
| 2 Vehicles | 80 (76.9%) | 92 (65.2%) |
| 3 Vehicles | 9 (8.6%) | 5 (3.5%) |
| 4 Vehicles | 8 (7.7%) | 9 (6.4%) |
| 5 or more Vehicles | 7 (6.7%) | 8 (5.7%) |
| Total | 104 (100.0%) | 141 (100.0%) |
Commute Time in Greenville CDP Greene County
The most frequently occuring commute durations in Greenville CDP Greene County are 45 to 59 minutes (75 commuters, 34.3%), less than 5 minutes (40 commuters, 18.3%), and 5 to 9 minutes (20 commuters, 9.1%).
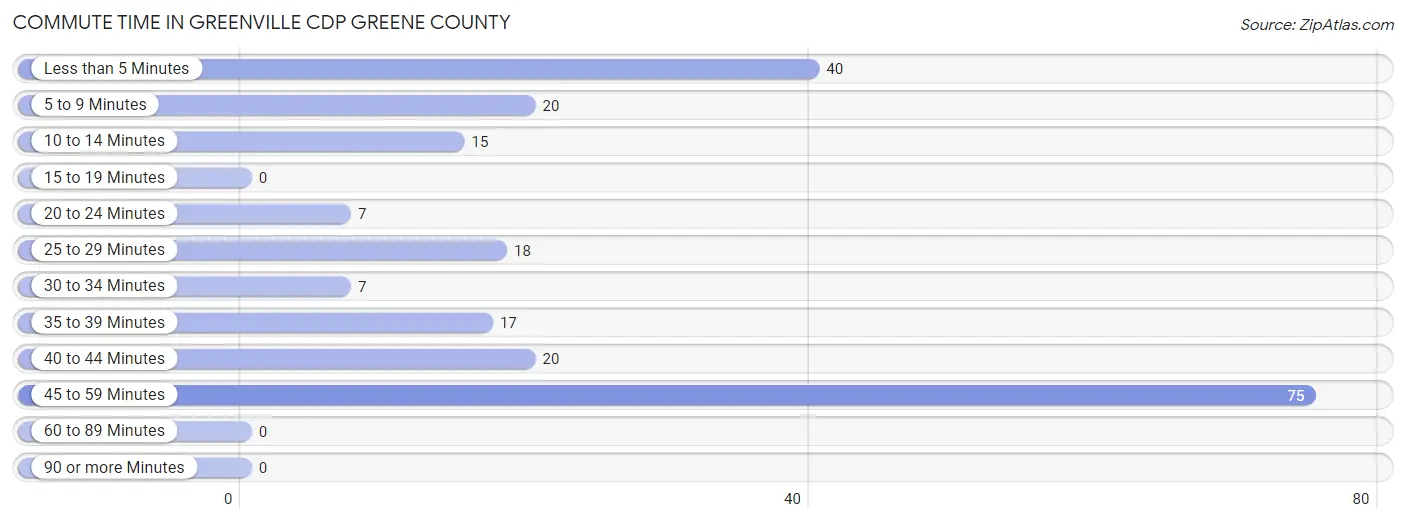
| Commute Time | # Commuters | % Commuters |
| Less than 5 Minutes | 40 | 18.3% |
| 5 to 9 Minutes | 20 | 9.1% |
| 10 to 14 Minutes | 15 | 6.9% |
| 15 to 19 Minutes | 0 | 0.0% |
| 20 to 24 Minutes | 7 | 3.2% |
| 25 to 29 Minutes | 18 | 8.2% |
| 30 to 34 Minutes | 7 | 3.2% |
| 35 to 39 Minutes | 17 | 7.8% |
| 40 to 44 Minutes | 20 | 9.1% |
| 45 to 59 Minutes | 75 | 34.3% |
| 60 to 89 Minutes | 0 | 0.0% |
| 90 or more Minutes | 0 | 0.0% |
Commute Time by Sex in Greenville CDP Greene County
The most common commute times in Greenville CDP Greene County are 45 to 59 minutes (37 commuters, 38.5%) for males and 45 to 59 minutes (38 commuters, 30.9%) for females.
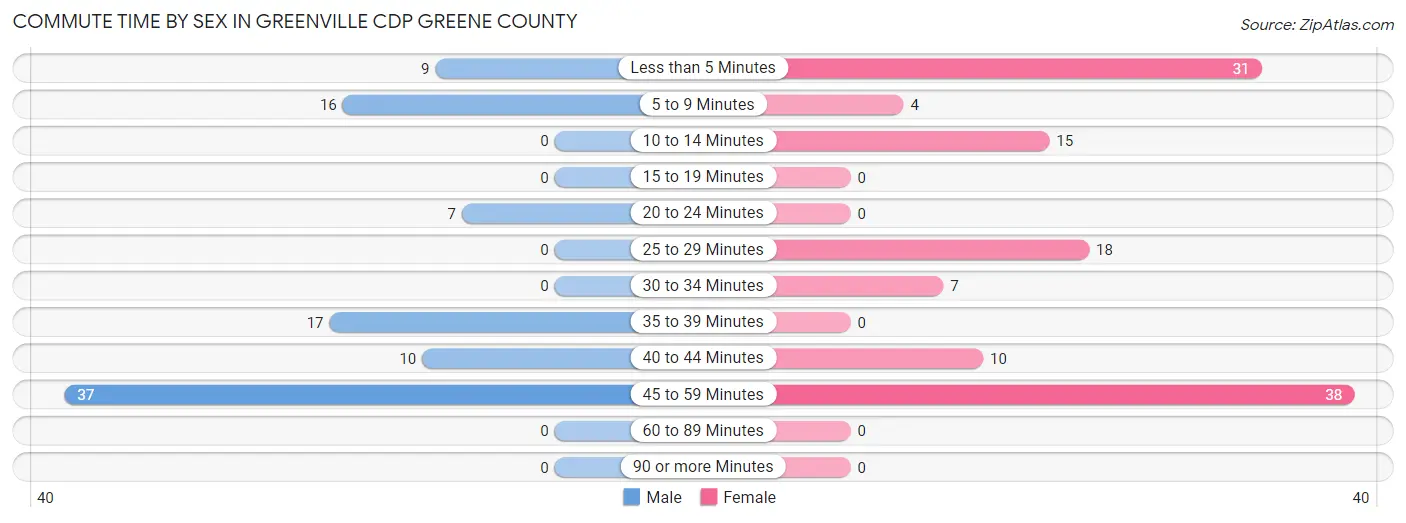
| Commute Time | Male | Female |
| Less than 5 Minutes | 9 (9.4%) | 31 (25.2%) |
| 5 to 9 Minutes | 16 (16.7%) | 4 (3.3%) |
| 10 to 14 Minutes | 0 (0.0%) | 15 (12.2%) |
| 15 to 19 Minutes | 0 (0.0%) | 0 (0.0%) |
| 20 to 24 Minutes | 7 (7.3%) | 0 (0.0%) |
| 25 to 29 Minutes | 0 (0.0%) | 18 (14.6%) |
| 30 to 34 Minutes | 0 (0.0%) | 7 (5.7%) |
| 35 to 39 Minutes | 17 (17.7%) | 0 (0.0%) |
| 40 to 44 Minutes | 10 (10.4%) | 10 (8.1%) |
| 45 to 59 Minutes | 37 (38.5%) | 38 (30.9%) |
| 60 to 89 Minutes | 0 (0.0%) | 0 (0.0%) |
| 90 or more Minutes | 0 (0.0%) | 0 (0.0%) |
Time of Departure to Work by Sex in Greenville CDP Greene County
The most frequent times of departure to work in Greenville CDP Greene County are 4:00 PM to 11:59 PM (23, 24.0%) for males and 7:00 AM to 7:29 AM (36, 29.3%) for females.
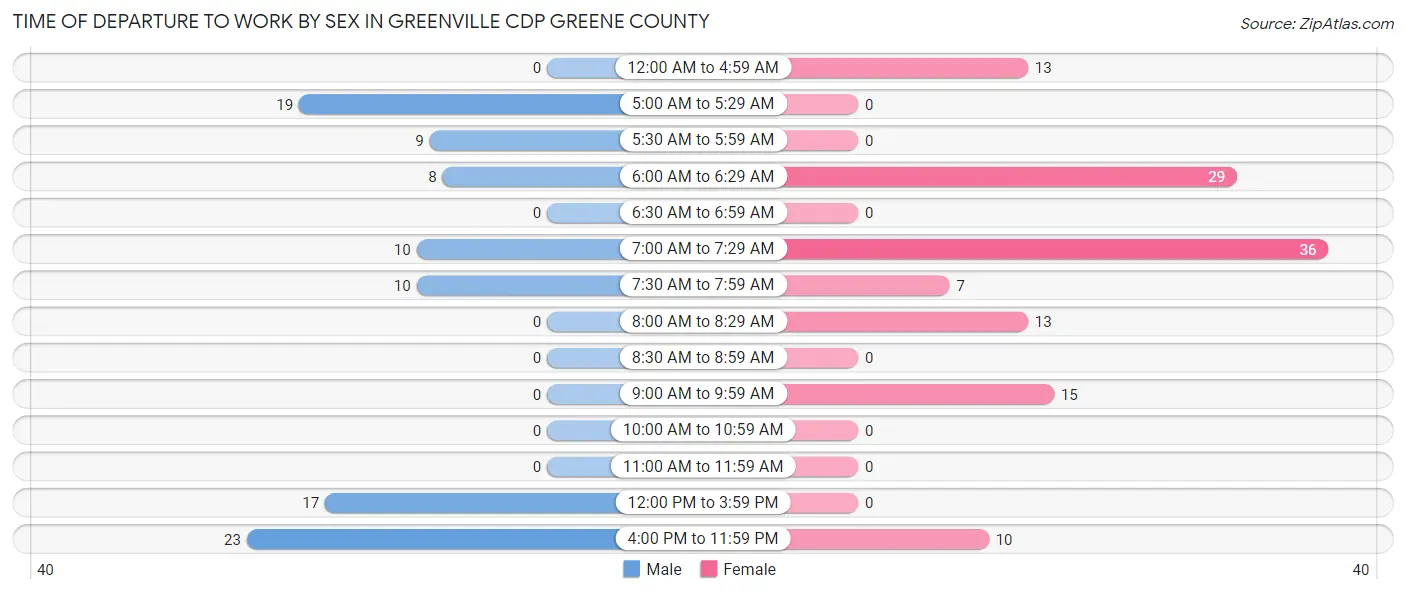
| Time of Departure | Male | Female |
| 12:00 AM to 4:59 AM | 0 (0.0%) | 13 (10.6%) |
| 5:00 AM to 5:29 AM | 19 (19.8%) | 0 (0.0%) |
| 5:30 AM to 5:59 AM | 9 (9.4%) | 0 (0.0%) |
| 6:00 AM to 6:29 AM | 8 (8.3%) | 29 (23.6%) |
| 6:30 AM to 6:59 AM | 0 (0.0%) | 0 (0.0%) |
| 7:00 AM to 7:29 AM | 10 (10.4%) | 36 (29.3%) |
| 7:30 AM to 7:59 AM | 10 (10.4%) | 7 (5.7%) |
| 8:00 AM to 8:29 AM | 0 (0.0%) | 13 (10.6%) |
| 8:30 AM to 8:59 AM | 0 (0.0%) | 0 (0.0%) |
| 9:00 AM to 9:59 AM | 0 (0.0%) | 15 (12.2%) |
| 10:00 AM to 10:59 AM | 0 (0.0%) | 0 (0.0%) |
| 11:00 AM to 11:59 AM | 0 (0.0%) | 0 (0.0%) |
| 12:00 PM to 3:59 PM | 17 (17.7%) | 0 (0.0%) |
| 4:00 PM to 11:59 PM | 23 (24.0%) | 10 (8.1%) |
| Total | 96 (100.0%) | 123 (100.0%) |
Housing Occupancy in Greenville CDP Greene County
Occupancy by Ownership in Greenville CDP Greene County
Of the total 277 dwellings in Greenville CDP Greene County, owner-occupied units account for 218 (78.7%), while renter-occupied units make up 59 (21.3%).
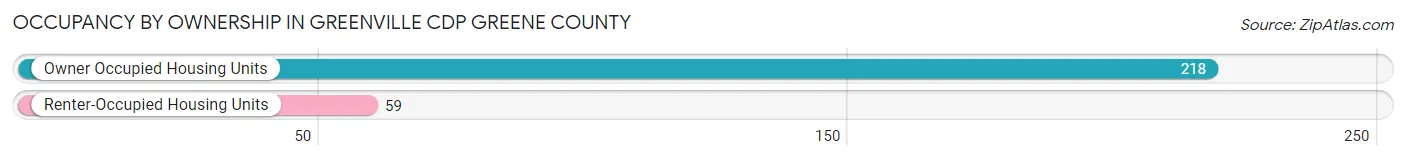
| Occupancy | # Housing Units | % Housing Units |
| Owner Occupied Housing Units | 218 | 78.7% |
| Renter-Occupied Housing Units | 59 | 21.3% |
| Total Occupied Housing Units | 277 | 100.0% |
Occupancy by Household Size in Greenville CDP Greene County
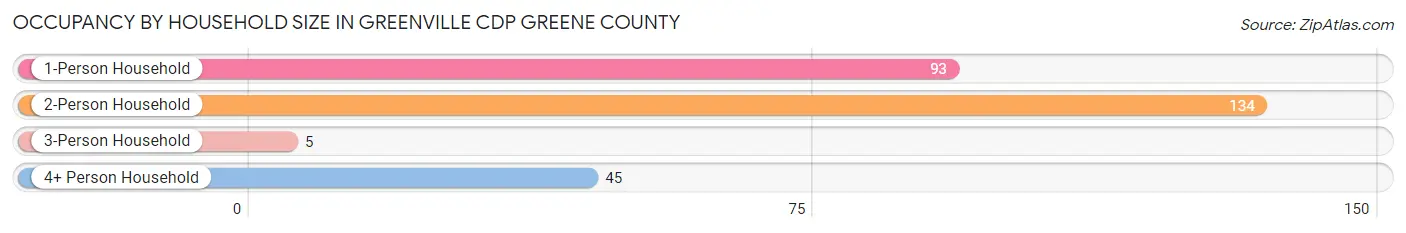
| Household Size | # Housing Units | % Housing Units |
| 1-Person Household | 93 | 33.6% |
| 2-Person Household | 134 | 48.4% |
| 3-Person Household | 5 | 1.8% |
| 4+ Person Household | 45 | 16.3% |
| Total Housing Units | 277 | 100.0% |
Occupancy by Ownership by Household Size in Greenville CDP Greene County
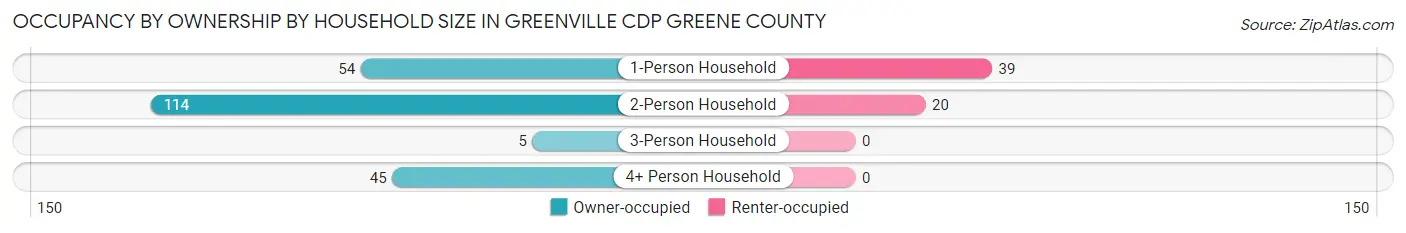
| Household Size | Owner-occupied | Renter-occupied |
| 1-Person Household | 54 (58.1%) | 39 (41.9%) |
| 2-Person Household | 114 (85.1%) | 20 (14.9%) |
| 3-Person Household | 5 (100.0%) | 0 (0.0%) |
| 4+ Person Household | 45 (100.0%) | 0 (0.0%) |
| Total Housing Units | 218 (78.7%) | 59 (21.3%) |
Occupancy by Educational Attainment in Greenville CDP Greene County
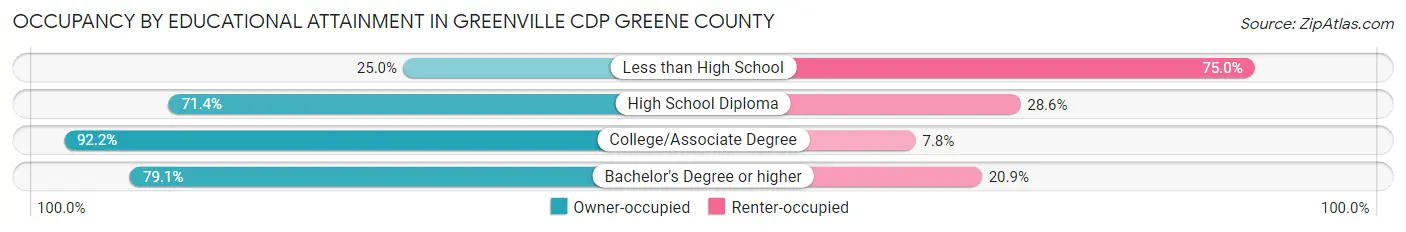
| Household Size | Owner-occupied | Renter-occupied |
| Less than High School | 7 (25.0%) | 21 (75.0%) |
| High School Diploma | 25 (71.4%) | 10 (28.6%) |
| College/Associate Degree | 118 (92.2%) | 10 (7.8%) |
| Bachelor's Degree or higher | 68 (79.1%) | 18 (20.9%) |
Occupancy by Age of Householder in Greenville CDP Greene County
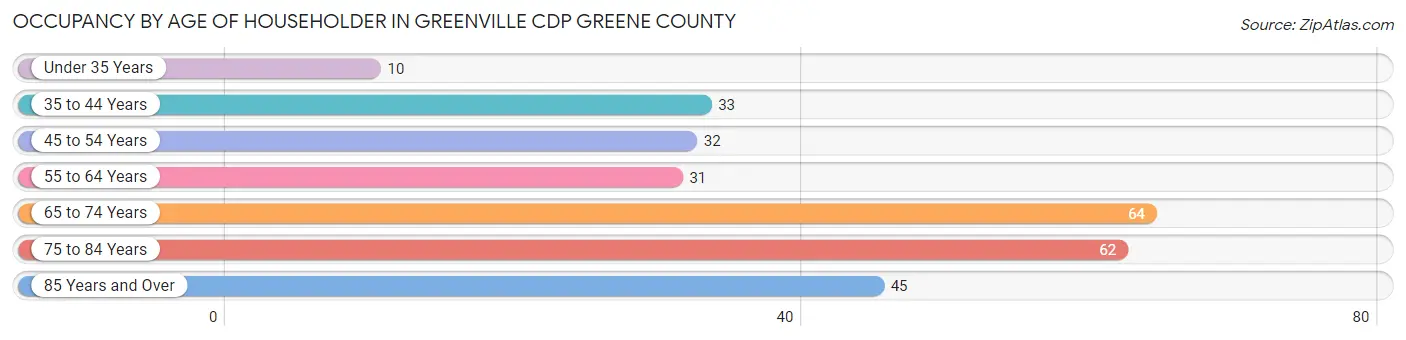
| Age Bracket | # Households | % Households |
| Under 35 Years | 10 | 3.6% |
| 35 to 44 Years | 33 | 11.9% |
| 45 to 54 Years | 32 | 11.6% |
| 55 to 64 Years | 31 | 11.2% |
| 65 to 74 Years | 64 | 23.1% |
| 75 to 84 Years | 62 | 22.4% |
| 85 Years and Over | 45 | 16.3% |
| Total | 277 | 100.0% |
Housing Finances in Greenville CDP Greene County
Median Income by Occupancy in Greenville CDP Greene County
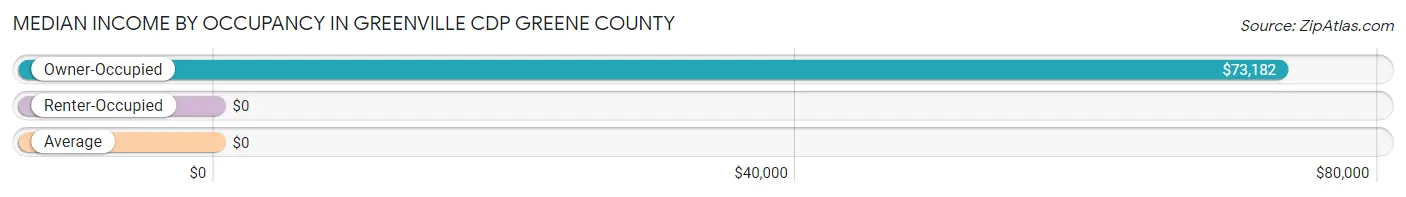
| Occupancy Type | # Households | Median Income |
| Owner-Occupied | 218 (78.7%) | $73,182 |
| Renter-Occupied | 59 (21.3%) | $0 |
| Average | 277 (100.0%) | $0 |
Occupancy by Householder Income Bracket in Greenville CDP Greene County
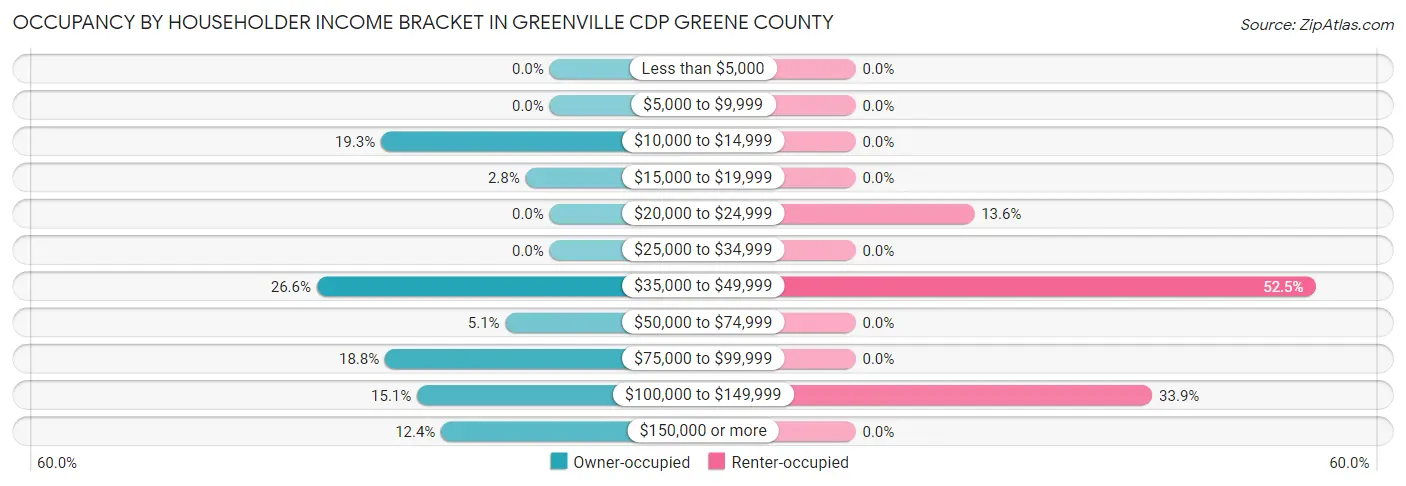
| Income Bracket | Owner-occupied | Renter-occupied |
| Less than $5,000 | 0 (0.0%) | 0 (0.0%) |
| $5,000 to $9,999 | 0 (0.0%) | 0 (0.0%) |
| $10,000 to $14,999 | 42 (19.3%) | 0 (0.0%) |
| $15,000 to $19,999 | 6 (2.8%) | 0 (0.0%) |
| $20,000 to $24,999 | 0 (0.0%) | 8 (13.6%) |
| $25,000 to $34,999 | 0 (0.0%) | 0 (0.0%) |
| $35,000 to $49,999 | 58 (26.6%) | 31 (52.5%) |
| $50,000 to $74,999 | 11 (5.1%) | 0 (0.0%) |
| $75,000 to $99,999 | 41 (18.8%) | 0 (0.0%) |
| $100,000 to $149,999 | 33 (15.1%) | 20 (33.9%) |
| $150,000 or more | 27 (12.4%) | 0 (0.0%) |
| Total | 218 (100.0%) | 59 (100.0%) |
Monthly Housing Cost Tiers in Greenville CDP Greene County
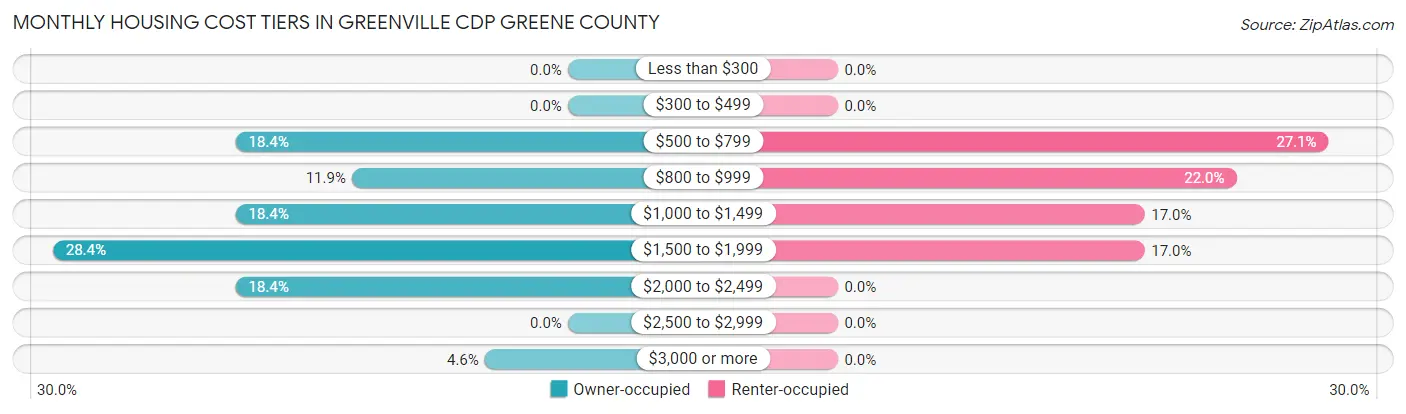
| Monthly Cost | Owner-occupied | Renter-occupied |
| Less than $300 | 0 (0.0%) | 0 (0.0%) |
| $300 to $499 | 0 (0.0%) | 0 (0.0%) |
| $500 to $799 | 40 (18.3%) | 16 (27.1%) |
| $800 to $999 | 26 (11.9%) | 13 (22.0%) |
| $1,000 to $1,499 | 40 (18.3%) | 10 (17.0%) |
| $1,500 to $1,999 | 62 (28.4%) | 10 (17.0%) |
| $2,000 to $2,499 | 40 (18.3%) | 0 (0.0%) |
| $2,500 to $2,999 | 0 (0.0%) | 0 (0.0%) |
| $3,000 or more | 10 (4.6%) | 0 (0.0%) |
| Total | 218 (100.0%) | 59 (100.0%) |
Physical Housing Characteristics in Greenville CDP Greene County
Housing Structures in Greenville CDP Greene County
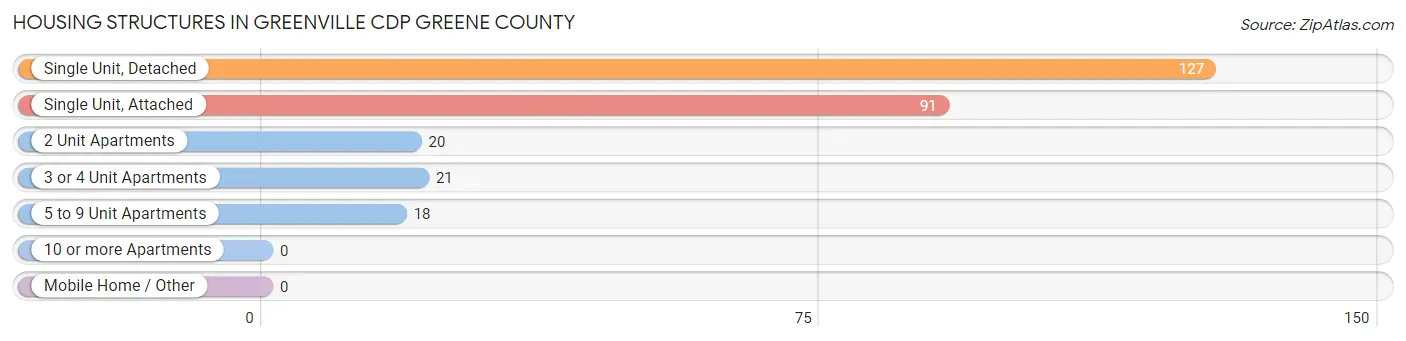
| Structure Type | # Housing Units | % Housing Units |
| Single Unit, Detached | 127 | 45.9% |
| Single Unit, Attached | 91 | 32.9% |
| 2 Unit Apartments | 20 | 7.2% |
| 3 or 4 Unit Apartments | 21 | 7.6% |
| 5 to 9 Unit Apartments | 18 | 6.5% |
| 10 or more Apartments | 0 | 0.0% |
| Mobile Home / Other | 0 | 0.0% |
| Total | 277 | 100.0% |
Housing Structures by Occupancy in Greenville CDP Greene County
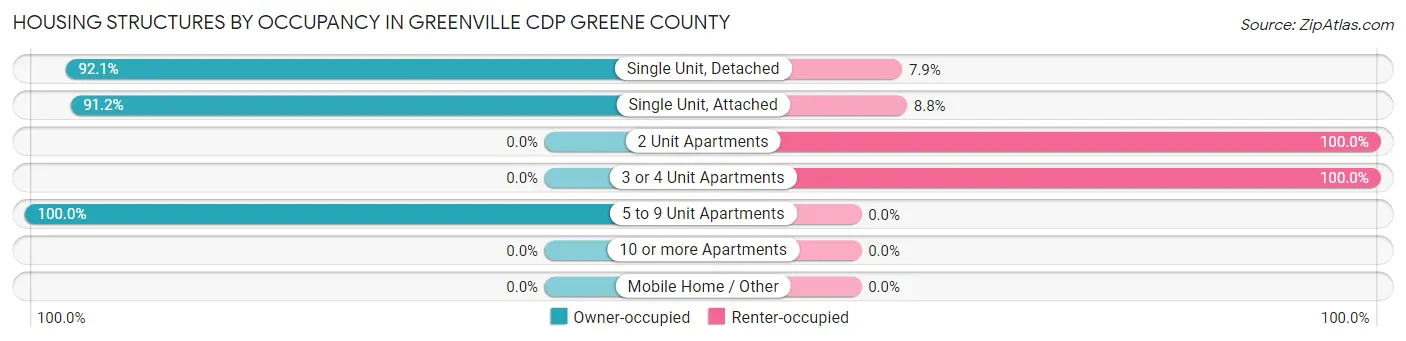
| Structure Type | Owner-occupied | Renter-occupied |
| Single Unit, Detached | 117 (92.1%) | 10 (7.9%) |
| Single Unit, Attached | 83 (91.2%) | 8 (8.8%) |
| 2 Unit Apartments | 0 (0.0%) | 20 (100.0%) |
| 3 or 4 Unit Apartments | 0 (0.0%) | 21 (100.0%) |
| 5 to 9 Unit Apartments | 18 (100.0%) | 0 (0.0%) |
| 10 or more Apartments | 0 (0.0%) | 0 (0.0%) |
| Mobile Home / Other | 0 (0.0%) | 0 (0.0%) |
| Total | 218 (78.7%) | 59 (21.3%) |
Housing Structures by Number of Rooms in Greenville CDP Greene County
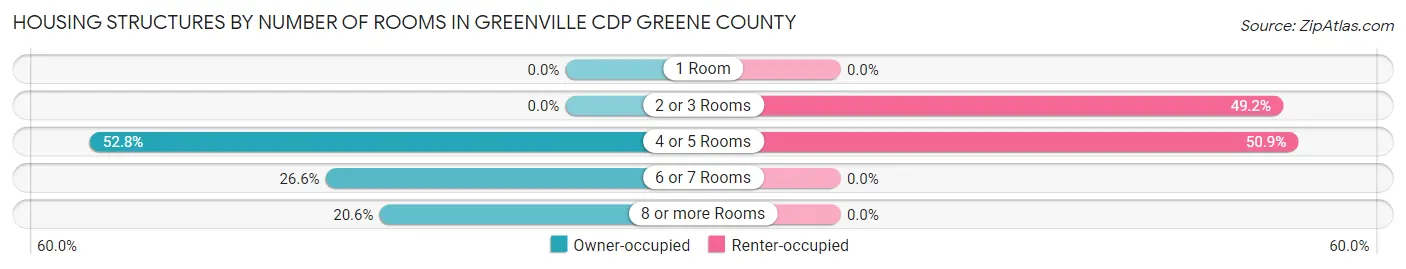
| Number of Rooms | Owner-occupied | Renter-occupied |
| 1 Room | 0 (0.0%) | 0 (0.0%) |
| 2 or 3 Rooms | 0 (0.0%) | 29 (49.1%) |
| 4 or 5 Rooms | 115 (52.7%) | 30 (50.8%) |
| 6 or 7 Rooms | 58 (26.6%) | 0 (0.0%) |
| 8 or more Rooms | 45 (20.6%) | 0 (0.0%) |
| Total | 218 (100.0%) | 59 (100.0%) |
Housing Structure by Heating Type in Greenville CDP Greene County
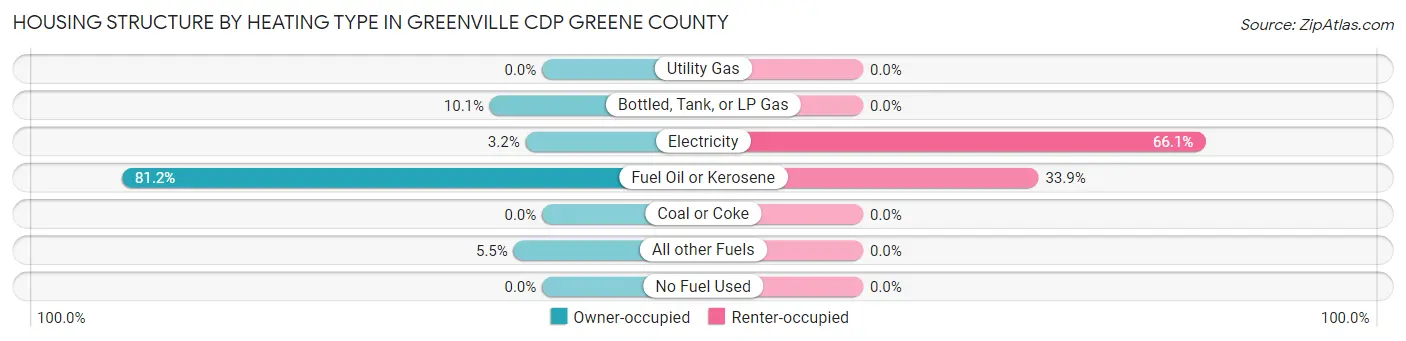
| Heating Type | Owner-occupied | Renter-occupied |
| Utility Gas | 0 (0.0%) | 0 (0.0%) |
| Bottled, Tank, or LP Gas | 22 (10.1%) | 0 (0.0%) |
| Electricity | 7 (3.2%) | 39 (66.1%) |
| Fuel Oil or Kerosene | 177 (81.2%) | 20 (33.9%) |
| Coal or Coke | 0 (0.0%) | 0 (0.0%) |
| All other Fuels | 12 (5.5%) | 0 (0.0%) |
| No Fuel Used | 0 (0.0%) | 0 (0.0%) |
| Total | 218 (100.0%) | 59 (100.0%) |
Household Vehicle Usage in Greenville CDP Greene County
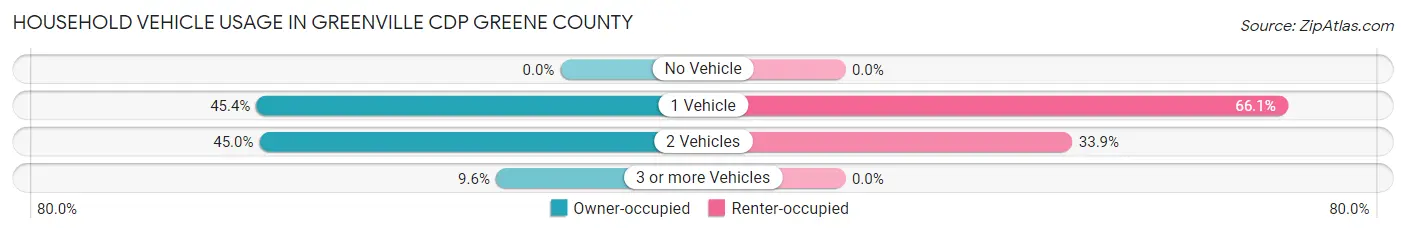
| Vehicles per Household | Owner-occupied | Renter-occupied |
| No Vehicle | 0 (0.0%) | 0 (0.0%) |
| 1 Vehicle | 99 (45.4%) | 39 (66.1%) |
| 2 Vehicles | 98 (45.0%) | 20 (33.9%) |
| 3 or more Vehicles | 21 (9.6%) | 0 (0.0%) |
| Total | 218 (100.0%) | 59 (100.0%) |
Real Estate & Mortgages in Greenville CDP Greene County
Real Estate and Mortgage Overview in Greenville CDP Greene County
| Characteristic | Without Mortgage | With Mortgage |
| Housing Units | 97 | 121 |
| Median Property Value | $318,400 | $216,200 |
| Median Household Income | $39,280 | $27 |
| Monthly Housing Costs | $955 | $10 |
| Real Estate Taxes | $5,461 | $0 |
Property Value by Mortgage Status in Greenville CDP Greene County
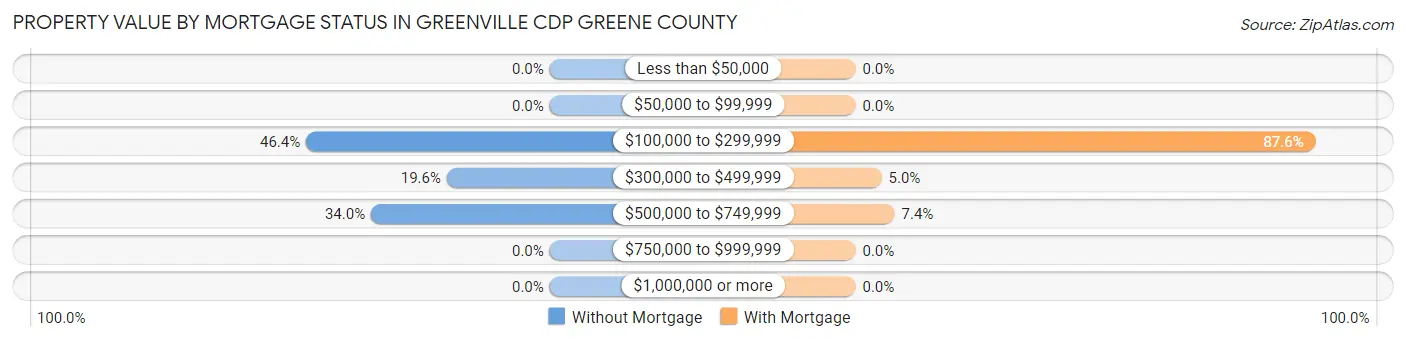
| Property Value | Without Mortgage | With Mortgage |
| Less than $50,000 | 0 (0.0%) | 0 (0.0%) |
| $50,000 to $99,999 | 0 (0.0%) | 0 (0.0%) |
| $100,000 to $299,999 | 45 (46.4%) | 106 (87.6%) |
| $300,000 to $499,999 | 19 (19.6%) | 6 (5.0%) |
| $500,000 to $749,999 | 33 (34.0%) | 9 (7.4%) |
| $750,000 to $999,999 | 0 (0.0%) | 0 (0.0%) |
| $1,000,000 or more | 0 (0.0%) | 0 (0.0%) |
| Total | 97 (100.0%) | 121 (100.0%) |
Household Income by Mortgage Status in Greenville CDP Greene County
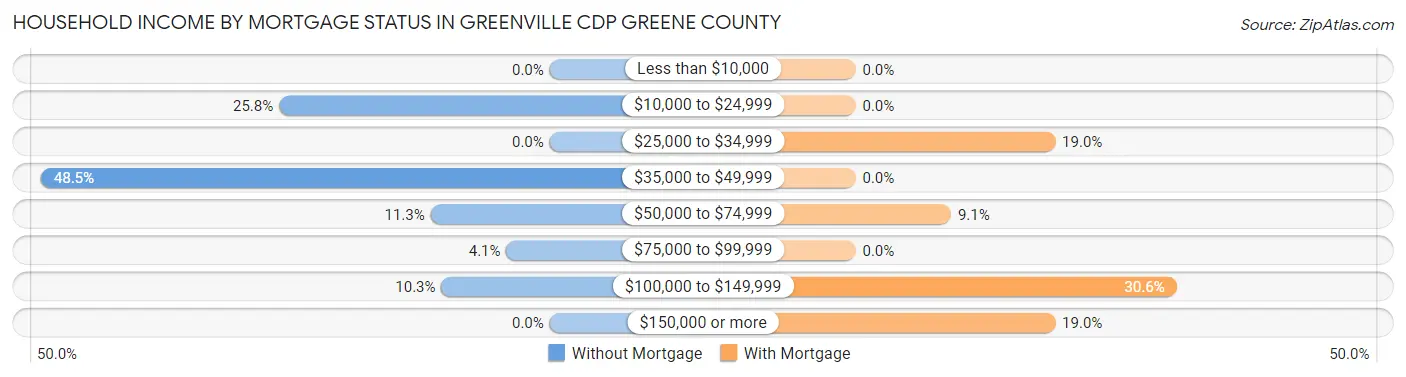
| Household Income | Without Mortgage | With Mortgage |
| Less than $10,000 | 0 (0.0%) | 0 (0.0%) |
| $10,000 to $24,999 | 25 (25.8%) | 0 (0.0%) |
| $25,000 to $34,999 | 0 (0.0%) | 23 (19.0%) |
| $35,000 to $49,999 | 47 (48.4%) | 0 (0.0%) |
| $50,000 to $74,999 | 11 (11.3%) | 11 (9.1%) |
| $75,000 to $99,999 | 4 (4.1%) | 0 (0.0%) |
| $100,000 to $149,999 | 10 (10.3%) | 37 (30.6%) |
| $150,000 or more | 0 (0.0%) | 23 (19.0%) |
| Total | 97 (100.0%) | 121 (100.0%) |
Property Value to Household Income Ratio in Greenville CDP Greene County
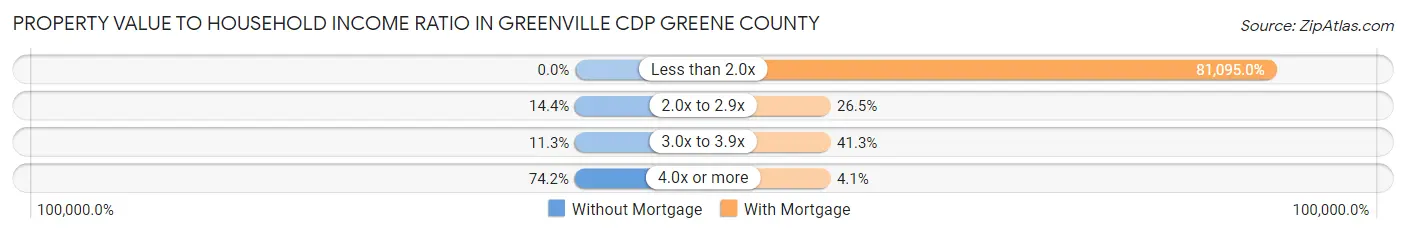
| Value-to-Income Ratio | Without Mortgage | With Mortgage |
| Less than 2.0x | 0 (0.0%) | 98,125 (81,095.0%) |
| 2.0x to 2.9x | 14 (14.4%) | 32 (26.5%) |
| 3.0x to 3.9x | 11 (11.3%) | 50 (41.3%) |
| 4.0x or more | 72 (74.2%) | 5 (4.1%) |
| Total | 97 (100.0%) | 121 (100.0%) |
Real Estate Taxes by Mortgage Status in Greenville CDP Greene County
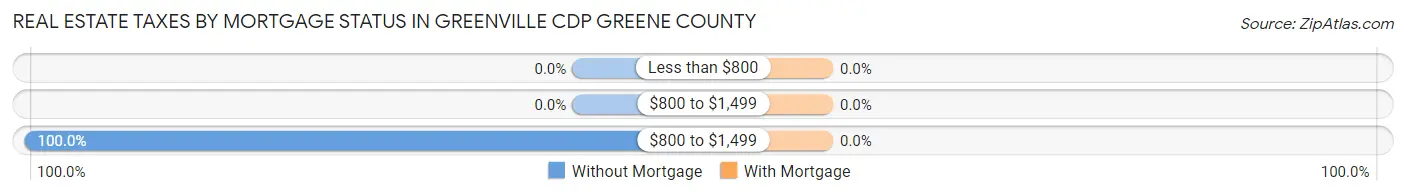
| Property Taxes | Without Mortgage | With Mortgage |
| Less than $800 | 0 (0.0%) | 0 (0.0%) |
| $800 to $1,499 | 0 (0.0%) | 0 (0.0%) |
| $800 to $1,499 | 97 (100.0%) | 0 (0.0%) |
| Total | 97 (100.0%) | 121 (100.0%) |
Health & Disability in Greenville CDP Greene County
Health Insurance Coverage by Age in Greenville CDP Greene County
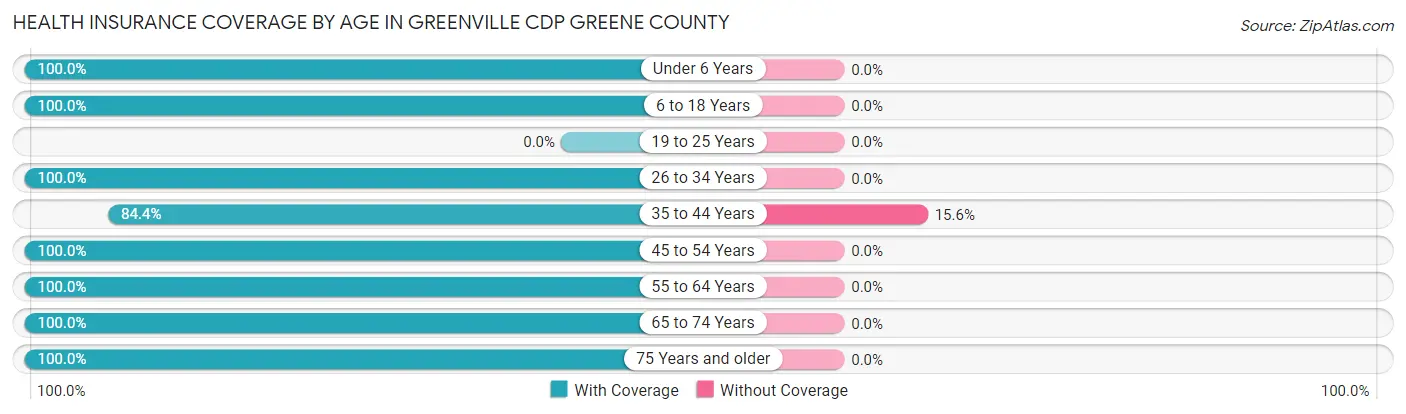
| Age Bracket | With Coverage | Without Coverage |
| Under 6 Years | 22 (100.0%) | 0 (0.0%) |
| 6 to 18 Years | 241 (100.0%) | 0 (0.0%) |
| 19 to 25 Years | 0 (0.0%) | 0 (0.0%) |
| 26 to 34 Years | 32 (100.0%) | 0 (0.0%) |
| 35 to 44 Years | 38 (84.4%) | 7 (15.6%) |
| 45 to 54 Years | 74 (100.0%) | 0 (0.0%) |
| 55 to 64 Years | 89 (100.0%) | 0 (0.0%) |
| 65 to 74 Years | 127 (100.0%) | 0 (0.0%) |
| 75 Years and older | 116 (100.0%) | 0 (0.0%) |
| Total | 739 (99.1%) | 7 (0.9%) |
Health Insurance Coverage by Citizenship Status in Greenville CDP Greene County
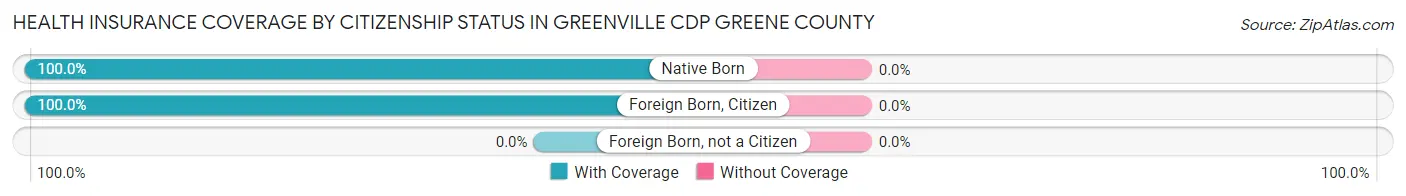
| Citizenship Status | With Coverage | Without Coverage |
| Native Born | 22 (100.0%) | 0 (0.0%) |
| Foreign Born, Citizen | 241 (100.0%) | 0 (0.0%) |
| Foreign Born, not a Citizen | 0 (0.0%) | 0 (0.0%) |
Health Insurance Coverage by Household Income in Greenville CDP Greene County
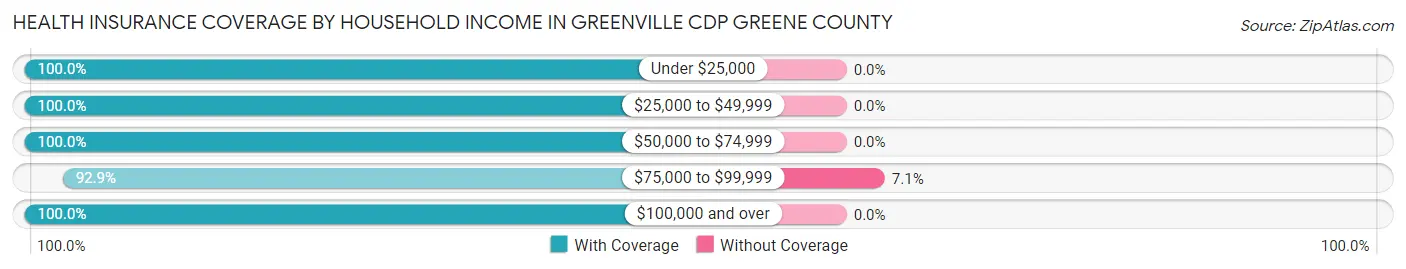
| Household Income | With Coverage | Without Coverage |
| Under $25,000 | 255 (100.0%) | 0 (0.0%) |
| $25,000 to $49,999 | 143 (100.0%) | 0 (0.0%) |
| $50,000 to $74,999 | 11 (100.0%) | 0 (0.0%) |
| $75,000 to $99,999 | 91 (92.9%) | 7 (7.1%) |
| $100,000 and over | 239 (100.0%) | 0 (0.0%) |
Public vs Private Health Insurance Coverage by Age in Greenville CDP Greene County
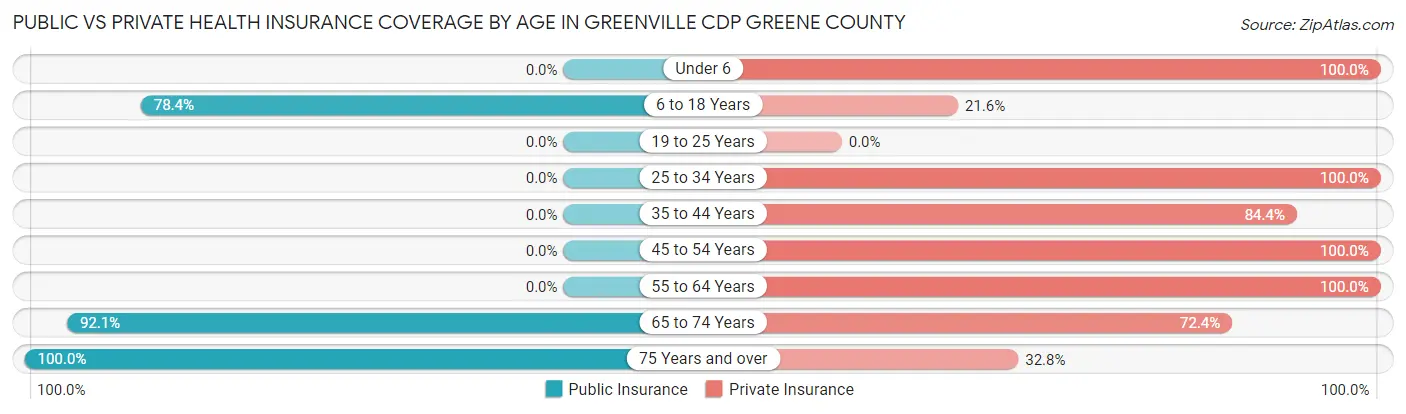
| Age Bracket | Public Insurance | Private Insurance |
| Under 6 | 0 (0.0%) | 22 (100.0%) |
| 6 to 18 Years | 189 (78.4%) | 52 (21.6%) |
| 19 to 25 Years | 0 (0.0%) | 0 (0.0%) |
| 25 to 34 Years | 0 (0.0%) | 32 (100.0%) |
| 35 to 44 Years | 0 (0.0%) | 38 (84.4%) |
| 45 to 54 Years | 0 (0.0%) | 74 (100.0%) |
| 55 to 64 Years | 0 (0.0%) | 89 (100.0%) |
| 65 to 74 Years | 117 (92.1%) | 92 (72.4%) |
| 75 Years and over | 116 (100.0%) | 38 (32.8%) |
| Total | 422 (56.6%) | 437 (58.6%) |
Disability Status by Sex by Age in Greenville CDP Greene County
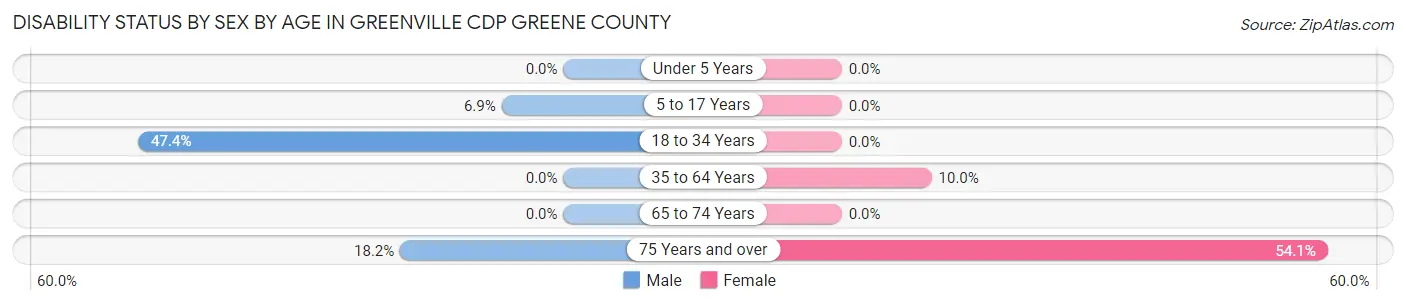
| Age Bracket | Male | Female |
| Under 5 Years | 0 (0.0%) | 0 (0.0%) |
| 5 to 17 Years | 11 (6.9%) | 0 (0.0%) |
| 18 to 34 Years | 9 (47.4%) | 0 (0.0%) |
| 35 to 64 Years | 0 (0.0%) | 10 (10.0%) |
| 65 to 74 Years | 0 (0.0%) | 0 (0.0%) |
| 75 Years and over | 10 (18.2%) | 33 (54.1%) |
Disability Class by Sex by Age in Greenville CDP Greene County
Disability Class: Hearing Difficulty
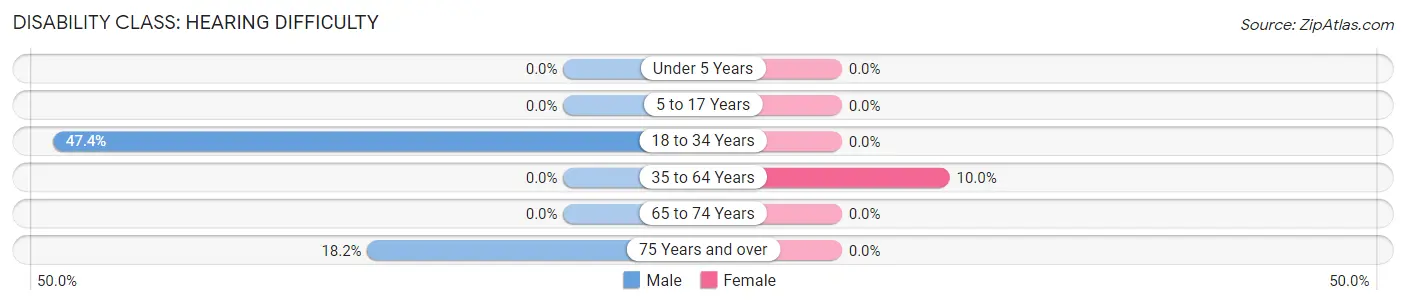
| Age Bracket | Male | Female |
| Under 5 Years | 0 (0.0%) | 0 (0.0%) |
| 5 to 17 Years | 0 (0.0%) | 0 (0.0%) |
| 18 to 34 Years | 9 (47.4%) | 0 (0.0%) |
| 35 to 64 Years | 0 (0.0%) | 10 (10.0%) |
| 65 to 74 Years | 0 (0.0%) | 0 (0.0%) |
| 75 Years and over | 10 (18.2%) | 0 (0.0%) |
Disability Class: Vision Difficulty
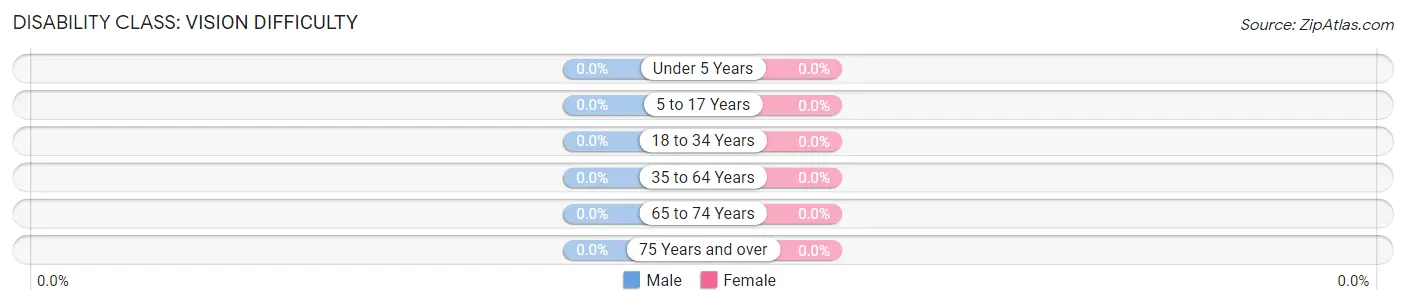
| Age Bracket | Male | Female |
| Under 5 Years | 0 (0.0%) | 0 (0.0%) |
| 5 to 17 Years | 0 (0.0%) | 0 (0.0%) |
| 18 to 34 Years | 0 (0.0%) | 0 (0.0%) |
| 35 to 64 Years | 0 (0.0%) | 0 (0.0%) |
| 65 to 74 Years | 0 (0.0%) | 0 (0.0%) |
| 75 Years and over | 0 (0.0%) | 0 (0.0%) |
Disability Class: Cognitive Difficulty
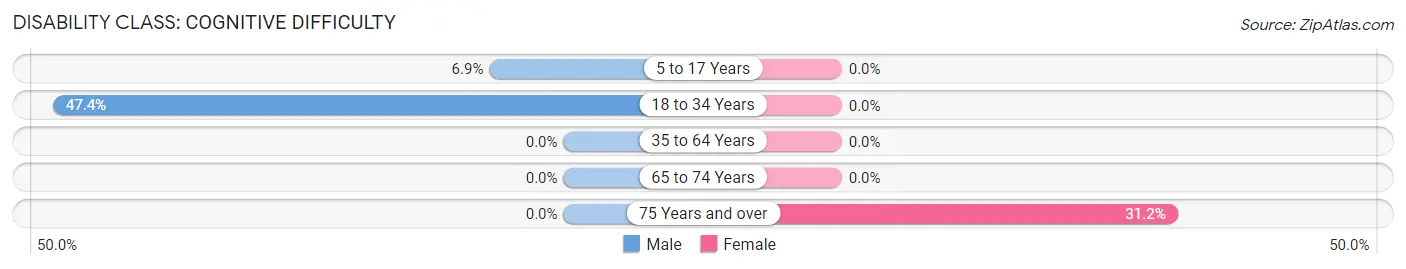
| Age Bracket | Male | Female |
| 5 to 17 Years | 11 (6.9%) | 0 (0.0%) |
| 18 to 34 Years | 9 (47.4%) | 0 (0.0%) |
| 35 to 64 Years | 0 (0.0%) | 0 (0.0%) |
| 65 to 74 Years | 0 (0.0%) | 0 (0.0%) |
| 75 Years and over | 0 (0.0%) | 19 (31.1%) |
Disability Class: Ambulatory Difficulty
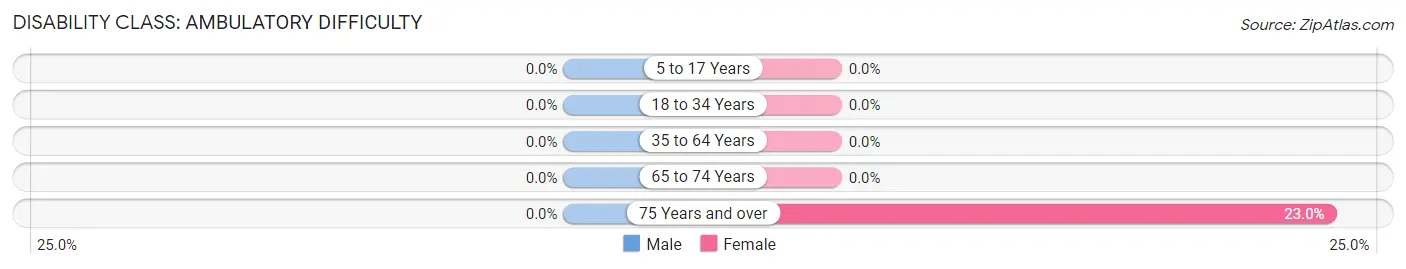
| Age Bracket | Male | Female |
| 5 to 17 Years | 0 (0.0%) | 0 (0.0%) |
| 18 to 34 Years | 0 (0.0%) | 0 (0.0%) |
| 35 to 64 Years | 0 (0.0%) | 0 (0.0%) |
| 65 to 74 Years | 0 (0.0%) | 0 (0.0%) |
| 75 Years and over | 0 (0.0%) | 14 (23.0%) |
Disability Class: Self-Care Difficulty
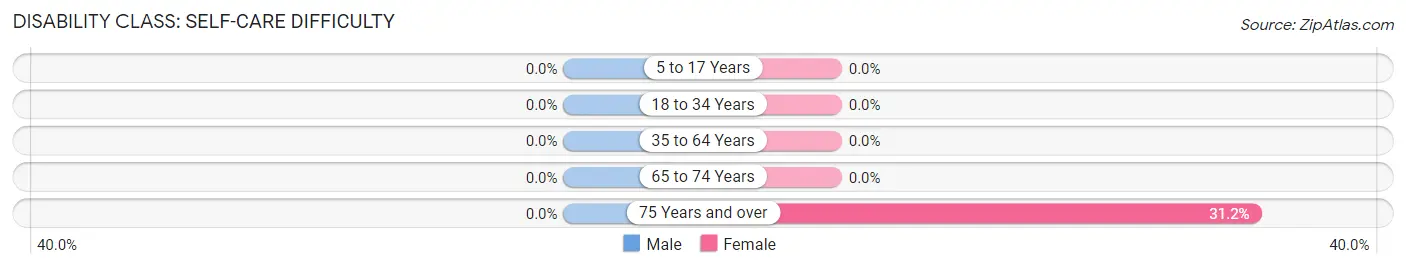
| Age Bracket | Male | Female |
| 5 to 17 Years | 0 (0.0%) | 0 (0.0%) |
| 18 to 34 Years | 0 (0.0%) | 0 (0.0%) |
| 35 to 64 Years | 0 (0.0%) | 0 (0.0%) |
| 65 to 74 Years | 0 (0.0%) | 0 (0.0%) |
| 75 Years and over | 0 (0.0%) | 19 (31.1%) |
Technology Access in Greenville CDP Greene County
Computing Device Access in Greenville CDP Greene County
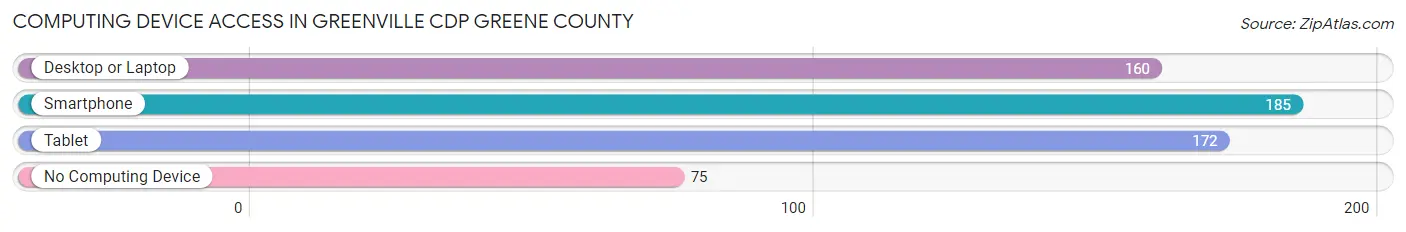
| Device Type | # Households | % Households |
| Desktop or Laptop | 160 | 57.8% |
| Smartphone | 185 | 66.8% |
| Tablet | 172 | 62.1% |
| No Computing Device | 75 | 27.1% |
| Total | 277 | 100.0% |
Internet Access in Greenville CDP Greene County
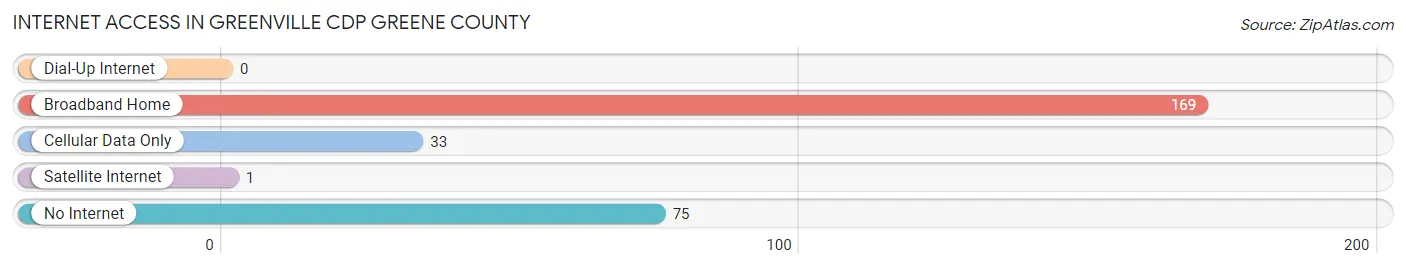
| Internet Type | # Households | % Households |
| Dial-Up Internet | 0 | 0.0% |
| Broadband Home | 169 | 61.0% |
| Cellular Data Only | 33 | 11.9% |
| Satellite Internet | 1 | 0.4% |
| No Internet | 75 | 27.1% |
| Total | 277 | 100.0% |
Greenville CDP Greene County Summary
Greenville Cdp is a census-designated place (CDP) located in Greene County, New York. It is situated in the town of Coxsackie, and is part of the Albany-Schenectady-Troy Metropolitan Statistical Area. As of the 2010 census, the population of Greenville Cdp was 1,845.
Geography
Greenville Cdp is located at 42°19'25" North, 73°45'45" West (42.323861, -73.762445). It has an area of 2.3 square miles, all of which is land. The terrain is mostly flat, with some rolling hills. The highest point in the CDP is 690 feet above sea level.
Climate
Greenville Cdp has a humid continental climate, with cold, snowy winters and warm, humid summers. The average annual temperature is 46°F, and the average annual precipitation is 43 inches.
Demographics
As of the 2010 census, there were 1,845 people, 690 households, and 486 families residing in the CDP. The population density was 803.9 people per square mile. The racial makeup of the CDP was 94.2% White, 2.2% African American, 0.3% Native American, 0.7% Asian, 0.1% Pacific Islander, 0.9% from other races, and 1.6% from two or more races. Hispanic or Latino of any race were 3.2% of the population.
There were 690 households, out of which 33.3% had children under the age of 18 living with them, 51.6% were married couples living together, 11.9% had a female householder with no husband present, and 30.3% were non-families. 24.3% of all households were made up of individuals, and 9.4% had someone living alone who was 65 years of age or older. The average household size was 2.67 and the average family size was 3.17.
The median age in the CDP was 38.2 years. 24.7% of residents were under the age of 18; 8.2% were between the ages of 18 and 24; 25.7% were from 25 to 44; 28.2% were from 45 to 64; and 13.2% were 65 years of age or older. The gender makeup of the CDP was 49.2% male and 50.8% female.
Economy
Greenville Cdp is primarily a residential community, with most of its residents commuting to nearby cities for work. The largest employers in the CDP are the Coxsackie-Athens Central School District, Greene County, and the Greene County Department of Social Services. Other major employers include the Greene County Sheriff's Office, Greene County Department of Public Works, and Greene County Department of Health.
The median household income in Greenville Cdp was $50,938 in 2018, and the median family income was $60,938. The per capita income was $25,938. About 8.2% of families and 10.2% of the population were below the poverty line, including 14.2% of those under age 18 and 5.2% of those age 65 or over.
Conclusion
Greenville Cdp is a census-designated place located in Greene County, New York. It is situated in the town of Coxsackie, and is part of the Albany-Schenectady-Troy Metropolitan Statistical Area. As of the 2010 census, the population of Greenville Cdp was 1,845. The CDP has a humid continental climate, with cold, snowy winters and warm, humid summers. The racial makeup of the CDP was 94.2% White, 2.2% African American, 0.3% Native American, 0.7% Asian, 0.1% Pacific Islander, 0.9% from other races, and 1.6% from two or more races. The largest employers in the CDP are the Coxsackie-Athens Central School District, Greene County, and the Greene County Department of Social Services. The median household income in Greenville Cdp was $50,938 in 2018, and the median family income was $60,938.
Common Questions
What is Per Capita Income in Greenville CDP Greene County?
Per Capita income in Greenville CDP Greene County is $29,897.
What is the Median Family Income in Greenville CDP Greene County?
Median Family Income in Greenville CDP Greene County is $96,250.
What is Inequality or Gini Index in Greenville CDP Greene County?
Inequality or Gini Index in Greenville CDP Greene County is 0.39.
What is the Total Population of Greenville CDP Greene County?
Total Population of Greenville CDP Greene County is 746.
What is the Total Male Population of Greenville CDP Greene County?
Total Male Population of Greenville CDP Greene County is 408.
What is the Total Female Population of Greenville CDP Greene County?
Total Female Population of Greenville CDP Greene County is 338.
What is the Ratio of Males per 100 Females in Greenville CDP Greene County?
There are 120.71 Males per 100 Females in Greenville CDP Greene County.
What is the Ratio of Females per 100 Males in Greenville CDP Greene County?
There are 82.84 Females per 100 Males in Greenville CDP Greene County.
What is the Median Population Age in Greenville CDP Greene County?
Median Population Age in Greenville CDP Greene County is 49.9 Years.
What is the Average Family Size in Greenville CDP Greene County
Average Family Size in Greenville CDP Greene County is 2.5 People.
What is the Average Household Size in Greenville CDP Greene County
Average Household Size in Greenville CDP Greene County is 2.7 People.
How Large is the Labor Force in Greenville CDP Greene County?
There are 245 People in the Labor Forcein in Greenville CDP Greene County.
What is the Percentage of People in the Labor Force in Greenville CDP Greene County?
47.4% of People are in the Labor Force in Greenville CDP Greene County.