Shirley, MA Map & Demographics
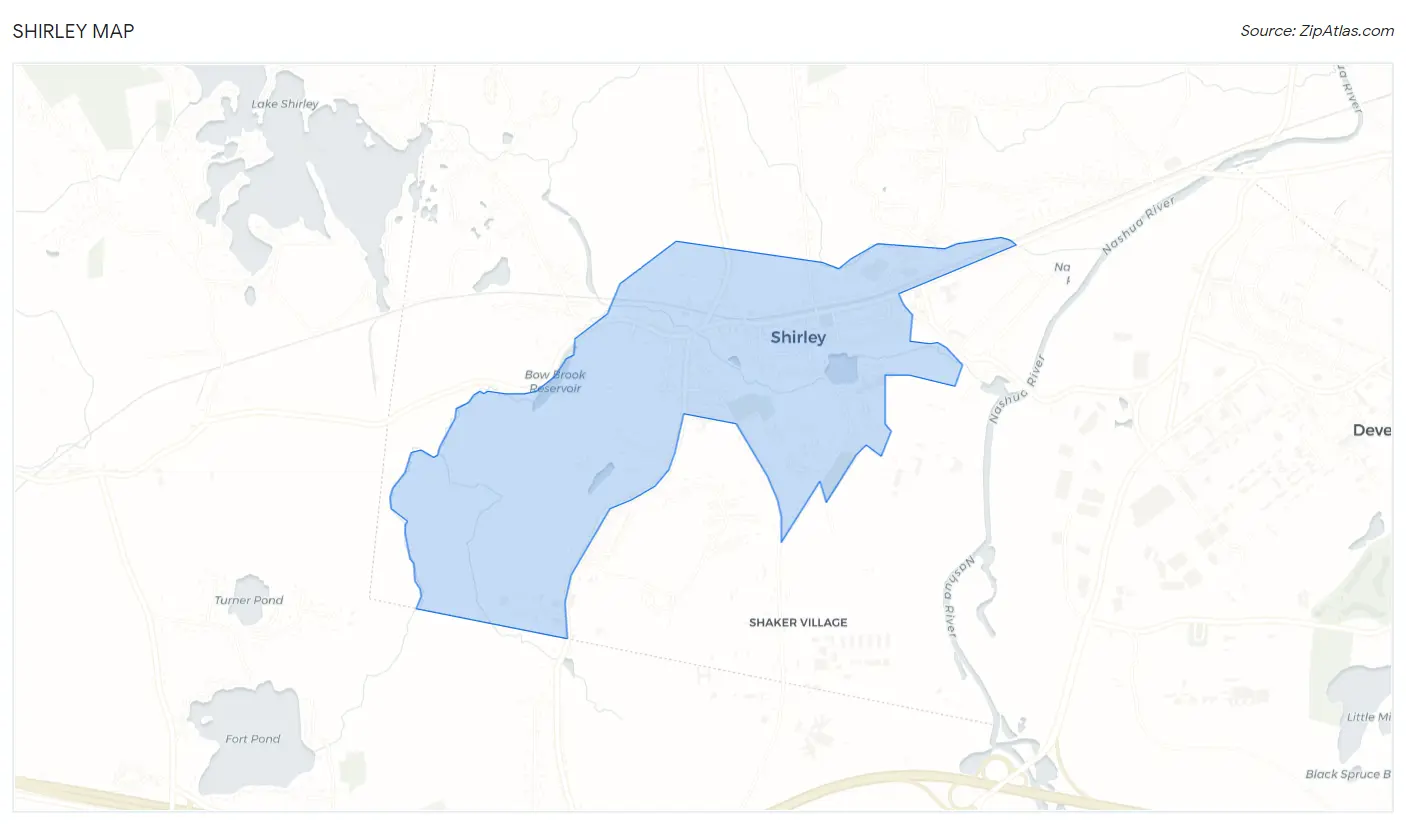
Shirley Map
Shirley Overview
$40,744
PER CAPITA INCOME
$125,568
AVG FAMILY INCOME
$85,119
AVG HOUSEHOLD INCOME
8.4%
WAGE / INCOME GAP [ % ]
91.6¢/ $1
WAGE / INCOME GAP [ $ ]
0.37
INEQUALITY / GINI INDEX
1,359
TOTAL POPULATION
728
MALE POPULATION
631
FEMALE POPULATION
115.37
MALES / 100 FEMALES
86.68
FEMALES / 100 MALES
53.1
MEDIAN AGE
2.8
AVG FAMILY SIZE
1.9
AVG HOUSEHOLD SIZE
878
LABOR FORCE [ PEOPLE ]
72.6%
PERCENT IN LABOR FORCE
6.9%
UNEMPLOYMENT RATE
Shirley Zip Codes
Shirley Area Codes
Income in Shirley
Income Overview in Shirley
Per Capita Income in Shirley is $40,744, while median incomes of families and households are $125,568 and $85,119 respectively.
| Characteristic | Number | Measure |
| Per Capita Income | 1,359 | $40,744 |
| Median Family Income | 338 | $125,568 |
| Mean Family Income | 338 | $122,902 |
| Median Household Income | 700 | $85,119 |
| Mean Household Income | 700 | $77,901 |
| Income Deficit | 338 | $0 |
| Wage / Income Gap (%) | 1,359 | 8.45% |
| Wage / Income Gap ($) | 1,359 | 91.55¢ per $1 |
| Gini / Inequality Index | 1,359 | 0.37 |
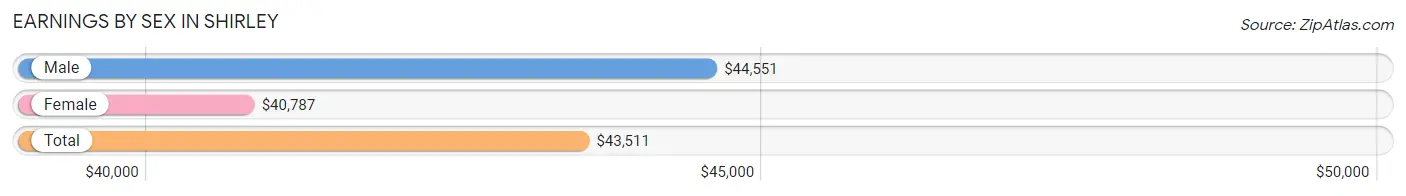
Earnings by Sex in Shirley
Average Earnings in Shirley are $43,511, $44,551 for men and $40,787 for women, a difference of 8.5%.
| Sex | Number | Average Earnings |
| Male | 488 (54.9%) | $44,551 |
| Female | 400 (45.1%) | $40,787 |
| Total | 888 (100.0%) | $43,511 |
Earnings by Sex by Income Bracket in Shirley
The most common earnings brackets in Shirley are $40,000 to $44,999 for men (89 | 18.2%) and $45,000 to $49,999 for women (70 | 17.5%).
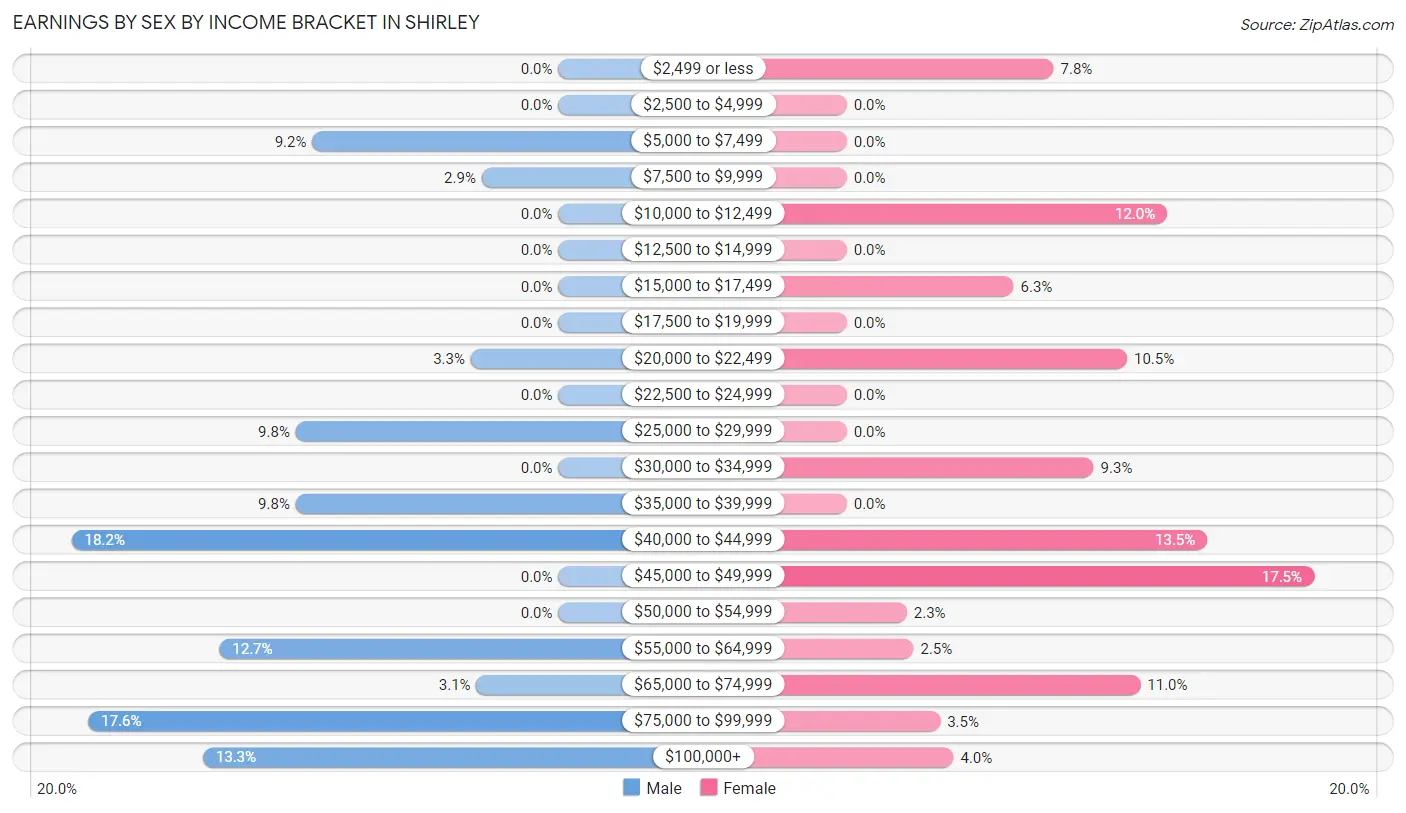
| Income | Male | Female |
| $2,499 or less | 0 (0.0%) | 31 (7.7%) |
| $2,500 to $4,999 | 0 (0.0%) | 0 (0.0%) |
| $5,000 to $7,499 | 45 (9.2%) | 0 (0.0%) |
| $7,500 to $9,999 | 14 (2.9%) | 0 (0.0%) |
| $10,000 to $12,499 | 0 (0.0%) | 48 (12.0%) |
| $12,500 to $14,999 | 0 (0.0%) | 0 (0.0%) |
| $15,000 to $17,499 | 0 (0.0%) | 25 (6.2%) |
| $17,500 to $19,999 | 0 (0.0%) | 0 (0.0%) |
| $20,000 to $22,499 | 16 (3.3%) | 42 (10.5%) |
| $22,500 to $24,999 | 0 (0.0%) | 0 (0.0%) |
| $25,000 to $29,999 | 48 (9.8%) | 0 (0.0%) |
| $30,000 to $34,999 | 0 (0.0%) | 37 (9.2%) |
| $35,000 to $39,999 | 48 (9.8%) | 0 (0.0%) |
| $40,000 to $44,999 | 89 (18.2%) | 54 (13.5%) |
| $45,000 to $49,999 | 0 (0.0%) | 70 (17.5%) |
| $50,000 to $54,999 | 0 (0.0%) | 9 (2.2%) |
| $55,000 to $64,999 | 62 (12.7%) | 10 (2.5%) |
| $65,000 to $74,999 | 15 (3.1%) | 44 (11.0%) |
| $75,000 to $99,999 | 86 (17.6%) | 14 (3.5%) |
| $100,000+ | 65 (13.3%) | 16 (4.0%) |
| Total | 488 (100.0%) | 400 (100.0%) |
Earnings by Sex by Educational Attainment in Shirley
Average earnings in Shirley are $44,747 for men and $41,181 for women, a difference of 8.0%. Men with an educational attainment of college or associate's degree enjoy the highest average annual earnings of $91,915, while those with bachelor's degree education earn the least with $42,971. Women with an educational attainment of graduate degree earn the most with the average annual earnings of $74,318, while those with high school diploma education have the smallest earnings of $34,054.

| Educational Attainment | Male Income | Female Income |
| Less than High School | - | - |
| High School Diploma | $44,152 | $34,054 |
| College or Associate's Degree | $91,915 | $40,995 |
| Bachelor's Degree | $42,971 | $0 |
| Graduate Degree | - | - |
| Total | $44,747 | $41,181 |
Family Income in Shirley
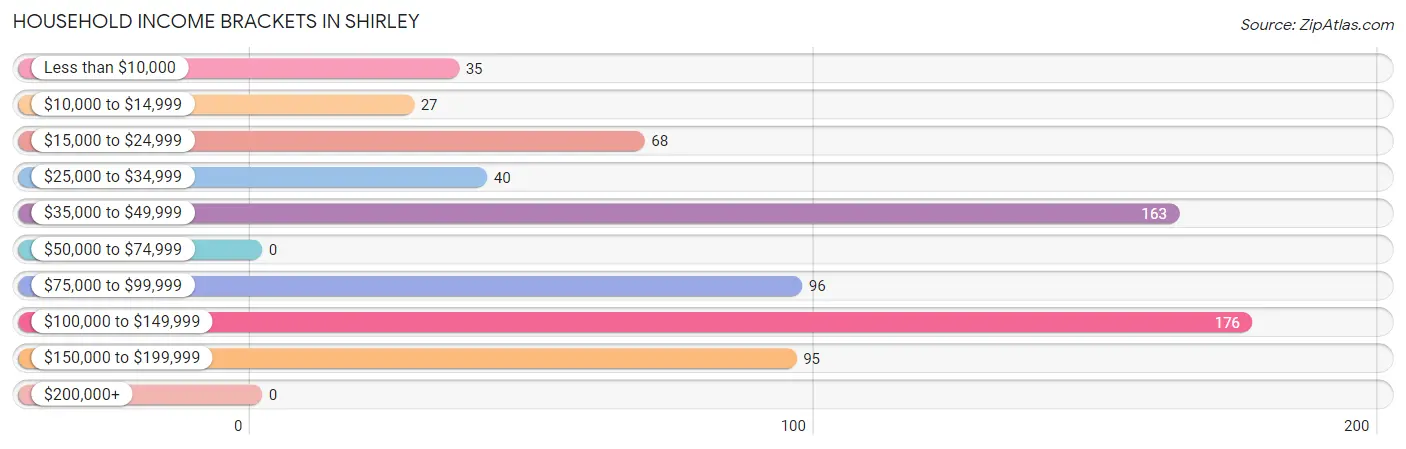
Family Income Brackets in Shirley
According to the Shirley family income data, there are 176 families falling into the $100,000 to $149,999 income range, which is the most common income bracket and makes up 52.1% of all families.
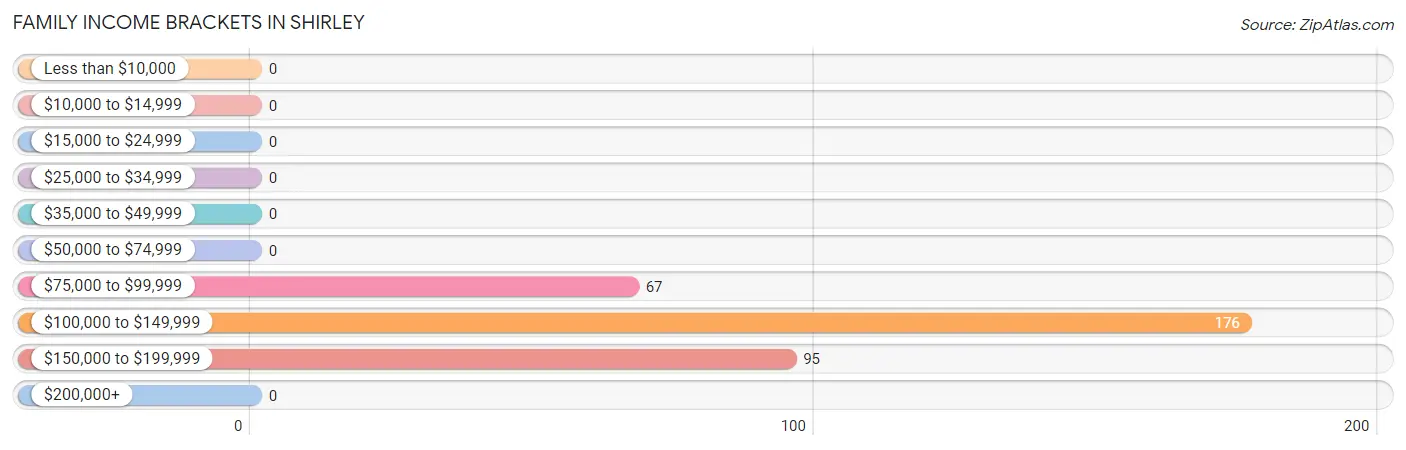
| Income Bracket | # Families | % Families |
| Less than $10,000 | 0 | 0.0% |
| $10,000 to $14,999 | 0 | 0.0% |
| $15,000 to $24,999 | 0 | 0.0% |
| $25,000 to $34,999 | 0 | 0.0% |
| $35,000 to $49,999 | 0 | 0.0% |
| $50,000 to $74,999 | 0 | 0.0% |
| $75,000 to $99,999 | 67 | 19.8% |
| $100,000 to $149,999 | 176 | 52.1% |
| $150,000 to $199,999 | 95 | 28.1% |
| $200,000+ | 0 | 0.0% |
Family Income by Famaliy Size in Shirley
3-person families (107 | 31.7%) account for the highest median family income in Shirley with $125,369 per family, while 2-person families (176 | 52.1%) have the highest median income of $50,584 per family member.
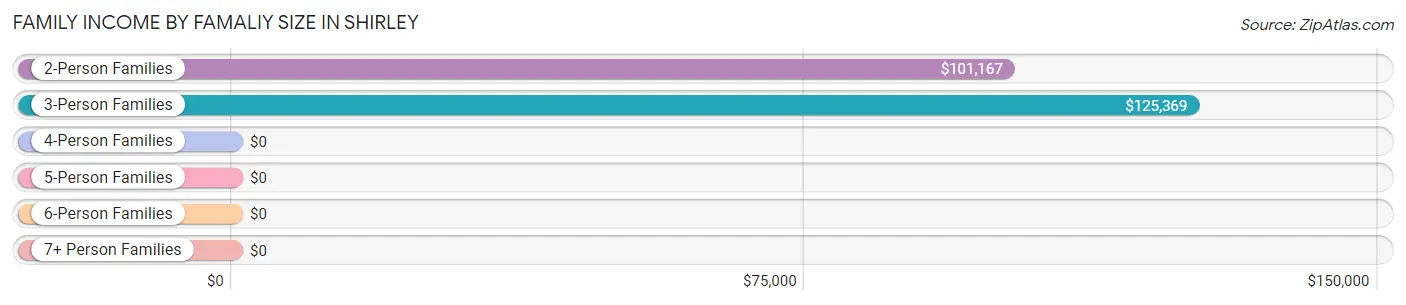
| Income Bracket | # Families | Median Income |
| 2-Person Families | 176 (52.1%) | $101,167 |
| 3-Person Families | 107 (31.7%) | $125,369 |
| 4-Person Families | 29 (8.6%) | $0 |
| 5-Person Families | 26 (7.7%) | $0 |
| 6-Person Families | 0 (0.0%) | $0 |
| 7+ Person Families | 0 (0.0%) | $0 |
| Total | 338 (100.0%) | $125,568 |
Family Income by Number of Earners in Shirley
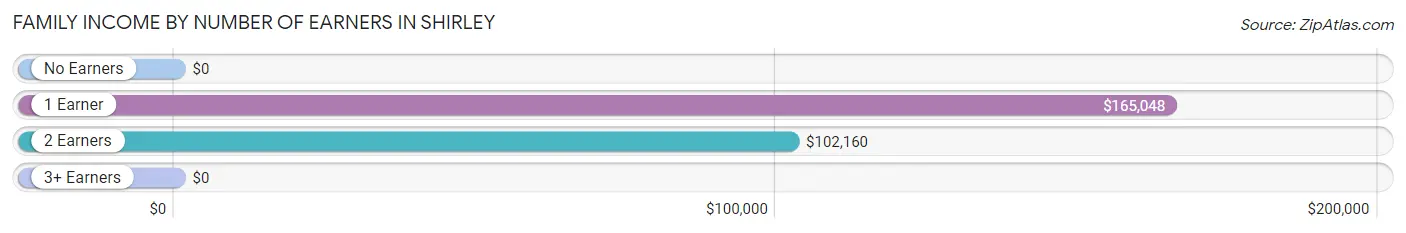
| Number of Earners | # Families | Median Income |
| No Earners | 0 (0.0%) | $0 |
| 1 Earner | 51 (15.1%) | $165,048 |
| 2 Earners | 273 (80.8%) | $102,160 |
| 3+ Earners | 14 (4.1%) | $0 |
| Total | 338 (100.0%) | $125,568 |
Household Income in Shirley
Household Income Brackets in Shirley
With 176 households falling in the category, the $100,000 to $149,999 income range is the most frequent in Shirley, accounting for 25.1% of all households.
| Income Bracket | # Households | % Households |
| Less than $10,000 | 35 | 5.0% |
| $10,000 to $14,999 | 27 | 3.9% |
| $15,000 to $24,999 | 68 | 9.7% |
| $25,000 to $34,999 | 40 | 5.7% |
| $35,000 to $49,999 | 163 | 23.3% |
| $50,000 to $74,999 | 0 | 0.0% |
| $75,000 to $99,999 | 96 | 13.7% |
| $100,000 to $149,999 | 176 | 25.1% |
| $150,000 to $199,999 | 95 | 13.6% |
| $200,000+ | 0 | 0.0% |
Household Income by Householder Age in Shirley
The median household income in Shirley is $85,119, with the highest median household income of $101,915 found in the 25 to 44 years age bracket for the primary householder. A total of 180 households (25.7%) fall into this category.
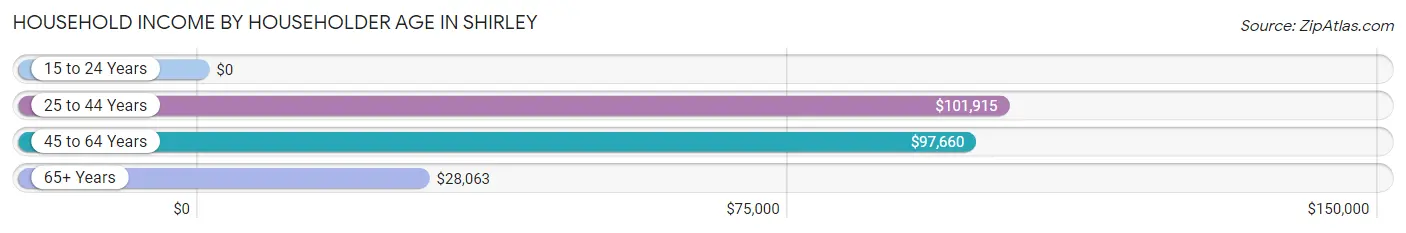
| Income Bracket | # Households | Median Income |
| 15 to 24 Years | 0 (0.0%) | $0 |
| 25 to 44 Years | 180 (25.7%) | $101,915 |
| 45 to 64 Years | 301 (43.0%) | $97,660 |
| 65+ Years | 219 (31.3%) | $28,063 |
| Total | 700 (100.0%) | $85,119 |
Poverty in Shirley
Income Below Poverty by Sex and Age in Shirley
With 6.2% poverty level for males and 2.7% for females among the residents of Shirley, 55 to 64 year old males and 75 year old and over females are the most vulnerable to poverty, with 45 males (17.3%) and 17 females (13.6%) in their respective age groups living below the poverty level.
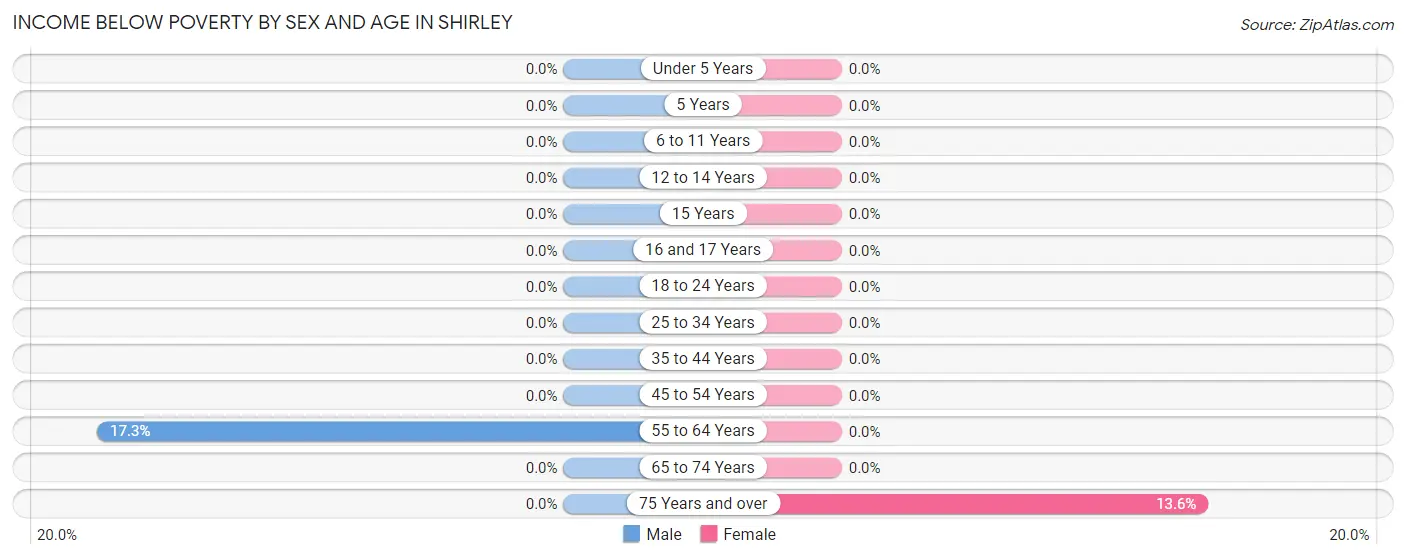
| Age Bracket | Male | Female |
| Under 5 Years | 0 (0.0%) | 0 (0.0%) |
| 5 Years | 0 (0.0%) | 0 (0.0%) |
| 6 to 11 Years | 0 (0.0%) | 0 (0.0%) |
| 12 to 14 Years | 0 (0.0%) | 0 (0.0%) |
| 15 Years | 0 (0.0%) | 0 (0.0%) |
| 16 and 17 Years | 0 (0.0%) | 0 (0.0%) |
| 18 to 24 Years | 0 (0.0%) | 0 (0.0%) |
| 25 to 34 Years | 0 (0.0%) | 0 (0.0%) |
| 35 to 44 Years | 0 (0.0%) | 0 (0.0%) |
| 45 to 54 Years | 0 (0.0%) | 0 (0.0%) |
| 55 to 64 Years | 45 (17.3%) | 0 (0.0%) |
| 65 to 74 Years | 0 (0.0%) | 0 (0.0%) |
| 75 Years and over | 0 (0.0%) | 17 (13.6%) |
| Total | 45 (6.2%) | 17 (2.7%) |
Income Above Poverty by Sex and Age in Shirley
According to the poverty statistics in Shirley, males aged under 5 years and females aged 6 to 11 years are the age groups that are most secure financially, with 100.0% of males and 100.0% of females in these age groups living above the poverty line.
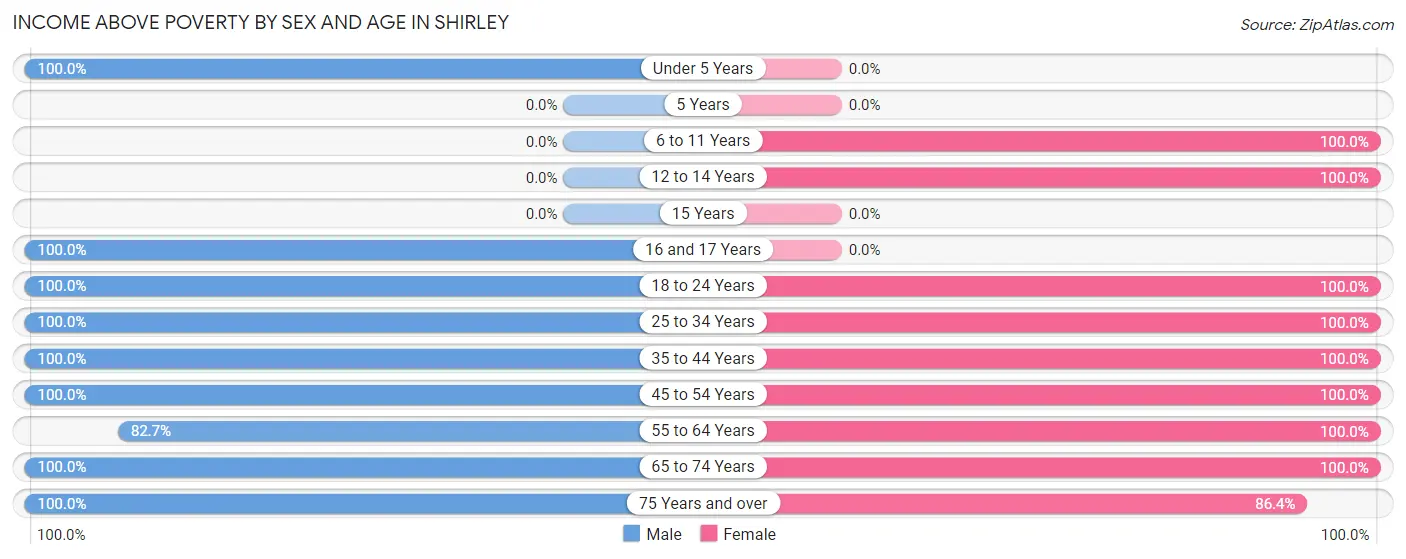
| Age Bracket | Male | Female |
| Under 5 Years | 97 (100.0%) | 0 (0.0%) |
| 5 Years | 0 (0.0%) | 0 (0.0%) |
| 6 to 11 Years | 0 (0.0%) | 26 (100.0%) |
| 12 to 14 Years | 0 (0.0%) | 26 (100.0%) |
| 15 Years | 0 (0.0%) | 0 (0.0%) |
| 16 and 17 Years | 27 (100.0%) | 0 (0.0%) |
| 18 to 24 Years | 14 (100.0%) | 17 (100.0%) |
| 25 to 34 Years | 70 (100.0%) | 14 (100.0%) |
| 35 to 44 Years | 73 (100.0%) | 180 (100.0%) |
| 45 to 54 Years | 94 (100.0%) | 81 (100.0%) |
| 55 to 64 Years | 215 (82.7%) | 131 (100.0%) |
| 65 to 74 Years | 79 (100.0%) | 31 (100.0%) |
| 75 Years and over | 14 (100.0%) | 108 (86.4%) |
| Total | 683 (93.8%) | 614 (97.3%) |
Income Below Poverty Among Married-Couple Families in Shirley
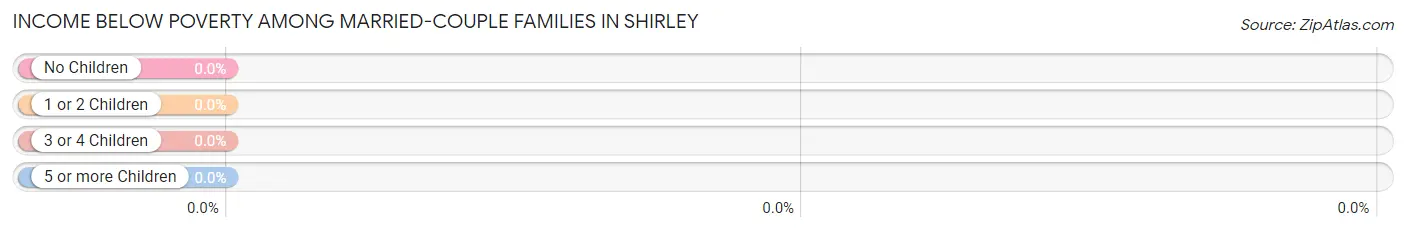
| Children | Above Poverty | Below Poverty |
| No Children | 221 (100.0%) | 0 (0.0%) |
| 1 or 2 Children | 91 (100.0%) | 0 (0.0%) |
| 3 or 4 Children | 26 (100.0%) | 0 (0.0%) |
| 5 or more Children | 0 (0.0%) | 0 (0.0%) |
| Total | 338 (100.0%) | 0 (0.0%) |
Income Below Poverty Among Single-Parent Households in Shirley
| Children | Single Father | Single Mother |
| No Children | 0 (0.0%) | 0 (0.0%) |
| 1 or 2 Children | 0 (0.0%) | 0 (0.0%) |
| 3 or 4 Children | 0 (0.0%) | 0 (0.0%) |
| 5 or more Children | 0 (0.0%) | 0 (0.0%) |
| Total | 0 (0.0%) | 0 (0.0%) |
Income Below Poverty Among Married-Couple vs Single-Parent Households in Shirley
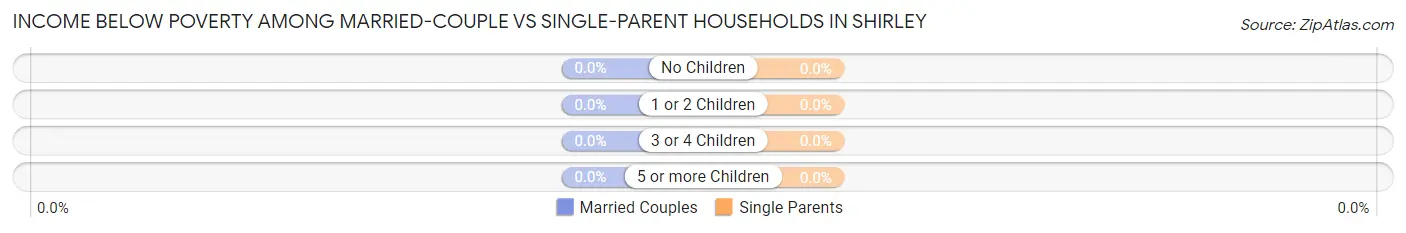
| Children | Married-Couple Families | Single-Parent Households |
| No Children | 0 (0.0%) | 0 (0.0%) |
| 1 or 2 Children | 0 (0.0%) | 0 (0.0%) |
| 3 or 4 Children | 0 (0.0%) | 0 (0.0%) |
| 5 or more Children | 0 (0.0%) | 0 (0.0%) |
| Total | 0 (0.0%) | 0 (0.0%) |
Race in Shirley
The most populous races in Shirley are White / Caucasian (1,298 | 95.5%), Hispanic or Latino (109 | 8.0%), and Black / African American (61 | 4.5%).
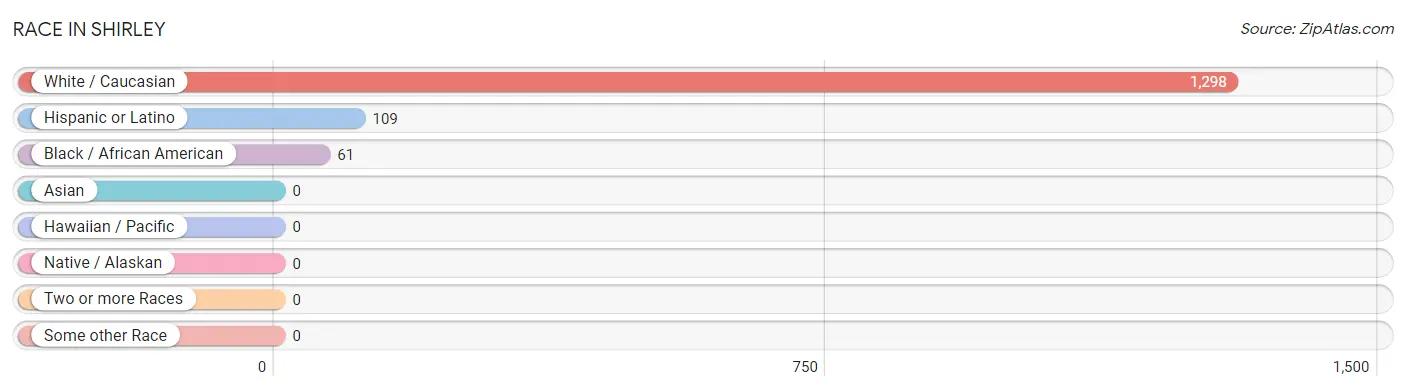
| Race | # Population | % Population |
| Asian | 0 | 0.0% |
| Black / African American | 61 | 4.5% |
| Hawaiian / Pacific | 0 | 0.0% |
| Hispanic or Latino | 109 | 8.0% |
| Native / Alaskan | 0 | 0.0% |
| White / Caucasian | 1,298 | 95.5% |
| Two or more Races | 0 | 0.0% |
| Some other Race | 0 | 0.0% |
| Total | 1,359 | 100.0% |
Ancestry in Shirley
The most populous ancestries reported in Shirley are Irish (400 | 29.4%), Scottish (240 | 17.7%), English (196 | 14.4%), American (193 | 14.2%), and Italian (166 | 12.2%), together accounting for 87.9% of all Shirley residents.
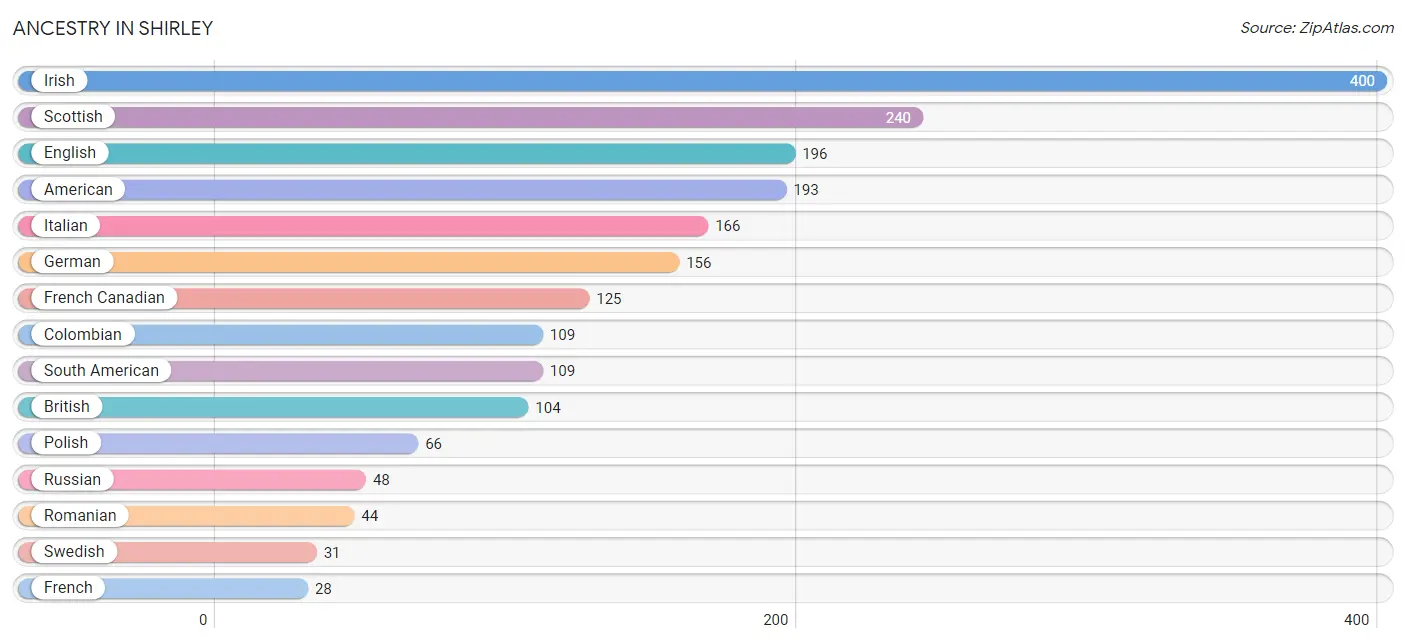
| Ancestry | # Population | % Population |
| American | 193 | 14.2% |
| British | 104 | 7.6% |
| Colombian | 109 | 8.0% |
| English | 196 | 14.4% |
| French | 28 | 2.1% |
| French Canadian | 125 | 9.2% |
| German | 156 | 11.5% |
| Irish | 400 | 29.4% |
| Italian | 166 | 12.2% |
| Lithuanian | 16 | 1.2% |
| Polish | 66 | 4.9% |
| Romanian | 44 | 3.2% |
| Russian | 48 | 3.5% |
| Scottish | 240 | 17.7% |
| South American | 109 | 8.0% |
| Swedish | 31 | 2.3% | View All 16 Rows |
Immigrants in Shirley
The most numerous immigrant groups reported in Shirley came from Colombia (61 | 4.5%), Latin America (61 | 4.5%), South America (61 | 4.5%), Canada (46 | 3.4%), and Europe (25 | 1.8%), together accounting for 18.7% of all Shirley residents.
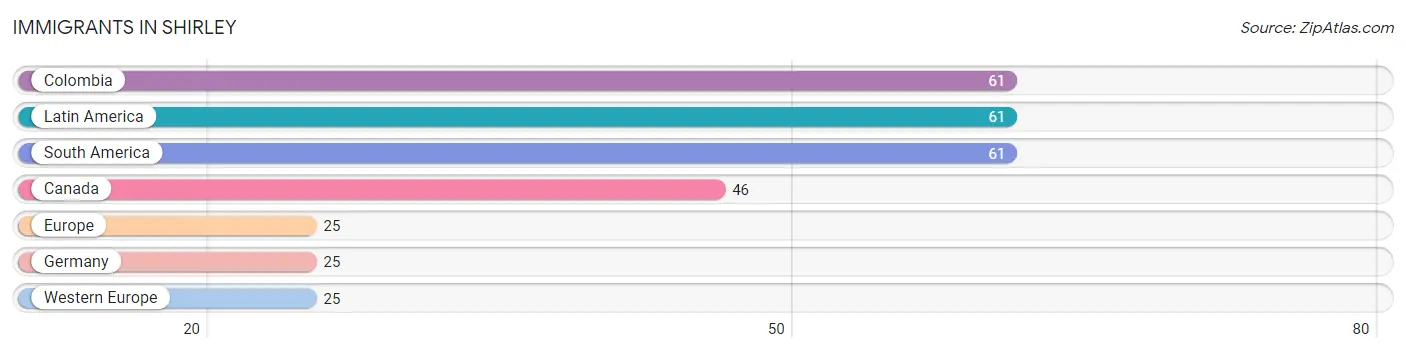
| Immigration Origin | # Population | % Population |
| Canada | 46 | 3.4% |
| Colombia | 61 | 4.5% |
| Europe | 25 | 1.8% |
| Germany | 25 | 1.8% |
| Latin America | 61 | 4.5% |
| South America | 61 | 4.5% |
| Western Europe | 25 | 1.8% | View All 7 Rows |
Sex and Age in Shirley
Sex and Age in Shirley
The most populous age groups in Shirley are 60 to 64 Years (168 | 23.1%) for men and 35 to 39 Years (155 | 24.6%) for women.
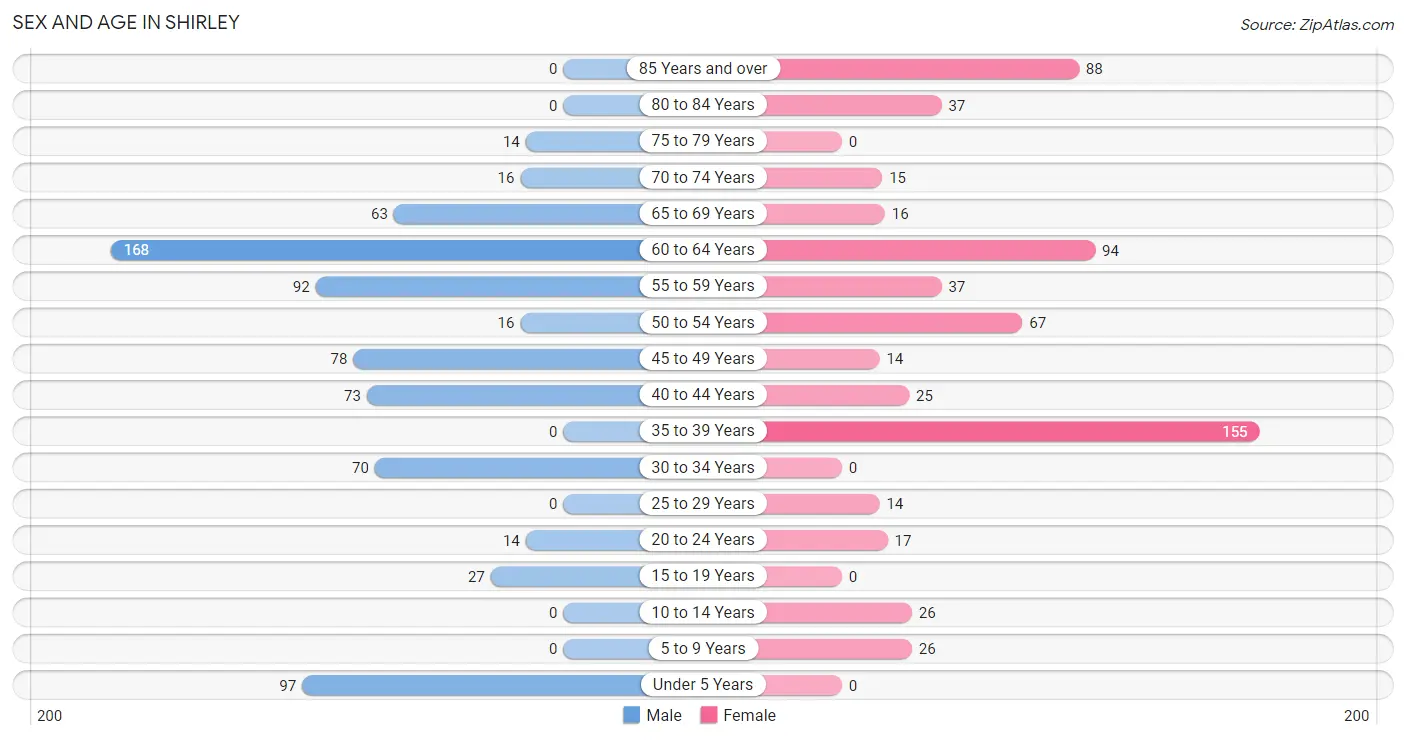
| Age Bracket | Male | Female |
| Under 5 Years | 97 (13.3%) | 0 (0.0%) |
| 5 to 9 Years | 0 (0.0%) | 26 (4.1%) |
| 10 to 14 Years | 0 (0.0%) | 26 (4.1%) |
| 15 to 19 Years | 27 (3.7%) | 0 (0.0%) |
| 20 to 24 Years | 14 (1.9%) | 17 (2.7%) |
| 25 to 29 Years | 0 (0.0%) | 14 (2.2%) |
| 30 to 34 Years | 70 (9.6%) | 0 (0.0%) |
| 35 to 39 Years | 0 (0.0%) | 155 (24.6%) |
| 40 to 44 Years | 73 (10.0%) | 25 (4.0%) |
| 45 to 49 Years | 78 (10.7%) | 14 (2.2%) |
| 50 to 54 Years | 16 (2.2%) | 67 (10.6%) |
| 55 to 59 Years | 92 (12.6%) | 37 (5.9%) |
| 60 to 64 Years | 168 (23.1%) | 94 (14.9%) |
| 65 to 69 Years | 63 (8.6%) | 16 (2.5%) |
| 70 to 74 Years | 16 (2.2%) | 15 (2.4%) |
| 75 to 79 Years | 14 (1.9%) | 0 (0.0%) |
| 80 to 84 Years | 0 (0.0%) | 37 (5.9%) |
| 85 Years and over | 0 (0.0%) | 88 (14.0%) |
| Total | 728 (100.0%) | 631 (100.0%) |
Families and Households in Shirley
Median Family Size in Shirley
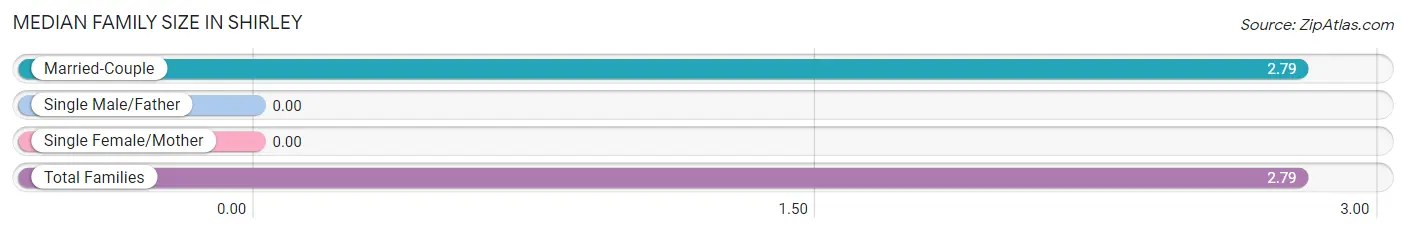
| Family Type | # Families | Family Size |
| Married-Couple | 338 (100.0%) | 2.79 |
| Single Male/Father | 0 (0.0%) | - |
| Single Female/Mother | 0 (0.0%) | - |
| Total Families | 338 (100.0%) | 2.79 |
Median Household Size in Shirley
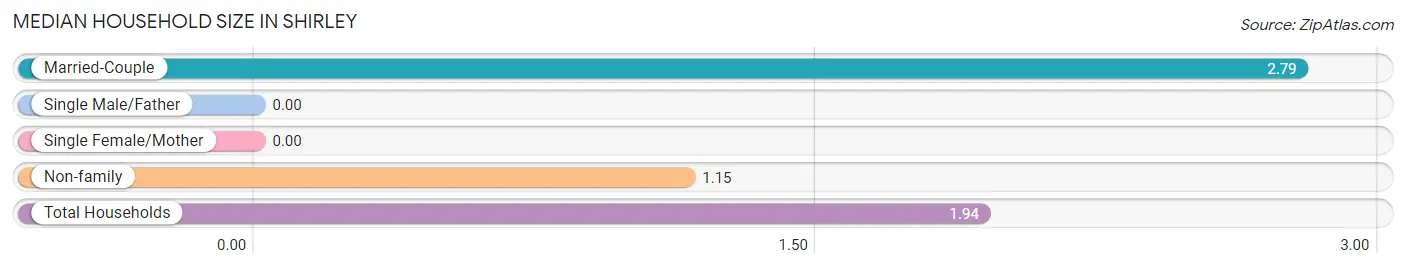
| Household Type | # Households | Household Size |
| Married-Couple | 338 (48.3%) | 2.79 |
| Single Male/Father | 0 (0.0%) | - |
| Single Female/Mother | 0 (0.0%) | - |
| Non-family | 362 (51.7%) | 1.15 |
| Total Households | 700 (100.0%) | 1.94 |
Household Size by Marriage Status in Shirley
Out of a total of 700 households in Shirley, 338 (48.3%) are family households, while 362 (51.7%) are nonfamily households. The most numerous type of family households are 2-person households, comprising 176, and the most common type of nonfamily households are 1-person households, comprising 333.
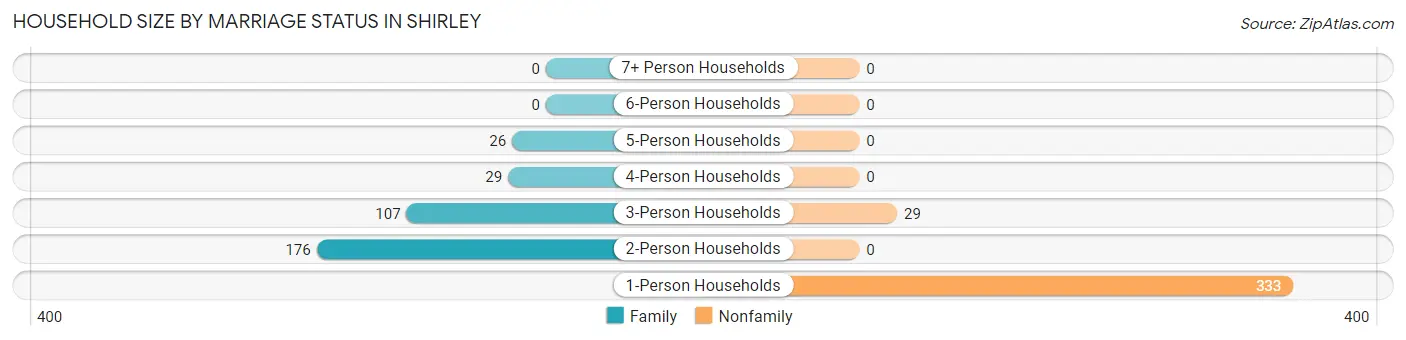
| Household Size | Family Households | Nonfamily Households |
| 1-Person Households | - | 333 (47.6%) |
| 2-Person Households | 176 (25.1%) | 0 (0.0%) |
| 3-Person Households | 107 (15.3%) | 29 (4.1%) |
| 4-Person Households | 29 (4.1%) | 0 (0.0%) |
| 5-Person Households | 26 (3.7%) | 0 (0.0%) |
| 6-Person Households | 0 (0.0%) | 0 (0.0%) |
| 7+ Person Households | 0 (0.0%) | 0 (0.0%) |
| Total | 338 (48.3%) | 362 (51.7%) |
Female Fertility in Shirley
Fertility by Age in Shirley
| Age Bracket | Women with Births | Births / 1,000 Women |
| 15 to 19 years | 0 (0.0%) | 0.0 |
| 20 to 34 years | 0 (0.0%) | 0.0 |
| 35 to 50 years | 0 (0.0%) | 0.0 |
| Total | 0 (0.0%) | 0.0 |
Fertility by Age by Marriage Status in Shirley
| Age Bracket | Married | Unmarried |
| 15 to 19 years | 0 (0.0%) | 0 (0.0%) |
| 20 to 34 years | 0 (0.0%) | 0 (0.0%) |
| 35 to 50 years | 0 (0.0%) | 0 (0.0%) |
| Total | 0 (0.0%) | 0 (0.0%) |
Fertility by Education in Shirley
| Educational Attainment | Women with Births | Births / 1,000 Women |
| Less than High School | 0 (0.0%) | 0.0 |
| High School Diploma | 0 (0.0%) | 0.0 |
| College or Associate's Degree | 0 (0.0%) | 0.0 |
| Bachelor's Degree | 0 (0.0%) | 0.0 |
| Graduate Degree | 0 (0.0%) | 0.0 |
| Total | 0 (0.0%) | 0.0 |
Fertility by Education by Marriage Status in Shirley
| Educational Attainment | Married | Unmarried |
| Less than High School | 0 (0.0%) | 0 (0.0%) |
| High School Diploma | 0 (0.0%) | 0 (0.0%) |
| College or Associate's Degree | 0 (0.0%) | 0 (0.0%) |
| Bachelor's Degree | 0 (0.0%) | 0 (0.0%) |
| Graduate Degree | 0 (0.0%) | 0 (0.0%) |
| Total | 0 (0.0%) | 0 (0.0%) |
Employment Characteristics in Shirley
Employment by Class of Employer in Shirley
Among the 817 employed individuals in Shirley, private company employees (397 | 48.6%), local government employees (215 | 26.3%), and not-for-profit organizations (125 | 15.3%) make up the most common classes of employment.
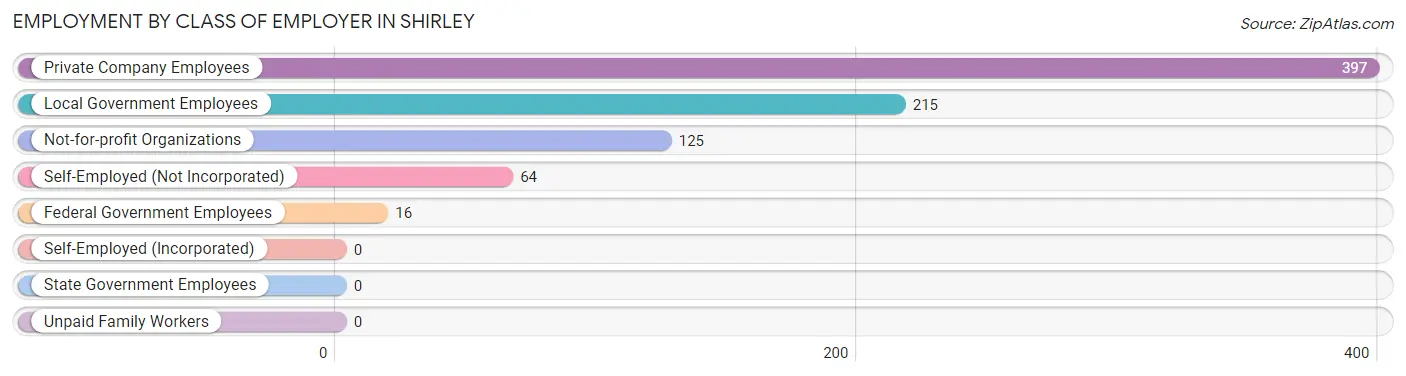
| Employer Class | # Employees | % Employees |
| Private Company Employees | 397 | 48.6% |
| Self-Employed (Incorporated) | 0 | 0.0% |
| Self-Employed (Not Incorporated) | 64 | 7.8% |
| Not-for-profit Organizations | 125 | 15.3% |
| Local Government Employees | 215 | 26.3% |
| State Government Employees | 0 | 0.0% |
| Federal Government Employees | 16 | 2.0% |
| Unpaid Family Workers | 0 | 0.0% |
| Total | 817 | 100.0% |
Employment Status by Age in Shirley
According to the labor force statistics for Shirley, out of the total population over 16 years of age (1,210), 72.6% or 878 individuals are in the labor force, with 6.9% or 61 of them unemployed. The age group with the highest labor force participation rate is 20 to 24 years, with 100.0% or 31 individuals in the labor force. Within the labor force, the 30 to 34 years age range has the highest percentage of unemployed individuals, with 87.1% or 61 of them being unemployed.
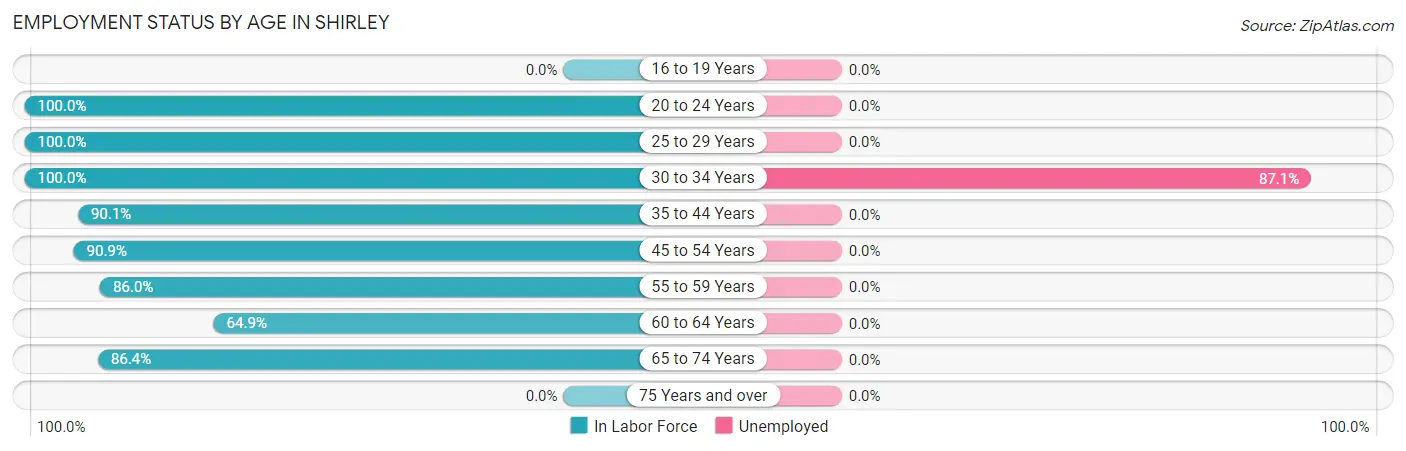
| Age Bracket | In Labor Force | Unemployed |
| 16 to 19 Years | 0 (0.0%) | 0 (0.0%) |
| 20 to 24 Years | 31 (100.0%) | 0 (0.0%) |
| 25 to 29 Years | 14 (100.0%) | 0 (0.0%) |
| 30 to 34 Years | 70 (100.0%) | 61 (87.1%) |
| 35 to 44 Years | 228 (90.1%) | 0 (0.0%) |
| 45 to 54 Years | 159 (90.9%) | 0 (0.0%) |
| 55 to 59 Years | 111 (86.0%) | 0 (0.0%) |
| 60 to 64 Years | 170 (64.9%) | 0 (0.0%) |
| 65 to 74 Years | 95 (86.4%) | 0 (0.0%) |
| 75 Years and over | 0 (0.0%) | 0 (0.0%) |
| Total | 878 (72.6%) | 61 (6.9%) |
Employment Status by Educational Attainment in Shirley
According to labor force statistics for Shirley, 83.3% of individuals (752) out of the total population between 25 and 64 years of age (903) are in the labor force, with 8.1% or 61 of them being unemployed. The group with the highest labor force participation rate are those with the educational attainment of college / associate degree, with 86.5% or 193 individuals in the labor force. Within the labor force, individuals with bachelor's degree or higher education have the highest percentage of unemployment, with 25.3% or 61 of them being unemployed.
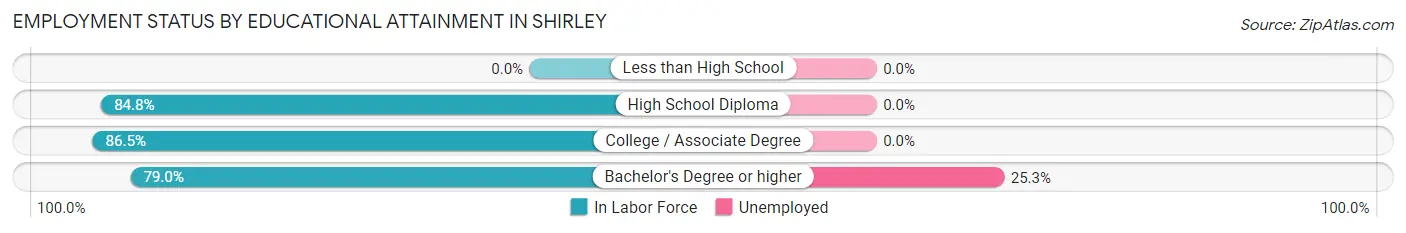
| Educational Attainment | In Labor Force | Unemployed |
| Less than High School | 0 (0.0%) | 0 (0.0%) |
| High School Diploma | 318 (84.8%) | 0 (0.0%) |
| College / Associate Degree | 193 (86.5%) | 0 (0.0%) |
| Bachelor's Degree or higher | 241 (79.0%) | 77 (25.3%) |
| Total | 752 (83.3%) | 73 (8.1%) |
Employment Occupations by Sex in Shirley
Management, Business, Science and Arts Occupations
The most common Management, Business, Science and Arts occupations in Shirley are Community & Social Service (186 | 22.8%), Management (132 | 16.2%), Arts, Media & Entertainment (95 | 11.6%), Education Instruction & Library (47 | 5.8%), and Education, Arts & Media (44 | 5.4%).
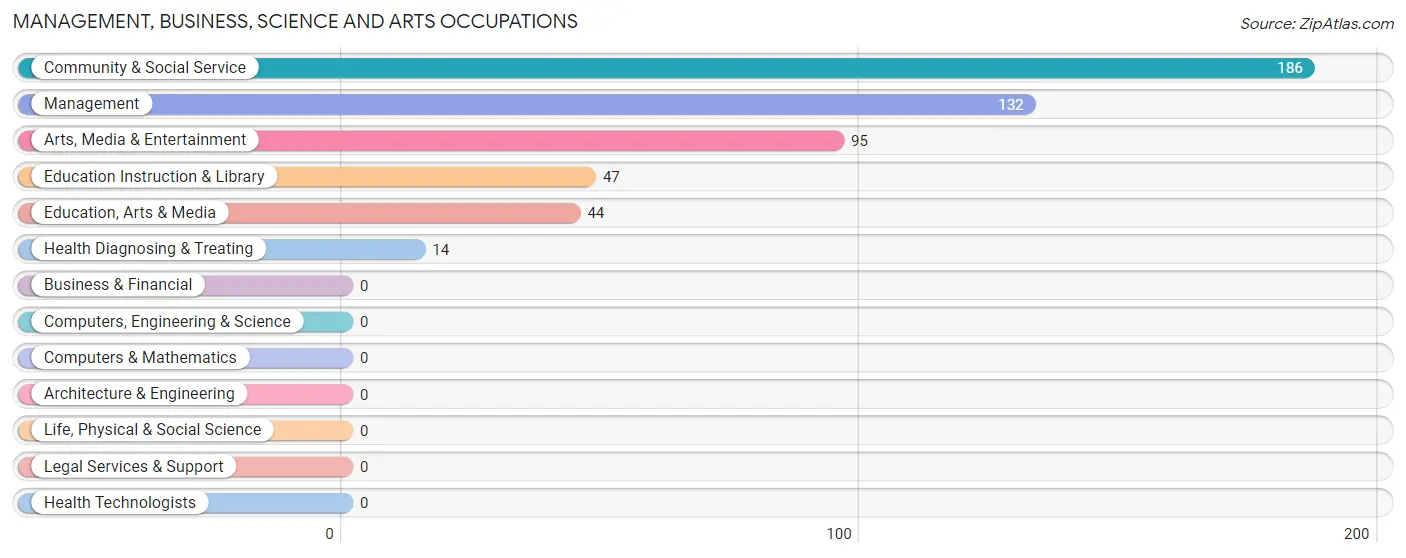
Management, Business, Science and Arts Occupations by Sex
Within the Management, Business, Science and Arts occupations in Shirley, the most male-oriented occupations are Management (59.9%), Arts, Media & Entertainment (49.5%), and Education Instruction & Library (34.0%), while the most female-oriented occupations are Education, Arts & Media (100.0%), Health Diagnosing & Treating (100.0%), and Community & Social Service (66.1%).
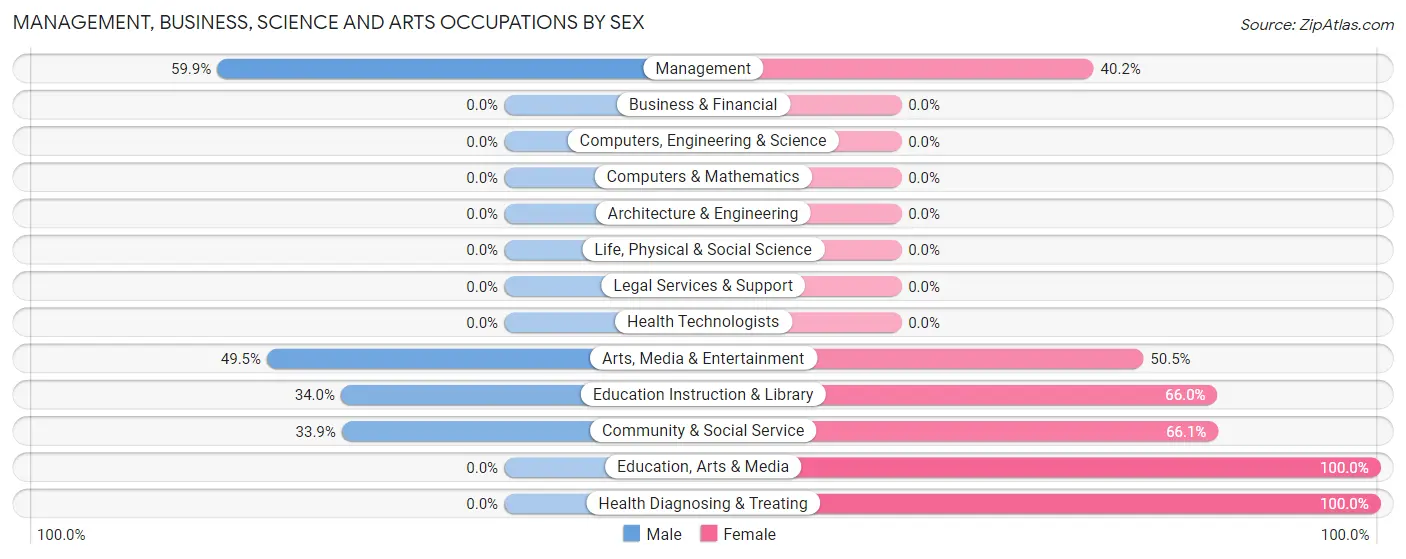
| Occupation | Male | Female |
| Management | 79 (59.9%) | 53 (40.2%) |
| Business & Financial | 0 (0.0%) | 0 (0.0%) |
| Computers, Engineering & Science | 0 (0.0%) | 0 (0.0%) |
| Computers & Mathematics | 0 (0.0%) | 0 (0.0%) |
| Architecture & Engineering | 0 (0.0%) | 0 (0.0%) |
| Life, Physical & Social Science | 0 (0.0%) | 0 (0.0%) |
| Community & Social Service | 63 (33.9%) | 123 (66.1%) |
| Education, Arts & Media | 0 (0.0%) | 44 (100.0%) |
| Legal Services & Support | 0 (0.0%) | 0 (0.0%) |
| Education Instruction & Library | 16 (34.0%) | 31 (66.0%) |
| Arts, Media & Entertainment | 47 (49.5%) | 48 (50.5%) |
| Health Diagnosing & Treating | 0 (0.0%) | 14 (100.0%) |
| Health Technologists | 0 (0.0%) | 0 (0.0%) |
| Total (Category) | 142 (42.8%) | 190 (57.2%) |
| Total (Overall) | 427 (52.3%) | 390 (47.7%) |
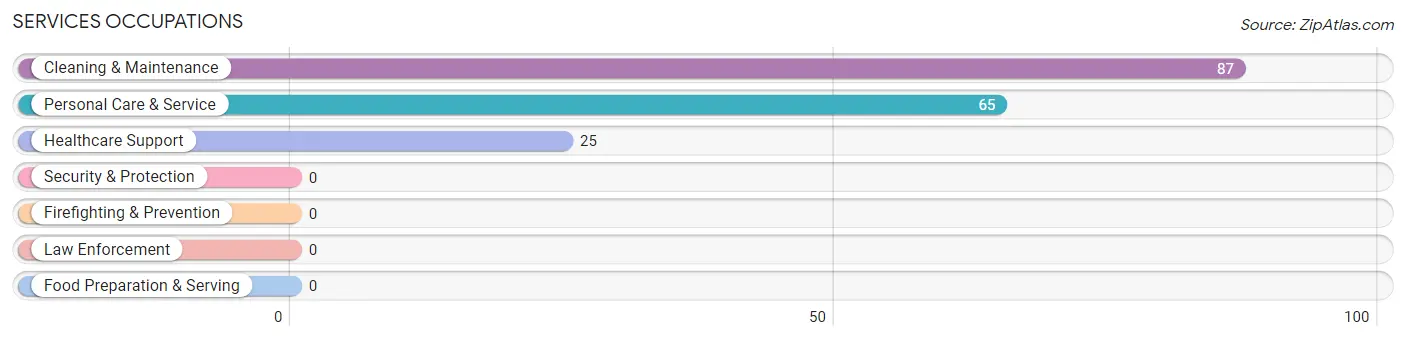
Services Occupations
The most common Services occupations in Shirley are Cleaning & Maintenance (87 | 10.6%), Personal Care & Service (65 | 8.0%), and Healthcare Support (25 | 3.1%).
Services Occupations by Sex
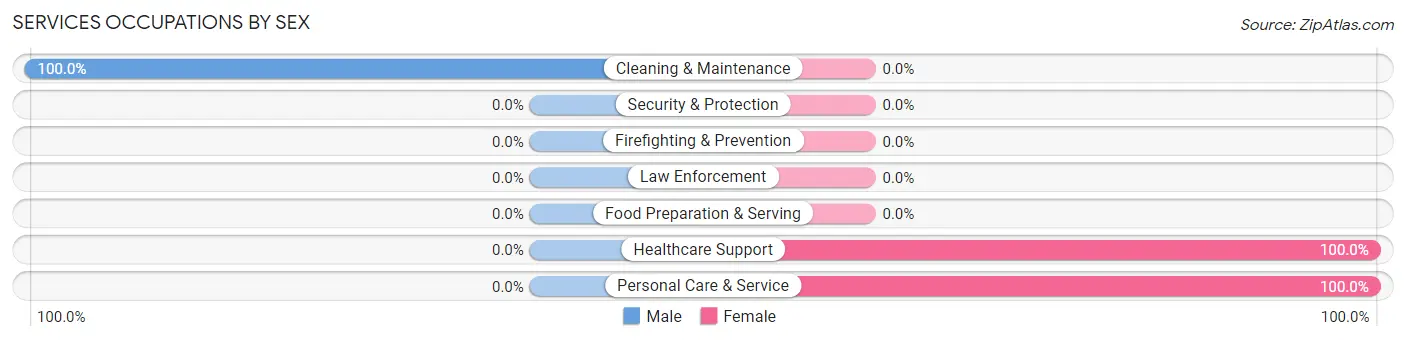
| Occupation | Male | Female |
| Healthcare Support | 0 (0.0%) | 25 (100.0%) |
| Security & Protection | 0 (0.0%) | 0 (0.0%) |
| Firefighting & Prevention | 0 (0.0%) | 0 (0.0%) |
| Law Enforcement | 0 (0.0%) | 0 (0.0%) |
| Food Preparation & Serving | 0 (0.0%) | 0 (0.0%) |
| Cleaning & Maintenance | 87 (100.0%) | 0 (0.0%) |
| Personal Care & Service | 0 (0.0%) | 65 (100.0%) |
| Total (Category) | 87 (49.1%) | 90 (50.8%) |
| Total (Overall) | 427 (52.3%) | 390 (47.7%) |
Sales and Office Occupations
The most common Sales and Office occupations in Shirley are , and Office & Administration (115 | 14.1%).
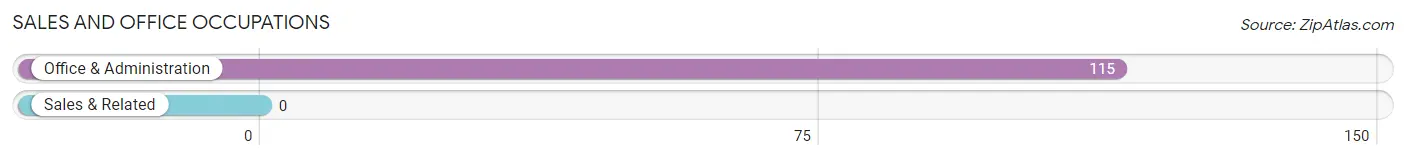
Sales and Office Occupations by Sex
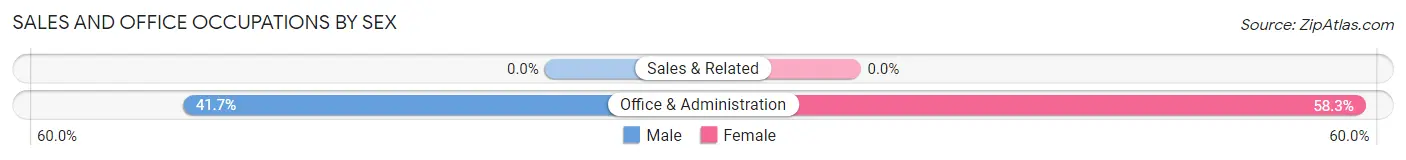
| Occupation | Male | Female |
| Sales & Related | 0 (0.0%) | 0 (0.0%) |
| Office & Administration | 48 (41.7%) | 67 (58.3%) |
| Total (Category) | 48 (41.7%) | 67 (58.3%) |
| Total (Overall) | 427 (52.3%) | 390 (47.7%) |
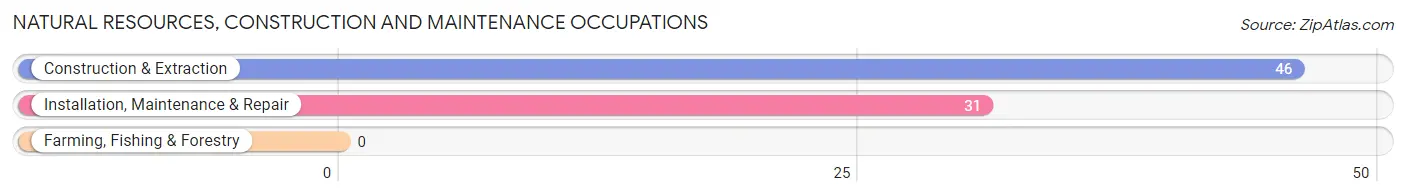
Natural Resources, Construction and Maintenance Occupations
The most common Natural Resources, Construction and Maintenance occupations in Shirley are Construction & Extraction (46 | 5.6%), and Installation, Maintenance & Repair (31 | 3.8%).
Natural Resources, Construction and Maintenance Occupations by Sex
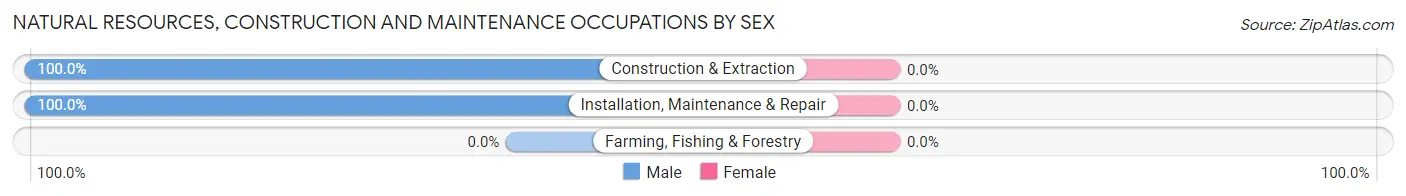
| Occupation | Male | Female |
| Farming, Fishing & Forestry | 0 (0.0%) | 0 (0.0%) |
| Construction & Extraction | 46 (100.0%) | 0 (0.0%) |
| Installation, Maintenance & Repair | 31 (100.0%) | 0 (0.0%) |
| Total (Category) | 77 (100.0%) | 0 (0.0%) |
| Total (Overall) | 427 (52.3%) | 390 (47.7%) |
Production, Transportation and Moving Occupations
The most common Production, Transportation and Moving occupations in Shirley are Production (68 | 8.3%), and Transportation (48 | 5.9%).
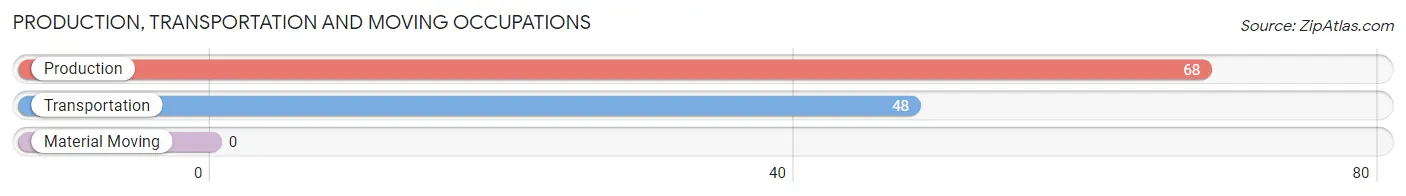
Production, Transportation and Moving Occupations by Sex
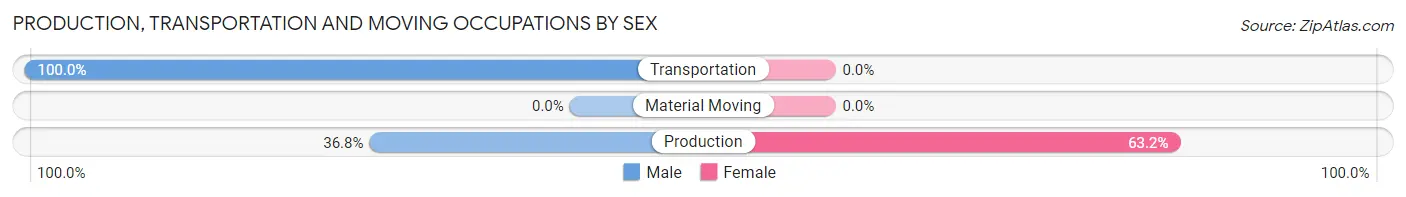
| Occupation | Male | Female |
| Production | 25 (36.8%) | 43 (63.2%) |
| Transportation | 48 (100.0%) | 0 (0.0%) |
| Material Moving | 0 (0.0%) | 0 (0.0%) |
| Total (Category) | 73 (62.9%) | 43 (37.1%) |
| Total (Overall) | 427 (52.3%) | 390 (47.7%) |
Employment Industries by Sex in Shirley
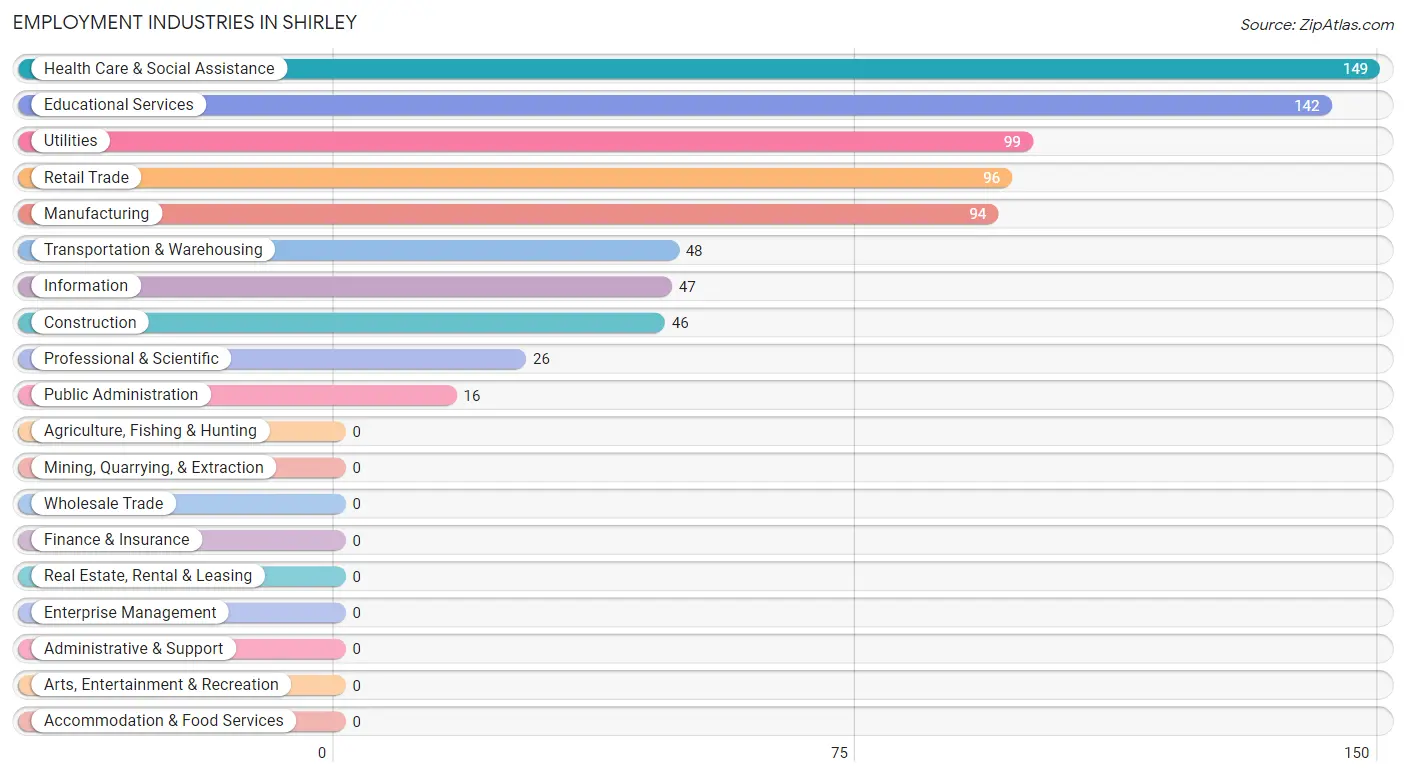
Employment Industries in Shirley
The major employment industries in Shirley include Health Care & Social Assistance (149 | 18.2%), Educational Services (142 | 17.4%), Utilities (99 | 12.1%), Retail Trade (96 | 11.7%), and Manufacturing (94 | 11.5%).
Employment Industries by Sex in Shirley
The Shirley industries that see more men than women are Construction (100.0%), Transportation & Warehousing (100.0%), and Information (100.0%), whereas the industries that tend to have a higher number of women are Health Care & Social Assistance (100.0%), Utilities (54.5%), and Educational Services (51.4%).
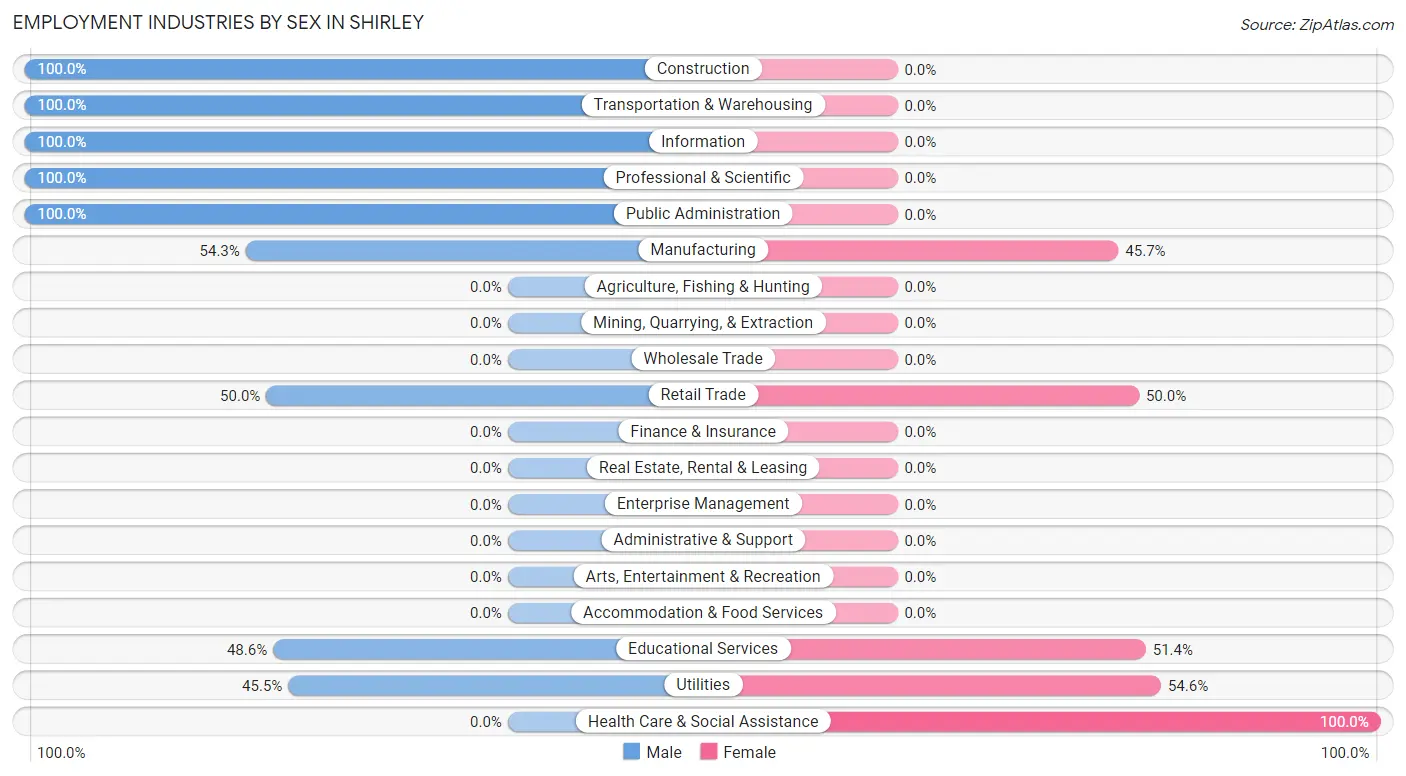
| Industry | Male | Female |
| Agriculture, Fishing & Hunting | 0 (0.0%) | 0 (0.0%) |
| Mining, Quarrying, & Extraction | 0 (0.0%) | 0 (0.0%) |
| Construction | 46 (100.0%) | 0 (0.0%) |
| Manufacturing | 51 (54.3%) | 43 (45.7%) |
| Wholesale Trade | 0 (0.0%) | 0 (0.0%) |
| Retail Trade | 48 (50.0%) | 48 (50.0%) |
| Transportation & Warehousing | 48 (100.0%) | 0 (0.0%) |
| Utilities | 45 (45.5%) | 54 (54.5%) |
| Information | 47 (100.0%) | 0 (0.0%) |
| Finance & Insurance | 0 (0.0%) | 0 (0.0%) |
| Real Estate, Rental & Leasing | 0 (0.0%) | 0 (0.0%) |
| Professional & Scientific | 26 (100.0%) | 0 (0.0%) |
| Enterprise Management | 0 (0.0%) | 0 (0.0%) |
| Administrative & Support | 0 (0.0%) | 0 (0.0%) |
| Educational Services | 69 (48.6%) | 73 (51.4%) |
| Health Care & Social Assistance | 0 (0.0%) | 149 (100.0%) |
| Arts, Entertainment & Recreation | 0 (0.0%) | 0 (0.0%) |
| Accommodation & Food Services | 0 (0.0%) | 0 (0.0%) |
| Public Administration | 16 (100.0%) | 0 (0.0%) |
| Total | 427 (52.3%) | 390 (47.7%) |
Education in Shirley
School Enrollment in Shirley
The most common levels of schooling among the 110 students in Shirley are college / undergraduate (31 | 28.2%), high school (27 | 24.5%), and elementary school (26 | 23.6%).
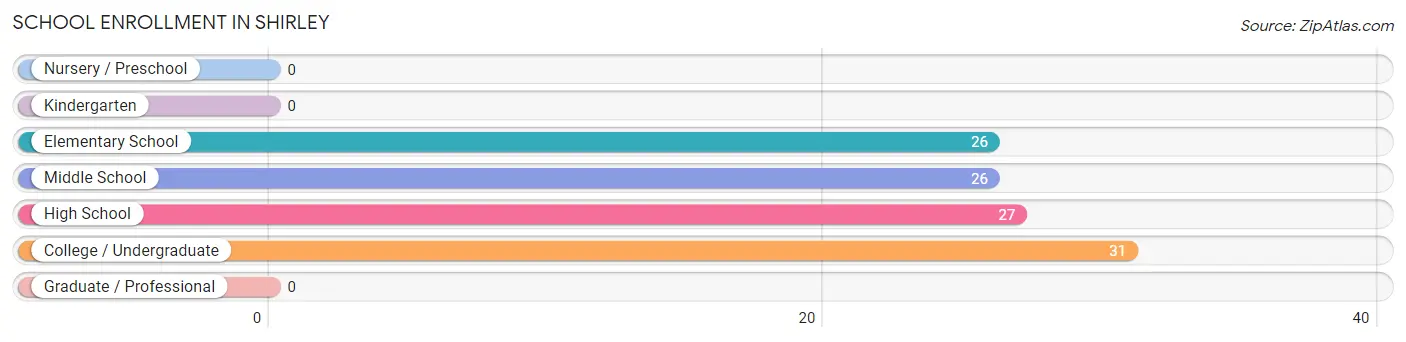
| School Level | # Students | % Students |
| Nursery / Preschool | 0 | 0.0% |
| Kindergarten | 0 | 0.0% |
| Elementary School | 26 | 23.6% |
| Middle School | 26 | 23.6% |
| High School | 27 | 24.5% |
| College / Undergraduate | 31 | 28.2% |
| Graduate / Professional | 0 | 0.0% |
| Total | 110 | 100.0% |
School Enrollment by Age by Funding Source in Shirley
Out of a total of 110 students who are enrolled in schools in Shirley, 52 (47.3%) attend a private institution, while the remaining 58 (52.7%) are enrolled in public schools. The age group of 5 to 9 year old has the highest likelihood of being enrolled in private schools, with 26 (100.0% in the age bracket) enrolled. Conversely, the age group of 15 to 17 year olds has the lowest likelihood of being enrolled in a private school, with 27 (100.0% in the age bracket) attending a public institution.
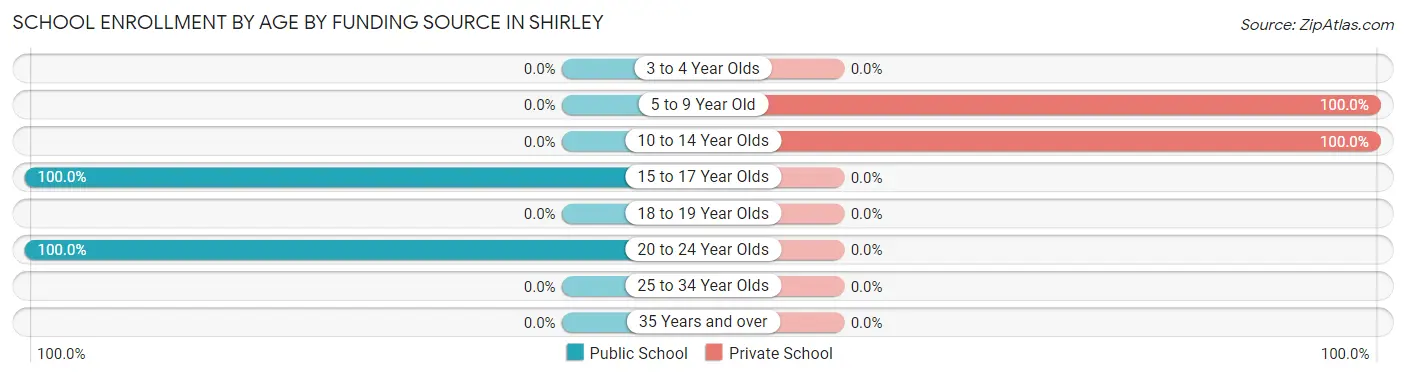
| Age Bracket | Public School | Private School |
| 3 to 4 Year Olds | 0 (0.0%) | 0 (0.0%) |
| 5 to 9 Year Old | 0 (0.0%) | 26 (100.0%) |
| 10 to 14 Year Olds | 0 (0.0%) | 26 (100.0%) |
| 15 to 17 Year Olds | 27 (100.0%) | 0 (0.0%) |
| 18 to 19 Year Olds | 0 (0.0%) | 0 (0.0%) |
| 20 to 24 Year Olds | 31 (100.0%) | 0 (0.0%) |
| 25 to 34 Year Olds | 0 (0.0%) | 0 (0.0%) |
| 35 Years and over | 0 (0.0%) | 0 (0.0%) |
| Total | 58 (52.7%) | 52 (47.3%) |
Educational Attainment by Field of Study in Shirley
Visual & performing arts (125 | 34.5%), literature & languages (51 | 14.1%), social sciences (48 | 13.3%), arts & humanities (44 | 12.1%), and education (39 | 10.8%) are the most common fields of study among 362 individuals in Shirley who have obtained a bachelor's degree or higher.
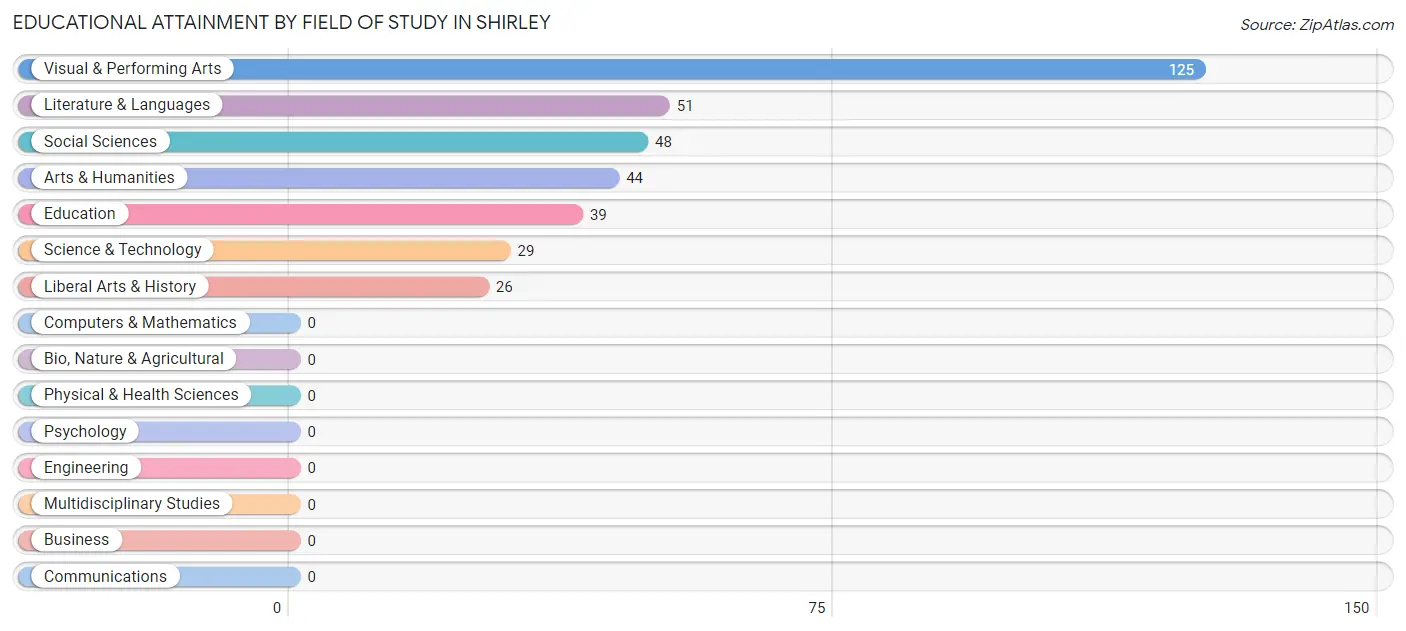
| Field of Study | # Graduates | % Graduates |
| Computers & Mathematics | 0 | 0.0% |
| Bio, Nature & Agricultural | 0 | 0.0% |
| Physical & Health Sciences | 0 | 0.0% |
| Psychology | 0 | 0.0% |
| Social Sciences | 48 | 13.3% |
| Engineering | 0 | 0.0% |
| Multidisciplinary Studies | 0 | 0.0% |
| Science & Technology | 29 | 8.0% |
| Business | 0 | 0.0% |
| Education | 39 | 10.8% |
| Literature & Languages | 51 | 14.1% |
| Liberal Arts & History | 26 | 7.2% |
| Visual & Performing Arts | 125 | 34.5% |
| Communications | 0 | 0.0% |
| Arts & Humanities | 44 | 12.1% |
| Total | 362 | 100.0% |
Transportation & Commute in Shirley
Vehicle Availability by Sex in Shirley
The most prevalent vehicle ownership categories in Shirley are males with 2 vehicles (234, accounting for 54.8%) and females with 2 vehicles (244, making up 60.0%).
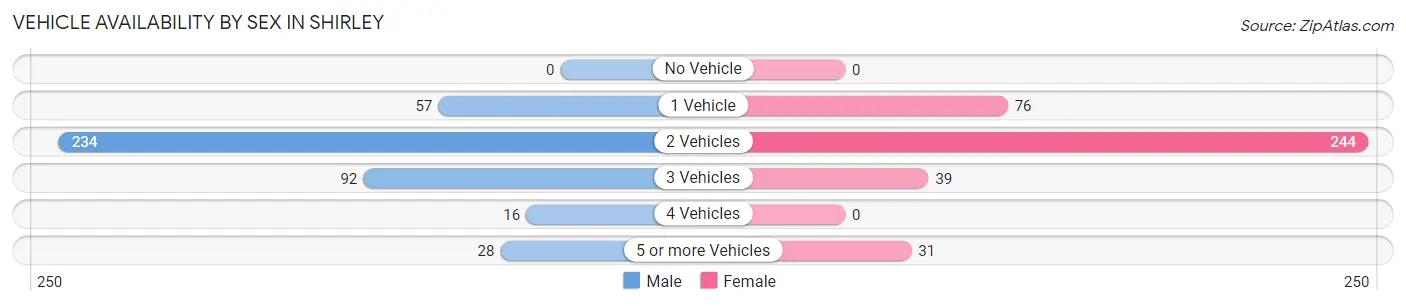
| Vehicles Available | Male | Female |
| No Vehicle | 0 (0.0%) | 0 (0.0%) |
| 1 Vehicle | 57 (13.4%) | 76 (19.5%) |
| 2 Vehicles | 234 (54.8%) | 244 (62.6%) |
| 3 Vehicles | 92 (21.5%) | 39 (10.0%) |
| 4 Vehicles | 16 (3.7%) | 0 (0.0%) |
| 5 or more Vehicles | 28 (6.6%) | 31 (8.0%) |
| Total | 427 (100.0%) | 390 (100.0%) |
Commute Time in Shirley
The most frequently occuring commute durations in Shirley are 30 to 34 minutes (152 commuters, 21.5%), 20 to 24 minutes (98 commuters, 13.9%), and 5 to 9 minutes (87 commuters, 12.3%).
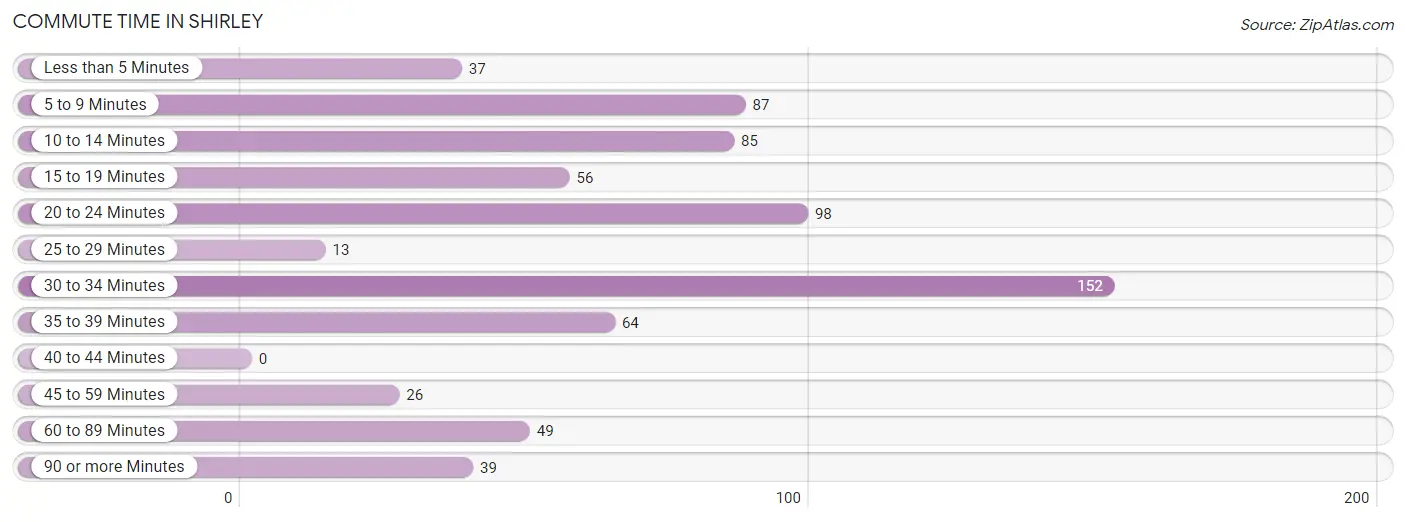
| Commute Time | # Commuters | % Commuters |
| Less than 5 Minutes | 37 | 5.2% |
| 5 to 9 Minutes | 87 | 12.3% |
| 10 to 14 Minutes | 85 | 12.0% |
| 15 to 19 Minutes | 56 | 7.9% |
| 20 to 24 Minutes | 98 | 13.9% |
| 25 to 29 Minutes | 13 | 1.8% |
| 30 to 34 Minutes | 152 | 21.5% |
| 35 to 39 Minutes | 64 | 9.1% |
| 40 to 44 Minutes | 0 | 0.0% |
| 45 to 59 Minutes | 26 | 3.7% |
| 60 to 89 Minutes | 49 | 6.9% |
| 90 or more Minutes | 39 | 5.5% |
Commute Time by Sex in Shirley
The most common commute times in Shirley are 35 to 39 minutes (64 commuters, 19.3%) for males and 30 to 34 minutes (106 commuters, 28.3%) for females.
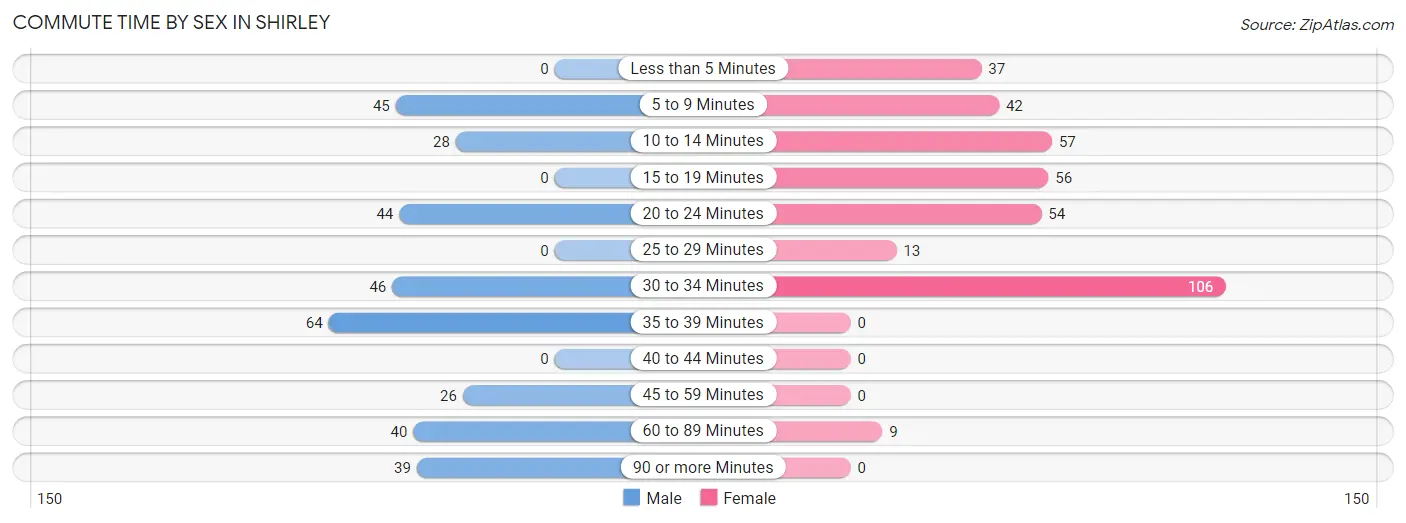
| Commute Time | Male | Female |
| Less than 5 Minutes | 0 (0.0%) | 37 (9.9%) |
| 5 to 9 Minutes | 45 (13.6%) | 42 (11.2%) |
| 10 to 14 Minutes | 28 (8.4%) | 57 (15.2%) |
| 15 to 19 Minutes | 0 (0.0%) | 56 (15.0%) |
| 20 to 24 Minutes | 44 (13.3%) | 54 (14.4%) |
| 25 to 29 Minutes | 0 (0.0%) | 13 (3.5%) |
| 30 to 34 Minutes | 46 (13.9%) | 106 (28.3%) |
| 35 to 39 Minutes | 64 (19.3%) | 0 (0.0%) |
| 40 to 44 Minutes | 0 (0.0%) | 0 (0.0%) |
| 45 to 59 Minutes | 26 (7.8%) | 0 (0.0%) |
| 60 to 89 Minutes | 40 (12.0%) | 9 (2.4%) |
| 90 or more Minutes | 39 (11.7%) | 0 (0.0%) |
Time of Departure to Work by Sex in Shirley
The most frequent times of departure to work in Shirley are 7:00 AM to 7:29 AM (77, 23.2%) for males and 7:30 AM to 7:59 AM (89, 23.8%) for females.
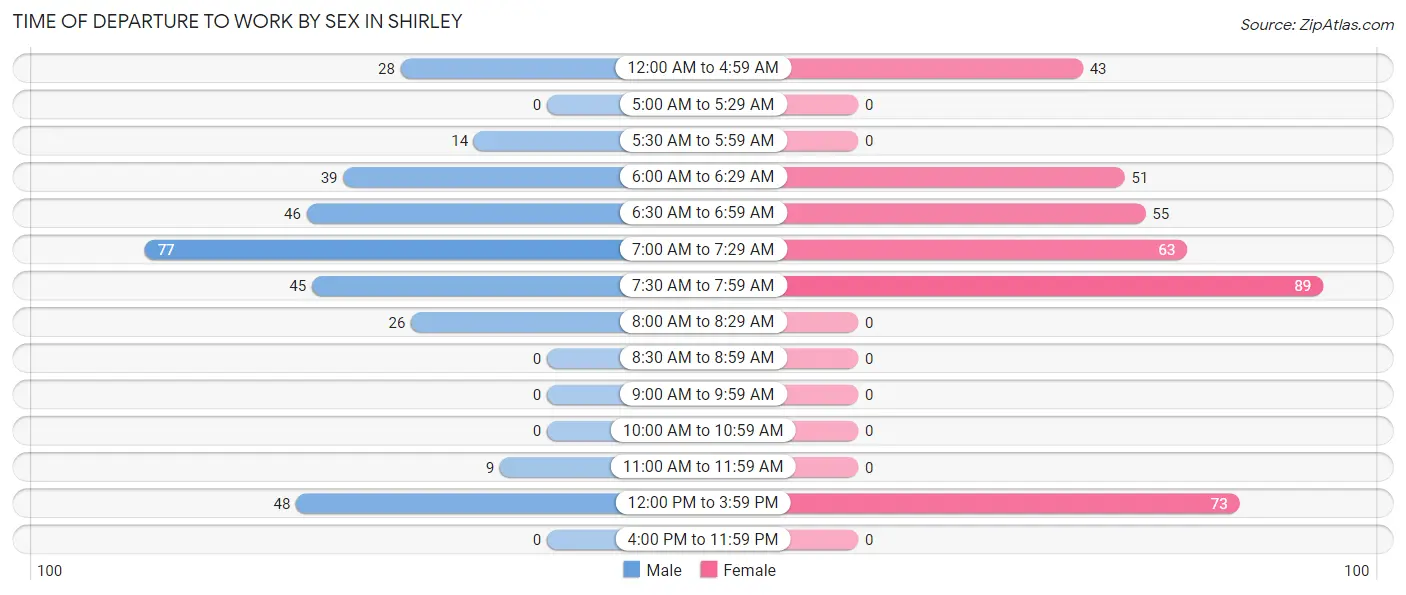
| Time of Departure | Male | Female |
| 12:00 AM to 4:59 AM | 28 (8.4%) | 43 (11.5%) |
| 5:00 AM to 5:29 AM | 0 (0.0%) | 0 (0.0%) |
| 5:30 AM to 5:59 AM | 14 (4.2%) | 0 (0.0%) |
| 6:00 AM to 6:29 AM | 39 (11.7%) | 51 (13.6%) |
| 6:30 AM to 6:59 AM | 46 (13.9%) | 55 (14.7%) |
| 7:00 AM to 7:29 AM | 77 (23.2%) | 63 (16.8%) |
| 7:30 AM to 7:59 AM | 45 (13.6%) | 89 (23.8%) |
| 8:00 AM to 8:29 AM | 26 (7.8%) | 0 (0.0%) |
| 8:30 AM to 8:59 AM | 0 (0.0%) | 0 (0.0%) |
| 9:00 AM to 9:59 AM | 0 (0.0%) | 0 (0.0%) |
| 10:00 AM to 10:59 AM | 0 (0.0%) | 0 (0.0%) |
| 11:00 AM to 11:59 AM | 9 (2.7%) | 0 (0.0%) |
| 12:00 PM to 3:59 PM | 48 (14.5%) | 73 (19.5%) |
| 4:00 PM to 11:59 PM | 0 (0.0%) | 0 (0.0%) |
| Total | 332 (100.0%) | 374 (100.0%) |
Housing Occupancy in Shirley
Occupancy by Ownership in Shirley
Of the total 700 dwellings in Shirley, owner-occupied units account for 403 (57.6%), while renter-occupied units make up 297 (42.4%).
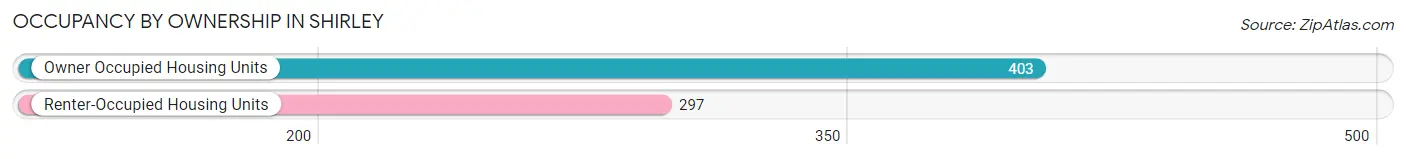
| Occupancy | # Housing Units | % Housing Units |
| Owner Occupied Housing Units | 403 | 57.6% |
| Renter-Occupied Housing Units | 297 | 42.4% |
| Total Occupied Housing Units | 700 | 100.0% |
Occupancy by Household Size in Shirley
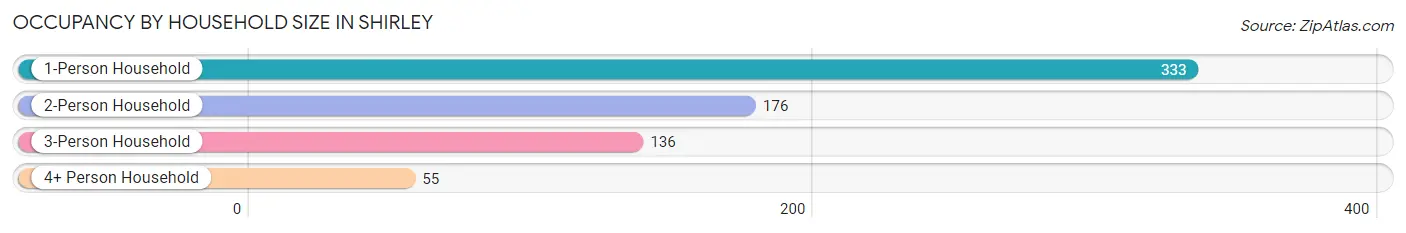
| Household Size | # Housing Units | % Housing Units |
| 1-Person Household | 333 | 47.6% |
| 2-Person Household | 176 | 25.1% |
| 3-Person Household | 136 | 19.4% |
| 4+ Person Household | 55 | 7.9% |
| Total Housing Units | 700 | 100.0% |
Occupancy by Ownership by Household Size in Shirley
| Household Size | Owner-occupied | Renter-occupied |
| 1-Person Household | 78 (23.4%) | 255 (76.6%) |
| 2-Person Household | 134 (76.1%) | 42 (23.9%) |
| 3-Person Household | 136 (100.0%) | 0 (0.0%) |
| 4+ Person Household | 55 (100.0%) | 0 (0.0%) |
| Total Housing Units | 403 (57.6%) | 297 (42.4%) |
Occupancy by Educational Attainment in Shirley
| Household Size | Owner-occupied | Renter-occupied |
| Less than High School | 0 (0.0%) | 0 (0.0%) |
| High School Diploma | 161 (56.1%) | 126 (43.9%) |
| College/Associate Degree | 103 (45.6%) | 123 (54.4%) |
| Bachelor's Degree or higher | 139 (74.3%) | 48 (25.7%) |
Occupancy by Age of Householder in Shirley
| Age Bracket | # Households | % Households |
| Under 35 Years | 0 | 0.0% |
| 35 to 44 Years | 180 | 25.7% |
| 45 to 54 Years | 104 | 14.9% |
| 55 to 64 Years | 197 | 28.1% |
| 65 to 74 Years | 94 | 13.4% |
| 75 to 84 Years | 37 | 5.3% |
| 85 Years and Over | 88 | 12.6% |
| Total | 700 | 100.0% |
Housing Finances in Shirley
Median Income by Occupancy in Shirley
| Occupancy Type | # Households | Median Income |
| Owner-Occupied | 403 (57.6%) | $101,889 |
| Renter-Occupied | 297 (42.4%) | $29,438 |
| Average | 700 (100.0%) | $85,119 |
Occupancy by Householder Income Bracket in Shirley
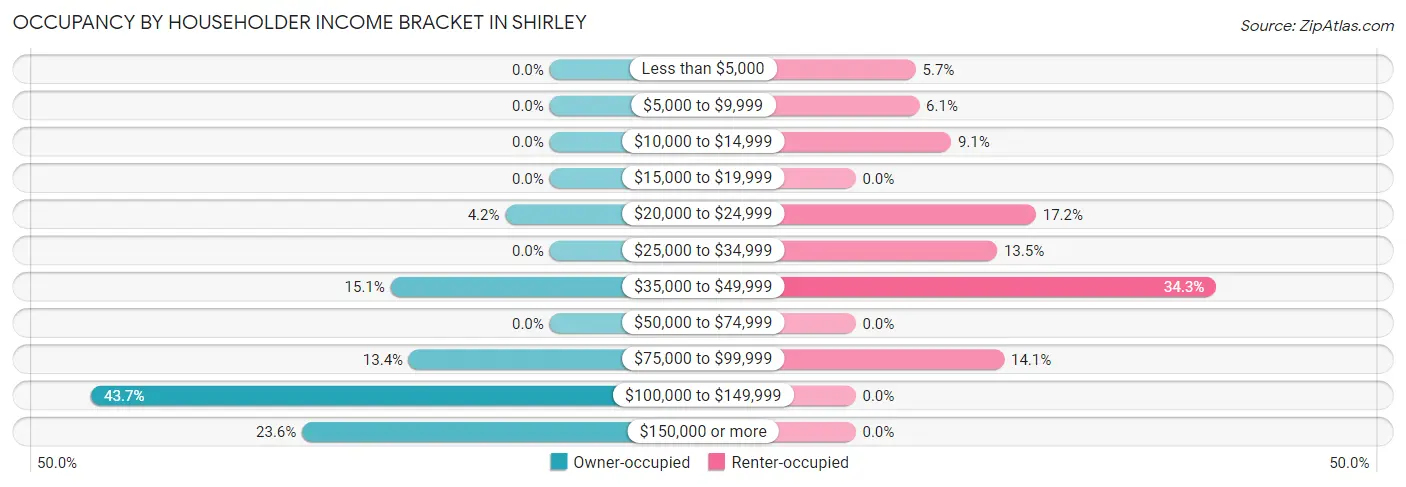
| Income Bracket | Owner-occupied | Renter-occupied |
| Less than $5,000 | 0 (0.0%) | 17 (5.7%) |
| $5,000 to $9,999 | 0 (0.0%) | 18 (6.1%) |
| $10,000 to $14,999 | 0 (0.0%) | 27 (9.1%) |
| $15,000 to $19,999 | 0 (0.0%) | 0 (0.0%) |
| $20,000 to $24,999 | 17 (4.2%) | 51 (17.2%) |
| $25,000 to $34,999 | 0 (0.0%) | 40 (13.5%) |
| $35,000 to $49,999 | 61 (15.1%) | 102 (34.3%) |
| $50,000 to $74,999 | 0 (0.0%) | 0 (0.0%) |
| $75,000 to $99,999 | 54 (13.4%) | 42 (14.1%) |
| $100,000 to $149,999 | 176 (43.7%) | 0 (0.0%) |
| $150,000 or more | 95 (23.6%) | 0 (0.0%) |
| Total | 403 (100.0%) | 297 (100.0%) |
Monthly Housing Cost Tiers in Shirley
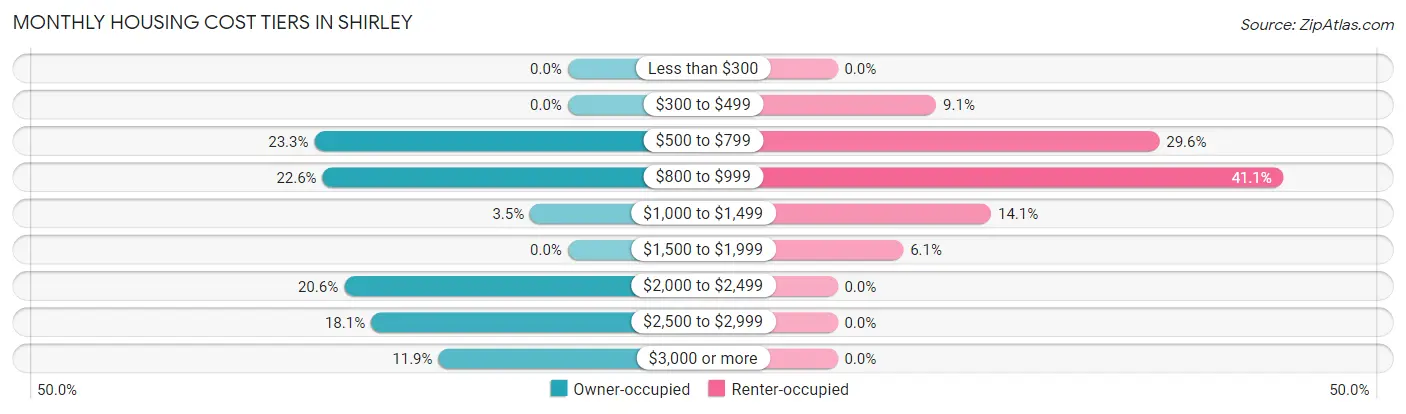
| Monthly Cost | Owner-occupied | Renter-occupied |
| Less than $300 | 0 (0.0%) | 0 (0.0%) |
| $300 to $499 | 0 (0.0%) | 27 (9.1%) |
| $500 to $799 | 94 (23.3%) | 88 (29.6%) |
| $800 to $999 | 91 (22.6%) | 122 (41.1%) |
| $1,000 to $1,499 | 14 (3.5%) | 42 (14.1%) |
| $1,500 to $1,999 | 0 (0.0%) | 18 (6.1%) |
| $2,000 to $2,499 | 83 (20.6%) | 0 (0.0%) |
| $2,500 to $2,999 | 73 (18.1%) | 0 (0.0%) |
| $3,000 or more | 48 (11.9%) | 0 (0.0%) |
| Total | 403 (100.0%) | 297 (100.0%) |
Physical Housing Characteristics in Shirley
Housing Structures in Shirley
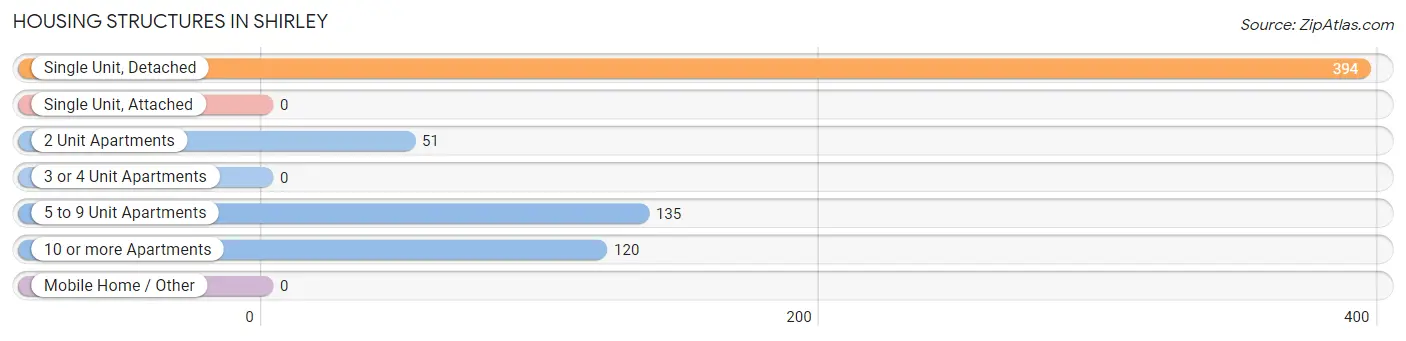
| Structure Type | # Housing Units | % Housing Units |
| Single Unit, Detached | 394 | 56.3% |
| Single Unit, Attached | 0 | 0.0% |
| 2 Unit Apartments | 51 | 7.3% |
| 3 or 4 Unit Apartments | 0 | 0.0% |
| 5 to 9 Unit Apartments | 135 | 19.3% |
| 10 or more Apartments | 120 | 17.1% |
| Mobile Home / Other | 0 | 0.0% |
| Total | 700 | 100.0% |
Housing Structures by Occupancy in Shirley
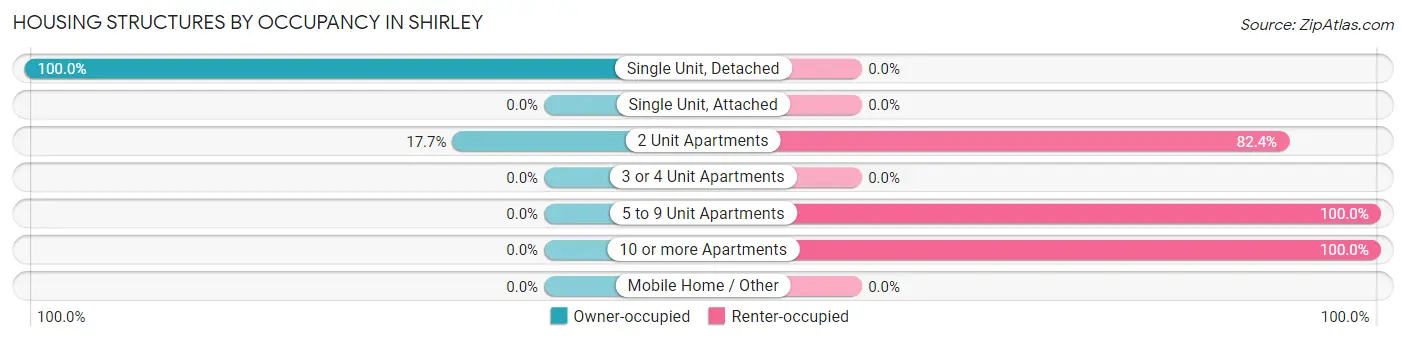
| Structure Type | Owner-occupied | Renter-occupied |
| Single Unit, Detached | 394 (100.0%) | 0 (0.0%) |
| Single Unit, Attached | 0 (0.0%) | 0 (0.0%) |
| 2 Unit Apartments | 9 (17.6%) | 42 (82.4%) |
| 3 or 4 Unit Apartments | 0 (0.0%) | 0 (0.0%) |
| 5 to 9 Unit Apartments | 0 (0.0%) | 135 (100.0%) |
| 10 or more Apartments | 0 (0.0%) | 120 (100.0%) |
| Mobile Home / Other | 0 (0.0%) | 0 (0.0%) |
| Total | 403 (57.6%) | 297 (42.4%) |
Housing Structures by Number of Rooms in Shirley
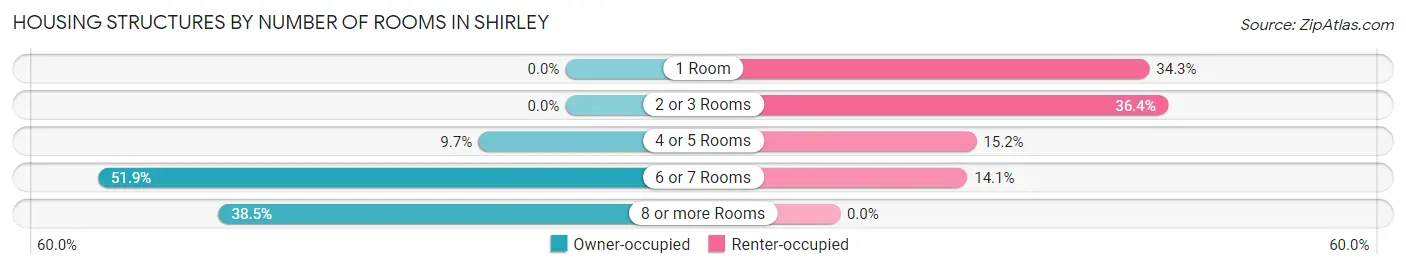
| Number of Rooms | Owner-occupied | Renter-occupied |
| 1 Room | 0 (0.0%) | 102 (34.3%) |
| 2 or 3 Rooms | 0 (0.0%) | 108 (36.4%) |
| 4 or 5 Rooms | 39 (9.7%) | 45 (15.1%) |
| 6 or 7 Rooms | 209 (51.9%) | 42 (14.1%) |
| 8 or more Rooms | 155 (38.5%) | 0 (0.0%) |
| Total | 403 (100.0%) | 297 (100.0%) |
Housing Structure by Heating Type in Shirley
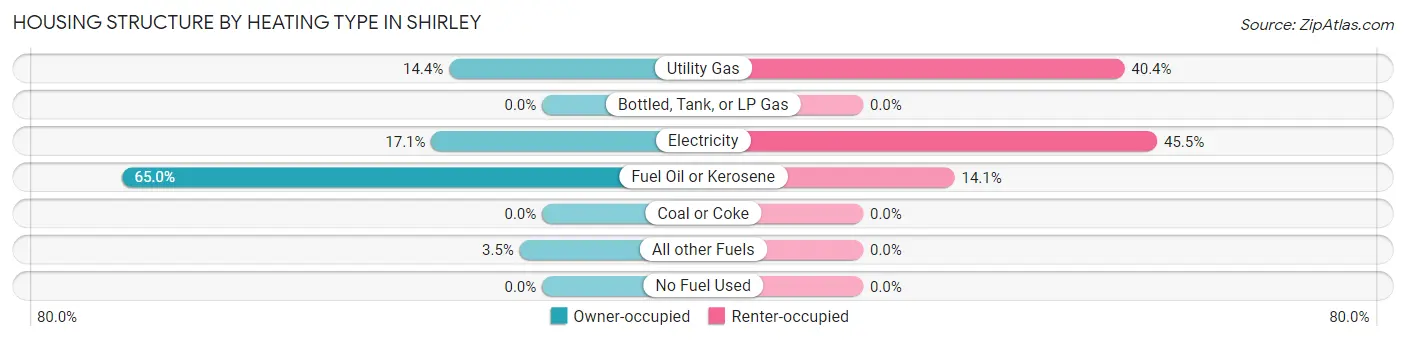
| Heating Type | Owner-occupied | Renter-occupied |
| Utility Gas | 58 (14.4%) | 120 (40.4%) |
| Bottled, Tank, or LP Gas | 0 (0.0%) | 0 (0.0%) |
| Electricity | 69 (17.1%) | 135 (45.5%) |
| Fuel Oil or Kerosene | 262 (65.0%) | 42 (14.1%) |
| Coal or Coke | 0 (0.0%) | 0 (0.0%) |
| All other Fuels | 14 (3.5%) | 0 (0.0%) |
| No Fuel Used | 0 (0.0%) | 0 (0.0%) |
| Total | 403 (100.0%) | 297 (100.0%) |
Household Vehicle Usage in Shirley
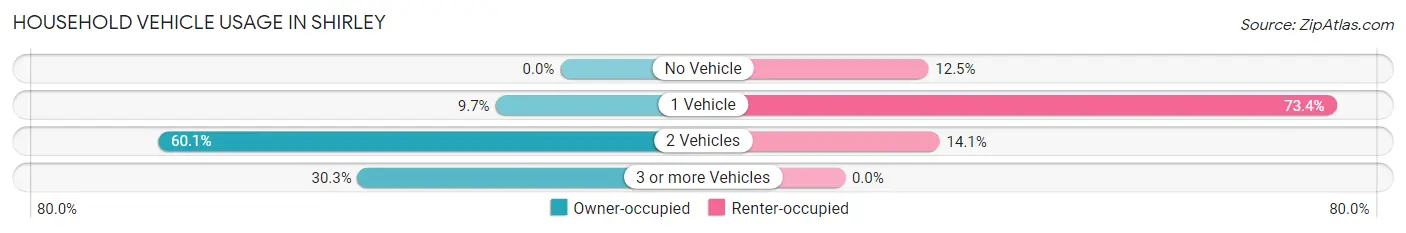
| Vehicles per Household | Owner-occupied | Renter-occupied |
| No Vehicle | 0 (0.0%) | 37 (12.5%) |
| 1 Vehicle | 39 (9.7%) | 218 (73.4%) |
| 2 Vehicles | 242 (60.1%) | 42 (14.1%) |
| 3 or more Vehicles | 122 (30.3%) | 0 (0.0%) |
| Total | 403 (100.0%) | 297 (100.0%) |
Real Estate & Mortgages in Shirley
Real Estate and Mortgage Overview in Shirley
| Characteristic | Without Mortgage | With Mortgage |
| Housing Units | 140 | 263 |
| Median Property Value | $320,800 | $342,500 |
| Median Household Income | - | - |
| Monthly Housing Costs | $720 | $48 |
| Real Estate Taxes | $4,136 | $0 |
Property Value by Mortgage Status in Shirley
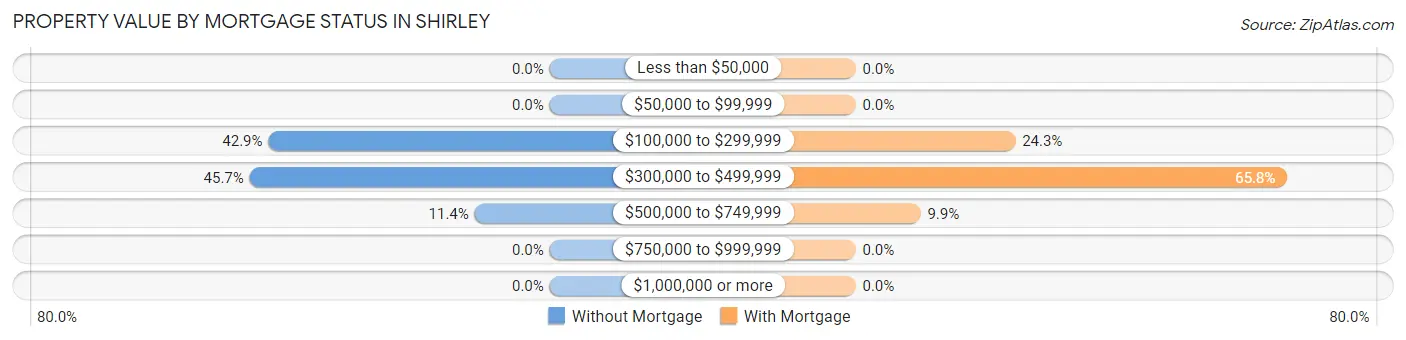
| Property Value | Without Mortgage | With Mortgage |
| Less than $50,000 | 0 (0.0%) | 0 (0.0%) |
| $50,000 to $99,999 | 0 (0.0%) | 0 (0.0%) |
| $100,000 to $299,999 | 60 (42.9%) | 64 (24.3%) |
| $300,000 to $499,999 | 64 (45.7%) | 173 (65.8%) |
| $500,000 to $749,999 | 16 (11.4%) | 26 (9.9%) |
| $750,000 to $999,999 | 0 (0.0%) | 0 (0.0%) |
| $1,000,000 or more | 0 (0.0%) | 0 (0.0%) |
| Total | 140 (100.0%) | 263 (100.0%) |
Household Income by Mortgage Status in Shirley
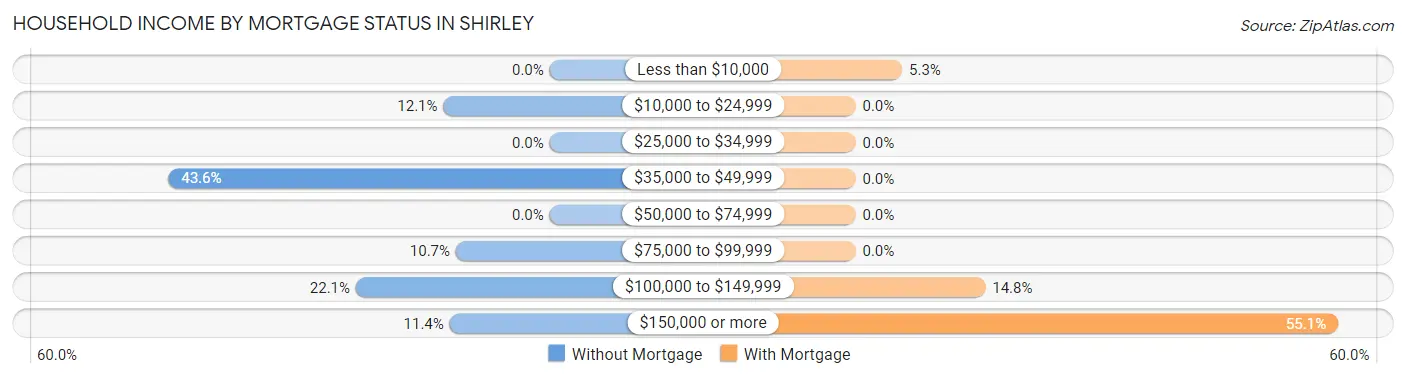
| Household Income | Without Mortgage | With Mortgage |
| Less than $10,000 | 0 (0.0%) | 14 (5.3%) |
| $10,000 to $24,999 | 17 (12.1%) | 0 (0.0%) |
| $25,000 to $34,999 | 0 (0.0%) | 0 (0.0%) |
| $35,000 to $49,999 | 61 (43.6%) | 0 (0.0%) |
| $50,000 to $74,999 | 0 (0.0%) | 0 (0.0%) |
| $75,000 to $99,999 | 15 (10.7%) | 0 (0.0%) |
| $100,000 to $149,999 | 31 (22.1%) | 39 (14.8%) |
| $150,000 or more | 16 (11.4%) | 145 (55.1%) |
| Total | 140 (100.0%) | 263 (100.0%) |
Property Value to Household Income Ratio in Shirley
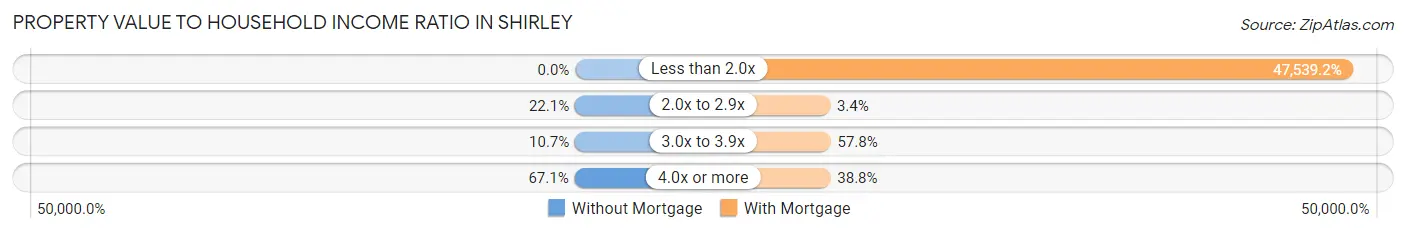
| Value-to-Income Ratio | Without Mortgage | With Mortgage |
| Less than 2.0x | 0 (0.0%) | 125,028 (47,539.2%) |
| 2.0x to 2.9x | 31 (22.1%) | 9 (3.4%) |
| 3.0x to 3.9x | 15 (10.7%) | 152 (57.8%) |
| 4.0x or more | 94 (67.1%) | 102 (38.8%) |
| Total | 140 (100.0%) | 263 (100.0%) |
Real Estate Taxes by Mortgage Status in Shirley
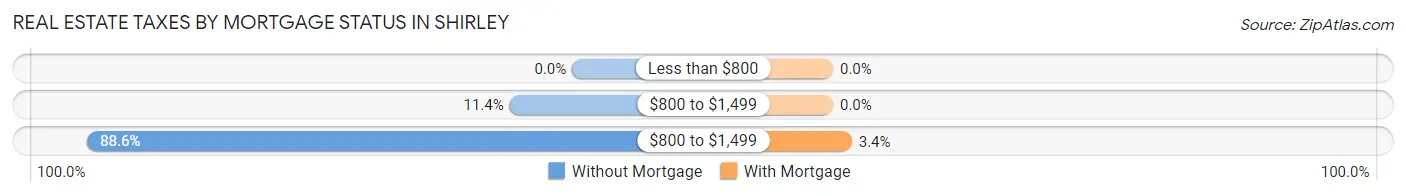
| Property Taxes | Without Mortgage | With Mortgage |
| Less than $800 | 0 (0.0%) | 0 (0.0%) |
| $800 to $1,499 | 16 (11.4%) | 0 (0.0%) |
| $800 to $1,499 | 124 (88.6%) | 9 (3.4%) |
| Total | 140 (100.0%) | 263 (100.0%) |
Health & Disability in Shirley
Health Insurance Coverage by Age in Shirley
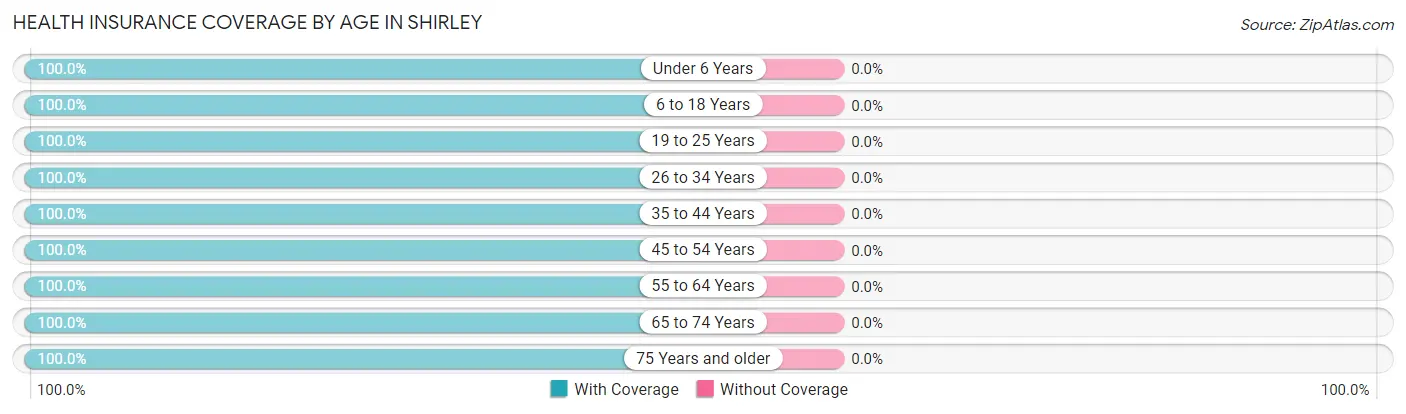
| Age Bracket | With Coverage | Without Coverage |
| Under 6 Years | 97 (100.0%) | 0 (0.0%) |
| 6 to 18 Years | 79 (100.0%) | 0 (0.0%) |
| 19 to 25 Years | 31 (100.0%) | 0 (0.0%) |
| 26 to 34 Years | 84 (100.0%) | 0 (0.0%) |
| 35 to 44 Years | 253 (100.0%) | 0 (0.0%) |
| 45 to 54 Years | 175 (100.0%) | 0 (0.0%) |
| 55 to 64 Years | 391 (100.0%) | 0 (0.0%) |
| 65 to 74 Years | 110 (100.0%) | 0 (0.0%) |
| 75 Years and older | 139 (100.0%) | 0 (0.0%) |
| Total | 1,359 (100.0%) | 0 (0.0%) |
Health Insurance Coverage by Citizenship Status in Shirley
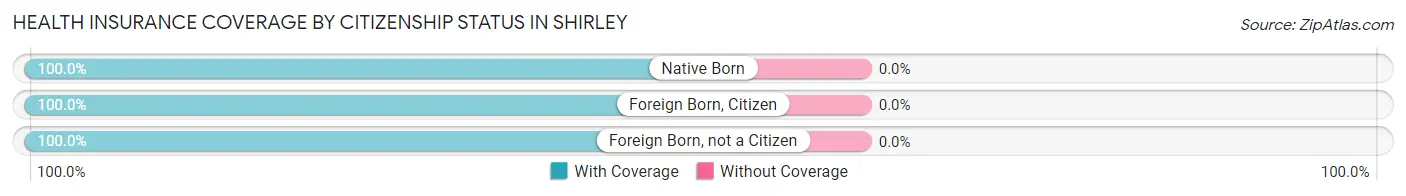
| Citizenship Status | With Coverage | Without Coverage |
| Native Born | 97 (100.0%) | 0 (0.0%) |
| Foreign Born, Citizen | 79 (100.0%) | 0 (0.0%) |
| Foreign Born, not a Citizen | 31 (100.0%) | 0 (0.0%) |
Health Insurance Coverage by Household Income in Shirley
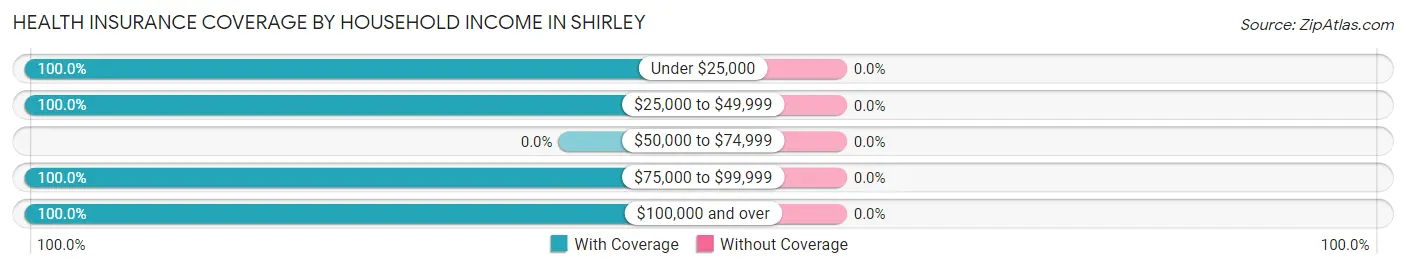
| Household Income | With Coverage | Without Coverage |
| Under $25,000 | 130 (100.0%) | 0 (0.0%) |
| $25,000 to $49,999 | 203 (100.0%) | 0 (0.0%) |
| $50,000 to $74,999 | 0 (0.0%) | 0 (0.0%) |
| $75,000 to $99,999 | 221 (100.0%) | 0 (0.0%) |
| $100,000 and over | 805 (100.0%) | 0 (0.0%) |
Public vs Private Health Insurance Coverage by Age in Shirley
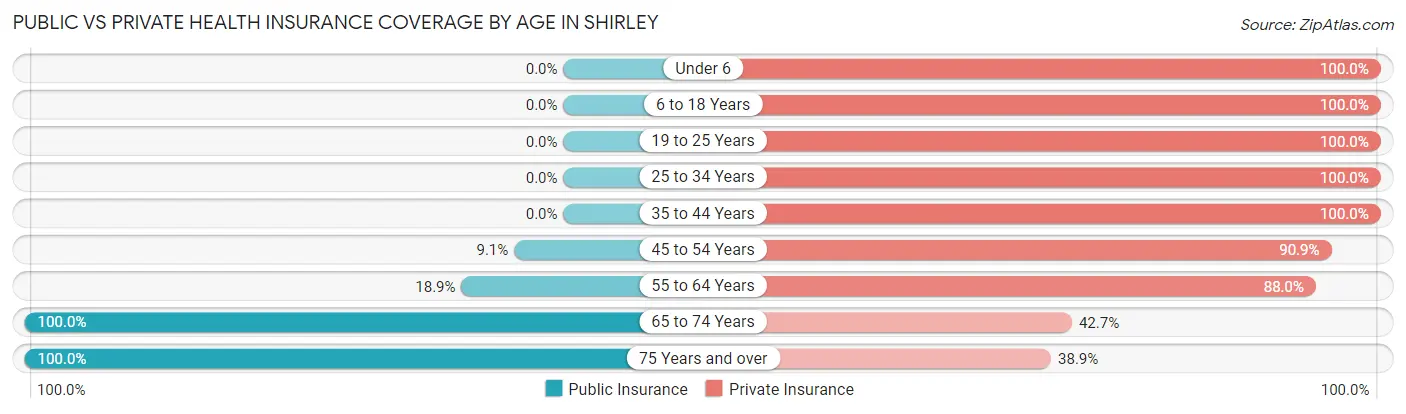
| Age Bracket | Public Insurance | Private Insurance |
| Under 6 | 0 (0.0%) | 97 (100.0%) |
| 6 to 18 Years | 0 (0.0%) | 79 (100.0%) |
| 19 to 25 Years | 0 (0.0%) | 31 (100.0%) |
| 25 to 34 Years | 0 (0.0%) | 84 (100.0%) |
| 35 to 44 Years | 0 (0.0%) | 253 (100.0%) |
| 45 to 54 Years | 16 (9.1%) | 159 (90.9%) |
| 55 to 64 Years | 74 (18.9%) | 344 (88.0%) |
| 65 to 74 Years | 110 (100.0%) | 47 (42.7%) |
| 75 Years and over | 139 (100.0%) | 54 (38.9%) |
| Total | 339 (24.9%) | 1,148 (84.5%) |
Disability Status by Sex by Age in Shirley
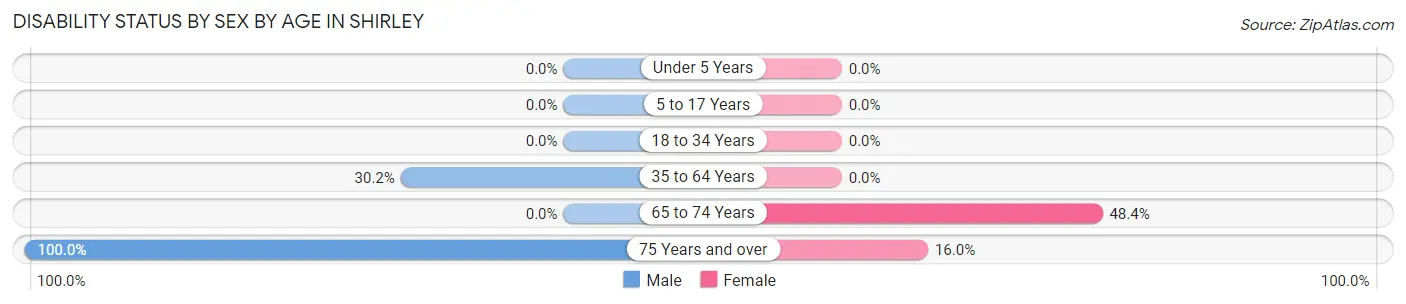
| Age Bracket | Male | Female |
| Under 5 Years | 0 (0.0%) | 0 (0.0%) |
| 5 to 17 Years | 0 (0.0%) | 0 (0.0%) |
| 18 to 34 Years | 0 (0.0%) | 0 (0.0%) |
| 35 to 64 Years | 129 (30.2%) | 0 (0.0%) |
| 65 to 74 Years | 0 (0.0%) | 15 (48.4%) |
| 75 Years and over | 14 (100.0%) | 20 (16.0%) |
Disability Class by Sex by Age in Shirley
Disability Class: Hearing Difficulty
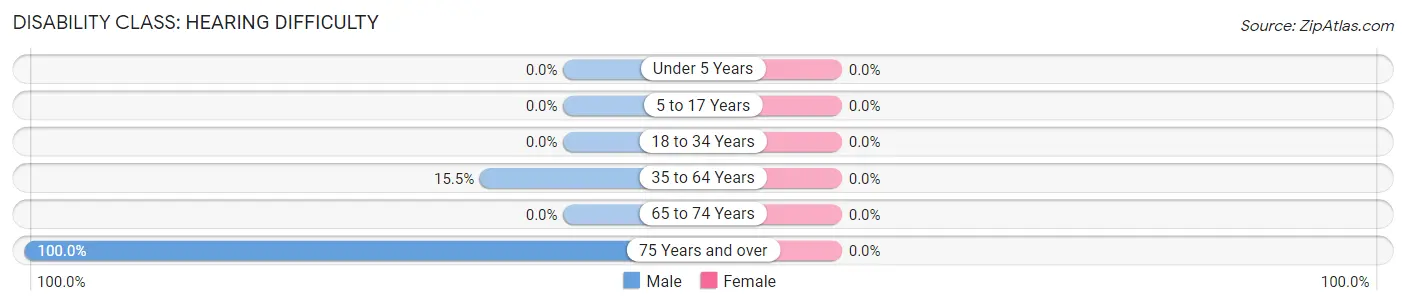
| Age Bracket | Male | Female |
| Under 5 Years | 0 (0.0%) | 0 (0.0%) |
| 5 to 17 Years | 0 (0.0%) | 0 (0.0%) |
| 18 to 34 Years | 0 (0.0%) | 0 (0.0%) |
| 35 to 64 Years | 66 (15.5%) | 0 (0.0%) |
| 65 to 74 Years | 0 (0.0%) | 0 (0.0%) |
| 75 Years and over | 14 (100.0%) | 0 (0.0%) |
Disability Class: Vision Difficulty
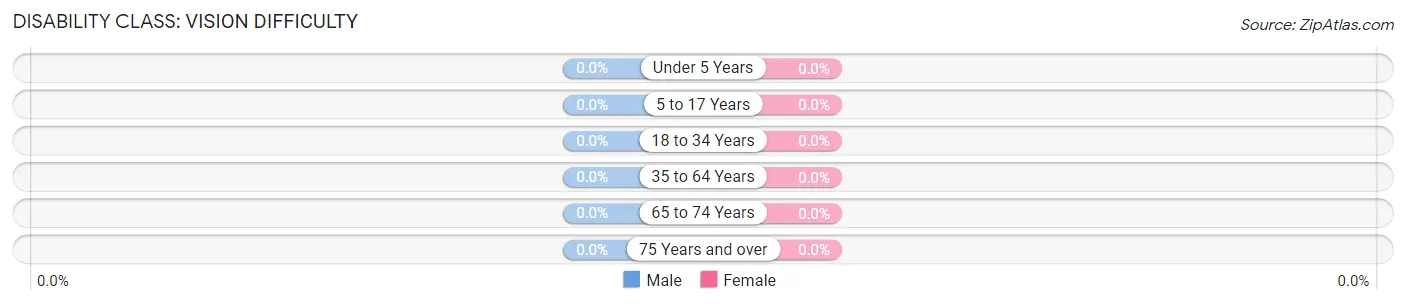
| Age Bracket | Male | Female |
| Under 5 Years | 0 (0.0%) | 0 (0.0%) |
| 5 to 17 Years | 0 (0.0%) | 0 (0.0%) |
| 18 to 34 Years | 0 (0.0%) | 0 (0.0%) |
| 35 to 64 Years | 0 (0.0%) | 0 (0.0%) |
| 65 to 74 Years | 0 (0.0%) | 0 (0.0%) |
| 75 Years and over | 0 (0.0%) | 0 (0.0%) |
Disability Class: Cognitive Difficulty
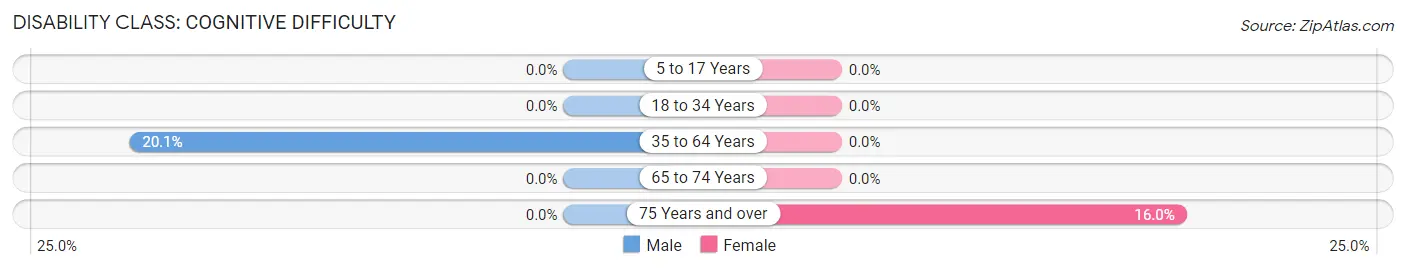
| Age Bracket | Male | Female |
| 5 to 17 Years | 0 (0.0%) | 0 (0.0%) |
| 18 to 34 Years | 0 (0.0%) | 0 (0.0%) |
| 35 to 64 Years | 86 (20.1%) | 0 (0.0%) |
| 65 to 74 Years | 0 (0.0%) | 0 (0.0%) |
| 75 Years and over | 0 (0.0%) | 20 (16.0%) |
Disability Class: Ambulatory Difficulty
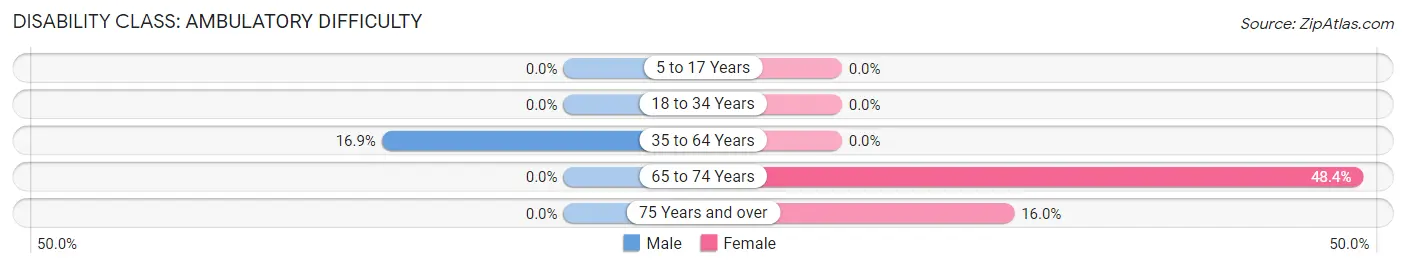
| Age Bracket | Male | Female |
| 5 to 17 Years | 0 (0.0%) | 0 (0.0%) |
| 18 to 34 Years | 0 (0.0%) | 0 (0.0%) |
| 35 to 64 Years | 72 (16.9%) | 0 (0.0%) |
| 65 to 74 Years | 0 (0.0%) | 15 (48.4%) |
| 75 Years and over | 0 (0.0%) | 20 (16.0%) |
Disability Class: Self-Care Difficulty
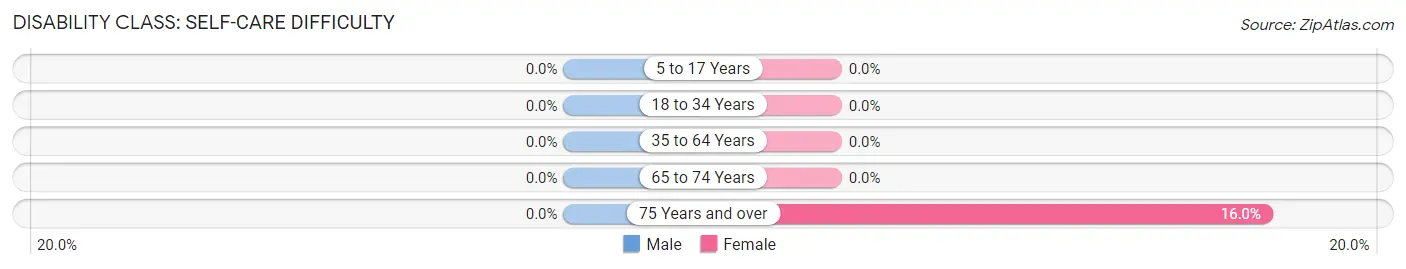
| Age Bracket | Male | Female |
| 5 to 17 Years | 0 (0.0%) | 0 (0.0%) |
| 18 to 34 Years | 0 (0.0%) | 0 (0.0%) |
| 35 to 64 Years | 0 (0.0%) | 0 (0.0%) |
| 65 to 74 Years | 0 (0.0%) | 0 (0.0%) |
| 75 Years and over | 0 (0.0%) | 20 (16.0%) |
Technology Access in Shirley
Computing Device Access in Shirley
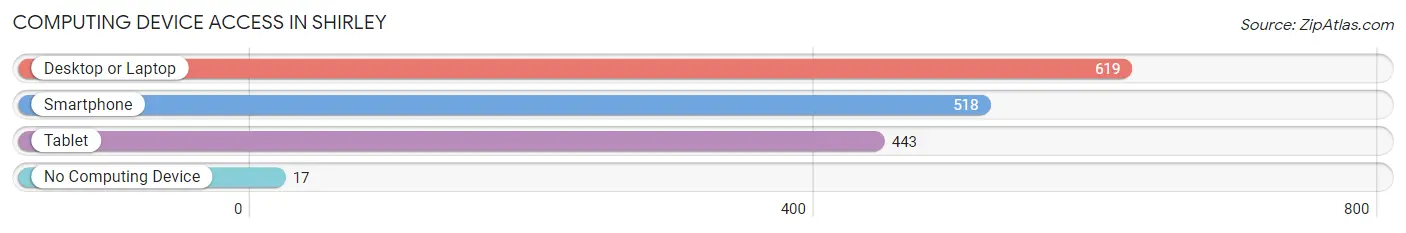
| Device Type | # Households | % Households |
| Desktop or Laptop | 619 | 88.4% |
| Smartphone | 518 | 74.0% |
| Tablet | 443 | 63.3% |
| No Computing Device | 17 | 2.4% |
| Total | 700 | 100.0% |
Internet Access in Shirley
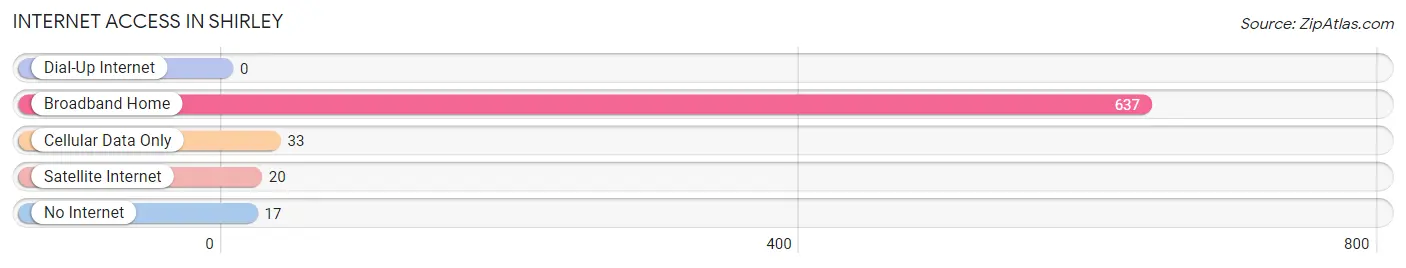
| Internet Type | # Households | % Households |
| Dial-Up Internet | 0 | 0.0% |
| Broadband Home | 637 | 91.0% |
| Cellular Data Only | 33 | 4.7% |
| Satellite Internet | 20 | 2.9% |
| No Internet | 17 | 2.4% |
| Total | 700 | 100.0% |
Shirley Summary
Shirley, Massachusetts is a small town located in Middlesex County, approximately 40 miles northwest of Boston. It is bordered by the towns of Ayer, Groton, Harvard, Lunenburg, and Townsend. The town has a population of approximately 8,000 people and covers an area of 22.2 square miles.
History
Shirley was first settled in 1653 and was originally part of Groton. It was officially incorporated as a town in 1753 and was named after William Shirley, the governor of Massachusetts at the time. The town was primarily an agricultural community until the mid-1800s when the railroad was built through the town. This allowed for the development of industry and commerce in the area.
Geography
Shirley is located in the northern part of Middlesex County, approximately 40 miles northwest of Boston. It is bordered by the towns of Ayer, Groton, Harvard, Lunenburg, and Townsend. The town is located in the Nashua River Valley and is surrounded by hills and forests. The highest point in the town is located at the summit of Mount Watatic, which is 1,064 feet above sea level.
Economy
Shirley’s economy is primarily based on manufacturing and services. The town is home to several large companies, including the Devens Industrial Park, which is home to several high-tech companies. The town also has a number of small businesses, including restaurants, retail stores, and professional services.
Demographics
As of the 2010 census, Shirley had a population of 8,234 people. The racial makeup of the town was 94.3% White, 1.3% African American, 0.3% Native American, 1.2% Asian, 0.1% Pacific Islander, 1.2% from other races, and 1.6% from two or more races. The median household income was $68,958 and the median family income was $77,813.
Shirley is a small town with a rich history and a diverse population. It is home to a number of businesses and industries, and is a great place to live and work. The town is located in a beautiful area and is close to many of the amenities of the larger cities in the area.
Common Questions
What is Per Capita Income in Shirley?
Per Capita income in Shirley is $40,744.
What is the Median Family Income in Shirley?
Median Family Income in Shirley is $125,568.
What is the Median Household income in Shirley?
Median Household Income in Shirley is $85,119.
What is Income or Wage Gap in Shirley?
Income or Wage Gap in Shirley is 8.4%.
Women in Shirley earn 91.6 cents for every dollar earned by a man.
What is Inequality or Gini Index in Shirley?
Inequality or Gini Index in Shirley is 0.37.
What is the Total Population of Shirley?
Total Population of Shirley is 1,359.
What is the Total Male Population of Shirley?
Total Male Population of Shirley is 728.
What is the Total Female Population of Shirley?
Total Female Population of Shirley is 631.
What is the Ratio of Males per 100 Females in Shirley?
There are 115.37 Males per 100 Females in Shirley.
What is the Ratio of Females per 100 Males in Shirley?
There are 86.68 Females per 100 Males in Shirley.
What is the Median Population Age in Shirley?
Median Population Age in Shirley is 53.1 Years.
What is the Average Family Size in Shirley
Average Family Size in Shirley is 2.8 People.
What is the Average Household Size in Shirley
Average Household Size in Shirley is 1.9 People.
How Large is the Labor Force in Shirley?
There are 878 People in the Labor Forcein in Shirley.
What is the Percentage of People in the Labor Force in Shirley?
72.6% of People are in the Labor Force in Shirley.
What is the Unemployment Rate in Shirley?
Unemployment Rate in Shirley is 6.9%.