Crystal Lake, IL Map & Demographics
Crystal Lake Map
Crystal Lake Overview
$44,911
PER CAPITA INCOME
$115,861
AVG FAMILY INCOME
$103,018
AVG HOUSEHOLD INCOME
41.0%
WAGE / INCOME GAP [ % ]
59.0¢/ $1
WAGE / INCOME GAP [ $ ]
0.39
INEQUALITY / GINI INDEX
40,463
TOTAL POPULATION
19,934
MALE POPULATION
20,529
FEMALE POPULATION
97.10
MALES / 100 FEMALES
102.98
FEMALES / 100 MALES
39.9
MEDIAN AGE
3.1
AVG FAMILY SIZE
2.7
AVG HOUSEHOLD SIZE
22,621
LABOR FORCE [ PEOPLE ]
70.1%
PERCENT IN LABOR FORCE
4.9%
UNEMPLOYMENT RATE
Income in Crystal Lake
Income Overview in Crystal Lake
Per Capita Income in Crystal Lake is $44,911, while median incomes of families and households are $115,861 and $103,018 respectively.
| Characteristic | Number | Measure |
| Per Capita Income | 40,463 | $44,911 |
| Median Family Income | 11,175 | $115,861 |
| Mean Family Income | 11,175 | $132,166 |
| Median Household Income | 14,774 | $103,018 |
| Mean Household Income | 14,774 | $120,538 |
| Income Deficit | 11,175 | $0 |
| Wage / Income Gap (%) | 40,463 | 40.99% |
| Wage / Income Gap ($) | 40,463 | 59.01¢ per $1 |
| Gini / Inequality Index | 40,463 | 0.39 |
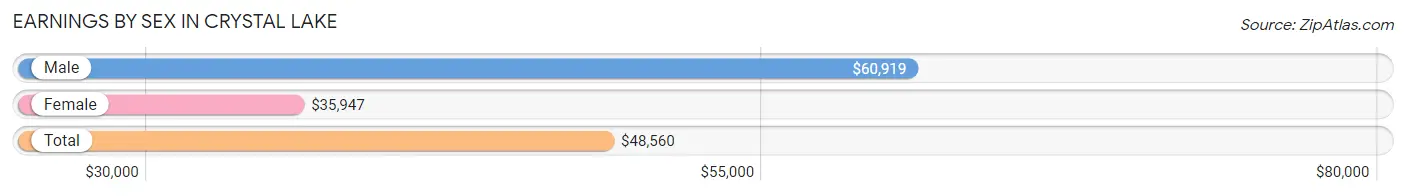
Earnings by Sex in Crystal Lake
Average Earnings in Crystal Lake are $48,560, $60,919 for men and $35,947 for women, a difference of 41.0%.
| Sex | Number | Average Earnings |
| Male | 12,580 (53.9%) | $60,919 |
| Female | 10,750 (46.1%) | $35,947 |
| Total | 23,330 (100.0%) | $48,560 |
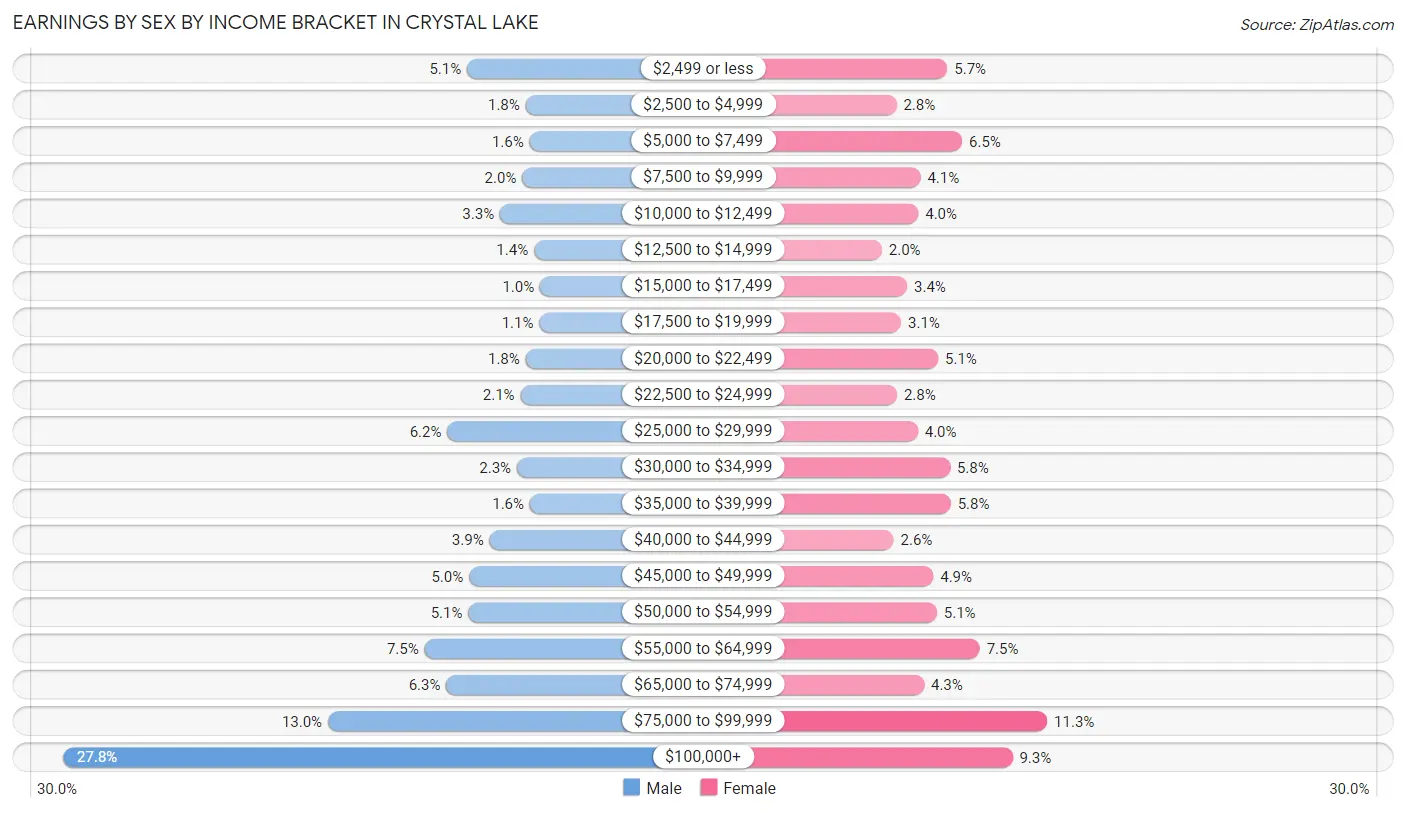
Earnings by Sex by Income Bracket in Crystal Lake
The most common earnings brackets in Crystal Lake are $100,000+ for men (3,496 | 27.8%) and $75,000 to $99,999 for women (1,210 | 11.3%).
| Income | Male | Female |
| $2,499 or less | 645 (5.1%) | 607 (5.7%) |
| $2,500 to $4,999 | 232 (1.8%) | 300 (2.8%) |
| $5,000 to $7,499 | 204 (1.6%) | 697 (6.5%) |
| $7,500 to $9,999 | 255 (2.0%) | 445 (4.1%) |
| $10,000 to $12,499 | 412 (3.3%) | 432 (4.0%) |
| $12,500 to $14,999 | 172 (1.4%) | 212 (2.0%) |
| $15,000 to $17,499 | 130 (1.0%) | 364 (3.4%) |
| $17,500 to $19,999 | 134 (1.1%) | 328 (3.0%) |
| $20,000 to $22,499 | 231 (1.8%) | 552 (5.1%) |
| $22,500 to $24,999 | 268 (2.1%) | 303 (2.8%) |
| $25,000 to $29,999 | 785 (6.2%) | 429 (4.0%) |
| $30,000 to $34,999 | 293 (2.3%) | 623 (5.8%) |
| $35,000 to $39,999 | 201 (1.6%) | 628 (5.8%) |
| $40,000 to $44,999 | 487 (3.9%) | 283 (2.6%) |
| $45,000 to $49,999 | 631 (5.0%) | 522 (4.9%) |
| $50,000 to $54,999 | 637 (5.1%) | 544 (5.1%) |
| $55,000 to $64,999 | 946 (7.5%) | 803 (7.5%) |
| $65,000 to $74,999 | 792 (6.3%) | 467 (4.3%) |
| $75,000 to $99,999 | 1,629 (13.0%) | 1,210 (11.3%) |
| $100,000+ | 3,496 (27.8%) | 1,001 (9.3%) |
| Total | 12,580 (100.0%) | 10,750 (100.0%) |
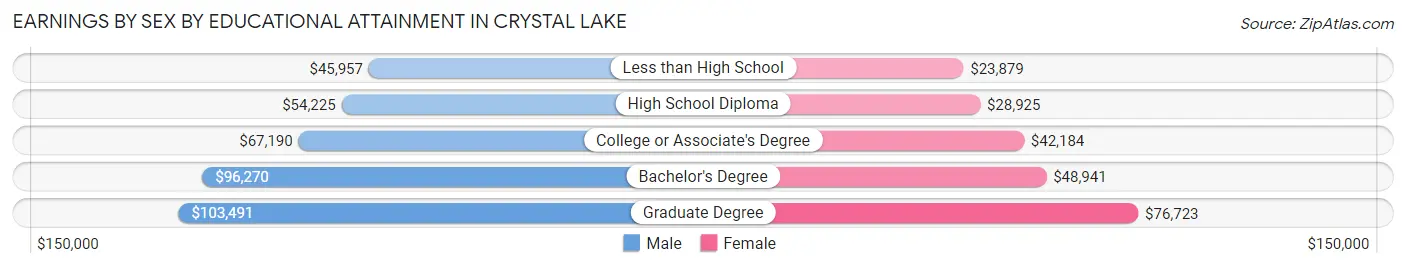
Earnings by Sex by Educational Attainment in Crystal Lake
Average earnings in Crystal Lake are $72,036 for men and $44,942 for women, a difference of 37.6%. Men with an educational attainment of graduate degree enjoy the highest average annual earnings of $103,491, while those with less than high school education earn the least with $45,957. Women with an educational attainment of graduate degree earn the most with the average annual earnings of $76,723, while those with less than high school education have the smallest earnings of $23,879.
| Educational Attainment | Male Income | Female Income |
| Less than High School | $45,957 | $23,879 |
| High School Diploma | $54,225 | $28,925 |
| College or Associate's Degree | $67,190 | $42,184 |
| Bachelor's Degree | $96,270 | $48,941 |
| Graduate Degree | $103,491 | $76,723 |
| Total | $72,036 | $44,942 |
Family Income in Crystal Lake
Family Income Brackets in Crystal Lake
According to the Crystal Lake family income data, there are 2,950 families falling into the $100,000 to $149,999 income range, which is the most common income bracket and makes up 26.4% of all families. Conversely, the $15,000 to $24,999 income bracket is the least frequent group with only 78 families (0.7%) belonging to this category.
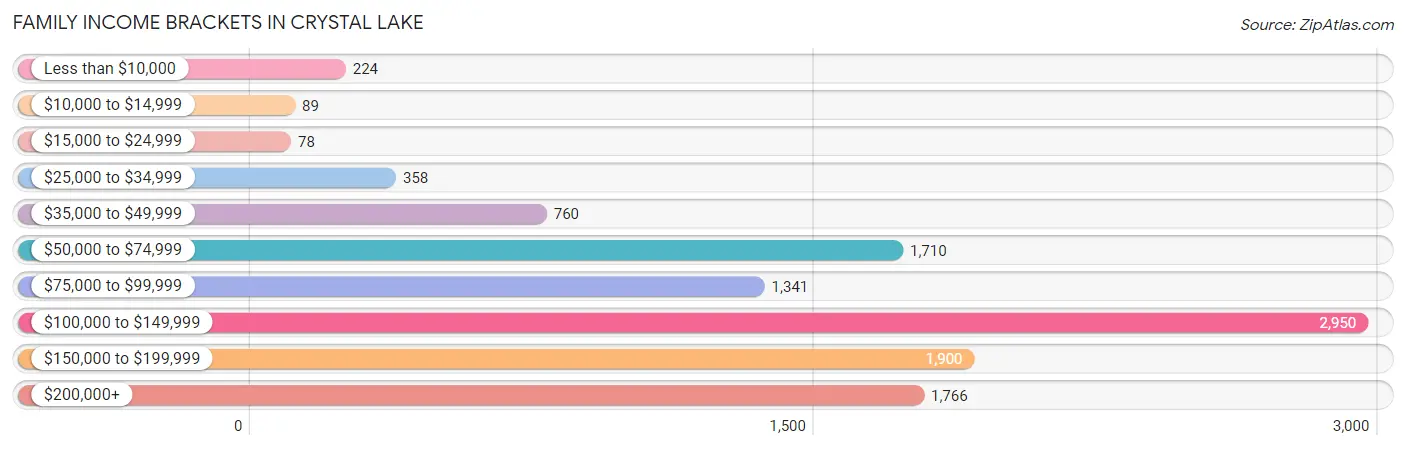
| Income Bracket | # Families | % Families |
| Less than $10,000 | 224 | 2.0% |
| $10,000 to $14,999 | 89 | 0.8% |
| $15,000 to $24,999 | 78 | 0.7% |
| $25,000 to $34,999 | 358 | 3.2% |
| $35,000 to $49,999 | 760 | 6.8% |
| $50,000 to $74,999 | 1,710 | 15.3% |
| $75,000 to $99,999 | 1,341 | 12.0% |
| $100,000 to $149,999 | 2,950 | 26.4% |
| $150,000 to $199,999 | 1,900 | 17.0% |
| $200,000+ | 1,766 | 15.8% |
Family Income by Famaliy Size in Crystal Lake
5-person families (861 | 7.7%) account for the highest median family income in Crystal Lake with $140,729 per family, while 2-person families (4,836 | 43.3%) have the highest median income of $42,631 per family member.
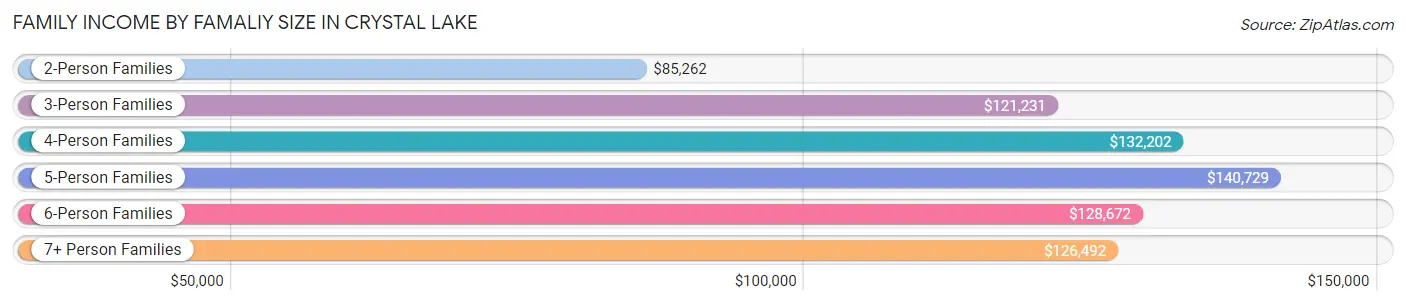
| Income Bracket | # Families | Median Income |
| 2-Person Families | 4,836 (43.3%) | $85,262 |
| 3-Person Families | 2,563 (22.9%) | $121,231 |
| 4-Person Families | 2,317 (20.7%) | $132,202 |
| 5-Person Families | 861 (7.7%) | $140,729 |
| 6-Person Families | 461 (4.1%) | $128,672 |
| 7+ Person Families | 137 (1.2%) | $126,492 |
| Total | 11,175 (100.0%) | $115,861 |
Family Income by Number of Earners in Crystal Lake
The median family income in Crystal Lake is $115,861, with families comprising 3+ earners (2,040) having the highest median family income of $157,154, while families with no earners (1,169) have the lowest median family income of $60,080, accounting for 18.3% and 10.5% of families, respectively.
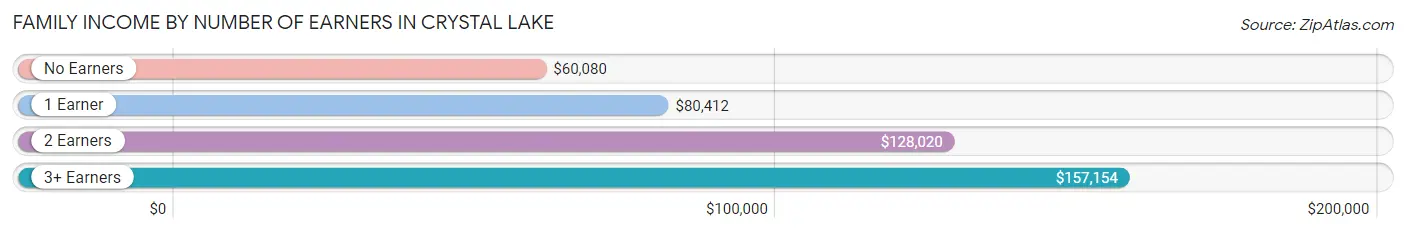
| Number of Earners | # Families | Median Income |
| No Earners | 1,169 (10.5%) | $60,080 |
| 1 Earner | 3,186 (28.5%) | $80,412 |
| 2 Earners | 4,780 (42.8%) | $128,020 |
| 3+ Earners | 2,040 (18.3%) | $157,154 |
| Total | 11,175 (100.0%) | $115,861 |
Household Income in Crystal Lake
Household Income Brackets in Crystal Lake
With 3,472 households falling in the category, the $100,000 to $149,999 income range is the most frequent in Crystal Lake, accounting for 23.5% of all households. In contrast, only 207 households (1.4%) fall into the $10,000 to $14,999 income bracket, making it the least populous group.
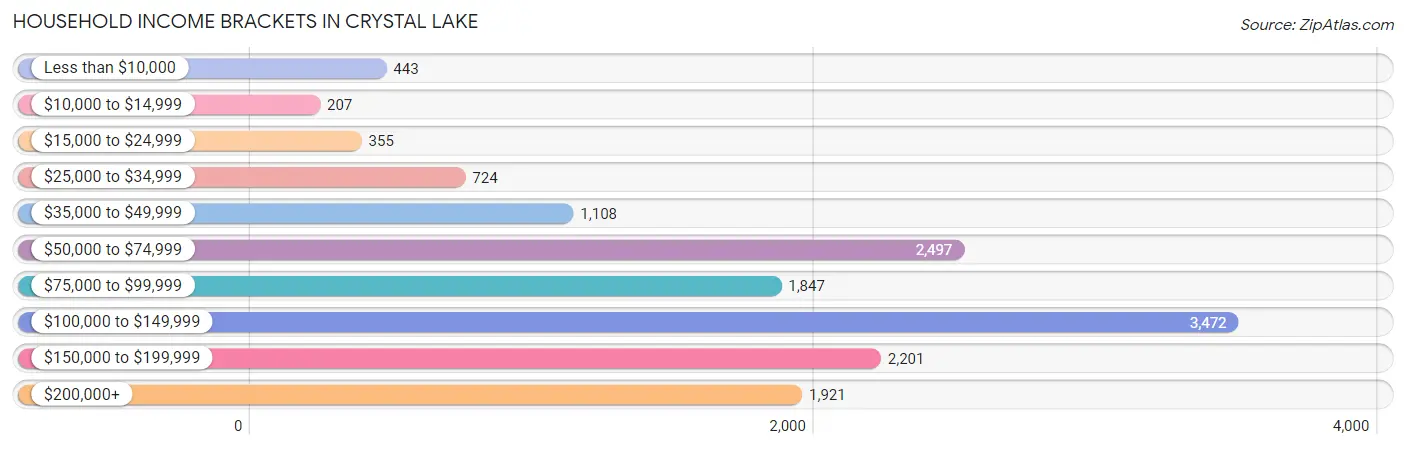
| Income Bracket | # Households | % Households |
| Less than $10,000 | 443 | 3.0% |
| $10,000 to $14,999 | 207 | 1.4% |
| $15,000 to $24,999 | 355 | 2.4% |
| $25,000 to $34,999 | 724 | 4.9% |
| $35,000 to $49,999 | 1,108 | 7.5% |
| $50,000 to $74,999 | 2,497 | 16.9% |
| $75,000 to $99,999 | 1,847 | 12.5% |
| $100,000 to $149,999 | 3,472 | 23.5% |
| $150,000 to $199,999 | 2,201 | 14.9% |
| $200,000+ | 1,921 | 13.0% |
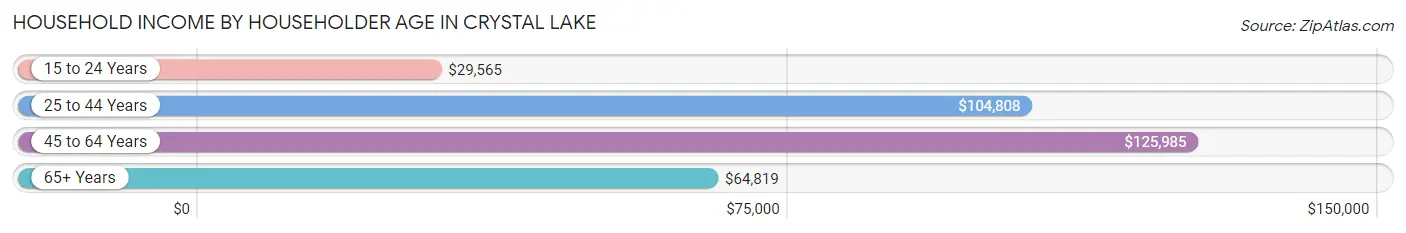
Household Income by Householder Age in Crystal Lake
The median household income in Crystal Lake is $103,018, with the highest median household income of $125,985 found in the 45 to 64 years age bracket for the primary householder. A total of 5,950 households (40.3%) fall into this category. Meanwhile, the 15 to 24 years age bracket for the primary householder has the lowest median household income of $29,565, with 252 households (1.7%) in this group.
| Income Bracket | # Households | Median Income |
| 15 to 24 Years | 252 (1.7%) | $29,565 |
| 25 to 44 Years | 4,740 (32.1%) | $104,808 |
| 45 to 64 Years | 5,950 (40.3%) | $125,985 |
| 65+ Years | 3,832 (25.9%) | $64,819 |
| Total | 14,774 (100.0%) | $103,018 |
Poverty in Crystal Lake
Income Below Poverty by Sex and Age in Crystal Lake
With 4.7% poverty level for males and 5.9% for females among the residents of Crystal Lake, 5 year old males and 25 to 34 year old females are the most vulnerable to poverty, with 31 males (17.8%) and 267 females (14.3%) in their respective age groups living below the poverty level.
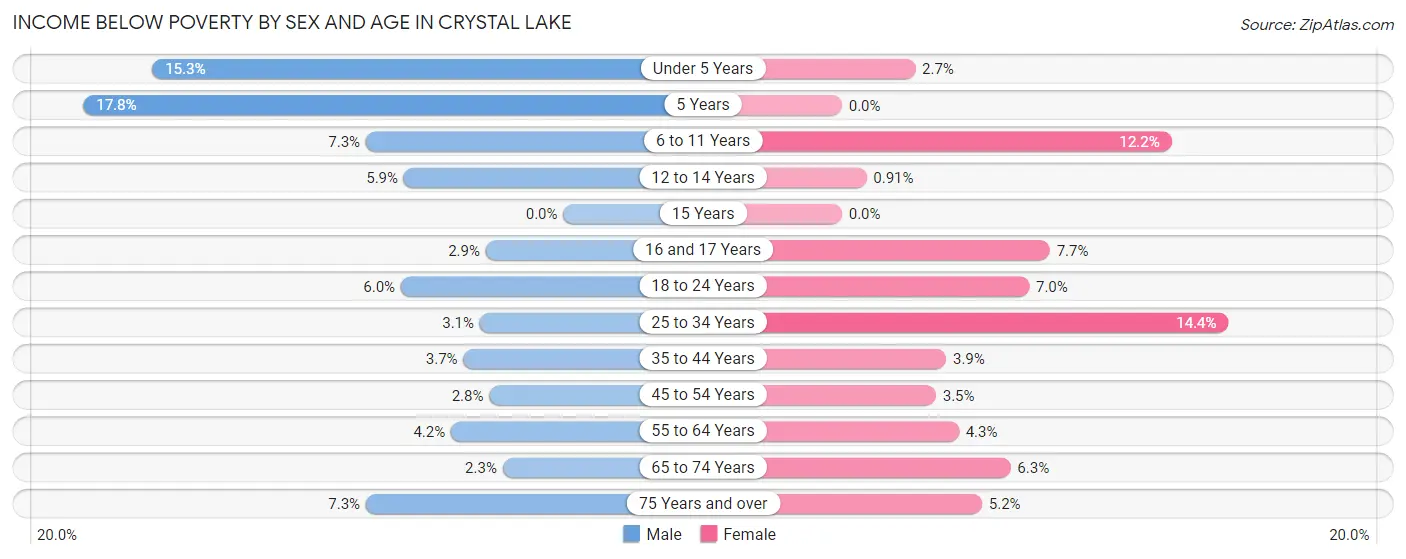
| Age Bracket | Male | Female |
| Under 5 Years | 121 (15.3%) | 24 (2.7%) |
| 5 Years | 31 (17.8%) | 0 (0.0%) |
| 6 to 11 Years | 115 (7.3%) | 191 (12.2%) |
| 12 to 14 Years | 74 (5.9%) | 8 (0.9%) |
| 15 Years | 0 (0.0%) | 0 (0.0%) |
| 16 and 17 Years | 21 (2.9%) | 41 (7.7%) |
| 18 to 24 Years | 113 (6.0%) | 134 (7.0%) |
| 25 to 34 Years | 60 (3.1%) | 267 (14.3%) |
| 35 to 44 Years | 110 (3.7%) | 125 (3.9%) |
| 45 to 54 Years | 83 (2.8%) | 96 (3.5%) |
| 55 to 64 Years | 109 (4.2%) | 119 (4.3%) |
| 65 to 74 Years | 42 (2.2%) | 124 (6.3%) |
| 75 Years and over | 53 (7.3%) | 63 (5.2%) |
| Total | 932 (4.7%) | 1,192 (5.9%) |
Income Above Poverty by Sex and Age in Crystal Lake
According to the poverty statistics in Crystal Lake, males aged 15 years and females aged 5 years are the age groups that are most secure financially, with 100.0% of males and 100.0% of females in these age groups living above the poverty line.
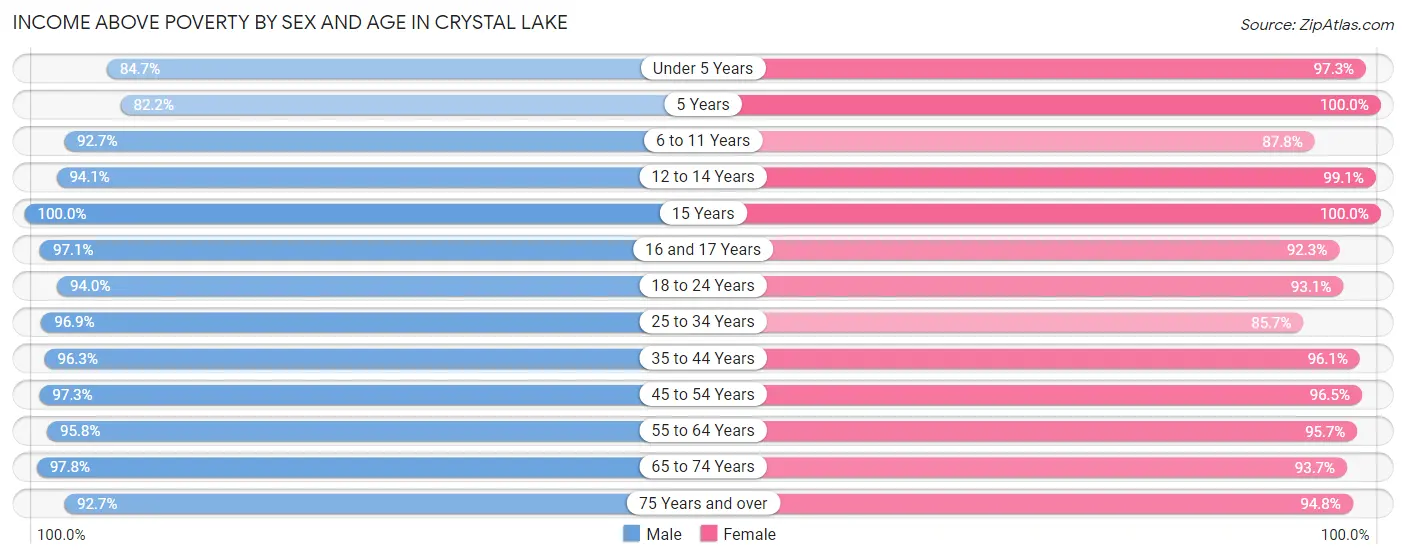
| Age Bracket | Male | Female |
| Under 5 Years | 672 (84.7%) | 859 (97.3%) |
| 5 Years | 143 (82.2%) | 445 (100.0%) |
| 6 to 11 Years | 1,453 (92.7%) | 1,369 (87.8%) |
| 12 to 14 Years | 1,176 (94.1%) | 871 (99.1%) |
| 15 Years | 273 (100.0%) | 293 (100.0%) |
| 16 and 17 Years | 707 (97.1%) | 490 (92.3%) |
| 18 to 24 Years | 1,760 (94.0%) | 1,795 (93.0%) |
| 25 to 34 Years | 1,876 (96.9%) | 1,593 (85.7%) |
| 35 to 44 Years | 2,852 (96.3%) | 3,101 (96.1%) |
| 45 to 54 Years | 2,933 (97.3%) | 2,652 (96.5%) |
| 55 to 64 Years | 2,508 (95.8%) | 2,621 (95.7%) |
| 65 to 74 Years | 1,822 (97.8%) | 1,857 (93.7%) |
| 75 Years and over | 670 (92.7%) | 1,149 (94.8%) |
| Total | 18,845 (95.3%) | 19,095 (94.1%) |
Income Below Poverty Among Married-Couple Families in Crystal Lake
The poverty statistics for married-couple families in Crystal Lake show that 1.8% or 168 of the total 9,080 families live below the poverty line. Families with 3 or 4 children have the highest poverty rate of 7.9%, comprising of 65 families. On the other hand, families with 5 or more children have the lowest poverty rate of 0.0%, which includes 0 families.
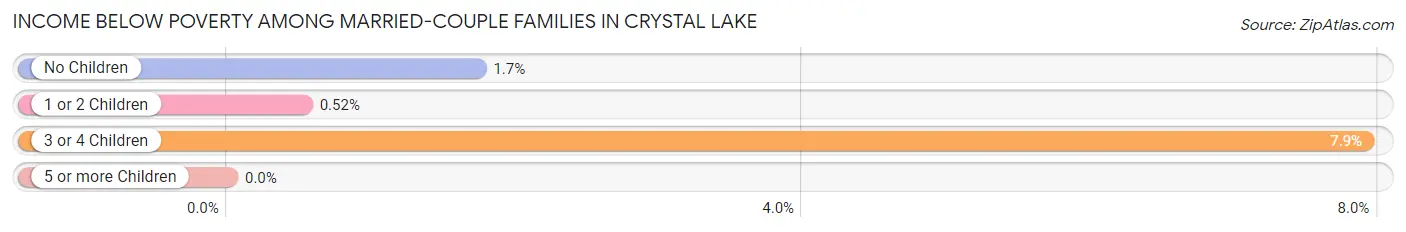
| Children | Above Poverty | Below Poverty |
| No Children | 4,897 (98.3%) | 86 (1.7%) |
| 1 or 2 Children | 3,241 (99.5%) | 17 (0.5%) |
| 3 or 4 Children | 757 (92.1%) | 65 (7.9%) |
| 5 or more Children | 17 (100.0%) | 0 (0.0%) |
| Total | 8,912 (98.2%) | 168 (1.8%) |
Income Below Poverty Among Single-Parent Households in Crystal Lake
According to the poverty data in Crystal Lake, 1.4% or 9 single-father households and 17.2% or 252 single-mother households are living below the poverty line. Among single-father households, those with 1 or 2 children have the highest poverty rate, with 9 households (3.6%) experiencing poverty. Likewise, among single-mother households, those with 1 or 2 children have the highest poverty rate, with 168 households (19.3%) falling below the poverty line.
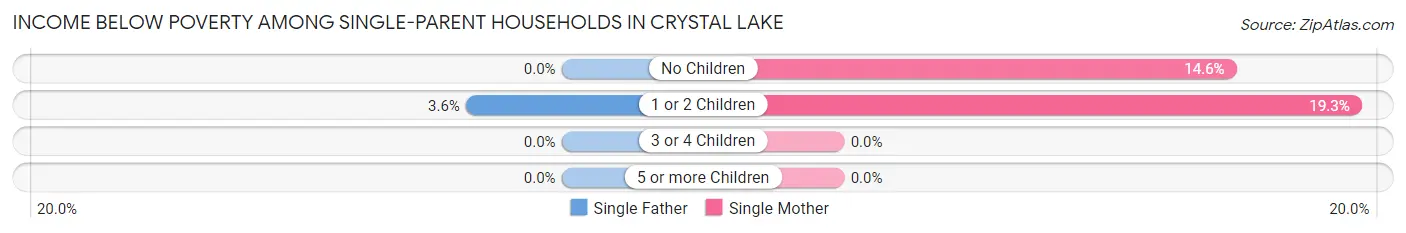
| Children | Single Father | Single Mother |
| No Children | 0 (0.0%) | 84 (14.6%) |
| 1 or 2 Children | 9 (3.6%) | 168 (19.3%) |
| 3 or 4 Children | 0 (0.0%) | 0 (0.0%) |
| 5 or more Children | 0 (0.0%) | 0 (0.0%) |
| Total | 9 (1.4%) | 252 (17.2%) |
Income Below Poverty Among Married-Couple vs Single-Parent Households in Crystal Lake
The poverty data for Crystal Lake shows that 168 of the married-couple family households (1.8%) and 261 of the single-parent households (12.5%) are living below the poverty level. Within the married-couple family households, those with 3 or 4 children have the highest poverty rate, with 65 households (7.9%) falling below the poverty line. Among the single-parent households, those with 1 or 2 children have the highest poverty rate, with 177 household (15.8%) living below poverty.
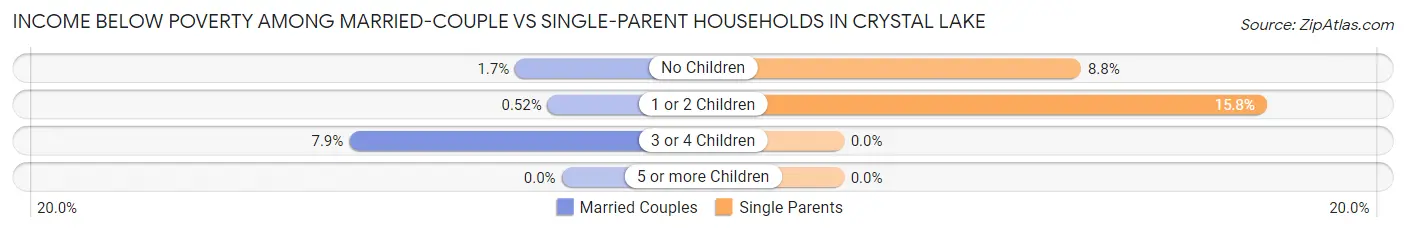
| Children | Married-Couple Families | Single-Parent Households |
| No Children | 86 (1.7%) | 84 (8.8%) |
| 1 or 2 Children | 17 (0.5%) | 177 (15.8%) |
| 3 or 4 Children | 65 (7.9%) | 0 (0.0%) |
| 5 or more Children | 0 (0.0%) | 0 (0.0%) |
| Total | 168 (1.8%) | 261 (12.5%) |
Race in Crystal Lake
The most populous races in Crystal Lake are White / Caucasian (35,782 | 88.4%), Hispanic or Latino (4,658 | 11.5%), and Two or more Races (1,861 | 4.6%).
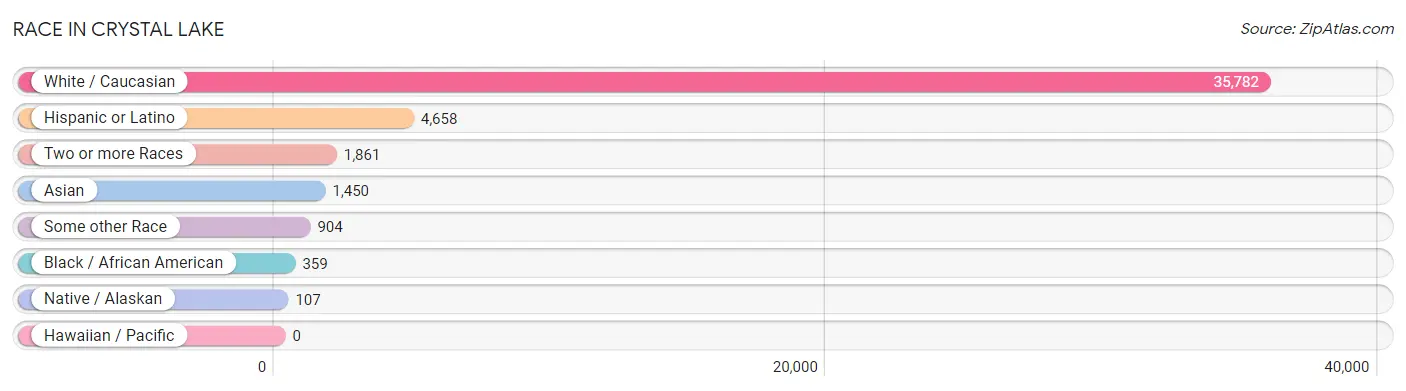
| Race | # Population | % Population |
| Asian | 1,450 | 3.6% |
| Black / African American | 359 | 0.9% |
| Hawaiian / Pacific | 0 | 0.0% |
| Hispanic or Latino | 4,658 | 11.5% |
| Native / Alaskan | 107 | 0.3% |
| White / Caucasian | 35,782 | 88.4% |
| Two or more Races | 1,861 | 4.6% |
| Some other Race | 904 | 2.2% |
| Total | 40,463 | 100.0% |
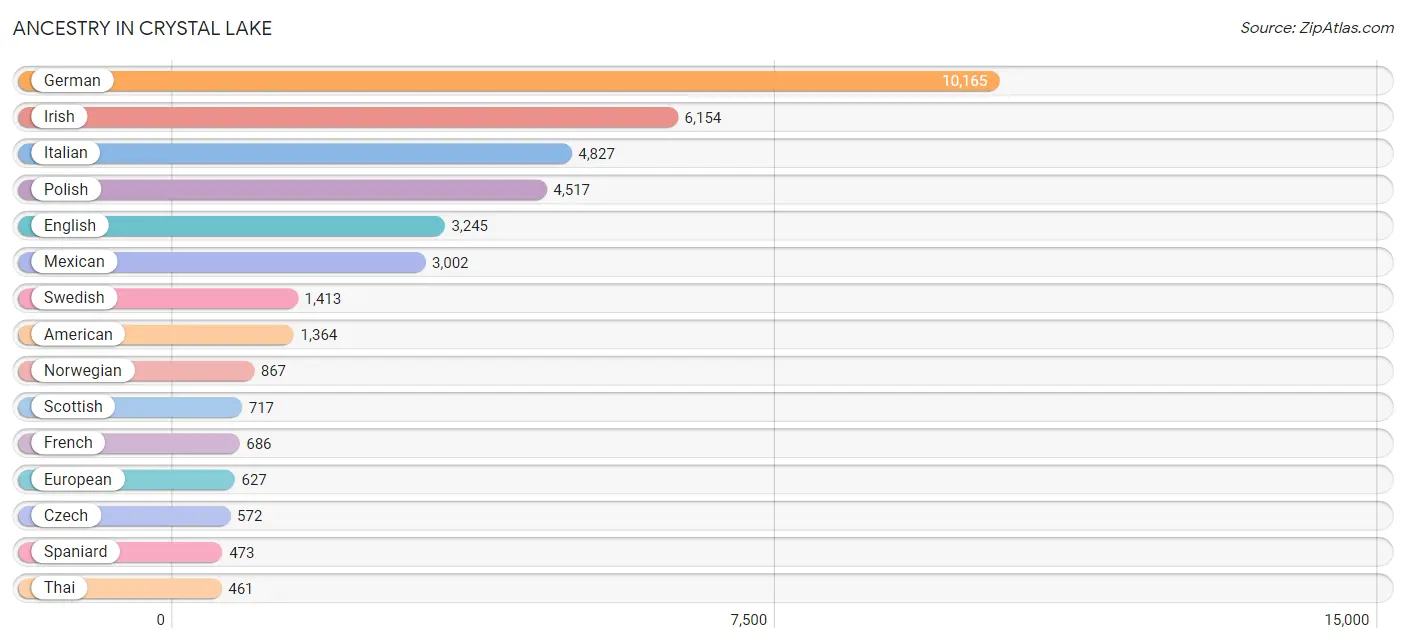
Ancestry in Crystal Lake
The most populous ancestries reported in Crystal Lake are German (10,165 | 25.1%), Irish (6,154 | 15.2%), Italian (4,827 | 11.9%), Polish (4,517 | 11.2%), and English (3,245 | 8.0%), together accounting for 71.4% of all Crystal Lake residents.
| Ancestry | # Population | % Population |
| African | 18 | 0.0% |
| American | 1,364 | 3.4% |
| Apache | 21 | 0.1% |
| Arab | 40 | 0.1% |
| Argentinean | 17 | 0.0% |
| Armenian | 171 | 0.4% |
| Austrian | 291 | 0.7% |
| Belgian | 121 | 0.3% |
| Bhutanese | 86 | 0.2% |
| Brazilian | 95 | 0.2% |
| British | 200 | 0.5% |
| Bulgarian | 137 | 0.3% |
| Burmese | 208 | 0.5% |
| Cambodian | 32 | 0.1% |
| Canadian | 122 | 0.3% |
| Central American | 363 | 0.9% |
| Cherokee | 38 | 0.1% |
| Chilean | 59 | 0.2% |
| Chippewa | 25 | 0.1% |
| Colombian | 161 | 0.4% |
| Croatian | 208 | 0.5% |
| Cuban | 38 | 0.1% |
| Czech | 572 | 1.4% |
| Czechoslovakian | 34 | 0.1% |
| Danish | 266 | 0.7% |
| Dominican | 74 | 0.2% |
| Dutch | 354 | 0.9% |
| Eastern European | 77 | 0.2% |
| English | 3,245 | 8.0% |
| Estonian | 22 | 0.1% |
| European | 627 | 1.5% |
| Finnish | 88 | 0.2% |
| French | 686 | 1.7% |
| French Canadian | 245 | 0.6% |
| German | 10,165 | 25.1% |
| Greek | 280 | 0.7% |
| Guatemalan | 46 | 0.1% |
| Hungarian | 171 | 0.4% |
| Indian (Asian) | 180 | 0.4% |
| Irish | 6,154 | 15.2% |
| Italian | 4,827 | 11.9% |
| Korean | 436 | 1.1% |
| Latvian | 89 | 0.2% |
| Lebanese | 25 | 0.1% |
| Lithuanian | 308 | 0.8% |
| Luxembourger | 45 | 0.1% |
| Maltese | 102 | 0.3% |
| Mexican | 3,002 | 7.4% |
| Mexican American Indian | 66 | 0.2% |
| Nicaraguan | 117 | 0.3% |
| Nigerian | 18 | 0.0% |
| Northern European | 80 | 0.2% |
| Norwegian | 867 | 2.1% |
| Pakistani | 24 | 0.1% |
| Panamanian | 29 | 0.1% |
| Polish | 4,517 | 11.2% |
| Portuguese | 101 | 0.3% |
| Puerto Rican | 442 | 1.1% |
| Romanian | 105 | 0.3% |
| Russian | 367 | 0.9% |
| Salvadoran | 171 | 0.4% |
| Scandinavian | 214 | 0.5% |
| Scotch-Irish | 175 | 0.4% |
| Scottish | 717 | 1.8% |
| Serbian | 73 | 0.2% |
| Slavic | 20 | 0.1% |
| Slovak | 93 | 0.2% |
| Slovene | 51 | 0.1% |
| South American | 237 | 0.6% |
| Spaniard | 473 | 1.2% |
| Spanish | 29 | 0.1% |
| Sri Lankan | 141 | 0.4% |
| Subsaharan African | 36 | 0.1% |
| Swedish | 1,413 | 3.5% |
| Swiss | 111 | 0.3% |
| Thai | 461 | 1.1% |
| Ukrainian | 305 | 0.7% |
| Welsh | 174 | 0.4% |
| Yugoslavian | 23 | 0.1% | View All 79 Rows |
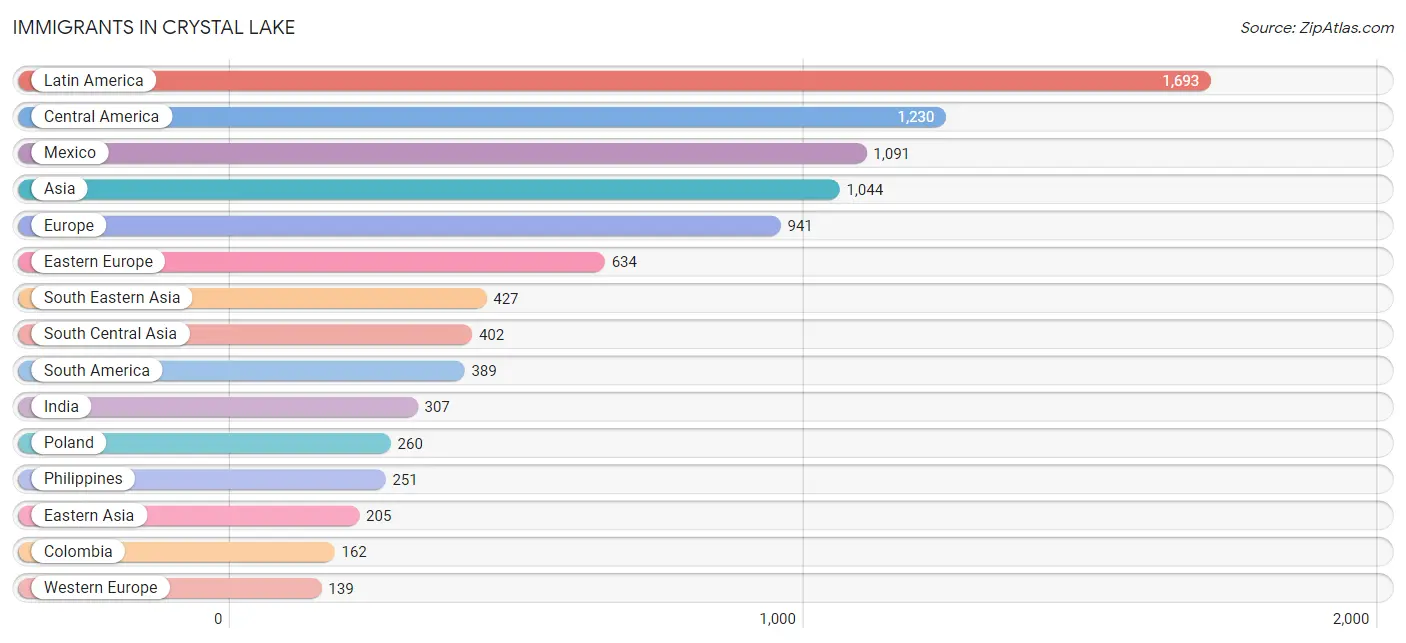
Immigrants in Crystal Lake
The most numerous immigrant groups reported in Crystal Lake came from Latin America (1,693 | 4.2%), Central America (1,230 | 3.0%), Mexico (1,091 | 2.7%), Asia (1,044 | 2.6%), and Europe (941 | 2.3%), together accounting for 14.8% of all Crystal Lake residents.
| Immigration Origin | # Population | % Population |
| Africa | 18 | 0.0% |
| Argentina | 31 | 0.1% |
| Asia | 1,044 | 2.6% |
| Austria | 9 | 0.0% |
| Bangladesh | 19 | 0.1% |
| Belarus | 17 | 0.0% |
| Belgium | 8 | 0.0% |
| Brazil | 64 | 0.2% |
| Bulgaria | 40 | 0.1% |
| Canada | 54 | 0.1% |
| Caribbean | 74 | 0.2% |
| Central America | 1,230 | 3.0% |
| Chile | 59 | 0.2% |
| China | 91 | 0.2% |
| Colombia | 162 | 0.4% |
| Czechoslovakia | 9 | 0.0% |
| Denmark | 20 | 0.1% |
| Dominican Republic | 74 | 0.2% |
| Eastern Asia | 205 | 0.5% |
| Eastern Europe | 634 | 1.6% |
| El Salvador | 112 | 0.3% |
| England | 38 | 0.1% |
| Europe | 941 | 2.3% |
| Germany | 102 | 0.3% |
| Greece | 13 | 0.0% |
| Hong Kong | 6 | 0.0% |
| Hungary | 33 | 0.1% |
| India | 307 | 0.8% |
| Indonesia | 32 | 0.1% |
| Ireland | 22 | 0.1% |
| Italy | 38 | 0.1% |
| Japan | 37 | 0.1% |
| Korea | 45 | 0.1% |
| Kuwait | 10 | 0.0% |
| Latin America | 1,693 | 4.2% |
| Latvia | 29 | 0.1% |
| Mexico | 1,091 | 2.7% |
| Nepal | 30 | 0.1% |
| Netherlands | 8 | 0.0% |
| Nicaragua | 27 | 0.1% |
| Nigeria | 18 | 0.0% |
| Northern Europe | 107 | 0.3% |
| Pakistan | 46 | 0.1% |
| Philippines | 251 | 0.6% |
| Poland | 260 | 0.6% |
| Romania | 46 | 0.1% |
| Russia | 22 | 0.1% |
| Scotland | 13 | 0.0% |
| South America | 389 | 1.0% |
| South Central Asia | 402 | 1.0% |
| South Eastern Asia | 427 | 1.1% |
| Southern Europe | 61 | 0.2% |
| Spain | 10 | 0.0% |
| Switzerland | 12 | 0.0% |
| Thailand | 24 | 0.1% |
| Ukraine | 64 | 0.2% |
| Venezuela | 73 | 0.2% |
| Vietnam | 120 | 0.3% |
| Western Africa | 18 | 0.0% |
| Western Asia | 10 | 0.0% |
| Western Europe | 139 | 0.3% | View All 61 Rows |
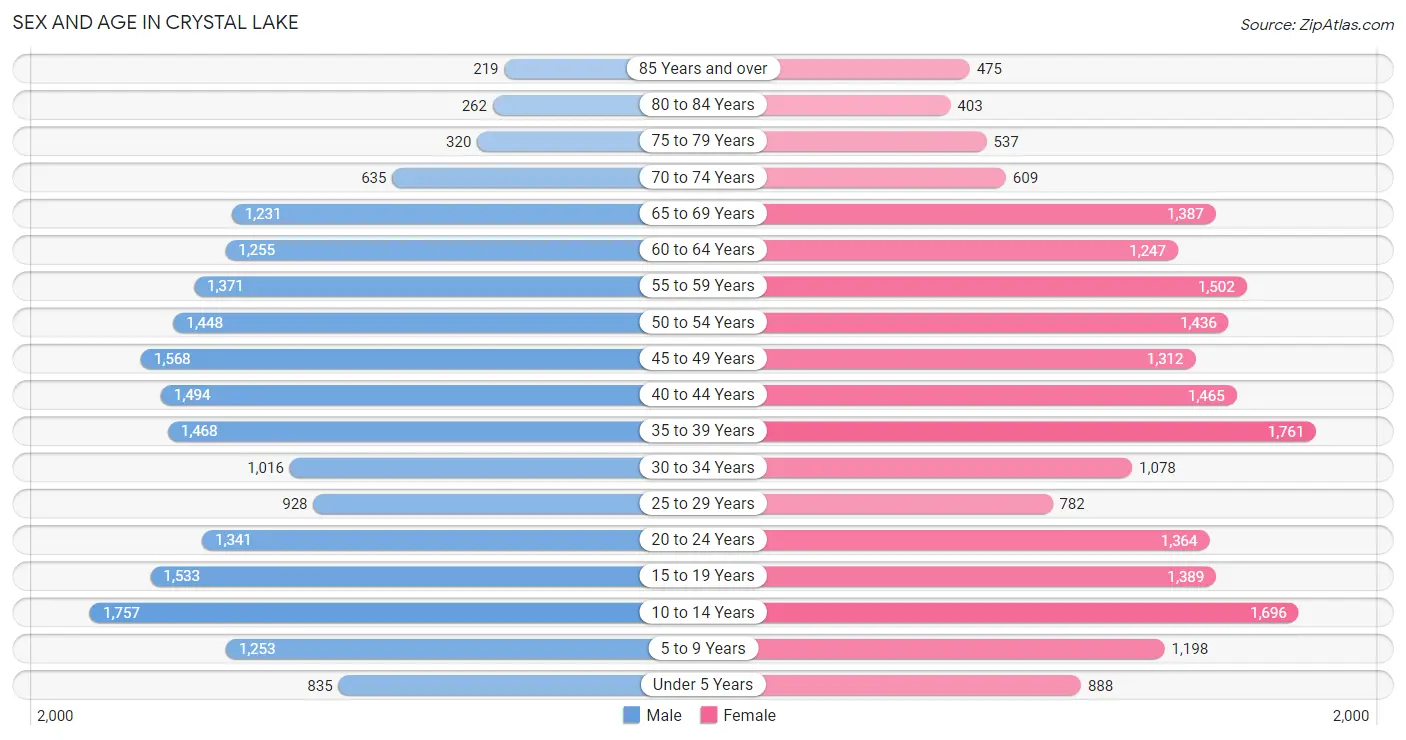
Sex and Age in Crystal Lake
Sex and Age in Crystal Lake
The most populous age groups in Crystal Lake are 10 to 14 Years (1,757 | 8.8%) for men and 35 to 39 Years (1,761 | 8.6%) for women.
| Age Bracket | Male | Female |
| Under 5 Years | 835 (4.2%) | 888 (4.3%) |
| 5 to 9 Years | 1,253 (6.3%) | 1,198 (5.8%) |
| 10 to 14 Years | 1,757 (8.8%) | 1,696 (8.3%) |
| 15 to 19 Years | 1,533 (7.7%) | 1,389 (6.8%) |
| 20 to 24 Years | 1,341 (6.7%) | 1,364 (6.6%) |
| 25 to 29 Years | 928 (4.7%) | 782 (3.8%) |
| 30 to 34 Years | 1,016 (5.1%) | 1,078 (5.2%) |
| 35 to 39 Years | 1,468 (7.4%) | 1,761 (8.6%) |
| 40 to 44 Years | 1,494 (7.5%) | 1,465 (7.1%) |
| 45 to 49 Years | 1,568 (7.9%) | 1,312 (6.4%) |
| 50 to 54 Years | 1,448 (7.3%) | 1,436 (7.0%) |
| 55 to 59 Years | 1,371 (6.9%) | 1,502 (7.3%) |
| 60 to 64 Years | 1,255 (6.3%) | 1,247 (6.1%) |
| 65 to 69 Years | 1,231 (6.2%) | 1,387 (6.8%) |
| 70 to 74 Years | 635 (3.2%) | 609 (3.0%) |
| 75 to 79 Years | 320 (1.6%) | 537 (2.6%) |
| 80 to 84 Years | 262 (1.3%) | 403 (2.0%) |
| 85 Years and over | 219 (1.1%) | 475 (2.3%) |
| Total | 19,934 (100.0%) | 20,529 (100.0%) |
Families and Households in Crystal Lake
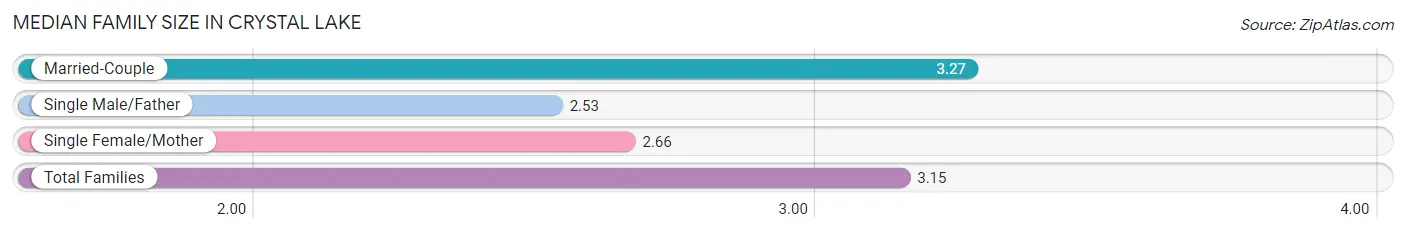
Median Family Size in Crystal Lake
The median family size in Crystal Lake is 3.15 persons per family, with married-couple families (9,080 | 81.2%) accounting for the largest median family size of 3.27 persons per family. On the other hand, single male/father families (628 | 5.6%) represent the smallest median family size with 2.53 persons per family.
| Family Type | # Families | Family Size |
| Married-Couple | 9,080 (81.2%) | 3.27 |
| Single Male/Father | 628 (5.6%) | 2.53 |
| Single Female/Mother | 1,467 (13.1%) | 2.66 |
| Total Families | 11,175 (100.0%) | 3.15 |
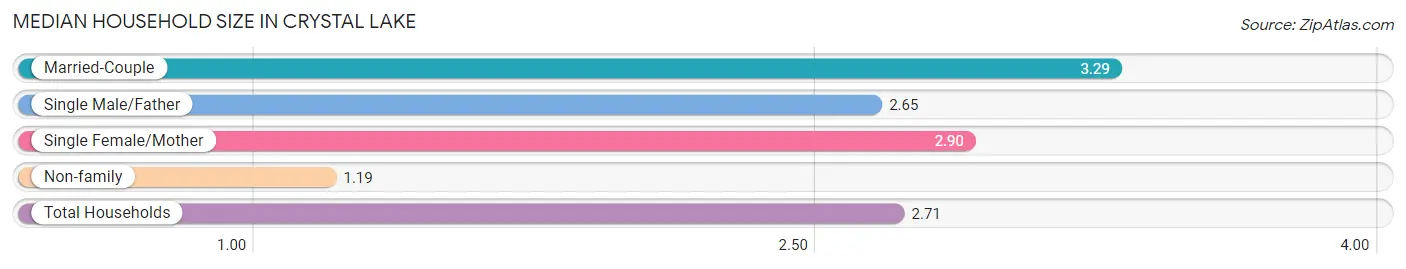
Median Household Size in Crystal Lake
The median household size in Crystal Lake is 2.71 persons per household, with married-couple households (9,080 | 61.5%) accounting for the largest median household size of 3.29 persons per household. non-family households (3,599 | 24.4%) represent the smallest median household size with 1.19 persons per household.
| Household Type | # Households | Household Size |
| Married-Couple | 9,080 (61.5%) | 3.29 |
| Single Male/Father | 628 (4.3%) | 2.65 |
| Single Female/Mother | 1,467 (9.9%) | 2.90 |
| Non-family | 3,599 (24.4%) | 1.19 |
| Total Households | 14,774 (100.0%) | 2.71 |
Household Size by Marriage Status in Crystal Lake
Out of a total of 14,774 households in Crystal Lake, 11,175 (75.6%) are family households, while 3,599 (24.4%) are nonfamily households. The most numerous type of family households are 2-person households, comprising 4,694, and the most common type of nonfamily households are 1-person households, comprising 3,009.
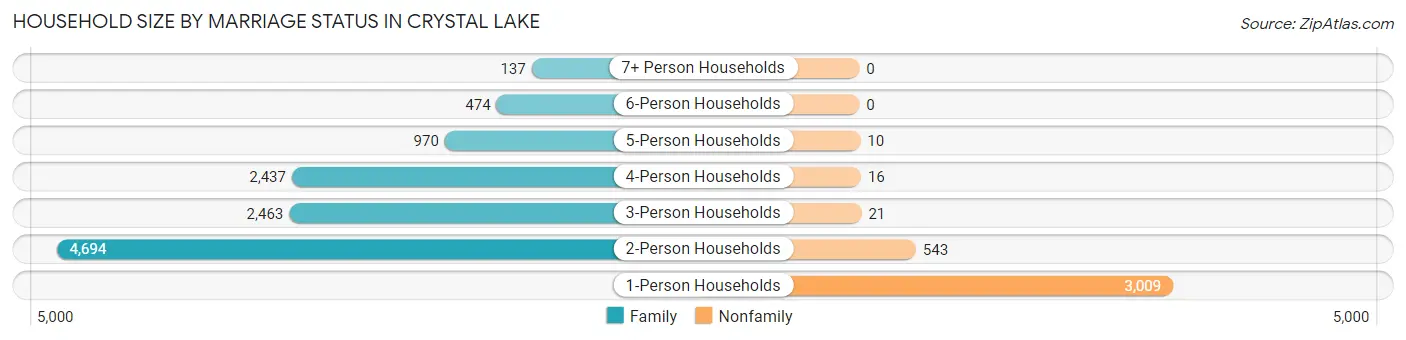
| Household Size | Family Households | Nonfamily Households |
| 1-Person Households | - | 3,009 (20.4%) |
| 2-Person Households | 4,694 (31.8%) | 543 (3.7%) |
| 3-Person Households | 2,463 (16.7%) | 21 (0.1%) |
| 4-Person Households | 2,437 (16.5%) | 16 (0.1%) |
| 5-Person Households | 970 (6.6%) | 10 (0.1%) |
| 6-Person Households | 474 (3.2%) | 0 (0.0%) |
| 7+ Person Households | 137 (0.9%) | 0 (0.0%) |
| Total | 11,175 (75.6%) | 3,599 (24.4%) |
Female Fertility in Crystal Lake
Fertility by Age in Crystal Lake
Average fertility rate in Crystal Lake is 26.0 births per 1,000 women. Women in the age bracket of 35 to 50 years have the highest fertility rate with 34.0 births per 1,000 women. Women in the age bracket of 35 to 50 years acount for 66.8% of all women with births.
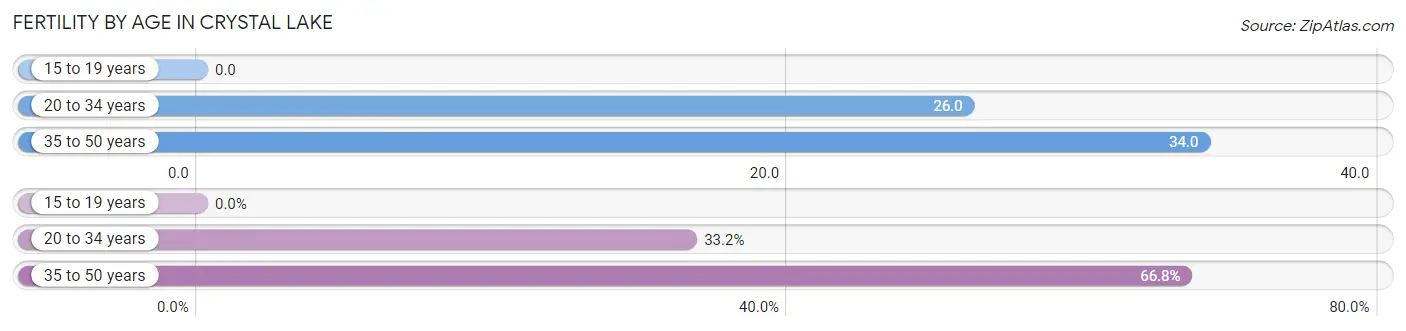
| Age Bracket | Women with Births | Births / 1,000 Women |
| 15 to 19 years | 0 (0.0%) | 0.0 |
| 20 to 34 years | 83 (33.2%) | 26.0 |
| 35 to 50 years | 167 (66.8%) | 34.0 |
| Total | 250 (100.0%) | 26.0 |
Fertility by Age by Marriage Status in Crystal Lake
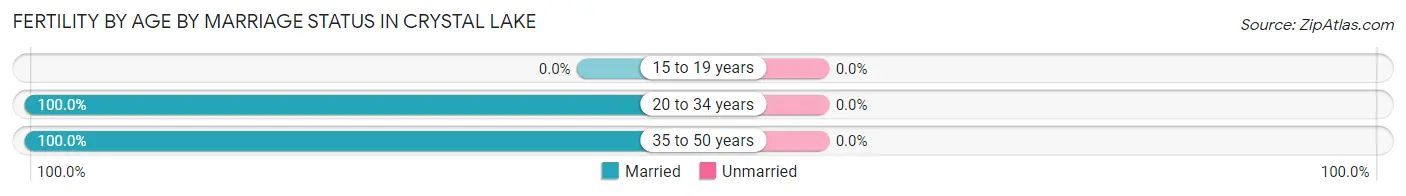
| Age Bracket | Married | Unmarried |
| 15 to 19 years | 0 (0.0%) | 0 (0.0%) |
| 20 to 34 years | 83 (100.0%) | 0 (0.0%) |
| 35 to 50 years | 167 (100.0%) | 0 (0.0%) |
| Total | 250 (100.0%) | 0 (0.0%) |
Fertility by Education in Crystal Lake
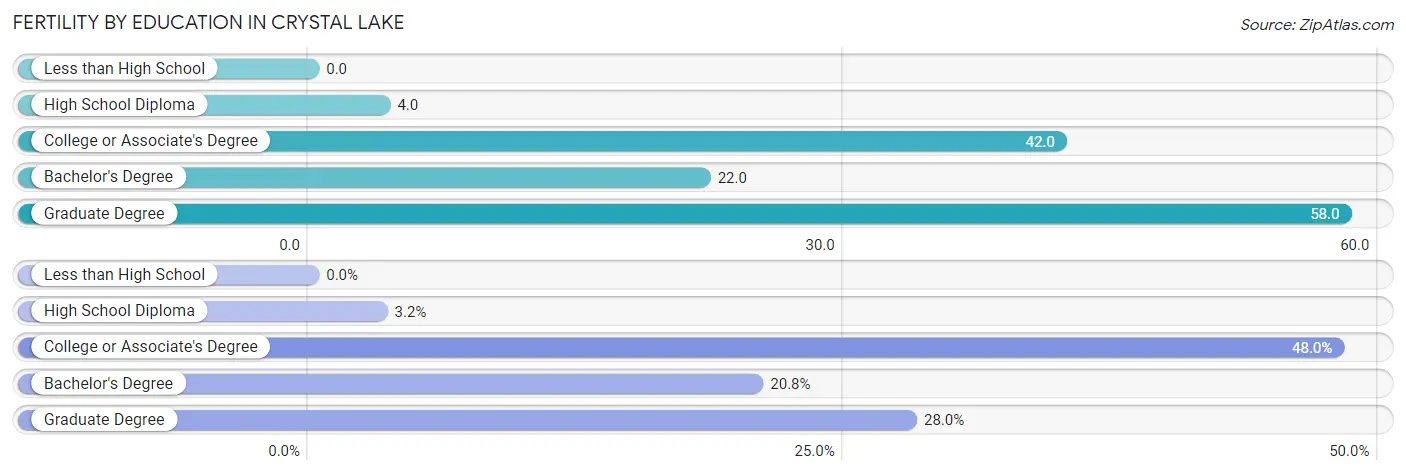
| Educational Attainment | Women with Births | Births / 1,000 Women |
| Less than High School | 0 (0.0%) | 0.0 |
| High School Diploma | 8 (3.2%) | 4.0 |
| College or Associate's Degree | 120 (48.0%) | 42.0 |
| Bachelor's Degree | 52 (20.8%) | 22.0 |
| Graduate Degree | 70 (28.0%) | 58.0 |
| Total | 250 (100.0%) | 26.0 |
Fertility by Education by Marriage Status in Crystal Lake
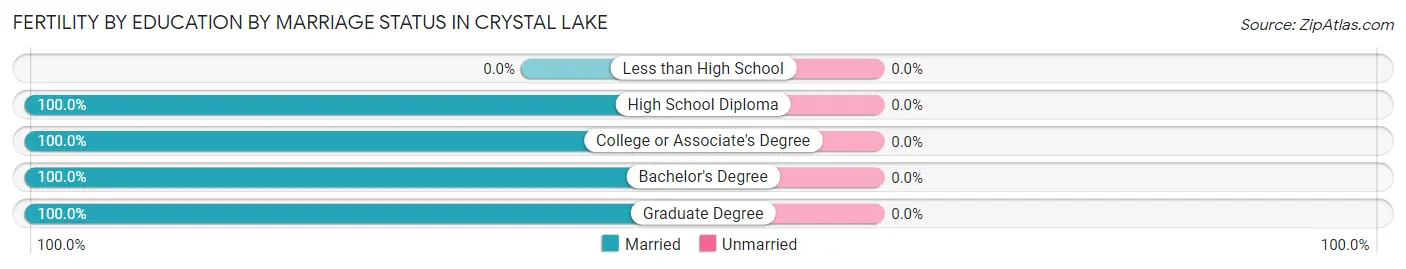
| Educational Attainment | Married | Unmarried |
| Less than High School | 0 (0.0%) | 0 (0.0%) |
| High School Diploma | 8 (100.0%) | 0 (0.0%) |
| College or Associate's Degree | 120 (100.0%) | 0 (0.0%) |
| Bachelor's Degree | 52 (100.0%) | 0 (0.0%) |
| Graduate Degree | 70 (100.0%) | 0 (0.0%) |
| Total | 250 (100.0%) | 0 (0.0%) |
Employment Characteristics in Crystal Lake
Employment by Class of Employer in Crystal Lake
Among the 21,232 employed individuals in Crystal Lake, private company employees (15,344 | 72.3%), local government employees (1,973 | 9.3%), and not-for-profit organizations (1,506 | 7.1%) make up the most common classes of employment.
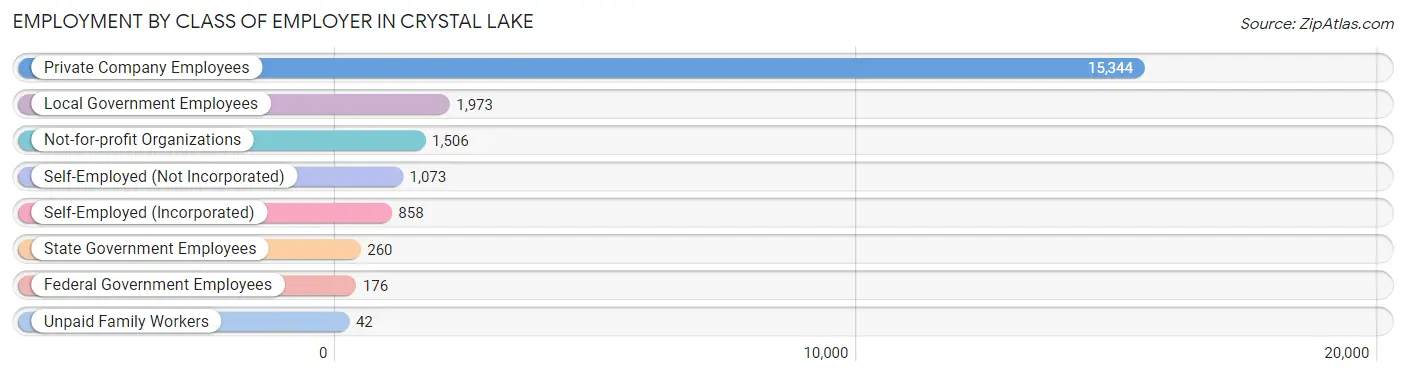
| Employer Class | # Employees | % Employees |
| Private Company Employees | 15,344 | 72.3% |
| Self-Employed (Incorporated) | 858 | 4.0% |
| Self-Employed (Not Incorporated) | 1,073 | 5.1% |
| Not-for-profit Organizations | 1,506 | 7.1% |
| Local Government Employees | 1,973 | 9.3% |
| State Government Employees | 260 | 1.2% |
| Federal Government Employees | 176 | 0.8% |
| Unpaid Family Workers | 42 | 0.2% |
| Total | 21,232 | 100.0% |
Employment Status by Age in Crystal Lake
According to the labor force statistics for Crystal Lake, out of the total population over 16 years of age (32,270), 70.1% or 22,621 individuals are in the labor force, with 4.9% or 1,108 of them unemployed. The age group with the highest labor force participation rate is 25 to 29 years, with 98.0% or 1,676 individuals in the labor force. Within the labor force, the 20 to 24 years age range has the highest percentage of unemployed individuals, with 13.5% or 313 of them being unemployed.
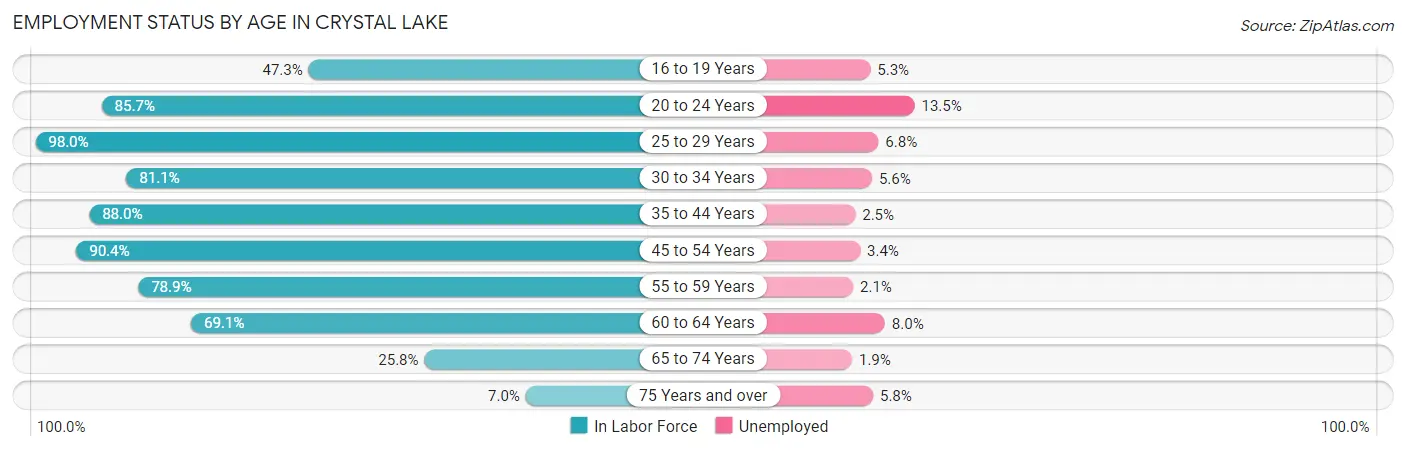
| Age Bracket | In Labor Force | Unemployed |
| 16 to 19 Years | 1,114 (47.3%) | 59 (5.3%) |
| 20 to 24 Years | 2,318 (85.7%) | 313 (13.5%) |
| 25 to 29 Years | 1,676 (98.0%) | 114 (6.8%) |
| 30 to 34 Years | 1,698 (81.1%) | 95 (5.6%) |
| 35 to 44 Years | 5,445 (88.0%) | 136 (2.5%) |
| 45 to 54 Years | 5,211 (90.4%) | 177 (3.4%) |
| 55 to 59 Years | 2,267 (78.9%) | 48 (2.1%) |
| 60 to 64 Years | 1,729 (69.1%) | 138 (8.0%) |
| 65 to 74 Years | 996 (25.8%) | 19 (1.9%) |
| 75 Years and over | 155 (7.0%) | 9 (5.8%) |
| Total | 22,621 (70.1%) | 1,108 (4.9%) |
Employment Status by Educational Attainment in Crystal Lake
According to labor force statistics for Crystal Lake, 85.3% of individuals (18,025) out of the total population between 25 and 64 years of age (21,131) are in the labor force, with 3.9% or 703 of them being unemployed. The group with the highest labor force participation rate are those with the educational attainment of bachelor's degree or higher, with 89.8% or 8,335 individuals in the labor force. Within the labor force, individuals with high school diploma education have the highest percentage of unemployment, with 6.5% or 235 of them being unemployed.
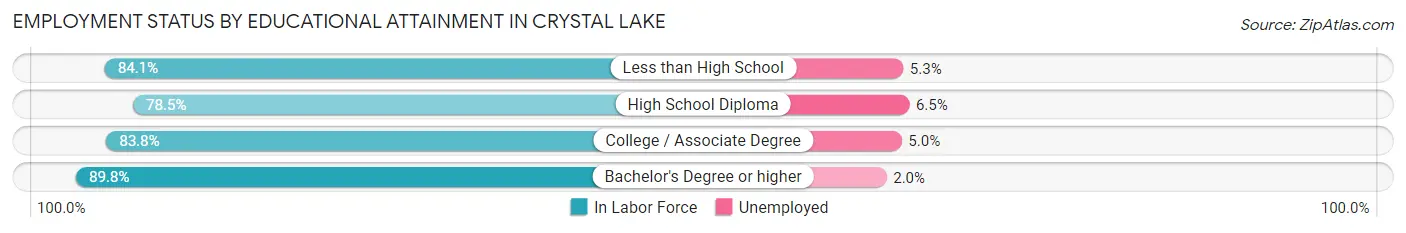
| Educational Attainment | In Labor Force | Unemployed |
| Less than High School | 684 (84.1%) | 43 (5.3%) |
| High School Diploma | 3,609 (78.5%) | 299 (6.5%) |
| College / Associate Degree | 5,396 (83.8%) | 322 (5.0%) |
| Bachelor's Degree or higher | 8,335 (89.8%) | 186 (2.0%) |
| Total | 18,025 (85.3%) | 824 (3.9%) |
Employment Occupations by Sex in Crystal Lake
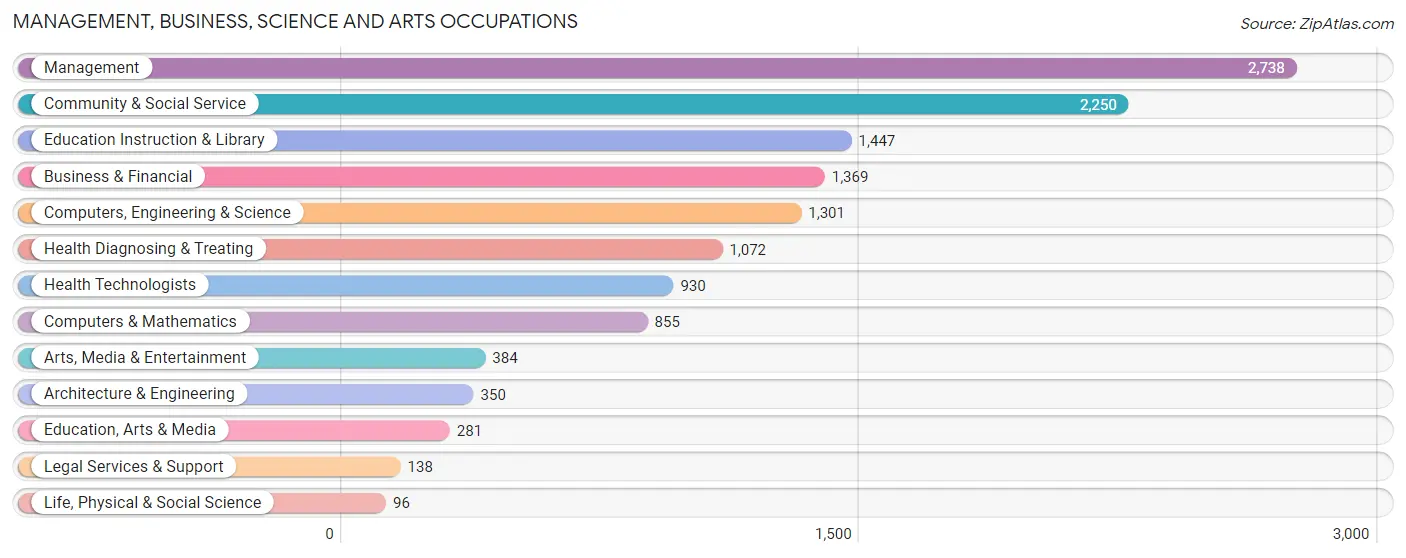
Management, Business, Science and Arts Occupations
The most common Management, Business, Science and Arts occupations in Crystal Lake are Management (2,738 | 12.7%), Community & Social Service (2,250 | 10.5%), Education Instruction & Library (1,447 | 6.7%), Business & Financial (1,369 | 6.4%), and Computers, Engineering & Science (1,301 | 6.0%).
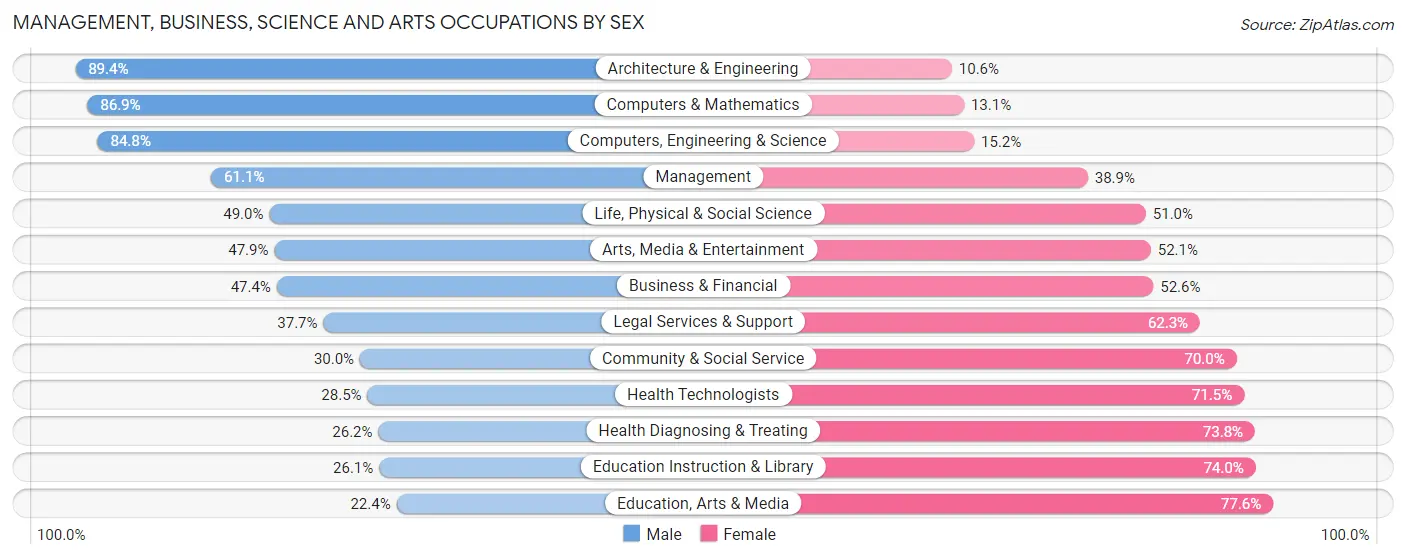
Management, Business, Science and Arts Occupations by Sex
Within the Management, Business, Science and Arts occupations in Crystal Lake, the most male-oriented occupations are Architecture & Engineering (89.4%), Computers & Mathematics (86.9%), and Computers, Engineering & Science (84.8%), while the most female-oriented occupations are Education, Arts & Media (77.6%), Education Instruction & Library (74.0%), and Health Diagnosing & Treating (73.8%).
| Occupation | Male | Female |
| Management | 1,672 (61.1%) | 1,066 (38.9%) |
| Business & Financial | 649 (47.4%) | 720 (52.6%) |
| Computers, Engineering & Science | 1,103 (84.8%) | 198 (15.2%) |
| Computers & Mathematics | 743 (86.9%) | 112 (13.1%) |
| Architecture & Engineering | 313 (89.4%) | 37 (10.6%) |
| Life, Physical & Social Science | 47 (49.0%) | 49 (51.0%) |
| Community & Social Service | 676 (30.0%) | 1,574 (70.0%) |
| Education, Arts & Media | 63 (22.4%) | 218 (77.6%) |
| Legal Services & Support | 52 (37.7%) | 86 (62.3%) |
| Education Instruction & Library | 377 (26.1%) | 1,070 (74.0%) |
| Arts, Media & Entertainment | 184 (47.9%) | 200 (52.1%) |
| Health Diagnosing & Treating | 281 (26.2%) | 791 (73.8%) |
| Health Technologists | 265 (28.5%) | 665 (71.5%) |
| Total (Category) | 4,381 (50.2%) | 4,349 (49.8%) |
| Total (Overall) | 11,696 (54.4%) | 9,803 (45.6%) |
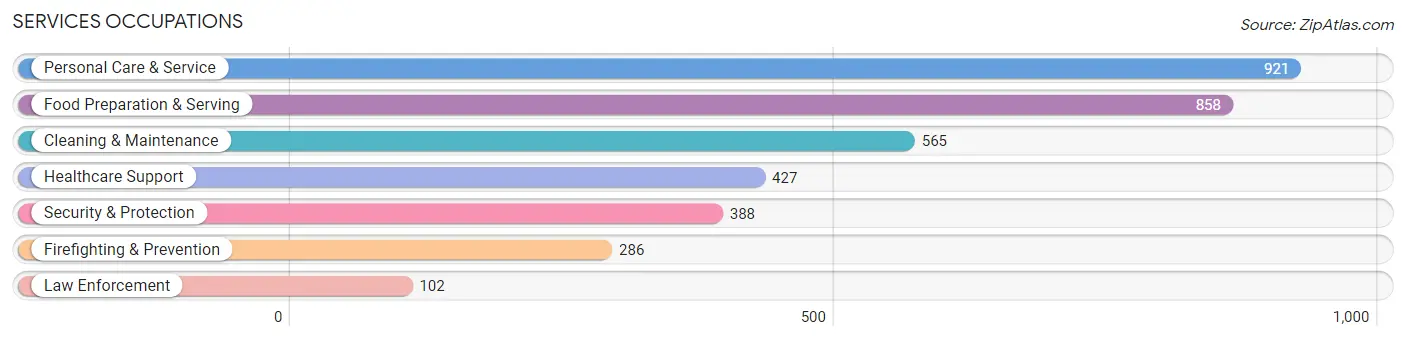
Services Occupations
The most common Services occupations in Crystal Lake are Personal Care & Service (921 | 4.3%), Food Preparation & Serving (858 | 4.0%), Cleaning & Maintenance (565 | 2.6%), Healthcare Support (427 | 2.0%), and Security & Protection (388 | 1.8%).
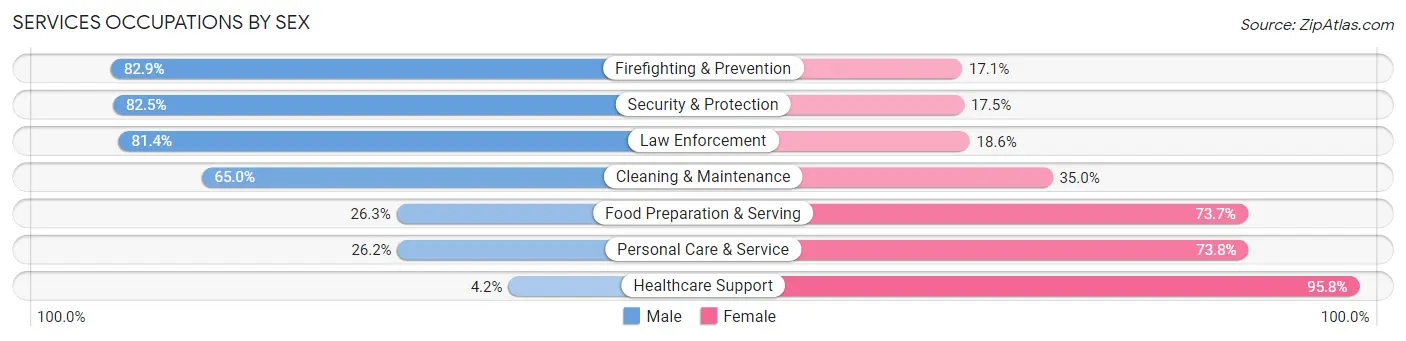
Services Occupations by Sex
Within the Services occupations in Crystal Lake, the most male-oriented occupations are Firefighting & Prevention (82.9%), Security & Protection (82.5%), and Law Enforcement (81.4%), while the most female-oriented occupations are Healthcare Support (95.8%), Personal Care & Service (73.8%), and Food Preparation & Serving (73.7%).
| Occupation | Male | Female |
| Healthcare Support | 18 (4.2%) | 409 (95.8%) |
| Security & Protection | 320 (82.5%) | 68 (17.5%) |
| Firefighting & Prevention | 237 (82.9%) | 49 (17.1%) |
| Law Enforcement | 83 (81.4%) | 19 (18.6%) |
| Food Preparation & Serving | 226 (26.3%) | 632 (73.7%) |
| Cleaning & Maintenance | 367 (65.0%) | 198 (35.0%) |
| Personal Care & Service | 241 (26.2%) | 680 (73.8%) |
| Total (Category) | 1,172 (37.1%) | 1,987 (62.9%) |
| Total (Overall) | 11,696 (54.4%) | 9,803 (45.6%) |
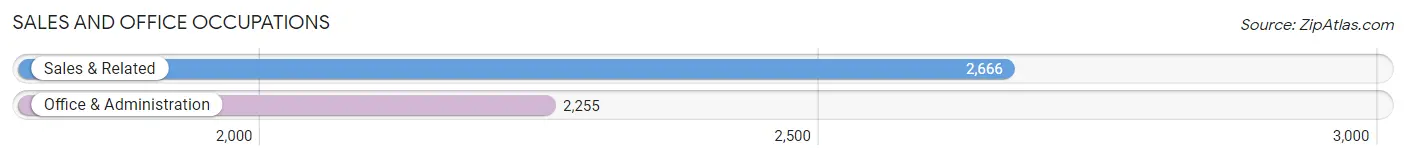
Sales and Office Occupations
The most common Sales and Office occupations in Crystal Lake are Sales & Related (2,666 | 12.4%), and Office & Administration (2,255 | 10.5%).
Sales and Office Occupations by Sex
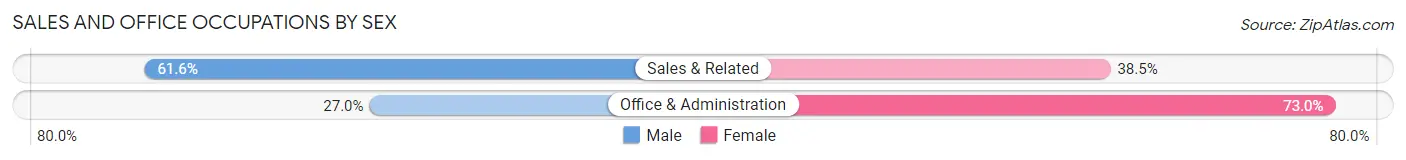
| Occupation | Male | Female |
| Sales & Related | 1,641 (61.6%) | 1,025 (38.5%) |
| Office & Administration | 608 (27.0%) | 1,647 (73.0%) |
| Total (Category) | 2,249 (45.7%) | 2,672 (54.3%) |
| Total (Overall) | 11,696 (54.4%) | 9,803 (45.6%) |
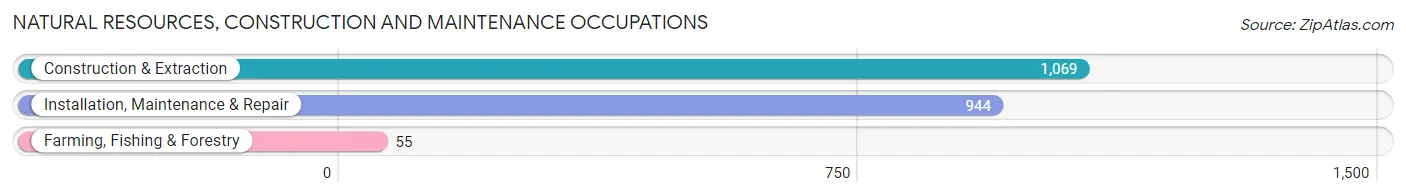
Natural Resources, Construction and Maintenance Occupations
The most common Natural Resources, Construction and Maintenance occupations in Crystal Lake are Construction & Extraction (1,069 | 5.0%), Installation, Maintenance & Repair (944 | 4.4%), and Farming, Fishing & Forestry (55 | 0.3%).
Natural Resources, Construction and Maintenance Occupations by Sex
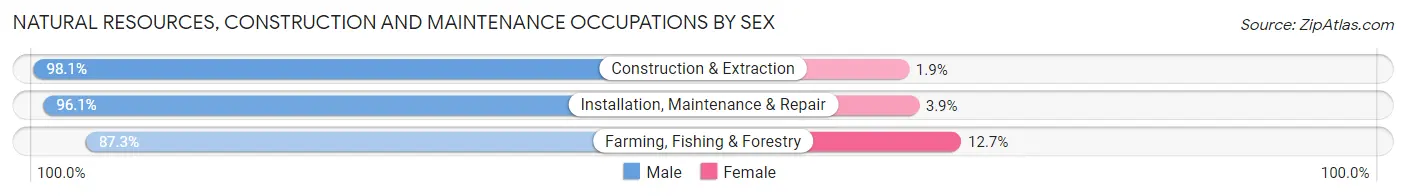
| Occupation | Male | Female |
| Farming, Fishing & Forestry | 48 (87.3%) | 7 (12.7%) |
| Construction & Extraction | 1,049 (98.1%) | 20 (1.9%) |
| Installation, Maintenance & Repair | 907 (96.1%) | 37 (3.9%) |
| Total (Category) | 2,004 (96.9%) | 64 (3.1%) |
| Total (Overall) | 11,696 (54.4%) | 9,803 (45.6%) |
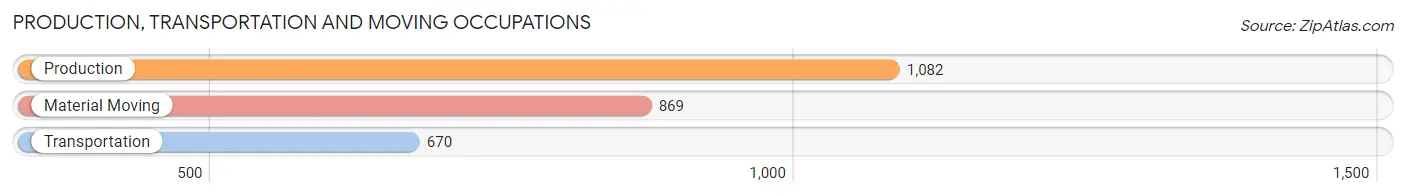
Production, Transportation and Moving Occupations
The most common Production, Transportation and Moving occupations in Crystal Lake are Production (1,082 | 5.0%), Material Moving (869 | 4.0%), and Transportation (670 | 3.1%).
Production, Transportation and Moving Occupations by Sex
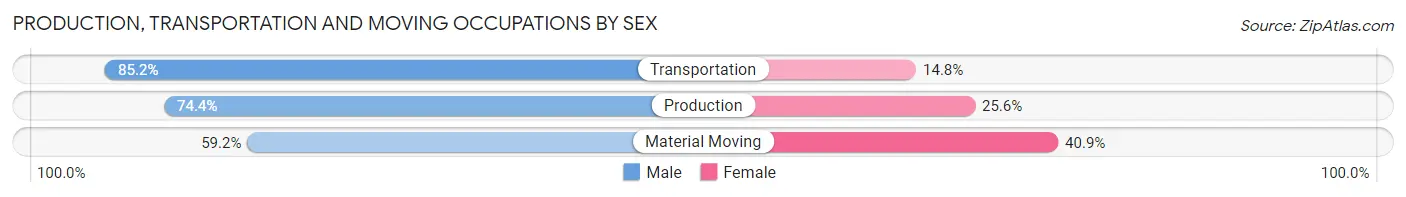
| Occupation | Male | Female |
| Production | 805 (74.4%) | 277 (25.6%) |
| Transportation | 571 (85.2%) | 99 (14.8%) |
| Material Moving | 514 (59.2%) | 355 (40.8%) |
| Total (Category) | 1,890 (72.1%) | 731 (27.9%) |
| Total (Overall) | 11,696 (54.4%) | 9,803 (45.6%) |
Employment Industries by Sex in Crystal Lake
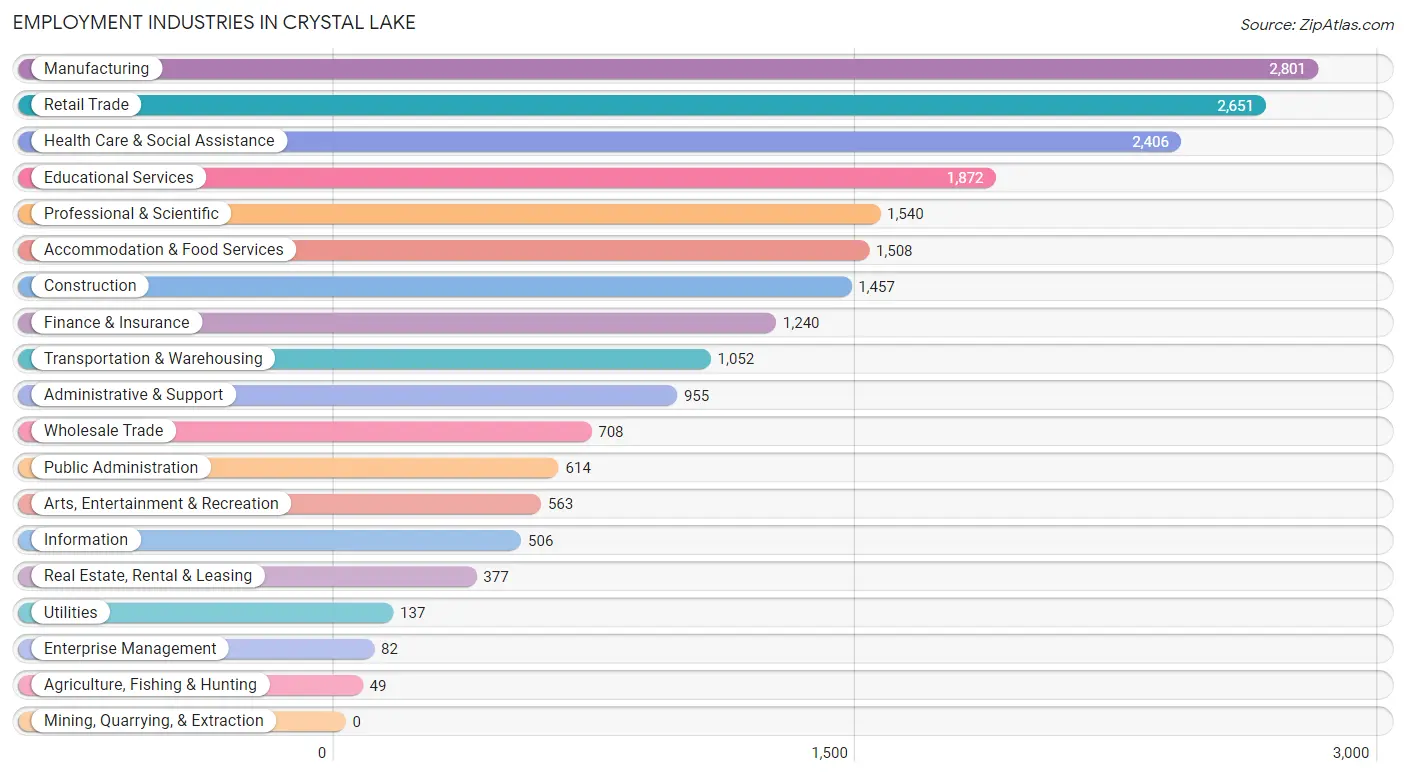
Employment Industries in Crystal Lake
The major employment industries in Crystal Lake include Manufacturing (2,801 | 13.0%), Retail Trade (2,651 | 12.3%), Health Care & Social Assistance (2,406 | 11.2%), Educational Services (1,872 | 8.7%), and Professional & Scientific (1,540 | 7.2%).
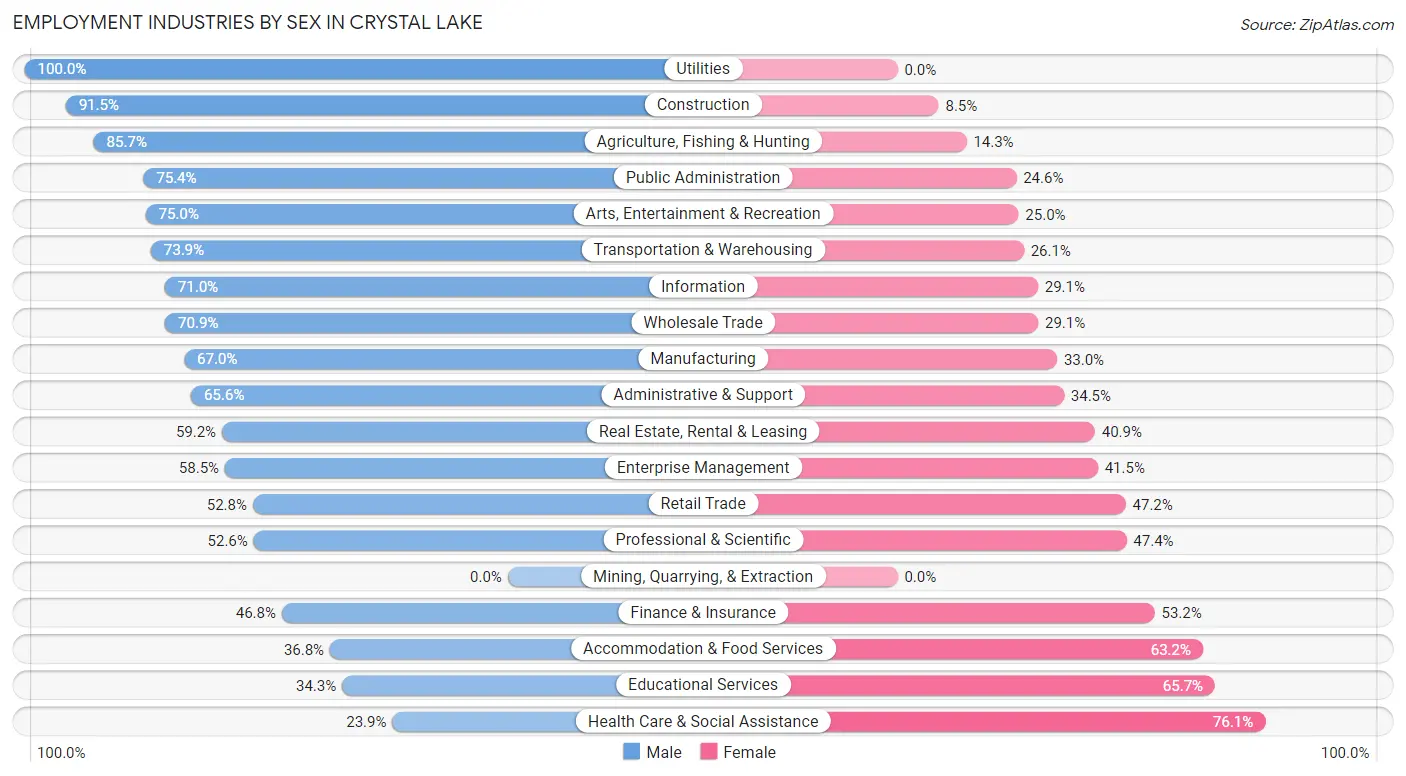
Employment Industries by Sex in Crystal Lake
The Crystal Lake industries that see more men than women are Utilities (100.0%), Construction (91.5%), and Agriculture, Fishing & Hunting (85.7%), whereas the industries that tend to have a higher number of women are Health Care & Social Assistance (76.1%), Educational Services (65.7%), and Accommodation & Food Services (63.2%).
| Industry | Male | Female |
| Agriculture, Fishing & Hunting | 42 (85.7%) | 7 (14.3%) |
| Mining, Quarrying, & Extraction | 0 (0.0%) | 0 (0.0%) |
| Construction | 1,333 (91.5%) | 124 (8.5%) |
| Manufacturing | 1,876 (67.0%) | 925 (33.0%) |
| Wholesale Trade | 502 (70.9%) | 206 (29.1%) |
| Retail Trade | 1,399 (52.8%) | 1,252 (47.2%) |
| Transportation & Warehousing | 777 (73.9%) | 275 (26.1%) |
| Utilities | 137 (100.0%) | 0 (0.0%) |
| Information | 359 (71.0%) | 147 (29.0%) |
| Finance & Insurance | 580 (46.8%) | 660 (53.2%) |
| Real Estate, Rental & Leasing | 223 (59.2%) | 154 (40.8%) |
| Professional & Scientific | 810 (52.6%) | 730 (47.4%) |
| Enterprise Management | 48 (58.5%) | 34 (41.5%) |
| Administrative & Support | 626 (65.5%) | 329 (34.4%) |
| Educational Services | 642 (34.3%) | 1,230 (65.7%) |
| Health Care & Social Assistance | 575 (23.9%) | 1,831 (76.1%) |
| Arts, Entertainment & Recreation | 422 (75.0%) | 141 (25.0%) |
| Accommodation & Food Services | 555 (36.8%) | 953 (63.2%) |
| Public Administration | 463 (75.4%) | 151 (24.6%) |
| Total | 11,696 (54.4%) | 9,803 (45.6%) |
Education in Crystal Lake
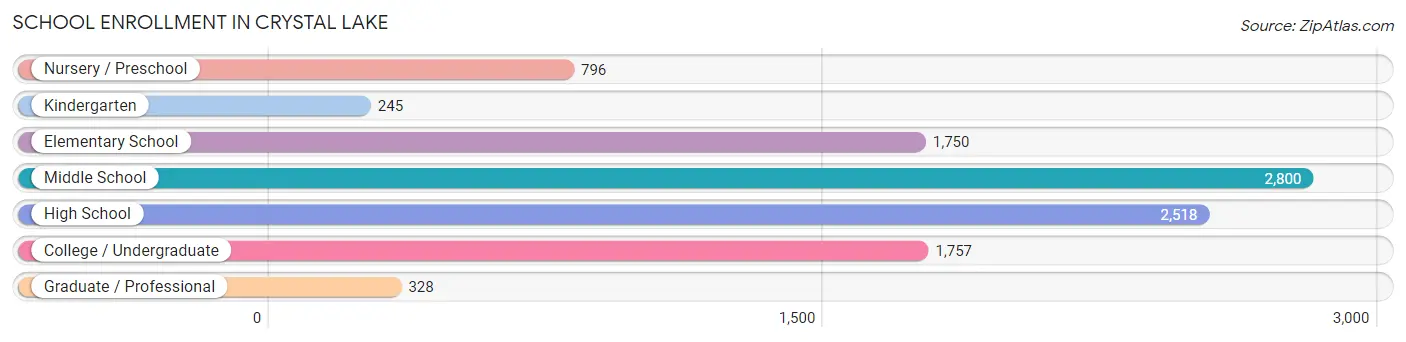
School Enrollment in Crystal Lake
The most common levels of schooling among the 10,194 students in Crystal Lake are middle school (2,800 | 27.5%), high school (2,518 | 24.7%), and college / undergraduate (1,757 | 17.2%).
| School Level | # Students | % Students |
| Nursery / Preschool | 796 | 7.8% |
| Kindergarten | 245 | 2.4% |
| Elementary School | 1,750 | 17.2% |
| Middle School | 2,800 | 27.5% |
| High School | 2,518 | 24.7% |
| College / Undergraduate | 1,757 | 17.2% |
| Graduate / Professional | 328 | 3.2% |
| Total | 10,194 | 100.0% |
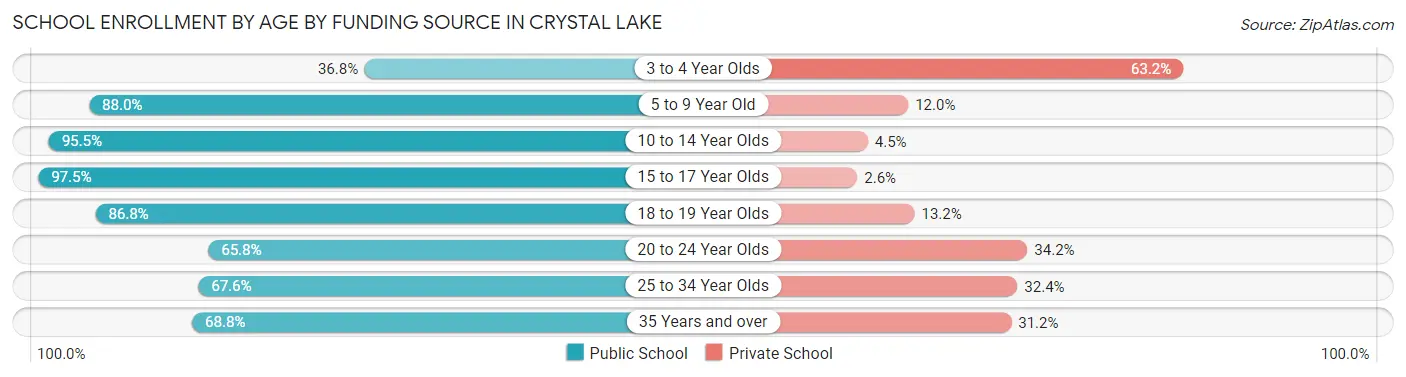
School Enrollment by Age by Funding Source in Crystal Lake
Out of a total of 10,194 students who are enrolled in schools in Crystal Lake, 1,397 (13.7%) attend a private institution, while the remaining 8,797 (86.3%) are enrolled in public schools. The age group of 3 to 4 year olds has the highest likelihood of being enrolled in private schools, with 287 (63.2% in the age bracket) enrolled. Conversely, the age group of 15 to 17 year olds has the lowest likelihood of being enrolled in a private school, with 1,758 (97.5% in the age bracket) attending a public institution.
| Age Bracket | Public School | Private School |
| 3 to 4 Year Olds | 167 (36.8%) | 287 (63.2%) |
| 5 to 9 Year Old | 1,850 (88.0%) | 253 (12.0%) |
| 10 to 14 Year Olds | 3,183 (95.5%) | 150 (4.5%) |
| 15 to 17 Year Olds | 1,758 (97.5%) | 46 (2.5%) |
| 18 to 19 Year Olds | 717 (86.8%) | 109 (13.2%) |
| 20 to 24 Year Olds | 640 (65.8%) | 333 (34.2%) |
| 25 to 34 Year Olds | 186 (67.6%) | 89 (32.4%) |
| 35 Years and over | 293 (68.8%) | 133 (31.2%) |
| Total | 8,797 (86.3%) | 1,397 (13.7%) |
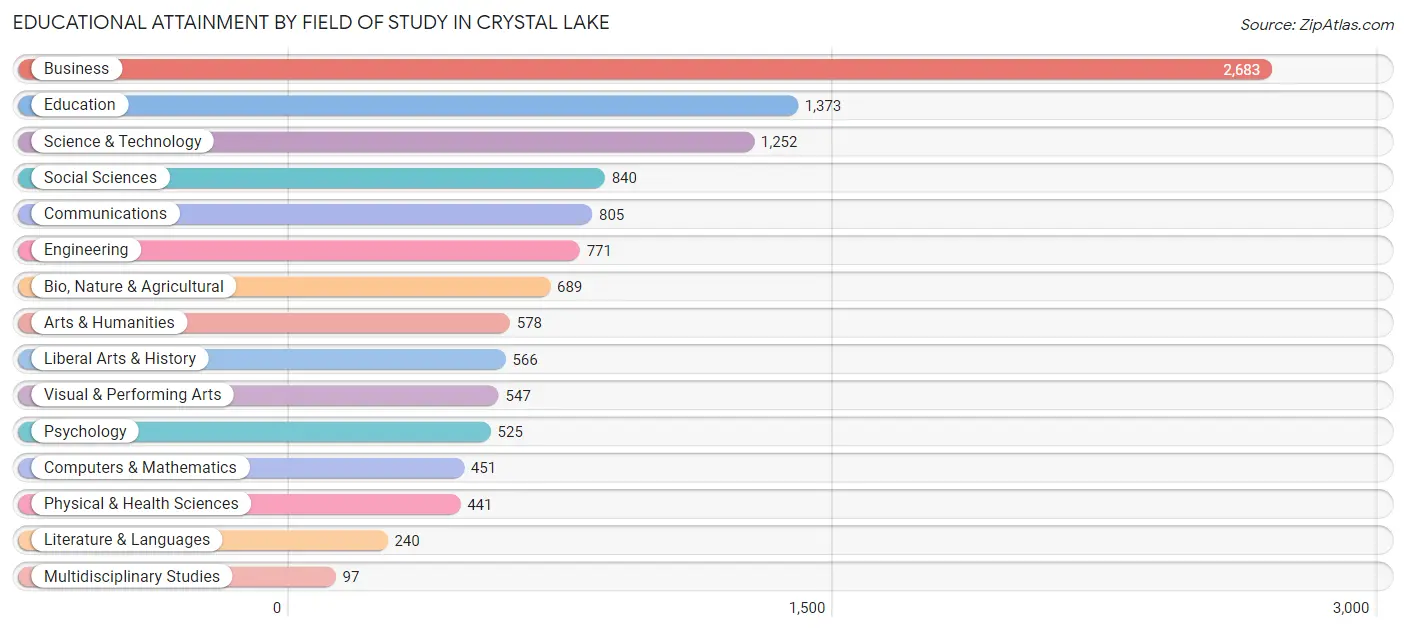
Educational Attainment by Field of Study in Crystal Lake
Business (2,683 | 22.6%), education (1,373 | 11.6%), science & technology (1,252 | 10.6%), social sciences (840 | 7.1%), and communications (805 | 6.8%) are the most common fields of study among 11,858 individuals in Crystal Lake who have obtained a bachelor's degree or higher.
| Field of Study | # Graduates | % Graduates |
| Computers & Mathematics | 451 | 3.8% |
| Bio, Nature & Agricultural | 689 | 5.8% |
| Physical & Health Sciences | 441 | 3.7% |
| Psychology | 525 | 4.4% |
| Social Sciences | 840 | 7.1% |
| Engineering | 771 | 6.5% |
| Multidisciplinary Studies | 97 | 0.8% |
| Science & Technology | 1,252 | 10.6% |
| Business | 2,683 | 22.6% |
| Education | 1,373 | 11.6% |
| Literature & Languages | 240 | 2.0% |
| Liberal Arts & History | 566 | 4.8% |
| Visual & Performing Arts | 547 | 4.6% |
| Communications | 805 | 6.8% |
| Arts & Humanities | 578 | 4.9% |
| Total | 11,858 | 100.0% |
Transportation & Commute in Crystal Lake
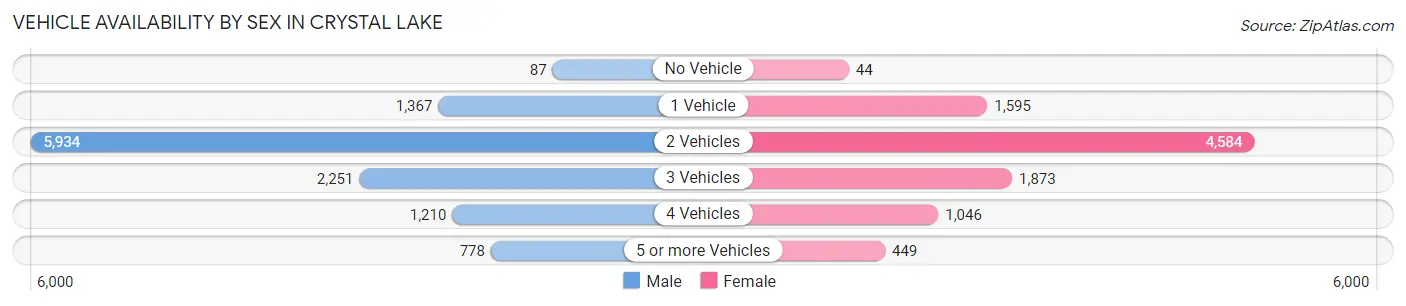
Vehicle Availability by Sex in Crystal Lake
The most prevalent vehicle ownership categories in Crystal Lake are males with 2 vehicles (5,934, accounting for 51.0%) and females with 2 vehicles (4,584, making up 61.9%).
| Vehicles Available | Male | Female |
| No Vehicle | 87 (0.7%) | 44 (0.5%) |
| 1 Vehicle | 1,367 (11.8%) | 1,595 (16.6%) |
| 2 Vehicles | 5,934 (51.0%) | 4,584 (47.8%) |
| 3 Vehicles | 2,251 (19.4%) | 1,873 (19.5%) |
| 4 Vehicles | 1,210 (10.4%) | 1,046 (10.9%) |
| 5 or more Vehicles | 778 (6.7%) | 449 (4.7%) |
| Total | 11,627 (100.0%) | 9,591 (100.0%) |
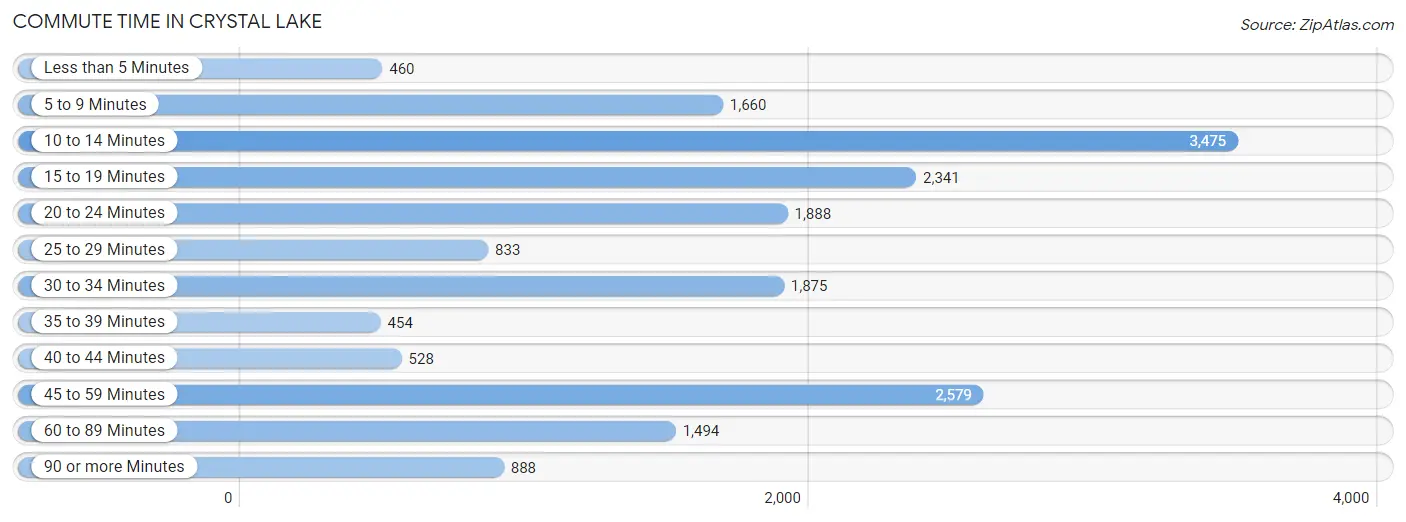
Commute Time in Crystal Lake
The most frequently occuring commute durations in Crystal Lake are 10 to 14 minutes (3,475 commuters, 18.8%), 45 to 59 minutes (2,579 commuters, 14.0%), and 15 to 19 minutes (2,341 commuters, 12.7%).
| Commute Time | # Commuters | % Commuters |
| Less than 5 Minutes | 460 | 2.5% |
| 5 to 9 Minutes | 1,660 | 9.0% |
| 10 to 14 Minutes | 3,475 | 18.8% |
| 15 to 19 Minutes | 2,341 | 12.7% |
| 20 to 24 Minutes | 1,888 | 10.2% |
| 25 to 29 Minutes | 833 | 4.5% |
| 30 to 34 Minutes | 1,875 | 10.2% |
| 35 to 39 Minutes | 454 | 2.5% |
| 40 to 44 Minutes | 528 | 2.9% |
| 45 to 59 Minutes | 2,579 | 14.0% |
| 60 to 89 Minutes | 1,494 | 8.1% |
| 90 or more Minutes | 888 | 4.8% |
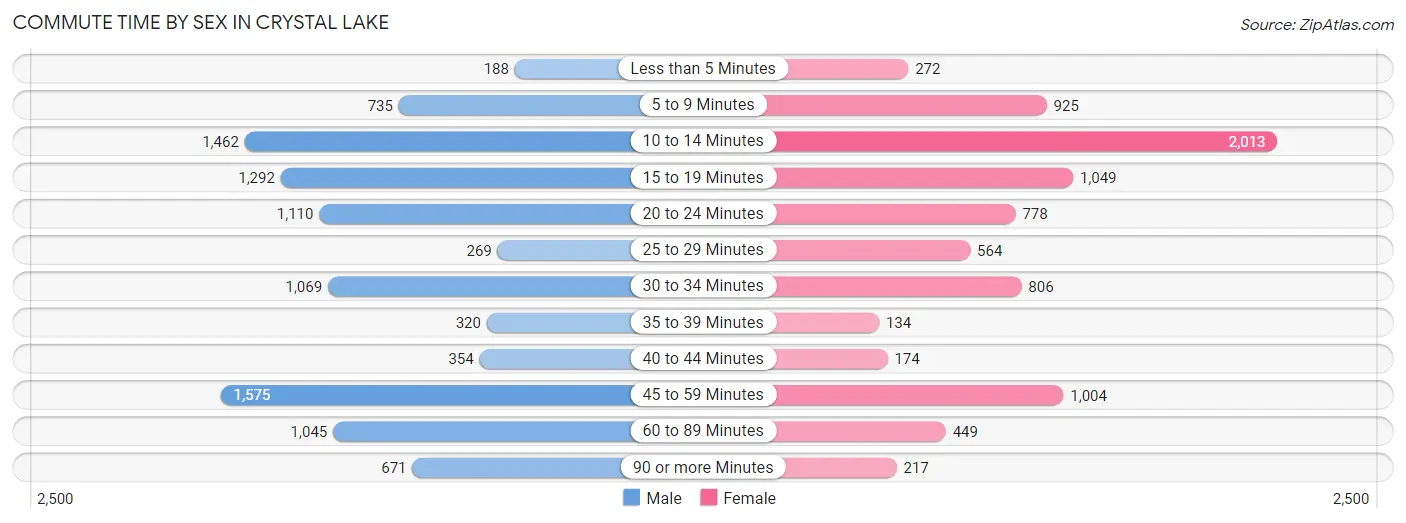
Commute Time by Sex in Crystal Lake
The most common commute times in Crystal Lake are 45 to 59 minutes (1,575 commuters, 15.6%) for males and 10 to 14 minutes (2,013 commuters, 24.0%) for females.
| Commute Time | Male | Female |
| Less than 5 Minutes | 188 (1.9%) | 272 (3.2%) |
| 5 to 9 Minutes | 735 (7.3%) | 925 (11.0%) |
| 10 to 14 Minutes | 1,462 (14.5%) | 2,013 (24.0%) |
| 15 to 19 Minutes | 1,292 (12.8%) | 1,049 (12.5%) |
| 20 to 24 Minutes | 1,110 (11.0%) | 778 (9.3%) |
| 25 to 29 Minutes | 269 (2.7%) | 564 (6.7%) |
| 30 to 34 Minutes | 1,069 (10.6%) | 806 (9.6%) |
| 35 to 39 Minutes | 320 (3.2%) | 134 (1.6%) |
| 40 to 44 Minutes | 354 (3.5%) | 174 (2.1%) |
| 45 to 59 Minutes | 1,575 (15.6%) | 1,004 (12.0%) |
| 60 to 89 Minutes | 1,045 (10.4%) | 449 (5.3%) |
| 90 or more Minutes | 671 (6.7%) | 217 (2.6%) |
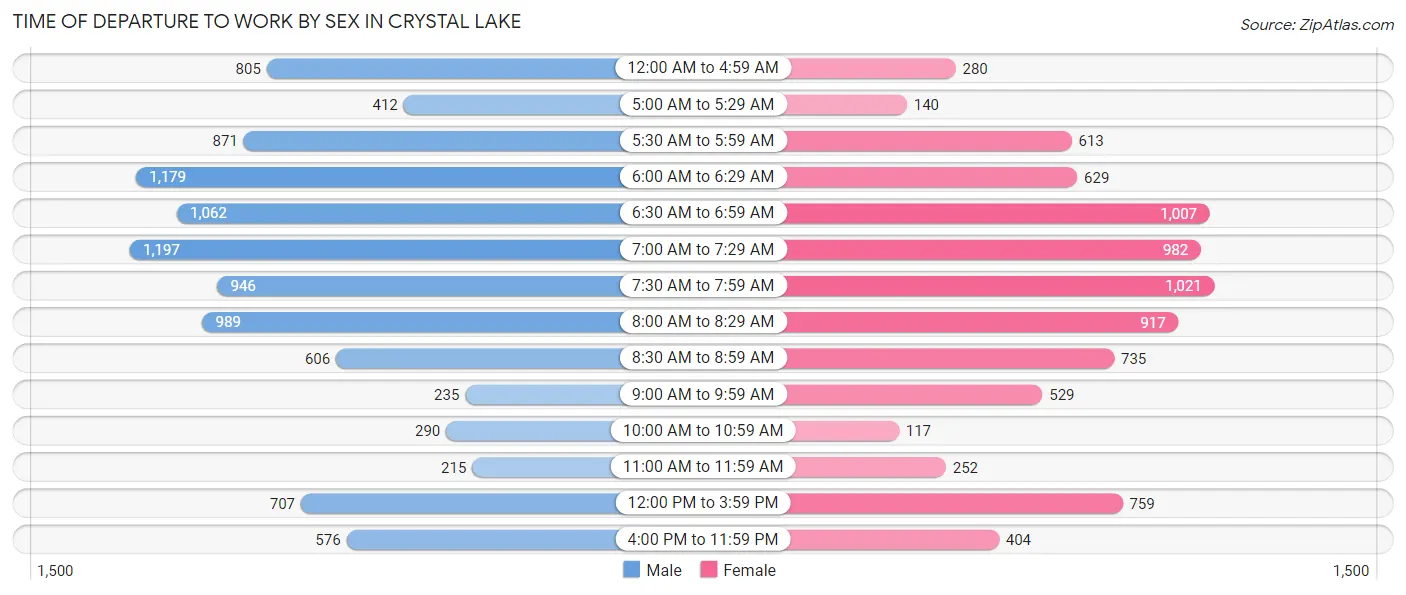
Time of Departure to Work by Sex in Crystal Lake
The most frequent times of departure to work in Crystal Lake are 7:00 AM to 7:29 AM (1,197, 11.9%) for males and 7:30 AM to 7:59 AM (1,021, 12.2%) for females.
| Time of Departure | Male | Female |
| 12:00 AM to 4:59 AM | 805 (8.0%) | 280 (3.3%) |
| 5:00 AM to 5:29 AM | 412 (4.1%) | 140 (1.7%) |
| 5:30 AM to 5:59 AM | 871 (8.6%) | 613 (7.3%) |
| 6:00 AM to 6:29 AM | 1,179 (11.7%) | 629 (7.5%) |
| 6:30 AM to 6:59 AM | 1,062 (10.5%) | 1,007 (12.0%) |
| 7:00 AM to 7:29 AM | 1,197 (11.9%) | 982 (11.7%) |
| 7:30 AM to 7:59 AM | 946 (9.4%) | 1,021 (12.2%) |
| 8:00 AM to 8:29 AM | 989 (9.8%) | 917 (10.9%) |
| 8:30 AM to 8:59 AM | 606 (6.0%) | 735 (8.8%) |
| 9:00 AM to 9:59 AM | 235 (2.3%) | 529 (6.3%) |
| 10:00 AM to 10:59 AM | 290 (2.9%) | 117 (1.4%) |
| 11:00 AM to 11:59 AM | 215 (2.1%) | 252 (3.0%) |
| 12:00 PM to 3:59 PM | 707 (7.0%) | 759 (9.0%) |
| 4:00 PM to 11:59 PM | 576 (5.7%) | 404 (4.8%) |
| Total | 10,090 (100.0%) | 8,385 (100.0%) |
Housing Occupancy in Crystal Lake
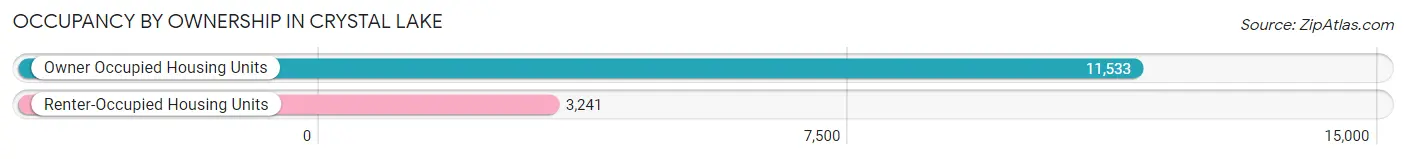
Occupancy by Ownership in Crystal Lake
Of the total 14,774 dwellings in Crystal Lake, owner-occupied units account for 11,533 (78.1%), while renter-occupied units make up 3,241 (21.9%).
| Occupancy | # Housing Units | % Housing Units |
| Owner Occupied Housing Units | 11,533 | 78.1% |
| Renter-Occupied Housing Units | 3,241 | 21.9% |
| Total Occupied Housing Units | 14,774 | 100.0% |
Occupancy by Household Size in Crystal Lake
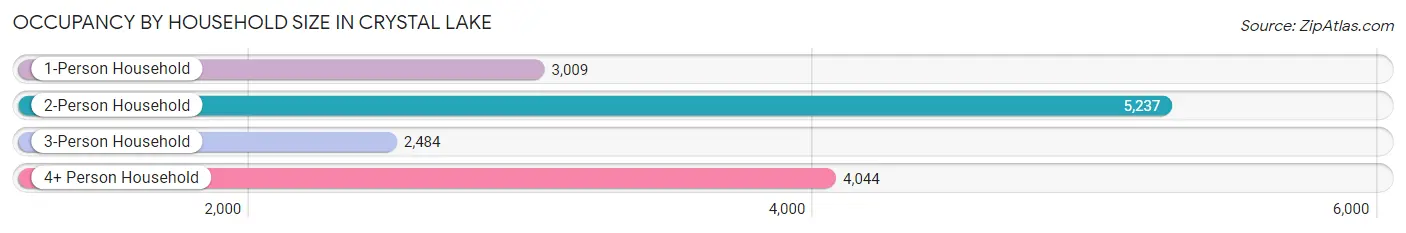
| Household Size | # Housing Units | % Housing Units |
| 1-Person Household | 3,009 | 20.4% |
| 2-Person Household | 5,237 | 35.4% |
| 3-Person Household | 2,484 | 16.8% |
| 4+ Person Household | 4,044 | 27.4% |
| Total Housing Units | 14,774 | 100.0% |
Occupancy by Ownership by Household Size in Crystal Lake
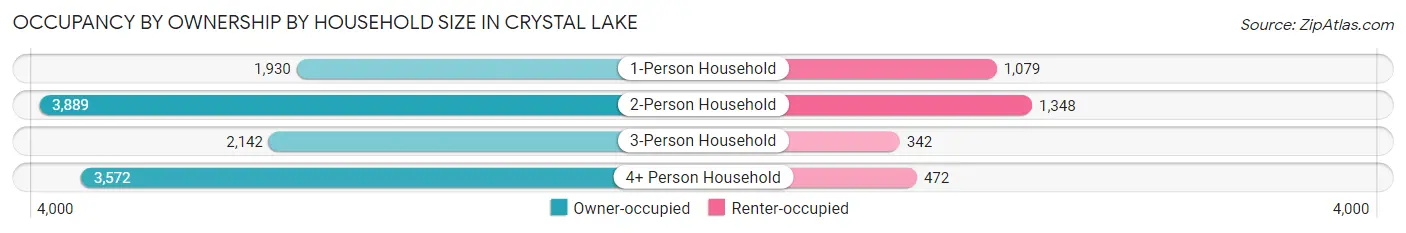
| Household Size | Owner-occupied | Renter-occupied |
| 1-Person Household | 1,930 (64.1%) | 1,079 (35.9%) |
| 2-Person Household | 3,889 (74.3%) | 1,348 (25.7%) |
| 3-Person Household | 2,142 (86.2%) | 342 (13.8%) |
| 4+ Person Household | 3,572 (88.3%) | 472 (11.7%) |
| Total Housing Units | 11,533 (78.1%) | 3,241 (21.9%) |
Occupancy by Educational Attainment in Crystal Lake
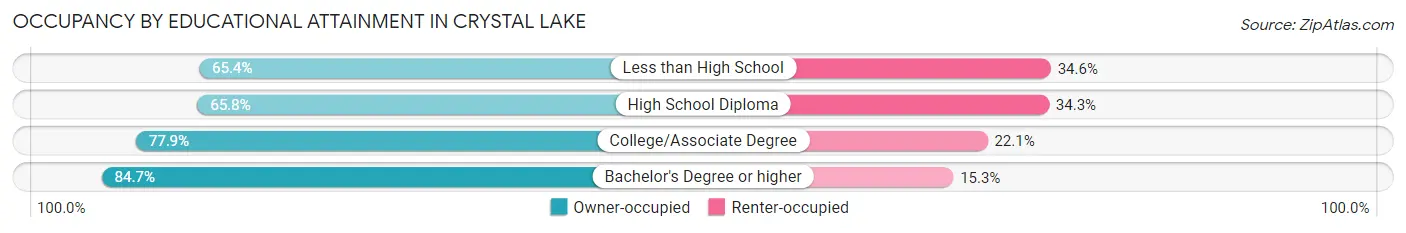
| Household Size | Owner-occupied | Renter-occupied |
| Less than High School | 359 (65.4%) | 190 (34.6%) |
| High School Diploma | 1,841 (65.7%) | 959 (34.3%) |
| College/Associate Degree | 3,979 (77.9%) | 1,127 (22.1%) |
| Bachelor's Degree or higher | 5,354 (84.7%) | 965 (15.3%) |
Occupancy by Age of Householder in Crystal Lake
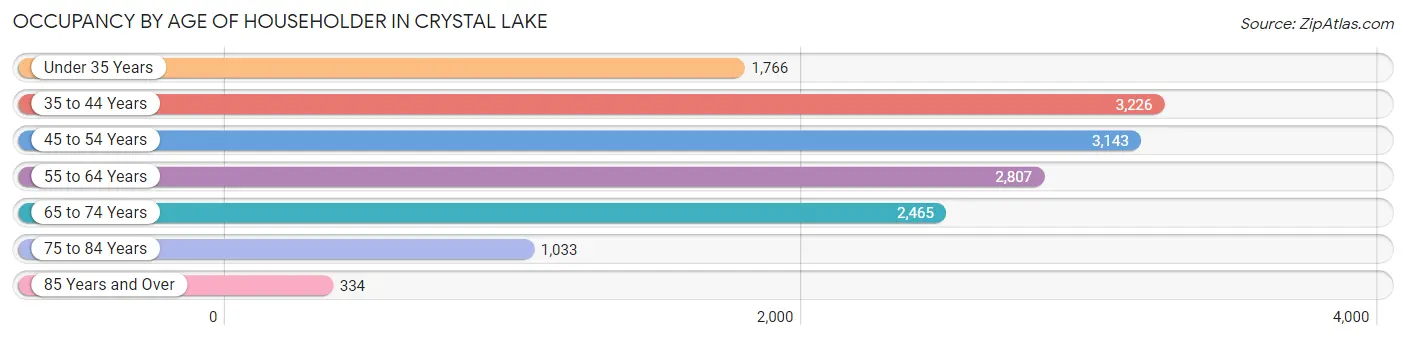
| Age Bracket | # Households | % Households |
| Under 35 Years | 1,766 | 11.9% |
| 35 to 44 Years | 3,226 | 21.8% |
| 45 to 54 Years | 3,143 | 21.3% |
| 55 to 64 Years | 2,807 | 19.0% |
| 65 to 74 Years | 2,465 | 16.7% |
| 75 to 84 Years | 1,033 | 7.0% |
| 85 Years and Over | 334 | 2.3% |
| Total | 14,774 | 100.0% |
Housing Finances in Crystal Lake
Median Income by Occupancy in Crystal Lake
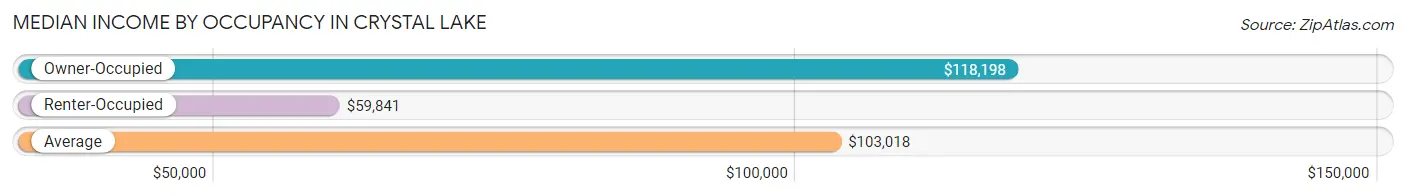
| Occupancy Type | # Households | Median Income |
| Owner-Occupied | 11,533 (78.1%) | $118,198 |
| Renter-Occupied | 3,241 (21.9%) | $59,841 |
| Average | 14,774 (100.0%) | $103,018 |
Occupancy by Householder Income Bracket in Crystal Lake
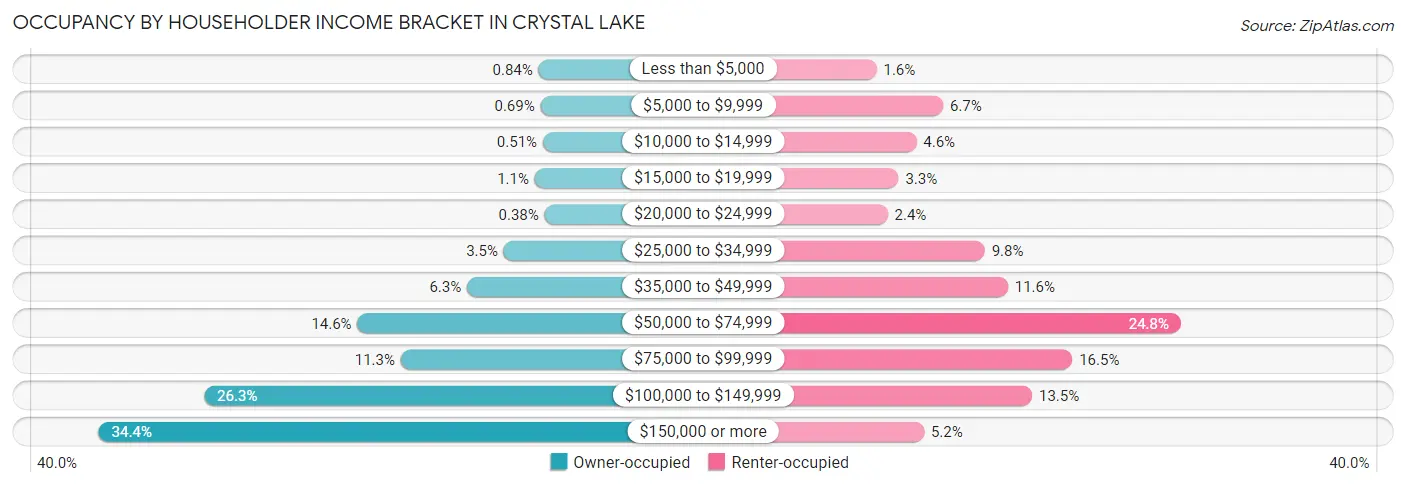
| Income Bracket | Owner-occupied | Renter-occupied |
| Less than $5,000 | 97 (0.8%) | 52 (1.6%) |
| $5,000 to $9,999 | 80 (0.7%) | 216 (6.7%) |
| $10,000 to $14,999 | 59 (0.5%) | 150 (4.6%) |
| $15,000 to $19,999 | 130 (1.1%) | 106 (3.3%) |
| $20,000 to $24,999 | 44 (0.4%) | 79 (2.4%) |
| $25,000 to $34,999 | 403 (3.5%) | 319 (9.8%) |
| $35,000 to $49,999 | 725 (6.3%) | 376 (11.6%) |
| $50,000 to $74,999 | 1,688 (14.6%) | 803 (24.8%) |
| $75,000 to $99,999 | 1,308 (11.3%) | 535 (16.5%) |
| $100,000 to $149,999 | 3,036 (26.3%) | 436 (13.5%) |
| $150,000 or more | 3,963 (34.4%) | 169 (5.2%) |
| Total | 11,533 (100.0%) | 3,241 (100.0%) |
Monthly Housing Cost Tiers in Crystal Lake
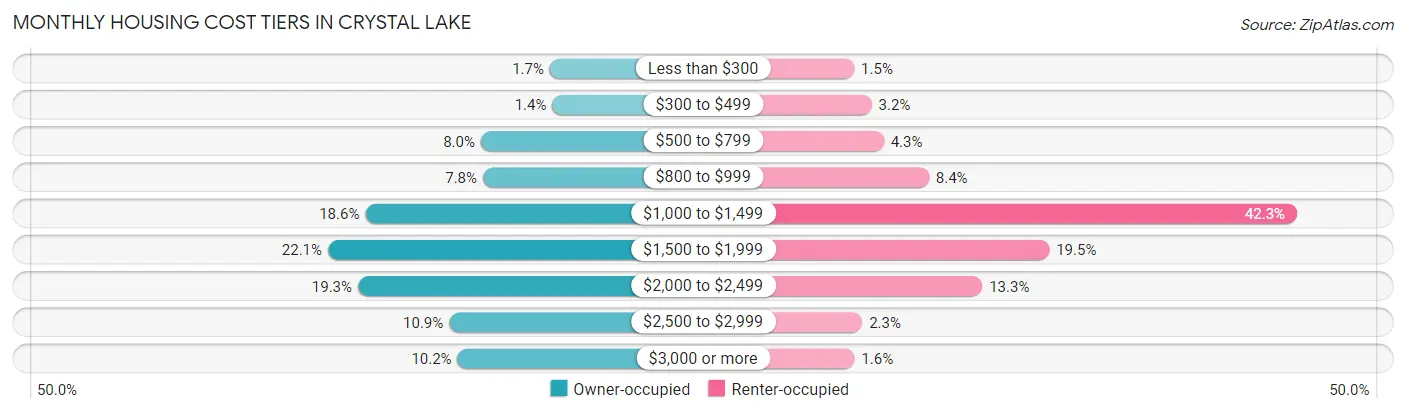
| Monthly Cost | Owner-occupied | Renter-occupied |
| Less than $300 | 190 (1.7%) | 50 (1.5%) |
| $300 to $499 | 164 (1.4%) | 102 (3.2%) |
| $500 to $799 | 923 (8.0%) | 138 (4.3%) |
| $800 to $999 | 901 (7.8%) | 273 (8.4%) |
| $1,000 to $1,499 | 2,150 (18.6%) | 1,371 (42.3%) |
| $1,500 to $1,999 | 2,547 (22.1%) | 632 (19.5%) |
| $2,000 to $2,499 | 2,228 (19.3%) | 432 (13.3%) |
| $2,500 to $2,999 | 1,259 (10.9%) | 74 (2.3%) |
| $3,000 or more | 1,171 (10.2%) | 51 (1.6%) |
| Total | 11,533 (100.0%) | 3,241 (100.0%) |
Physical Housing Characteristics in Crystal Lake
Housing Structures in Crystal Lake
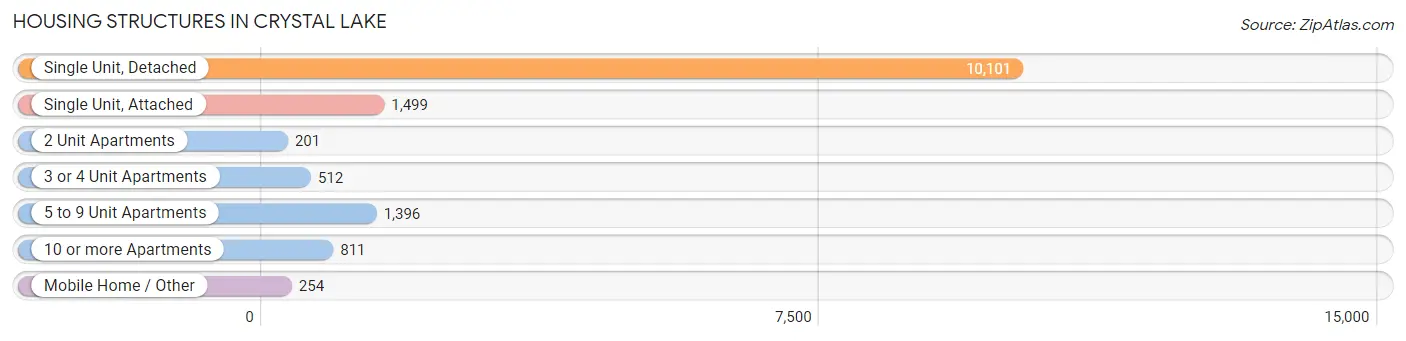
| Structure Type | # Housing Units | % Housing Units |
| Single Unit, Detached | 10,101 | 68.4% |
| Single Unit, Attached | 1,499 | 10.2% |
| 2 Unit Apartments | 201 | 1.4% |
| 3 or 4 Unit Apartments | 512 | 3.5% |
| 5 to 9 Unit Apartments | 1,396 | 9.5% |
| 10 or more Apartments | 811 | 5.5% |
| Mobile Home / Other | 254 | 1.7% |
| Total | 14,774 | 100.0% |
Housing Structures by Occupancy in Crystal Lake
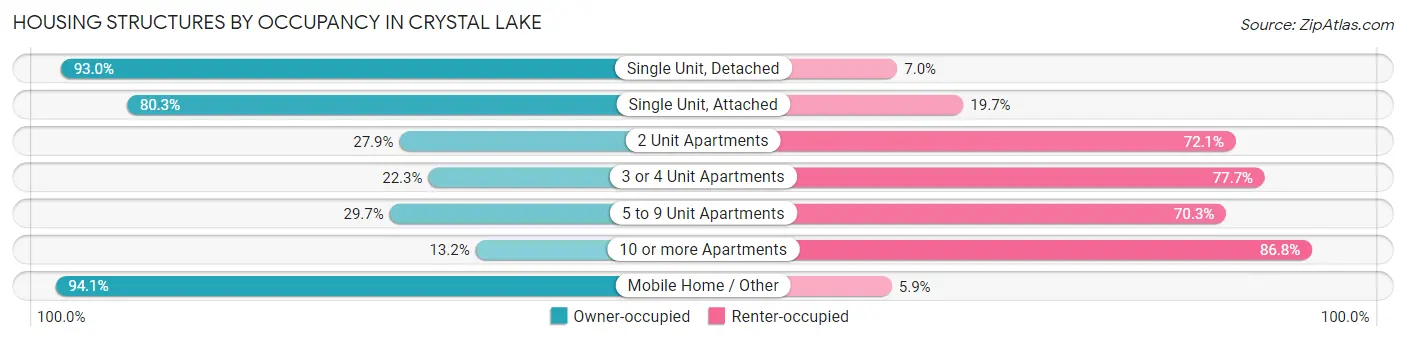
| Structure Type | Owner-occupied | Renter-occupied |
| Single Unit, Detached | 9,398 (93.0%) | 703 (7.0%) |
| Single Unit, Attached | 1,204 (80.3%) | 295 (19.7%) |
| 2 Unit Apartments | 56 (27.9%) | 145 (72.1%) |
| 3 or 4 Unit Apartments | 114 (22.3%) | 398 (77.7%) |
| 5 to 9 Unit Apartments | 415 (29.7%) | 981 (70.3%) |
| 10 or more Apartments | 107 (13.2%) | 704 (86.8%) |
| Mobile Home / Other | 239 (94.1%) | 15 (5.9%) |
| Total | 11,533 (78.1%) | 3,241 (21.9%) |
Housing Structures by Number of Rooms in Crystal Lake
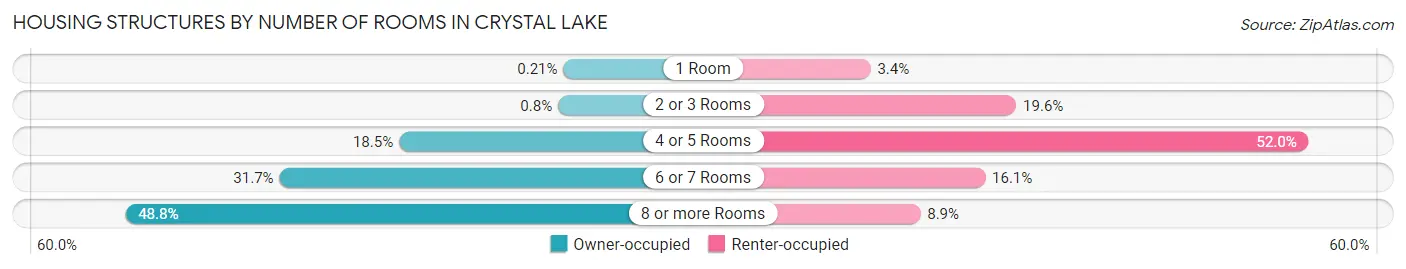
| Number of Rooms | Owner-occupied | Renter-occupied |
| 1 Room | 24 (0.2%) | 110 (3.4%) |
| 2 or 3 Rooms | 92 (0.8%) | 634 (19.6%) |
| 4 or 5 Rooms | 2,128 (18.4%) | 1,686 (52.0%) |
| 6 or 7 Rooms | 3,658 (31.7%) | 522 (16.1%) |
| 8 or more Rooms | 5,631 (48.8%) | 289 (8.9%) |
| Total | 11,533 (100.0%) | 3,241 (100.0%) |
Housing Structure by Heating Type in Crystal Lake
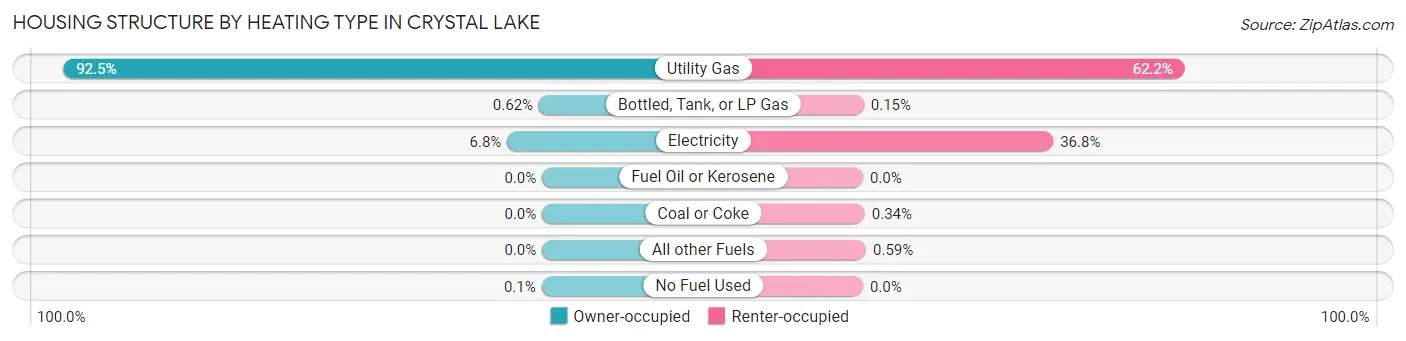
| Heating Type | Owner-occupied | Renter-occupied |
| Utility Gas | 10,671 (92.5%) | 2,015 (62.2%) |
| Bottled, Tank, or LP Gas | 72 (0.6%) | 5 (0.2%) |
| Electricity | 779 (6.8%) | 1,191 (36.7%) |
| Fuel Oil or Kerosene | 0 (0.0%) | 0 (0.0%) |
| Coal or Coke | 0 (0.0%) | 11 (0.3%) |
| All other Fuels | 0 (0.0%) | 19 (0.6%) |
| No Fuel Used | 11 (0.1%) | 0 (0.0%) |
| Total | 11,533 (100.0%) | 3,241 (100.0%) |
Household Vehicle Usage in Crystal Lake
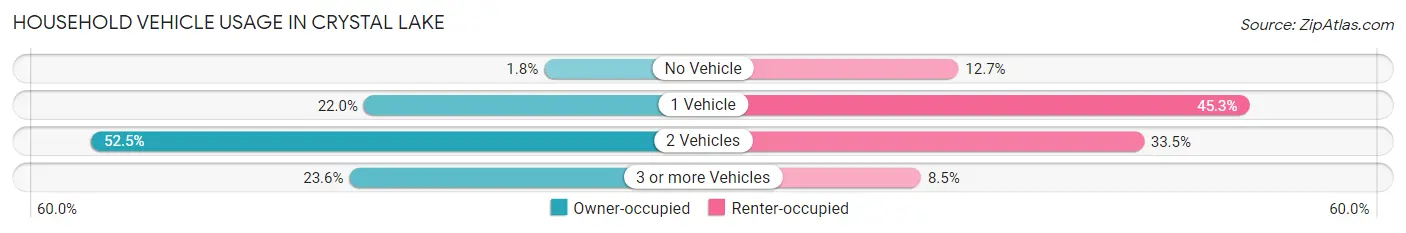
| Vehicles per Household | Owner-occupied | Renter-occupied |
| No Vehicle | 210 (1.8%) | 412 (12.7%) |
| 1 Vehicle | 2,538 (22.0%) | 1,468 (45.3%) |
| 2 Vehicles | 6,060 (52.5%) | 1,085 (33.5%) |
| 3 or more Vehicles | 2,725 (23.6%) | 276 (8.5%) |
| Total | 11,533 (100.0%) | 3,241 (100.0%) |
Real Estate & Mortgages in Crystal Lake
Real Estate and Mortgage Overview in Crystal Lake
| Characteristic | Without Mortgage | With Mortgage |
| Housing Units | 3,141 | 8,392 |
| Median Property Value | $253,700 | $275,800 |
| Median Household Income | $92,097 | $3,101 |
| Monthly Housing Costs | $897 | $1,171 |
| Real Estate Taxes | $7,025 | $93 |
Property Value by Mortgage Status in Crystal Lake
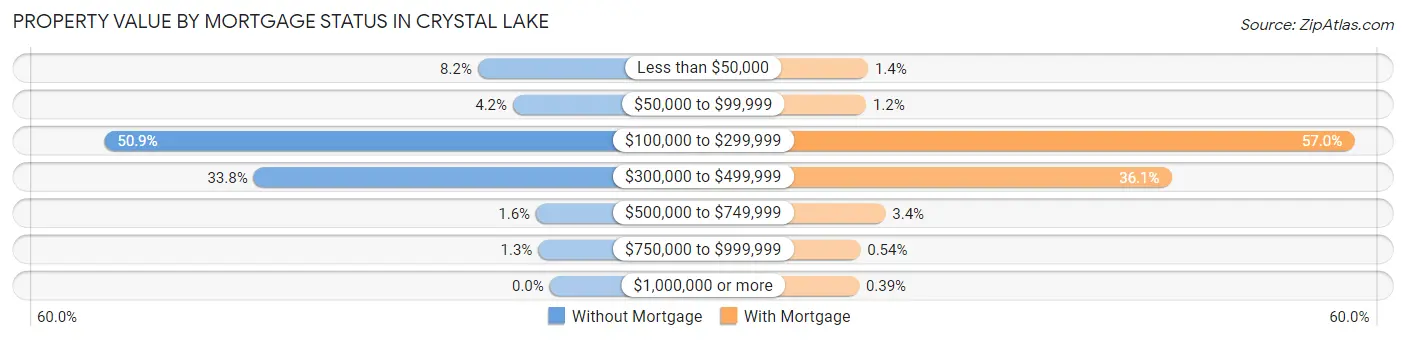
| Property Value | Without Mortgage | With Mortgage |
| Less than $50,000 | 258 (8.2%) | 119 (1.4%) |
| $50,000 to $99,999 | 132 (4.2%) | 100 (1.2%) |
| $100,000 to $299,999 | 1,598 (50.9%) | 4,781 (57.0%) |
| $300,000 to $499,999 | 1,063 (33.8%) | 3,028 (36.1%) |
| $500,000 to $749,999 | 49 (1.6%) | 286 (3.4%) |
| $750,000 to $999,999 | 41 (1.3%) | 45 (0.5%) |
| $1,000,000 or more | 0 (0.0%) | 33 (0.4%) |
| Total | 3,141 (100.0%) | 8,392 (100.0%) |
Household Income by Mortgage Status in Crystal Lake
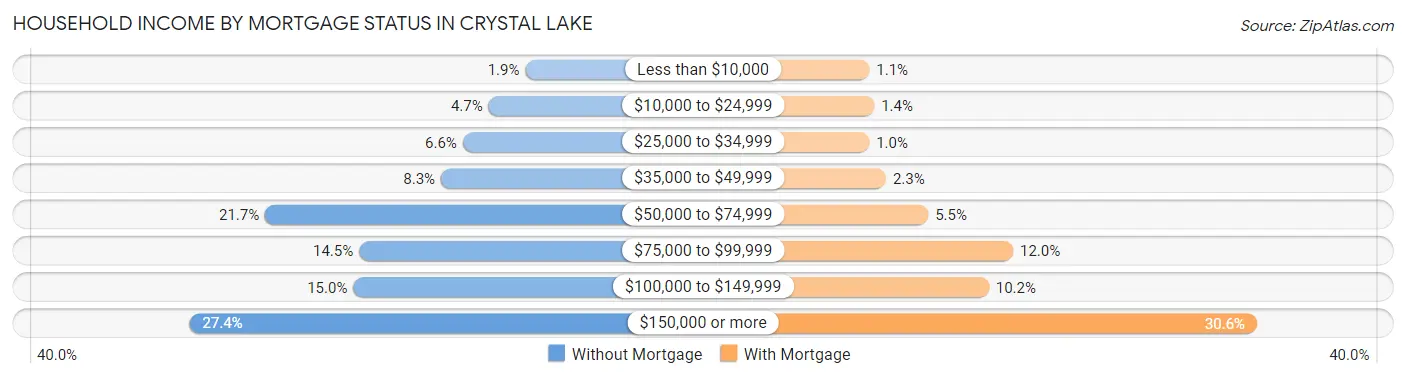
| Household Income | Without Mortgage | With Mortgage |
| Less than $10,000 | 58 (1.8%) | 88 (1.1%) |
| $10,000 to $24,999 | 146 (4.6%) | 119 (1.4%) |
| $25,000 to $34,999 | 208 (6.6%) | 87 (1.0%) |
| $35,000 to $49,999 | 260 (8.3%) | 195 (2.3%) |
| $50,000 to $74,999 | 681 (21.7%) | 465 (5.5%) |
| $75,000 to $99,999 | 456 (14.5%) | 1,007 (12.0%) |
| $100,000 to $149,999 | 470 (15.0%) | 852 (10.2%) |
| $150,000 or more | 862 (27.4%) | 2,566 (30.6%) |
| Total | 3,141 (100.0%) | 8,392 (100.0%) |
Property Value to Household Income Ratio in Crystal Lake
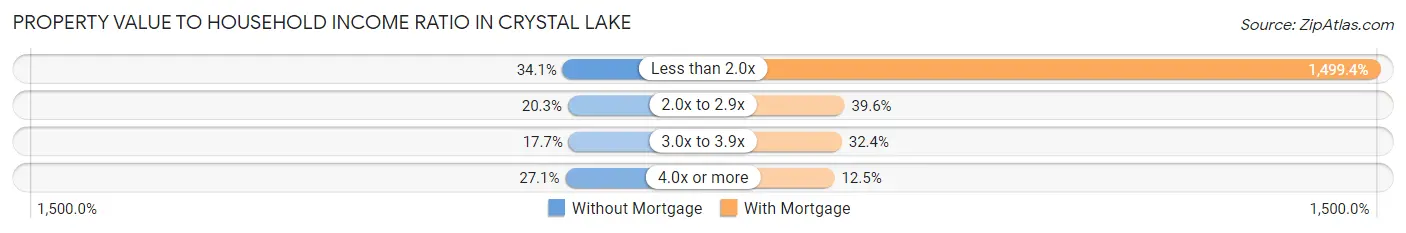
| Value-to-Income Ratio | Without Mortgage | With Mortgage |
| Less than 2.0x | 1,072 (34.1%) | 125,829 (1,499.4%) |
| 2.0x to 2.9x | 638 (20.3%) | 3,319 (39.6%) |
| 3.0x to 3.9x | 556 (17.7%) | 2,721 (32.4%) |
| 4.0x or more | 850 (27.1%) | 1,045 (12.4%) |
| Total | 3,141 (100.0%) | 8,392 (100.0%) |
Real Estate Taxes by Mortgage Status in Crystal Lake
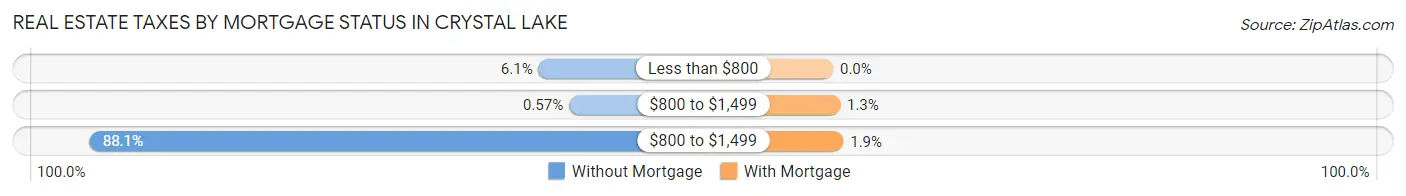
| Property Taxes | Without Mortgage | With Mortgage |
| Less than $800 | 193 (6.1%) | 0 (0.0%) |
| $800 to $1,499 | 18 (0.6%) | 107 (1.3%) |
| $800 to $1,499 | 2,767 (88.1%) | 157 (1.9%) |
| Total | 3,141 (100.0%) | 8,392 (100.0%) |
Health & Disability in Crystal Lake
Health Insurance Coverage by Age in Crystal Lake
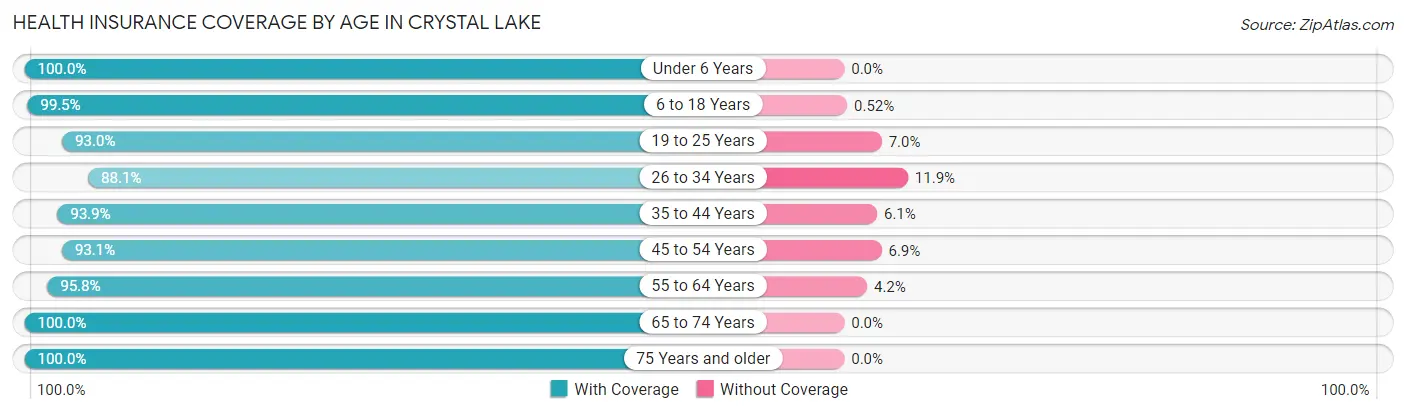
| Age Bracket | With Coverage | Without Coverage |
| Under 6 Years | 2,344 (100.0%) | 0 (0.0%) |
| 6 to 18 Years | 7,700 (99.5%) | 40 (0.5%) |
| 19 to 25 Years | 3,304 (93.0%) | 248 (7.0%) |
| 26 to 34 Years | 3,009 (88.1%) | 405 (11.9%) |
| 35 to 44 Years | 5,810 (93.9%) | 378 (6.1%) |
| 45 to 54 Years | 5,364 (93.1%) | 400 (6.9%) |
| 55 to 64 Years | 5,130 (95.8%) | 227 (4.2%) |
| 65 to 74 Years | 3,845 (100.0%) | 0 (0.0%) |
| 75 Years and older | 1,935 (100.0%) | 0 (0.0%) |
| Total | 38,441 (95.8%) | 1,698 (4.2%) |
Health Insurance Coverage by Citizenship Status in Crystal Lake
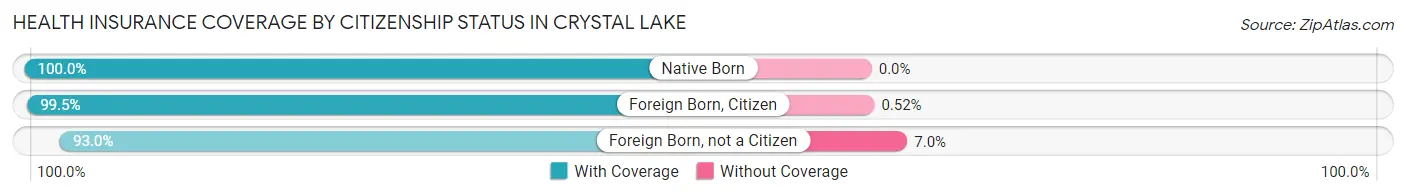
| Citizenship Status | With Coverage | Without Coverage |
| Native Born | 2,344 (100.0%) | 0 (0.0%) |
| Foreign Born, Citizen | 7,700 (99.5%) | 40 (0.5%) |
| Foreign Born, not a Citizen | 3,304 (93.0%) | 248 (7.0%) |
Health Insurance Coverage by Household Income in Crystal Lake
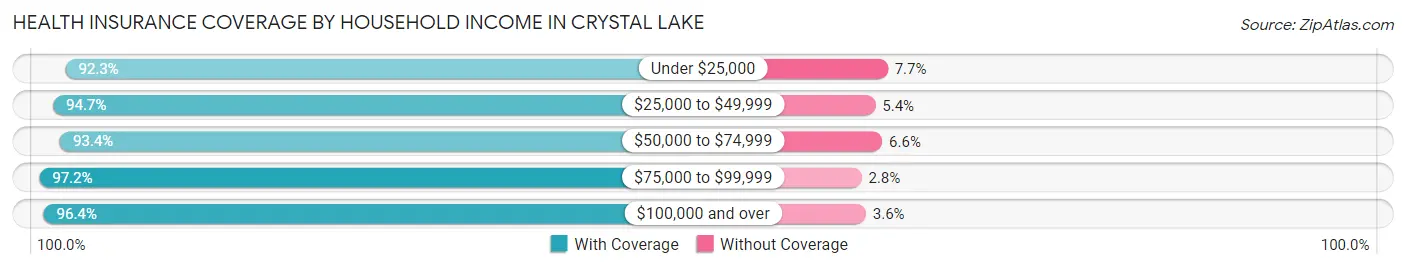
| Household Income | With Coverage | Without Coverage |
| Under $25,000 | 1,399 (92.3%) | 116 (7.7%) |
| $25,000 to $49,999 | 3,310 (94.7%) | 187 (5.3%) |
| $50,000 to $74,999 | 5,440 (93.4%) | 386 (6.6%) |
| $75,000 to $99,999 | 4,411 (97.2%) | 125 (2.8%) |
| $100,000 and over | 23,827 (96.4%) | 881 (3.6%) |
Public vs Private Health Insurance Coverage by Age in Crystal Lake
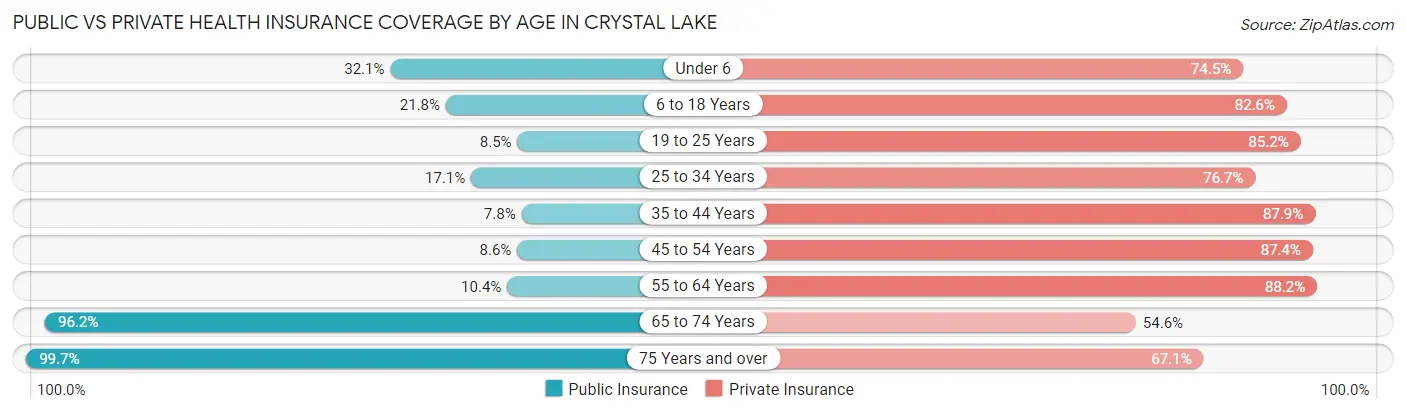
| Age Bracket | Public Insurance | Private Insurance |
| Under 6 | 753 (32.1%) | 1,746 (74.5%) |
| 6 to 18 Years | 1,688 (21.8%) | 6,393 (82.6%) |
| 19 to 25 Years | 303 (8.5%) | 3,025 (85.2%) |
| 25 to 34 Years | 585 (17.1%) | 2,620 (76.7%) |
| 35 to 44 Years | 481 (7.8%) | 5,436 (87.8%) |
| 45 to 54 Years | 494 (8.6%) | 5,039 (87.4%) |
| 55 to 64 Years | 559 (10.4%) | 4,726 (88.2%) |
| 65 to 74 Years | 3,699 (96.2%) | 2,099 (54.6%) |
| 75 Years and over | 1,929 (99.7%) | 1,299 (67.1%) |
| Total | 10,491 (26.1%) | 32,383 (80.7%) |
Disability Status by Sex by Age in Crystal Lake
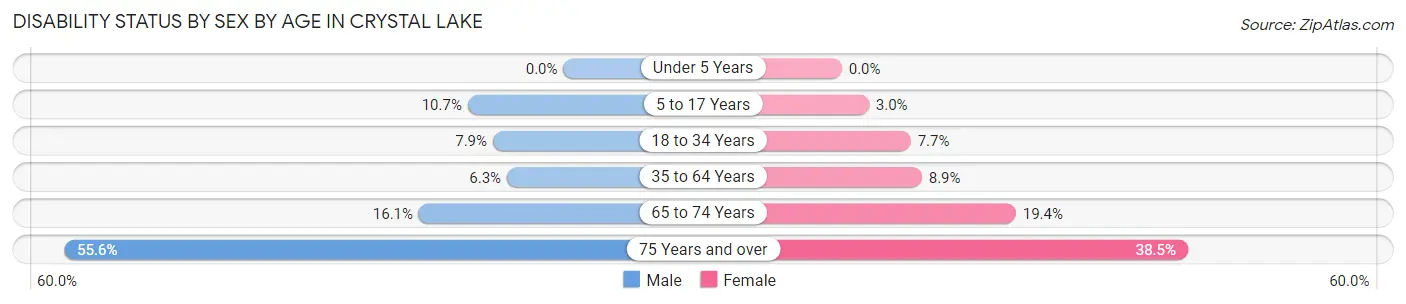
| Age Bracket | Male | Female |
| Under 5 Years | 0 (0.0%) | 0 (0.0%) |
| 5 to 17 Years | 427 (10.6%) | 112 (3.0%) |
| 18 to 34 Years | 299 (7.9%) | 291 (7.7%) |
| 35 to 64 Years | 540 (6.3%) | 776 (8.9%) |
| 65 to 74 Years | 300 (16.1%) | 384 (19.4%) |
| 75 Years and over | 402 (55.6%) | 467 (38.5%) |
Disability Class by Sex by Age in Crystal Lake
Disability Class: Hearing Difficulty
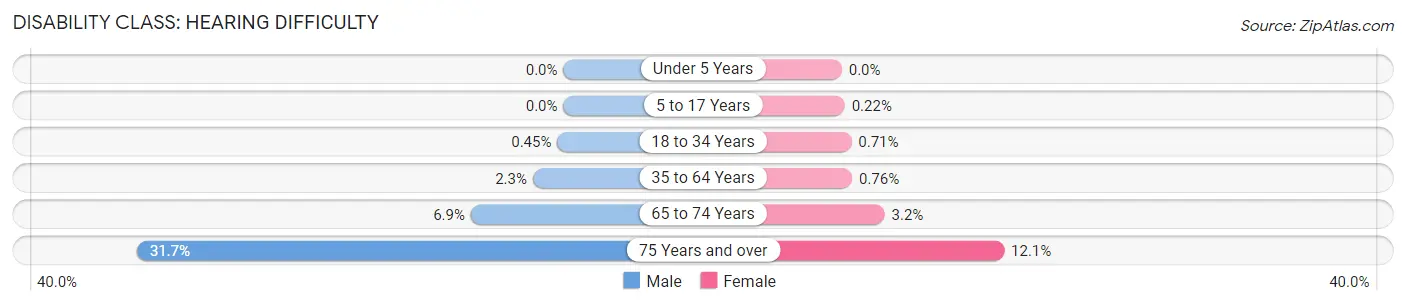
| Age Bracket | Male | Female |
| Under 5 Years | 0 (0.0%) | 0 (0.0%) |
| 5 to 17 Years | 0 (0.0%) | 8 (0.2%) |
| 18 to 34 Years | 17 (0.4%) | 27 (0.7%) |
| 35 to 64 Years | 195 (2.3%) | 66 (0.8%) |
| 65 to 74 Years | 128 (6.9%) | 63 (3.2%) |
| 75 Years and over | 229 (31.7%) | 146 (12.0%) |
Disability Class: Vision Difficulty
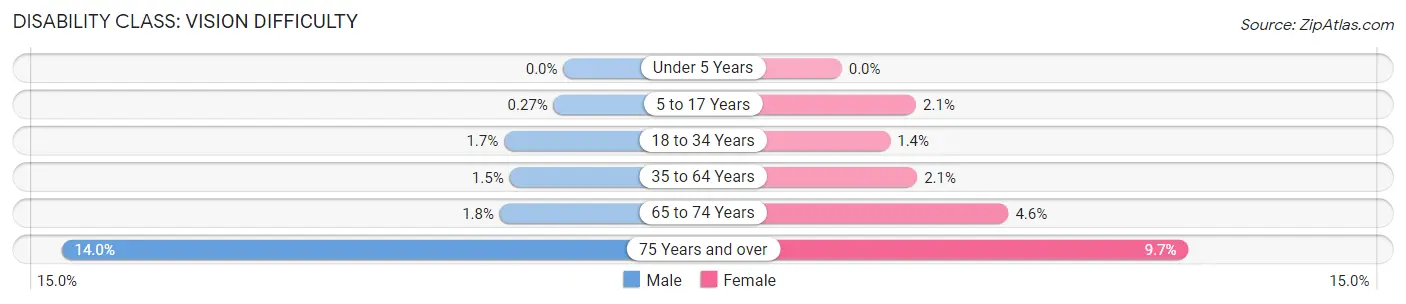
| Age Bracket | Male | Female |
| Under 5 Years | 0 (0.0%) | 0 (0.0%) |
| 5 to 17 Years | 11 (0.3%) | 77 (2.1%) |
| 18 to 34 Years | 63 (1.7%) | 51 (1.3%) |
| 35 to 64 Years | 129 (1.5%) | 183 (2.1%) |
| 65 to 74 Years | 33 (1.8%) | 92 (4.6%) |
| 75 Years and over | 101 (14.0%) | 117 (9.7%) |
Disability Class: Cognitive Difficulty
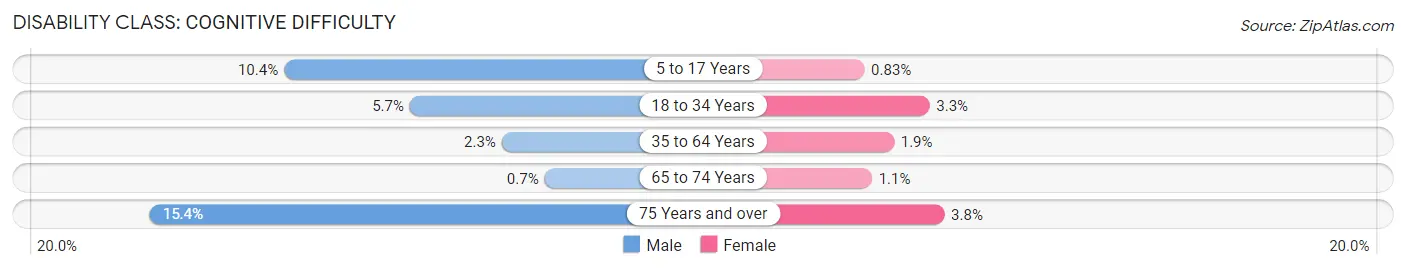
| Age Bracket | Male | Female |
| 5 to 17 Years | 416 (10.4%) | 31 (0.8%) |
| 18 to 34 Years | 217 (5.7%) | 123 (3.3%) |
| 35 to 64 Years | 197 (2.3%) | 168 (1.9%) |
| 65 to 74 Years | 13 (0.7%) | 22 (1.1%) |
| 75 Years and over | 111 (15.3%) | 46 (3.8%) |
Disability Class: Ambulatory Difficulty
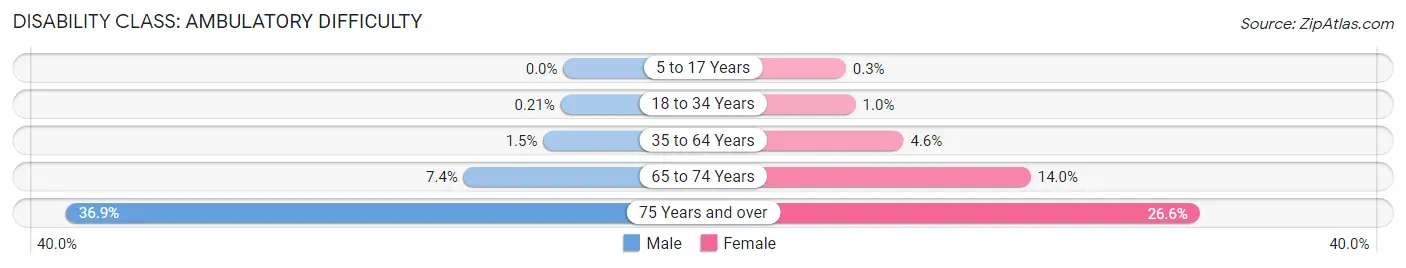
| Age Bracket | Male | Female |
| 5 to 17 Years | 0 (0.0%) | 11 (0.3%) |
| 18 to 34 Years | 8 (0.2%) | 39 (1.0%) |
| 35 to 64 Years | 128 (1.5%) | 399 (4.6%) |
| 65 to 74 Years | 138 (7.4%) | 278 (14.0%) |
| 75 Years and over | 267 (36.9%) | 322 (26.6%) |
Disability Class: Self-Care Difficulty
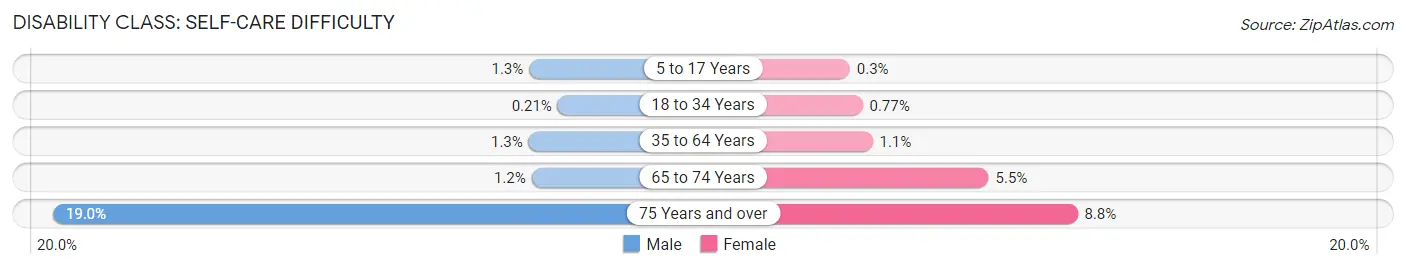
| Age Bracket | Male | Female |
| 5 to 17 Years | 51 (1.3%) | 11 (0.3%) |
| 18 to 34 Years | 8 (0.2%) | 29 (0.8%) |
| 35 to 64 Years | 111 (1.3%) | 99 (1.1%) |
| 65 to 74 Years | 22 (1.2%) | 108 (5.4%) |
| 75 Years and over | 137 (19.0%) | 106 (8.7%) |
Technology Access in Crystal Lake
Computing Device Access in Crystal Lake
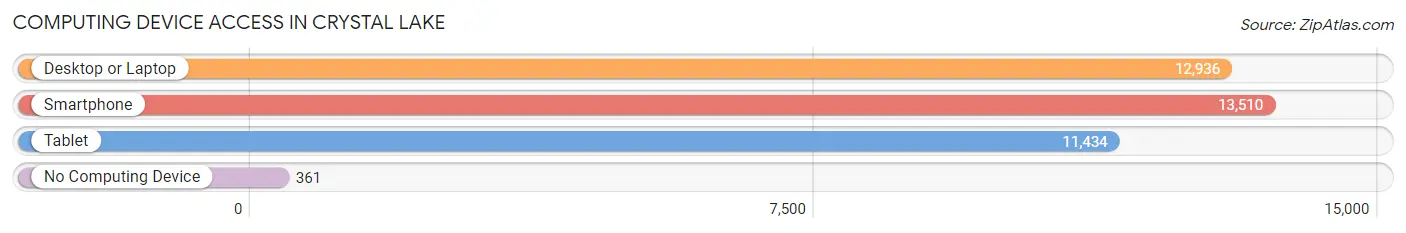
| Device Type | # Households | % Households |
| Desktop or Laptop | 12,936 | 87.6% |
| Smartphone | 13,510 | 91.4% |
| Tablet | 11,434 | 77.4% |
| No Computing Device | 361 | 2.4% |
| Total | 14,774 | 100.0% |
Internet Access in Crystal Lake
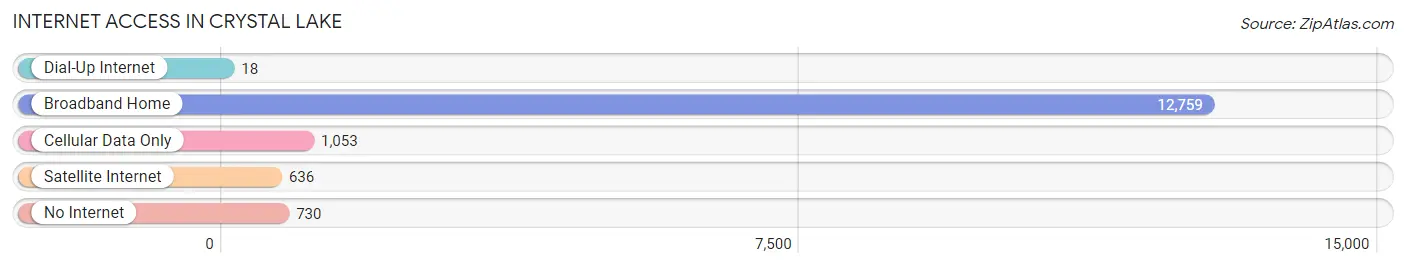
| Internet Type | # Households | % Households |
| Dial-Up Internet | 18 | 0.1% |
| Broadband Home | 12,759 | 86.4% |
| Cellular Data Only | 1,053 | 7.1% |
| Satellite Internet | 636 | 4.3% |
| No Internet | 730 | 4.9% |
| Total | 14,774 | 100.0% |
Crystal Lake Summary
Introduction
Crystal Lake is a city located in McHenry County, Illinois, United States. It is located about 40 miles northwest of Chicago and is part of the Chicago metropolitan area. The city has a population of 40,743 as of the 2010 census, making it the largest city in McHenry County. Crystal Lake is known for its natural beauty, its many parks and recreational areas, and its vibrant downtown area.
History
The area that is now Crystal Lake was first settled in the 1830s by settlers from New England. The first settler was Elijah B. Beardsley, who arrived in 1835 and built a log cabin near what is now the intersection of Virginia Road and Walkup Road. The area was originally known as Crystal Ville, named after the crystal-clear lake that was located in the area.
In 1856, the area was officially incorporated as the Village of Crystal Lake. The village was named after the lake, which was named for its crystal-clear waters. The village grew slowly, but steadily, and by the early 1900s, it had become a popular summer resort destination.
In 1914, the village was officially incorporated as the City of Crystal Lake. The city continued to grow and by the 1950s, it had become a popular bedroom community for Chicago. The city has continued to grow and today, it is a vibrant and thriving community.
Geography
Crystal Lake is located in McHenry County, Illinois, about 40 miles northwest of Chicago. The city is situated on the banks of the Crystal Lake, which is the largest natural lake in the state of Illinois. The lake is approximately 3 miles long and 1 mile wide, and is known for its crystal-clear waters.
The city is located in the Fox River Valley, which is a region of rolling hills and valleys. The city is surrounded by several small lakes and ponds, as well as several parks and recreational areas. The city is also home to several golf courses, including the Crystal Lake Country Club.
Economy
Crystal Lake is a vibrant and thriving community with a diverse economy. The city is home to several large employers, including Centegra Health System, which is the largest employer in the city. Other major employers include the Crystal Lake Park District, the Crystal Lake Public Library, and the Crystal Lake School District.
The city is also home to several small businesses, including restaurants, retail stores, and professional services. The city is also home to several manufacturing companies, including the Crystal Lake Brewing Company, which produces craft beer.
Demographics
As of the 2010 census, the city of Crystal Lake had a population of 40,743. The population is fairly evenly split between males and females, with 50.3% of the population being male and 49.7% being female. The median age of the population is 38.7 years, and the median household income is $77,845.
The city is predominantly white, with 87.3% of the population being white. Other racial groups include African American (4.3%), Asian (3.7%), and Hispanic or Latino (3.2%). The city is also home to a large number of foreign-born residents, with 11.3% of the population being foreign-born.
Conclusion
Crystal Lake is a vibrant and thriving city located in McHenry County, Illinois. The city is known for its natural beauty, its many parks and recreational areas, and its vibrant downtown area. The city has a diverse economy, with several large employers and a variety of small businesses. The city also has a diverse population, with a median age of 38.7 years and a median household income of $77,845. Crystal Lake is a great place to live, work, and play.
Common Questions
What is Per Capita Income in Crystal Lake?
Per Capita income in Crystal Lake is $44,911.
What is the Median Family Income in Crystal Lake?
Median Family Income in Crystal Lake is $115,861.
What is the Median Household income in Crystal Lake?
Median Household Income in Crystal Lake is $103,018.
What is Income or Wage Gap in Crystal Lake?
Income or Wage Gap in Crystal Lake is 41.0%.
Women in Crystal Lake earn 59.0 cents for every dollar earned by a man.
What is Inequality or Gini Index in Crystal Lake?
Inequality or Gini Index in Crystal Lake is 0.39.
What is the Total Population of Crystal Lake?
Total Population of Crystal Lake is 40,463.
What is the Total Male Population of Crystal Lake?
Total Male Population of Crystal Lake is 19,934.
What is the Total Female Population of Crystal Lake?
Total Female Population of Crystal Lake is 20,529.
What is the Ratio of Males per 100 Females in Crystal Lake?
There are 97.10 Males per 100 Females in Crystal Lake.
What is the Ratio of Females per 100 Males in Crystal Lake?
There are 102.98 Females per 100 Males in Crystal Lake.
What is the Median Population Age in Crystal Lake?
Median Population Age in Crystal Lake is 39.9 Years.
What is the Average Family Size in Crystal Lake
Average Family Size in Crystal Lake is 3.1 People.
What is the Average Household Size in Crystal Lake
Average Household Size in Crystal Lake is 2.7 People.
How Large is the Labor Force in Crystal Lake?
There are 22,621 People in the Labor Forcein in Crystal Lake.
What is the Percentage of People in the Labor Force in Crystal Lake?
70.1% of People are in the Labor Force in Crystal Lake.
What is the Unemployment Rate in Crystal Lake?
Unemployment Rate in Crystal Lake is 4.9%.