Chester, IL Map & Demographics
Chester Map
Chester Overview
$22,129
PER CAPITA INCOME
$89,833
AVG FAMILY INCOME
$68,826
AVG HOUSEHOLD INCOME
31.1%
WAGE / INCOME GAP [ % ]
68.9¢/ $1
WAGE / INCOME GAP [ $ ]
$9,943
FAMILY INCOME DEFICIT
0.39
INEQUALITY / GINI INDEX
6,941
TOTAL POPULATION
4,779
MALE POPULATION
2,162
FEMALE POPULATION
221.05
MALES / 100 FEMALES
45.24
FEMALES / 100 MALES
43.2
MEDIAN AGE
2.8
AVG FAMILY SIZE
2.2
AVG HOUSEHOLD SIZE
2,202
LABOR FORCE [ PEOPLE ]
34.5%
PERCENT IN LABOR FORCE
3.7%
UNEMPLOYMENT RATE
Chester Zip Codes
Chester Area Codes
Income in Chester
Income Overview in Chester
Per Capita Income in Chester is $22,129, while median incomes of families and households are $89,833 and $68,826 respectively.
| Characteristic | Number | Measure |
| Per Capita Income | 6,941 | $22,129 |
| Median Family Income | 1,056 | $89,833 |
| Mean Family Income | 1,056 | $95,625 |
| Median Household Income | 1,860 | $68,826 |
| Mean Household Income | 1,860 | $81,370 |
| Income Deficit | 1,056 | $9,943 |
| Wage / Income Gap (%) | 6,941 | 31.10% |
| Wage / Income Gap ($) | 6,941 | 68.90¢ per $1 |
| Gini / Inequality Index | 6,941 | 0.39 |
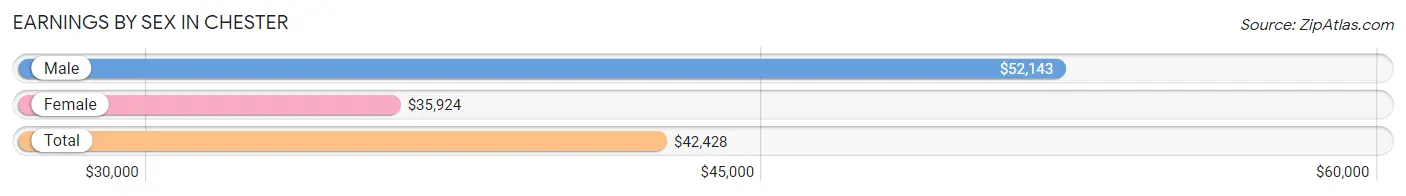
Earnings by Sex in Chester
Average Earnings in Chester are $42,428, $52,143 for men and $35,924 for women, a difference of 31.1%.
| Sex | Number | Average Earnings |
| Male | 1,114 (50.6%) | $52,143 |
| Female | 1,086 (49.4%) | $35,924 |
| Total | 2,200 (100.0%) | $42,428 |
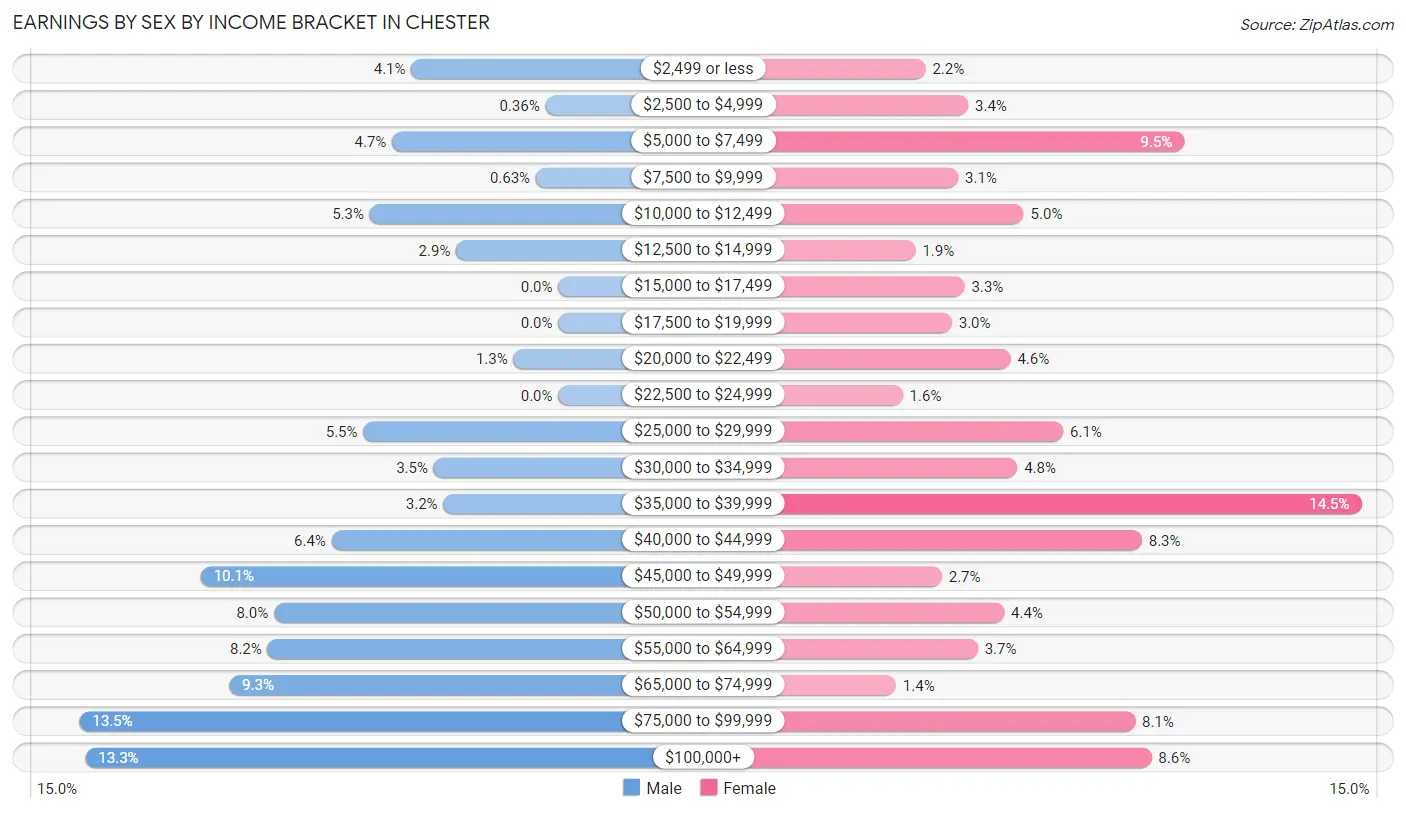
Earnings by Sex by Income Bracket in Chester
The most common earnings brackets in Chester are $75,000 to $99,999 for men (150 | 13.5%) and $35,000 to $39,999 for women (157 | 14.5%).
| Income | Male | Female |
| $2,499 or less | 46 (4.1%) | 24 (2.2%) |
| $2,500 to $4,999 | 4 (0.4%) | 37 (3.4%) |
| $5,000 to $7,499 | 52 (4.7%) | 103 (9.5%) |
| $7,500 to $9,999 | 7 (0.6%) | 34 (3.1%) |
| $10,000 to $12,499 | 59 (5.3%) | 54 (5.0%) |
| $12,500 to $14,999 | 32 (2.9%) | 21 (1.9%) |
| $15,000 to $17,499 | 0 (0.0%) | 36 (3.3%) |
| $17,500 to $19,999 | 0 (0.0%) | 32 (2.9%) |
| $20,000 to $22,499 | 14 (1.3%) | 50 (4.6%) |
| $22,500 to $24,999 | 0 (0.0%) | 17 (1.6%) |
| $25,000 to $29,999 | 61 (5.5%) | 66 (6.1%) |
| $30,000 to $34,999 | 39 (3.5%) | 52 (4.8%) |
| $35,000 to $39,999 | 36 (3.2%) | 157 (14.5%) |
| $40,000 to $44,999 | 71 (6.4%) | 90 (8.3%) |
| $45,000 to $49,999 | 112 (10.1%) | 29 (2.7%) |
| $50,000 to $54,999 | 89 (8.0%) | 48 (4.4%) |
| $55,000 to $64,999 | 91 (8.2%) | 40 (3.7%) |
| $65,000 to $74,999 | 103 (9.2%) | 15 (1.4%) |
| $75,000 to $99,999 | 150 (13.5%) | 88 (8.1%) |
| $100,000+ | 148 (13.3%) | 93 (8.6%) |
| Total | 1,114 (100.0%) | 1,086 (100.0%) |
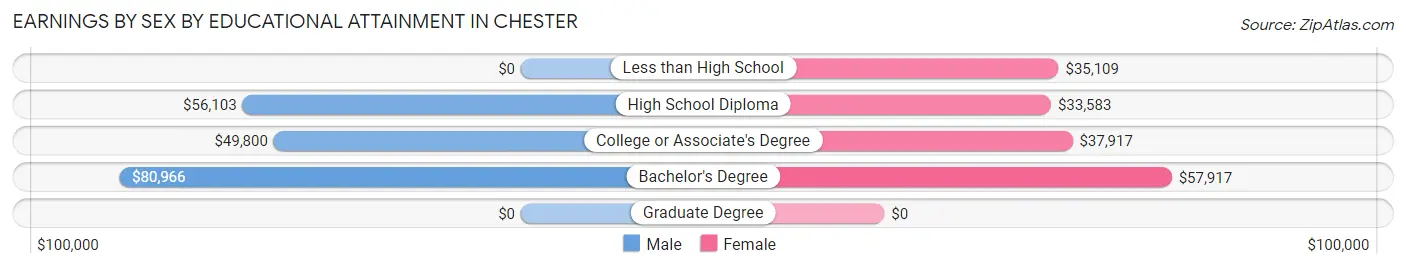
Earnings by Sex by Educational Attainment in Chester
Average earnings in Chester are $54,119 for men and $37,798 for women, a difference of 30.2%. Men with an educational attainment of bachelor's degree enjoy the highest average annual earnings of $80,966, while those with college or associate's degree education earn the least with $49,800. Women with an educational attainment of bachelor's degree earn the most with the average annual earnings of $57,917, while those with high school diploma education have the smallest earnings of $33,583.
| Educational Attainment | Male Income | Female Income |
| Less than High School | - | - |
| High School Diploma | $56,103 | $33,583 |
| College or Associate's Degree | $49,800 | $37,917 |
| Bachelor's Degree | $80,966 | $57,917 |
| Graduate Degree | - | - |
| Total | $54,119 | $37,798 |
Family Income in Chester
Family Income Brackets in Chester
According to the Chester family income data, there are 336 families falling into the $100,000 to $149,999 income range, which is the most common income bracket and makes up 31.8% of all families. Conversely, the $25,000 to $34,999 income bracket is the least frequent group with only 21 families (2.0%) belonging to this category.
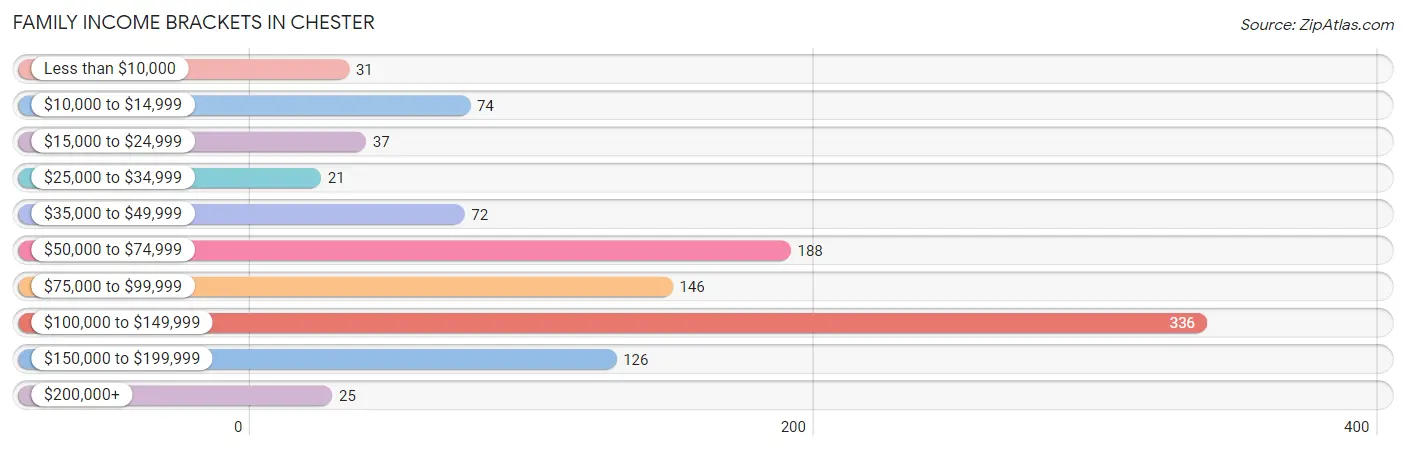
| Income Bracket | # Families | % Families |
| Less than $10,000 | 31 | 2.9% |
| $10,000 to $14,999 | 74 | 7.0% |
| $15,000 to $24,999 | 37 | 3.5% |
| $25,000 to $34,999 | 21 | 2.0% |
| $35,000 to $49,999 | 72 | 6.8% |
| $50,000 to $74,999 | 188 | 17.8% |
| $75,000 to $99,999 | 146 | 13.8% |
| $100,000 to $149,999 | 336 | 31.8% |
| $150,000 to $199,999 | 126 | 11.9% |
| $200,000+ | 25 | 2.4% |
Family Income by Famaliy Size in Chester
3-person families (191 | 18.1%) account for the highest median family income in Chester with $122,125 per family, while 3-person families (191 | 18.1%) have the highest median income of $40,708 per family member.
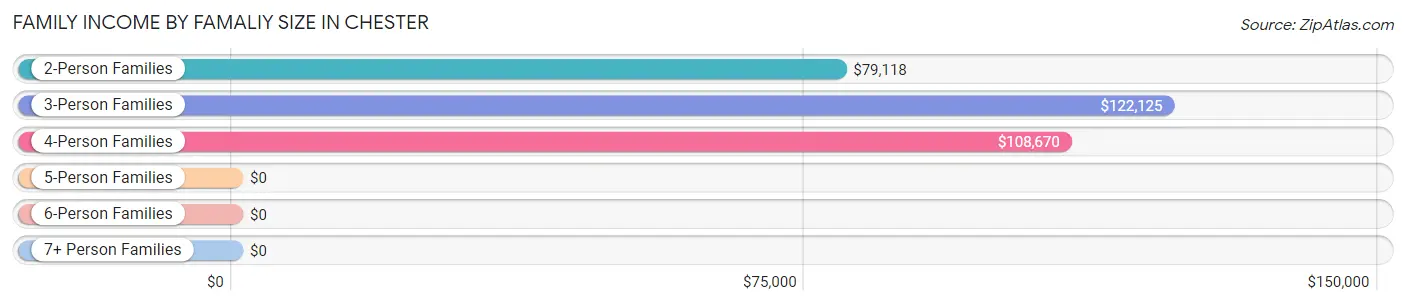
| Income Bracket | # Families | Median Income |
| 2-Person Families | 598 (56.6%) | $79,118 |
| 3-Person Families | 191 (18.1%) | $122,125 |
| 4-Person Families | 232 (22.0%) | $108,670 |
| 5-Person Families | 34 (3.2%) | $0 |
| 6-Person Families | 1 (0.1%) | $0 |
| 7+ Person Families | 0 (0.0%) | $0 |
| Total | 1,056 (100.0%) | $89,833 |
Family Income by Number of Earners in Chester
The median family income in Chester is $89,833, with families comprising 3+ earners (125) having the highest median family income of $125,662, while families with no earners (239) have the lowest median family income of $68,384, accounting for 11.8% and 22.6% of families, respectively.
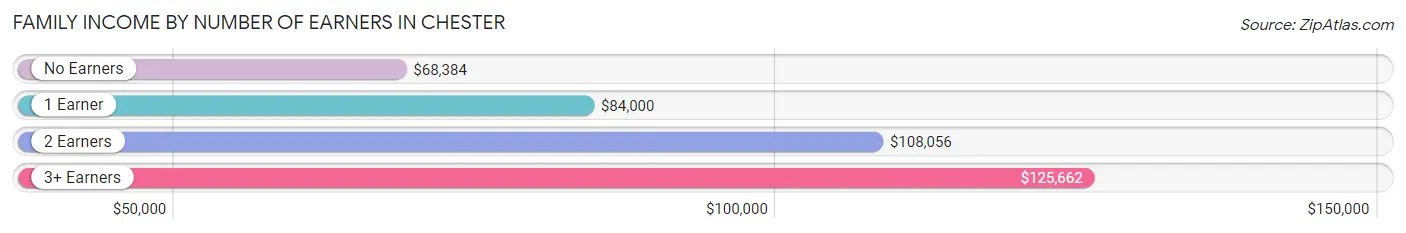
| Number of Earners | # Families | Median Income |
| No Earners | 239 (22.6%) | $68,384 |
| 1 Earner | 286 (27.1%) | $84,000 |
| 2 Earners | 406 (38.5%) | $108,056 |
| 3+ Earners | 125 (11.8%) | $125,662 |
| Total | 1,056 (100.0%) | $89,833 |
Household Income in Chester
Household Income Brackets in Chester
With 480 households falling in the category, the $100,000 to $149,999 income range is the most frequent in Chester, accounting for 25.8% of all households. In contrast, only 24 households (1.3%) fall into the $200,000+ income bracket, making it the least populous group.
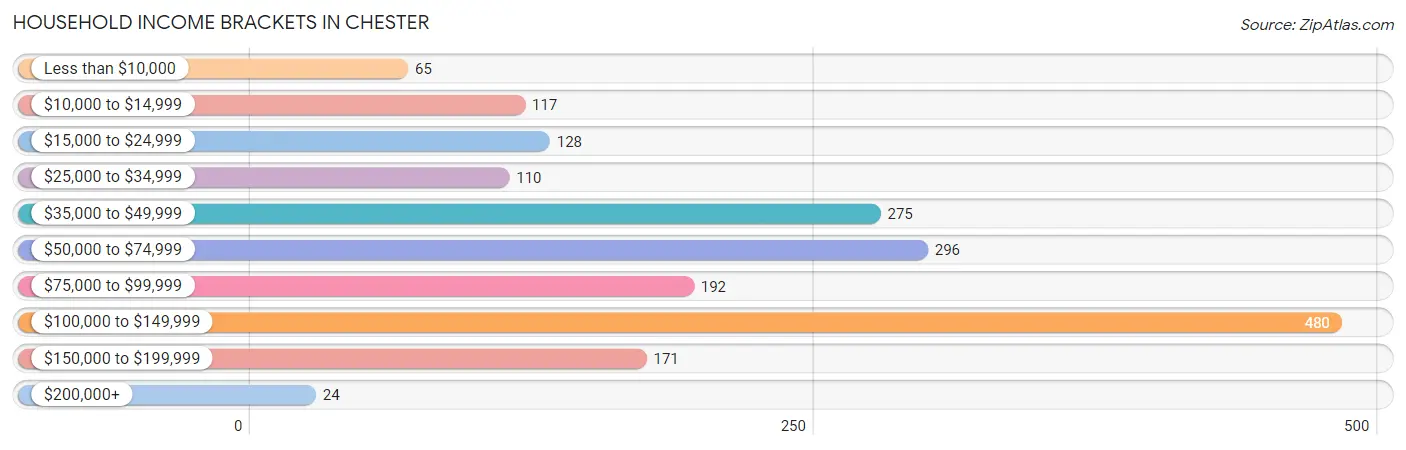
| Income Bracket | # Households | % Households |
| Less than $10,000 | 65 | 3.5% |
| $10,000 to $14,999 | 117 | 6.3% |
| $15,000 to $24,999 | 128 | 6.9% |
| $25,000 to $34,999 | 110 | 5.9% |
| $35,000 to $49,999 | 275 | 14.8% |
| $50,000 to $74,999 | 296 | 15.9% |
| $75,000 to $99,999 | 192 | 10.3% |
| $100,000 to $149,999 | 480 | 25.8% |
| $150,000 to $199,999 | 171 | 9.2% |
| $200,000+ | 24 | 1.3% |
Household Income by Householder Age in Chester
The median household income in Chester is $68,826, with the highest median household income of $102,778 found in the 25 to 44 years age bracket for the primary householder. A total of 536 households (28.8%) fall into this category. Meanwhile, the 65+ years age bracket for the primary householder has the lowest median household income of $49,405, with 492 households (26.5%) in this group.
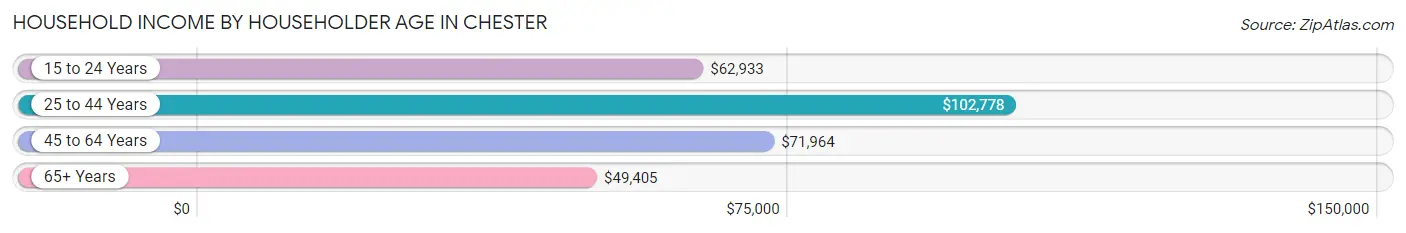
| Income Bracket | # Households | Median Income |
| 15 to 24 Years | 43 (2.3%) | $62,933 |
| 25 to 44 Years | 536 (28.8%) | $102,778 |
| 45 to 64 Years | 789 (42.4%) | $71,964 |
| 65+ Years | 492 (26.5%) | $49,405 |
| Total | 1,860 (100.0%) | $68,826 |
Poverty in Chester
Income Below Poverty by Sex and Age in Chester
With 22.0% poverty level for males and 18.2% for females among the residents of Chester, 12 to 14 year old males and 6 to 11 year old females are the most vulnerable to poverty, with 22 males (46.8%) and 21 females (38.9%) in their respective age groups living below the poverty level.
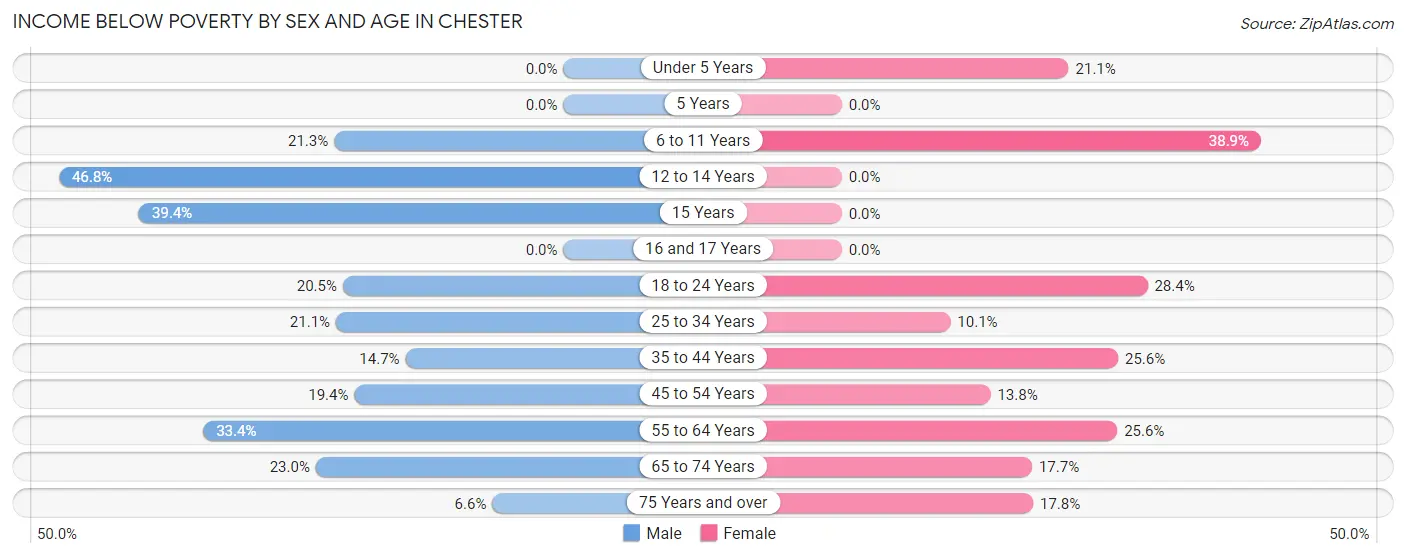
| Age Bracket | Male | Female |
| Under 5 Years | 0 (0.0%) | 24 (21.0%) |
| 5 Years | 0 (0.0%) | 0 (0.0%) |
| 6 to 11 Years | 20 (21.3%) | 21 (38.9%) |
| 12 to 14 Years | 22 (46.8%) | 0 (0.0%) |
| 15 Years | 13 (39.4%) | 0 (0.0%) |
| 16 and 17 Years | 0 (0.0%) | 0 (0.0%) |
| 18 to 24 Years | 35 (20.5%) | 40 (28.4%) |
| 25 to 34 Years | 91 (21.1%) | 24 (10.1%) |
| 35 to 44 Years | 39 (14.7%) | 50 (25.6%) |
| 45 to 54 Years | 52 (19.4%) | 49 (13.8%) |
| 55 to 64 Years | 128 (33.4%) | 103 (25.6%) |
| 65 to 74 Years | 57 (23.0%) | 39 (17.6%) |
| 75 Years and over | 7 (6.6%) | 30 (17.7%) |
| Total | 464 (22.0%) | 380 (18.2%) |
Income Above Poverty by Sex and Age in Chester
According to the poverty statistics in Chester, males aged under 5 years and females aged 5 years are the age groups that are most secure financially, with 100.0% of males and 100.0% of females in these age groups living above the poverty line.
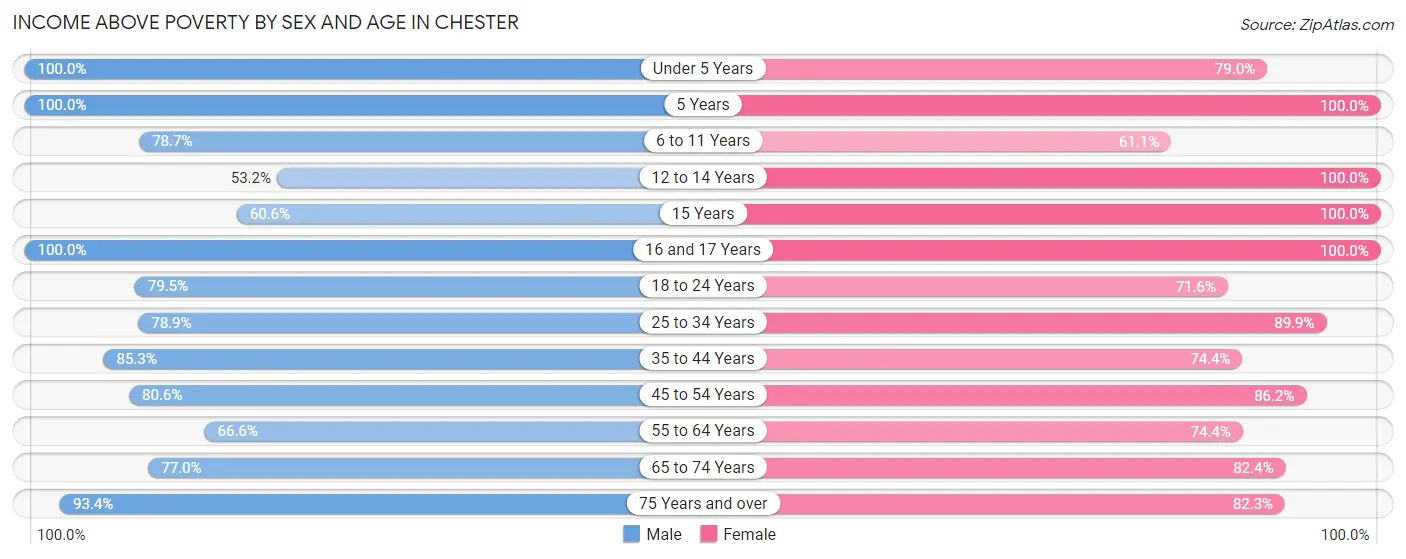
| Age Bracket | Male | Female |
| Under 5 Years | 25 (100.0%) | 90 (78.9%) |
| 5 Years | 3 (100.0%) | 14 (100.0%) |
| 6 to 11 Years | 74 (78.7%) | 33 (61.1%) |
| 12 to 14 Years | 25 (53.2%) | 115 (100.0%) |
| 15 Years | 20 (60.6%) | 30 (100.0%) |
| 16 and 17 Years | 38 (100.0%) | 38 (100.0%) |
| 18 to 24 Years | 136 (79.5%) | 101 (71.6%) |
| 25 to 34 Years | 340 (78.9%) | 214 (89.9%) |
| 35 to 44 Years | 227 (85.3%) | 145 (74.4%) |
| 45 to 54 Years | 216 (80.6%) | 306 (86.2%) |
| 55 to 64 Years | 255 (66.6%) | 300 (74.4%) |
| 65 to 74 Years | 191 (77.0%) | 182 (82.4%) |
| 75 Years and over | 99 (93.4%) | 139 (82.3%) |
| Total | 1,649 (78.0%) | 1,707 (81.8%) |
Income Below Poverty Among Married-Couple Families in Chester
The poverty statistics for married-couple families in Chester show that 4.3% or 30 of the total 705 families live below the poverty line. Families with no children have the highest poverty rate of 4.5%, comprising of 23 families. On the other hand, families with 3 or 4 children have the lowest poverty rate of 0.0%, which includes 0 families.
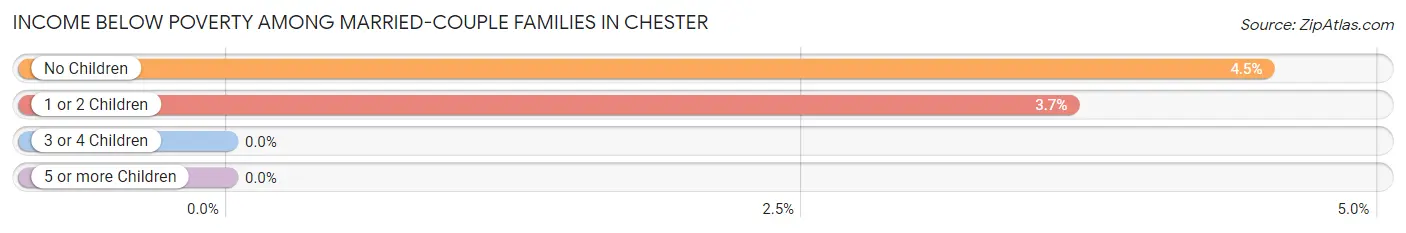
| Children | Above Poverty | Below Poverty |
| No Children | 487 (95.5%) | 23 (4.5%) |
| 1 or 2 Children | 184 (96.3%) | 7 (3.7%) |
| 3 or 4 Children | 4 (100.0%) | 0 (0.0%) |
| 5 or more Children | 0 (0.0%) | 0 (0.0%) |
| Total | 675 (95.7%) | 30 (4.3%) |
Income Below Poverty Among Single-Parent Households in Chester
According to the poverty data in Chester, 53.4% or 79 single-father households and 24.6% or 50 single-mother households are living below the poverty line. Among single-father households, those with no children have the highest poverty rate, with 60 households (66.7%) experiencing poverty. Likewise, among single-mother households, those with 3 or 4 children have the highest poverty rate, with 24 households (100.0%) falling below the poverty line.
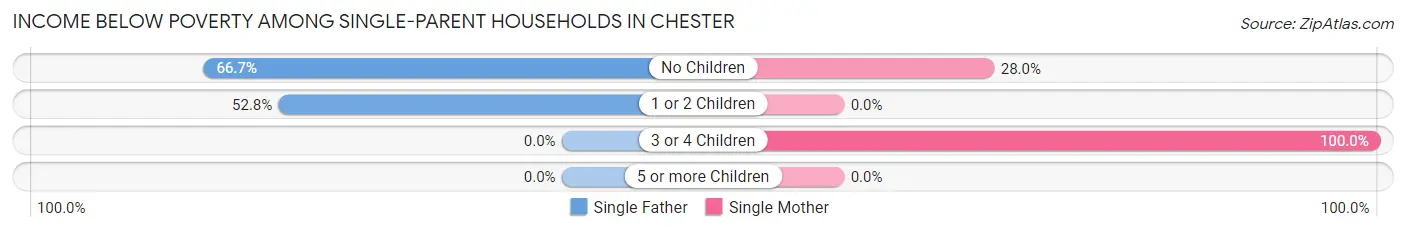
| Children | Single Father | Single Mother |
| No Children | 60 (66.7%) | 26 (28.0%) |
| 1 or 2 Children | 19 (52.8%) | 0 (0.0%) |
| 3 or 4 Children | 0 (0.0%) | 24 (100.0%) |
| 5 or more Children | 0 (0.0%) | 0 (0.0%) |
| Total | 79 (53.4%) | 50 (24.6%) |
Income Below Poverty Among Married-Couple vs Single-Parent Households in Chester
The poverty data for Chester shows that 30 of the married-couple family households (4.3%) and 129 of the single-parent households (36.7%) are living below the poverty level. Within the married-couple family households, those with no children have the highest poverty rate, with 23 households (4.5%) falling below the poverty line. Among the single-parent households, those with 3 or 4 children have the highest poverty rate, with 24 household (52.2%) living below poverty.
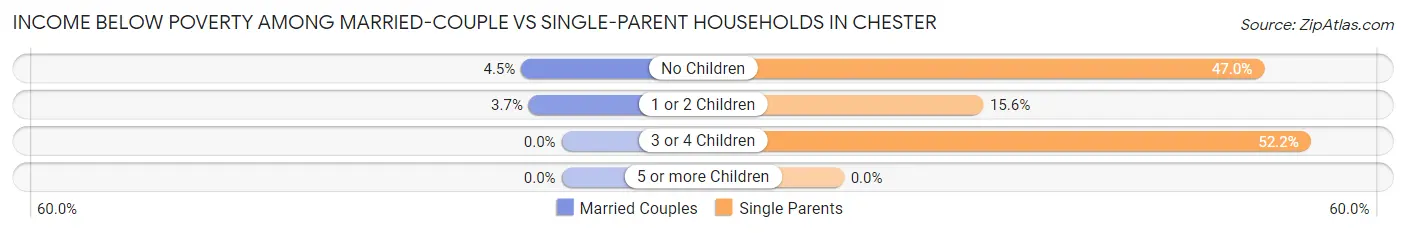
| Children | Married-Couple Families | Single-Parent Households |
| No Children | 23 (4.5%) | 86 (47.0%) |
| 1 or 2 Children | 7 (3.7%) | 19 (15.6%) |
| 3 or 4 Children | 0 (0.0%) | 24 (52.2%) |
| 5 or more Children | 0 (0.0%) | 0 (0.0%) |
| Total | 30 (4.3%) | 129 (36.7%) |
Race in Chester
The most populous races in Chester are White / Caucasian (4,858 | 70.0%), Black / African American (1,799 | 25.9%), and Hispanic or Latino (365 | 5.3%).
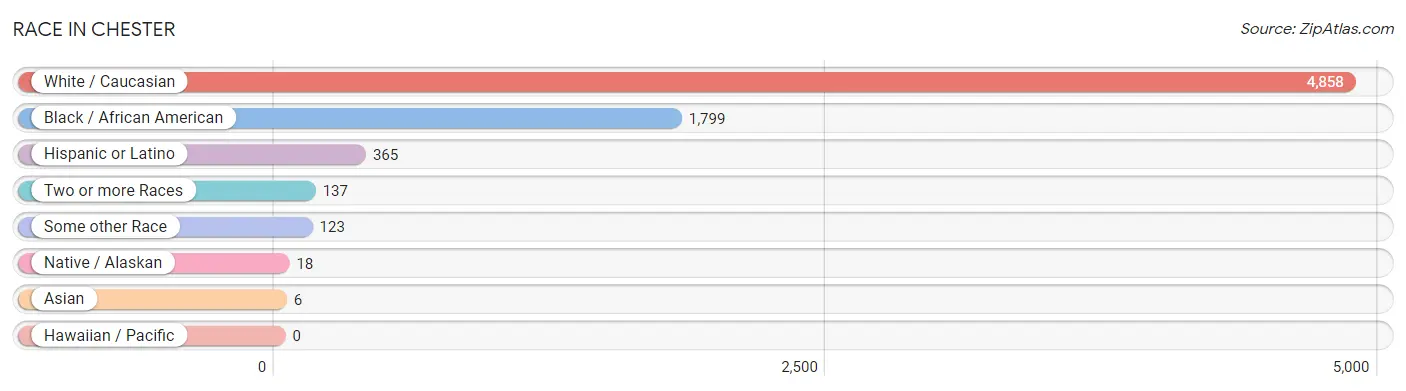
| Race | # Population | % Population |
| Asian | 6 | 0.1% |
| Black / African American | 1,799 | 25.9% |
| Hawaiian / Pacific | 0 | 0.0% |
| Hispanic or Latino | 365 | 5.3% |
| Native / Alaskan | 18 | 0.3% |
| White / Caucasian | 4,858 | 70.0% |
| Two or more Races | 137 | 2.0% |
| Some other Race | 123 | 1.8% |
| Total | 6,941 | 100.0% |
Ancestry in Chester
The most populous ancestries reported in Chester are German (1,249 | 18.0%), American (479 | 6.9%), Irish (441 | 6.4%), English (405 | 5.8%), and Mexican (300 | 4.3%), together accounting for 41.4% of all Chester residents.
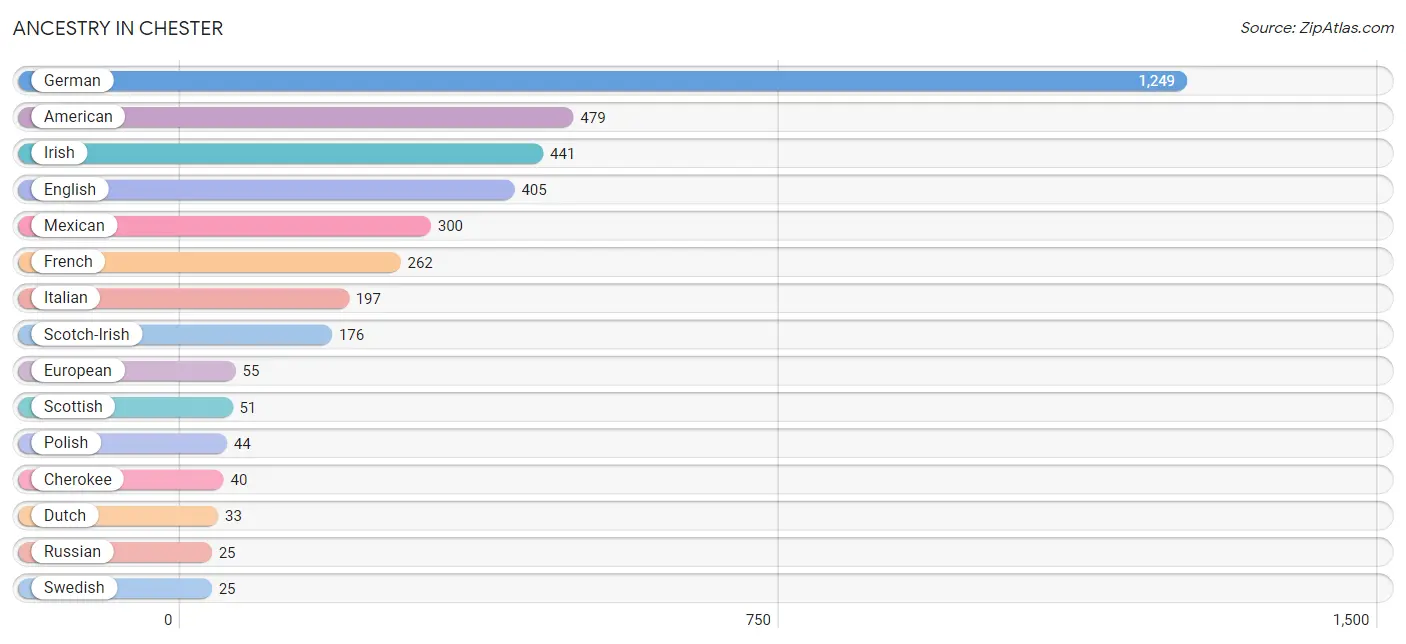
| Ancestry | # Population | % Population |
| American | 479 | 6.9% |
| Bhutanese | 6 | 0.1% |
| Central American | 14 | 0.2% |
| Cherokee | 40 | 0.6% |
| Cuban | 18 | 0.3% |
| Czech | 7 | 0.1% |
| Danish | 7 | 0.1% |
| Dutch | 33 | 0.5% |
| English | 405 | 5.8% |
| European | 55 | 0.8% |
| French | 262 | 3.8% |
| German | 1,249 | 18.0% |
| Honduran | 14 | 0.2% |
| Irish | 441 | 6.4% |
| Italian | 197 | 2.8% |
| Mexican | 300 | 4.3% |
| Norwegian | 8 | 0.1% |
| Polish | 44 | 0.6% |
| Puerto Rican | 24 | 0.4% |
| Russian | 25 | 0.4% |
| Scandinavian | 2 | 0.0% |
| Scotch-Irish | 176 | 2.5% |
| Scottish | 51 | 0.7% |
| Slovak | 6 | 0.1% |
| Swedish | 25 | 0.4% | View All 25 Rows |
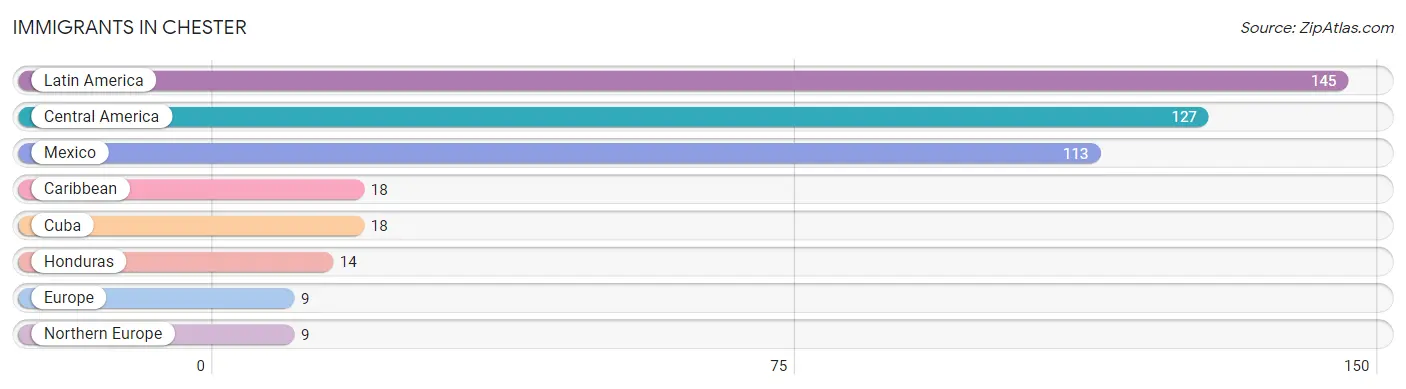
Immigrants in Chester
The most numerous immigrant groups reported in Chester came from Latin America (145 | 2.1%), Central America (127 | 1.8%), Mexico (113 | 1.6%), Caribbean (18 | 0.3%), and Cuba (18 | 0.3%), together accounting for 6.1% of all Chester residents.
| Immigration Origin | # Population | % Population |
| Caribbean | 18 | 0.3% |
| Central America | 127 | 1.8% |
| Cuba | 18 | 0.3% |
| Europe | 9 | 0.1% |
| Honduras | 14 | 0.2% |
| Latin America | 145 | 2.1% |
| Mexico | 113 | 1.6% |
| Northern Europe | 9 | 0.1% | View All 8 Rows |
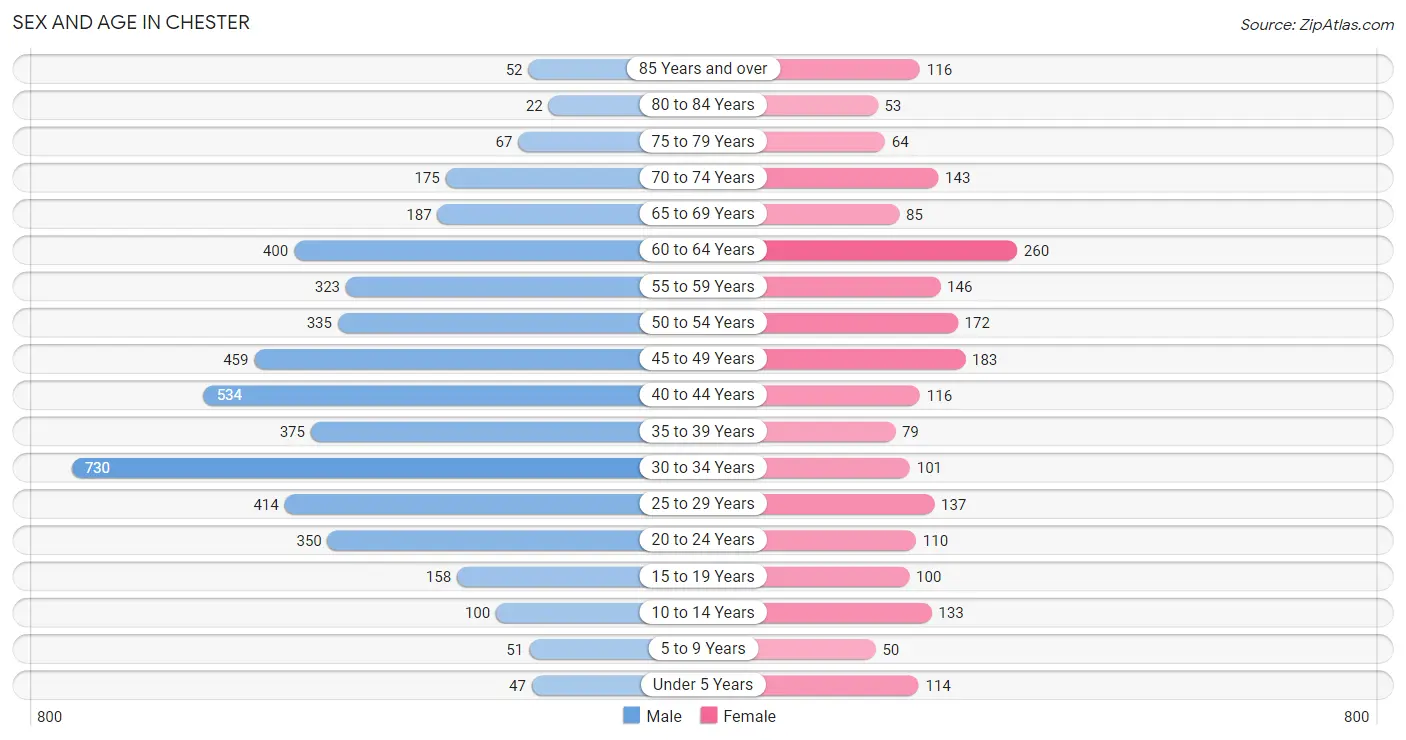
Sex and Age in Chester
Sex and Age in Chester
The most populous age groups in Chester are 30 to 34 Years (730 | 15.3%) for men and 60 to 64 Years (260 | 12.0%) for women.
| Age Bracket | Male | Female |
| Under 5 Years | 47 (1.0%) | 114 (5.3%) |
| 5 to 9 Years | 51 (1.1%) | 50 (2.3%) |
| 10 to 14 Years | 100 (2.1%) | 133 (6.1%) |
| 15 to 19 Years | 158 (3.3%) | 100 (4.6%) |
| 20 to 24 Years | 350 (7.3%) | 110 (5.1%) |
| 25 to 29 Years | 414 (8.7%) | 137 (6.3%) |
| 30 to 34 Years | 730 (15.3%) | 101 (4.7%) |
| 35 to 39 Years | 375 (7.9%) | 79 (3.6%) |
| 40 to 44 Years | 534 (11.2%) | 116 (5.4%) |
| 45 to 49 Years | 459 (9.6%) | 183 (8.5%) |
| 50 to 54 Years | 335 (7.0%) | 172 (8.0%) |
| 55 to 59 Years | 323 (6.8%) | 146 (6.8%) |
| 60 to 64 Years | 400 (8.4%) | 260 (12.0%) |
| 65 to 69 Years | 187 (3.9%) | 85 (3.9%) |
| 70 to 74 Years | 175 (3.7%) | 143 (6.6%) |
| 75 to 79 Years | 67 (1.4%) | 64 (3.0%) |
| 80 to 84 Years | 22 (0.5%) | 53 (2.5%) |
| 85 Years and over | 52 (1.1%) | 116 (5.4%) |
| Total | 4,779 (100.0%) | 2,162 (100.0%) |
Families and Households in Chester
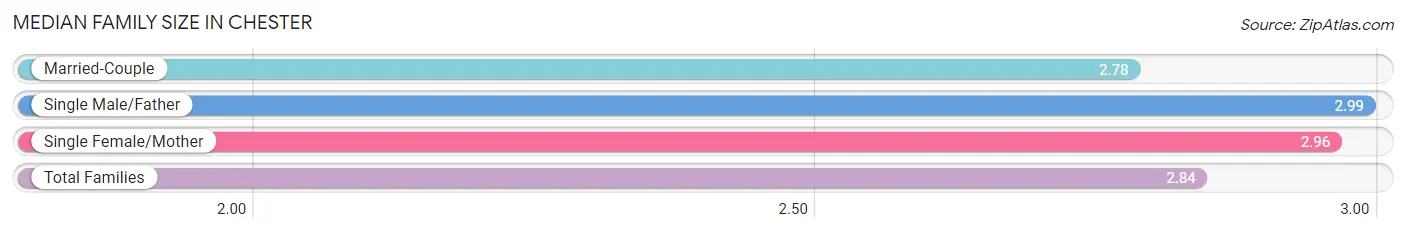
Median Family Size in Chester
The median family size in Chester is 2.84 persons per family, with single male/father families (148 | 14.0%) accounting for the largest median family size of 2.99 persons per family. On the other hand, married-couple families (705 | 66.8%) represent the smallest median family size with 2.78 persons per family.
| Family Type | # Families | Family Size |
| Married-Couple | 705 (66.8%) | 2.78 |
| Single Male/Father | 148 (14.0%) | 2.99 |
| Single Female/Mother | 203 (19.2%) | 2.96 |
| Total Families | 1,056 (100.0%) | 2.84 |
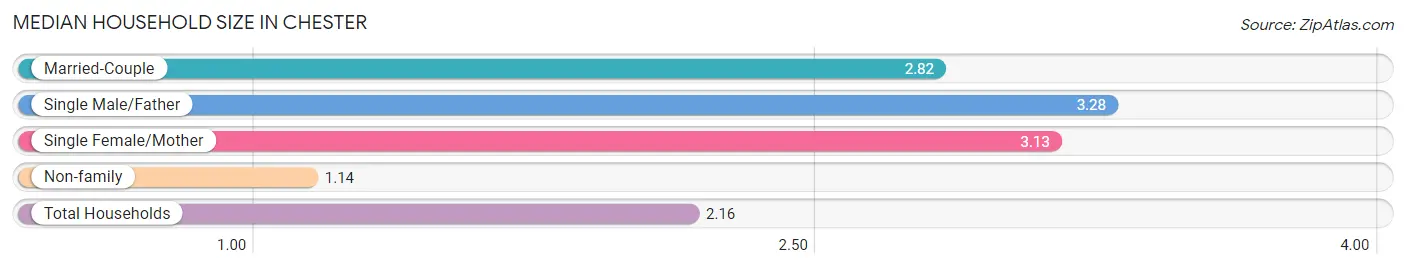
Median Household Size in Chester
The median household size in Chester is 2.16 persons per household, with single male/father households (148 | 8.0%) accounting for the largest median household size of 3.28 persons per household. non-family households (804 | 43.2%) represent the smallest median household size with 1.14 persons per household.
| Household Type | # Households | Household Size |
| Married-Couple | 705 (37.9%) | 2.82 |
| Single Male/Father | 148 (8.0%) | 3.28 |
| Single Female/Mother | 203 (10.9%) | 3.13 |
| Non-family | 804 (43.2%) | 1.14 |
| Total Households | 1,860 (100.0%) | 2.16 |
Household Size by Marriage Status in Chester
Out of a total of 1,860 households in Chester, 1,056 (56.8%) are family households, while 804 (43.2%) are nonfamily households. The most numerous type of family households are 2-person households, comprising 537, and the most common type of nonfamily households are 1-person households, comprising 671.
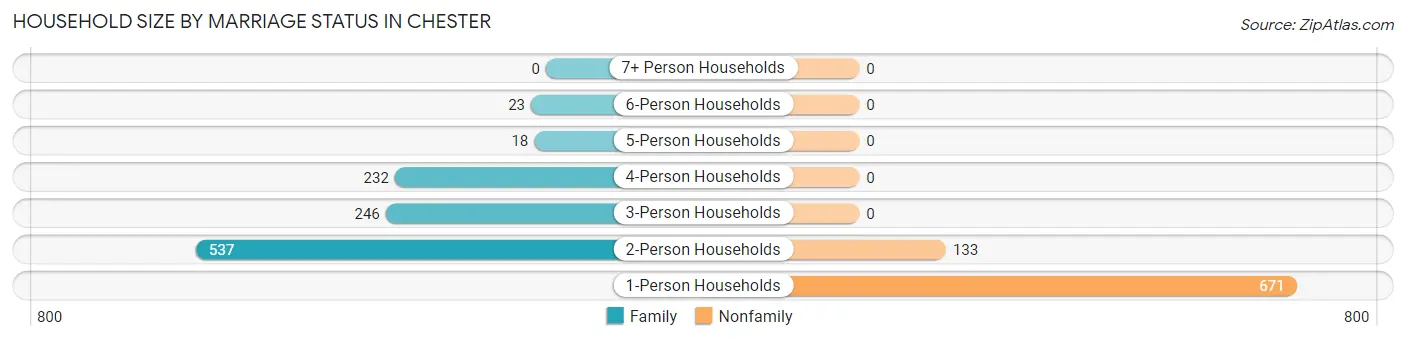
| Household Size | Family Households | Nonfamily Households |
| 1-Person Households | - | 671 (36.1%) |
| 2-Person Households | 537 (28.9%) | 133 (7.1%) |
| 3-Person Households | 246 (13.2%) | 0 (0.0%) |
| 4-Person Households | 232 (12.5%) | 0 (0.0%) |
| 5-Person Households | 18 (1.0%) | 0 (0.0%) |
| 6-Person Households | 23 (1.2%) | 0 (0.0%) |
| 7+ Person Households | 0 (0.0%) | 0 (0.0%) |
| Total | 1,056 (56.8%) | 804 (43.2%) |
Female Fertility in Chester
Fertility by Age in Chester
Average fertility rate in Chester is 38.0 births per 1,000 women. Women in the age bracket of 20 to 34 years have the highest fertility rate with 69.0 births per 1,000 women. Women in the age bracket of 20 to 34 years acount for 72.7% of all women with births.
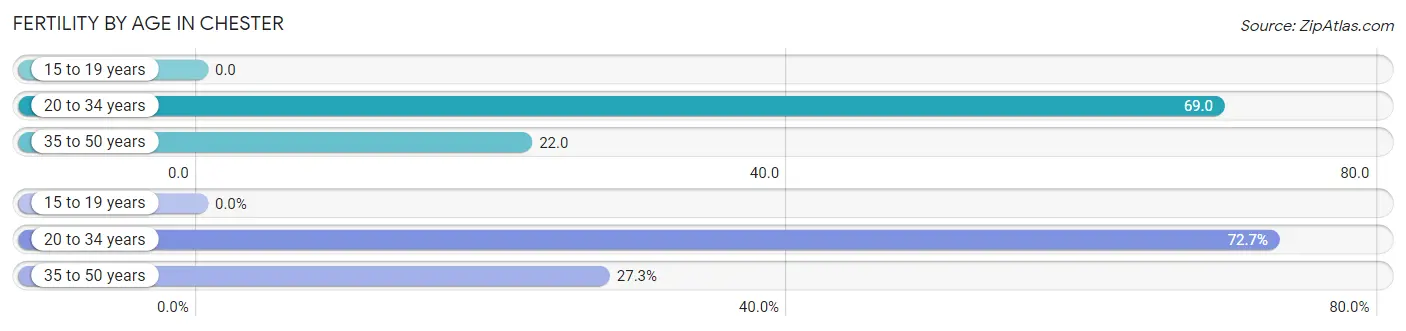
| Age Bracket | Women with Births | Births / 1,000 Women |
| 15 to 19 years | 0 (0.0%) | 0.0 |
| 20 to 34 years | 24 (72.7%) | 69.0 |
| 35 to 50 years | 9 (27.3%) | 22.0 |
| Total | 33 (100.0%) | 38.0 |
Fertility by Age by Marriage Status in Chester
27.3% of women with births (33) in Chester are married. The highest percentage of unmarried women with births falls into 20 to 34 years age bracket with 100.0% of them unmarried at the time of birth, while the lowest percentage of unmarried women with births belong to 35 to 50 years age bracket with 0.0% of them unmarried.
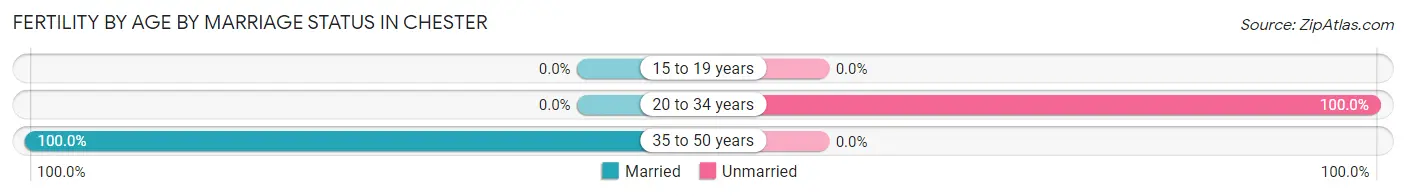
| Age Bracket | Married | Unmarried |
| 15 to 19 years | 0 (0.0%) | 0 (0.0%) |
| 20 to 34 years | 0 (0.0%) | 24 (100.0%) |
| 35 to 50 years | 9 (100.0%) | 0 (0.0%) |
| Total | 9 (27.3%) | 24 (72.7%) |
Fertility by Education in Chester
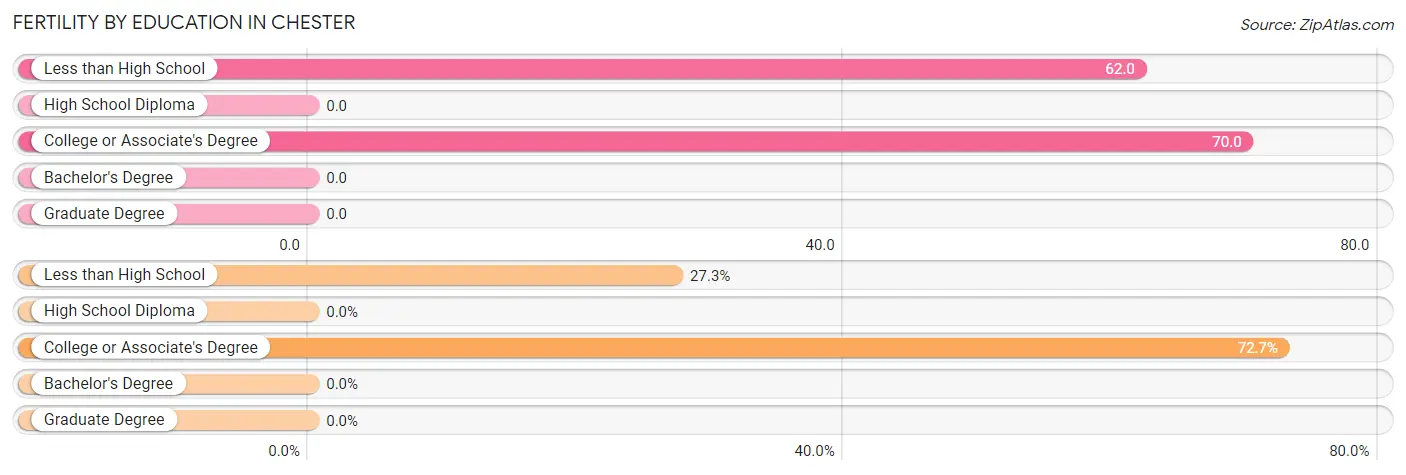
| Educational Attainment | Women with Births | Births / 1,000 Women |
| Less than High School | 9 (27.3%) | 62.0 |
| High School Diploma | 0 (0.0%) | 0.0 |
| College or Associate's Degree | 24 (72.7%) | 70.0 |
| Bachelor's Degree | 0 (0.0%) | 0.0 |
| Graduate Degree | 0 (0.0%) | 0.0 |
| Total | 33 (100.0%) | 38.0 |
Fertility by Education by Marriage Status in Chester
72.7% of women with births in Chester are unmarried. Women with the educational attainment of less than high school are most likely to be married with 100.0% of them married at childbirth, while women with the educational attainment of college or associate's degree are least likely to be married with 100.0% of them unmarried at childbirth.
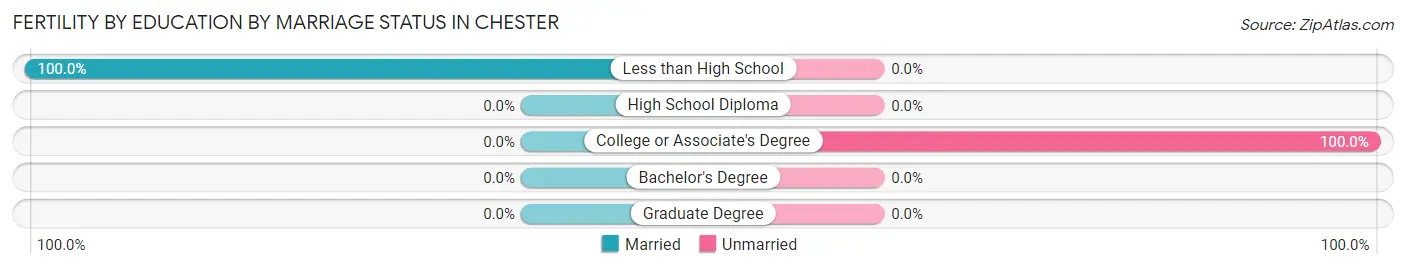
| Educational Attainment | Married | Unmarried |
| Less than High School | 9 (100.0%) | 0 (0.0%) |
| High School Diploma | 0 (0.0%) | 0 (0.0%) |
| College or Associate's Degree | 0 (0.0%) | 24 (100.0%) |
| Bachelor's Degree | 0 (0.0%) | 0 (0.0%) |
| Graduate Degree | 0 (0.0%) | 0 (0.0%) |
| Total | 9 (27.3%) | 24 (72.7%) |
Employment Characteristics in Chester
Employment by Class of Employer in Chester
Among the 2,035 employed individuals in Chester, private company employees (1,046 | 51.4%), state government employees (514 | 25.3%), and local government employees (134 | 6.6%) make up the most common classes of employment.
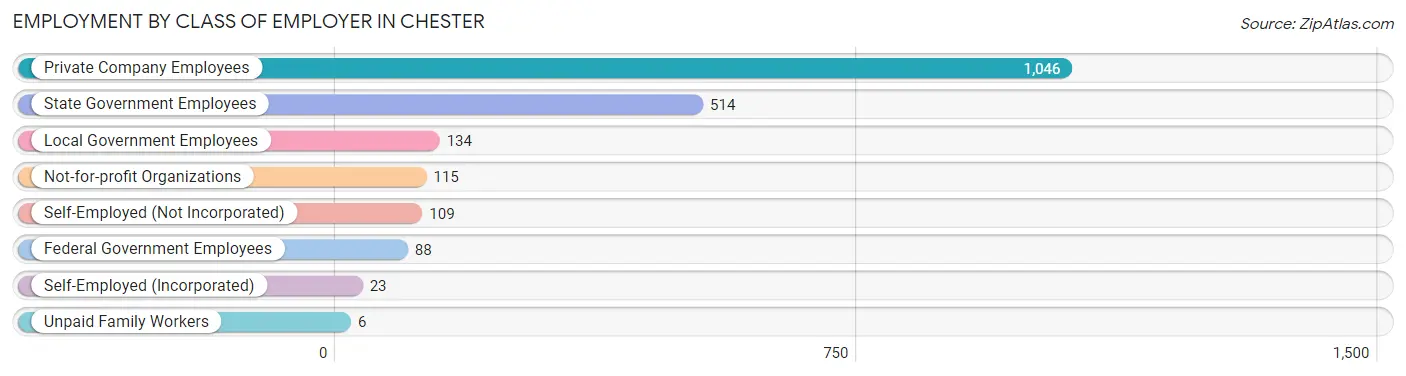
| Employer Class | # Employees | % Employees |
| Private Company Employees | 1,046 | 51.4% |
| Self-Employed (Incorporated) | 23 | 1.1% |
| Self-Employed (Not Incorporated) | 109 | 5.4% |
| Not-for-profit Organizations | 115 | 5.7% |
| Local Government Employees | 134 | 6.6% |
| State Government Employees | 514 | 25.3% |
| Federal Government Employees | 88 | 4.3% |
| Unpaid Family Workers | 6 | 0.3% |
| Total | 2,035 | 100.0% |
Employment Status by Age in Chester
According to the labor force statistics for Chester, out of the total population over 16 years of age (6,383), 34.5% or 2,202 individuals are in the labor force, with 3.7% or 81 of them unemployed. The age group with the highest labor force participation rate is 55 to 59 years, with 44.1% or 207 individuals in the labor force. Within the labor force, the 16 to 19 years age range has the highest percentage of unemployed individuals, with 14.0% or 7 of them being unemployed.
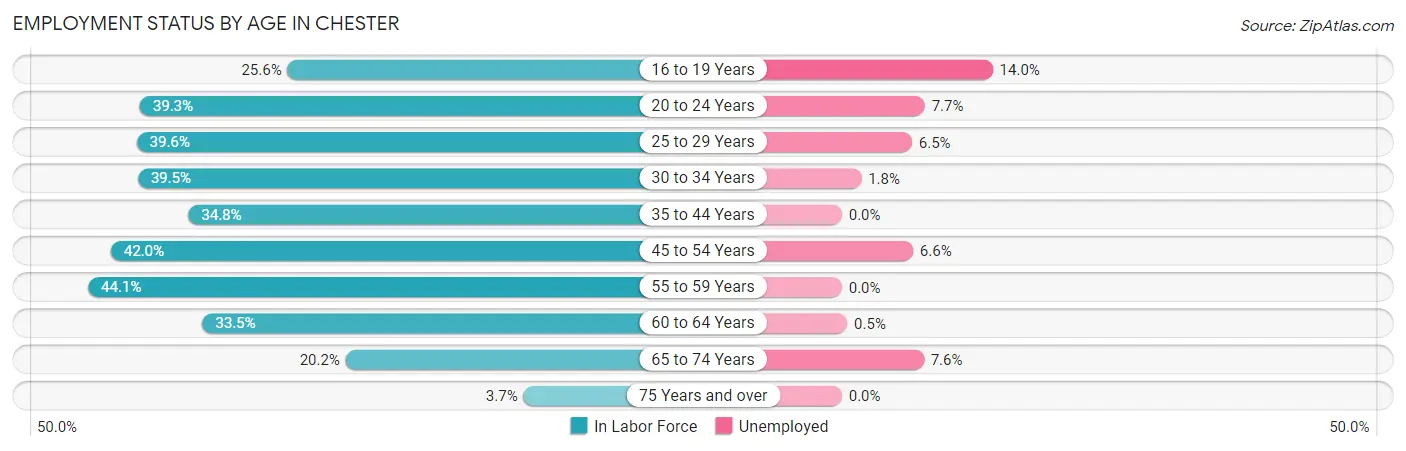
| Age Bracket | In Labor Force | Unemployed |
| 16 to 19 Years | 50 (25.6%) | 7 (14.0%) |
| 20 to 24 Years | 181 (39.3%) | 14 (7.7%) |
| 25 to 29 Years | 218 (39.6%) | 14 (6.5%) |
| 30 to 34 Years | 328 (39.5%) | 6 (1.8%) |
| 35 to 44 Years | 384 (34.8%) | 0 (0.0%) |
| 45 to 54 Years | 483 (42.0%) | 32 (6.6%) |
| 55 to 59 Years | 207 (44.1%) | 0 (0.0%) |
| 60 to 64 Years | 221 (33.5%) | 1 (0.5%) |
| 65 to 74 Years | 119 (20.2%) | 9 (7.6%) |
| 75 Years and over | 14 (3.7%) | 0 (0.0%) |
| Total | 2,202 (34.5%) | 81 (3.7%) |
Employment Status by Educational Attainment in Chester
According to labor force statistics for Chester, 38.6% of individuals (1,839) out of the total population between 25 and 64 years of age (4,764) are in the labor force, with 2.8% or 51 of them being unemployed. The group with the highest labor force participation rate are those with the educational attainment of bachelor's degree or higher, with 92.0% or 253 individuals in the labor force. Within the labor force, individuals with less than high school education have the highest percentage of unemployment, with 19.1% or 21 of them being unemployed.
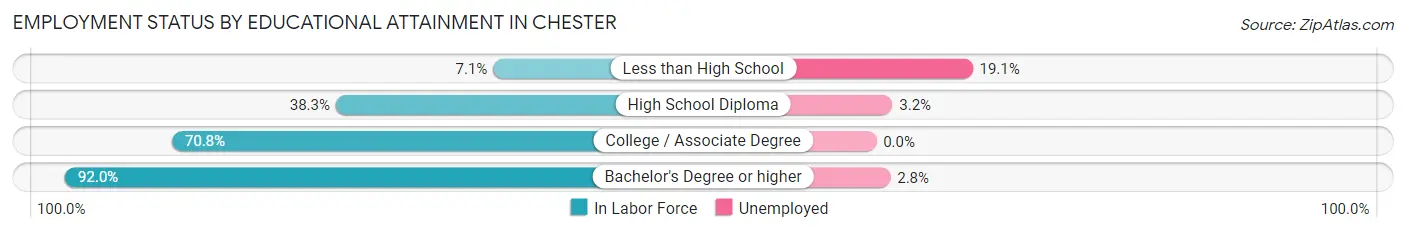
| Educational Attainment | In Labor Force | Unemployed |
| Less than High School | 110 (7.1%) | 295 (19.1%) |
| High School Diploma | 717 (38.3%) | 60 (3.2%) |
| College / Associate Degree | 760 (70.8%) | 0 (0.0%) |
| Bachelor's Degree or higher | 253 (92.0%) | 8 (2.8%) |
| Total | 1,839 (38.6%) | 133 (2.8%) |
Employment Occupations by Sex in Chester
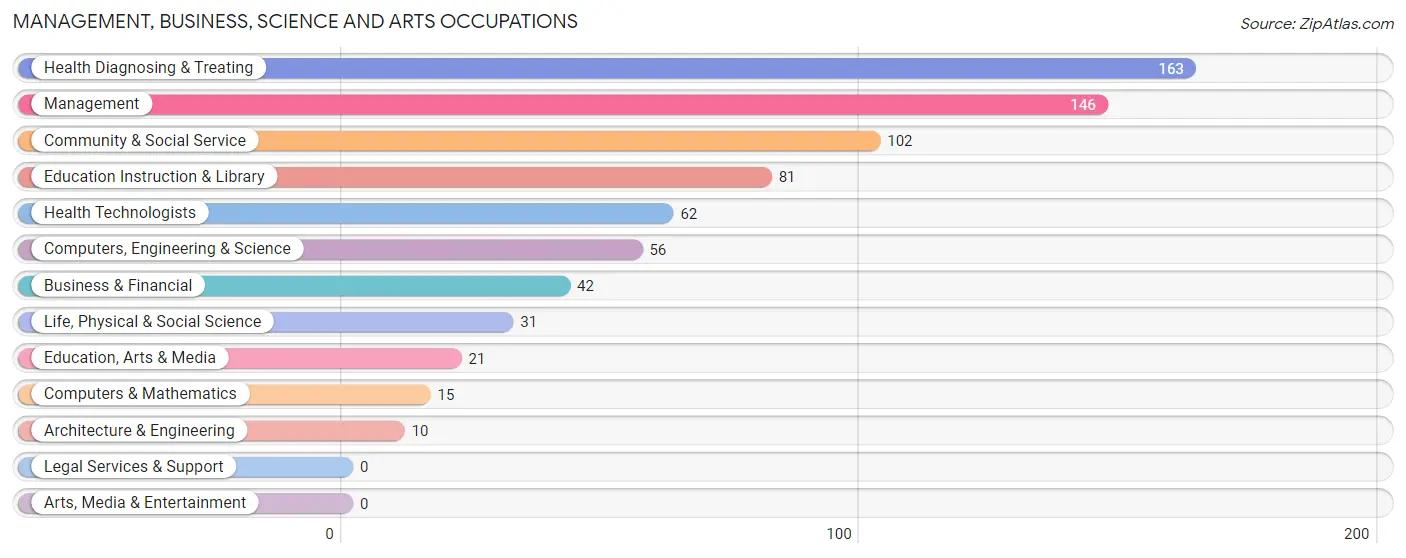
Management, Business, Science and Arts Occupations
The most common Management, Business, Science and Arts occupations in Chester are Health Diagnosing & Treating (163 | 7.8%), Management (146 | 7.0%), Community & Social Service (102 | 4.9%), Education Instruction & Library (81 | 3.9%), and Health Technologists (62 | 3.0%).
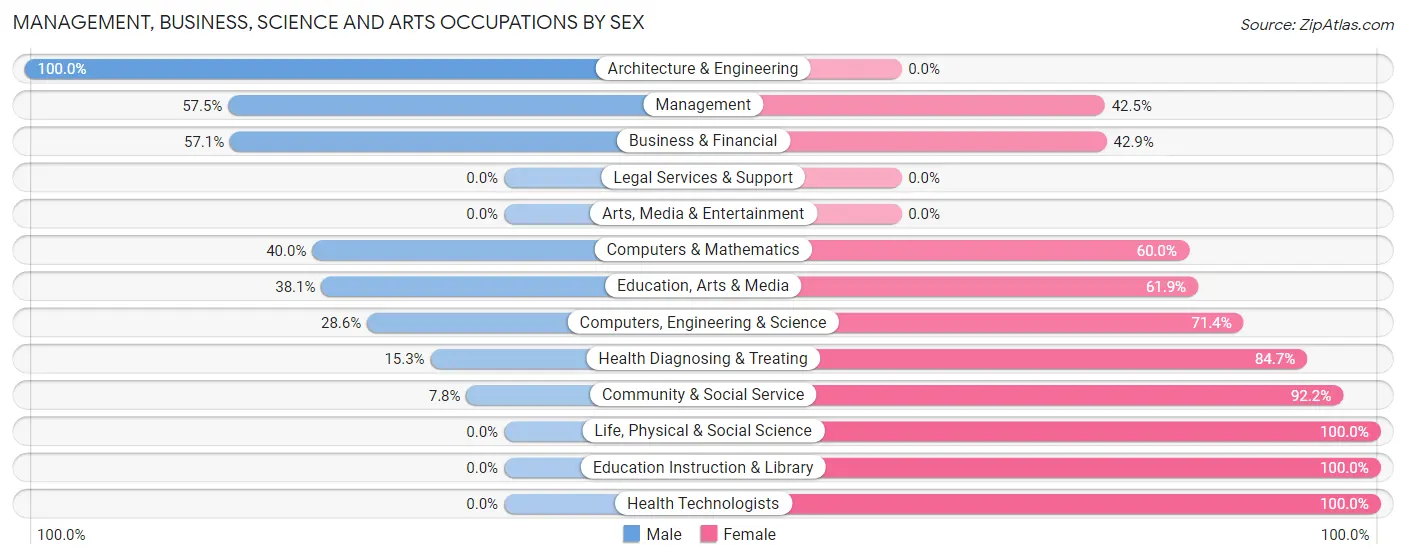
Management, Business, Science and Arts Occupations by Sex
Within the Management, Business, Science and Arts occupations in Chester, the most male-oriented occupations are Architecture & Engineering (100.0%), Management (57.5%), and Business & Financial (57.1%), while the most female-oriented occupations are Life, Physical & Social Science (100.0%), Education Instruction & Library (100.0%), and Health Technologists (100.0%).
| Occupation | Male | Female |
| Management | 84 (57.5%) | 62 (42.5%) |
| Business & Financial | 24 (57.1%) | 18 (42.9%) |
| Computers, Engineering & Science | 16 (28.6%) | 40 (71.4%) |
| Computers & Mathematics | 6 (40.0%) | 9 (60.0%) |
| Architecture & Engineering | 10 (100.0%) | 0 (0.0%) |
| Life, Physical & Social Science | 0 (0.0%) | 31 (100.0%) |
| Community & Social Service | 8 (7.8%) | 94 (92.2%) |
| Education, Arts & Media | 8 (38.1%) | 13 (61.9%) |
| Legal Services & Support | 0 (0.0%) | 0 (0.0%) |
| Education Instruction & Library | 0 (0.0%) | 81 (100.0%) |
| Arts, Media & Entertainment | 0 (0.0%) | 0 (0.0%) |
| Health Diagnosing & Treating | 25 (15.3%) | 138 (84.7%) |
| Health Technologists | 0 (0.0%) | 62 (100.0%) |
| Total (Category) | 157 (30.8%) | 352 (69.2%) |
| Total (Overall) | 1,042 (49.8%) | 1,049 (50.2%) |
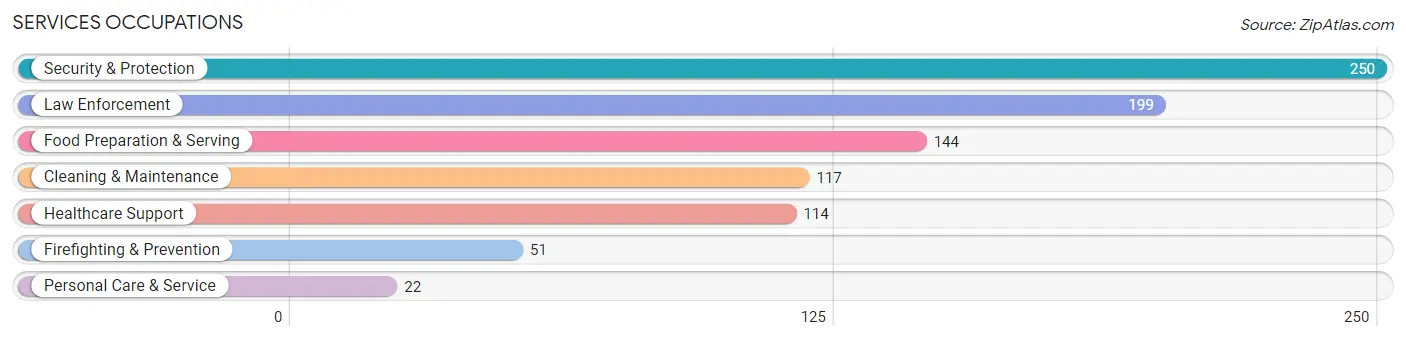
Services Occupations
The most common Services occupations in Chester are Security & Protection (250 | 12.0%), Law Enforcement (199 | 9.5%), Food Preparation & Serving (144 | 6.9%), Cleaning & Maintenance (117 | 5.6%), and Healthcare Support (114 | 5.4%).
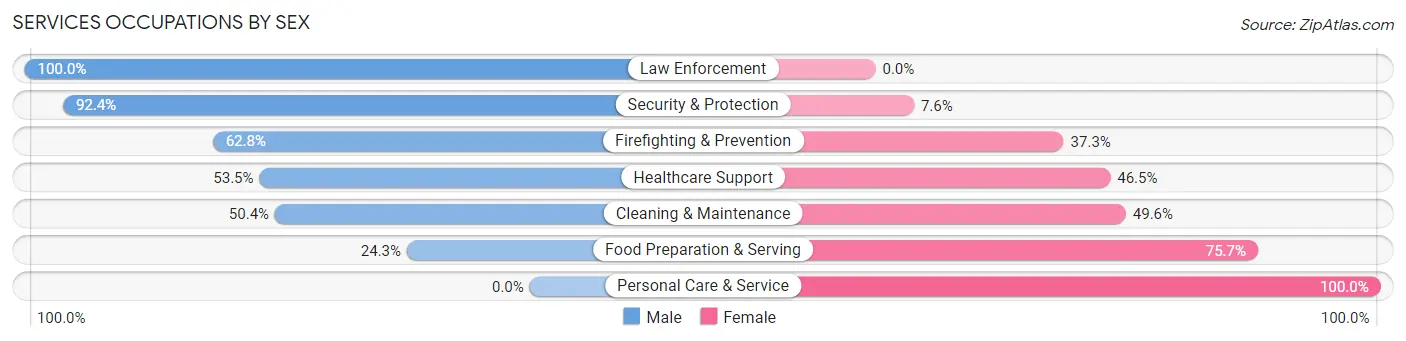
Services Occupations by Sex
Within the Services occupations in Chester, the most male-oriented occupations are Law Enforcement (100.0%), Security & Protection (92.4%), and Firefighting & Prevention (62.7%), while the most female-oriented occupations are Personal Care & Service (100.0%), Food Preparation & Serving (75.7%), and Cleaning & Maintenance (49.6%).
| Occupation | Male | Female |
| Healthcare Support | 61 (53.5%) | 53 (46.5%) |
| Security & Protection | 231 (92.4%) | 19 (7.6%) |
| Firefighting & Prevention | 32 (62.7%) | 19 (37.2%) |
| Law Enforcement | 199 (100.0%) | 0 (0.0%) |
| Food Preparation & Serving | 35 (24.3%) | 109 (75.7%) |
| Cleaning & Maintenance | 59 (50.4%) | 58 (49.6%) |
| Personal Care & Service | 0 (0.0%) | 22 (100.0%) |
| Total (Category) | 386 (59.7%) | 261 (40.3%) |
| Total (Overall) | 1,042 (49.8%) | 1,049 (50.2%) |
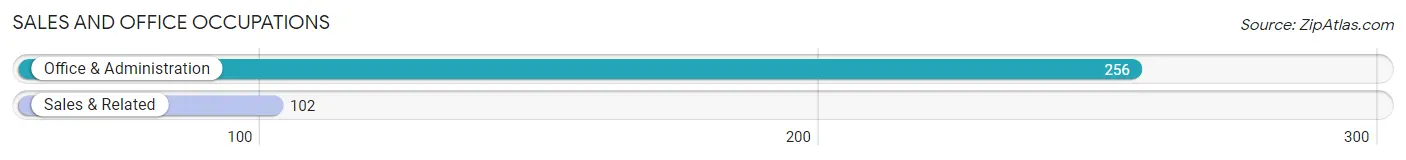
Sales and Office Occupations
The most common Sales and Office occupations in Chester are Office & Administration (256 | 12.2%), and Sales & Related (102 | 4.9%).
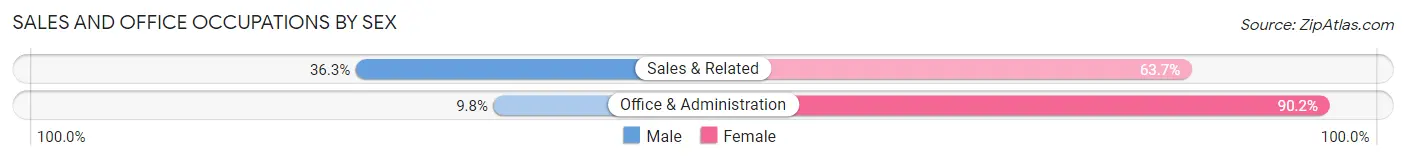
Sales and Office Occupations by Sex
| Occupation | Male | Female |
| Sales & Related | 37 (36.3%) | 65 (63.7%) |
| Office & Administration | 25 (9.8%) | 231 (90.2%) |
| Total (Category) | 62 (17.3%) | 296 (82.7%) |
| Total (Overall) | 1,042 (49.8%) | 1,049 (50.2%) |
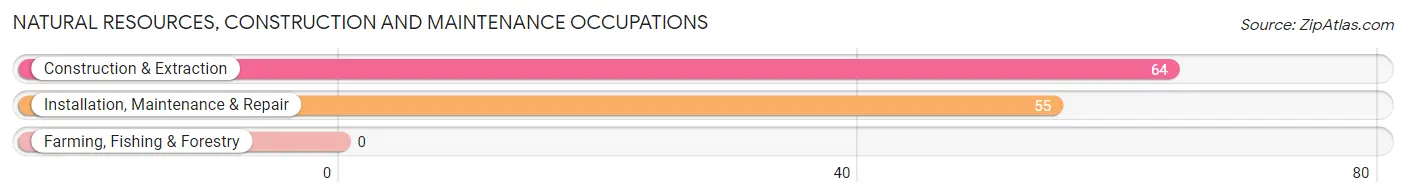
Natural Resources, Construction and Maintenance Occupations
The most common Natural Resources, Construction and Maintenance occupations in Chester are Construction & Extraction (64 | 3.1%), and Installation, Maintenance & Repair (55 | 2.6%).
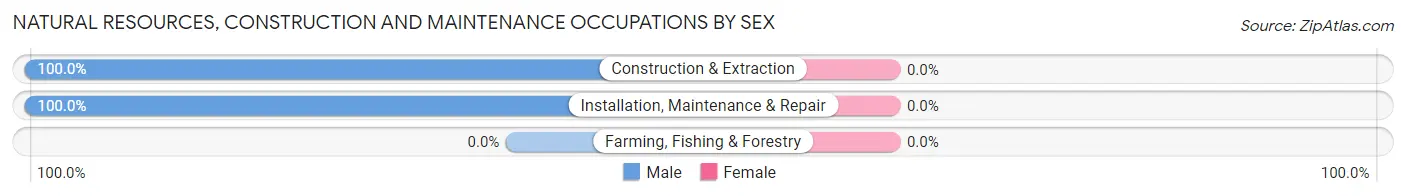
Natural Resources, Construction and Maintenance Occupations by Sex
| Occupation | Male | Female |
| Farming, Fishing & Forestry | 0 (0.0%) | 0 (0.0%) |
| Construction & Extraction | 64 (100.0%) | 0 (0.0%) |
| Installation, Maintenance & Repair | 55 (100.0%) | 0 (0.0%) |
| Total (Category) | 119 (100.0%) | 0 (0.0%) |
| Total (Overall) | 1,042 (49.8%) | 1,049 (50.2%) |
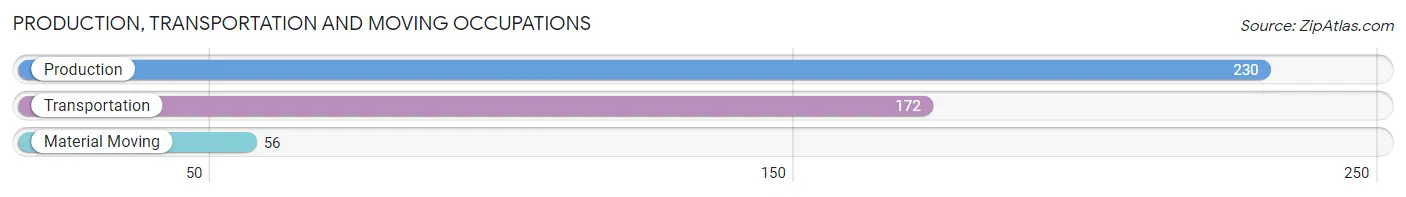
Production, Transportation and Moving Occupations
The most common Production, Transportation and Moving occupations in Chester are Production (230 | 11.0%), Transportation (172 | 8.2%), and Material Moving (56 | 2.7%).
Production, Transportation and Moving Occupations by Sex
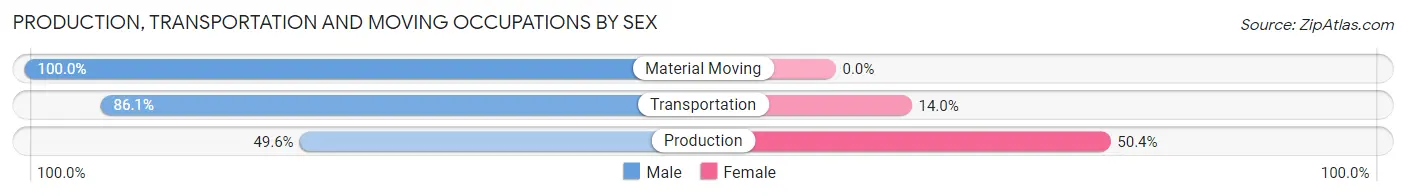
| Occupation | Male | Female |
| Production | 114 (49.6%) | 116 (50.4%) |
| Transportation | 148 (86.1%) | 24 (14.0%) |
| Material Moving | 56 (100.0%) | 0 (0.0%) |
| Total (Category) | 318 (69.4%) | 140 (30.6%) |
| Total (Overall) | 1,042 (49.8%) | 1,049 (50.2%) |
Employment Industries by Sex in Chester
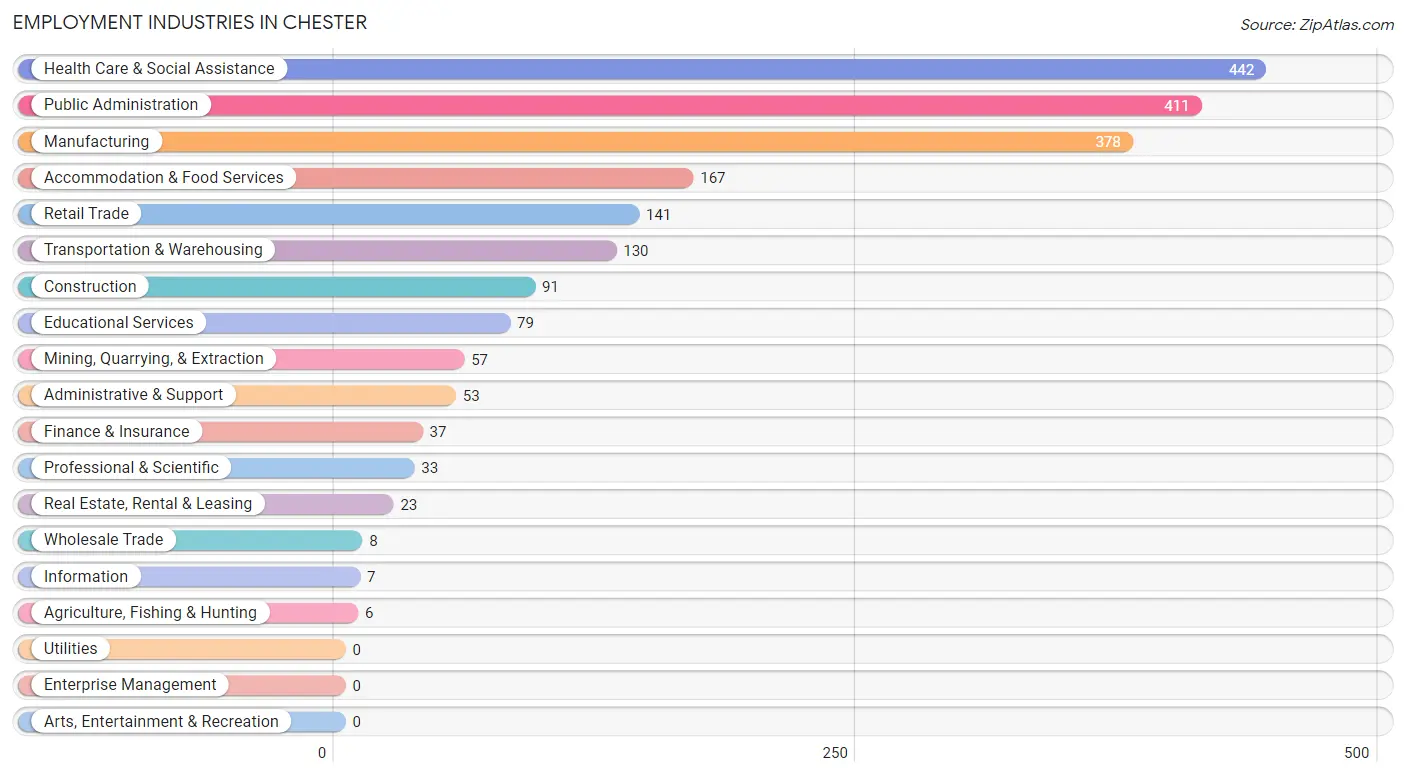
Employment Industries in Chester
The major employment industries in Chester include Health Care & Social Assistance (442 | 21.1%), Public Administration (411 | 19.7%), Manufacturing (378 | 18.1%), Accommodation & Food Services (167 | 8.0%), and Retail Trade (141 | 6.7%).
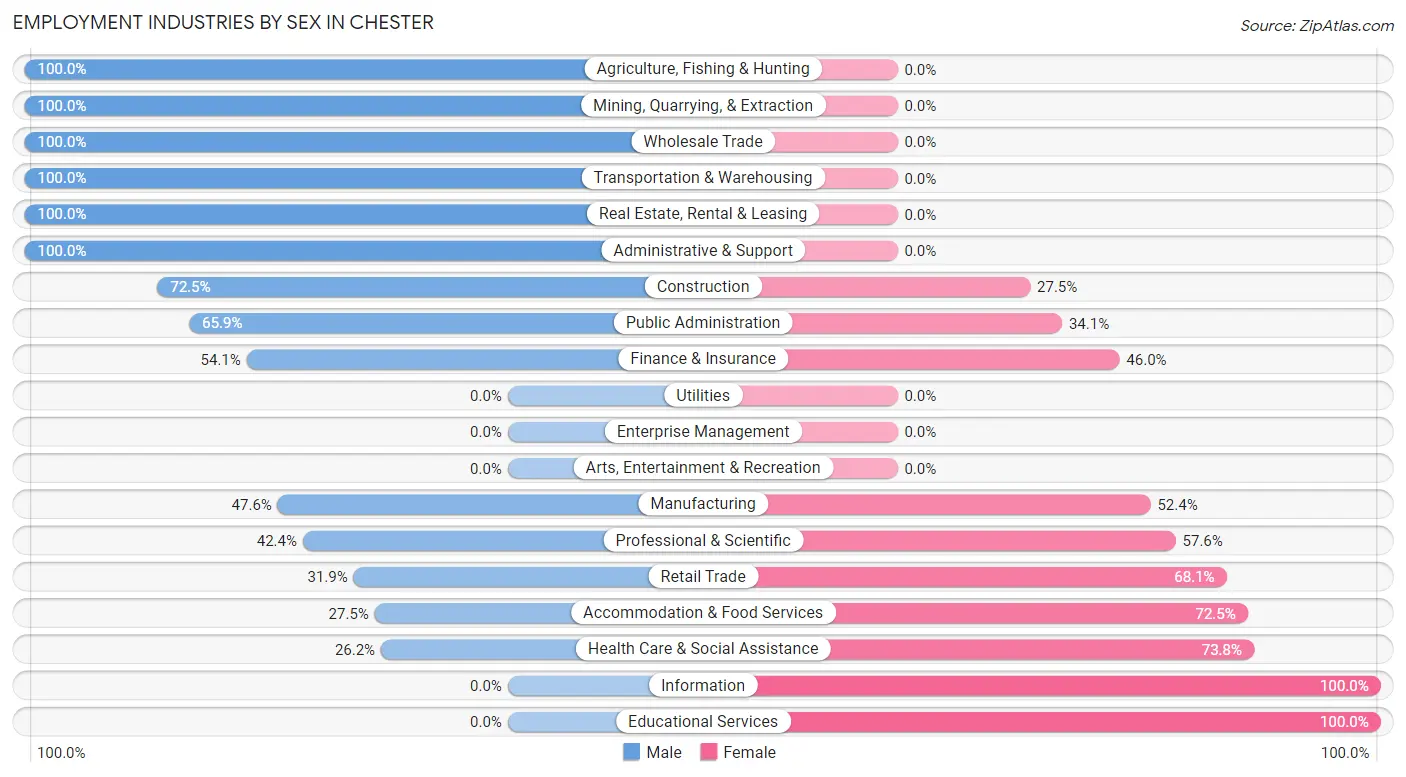
Employment Industries by Sex in Chester
The Chester industries that see more men than women are Agriculture, Fishing & Hunting (100.0%), Mining, Quarrying, & Extraction (100.0%), and Wholesale Trade (100.0%), whereas the industries that tend to have a higher number of women are Information (100.0%), Educational Services (100.0%), and Health Care & Social Assistance (73.8%).
| Industry | Male | Female |
| Agriculture, Fishing & Hunting | 6 (100.0%) | 0 (0.0%) |
| Mining, Quarrying, & Extraction | 57 (100.0%) | 0 (0.0%) |
| Construction | 66 (72.5%) | 25 (27.5%) |
| Manufacturing | 180 (47.6%) | 198 (52.4%) |
| Wholesale Trade | 8 (100.0%) | 0 (0.0%) |
| Retail Trade | 45 (31.9%) | 96 (68.1%) |
| Transportation & Warehousing | 130 (100.0%) | 0 (0.0%) |
| Utilities | 0 (0.0%) | 0 (0.0%) |
| Information | 0 (0.0%) | 7 (100.0%) |
| Finance & Insurance | 20 (54.0%) | 17 (46.0%) |
| Real Estate, Rental & Leasing | 23 (100.0%) | 0 (0.0%) |
| Professional & Scientific | 14 (42.4%) | 19 (57.6%) |
| Enterprise Management | 0 (0.0%) | 0 (0.0%) |
| Administrative & Support | 53 (100.0%) | 0 (0.0%) |
| Educational Services | 0 (0.0%) | 79 (100.0%) |
| Health Care & Social Assistance | 116 (26.2%) | 326 (73.8%) |
| Arts, Entertainment & Recreation | 0 (0.0%) | 0 (0.0%) |
| Accommodation & Food Services | 46 (27.5%) | 121 (72.5%) |
| Public Administration | 271 (65.9%) | 140 (34.1%) |
| Total | 1,042 (49.8%) | 1,049 (50.2%) |
Education in Chester
School Enrollment in Chester
The most common levels of schooling among the 749 students in Chester are college / undergraduate (216 | 28.8%), high school (200 | 26.7%), and middle school (151 | 20.2%).
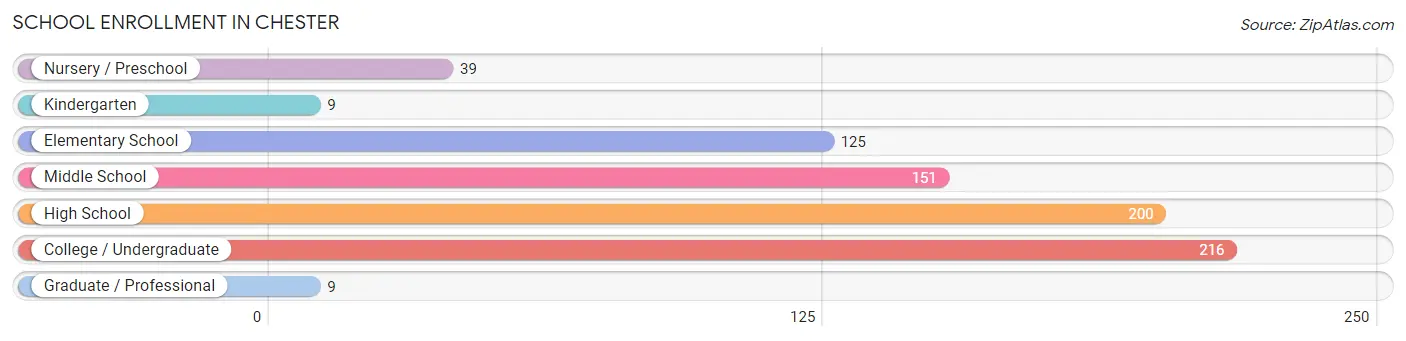
| School Level | # Students | % Students |
| Nursery / Preschool | 39 | 5.2% |
| Kindergarten | 9 | 1.2% |
| Elementary School | 125 | 16.7% |
| Middle School | 151 | 20.2% |
| High School | 200 | 26.7% |
| College / Undergraduate | 216 | 28.8% |
| Graduate / Professional | 9 | 1.2% |
| Total | 749 | 100.0% |
School Enrollment by Age by Funding Source in Chester
Out of a total of 749 students who are enrolled in schools in Chester, 203 (27.1%) attend a private institution, while the remaining 546 (72.9%) are enrolled in public schools. The age group of 35 years and over has the highest likelihood of being enrolled in private schools, with 46 (93.9% in the age bracket) enrolled. Conversely, the age group of 18 to 19 year olds has the lowest likelihood of being enrolled in a private school, with 70 (100.0% in the age bracket) attending a public institution.
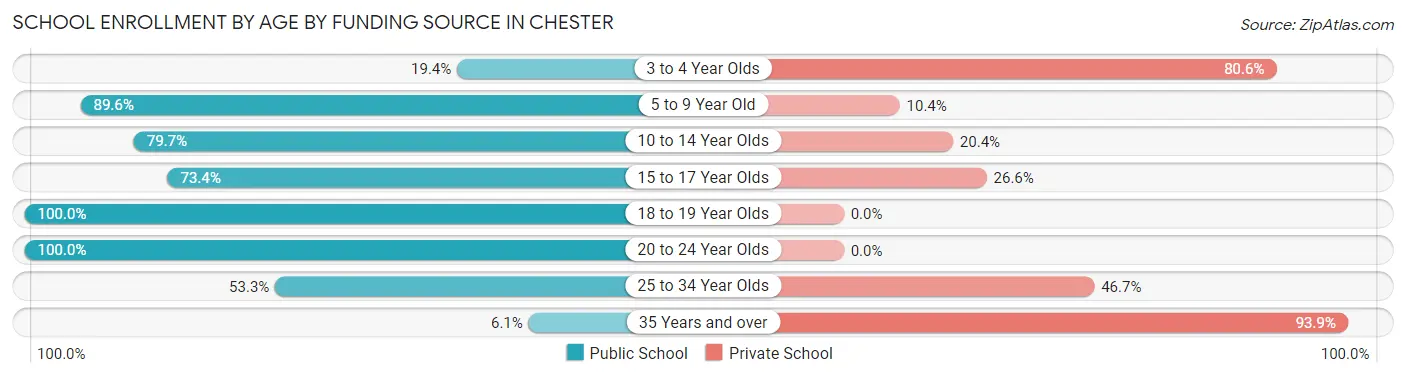
| Age Bracket | Public School | Private School |
| 3 to 4 Year Olds | 7 (19.4%) | 29 (80.6%) |
| 5 to 9 Year Old | 86 (89.6%) | 10 (10.4%) |
| 10 to 14 Year Olds | 180 (79.6%) | 46 (20.3%) |
| 15 to 17 Year Olds | 102 (73.4%) | 37 (26.6%) |
| 18 to 19 Year Olds | 70 (100.0%) | 0 (0.0%) |
| 20 to 24 Year Olds | 58 (100.0%) | 0 (0.0%) |
| 25 to 34 Year Olds | 40 (53.3%) | 35 (46.7%) |
| 35 Years and over | 3 (6.1%) | 46 (93.9%) |
| Total | 546 (72.9%) | 203 (27.1%) |
Educational Attainment by Field of Study in Chester
Science & technology (116 | 24.6%), business (103 | 21.8%), education (76 | 16.1%), arts & humanities (46 | 9.8%), and engineering (37 | 7.8%) are the most common fields of study among 472 individuals in Chester who have obtained a bachelor's degree or higher.
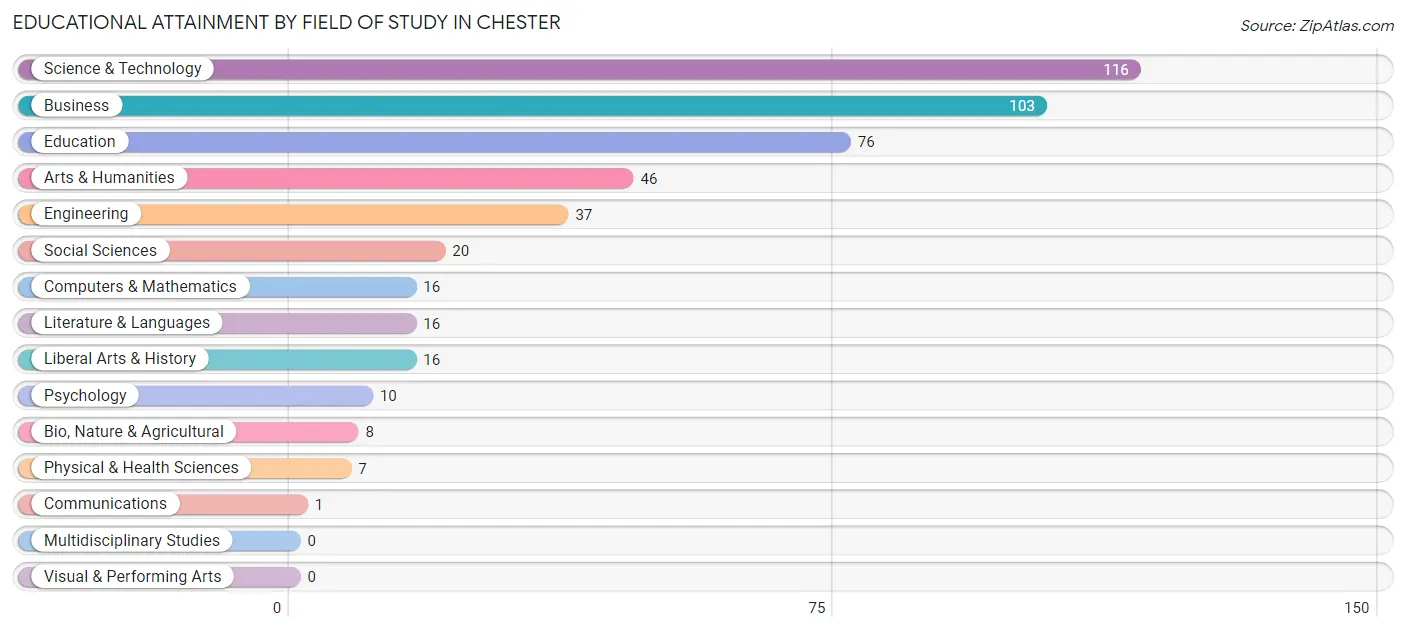
| Field of Study | # Graduates | % Graduates |
| Computers & Mathematics | 16 | 3.4% |
| Bio, Nature & Agricultural | 8 | 1.7% |
| Physical & Health Sciences | 7 | 1.5% |
| Psychology | 10 | 2.1% |
| Social Sciences | 20 | 4.2% |
| Engineering | 37 | 7.8% |
| Multidisciplinary Studies | 0 | 0.0% |
| Science & Technology | 116 | 24.6% |
| Business | 103 | 21.8% |
| Education | 76 | 16.1% |
| Literature & Languages | 16 | 3.4% |
| Liberal Arts & History | 16 | 3.4% |
| Visual & Performing Arts | 0 | 0.0% |
| Communications | 1 | 0.2% |
| Arts & Humanities | 46 | 9.8% |
| Total | 472 | 100.0% |
Transportation & Commute in Chester
Vehicle Availability by Sex in Chester
The most prevalent vehicle ownership categories in Chester are males with 3 vehicles (366, accounting for 35.1%) and females with 3 vehicles (302, making up 36.9%).
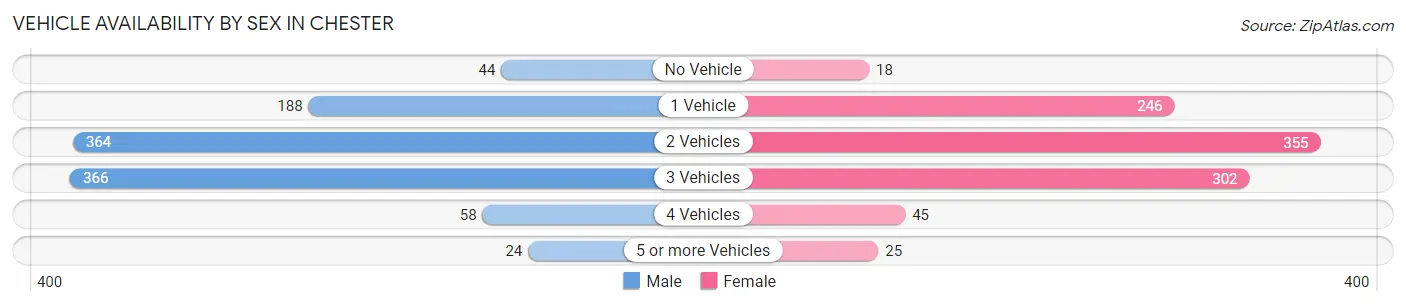
| Vehicles Available | Male | Female |
| No Vehicle | 44 (4.2%) | 18 (1.8%) |
| 1 Vehicle | 188 (18.0%) | 246 (24.8%) |
| 2 Vehicles | 364 (34.9%) | 355 (35.8%) |
| 3 Vehicles | 366 (35.1%) | 302 (30.5%) |
| 4 Vehicles | 58 (5.6%) | 45 (4.5%) |
| 5 or more Vehicles | 24 (2.3%) | 25 (2.5%) |
| Total | 1,044 (100.0%) | 991 (100.0%) |
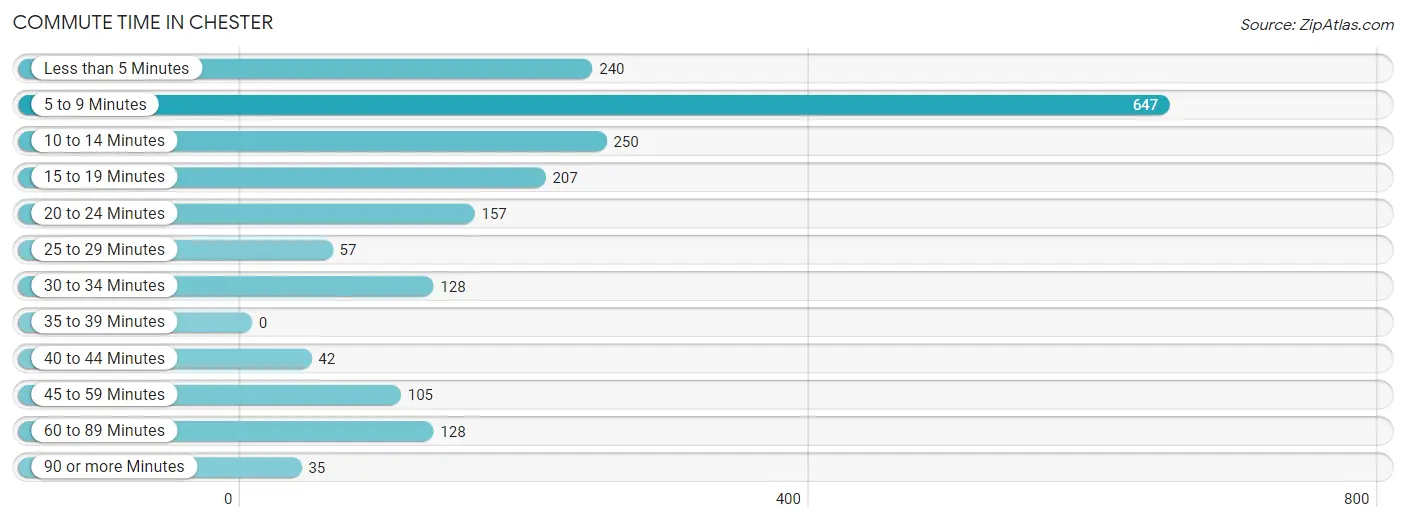
Commute Time in Chester
The most frequently occuring commute durations in Chester are 5 to 9 minutes (647 commuters, 32.4%), 10 to 14 minutes (250 commuters, 12.5%), and less than 5 minutes (240 commuters, 12.0%).
| Commute Time | # Commuters | % Commuters |
| Less than 5 Minutes | 240 | 12.0% |
| 5 to 9 Minutes | 647 | 32.4% |
| 10 to 14 Minutes | 250 | 12.5% |
| 15 to 19 Minutes | 207 | 10.4% |
| 20 to 24 Minutes | 157 | 7.9% |
| 25 to 29 Minutes | 57 | 2.9% |
| 30 to 34 Minutes | 128 | 6.4% |
| 35 to 39 Minutes | 0 | 0.0% |
| 40 to 44 Minutes | 42 | 2.1% |
| 45 to 59 Minutes | 105 | 5.3% |
| 60 to 89 Minutes | 128 | 6.4% |
| 90 or more Minutes | 35 | 1.8% |
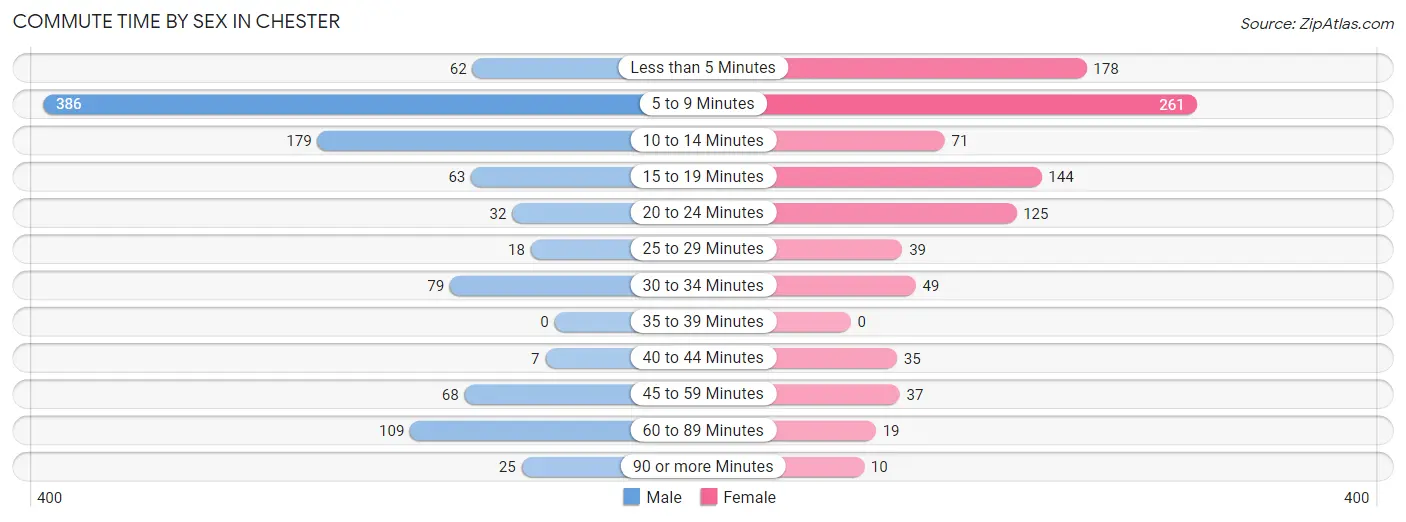
Commute Time by Sex in Chester
The most common commute times in Chester are 5 to 9 minutes (386 commuters, 37.6%) for males and 5 to 9 minutes (261 commuters, 27.0%) for females.
| Commute Time | Male | Female |
| Less than 5 Minutes | 62 (6.0%) | 178 (18.4%) |
| 5 to 9 Minutes | 386 (37.6%) | 261 (27.0%) |
| 10 to 14 Minutes | 179 (17.4%) | 71 (7.3%) |
| 15 to 19 Minutes | 63 (6.1%) | 144 (14.9%) |
| 20 to 24 Minutes | 32 (3.1%) | 125 (12.9%) |
| 25 to 29 Minutes | 18 (1.8%) | 39 (4.0%) |
| 30 to 34 Minutes | 79 (7.7%) | 49 (5.1%) |
| 35 to 39 Minutes | 0 (0.0%) | 0 (0.0%) |
| 40 to 44 Minutes | 7 (0.7%) | 35 (3.6%) |
| 45 to 59 Minutes | 68 (6.6%) | 37 (3.8%) |
| 60 to 89 Minutes | 109 (10.6%) | 19 (2.0%) |
| 90 or more Minutes | 25 (2.4%) | 10 (1.0%) |
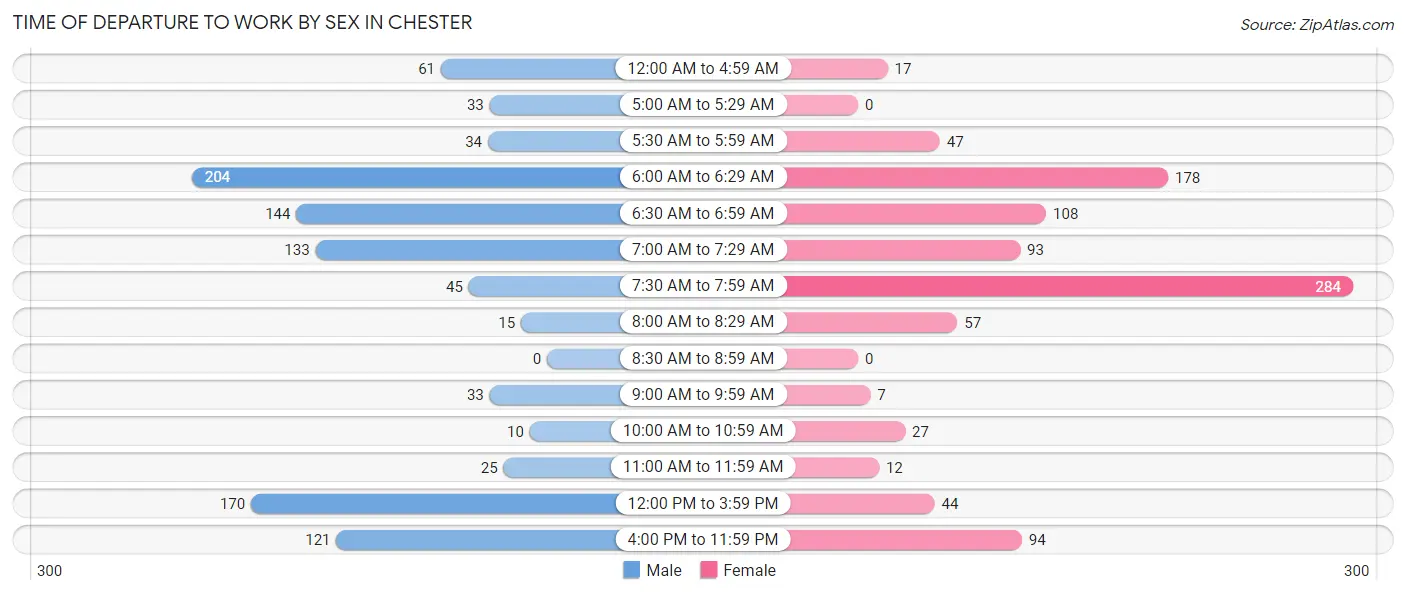
Time of Departure to Work by Sex in Chester
The most frequent times of departure to work in Chester are 6:00 AM to 6:29 AM (204, 19.8%) for males and 7:30 AM to 7:59 AM (284, 29.3%) for females.
| Time of Departure | Male | Female |
| 12:00 AM to 4:59 AM | 61 (5.9%) | 17 (1.8%) |
| 5:00 AM to 5:29 AM | 33 (3.2%) | 0 (0.0%) |
| 5:30 AM to 5:59 AM | 34 (3.3%) | 47 (4.9%) |
| 6:00 AM to 6:29 AM | 204 (19.8%) | 178 (18.4%) |
| 6:30 AM to 6:59 AM | 144 (14.0%) | 108 (11.2%) |
| 7:00 AM to 7:29 AM | 133 (12.9%) | 93 (9.6%) |
| 7:30 AM to 7:59 AM | 45 (4.4%) | 284 (29.3%) |
| 8:00 AM to 8:29 AM | 15 (1.5%) | 57 (5.9%) |
| 8:30 AM to 8:59 AM | 0 (0.0%) | 0 (0.0%) |
| 9:00 AM to 9:59 AM | 33 (3.2%) | 7 (0.7%) |
| 10:00 AM to 10:59 AM | 10 (1.0%) | 27 (2.8%) |
| 11:00 AM to 11:59 AM | 25 (2.4%) | 12 (1.2%) |
| 12:00 PM to 3:59 PM | 170 (16.5%) | 44 (4.5%) |
| 4:00 PM to 11:59 PM | 121 (11.8%) | 94 (9.7%) |
| Total | 1,028 (100.0%) | 968 (100.0%) |
Housing Occupancy in Chester
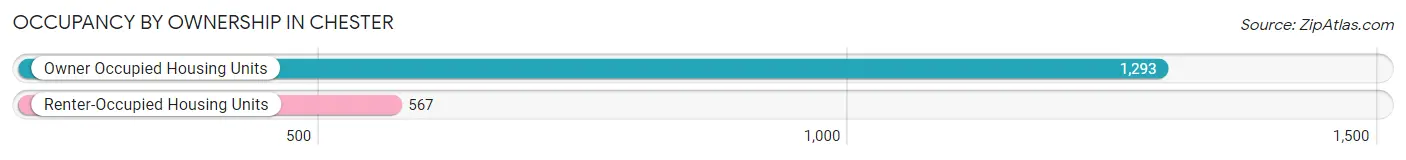
Occupancy by Ownership in Chester
Of the total 1,860 dwellings in Chester, owner-occupied units account for 1,293 (69.5%), while renter-occupied units make up 567 (30.5%).
| Occupancy | # Housing Units | % Housing Units |
| Owner Occupied Housing Units | 1,293 | 69.5% |
| Renter-Occupied Housing Units | 567 | 30.5% |
| Total Occupied Housing Units | 1,860 | 100.0% |
Occupancy by Household Size in Chester
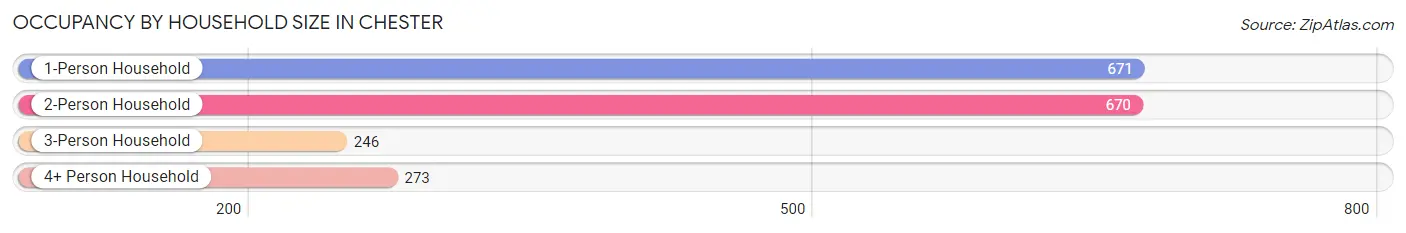
| Household Size | # Housing Units | % Housing Units |
| 1-Person Household | 671 | 36.1% |
| 2-Person Household | 670 | 36.0% |
| 3-Person Household | 246 | 13.2% |
| 4+ Person Household | 273 | 14.7% |
| Total Housing Units | 1,860 | 100.0% |
Occupancy by Ownership by Household Size in Chester
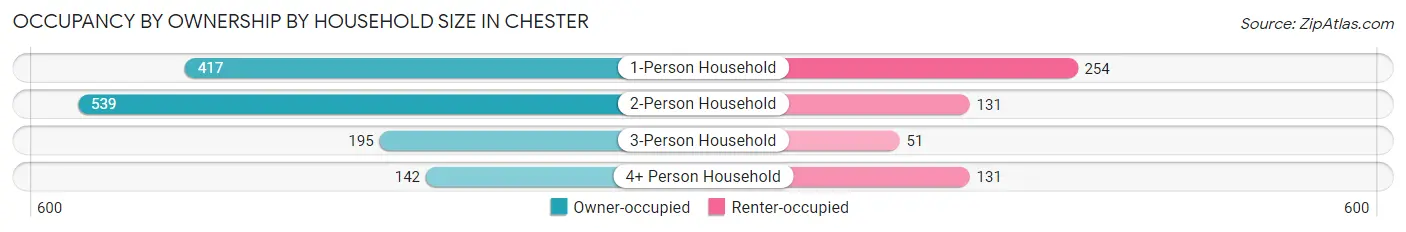
| Household Size | Owner-occupied | Renter-occupied |
| 1-Person Household | 417 (62.2%) | 254 (37.9%) |
| 2-Person Household | 539 (80.4%) | 131 (19.6%) |
| 3-Person Household | 195 (79.3%) | 51 (20.7%) |
| 4+ Person Household | 142 (52.0%) | 131 (48.0%) |
| Total Housing Units | 1,293 (69.5%) | 567 (30.5%) |
Occupancy by Educational Attainment in Chester
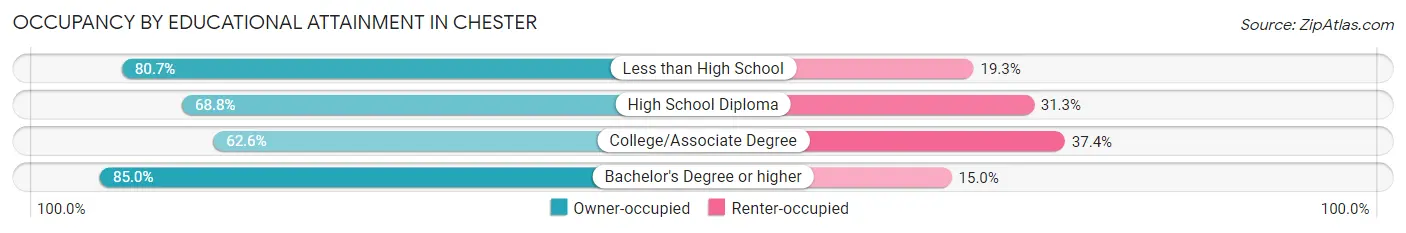
| Household Size | Owner-occupied | Renter-occupied |
| Less than High School | 92 (80.7%) | 22 (19.3%) |
| High School Diploma | 572 (68.8%) | 260 (31.2%) |
| College/Associate Degree | 413 (62.6%) | 247 (37.4%) |
| Bachelor's Degree or higher | 216 (85.0%) | 38 (15.0%) |
Occupancy by Age of Householder in Chester
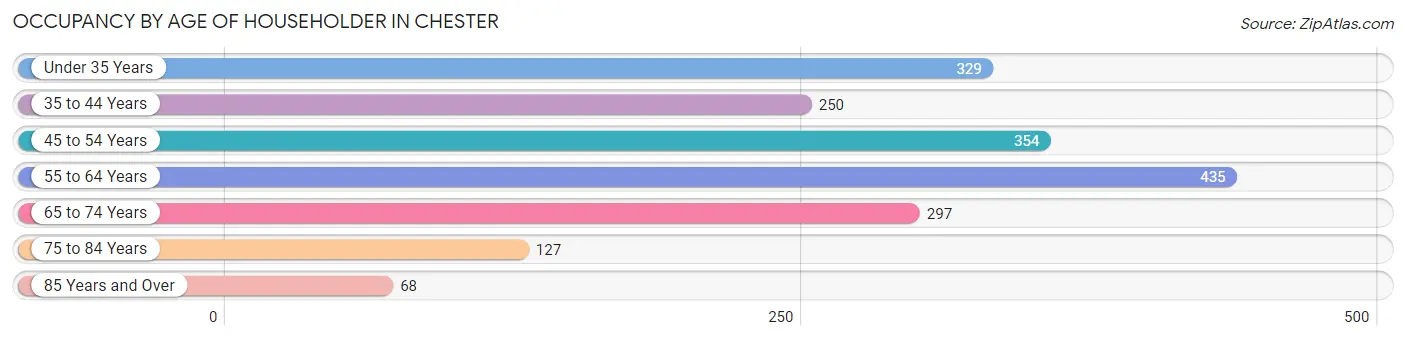
| Age Bracket | # Households | % Households |
| Under 35 Years | 329 | 17.7% |
| 35 to 44 Years | 250 | 13.4% |
| 45 to 54 Years | 354 | 19.0% |
| 55 to 64 Years | 435 | 23.4% |
| 65 to 74 Years | 297 | 16.0% |
| 75 to 84 Years | 127 | 6.8% |
| 85 Years and Over | 68 | 3.7% |
| Total | 1,860 | 100.0% |
Housing Finances in Chester
Median Income by Occupancy in Chester
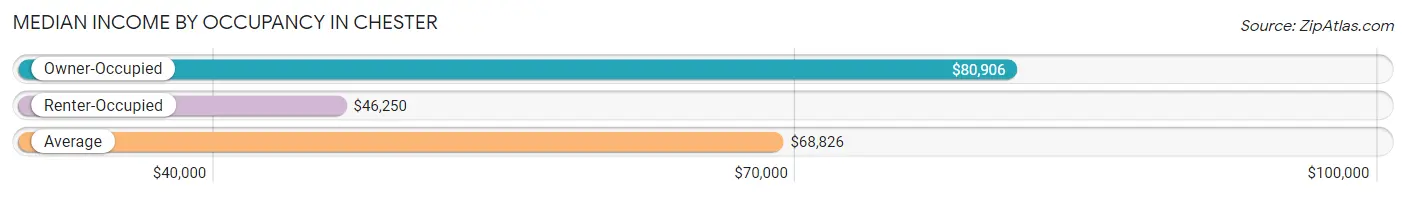
| Occupancy Type | # Households | Median Income |
| Owner-Occupied | 1,293 (69.5%) | $80,906 |
| Renter-Occupied | 567 (30.5%) | $46,250 |
| Average | 1,860 (100.0%) | $68,826 |
Occupancy by Householder Income Bracket in Chester
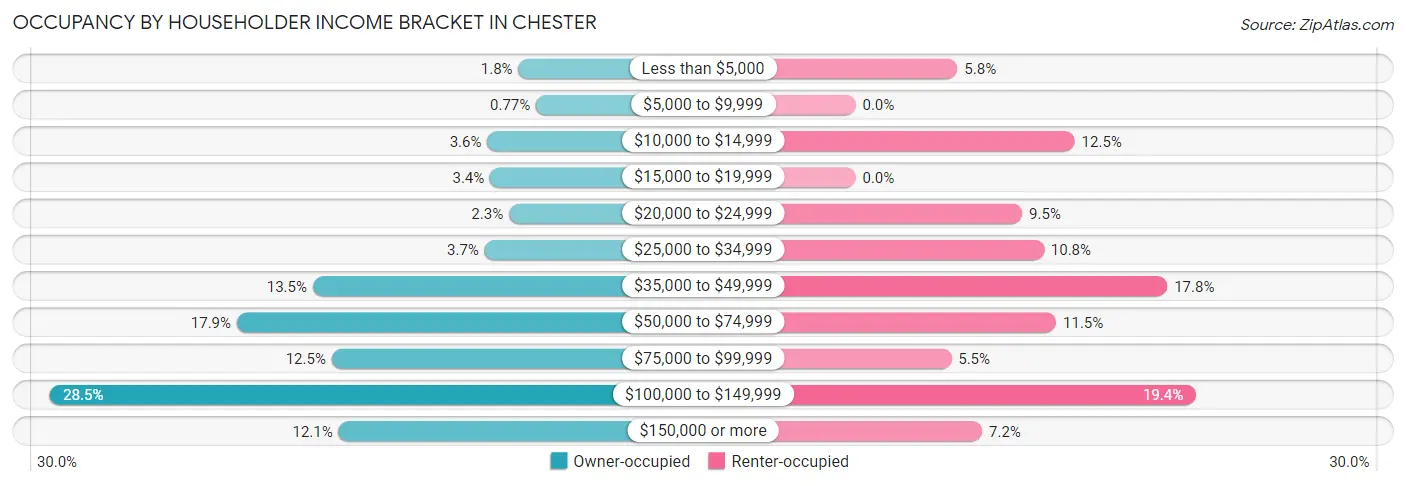
| Income Bracket | Owner-occupied | Renter-occupied |
| Less than $5,000 | 23 (1.8%) | 33 (5.8%) |
| $5,000 to $9,999 | 10 (0.8%) | 0 (0.0%) |
| $10,000 to $14,999 | 46 (3.6%) | 71 (12.5%) |
| $15,000 to $19,999 | 44 (3.4%) | 0 (0.0%) |
| $20,000 to $24,999 | 30 (2.3%) | 54 (9.5%) |
| $25,000 to $34,999 | 48 (3.7%) | 61 (10.8%) |
| $35,000 to $49,999 | 175 (13.5%) | 101 (17.8%) |
| $50,000 to $74,999 | 231 (17.9%) | 65 (11.5%) |
| $75,000 to $99,999 | 161 (12.4%) | 31 (5.5%) |
| $100,000 to $149,999 | 369 (28.5%) | 110 (19.4%) |
| $150,000 or more | 156 (12.1%) | 41 (7.2%) |
| Total | 1,293 (100.0%) | 567 (100.0%) |
Monthly Housing Cost Tiers in Chester
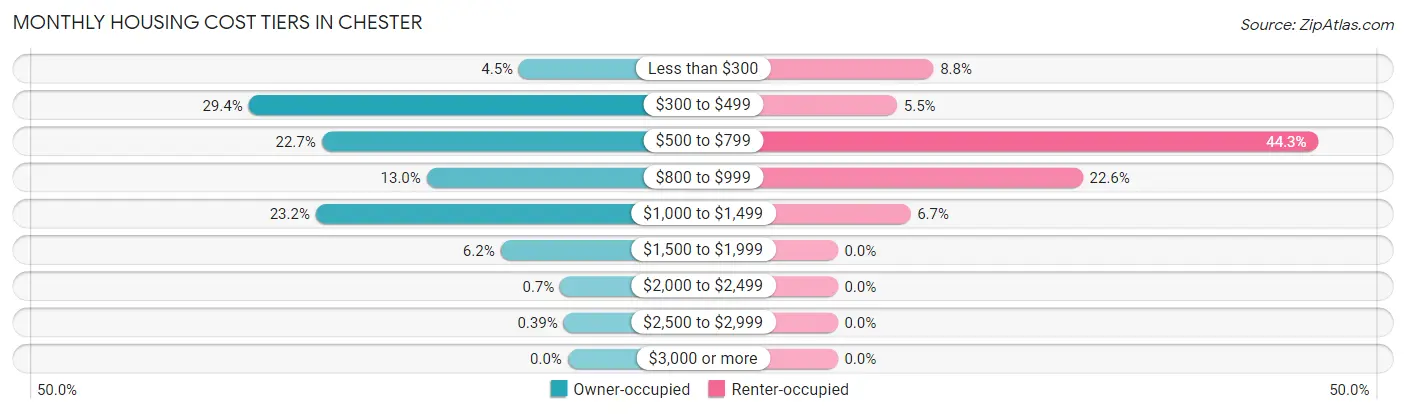
| Monthly Cost | Owner-occupied | Renter-occupied |
| Less than $300 | 58 (4.5%) | 50 (8.8%) |
| $300 to $499 | 380 (29.4%) | 31 (5.5%) |
| $500 to $799 | 293 (22.7%) | 251 (44.3%) |
| $800 to $999 | 168 (13.0%) | 128 (22.6%) |
| $1,000 to $1,499 | 300 (23.2%) | 38 (6.7%) |
| $1,500 to $1,999 | 80 (6.2%) | 0 (0.0%) |
| $2,000 to $2,499 | 9 (0.7%) | 0 (0.0%) |
| $2,500 to $2,999 | 5 (0.4%) | 0 (0.0%) |
| $3,000 or more | 0 (0.0%) | 0 (0.0%) |
| Total | 1,293 (100.0%) | 567 (100.0%) |
Physical Housing Characteristics in Chester
Housing Structures in Chester
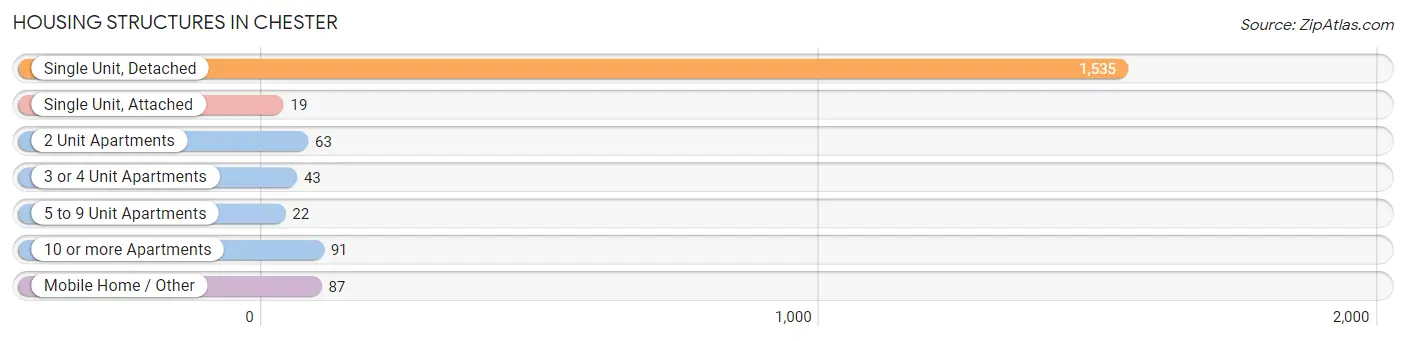
| Structure Type | # Housing Units | % Housing Units |
| Single Unit, Detached | 1,535 | 82.5% |
| Single Unit, Attached | 19 | 1.0% |
| 2 Unit Apartments | 63 | 3.4% |
| 3 or 4 Unit Apartments | 43 | 2.3% |
| 5 to 9 Unit Apartments | 22 | 1.2% |
| 10 or more Apartments | 91 | 4.9% |
| Mobile Home / Other | 87 | 4.7% |
| Total | 1,860 | 100.0% |
Housing Structures by Occupancy in Chester
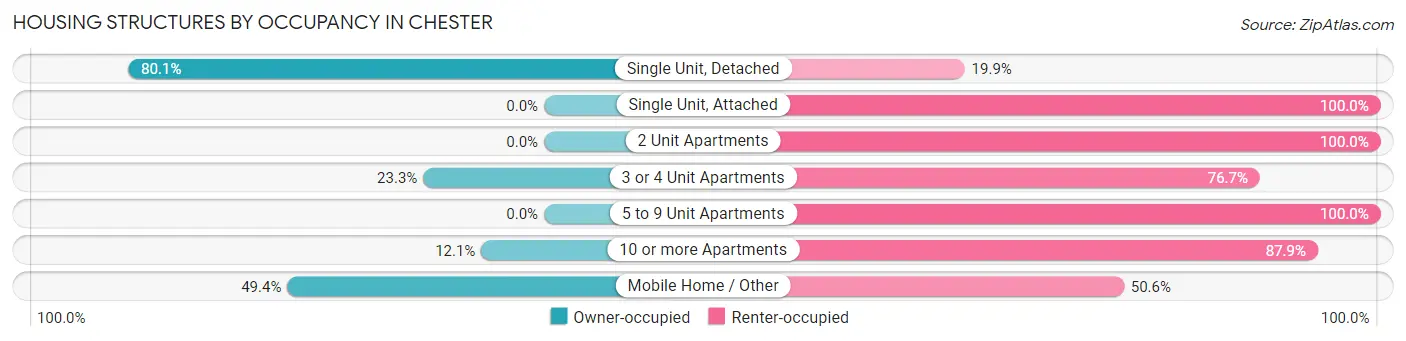
| Structure Type | Owner-occupied | Renter-occupied |
| Single Unit, Detached | 1,229 (80.1%) | 306 (19.9%) |
| Single Unit, Attached | 0 (0.0%) | 19 (100.0%) |
| 2 Unit Apartments | 0 (0.0%) | 63 (100.0%) |
| 3 or 4 Unit Apartments | 10 (23.3%) | 33 (76.7%) |
| 5 to 9 Unit Apartments | 0 (0.0%) | 22 (100.0%) |
| 10 or more Apartments | 11 (12.1%) | 80 (87.9%) |
| Mobile Home / Other | 43 (49.4%) | 44 (50.6%) |
| Total | 1,293 (69.5%) | 567 (30.5%) |
Housing Structures by Number of Rooms in Chester
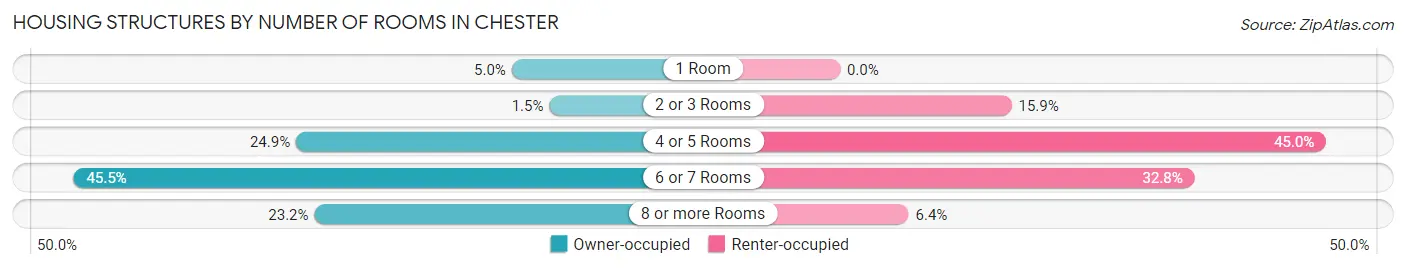
| Number of Rooms | Owner-occupied | Renter-occupied |
| 1 Room | 64 (5.0%) | 0 (0.0%) |
| 2 or 3 Rooms | 19 (1.5%) | 90 (15.9%) |
| 4 or 5 Rooms | 322 (24.9%) | 255 (45.0%) |
| 6 or 7 Rooms | 588 (45.5%) | 186 (32.8%) |
| 8 or more Rooms | 300 (23.2%) | 36 (6.4%) |
| Total | 1,293 (100.0%) | 567 (100.0%) |
Housing Structure by Heating Type in Chester
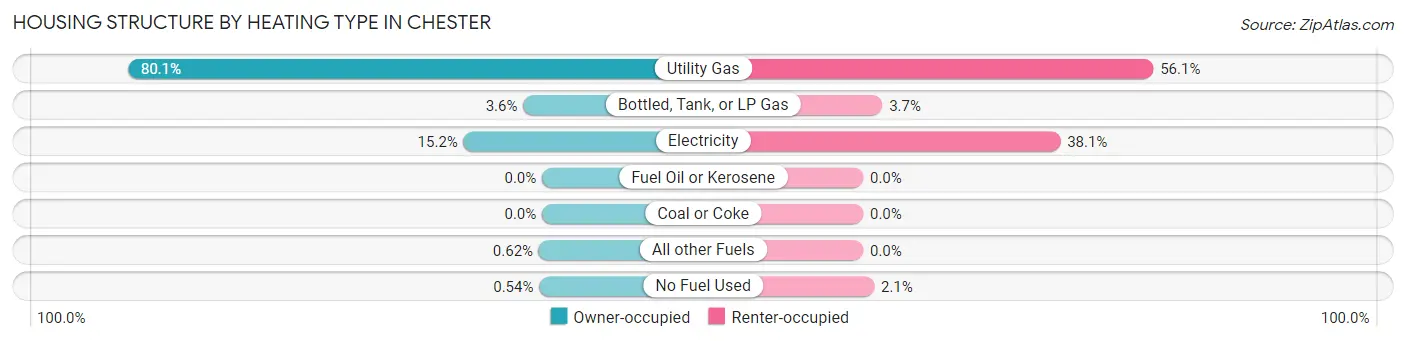
| Heating Type | Owner-occupied | Renter-occupied |
| Utility Gas | 1,035 (80.0%) | 318 (56.1%) |
| Bottled, Tank, or LP Gas | 47 (3.6%) | 21 (3.7%) |
| Electricity | 196 (15.2%) | 216 (38.1%) |
| Fuel Oil or Kerosene | 0 (0.0%) | 0 (0.0%) |
| Coal or Coke | 0 (0.0%) | 0 (0.0%) |
| All other Fuels | 8 (0.6%) | 0 (0.0%) |
| No Fuel Used | 7 (0.5%) | 12 (2.1%) |
| Total | 1,293 (100.0%) | 567 (100.0%) |
Household Vehicle Usage in Chester
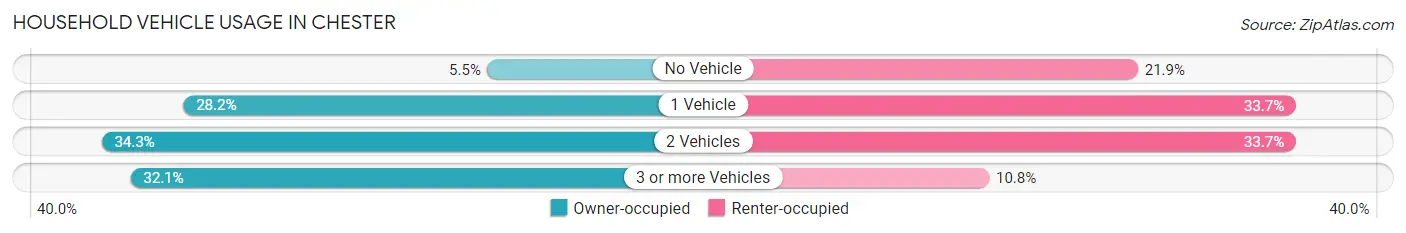
| Vehicles per Household | Owner-occupied | Renter-occupied |
| No Vehicle | 71 (5.5%) | 124 (21.9%) |
| 1 Vehicle | 364 (28.1%) | 191 (33.7%) |
| 2 Vehicles | 443 (34.3%) | 191 (33.7%) |
| 3 or more Vehicles | 415 (32.1%) | 61 (10.8%) |
| Total | 1,293 (100.0%) | 567 (100.0%) |
Real Estate & Mortgages in Chester
Real Estate and Mortgage Overview in Chester
| Characteristic | Without Mortgage | With Mortgage |
| Housing Units | 670 | 623 |
| Median Property Value | $112,500 | $109,700 |
| Median Household Income | $61,638 | $85 |
| Monthly Housing Costs | $460 | $0 |
| Real Estate Taxes | $1,699 | $0 |
Property Value by Mortgage Status in Chester
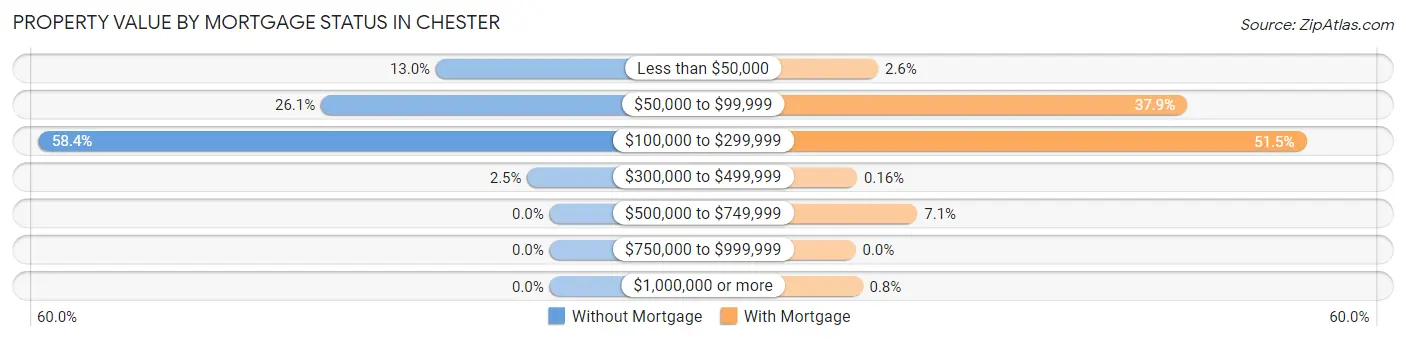
| Property Value | Without Mortgage | With Mortgage |
| Less than $50,000 | 87 (13.0%) | 16 (2.6%) |
| $50,000 to $99,999 | 175 (26.1%) | 236 (37.9%) |
| $100,000 to $299,999 | 391 (58.4%) | 321 (51.5%) |
| $300,000 to $499,999 | 17 (2.5%) | 1 (0.2%) |
| $500,000 to $749,999 | 0 (0.0%) | 44 (7.1%) |
| $750,000 to $999,999 | 0 (0.0%) | 0 (0.0%) |
| $1,000,000 or more | 0 (0.0%) | 5 (0.8%) |
| Total | 670 (100.0%) | 623 (100.0%) |
Household Income by Mortgage Status in Chester
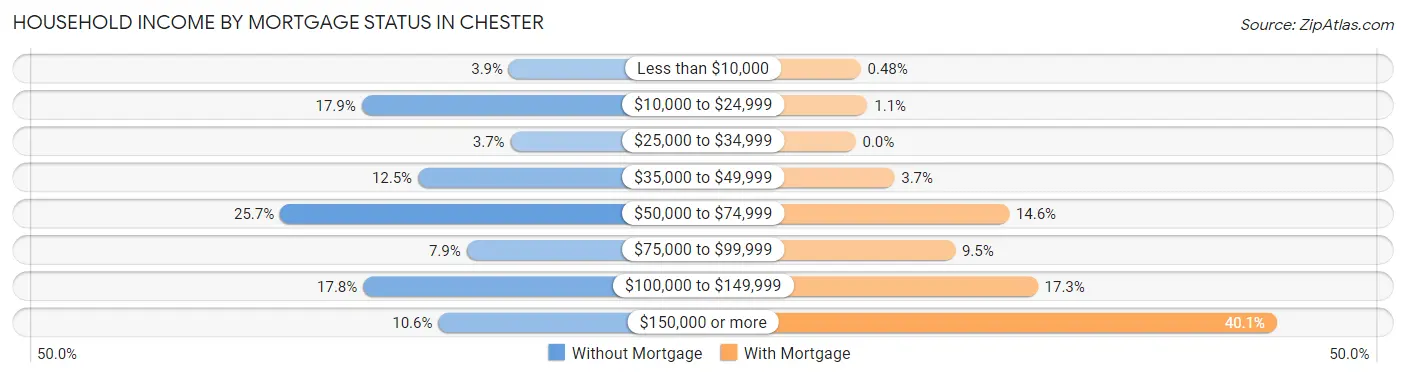
| Household Income | Without Mortgage | With Mortgage |
| Less than $10,000 | 26 (3.9%) | 3 (0.5%) |
| $10,000 to $24,999 | 120 (17.9%) | 7 (1.1%) |
| $25,000 to $34,999 | 25 (3.7%) | 0 (0.0%) |
| $35,000 to $49,999 | 84 (12.5%) | 23 (3.7%) |
| $50,000 to $74,999 | 172 (25.7%) | 91 (14.6%) |
| $75,000 to $99,999 | 53 (7.9%) | 59 (9.5%) |
| $100,000 to $149,999 | 119 (17.8%) | 108 (17.3%) |
| $150,000 or more | 71 (10.6%) | 250 (40.1%) |
| Total | 670 (100.0%) | 623 (100.0%) |
Property Value to Household Income Ratio in Chester
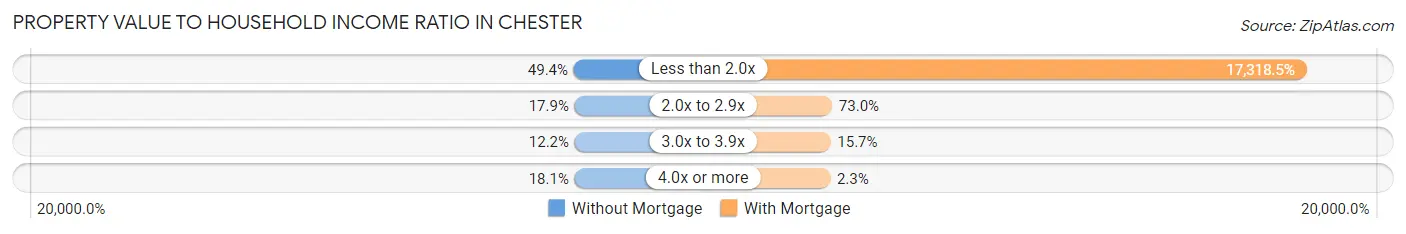
| Value-to-Income Ratio | Without Mortgage | With Mortgage |
| Less than 2.0x | 331 (49.4%) | 107,894 (17,318.5%) |
| 2.0x to 2.9x | 120 (17.9%) | 455 (73.0%) |
| 3.0x to 3.9x | 82 (12.2%) | 98 (15.7%) |
| 4.0x or more | 121 (18.1%) | 14 (2.2%) |
| Total | 670 (100.0%) | 623 (100.0%) |
Real Estate Taxes by Mortgage Status in Chester
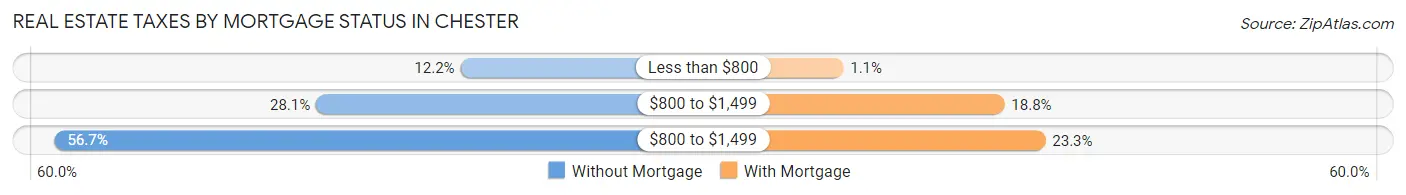
| Property Taxes | Without Mortgage | With Mortgage |
| Less than $800 | 82 (12.2%) | 7 (1.1%) |
| $800 to $1,499 | 188 (28.1%) | 117 (18.8%) |
| $800 to $1,499 | 380 (56.7%) | 145 (23.3%) |
| Total | 670 (100.0%) | 623 (100.0%) |
Health & Disability in Chester
Health Insurance Coverage by Age in Chester
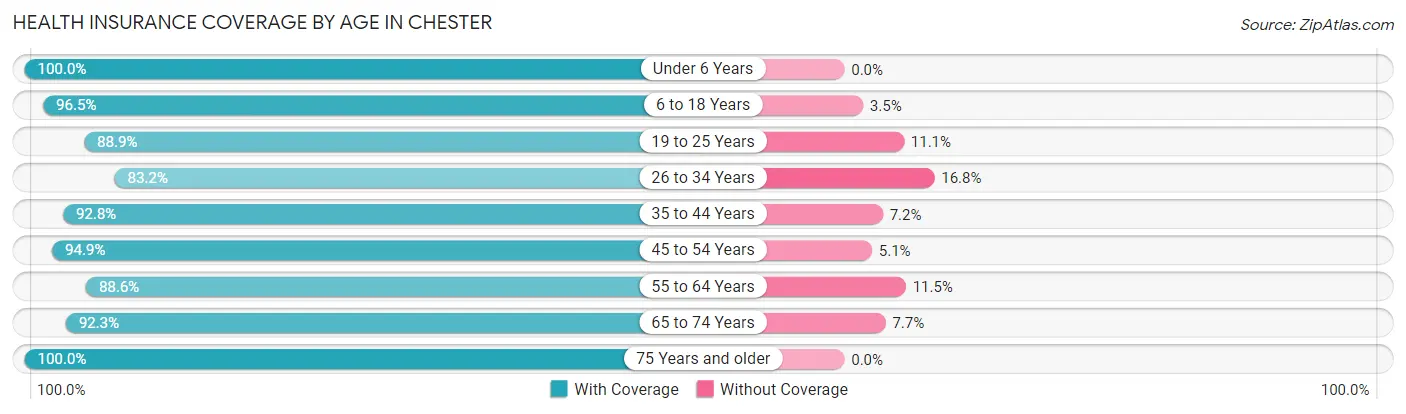
| Age Bracket | With Coverage | Without Coverage |
| Under 6 Years | 178 (100.0%) | 0 (0.0%) |
| 6 to 18 Years | 528 (96.5%) | 19 (3.5%) |
| 19 to 25 Years | 232 (88.9%) | 29 (11.1%) |
| 26 to 34 Years | 496 (83.2%) | 100 (16.8%) |
| 35 to 44 Years | 428 (92.8%) | 33 (7.2%) |
| 45 to 54 Years | 591 (94.9%) | 32 (5.1%) |
| 55 to 64 Years | 696 (88.5%) | 90 (11.5%) |
| 65 to 74 Years | 433 (92.3%) | 36 (7.7%) |
| 75 Years and older | 275 (100.0%) | 0 (0.0%) |
| Total | 3,857 (91.9%) | 339 (8.1%) |
Health Insurance Coverage by Citizenship Status in Chester
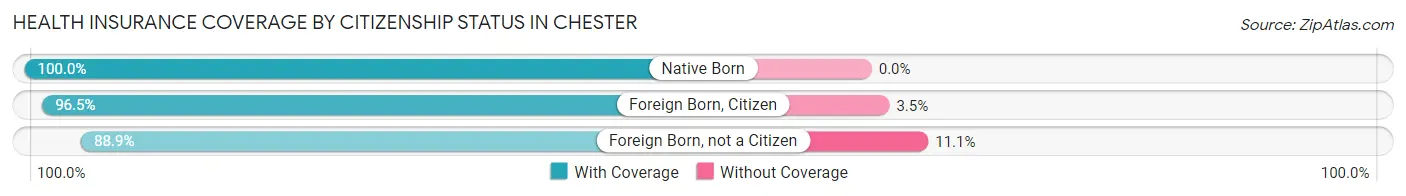
| Citizenship Status | With Coverage | Without Coverage |
| Native Born | 178 (100.0%) | 0 (0.0%) |
| Foreign Born, Citizen | 528 (96.5%) | 19 (3.5%) |
| Foreign Born, not a Citizen | 232 (88.9%) | 29 (11.1%) |
Health Insurance Coverage by Household Income in Chester
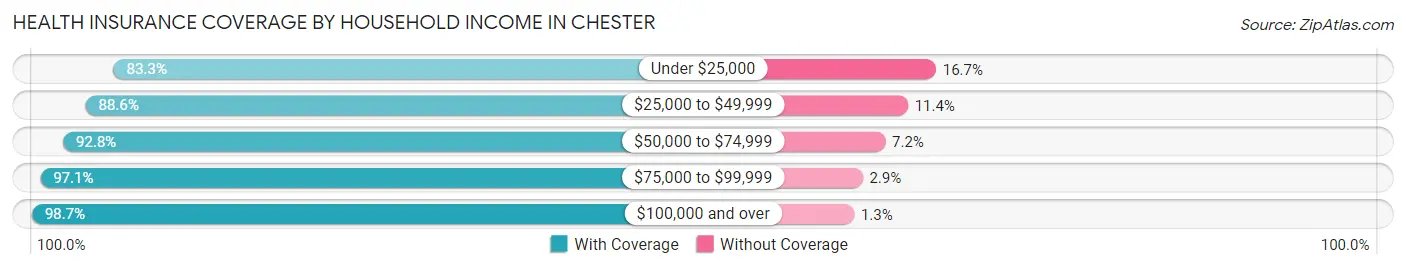
| Household Income | With Coverage | Without Coverage |
| Under $25,000 | 465 (83.3%) | 93 (16.7%) |
| $25,000 to $49,999 | 598 (88.6%) | 77 (11.4%) |
| $50,000 to $74,999 | 543 (92.8%) | 42 (7.2%) |
| $75,000 to $99,999 | 365 (97.1%) | 11 (2.9%) |
| $100,000 and over | 1,771 (98.7%) | 24 (1.3%) |
Public vs Private Health Insurance Coverage by Age in Chester
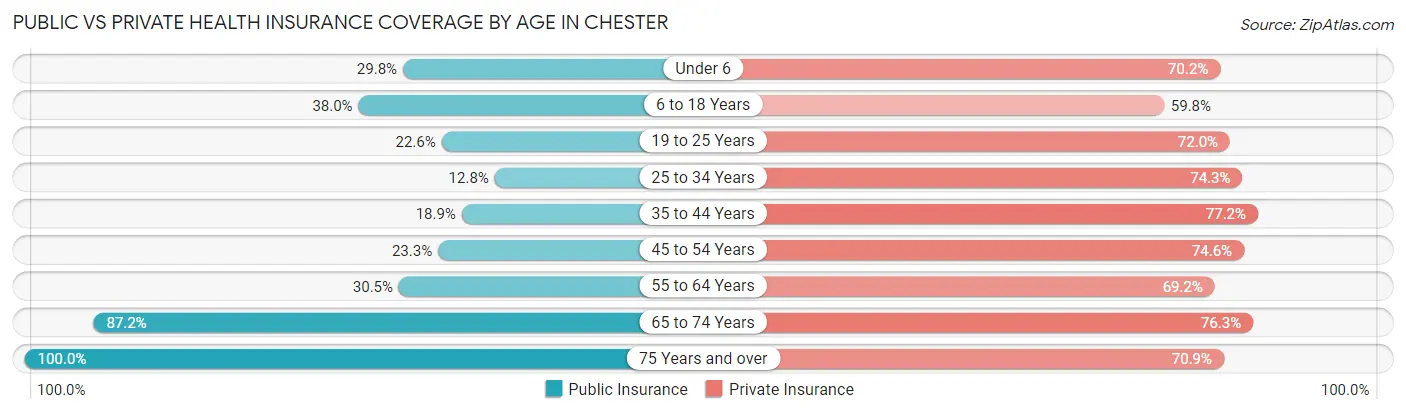
| Age Bracket | Public Insurance | Private Insurance |
| Under 6 | 53 (29.8%) | 125 (70.2%) |
| 6 to 18 Years | 208 (38.0%) | 327 (59.8%) |
| 19 to 25 Years | 59 (22.6%) | 188 (72.0%) |
| 25 to 34 Years | 76 (12.8%) | 443 (74.3%) |
| 35 to 44 Years | 87 (18.9%) | 356 (77.2%) |
| 45 to 54 Years | 145 (23.3%) | 465 (74.6%) |
| 55 to 64 Years | 240 (30.5%) | 544 (69.2%) |
| 65 to 74 Years | 409 (87.2%) | 358 (76.3%) |
| 75 Years and over | 275 (100.0%) | 195 (70.9%) |
| Total | 1,552 (37.0%) | 3,001 (71.5%) |
Disability Status by Sex by Age in Chester
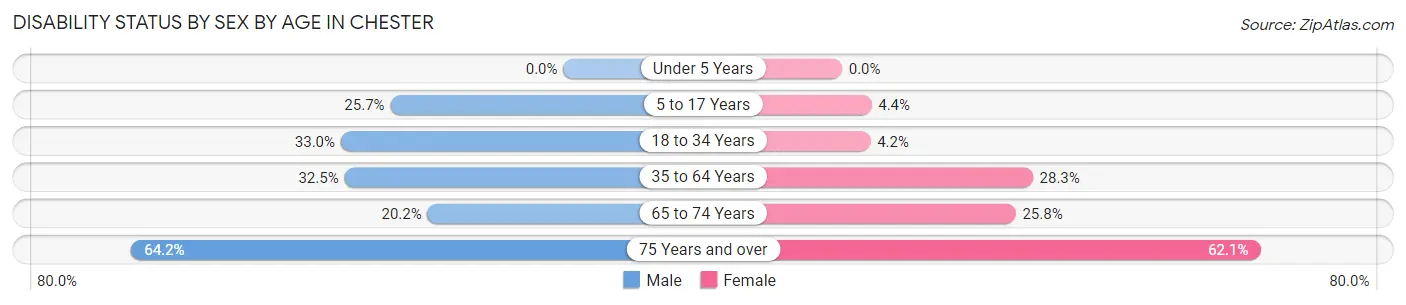
| Age Bracket | Male | Female |
| Under 5 Years | 0 (0.0%) | 0 (0.0%) |
| 5 to 17 Years | 57 (25.7%) | 11 (4.4%) |
| 18 to 34 Years | 188 (33.0%) | 16 (4.2%) |
| 35 to 64 Years | 298 (32.5%) | 270 (28.3%) |
| 65 to 74 Years | 50 (20.2%) | 57 (25.8%) |
| 75 Years and over | 68 (64.1%) | 105 (62.1%) |
Disability Class by Sex by Age in Chester
Disability Class: Hearing Difficulty
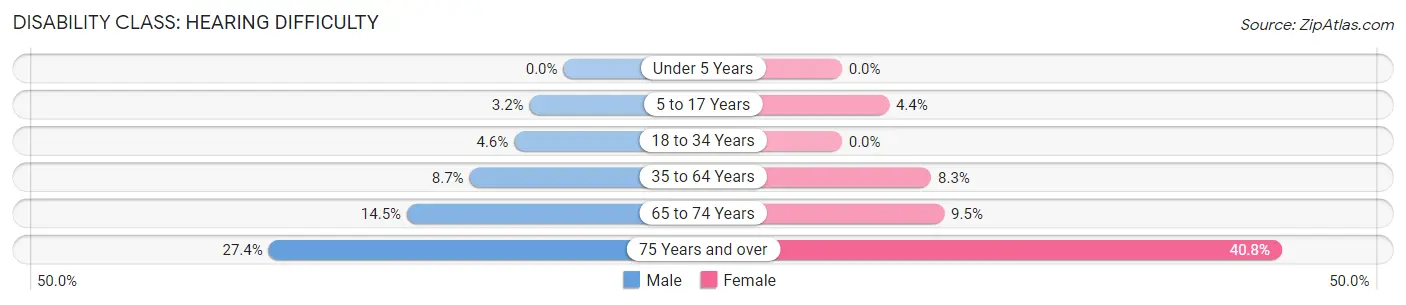
| Age Bracket | Male | Female |
| Under 5 Years | 0 (0.0%) | 0 (0.0%) |
| 5 to 17 Years | 7 (3.2%) | 11 (4.4%) |
| 18 to 34 Years | 26 (4.6%) | 0 (0.0%) |
| 35 to 64 Years | 80 (8.7%) | 79 (8.3%) |
| 65 to 74 Years | 36 (14.5%) | 21 (9.5%) |
| 75 Years and over | 29 (27.4%) | 69 (40.8%) |
Disability Class: Vision Difficulty
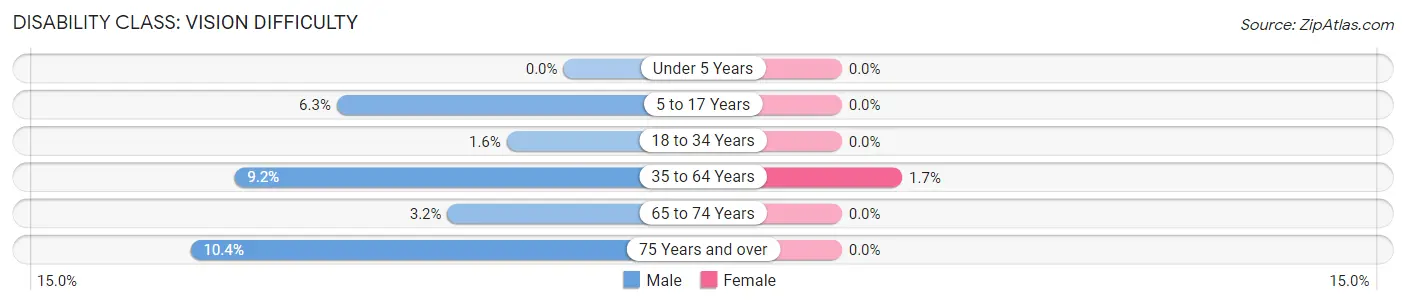
| Age Bracket | Male | Female |
| Under 5 Years | 0 (0.0%) | 0 (0.0%) |
| 5 to 17 Years | 14 (6.3%) | 0 (0.0%) |
| 18 to 34 Years | 9 (1.6%) | 0 (0.0%) |
| 35 to 64 Years | 84 (9.2%) | 16 (1.7%) |
| 65 to 74 Years | 8 (3.2%) | 0 (0.0%) |
| 75 Years and over | 11 (10.4%) | 0 (0.0%) |
Disability Class: Cognitive Difficulty
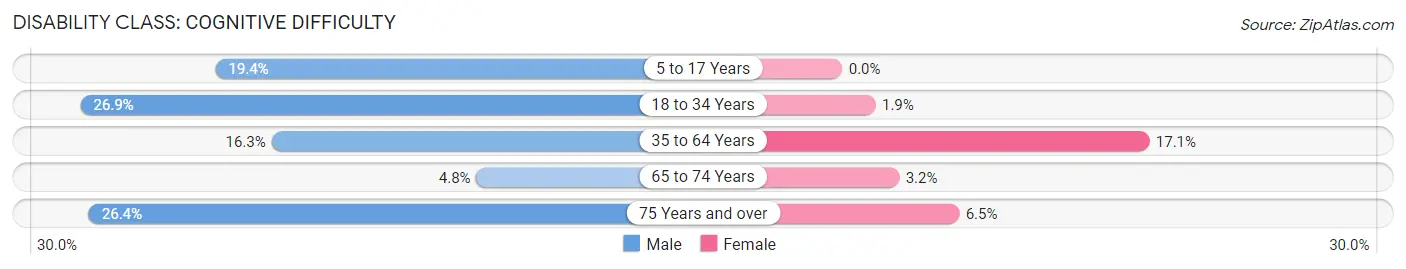
| Age Bracket | Male | Female |
| 5 to 17 Years | 43 (19.4%) | 0 (0.0%) |
| 18 to 34 Years | 153 (26.9%) | 7 (1.8%) |
| 35 to 64 Years | 149 (16.3%) | 163 (17.1%) |
| 65 to 74 Years | 12 (4.8%) | 7 (3.2%) |
| 75 Years and over | 28 (26.4%) | 11 (6.5%) |
Disability Class: Ambulatory Difficulty
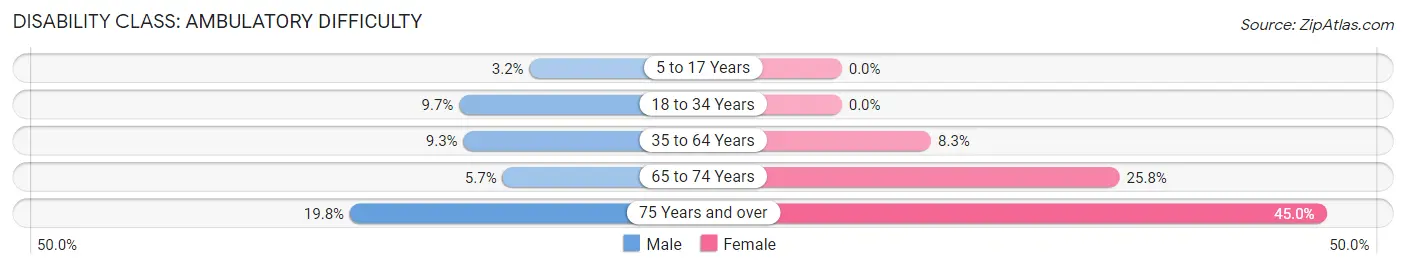
| Age Bracket | Male | Female |
| 5 to 17 Years | 7 (3.2%) | 0 (0.0%) |
| 18 to 34 Years | 55 (9.7%) | 0 (0.0%) |
| 35 to 64 Years | 85 (9.3%) | 79 (8.3%) |
| 65 to 74 Years | 14 (5.7%) | 57 (25.8%) |
| 75 Years and over | 21 (19.8%) | 76 (45.0%) |
Disability Class: Self-Care Difficulty
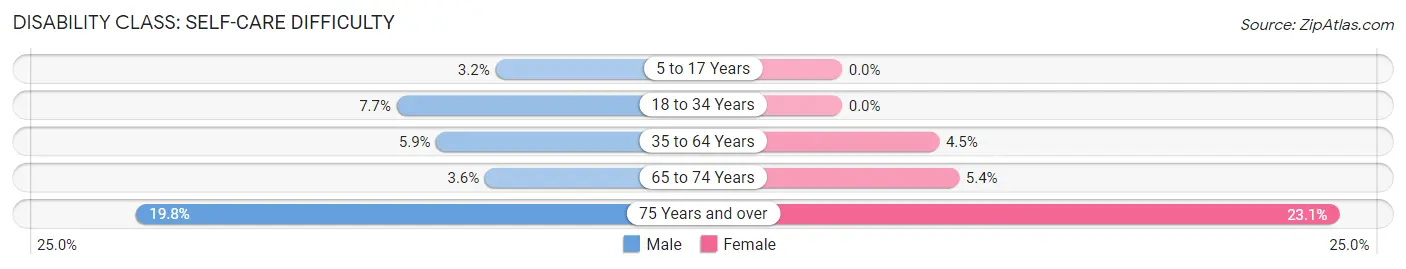
| Age Bracket | Male | Female |
| 5 to 17 Years | 7 (3.2%) | 0 (0.0%) |
| 18 to 34 Years | 44 (7.7%) | 0 (0.0%) |
| 35 to 64 Years | 54 (5.9%) | 43 (4.5%) |
| 65 to 74 Years | 9 (3.6%) | 12 (5.4%) |
| 75 Years and over | 21 (19.8%) | 39 (23.1%) |
Technology Access in Chester
Computing Device Access in Chester
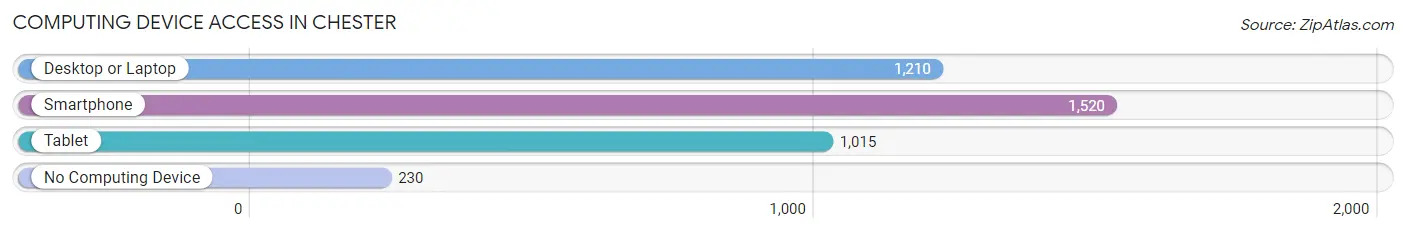
| Device Type | # Households | % Households |
| Desktop or Laptop | 1,210 | 65.0% |
| Smartphone | 1,520 | 81.7% |
| Tablet | 1,015 | 54.6% |
| No Computing Device | 230 | 12.4% |
| Total | 1,860 | 100.0% |
Internet Access in Chester
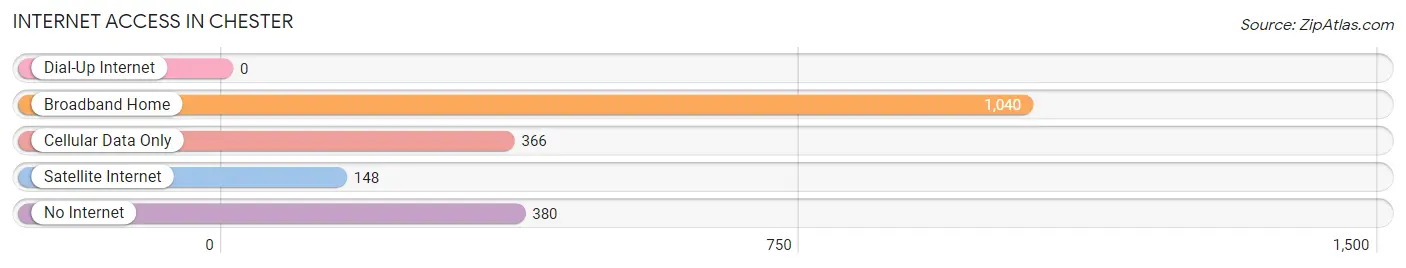
| Internet Type | # Households | % Households |
| Dial-Up Internet | 0 | 0.0% |
| Broadband Home | 1,040 | 55.9% |
| Cellular Data Only | 366 | 19.7% |
| Satellite Internet | 148 | 8.0% |
| No Internet | 380 | 20.4% |
| Total | 1,860 | 100.0% |
Chester Summary
Chester, Illinois is a small city located in Randolph County, Illinois, United States. It is situated along the Mississippi River, approximately 50 miles south of St. Louis, Missouri. The city has a population of 8,621 as of the 2010 census, making it the largest city in Randolph County.
History
Chester was founded in 1819 by a group of settlers from Kentucky and Tennessee. The city was named after the nearby Chester Creek, which was named after the English city of Chester. The city was incorporated in 1839 and was the county seat of Randolph County from 1839 to 1883.
Chester was an important port city during the 19th century, as it was located at the confluence of the Mississippi and Chester Rivers. The city was a major hub for steamboat traffic, and was home to several large steamboat companies. The city was also a major center for the production of iron and steel products, and was home to several large iron and steel mills.
Geography
Chester is located at 38°14'N 89°58'W (38.23, -89.97). The city is situated along the Mississippi River, approximately 50 miles south of St. Louis, Missouri. The city has a total area of 4.2 square miles, all of which is land.
The city is located in the Central Lowland region of the United States, and is part of the Mississippi Alluvial Plain. The city is located in a flat, low-lying area, and is surrounded by agricultural land. The city is located in a humid subtropical climate zone, and experiences hot, humid summers and mild winters.
Economy
Chester is a small city with a limited economy. The city is home to several small businesses, including restaurants, retail stores, and service providers. The city is also home to several manufacturing companies, including a steel mill and a paper mill.
The city is also home to several educational institutions, including a community college and a vocational school. The city is also home to a hospital and several medical clinics.
Demographics
As of the 2010 census, Chester had a population of 8,621. The racial makeup of the city was 87.3% White, 8.2% African American, 0.3% Native American, 0.7% Asian, 0.1% Pacific Islander, 1.2% from other races, and 2.4% from two or more races. Hispanic or Latino of any race were 3.2% of the population.
The median income for a household in the city was $37,917, and the median income for a family was $45,917. The per capita income for the city was $18,917. About 11.2% of families and 14.2% of the population were below the poverty line, including 19.2% of those under age 18 and 8.2% of those age 65 or over.
Common Questions
What is Per Capita Income in Chester?
Per Capita income in Chester is $22,129.
What is the Median Family Income in Chester?
Median Family Income in Chester is $89,833.
What is the Median Household income in Chester?
Median Household Income in Chester is $68,826.
What is Income or Wage Gap in Chester?
Income or Wage Gap in Chester is 31.1%.
Women in Chester earn 68.9 cents for every dollar earned by a man.
What is Family Income Deficit in Chester?
Family Income Deficit in Chester is $9,943.
Families that are below poverty line in Chester earn $9,943 less on average than the poverty threshold level.
What is Inequality or Gini Index in Chester?
Inequality or Gini Index in Chester is 0.39.
What is the Total Population of Chester?
Total Population of Chester is 6,941.
What is the Total Male Population of Chester?
Total Male Population of Chester is 4,779.
What is the Total Female Population of Chester?
Total Female Population of Chester is 2,162.
What is the Ratio of Males per 100 Females in Chester?
There are 221.05 Males per 100 Females in Chester.
What is the Ratio of Females per 100 Males in Chester?
There are 45.24 Females per 100 Males in Chester.
What is the Median Population Age in Chester?
Median Population Age in Chester is 43.2 Years.
What is the Average Family Size in Chester
Average Family Size in Chester is 2.8 People.
What is the Average Household Size in Chester
Average Household Size in Chester is 2.2 People.
How Large is the Labor Force in Chester?
There are 2,202 People in the Labor Forcein in Chester.
What is the Percentage of People in the Labor Force in Chester?
34.5% of People are in the Labor Force in Chester.
What is the Unemployment Rate in Chester?
Unemployment Rate in Chester is 3.7%.