Cairo, IL Map & Demographics
Cairo Map
Cairo Overview
$19,511
PER CAPITA INCOME
$43,958
AVG FAMILY INCOME
$31,429
AVG HOUSEHOLD INCOME
66.7%
WAGE / INCOME GAP [ % ]
33.3¢/ $1
WAGE / INCOME GAP [ $ ]
0.45
INEQUALITY / GINI INDEX
1,510
TOTAL POPULATION
731
MALE POPULATION
779
FEMALE POPULATION
93.84
MALES / 100 FEMALES
106.57
FEMALES / 100 MALES
42.6
MEDIAN AGE
5.1
AVG FAMILY SIZE
2.6
AVG HOUSEHOLD SIZE
593
LABOR FORCE [ PEOPLE ]
47.2%
PERCENT IN LABOR FORCE
16.2%
UNEMPLOYMENT RATE
Cairo Zip Codes
Cairo Area Codes
Income in Cairo
Income Overview in Cairo
Per Capita Income in Cairo is $19,511, while median incomes of families and households are $43,958 and $31,429 respectively.
| Characteristic | Number | Measure |
| Per Capita Income | 1,510 | $19,511 |
| Median Family Income | 203 | $43,958 |
| Mean Family Income | 203 | $56,503 |
| Median Household Income | 548 | $31,429 |
| Mean Household Income | 548 | $40,084 |
| Income Deficit | 203 | $0 |
| Wage / Income Gap (%) | 1,510 | 66.67% |
| Wage / Income Gap ($) | 1,510 | 33.33¢ per $1 |
| Gini / Inequality Index | 1,510 | 0.45 |
Earnings by Sex in Cairo
Average Earnings in Cairo are $21,818, $10,833 for men and $32,500 for women, a difference of 66.7%.
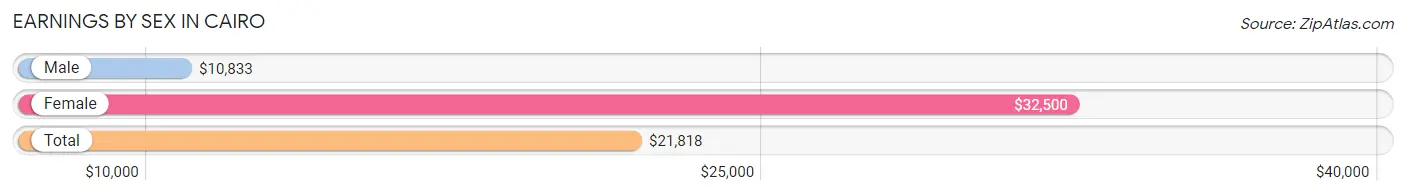
| Sex | Number | Average Earnings |
| Male | 338 (53.3%) | $10,833 |
| Female | 296 (46.7%) | $32,500 |
| Total | 634 (100.0%) | $21,818 |
Earnings by Sex by Income Bracket in Cairo
The most common earnings brackets in Cairo are $5,000 to $7,499 for men (60 | 17.7%) and $30,000 to $34,999 for women (63 | 21.3%).
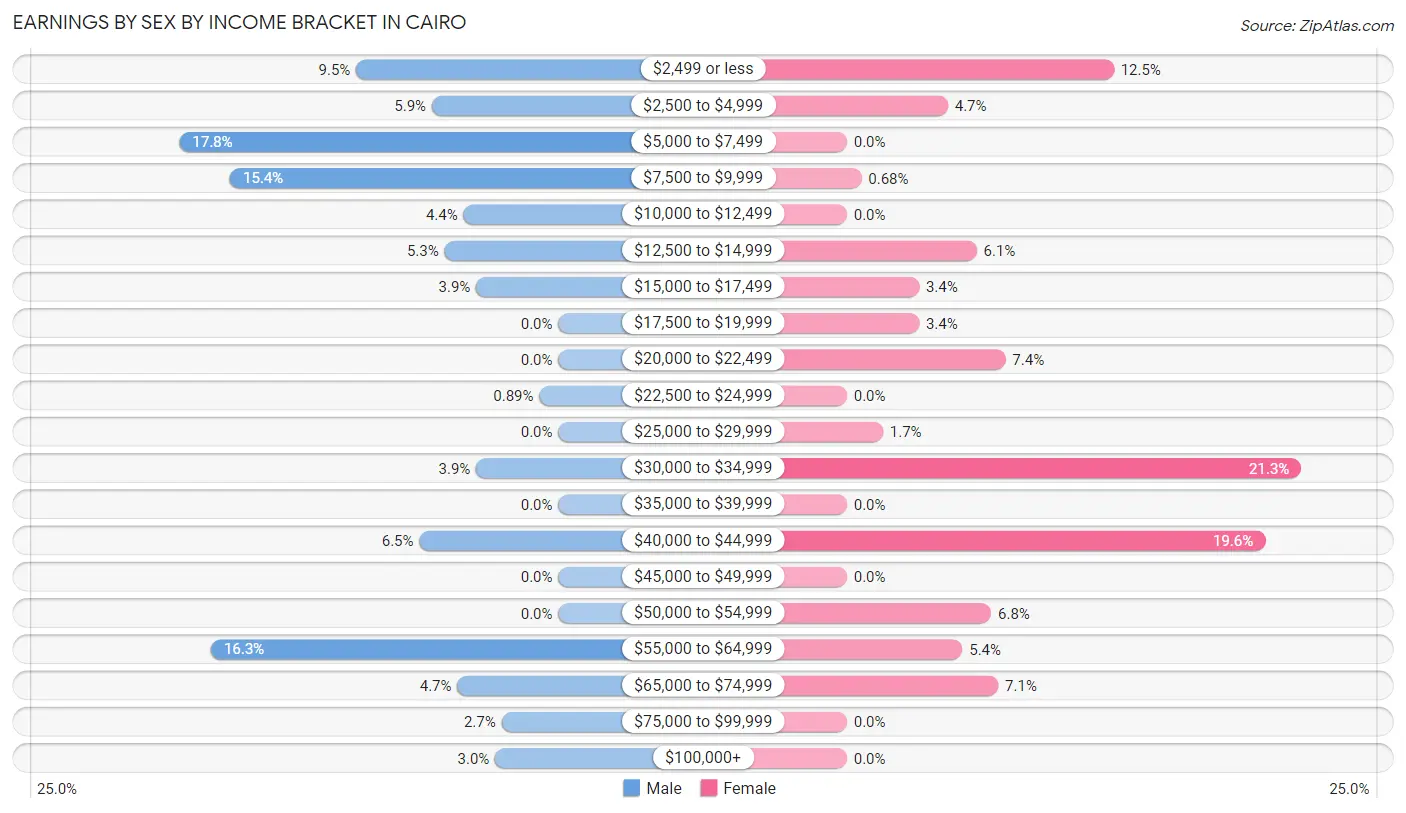
| Income | Male | Female |
| $2,499 or less | 32 (9.5%) | 37 (12.5%) |
| $2,500 to $4,999 | 20 (5.9%) | 14 (4.7%) |
| $5,000 to $7,499 | 60 (17.7%) | 0 (0.0%) |
| $7,500 to $9,999 | 52 (15.4%) | 2 (0.7%) |
| $10,000 to $12,499 | 15 (4.4%) | 0 (0.0%) |
| $12,500 to $14,999 | 18 (5.3%) | 18 (6.1%) |
| $15,000 to $17,499 | 13 (3.8%) | 10 (3.4%) |
| $17,500 to $19,999 | 0 (0.0%) | 10 (3.4%) |
| $20,000 to $22,499 | 0 (0.0%) | 22 (7.4%) |
| $22,500 to $24,999 | 3 (0.9%) | 0 (0.0%) |
| $25,000 to $29,999 | 0 (0.0%) | 5 (1.7%) |
| $30,000 to $34,999 | 13 (3.8%) | 63 (21.3%) |
| $35,000 to $39,999 | 0 (0.0%) | 0 (0.0%) |
| $40,000 to $44,999 | 22 (6.5%) | 58 (19.6%) |
| $45,000 to $49,999 | 0 (0.0%) | 0 (0.0%) |
| $50,000 to $54,999 | 0 (0.0%) | 20 (6.8%) |
| $55,000 to $64,999 | 55 (16.3%) | 16 (5.4%) |
| $65,000 to $74,999 | 16 (4.7%) | 21 (7.1%) |
| $75,000 to $99,999 | 9 (2.7%) | 0 (0.0%) |
| $100,000+ | 10 (3.0%) | 0 (0.0%) |
| Total | 338 (100.0%) | 296 (100.0%) |
Earnings by Sex by Educational Attainment in Cairo
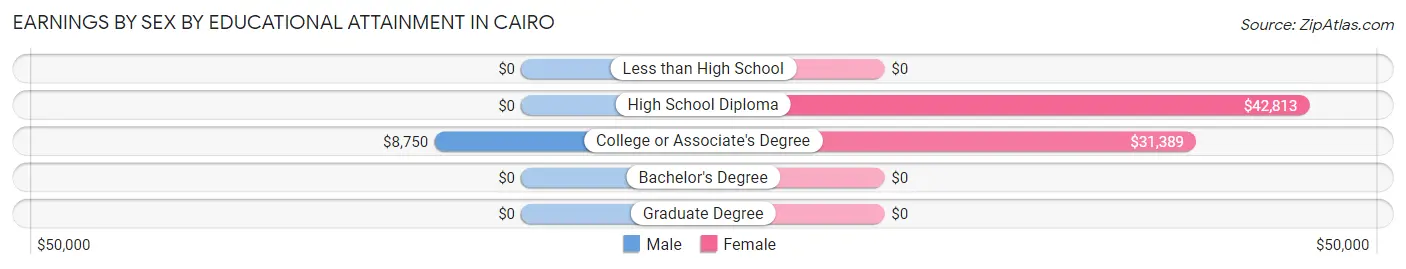
| Educational Attainment | Male Income | Female Income |
| Less than High School | - | - |
| High School Diploma | - | - |
| College or Associate's Degree | $8,750 | $31,389 |
| Bachelor's Degree | - | - |
| Graduate Degree | - | - |
| Total | - | - |
Family Income in Cairo
Family Income Brackets in Cairo
According to the Cairo family income data, there are 54 families falling into the $35,000 to $49,999 income range, which is the most common income bracket and makes up 26.6% of all families.
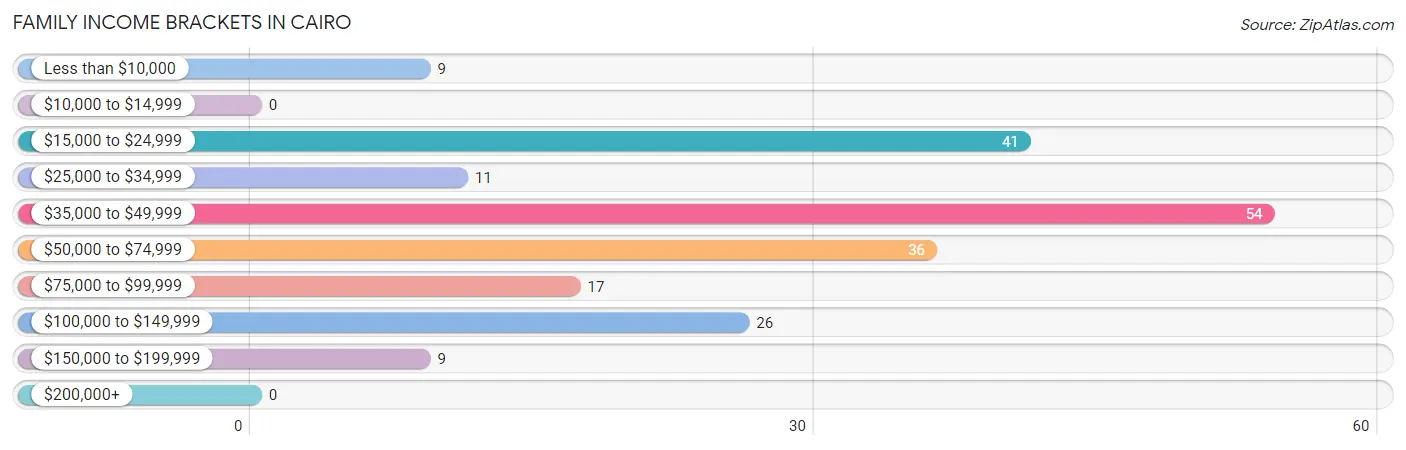
| Income Bracket | # Families | % Families |
| Less than $10,000 | 9 | 4.4% |
| $10,000 to $14,999 | 0 | 0.0% |
| $15,000 to $24,999 | 41 | 20.2% |
| $25,000 to $34,999 | 11 | 5.4% |
| $35,000 to $49,999 | 54 | 26.6% |
| $50,000 to $74,999 | 36 | 17.7% |
| $75,000 to $99,999 | 17 | 8.4% |
| $100,000 to $149,999 | 26 | 12.8% |
| $150,000 to $199,999 | 9 | 4.4% |
| $200,000+ | 0 | 0.0% |
Family Income by Famaliy Size in Cairo
2-person families (111 | 54.7%) account for the highest median family income in Cairo with $50,114 per family, while 2-person families (111 | 54.7%) have the highest median income of $25,057 per family member.
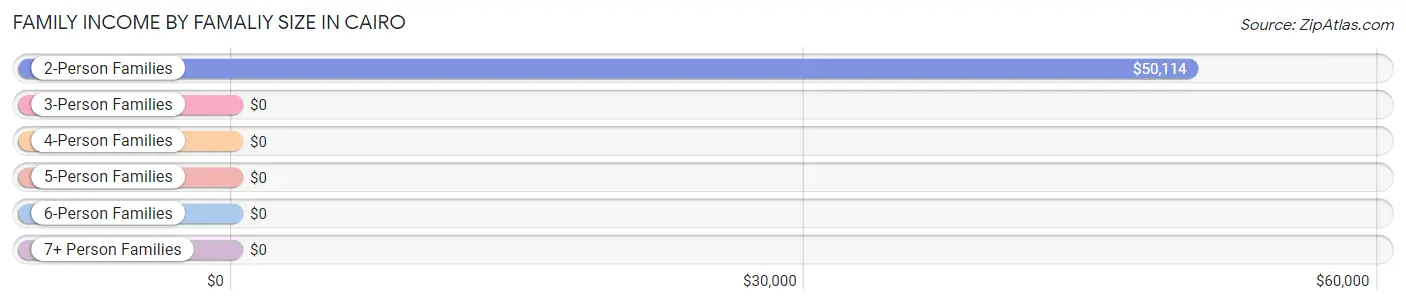
| Income Bracket | # Families | Median Income |
| 2-Person Families | 111 (54.7%) | $50,114 |
| 3-Person Families | 27 (13.3%) | $0 |
| 4-Person Families | 44 (21.7%) | $0 |
| 5-Person Families | 19 (9.4%) | $0 |
| 6-Person Families | 0 (0.0%) | $0 |
| 7+ Person Families | 2 (1.0%) | $0 |
| Total | 203 (100.0%) | $43,958 |
Family Income by Number of Earners in Cairo
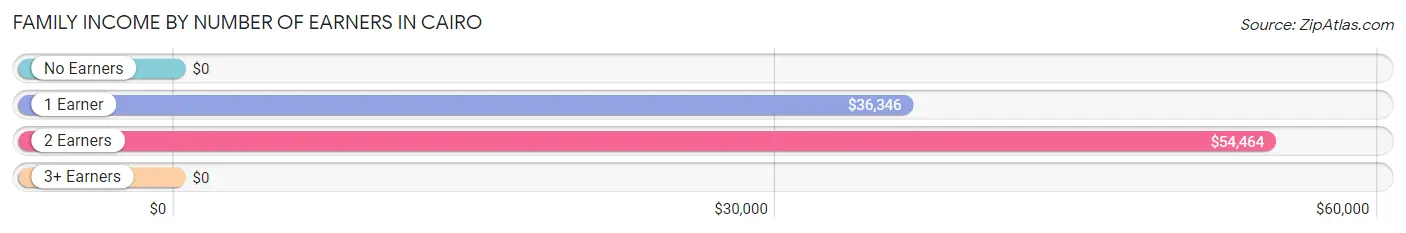
| Number of Earners | # Families | Median Income |
| No Earners | 34 (16.8%) | $0 |
| 1 Earner | 82 (40.4%) | $36,346 |
| 2 Earners | 75 (36.9%) | $54,464 |
| 3+ Earners | 12 (5.9%) | $0 |
| Total | 203 (100.0%) | $43,958 |
Household Income in Cairo
Household Income Brackets in Cairo
With 110 households falling in the category, the $35,000 to $49,999 income range is the most frequent in Cairo, accounting for 20.1% of all households.
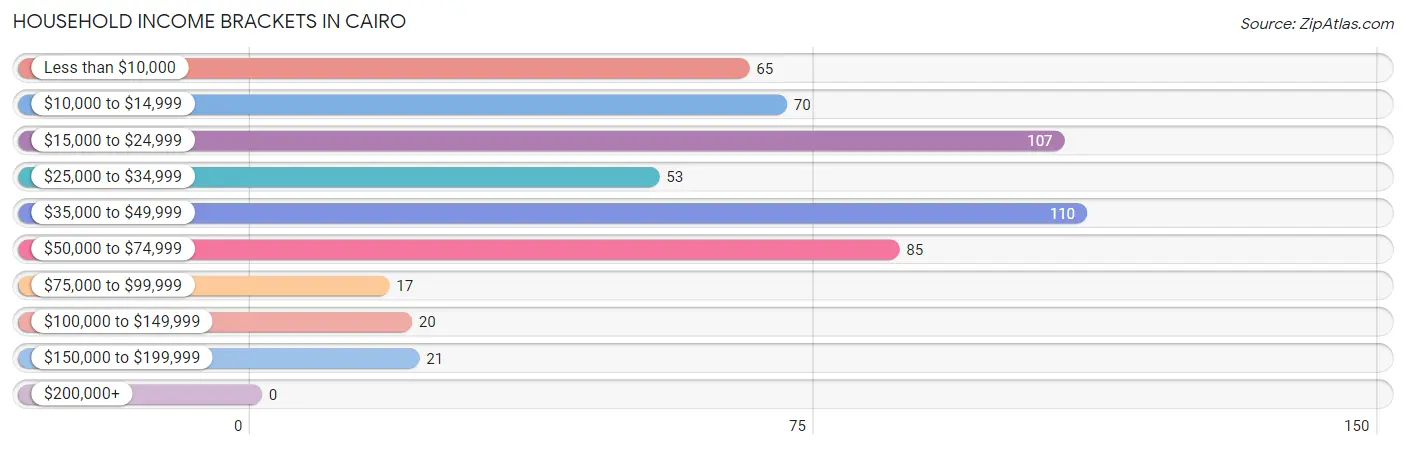
| Income Bracket | # Households | % Households |
| Less than $10,000 | 65 | 11.9% |
| $10,000 to $14,999 | 70 | 12.8% |
| $15,000 to $24,999 | 107 | 19.5% |
| $25,000 to $34,999 | 53 | 9.7% |
| $35,000 to $49,999 | 110 | 20.1% |
| $50,000 to $74,999 | 85 | 15.5% |
| $75,000 to $99,999 | 17 | 3.1% |
| $100,000 to $149,999 | 20 | 3.6% |
| $150,000 to $199,999 | 21 | 3.8% |
| $200,000+ | 0 | 0.0% |
Household Income by Householder Age in Cairo
The median household income in Cairo is $31,429, with the highest median household income of $38,250 found in the 65+ years age bracket for the primary householder. A total of 265 households (48.4%) fall into this category.
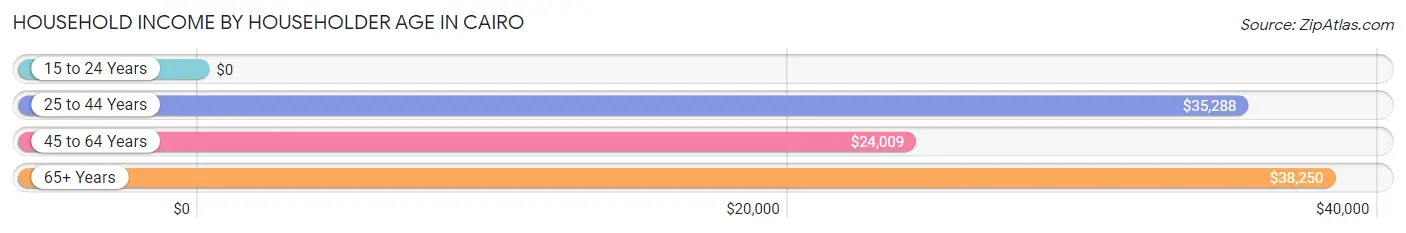
| Income Bracket | # Households | Median Income |
| 15 to 24 Years | 0 (0.0%) | $0 |
| 25 to 44 Years | 53 (9.7%) | $35,288 |
| 45 to 64 Years | 230 (42.0%) | $24,009 |
| 65+ Years | 265 (48.4%) | $38,250 |
| Total | 548 (100.0%) | $31,429 |
Poverty in Cairo
Income Below Poverty by Sex and Age in Cairo
With 6.9% poverty level for males and 39.9% for females among the residents of Cairo, 45 to 54 year old males and under 5 year old females are the most vulnerable to poverty, with 6 males (27.3%) and 5 females (100.0%) in their respective age groups living below the poverty level.
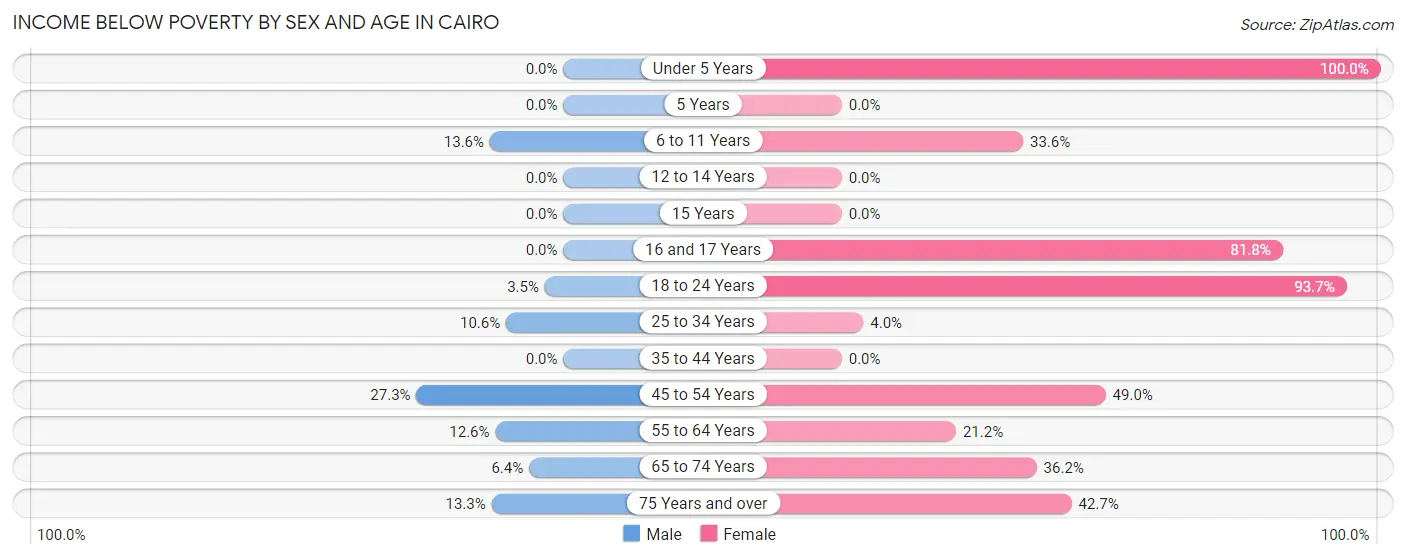
| Age Bracket | Male | Female |
| Under 5 Years | 0 (0.0%) | 5 (100.0%) |
| 5 Years | 0 (0.0%) | 0 (0.0%) |
| 6 to 11 Years | 6 (13.6%) | 36 (33.6%) |
| 12 to 14 Years | 0 (0.0%) | 0 (0.0%) |
| 15 Years | 0 (0.0%) | 0 (0.0%) |
| 16 and 17 Years | 0 (0.0%) | 36 (81.8%) |
| 18 to 24 Years | 2 (3.5%) | 74 (93.7%) |
| 25 to 34 Years | 10 (10.6%) | 3 (4.0%) |
| 35 to 44 Years | 0 (0.0%) | 0 (0.0%) |
| 45 to 54 Years | 6 (27.3%) | 48 (49.0%) |
| 55 to 64 Years | 13 (12.6%) | 25 (21.2%) |
| 65 to 74 Years | 7 (6.4%) | 34 (36.2%) |
| 75 Years and over | 6 (13.3%) | 29 (42.6%) |
| Total | 50 (6.9%) | 290 (39.9%) |
Income Above Poverty by Sex and Age in Cairo
According to the poverty statistics in Cairo, males aged under 5 years and females aged 15 years are the age groups that are most secure financially, with 100.0% of males and 100.0% of females in these age groups living above the poverty line.
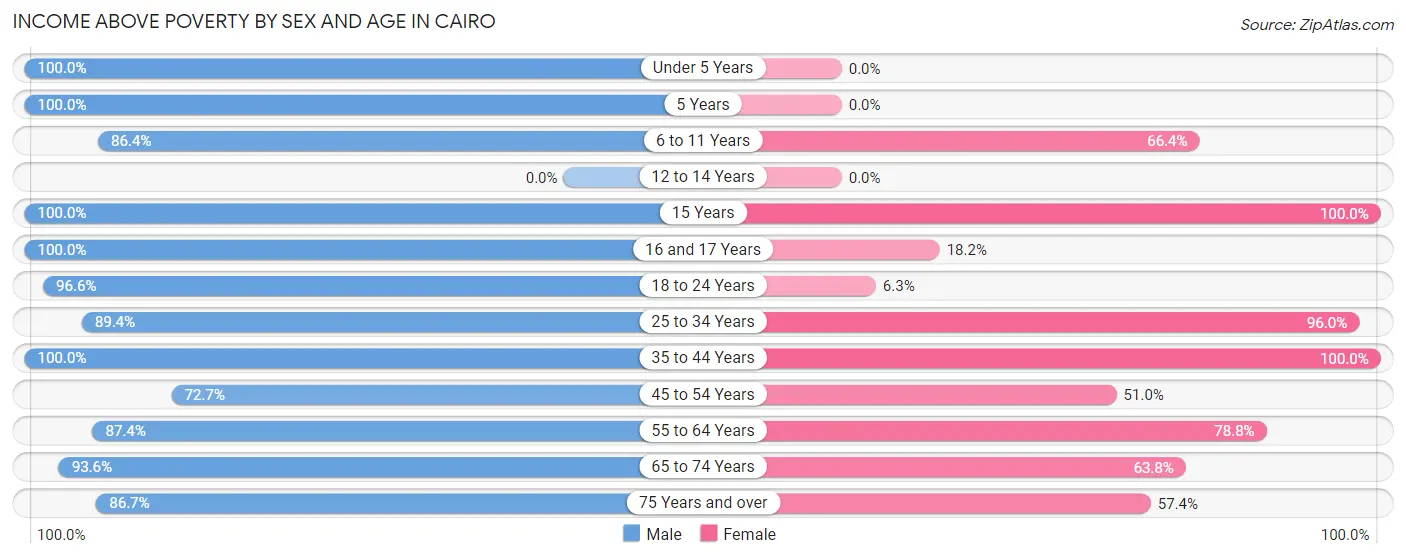
| Age Bracket | Male | Female |
| Under 5 Years | 65 (100.0%) | 0 (0.0%) |
| 5 Years | 25 (100.0%) | 0 (0.0%) |
| 6 to 11 Years | 38 (86.4%) | 71 (66.4%) |
| 12 to 14 Years | 0 (0.0%) | 0 (0.0%) |
| 15 Years | 6 (100.0%) | 2 (100.0%) |
| 16 and 17 Years | 19 (100.0%) | 8 (18.2%) |
| 18 to 24 Years | 56 (96.6%) | 5 (6.3%) |
| 25 to 34 Years | 84 (89.4%) | 72 (96.0%) |
| 35 to 44 Years | 129 (100.0%) | 37 (100.0%) |
| 45 to 54 Years | 16 (72.7%) | 50 (51.0%) |
| 55 to 64 Years | 90 (87.4%) | 93 (78.8%) |
| 65 to 74 Years | 103 (93.6%) | 60 (63.8%) |
| 75 Years and over | 39 (86.7%) | 39 (57.4%) |
| Total | 670 (93.1%) | 437 (60.1%) |
Income Below Poverty Among Married-Couple Families in Cairo
The poverty statistics for married-couple families in Cairo show that 8.6% or 9 of the total 104 families live below the poverty line. Families with 1 or 2 children have the highest poverty rate of 37.5%, comprising of 3 families. On the other hand, families with 3 or 4 children have the lowest poverty rate of 0.0%, which includes 0 families.
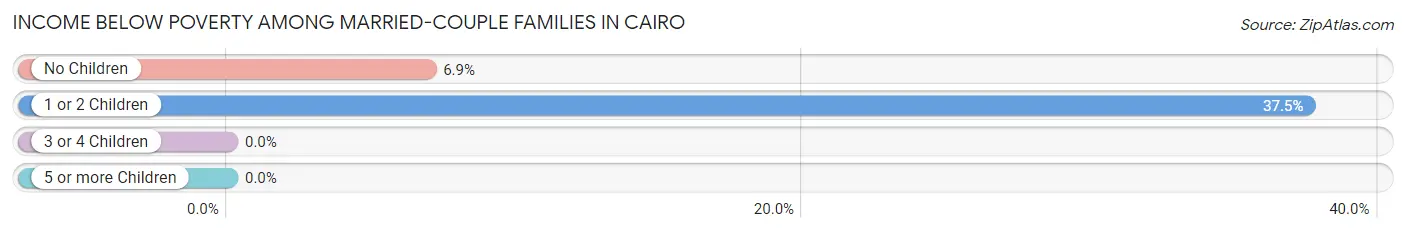
| Children | Above Poverty | Below Poverty |
| No Children | 81 (93.1%) | 6 (6.9%) |
| 1 or 2 Children | 5 (62.5%) | 3 (37.5%) |
| 3 or 4 Children | 7 (100.0%) | 0 (0.0%) |
| 5 or more Children | 2 (100.0%) | 0 (0.0%) |
| Total | 95 (91.3%) | 9 (8.6%) |
Income Below Poverty Among Single-Parent Households in Cairo
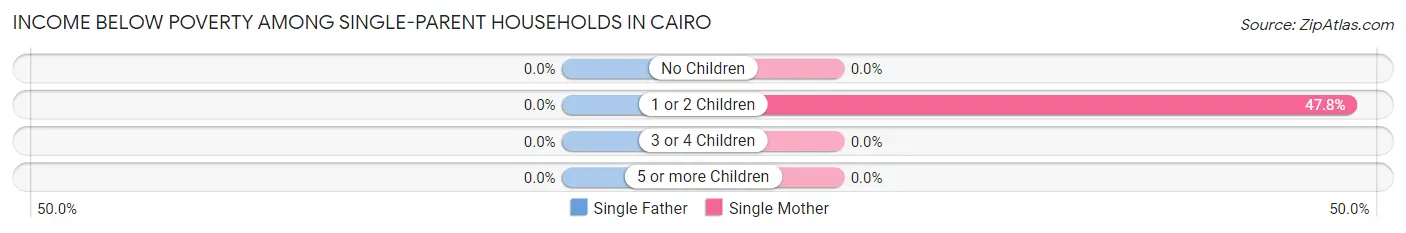
| Children | Single Father | Single Mother |
| No Children | 0 (0.0%) | 0 (0.0%) |
| 1 or 2 Children | 0 (0.0%) | 22 (47.8%) |
| 3 or 4 Children | 0 (0.0%) | 0 (0.0%) |
| 5 or more Children | 0 (0.0%) | 0 (0.0%) |
| Total | 0 (0.0%) | 22 (23.9%) |
Income Below Poverty Among Married-Couple vs Single-Parent Households in Cairo
The poverty data for Cairo shows that 9 of the married-couple family households (8.6%) and 22 of the single-parent households (22.2%) are living below the poverty level. Within the married-couple family households, those with 1 or 2 children have the highest poverty rate, with 3 households (37.5%) falling below the poverty line. Among the single-parent households, those with 1 or 2 children have the highest poverty rate, with 22 household (41.5%) living below poverty.
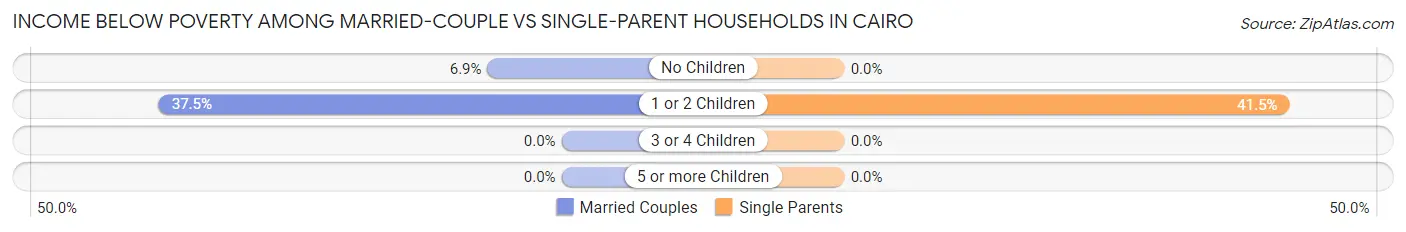
| Children | Married-Couple Families | Single-Parent Households |
| No Children | 6 (6.9%) | 0 (0.0%) |
| 1 or 2 Children | 3 (37.5%) | 22 (41.5%) |
| 3 or 4 Children | 0 (0.0%) | 0 (0.0%) |
| 5 or more Children | 0 (0.0%) | 0 (0.0%) |
| Total | 9 (8.6%) | 22 (22.2%) |
Race in Cairo
The most populous races in Cairo are Black / African American (1,116 | 73.9%), White / Caucasian (351 | 23.3%), and Two or more Races (43 | 2.9%).
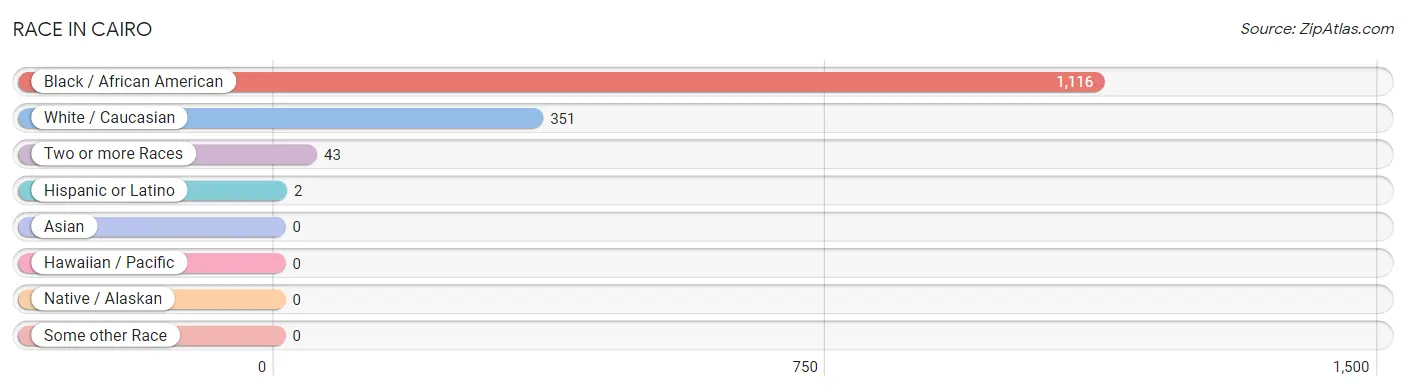
| Race | # Population | % Population |
| Asian | 0 | 0.0% |
| Black / African American | 1,116 | 73.9% |
| Hawaiian / Pacific | 0 | 0.0% |
| Hispanic or Latino | 2 | 0.1% |
| Native / Alaskan | 0 | 0.0% |
| White / Caucasian | 351 | 23.3% |
| Two or more Races | 43 | 2.9% |
| Some other Race | 0 | 0.0% |
| Total | 1,510 | 100.0% |
Ancestry in Cairo
The most populous ancestries reported in Cairo are Irish (76 | 5.0%), German (32 | 2.1%), English (31 | 2.1%), American (30 | 2.0%), and Scottish (24 | 1.6%), together accounting for 12.8% of all Cairo residents.
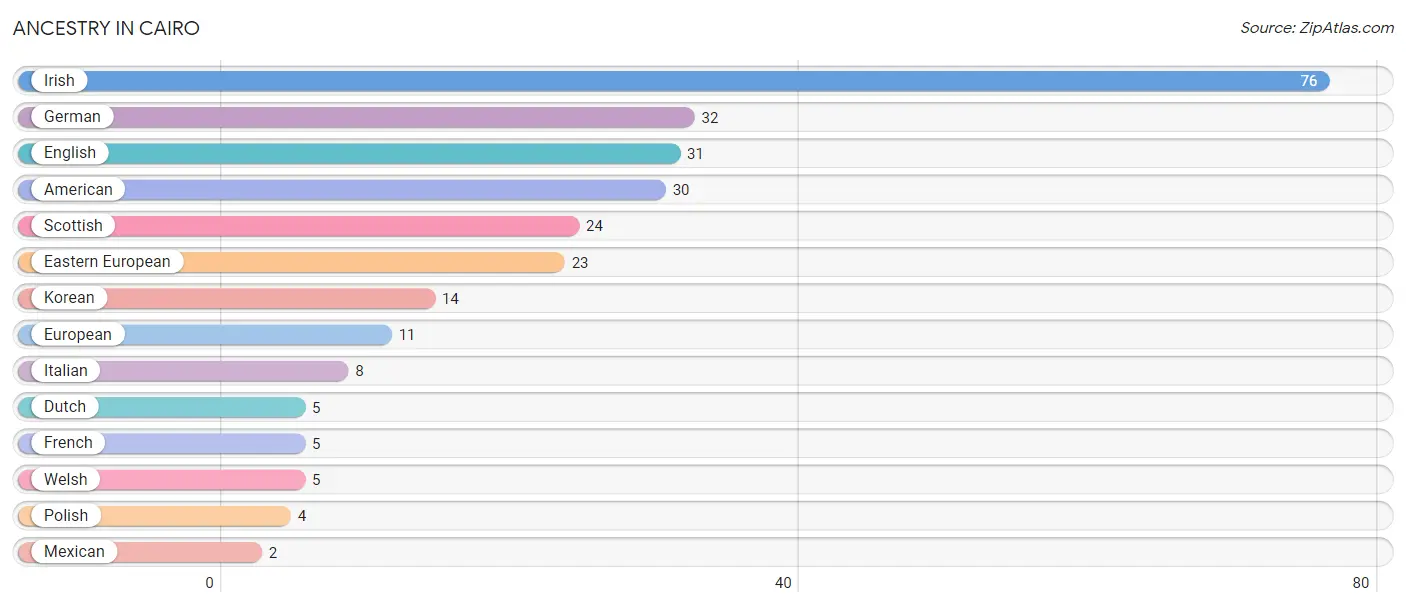
| Ancestry | # Population | % Population |
| American | 30 | 2.0% |
| Dutch | 5 | 0.3% |
| Eastern European | 23 | 1.5% |
| English | 31 | 2.1% |
| European | 11 | 0.7% |
| French | 5 | 0.3% |
| German | 32 | 2.1% |
| Irish | 76 | 5.0% |
| Italian | 8 | 0.5% |
| Korean | 14 | 0.9% |
| Mexican | 2 | 0.1% |
| Polish | 4 | 0.3% |
| Scottish | 24 | 1.6% |
| Welsh | 5 | 0.3% | View All 14 Rows |
Immigrants in Cairo
The most numerous immigrant groups reported in Cairo came from Caribbean (22 | 1.5%), Jamaica (22 | 1.5%), and Latin America (22 | 1.5%), together accounting for 4.4% of all Cairo residents.
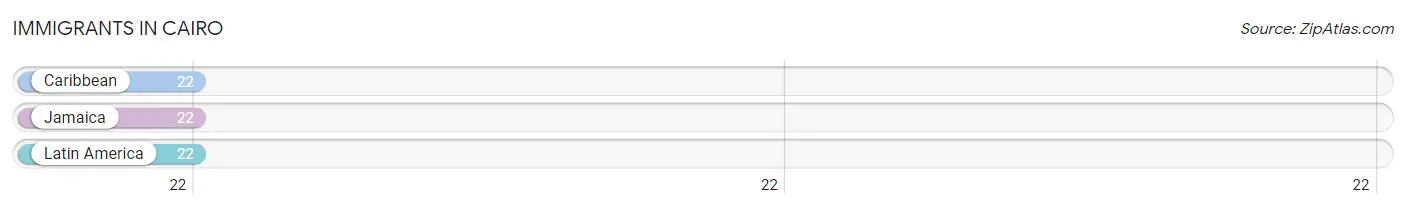
| Immigration Origin | # Population | % Population |
| Caribbean | 22 | 1.5% |
| Jamaica | 22 | 1.5% |
| Latin America | 22 | 1.5% | View All 3 Rows |
Sex and Age in Cairo
Sex and Age in Cairo
The most populous age groups in Cairo are 30 to 34 Years (83 | 11.4%) for men and 15 to 19 Years (120 | 15.4%) for women.
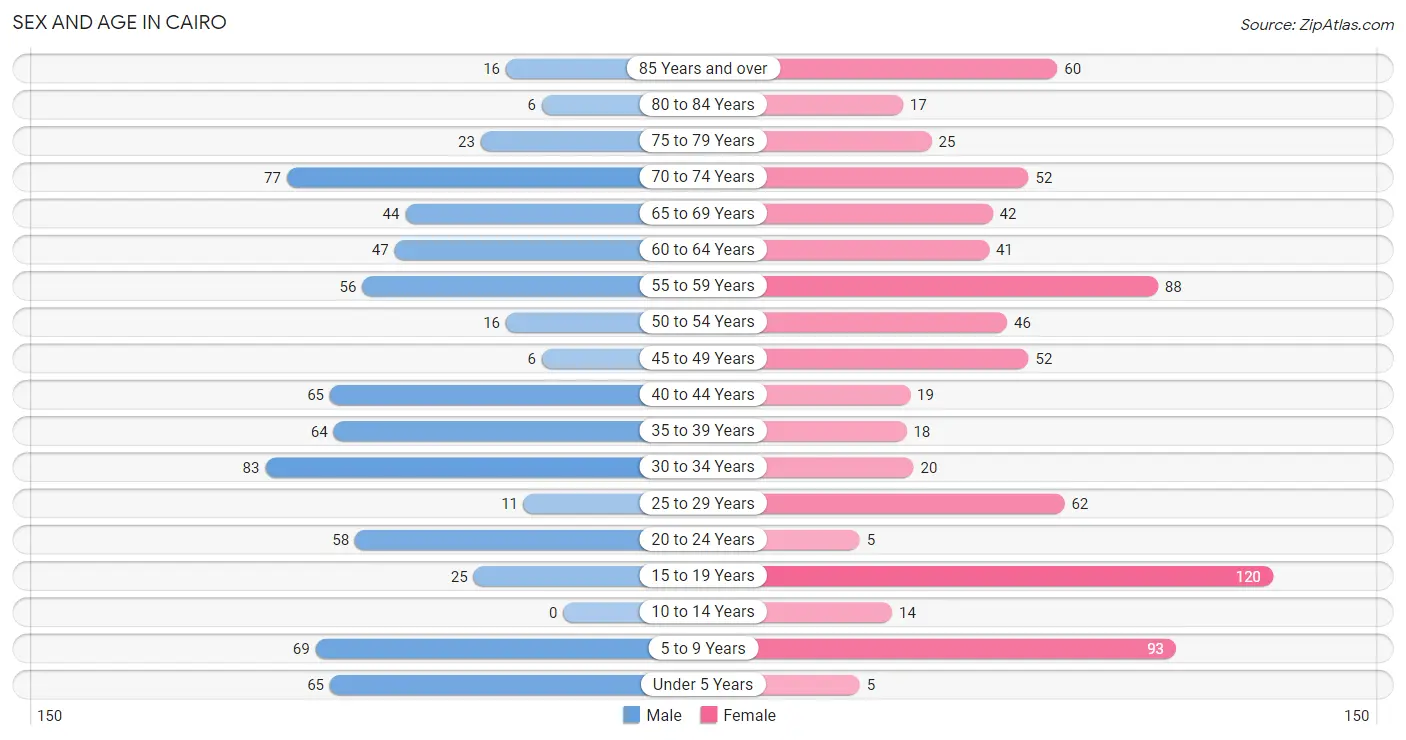
| Age Bracket | Male | Female |
| Under 5 Years | 65 (8.9%) | 5 (0.6%) |
| 5 to 9 Years | 69 (9.4%) | 93 (11.9%) |
| 10 to 14 Years | 0 (0.0%) | 14 (1.8%) |
| 15 to 19 Years | 25 (3.4%) | 120 (15.4%) |
| 20 to 24 Years | 58 (7.9%) | 5 (0.6%) |
| 25 to 29 Years | 11 (1.5%) | 62 (8.0%) |
| 30 to 34 Years | 83 (11.4%) | 20 (2.6%) |
| 35 to 39 Years | 64 (8.8%) | 18 (2.3%) |
| 40 to 44 Years | 65 (8.9%) | 19 (2.4%) |
| 45 to 49 Years | 6 (0.8%) | 52 (6.7%) |
| 50 to 54 Years | 16 (2.2%) | 46 (5.9%) |
| 55 to 59 Years | 56 (7.7%) | 88 (11.3%) |
| 60 to 64 Years | 47 (6.4%) | 41 (5.3%) |
| 65 to 69 Years | 44 (6.0%) | 42 (5.4%) |
| 70 to 74 Years | 77 (10.5%) | 52 (6.7%) |
| 75 to 79 Years | 23 (3.2%) | 25 (3.2%) |
| 80 to 84 Years | 6 (0.8%) | 17 (2.2%) |
| 85 Years and over | 16 (2.2%) | 60 (7.7%) |
| Total | 731 (100.0%) | 779 (100.0%) |
Families and Households in Cairo
Median Family Size in Cairo
The median family size in Cairo is 5.14 persons per family, with single female/mother families (92 | 45.3%) accounting for the largest median family size of 6.76 persons per family. On the other hand, single male/father families (7 | 3.5%) represent the smallest median family size with 1.57 persons per family.
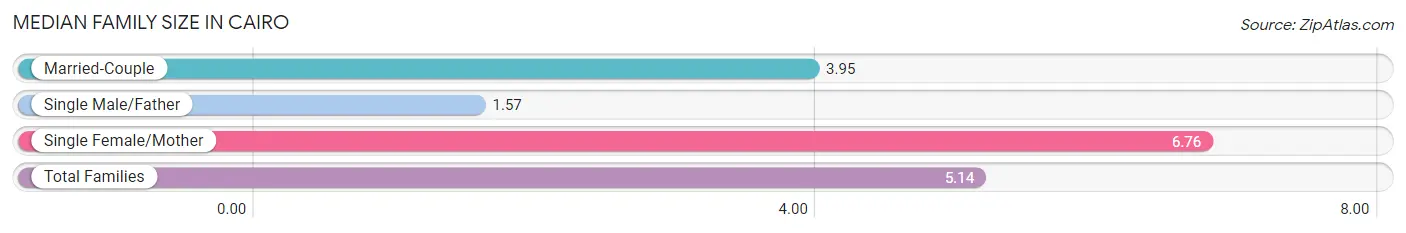
| Family Type | # Families | Family Size |
| Married-Couple | 104 (51.2%) | 3.95 |
| Single Male/Father | 7 (3.5%) | 1.57 |
| Single Female/Mother | 92 (45.3%) | 6.76 |
| Total Families | 203 (100.0%) | 5.14 |
Median Household Size in Cairo
The median household size in Cairo is 2.61 persons per household, with single female/mother households (92 | 16.8%) accounting for the largest median household size of 6.87 persons per household. non-family households (345 | 63.0%) represent the smallest median household size with 1.04 persons per household.
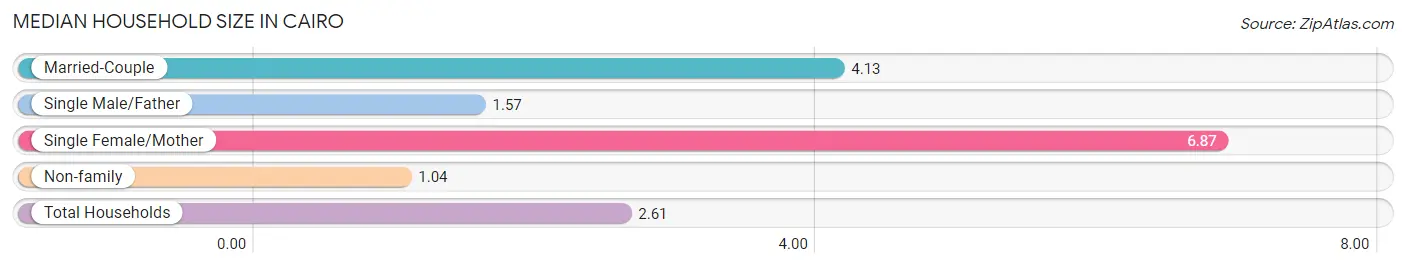
| Household Type | # Households | Household Size |
| Married-Couple | 104 (19.0%) | 4.13 |
| Single Male/Father | 7 (1.3%) | 1.57 |
| Single Female/Mother | 92 (16.8%) | 6.87 |
| Non-family | 345 (63.0%) | 1.04 |
| Total Households | 548 (100.0%) | 2.61 |
Household Size by Marriage Status in Cairo
Out of a total of 548 households in Cairo, 203 (37.0%) are family households, while 345 (63.0%) are nonfamily households. The most numerous type of family households are 2-person households, comprising 111, and the most common type of nonfamily households are 1-person households, comprising 341.
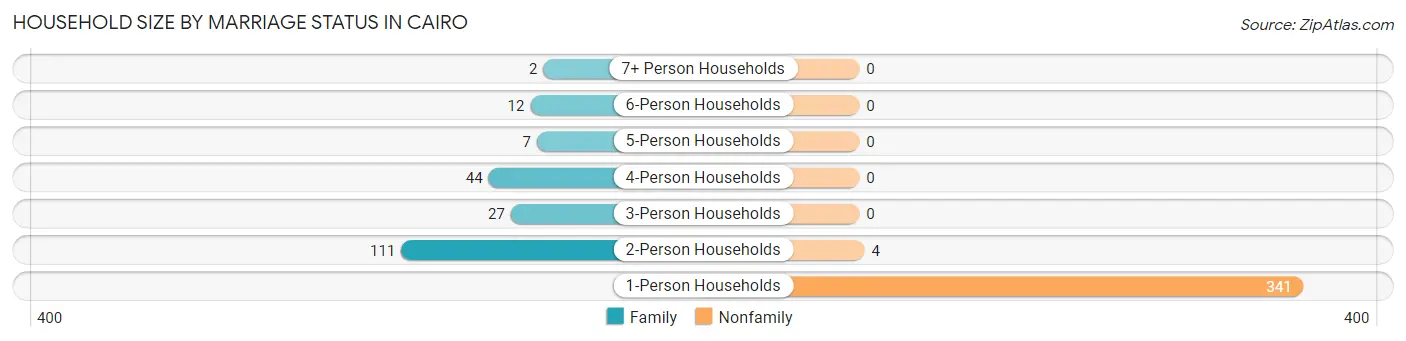
| Household Size | Family Households | Nonfamily Households |
| 1-Person Households | - | 341 (62.2%) |
| 2-Person Households | 111 (20.3%) | 4 (0.7%) |
| 3-Person Households | 27 (4.9%) | 0 (0.0%) |
| 4-Person Households | 44 (8.0%) | 0 (0.0%) |
| 5-Person Households | 7 (1.3%) | 0 (0.0%) |
| 6-Person Households | 12 (2.2%) | 0 (0.0%) |
| 7+ Person Households | 2 (0.4%) | 0 (0.0%) |
| Total | 203 (37.0%) | 345 (63.0%) |
Female Fertility in Cairo
Fertility by Age in Cairo
| Age Bracket | Women with Births | Births / 1,000 Women |
| 15 to 19 years | 0 (0.0%) | 0.0 |
| 20 to 34 years | 0 (0.0%) | 0.0 |
| 35 to 50 years | 0 (0.0%) | 0.0 |
| Total | 0 (0.0%) | 0.0 |
Fertility by Age by Marriage Status in Cairo
| Age Bracket | Married | Unmarried |
| 15 to 19 years | 0 (0.0%) | 0 (0.0%) |
| 20 to 34 years | 0 (0.0%) | 0 (0.0%) |
| 35 to 50 years | 0 (0.0%) | 0 (0.0%) |
| Total | 0 (0.0%) | 0 (0.0%) |
Fertility by Education in Cairo
| Educational Attainment | Women with Births | Births / 1,000 Women |
| Less than High School | 0 (0.0%) | 0.0 |
| High School Diploma | 0 (0.0%) | 0.0 |
| College or Associate's Degree | 0 (0.0%) | 0.0 |
| Bachelor's Degree | 0 (0.0%) | 0.0 |
| Graduate Degree | 0 (0.0%) | 0.0 |
| Total | 0 (0.0%) | 0.0 |
Fertility by Education by Marriage Status in Cairo
| Educational Attainment | Married | Unmarried |
| Less than High School | 0 (0.0%) | 0 (0.0%) |
| High School Diploma | 0 (0.0%) | 0 (0.0%) |
| College or Associate's Degree | 0 (0.0%) | 0 (0.0%) |
| Bachelor's Degree | 0 (0.0%) | 0 (0.0%) |
| Graduate Degree | 0 (0.0%) | 0 (0.0%) |
| Total | 0 (0.0%) | 0 (0.0%) |
Employment Characteristics in Cairo
Employment by Class of Employer in Cairo
Among the 497 employed individuals in Cairo, private company employees (313 | 63.0%), local government employees (110 | 22.1%), and not-for-profit organizations (32 | 6.4%) make up the most common classes of employment.
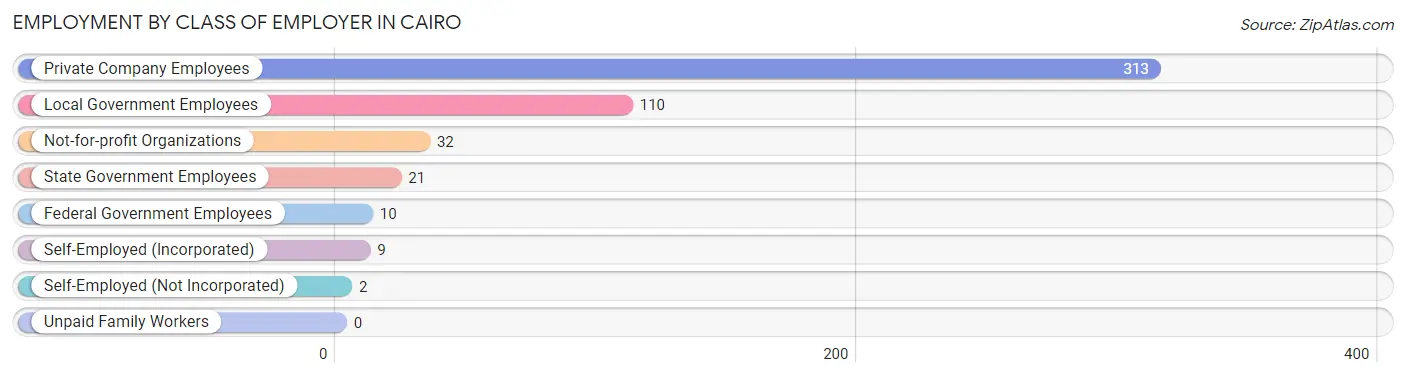
| Employer Class | # Employees | % Employees |
| Private Company Employees | 313 | 63.0% |
| Self-Employed (Incorporated) | 9 | 1.8% |
| Self-Employed (Not Incorporated) | 2 | 0.4% |
| Not-for-profit Organizations | 32 | 6.4% |
| Local Government Employees | 110 | 22.1% |
| State Government Employees | 21 | 4.2% |
| Federal Government Employees | 10 | 2.0% |
| Unpaid Family Workers | 0 | 0.0% |
| Total | 497 | 100.0% |
Employment Status by Age in Cairo
According to the labor force statistics for Cairo, out of the total population over 16 years of age (1,256), 47.2% or 593 individuals are in the labor force, with 16.2% or 96 of them unemployed. The age group with the highest labor force participation rate is 35 to 44 years, with 100.0% or 166 individuals in the labor force. Within the labor force, the 25 to 29 years age range has the highest percentage of unemployed individuals, with 55.6% or 5 of them being unemployed.
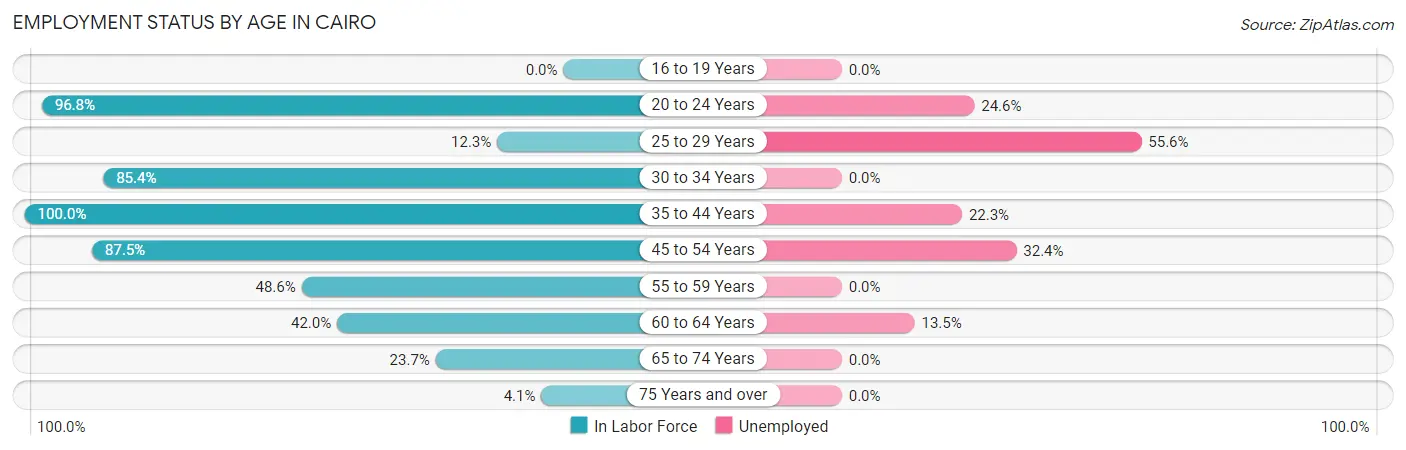
| Age Bracket | In Labor Force | Unemployed |
| 16 to 19 Years | 0 (0.0%) | 0 (0.0%) |
| 20 to 24 Years | 61 (96.8%) | 15 (24.6%) |
| 25 to 29 Years | 9 (12.3%) | 5 (55.6%) |
| 30 to 34 Years | 88 (85.4%) | 0 (0.0%) |
| 35 to 44 Years | 166 (100.0%) | 37 (22.3%) |
| 45 to 54 Years | 105 (87.5%) | 34 (32.4%) |
| 55 to 59 Years | 70 (48.6%) | 0 (0.0%) |
| 60 to 64 Years | 37 (42.0%) | 5 (13.5%) |
| 65 to 74 Years | 51 (23.7%) | 0 (0.0%) |
| 75 Years and over | 6 (4.1%) | 0 (0.0%) |
| Total | 593 (47.2%) | 96 (16.2%) |
Employment Status by Educational Attainment in Cairo
According to labor force statistics for Cairo, 68.4% of individuals (475) out of the total population between 25 and 64 years of age (694) are in the labor force, with 17.1% or 81 of them being unemployed. The group with the highest labor force participation rate are those with the educational attainment of bachelor's degree or higher, with 89.6% or 69 individuals in the labor force. Within the labor force, individuals with less than high school education have the highest percentage of unemployment, with 70.2% or 66 of them being unemployed.
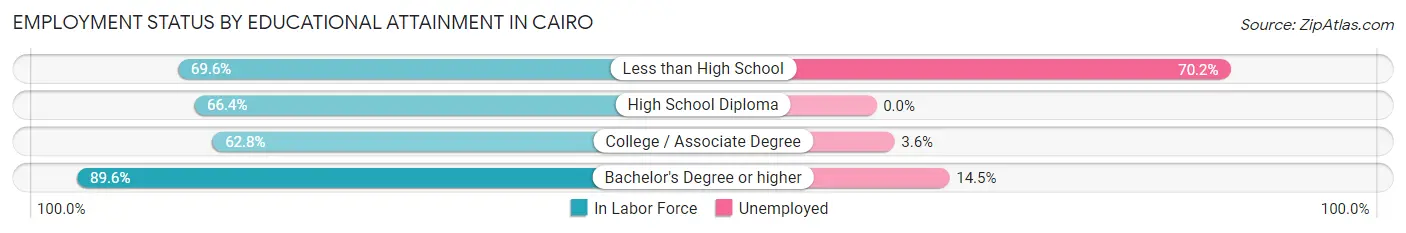
| Educational Attainment | In Labor Force | Unemployed |
| Less than High School | 94 (69.6%) | 95 (70.2%) |
| High School Diploma | 172 (66.4%) | 0 (0.0%) |
| College / Associate Degree | 140 (62.8%) | 8 (3.6%) |
| Bachelor's Degree or higher | 69 (89.6%) | 11 (14.5%) |
| Total | 475 (68.4%) | 119 (17.1%) |
Employment Occupations by Sex in Cairo
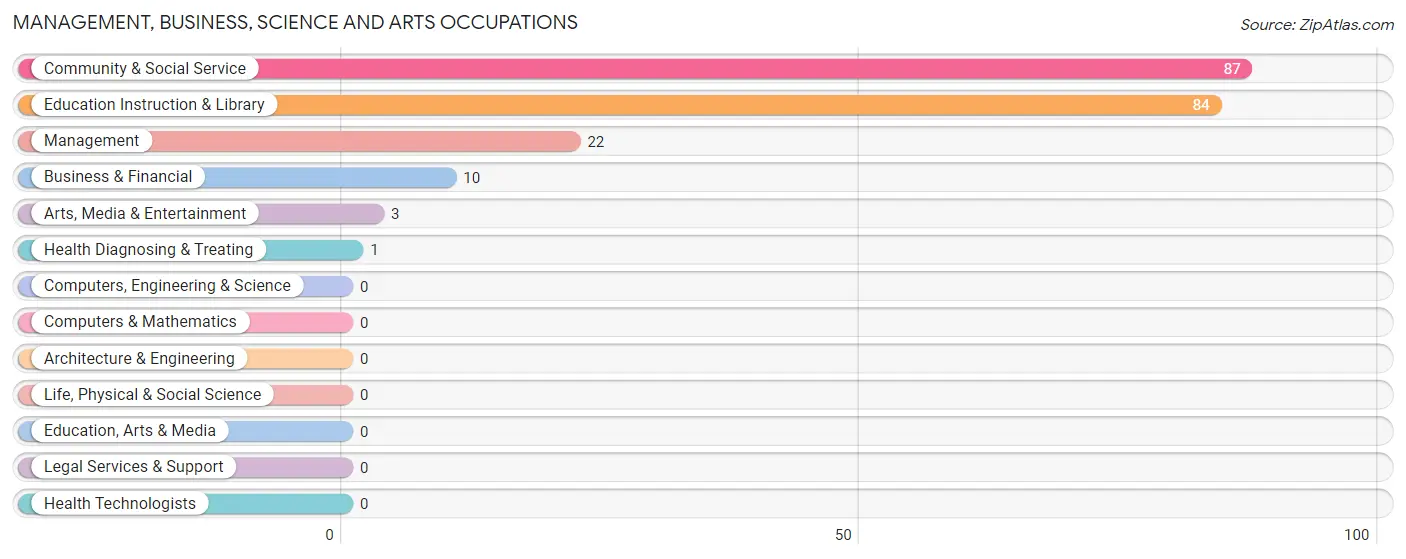
Management, Business, Science and Arts Occupations
The most common Management, Business, Science and Arts occupations in Cairo are Community & Social Service (87 | 17.5%), Education Instruction & Library (84 | 16.9%), Management (22 | 4.4%), Business & Financial (10 | 2.0%), and Arts, Media & Entertainment (3 | 0.6%).
Management, Business, Science and Arts Occupations by Sex
Within the Management, Business, Science and Arts occupations in Cairo, the most male-oriented occupations are Business & Financial (100.0%), Arts, Media & Entertainment (100.0%), and Community & Social Service (66.7%), while the most female-oriented occupations are Health Diagnosing & Treating (100.0%), Management (54.5%), and Education Instruction & Library (34.5%).
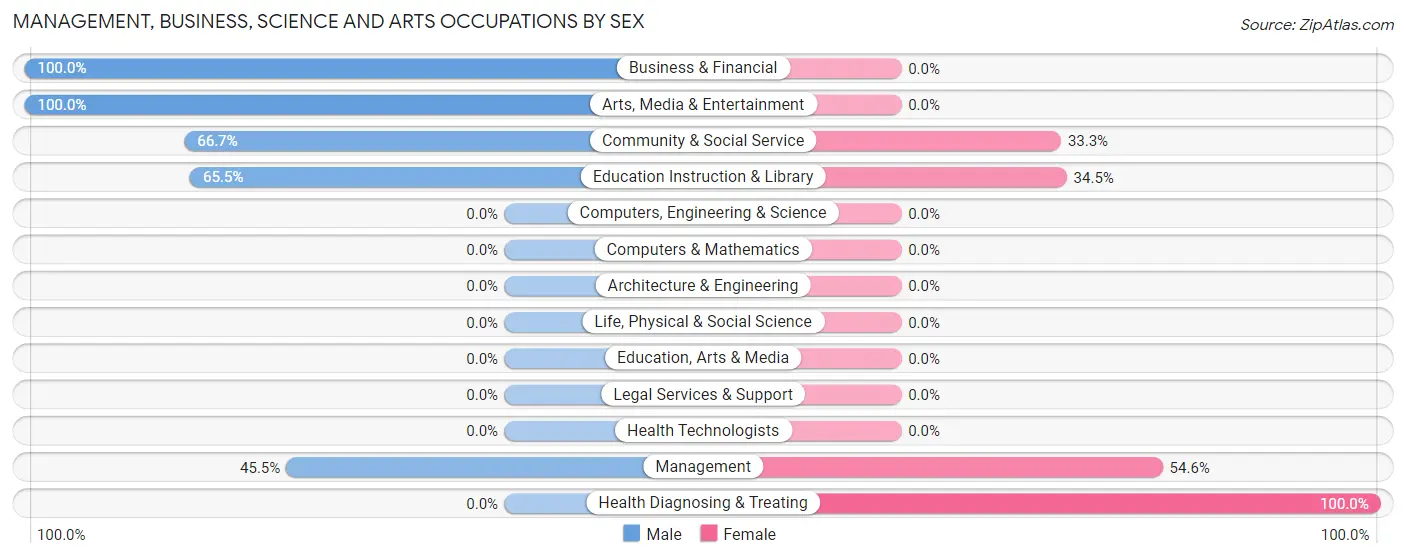
| Occupation | Male | Female |
| Management | 10 (45.5%) | 12 (54.5%) |
| Business & Financial | 10 (100.0%) | 0 (0.0%) |
| Computers, Engineering & Science | 0 (0.0%) | 0 (0.0%) |
| Computers & Mathematics | 0 (0.0%) | 0 (0.0%) |
| Architecture & Engineering | 0 (0.0%) | 0 (0.0%) |
| Life, Physical & Social Science | 0 (0.0%) | 0 (0.0%) |
| Community & Social Service | 58 (66.7%) | 29 (33.3%) |
| Education, Arts & Media | 0 (0.0%) | 0 (0.0%) |
| Legal Services & Support | 0 (0.0%) | 0 (0.0%) |
| Education Instruction & Library | 55 (65.5%) | 29 (34.5%) |
| Arts, Media & Entertainment | 3 (100.0%) | 0 (0.0%) |
| Health Diagnosing & Treating | 0 (0.0%) | 1 (100.0%) |
| Health Technologists | 0 (0.0%) | 0 (0.0%) |
| Total (Category) | 78 (65.0%) | 42 (35.0%) |
| Total (Overall) | 297 (59.8%) | 200 (40.2%) |
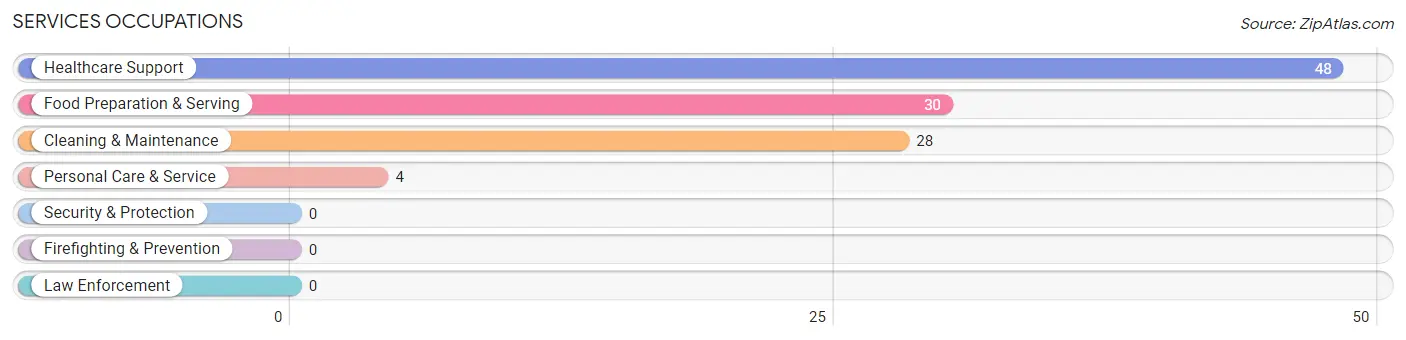
Services Occupations
The most common Services occupations in Cairo are Healthcare Support (48 | 9.7%), Food Preparation & Serving (30 | 6.0%), Cleaning & Maintenance (28 | 5.6%), and Personal Care & Service (4 | 0.8%).
Services Occupations by Sex
Within the Services occupations in Cairo, the most male-oriented occupations are Cleaning & Maintenance (100.0%), and Food Preparation & Serving (16.7%), while the most female-oriented occupations are Healthcare Support (100.0%), Personal Care & Service (100.0%), and Food Preparation & Serving (83.3%).
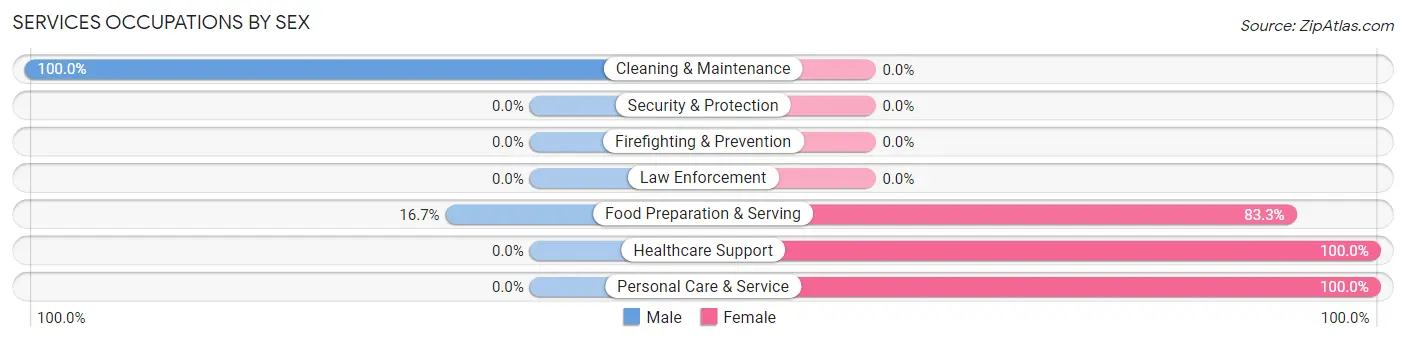
| Occupation | Male | Female |
| Healthcare Support | 0 (0.0%) | 48 (100.0%) |
| Security & Protection | 0 (0.0%) | 0 (0.0%) |
| Firefighting & Prevention | 0 (0.0%) | 0 (0.0%) |
| Law Enforcement | 0 (0.0%) | 0 (0.0%) |
| Food Preparation & Serving | 5 (16.7%) | 25 (83.3%) |
| Cleaning & Maintenance | 28 (100.0%) | 0 (0.0%) |
| Personal Care & Service | 0 (0.0%) | 4 (100.0%) |
| Total (Category) | 33 (30.0%) | 77 (70.0%) |
| Total (Overall) | 297 (59.8%) | 200 (40.2%) |
Sales and Office Occupations
The most common Sales and Office occupations in Cairo are Office & Administration (110 | 22.1%), and Sales & Related (67 | 13.5%).

Sales and Office Occupations by Sex
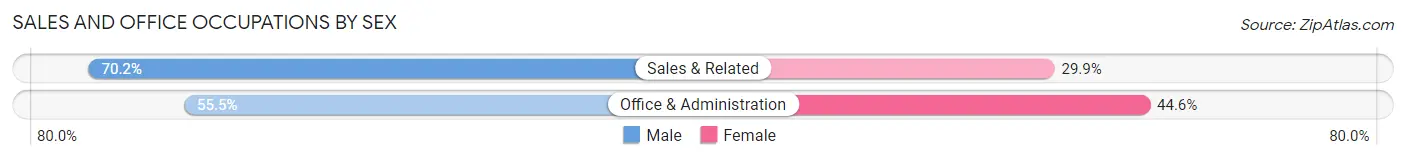
| Occupation | Male | Female |
| Sales & Related | 47 (70.2%) | 20 (29.8%) |
| Office & Administration | 61 (55.4%) | 49 (44.6%) |
| Total (Category) | 108 (61.0%) | 69 (39.0%) |
| Total (Overall) | 297 (59.8%) | 200 (40.2%) |
Natural Resources, Construction and Maintenance Occupations
The most common Natural Resources, Construction and Maintenance occupations in Cairo are , and Construction & Extraction (19 | 3.8%).
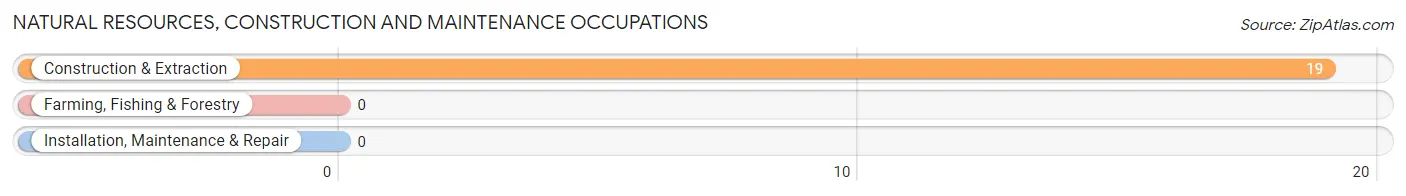
Natural Resources, Construction and Maintenance Occupations by Sex
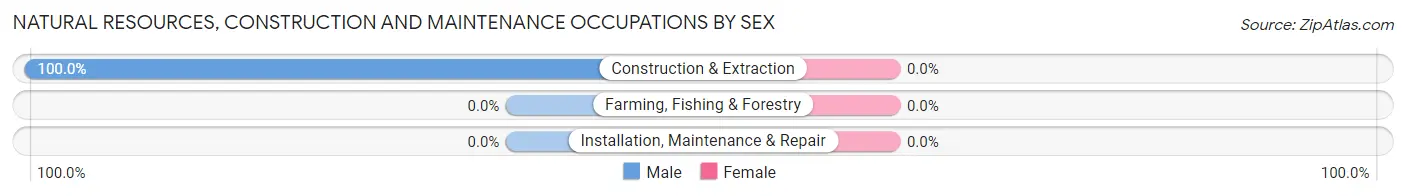
| Occupation | Male | Female |
| Farming, Fishing & Forestry | 0 (0.0%) | 0 (0.0%) |
| Construction & Extraction | 19 (100.0%) | 0 (0.0%) |
| Installation, Maintenance & Repair | 0 (0.0%) | 0 (0.0%) |
| Total (Category) | 19 (100.0%) | 0 (0.0%) |
| Total (Overall) | 297 (59.8%) | 200 (40.2%) |
Production, Transportation and Moving Occupations
The most common Production, Transportation and Moving occupations in Cairo are Production (35 | 7.0%), Transportation (19 | 3.8%), and Material Moving (17 | 3.4%).
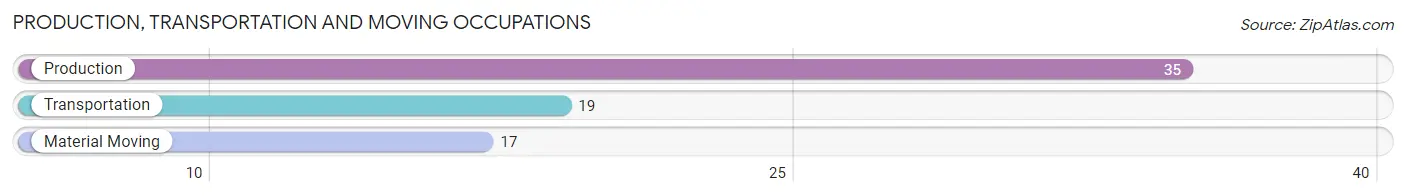
Production, Transportation and Moving Occupations by Sex
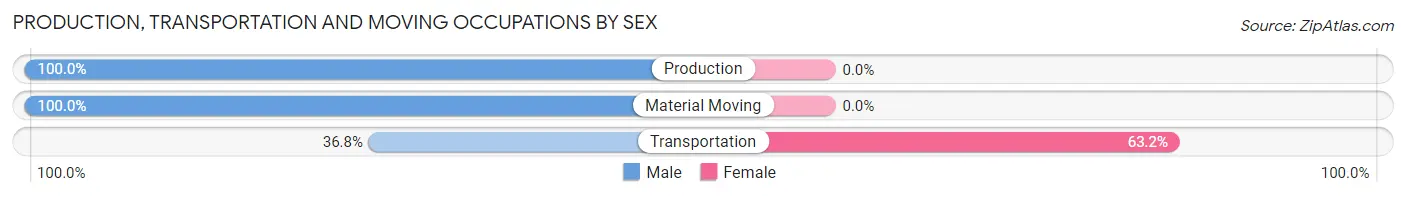
| Occupation | Male | Female |
| Production | 35 (100.0%) | 0 (0.0%) |
| Transportation | 7 (36.8%) | 12 (63.2%) |
| Material Moving | 17 (100.0%) | 0 (0.0%) |
| Total (Category) | 59 (83.1%) | 12 (16.9%) |
| Total (Overall) | 297 (59.8%) | 200 (40.2%) |
Employment Industries by Sex in Cairo
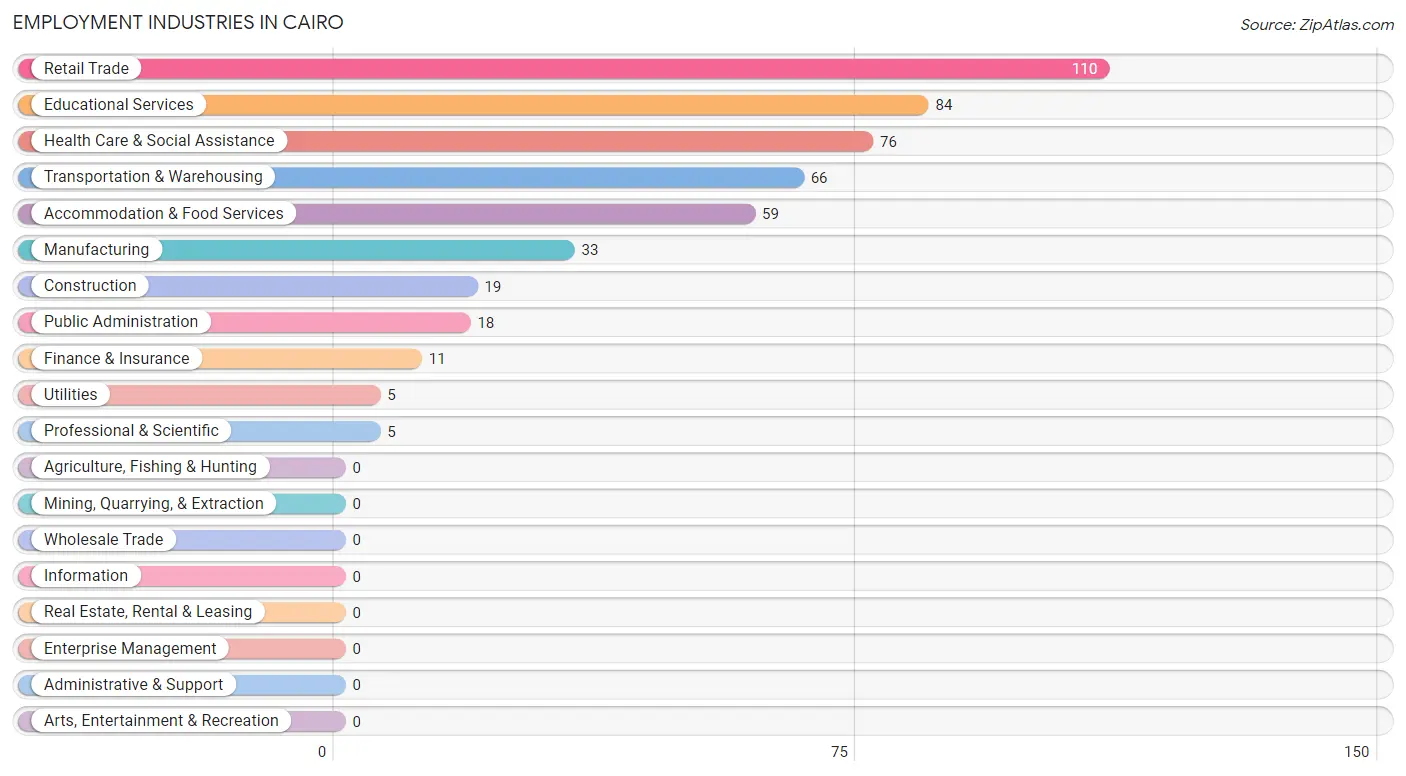
Employment Industries in Cairo
The major employment industries in Cairo include Retail Trade (110 | 22.1%), Educational Services (84 | 16.9%), Health Care & Social Assistance (76 | 15.3%), Transportation & Warehousing (66 | 13.3%), and Accommodation & Food Services (59 | 11.9%).
Employment Industries by Sex in Cairo
The Cairo industries that see more men than women are Construction (100.0%), Manufacturing (100.0%), and Utilities (100.0%), whereas the industries that tend to have a higher number of women are Finance & Insurance (100.0%), Professional & Scientific (100.0%), and Health Care & Social Assistance (98.7%).
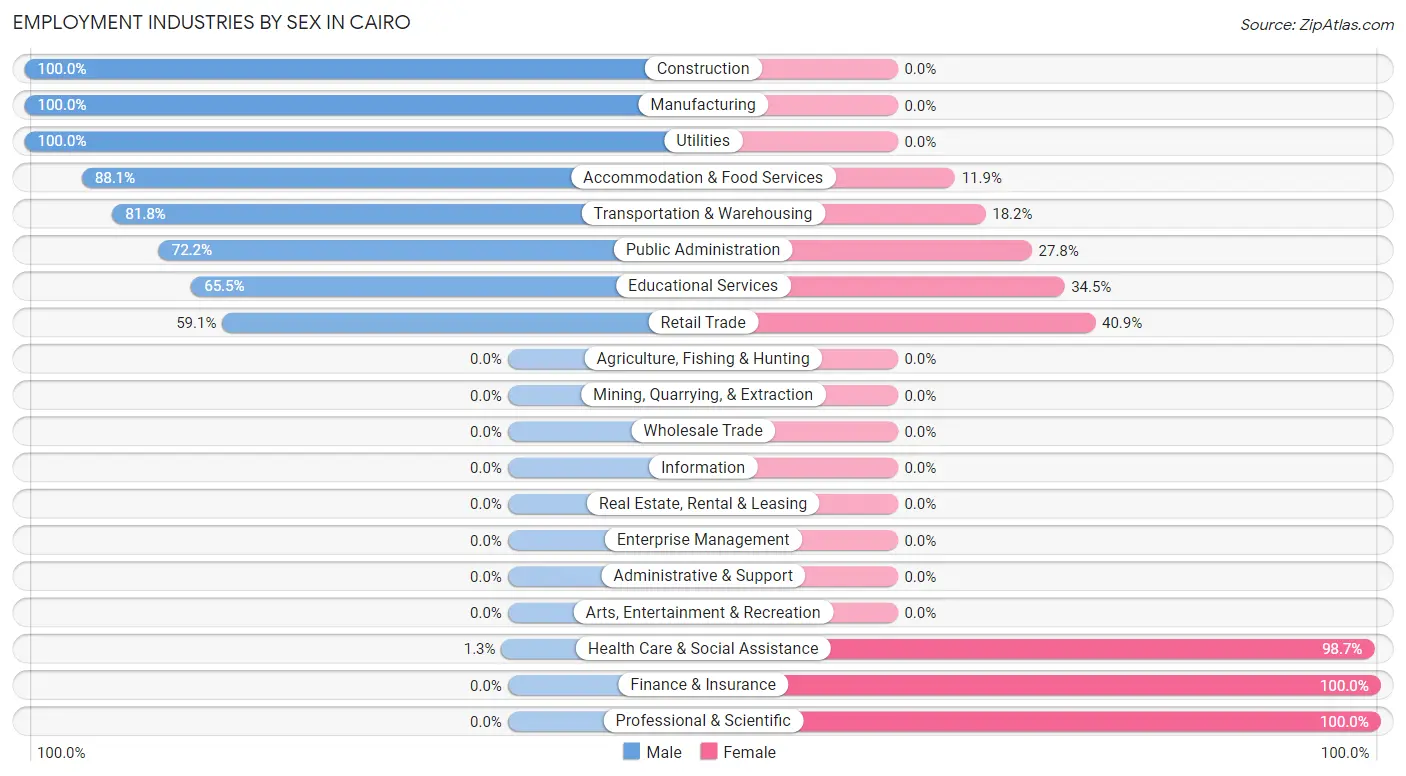
| Industry | Male | Female |
| Agriculture, Fishing & Hunting | 0 (0.0%) | 0 (0.0%) |
| Mining, Quarrying, & Extraction | 0 (0.0%) | 0 (0.0%) |
| Construction | 19 (100.0%) | 0 (0.0%) |
| Manufacturing | 33 (100.0%) | 0 (0.0%) |
| Wholesale Trade | 0 (0.0%) | 0 (0.0%) |
| Retail Trade | 65 (59.1%) | 45 (40.9%) |
| Transportation & Warehousing | 54 (81.8%) | 12 (18.2%) |
| Utilities | 5 (100.0%) | 0 (0.0%) |
| Information | 0 (0.0%) | 0 (0.0%) |
| Finance & Insurance | 0 (0.0%) | 11 (100.0%) |
| Real Estate, Rental & Leasing | 0 (0.0%) | 0 (0.0%) |
| Professional & Scientific | 0 (0.0%) | 5 (100.0%) |
| Enterprise Management | 0 (0.0%) | 0 (0.0%) |
| Administrative & Support | 0 (0.0%) | 0 (0.0%) |
| Educational Services | 55 (65.5%) | 29 (34.5%) |
| Health Care & Social Assistance | 1 (1.3%) | 75 (98.7%) |
| Arts, Entertainment & Recreation | 0 (0.0%) | 0 (0.0%) |
| Accommodation & Food Services | 52 (88.1%) | 7 (11.9%) |
| Public Administration | 13 (72.2%) | 5 (27.8%) |
| Total | 297 (59.8%) | 200 (40.2%) |
Education in Cairo
School Enrollment in Cairo
The most common levels of schooling among the 373 students in Cairo are high school (147 | 39.4%), elementary school (137 | 36.7%), and nursery / preschool (54 | 14.5%).
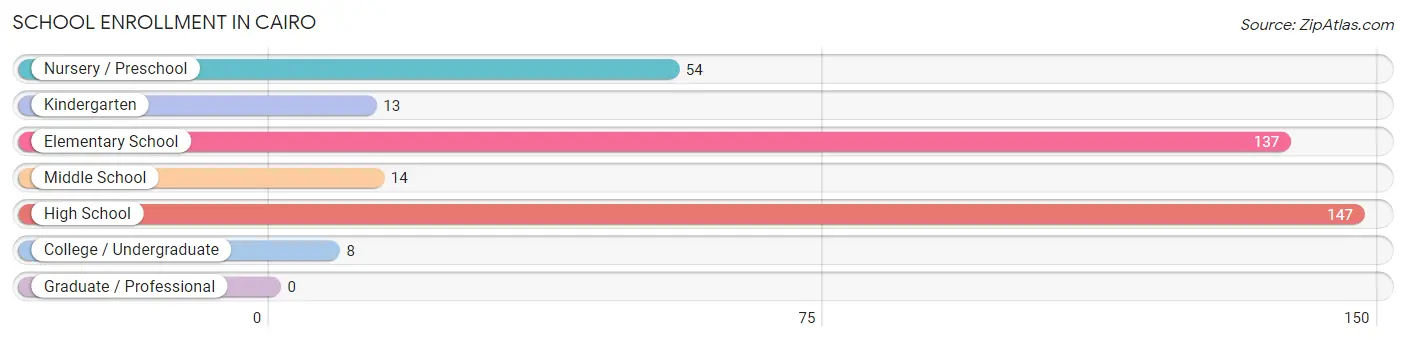
| School Level | # Students | % Students |
| Nursery / Preschool | 54 | 14.5% |
| Kindergarten | 13 | 3.5% |
| Elementary School | 137 | 36.7% |
| Middle School | 14 | 3.7% |
| High School | 147 | 39.4% |
| College / Undergraduate | 8 | 2.1% |
| Graduate / Professional | 0 | 0.0% |
| Total | 373 | 100.0% |
School Enrollment by Age by Funding Source in Cairo
Out of a total of 373 students who are enrolled in schools in Cairo, 13 (3.5%) attend a private institution, while the remaining 360 (96.5%) are enrolled in public schools. The age group of 5 to 9 year old has the highest likelihood of being enrolled in private schools, with 13 (8.3% in the age bracket) enrolled. Conversely, the age group of 3 to 4 year olds has the lowest likelihood of being enrolled in a private school, with 48 (100.0% in the age bracket) attending a public institution.
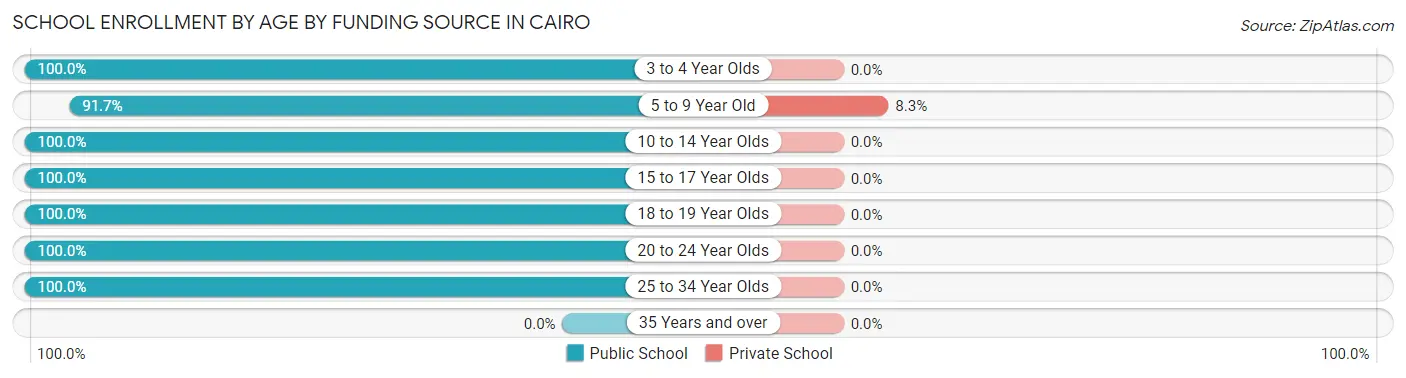
| Age Bracket | Public School | Private School |
| 3 to 4 Year Olds | 48 (100.0%) | 0 (0.0%) |
| 5 to 9 Year Old | 143 (91.7%) | 13 (8.3%) |
| 10 to 14 Year Olds | 14 (100.0%) | 0 (0.0%) |
| 15 to 17 Year Olds | 71 (100.0%) | 0 (0.0%) |
| 18 to 19 Year Olds | 74 (100.0%) | 0 (0.0%) |
| 20 to 24 Year Olds | 7 (100.0%) | 0 (0.0%) |
| 25 to 34 Year Olds | 3 (100.0%) | 0 (0.0%) |
| 35 Years and over | 0 (0.0%) | 0 (0.0%) |
| Total | 360 (96.5%) | 13 (3.5%) |
Educational Attainment by Field of Study in Cairo
Education (94 | 44.1%), computers & mathematics (55 | 25.8%), business (24 | 11.3%), engineering (12 | 5.6%), and social sciences (11 | 5.2%) are the most common fields of study among 213 individuals in Cairo who have obtained a bachelor's degree or higher.
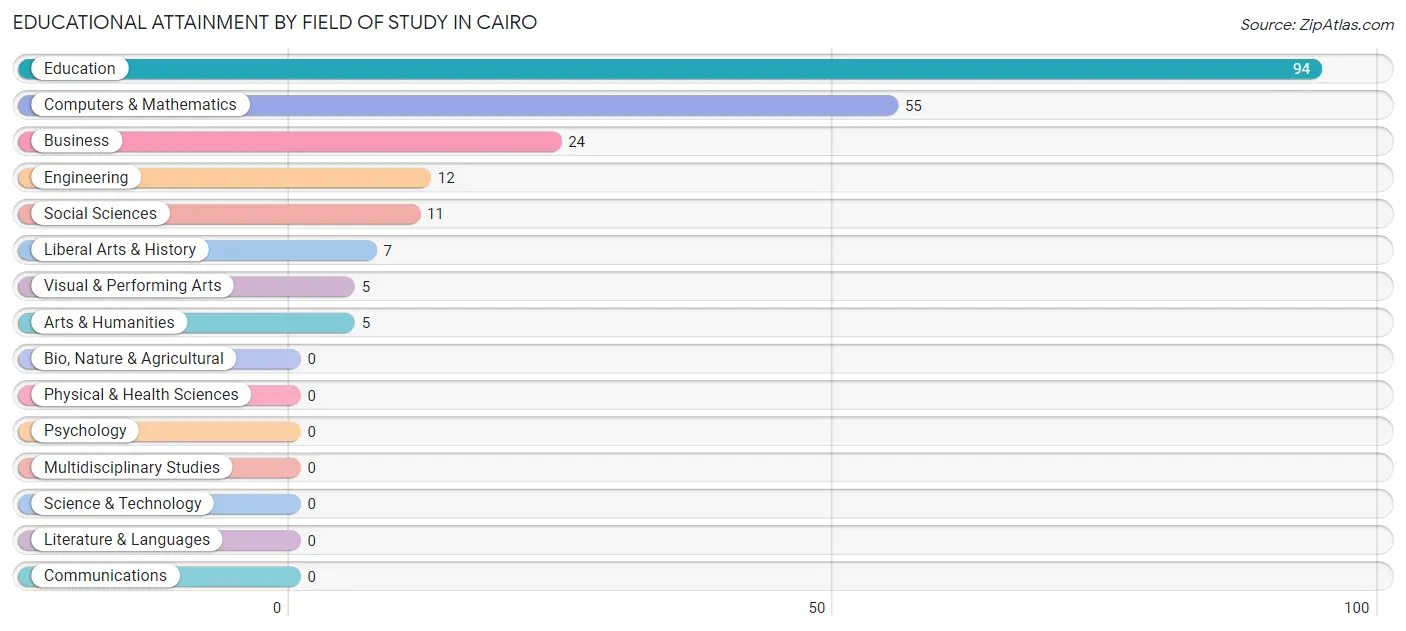
| Field of Study | # Graduates | % Graduates |
| Computers & Mathematics | 55 | 25.8% |
| Bio, Nature & Agricultural | 0 | 0.0% |
| Physical & Health Sciences | 0 | 0.0% |
| Psychology | 0 | 0.0% |
| Social Sciences | 11 | 5.2% |
| Engineering | 12 | 5.6% |
| Multidisciplinary Studies | 0 | 0.0% |
| Science & Technology | 0 | 0.0% |
| Business | 24 | 11.3% |
| Education | 94 | 44.1% |
| Literature & Languages | 0 | 0.0% |
| Liberal Arts & History | 7 | 3.3% |
| Visual & Performing Arts | 5 | 2.4% |
| Communications | 0 | 0.0% |
| Arts & Humanities | 5 | 2.4% |
| Total | 213 | 100.0% |
Transportation & Commute in Cairo
Vehicle Availability by Sex in Cairo
The most prevalent vehicle ownership categories in Cairo are males with 2 vehicles (113, accounting for 38.2%) and females with 2 vehicles (79, making up 56.5%).
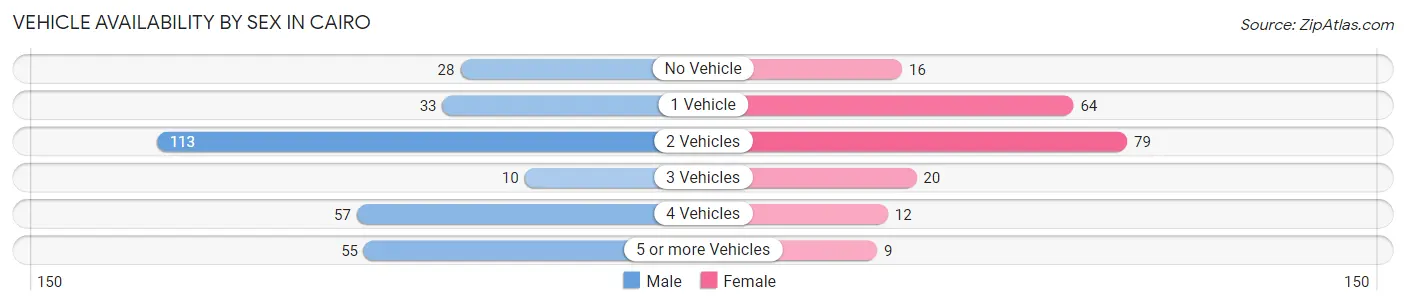
| Vehicles Available | Male | Female |
| No Vehicle | 28 (9.5%) | 16 (8.0%) |
| 1 Vehicle | 33 (11.2%) | 64 (32.0%) |
| 2 Vehicles | 113 (38.2%) | 79 (39.5%) |
| 3 Vehicles | 10 (3.4%) | 20 (10.0%) |
| 4 Vehicles | 57 (19.3%) | 12 (6.0%) |
| 5 or more Vehicles | 55 (18.6%) | 9 (4.5%) |
| Total | 296 (100.0%) | 200 (100.0%) |
Commute Time in Cairo
The most frequently occuring commute durations in Cairo are 5 to 9 minutes (141 commuters, 28.7%), 10 to 14 minutes (116 commuters, 23.6%), and 30 to 34 minutes (63 commuters, 12.8%).
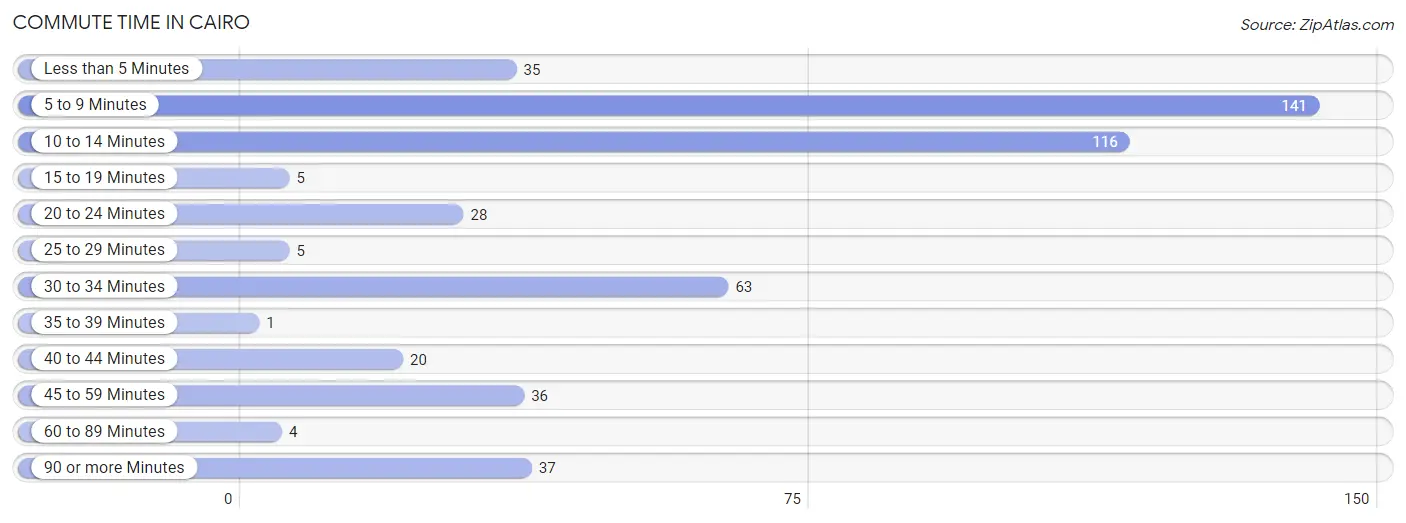
| Commute Time | # Commuters | % Commuters |
| Less than 5 Minutes | 35 | 7.1% |
| 5 to 9 Minutes | 141 | 28.7% |
| 10 to 14 Minutes | 116 | 23.6% |
| 15 to 19 Minutes | 5 | 1.0% |
| 20 to 24 Minutes | 28 | 5.7% |
| 25 to 29 Minutes | 5 | 1.0% |
| 30 to 34 Minutes | 63 | 12.8% |
| 35 to 39 Minutes | 1 | 0.2% |
| 40 to 44 Minutes | 20 | 4.1% |
| 45 to 59 Minutes | 36 | 7.3% |
| 60 to 89 Minutes | 4 | 0.8% |
| 90 or more Minutes | 37 | 7.5% |
Commute Time by Sex in Cairo
The most common commute times in Cairo are 5 to 9 minutes (78 commuters, 26.6%) for males and 5 to 9 minutes (63 commuters, 31.8%) for females.
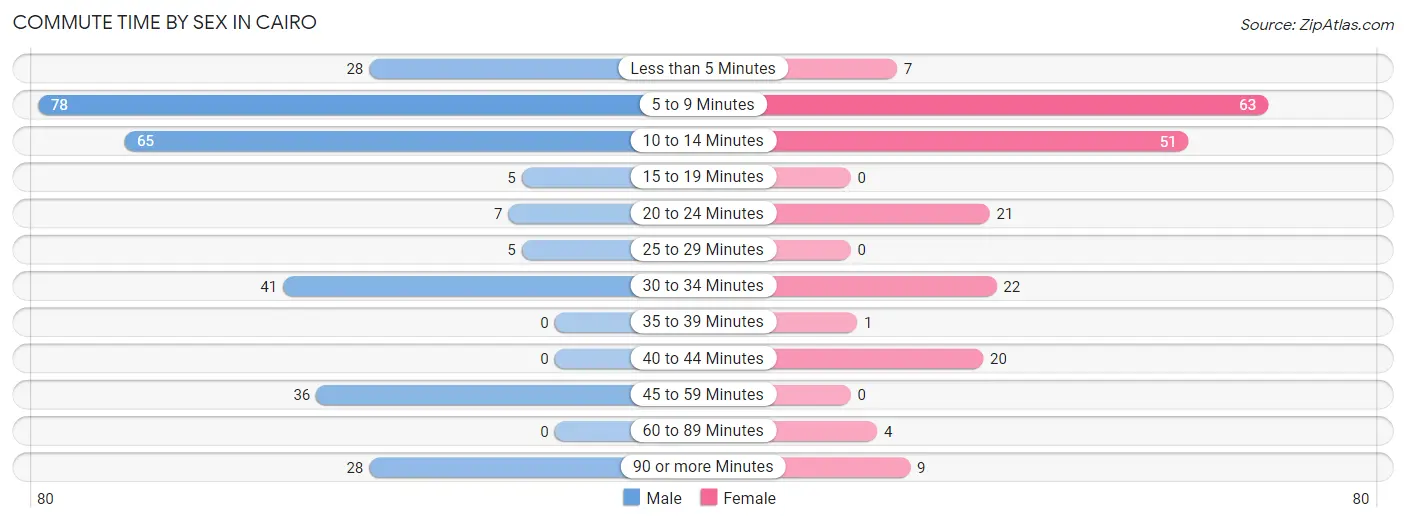
| Commute Time | Male | Female |
| Less than 5 Minutes | 28 (9.6%) | 7 (3.5%) |
| 5 to 9 Minutes | 78 (26.6%) | 63 (31.8%) |
| 10 to 14 Minutes | 65 (22.2%) | 51 (25.8%) |
| 15 to 19 Minutes | 5 (1.7%) | 0 (0.0%) |
| 20 to 24 Minutes | 7 (2.4%) | 21 (10.6%) |
| 25 to 29 Minutes | 5 (1.7%) | 0 (0.0%) |
| 30 to 34 Minutes | 41 (14.0%) | 22 (11.1%) |
| 35 to 39 Minutes | 0 (0.0%) | 1 (0.5%) |
| 40 to 44 Minutes | 0 (0.0%) | 20 (10.1%) |
| 45 to 59 Minutes | 36 (12.3%) | 0 (0.0%) |
| 60 to 89 Minutes | 0 (0.0%) | 4 (2.0%) |
| 90 or more Minutes | 28 (9.6%) | 9 (4.5%) |
Time of Departure to Work by Sex in Cairo
The most frequent times of departure to work in Cairo are 7:30 AM to 7:59 AM (76, 25.9%) for males and 7:30 AM to 7:59 AM (71, 35.9%) for females.
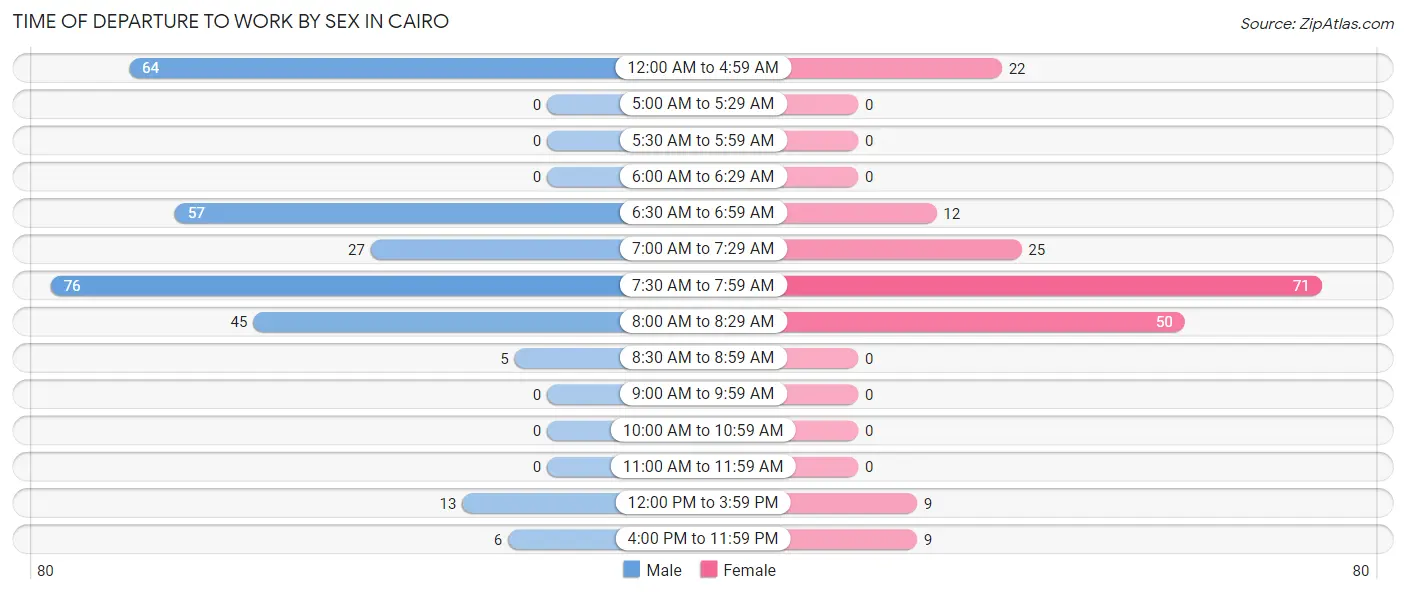
| Time of Departure | Male | Female |
| 12:00 AM to 4:59 AM | 64 (21.8%) | 22 (11.1%) |
| 5:00 AM to 5:29 AM | 0 (0.0%) | 0 (0.0%) |
| 5:30 AM to 5:59 AM | 0 (0.0%) | 0 (0.0%) |
| 6:00 AM to 6:29 AM | 0 (0.0%) | 0 (0.0%) |
| 6:30 AM to 6:59 AM | 57 (19.5%) | 12 (6.1%) |
| 7:00 AM to 7:29 AM | 27 (9.2%) | 25 (12.6%) |
| 7:30 AM to 7:59 AM | 76 (25.9%) | 71 (35.9%) |
| 8:00 AM to 8:29 AM | 45 (15.4%) | 50 (25.3%) |
| 8:30 AM to 8:59 AM | 5 (1.7%) | 0 (0.0%) |
| 9:00 AM to 9:59 AM | 0 (0.0%) | 0 (0.0%) |
| 10:00 AM to 10:59 AM | 0 (0.0%) | 0 (0.0%) |
| 11:00 AM to 11:59 AM | 0 (0.0%) | 0 (0.0%) |
| 12:00 PM to 3:59 PM | 13 (4.4%) | 9 (4.5%) |
| 4:00 PM to 11:59 PM | 6 (2.1%) | 9 (4.5%) |
| Total | 293 (100.0%) | 198 (100.0%) |
Housing Occupancy in Cairo
Occupancy by Ownership in Cairo
Of the total 548 dwellings in Cairo, owner-occupied units account for 359 (65.5%), while renter-occupied units make up 189 (34.5%).
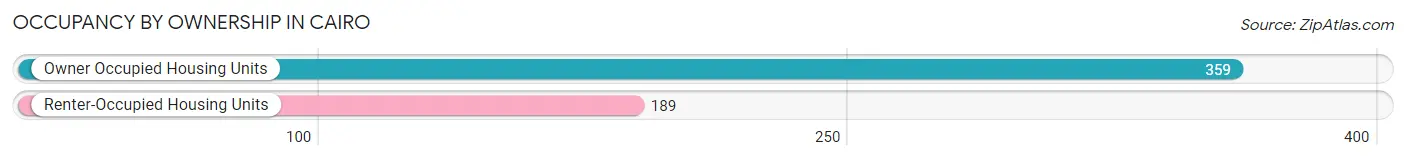
| Occupancy | # Housing Units | % Housing Units |
| Owner Occupied Housing Units | 359 | 65.5% |
| Renter-Occupied Housing Units | 189 | 34.5% |
| Total Occupied Housing Units | 548 | 100.0% |
Occupancy by Household Size in Cairo
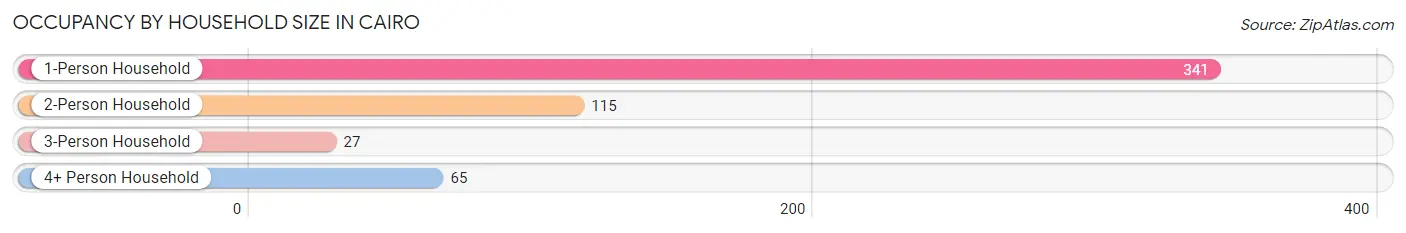
| Household Size | # Housing Units | % Housing Units |
| 1-Person Household | 341 | 62.2% |
| 2-Person Household | 115 | 21.0% |
| 3-Person Household | 27 | 4.9% |
| 4+ Person Household | 65 | 11.9% |
| Total Housing Units | 548 | 100.0% |
Occupancy by Ownership by Household Size in Cairo
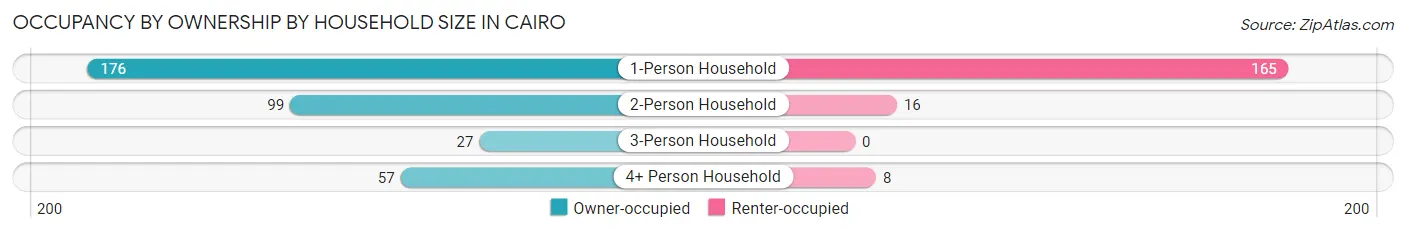
| Household Size | Owner-occupied | Renter-occupied |
| 1-Person Household | 176 (51.6%) | 165 (48.4%) |
| 2-Person Household | 99 (86.1%) | 16 (13.9%) |
| 3-Person Household | 27 (100.0%) | 0 (0.0%) |
| 4+ Person Household | 57 (87.7%) | 8 (12.3%) |
| Total Housing Units | 359 (65.5%) | 189 (34.5%) |
Occupancy by Educational Attainment in Cairo
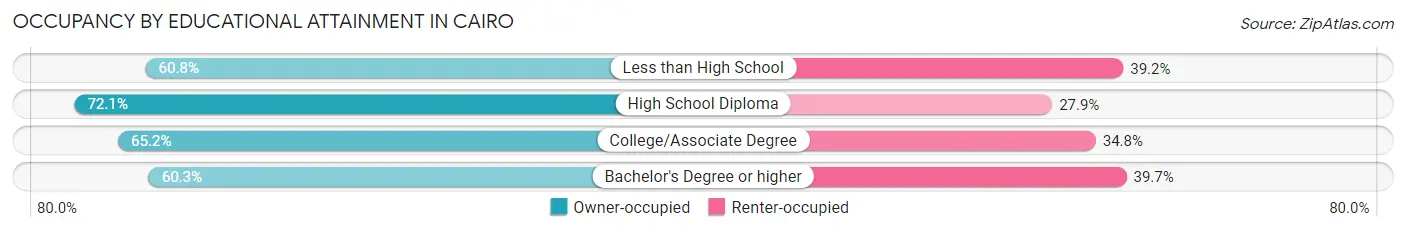
| Household Size | Owner-occupied | Renter-occupied |
| Less than High School | 76 (60.8%) | 49 (39.2%) |
| High School Diploma | 111 (72.1%) | 43 (27.9%) |
| College/Associate Degree | 131 (65.2%) | 70 (34.8%) |
| Bachelor's Degree or higher | 41 (60.3%) | 27 (39.7%) |
Occupancy by Age of Householder in Cairo
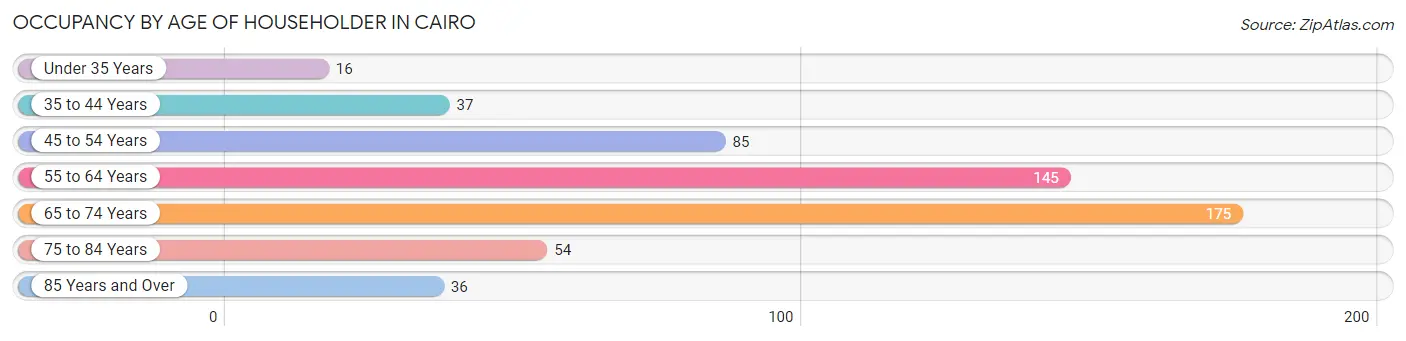
| Age Bracket | # Households | % Households |
| Under 35 Years | 16 | 2.9% |
| 35 to 44 Years | 37 | 6.8% |
| 45 to 54 Years | 85 | 15.5% |
| 55 to 64 Years | 145 | 26.5% |
| 65 to 74 Years | 175 | 31.9% |
| 75 to 84 Years | 54 | 9.9% |
| 85 Years and Over | 36 | 6.6% |
| Total | 548 | 100.0% |
Housing Finances in Cairo
Median Income by Occupancy in Cairo
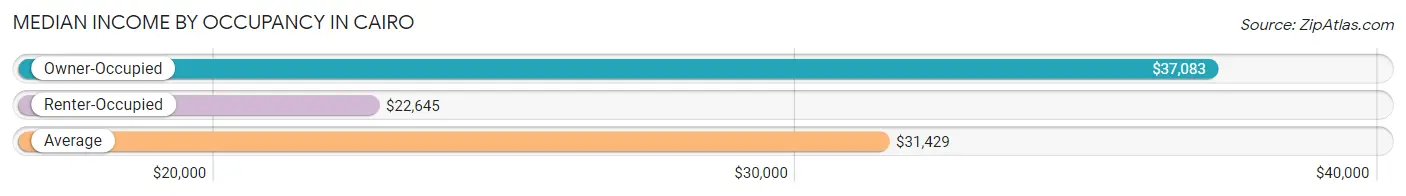
| Occupancy Type | # Households | Median Income |
| Owner-Occupied | 359 (65.5%) | $37,083 |
| Renter-Occupied | 189 (34.5%) | $22,645 |
| Average | 548 (100.0%) | $31,429 |
Occupancy by Householder Income Bracket in Cairo
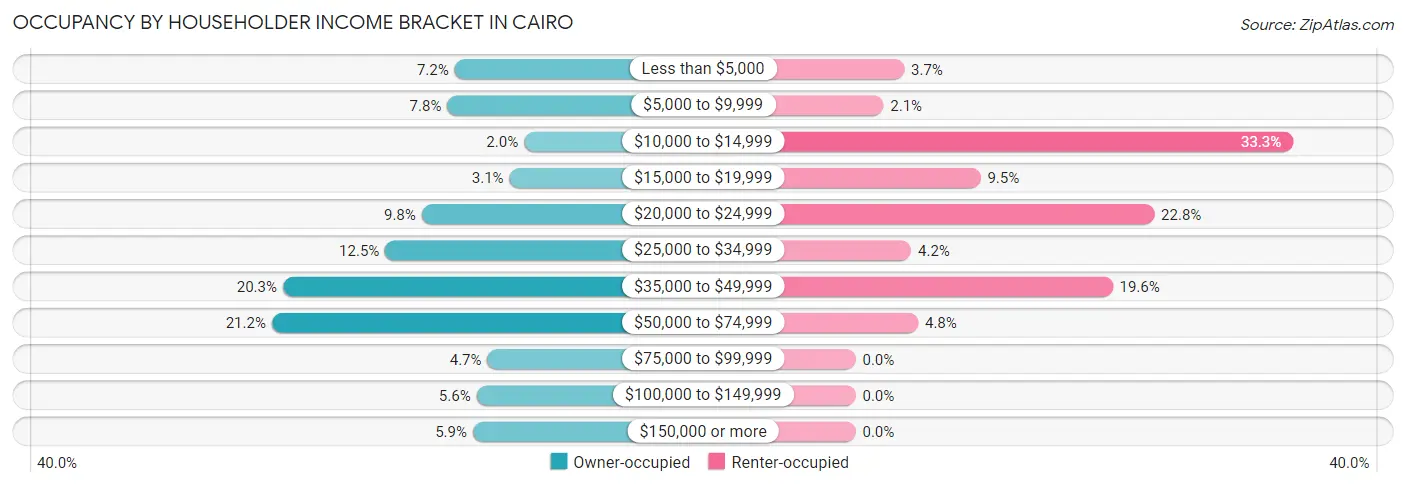
| Income Bracket | Owner-occupied | Renter-occupied |
| Less than $5,000 | 26 (7.2%) | 7 (3.7%) |
| $5,000 to $9,999 | 28 (7.8%) | 4 (2.1%) |
| $10,000 to $14,999 | 7 (1.9%) | 63 (33.3%) |
| $15,000 to $19,999 | 11 (3.1%) | 18 (9.5%) |
| $20,000 to $24,999 | 35 (9.8%) | 43 (22.8%) |
| $25,000 to $34,999 | 45 (12.5%) | 8 (4.2%) |
| $35,000 to $49,999 | 73 (20.3%) | 37 (19.6%) |
| $50,000 to $74,999 | 76 (21.2%) | 9 (4.8%) |
| $75,000 to $99,999 | 17 (4.7%) | 0 (0.0%) |
| $100,000 to $149,999 | 20 (5.6%) | 0 (0.0%) |
| $150,000 or more | 21 (5.9%) | 0 (0.0%) |
| Total | 359 (100.0%) | 189 (100.0%) |
Monthly Housing Cost Tiers in Cairo
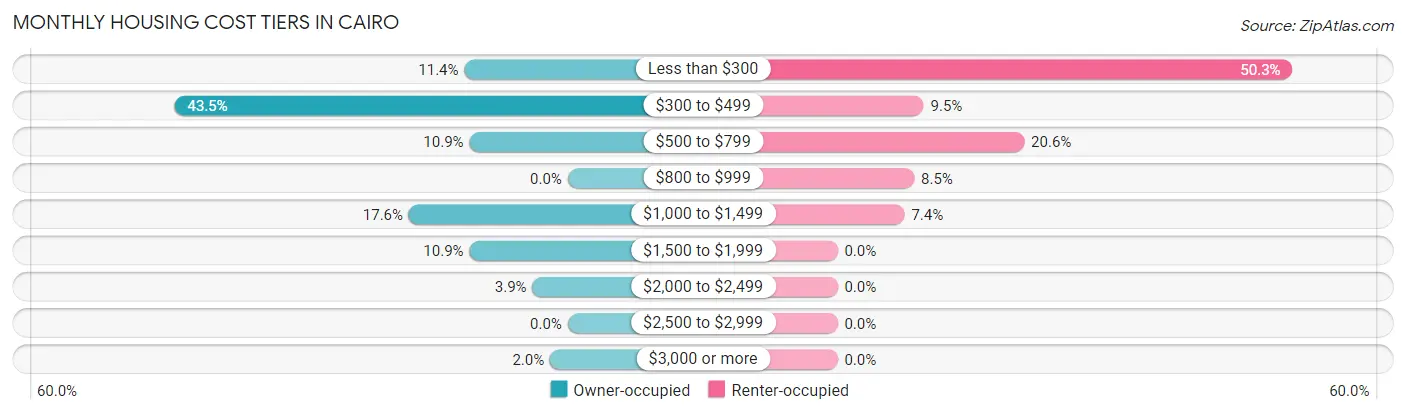
| Monthly Cost | Owner-occupied | Renter-occupied |
| Less than $300 | 41 (11.4%) | 95 (50.3%) |
| $300 to $499 | 156 (43.4%) | 18 (9.5%) |
| $500 to $799 | 39 (10.9%) | 39 (20.6%) |
| $800 to $999 | 0 (0.0%) | 16 (8.5%) |
| $1,000 to $1,499 | 63 (17.5%) | 14 (7.4%) |
| $1,500 to $1,999 | 39 (10.9%) | 0 (0.0%) |
| $2,000 to $2,499 | 14 (3.9%) | 0 (0.0%) |
| $2,500 to $2,999 | 0 (0.0%) | 0 (0.0%) |
| $3,000 or more | 7 (1.9%) | 0 (0.0%) |
| Total | 359 (100.0%) | 189 (100.0%) |
Physical Housing Characteristics in Cairo
Housing Structures in Cairo
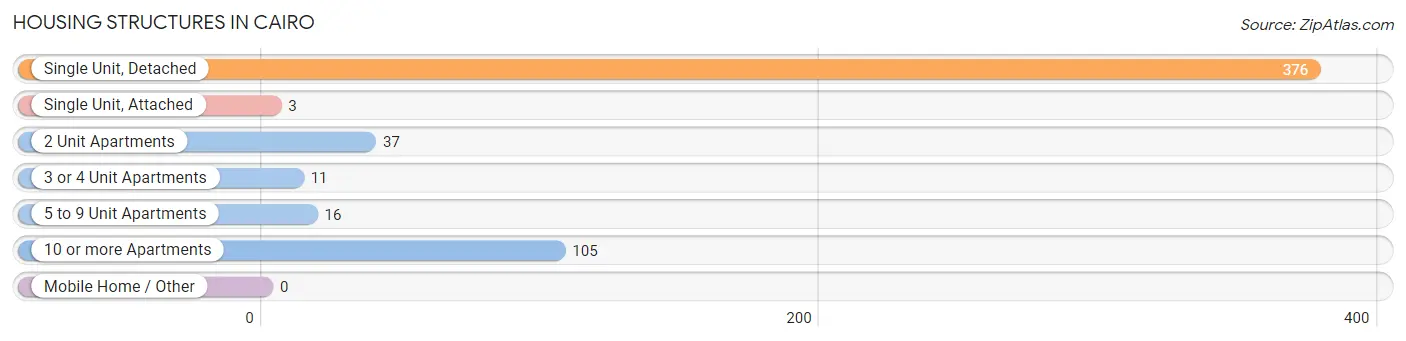
| Structure Type | # Housing Units | % Housing Units |
| Single Unit, Detached | 376 | 68.6% |
| Single Unit, Attached | 3 | 0.5% |
| 2 Unit Apartments | 37 | 6.8% |
| 3 or 4 Unit Apartments | 11 | 2.0% |
| 5 to 9 Unit Apartments | 16 | 2.9% |
| 10 or more Apartments | 105 | 19.2% |
| Mobile Home / Other | 0 | 0.0% |
| Total | 548 | 100.0% |
Housing Structures by Occupancy in Cairo
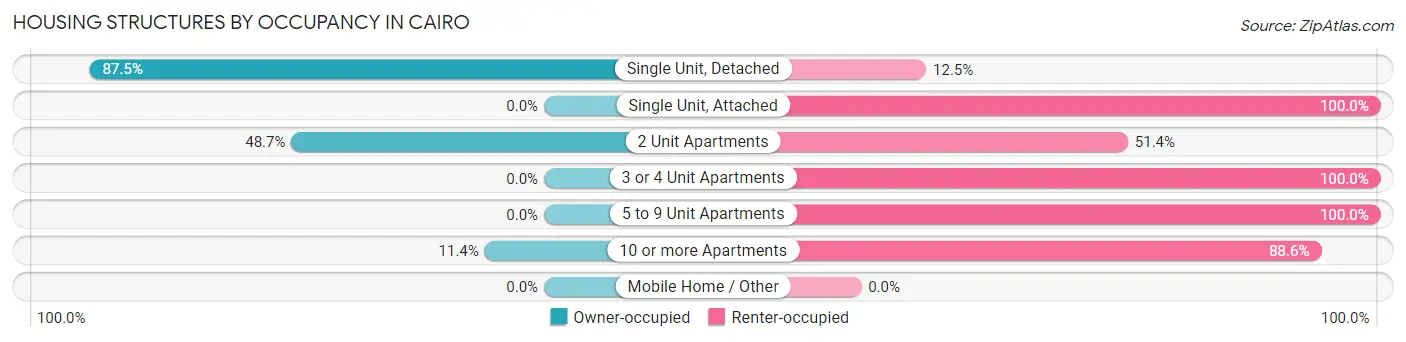
| Structure Type | Owner-occupied | Renter-occupied |
| Single Unit, Detached | 329 (87.5%) | 47 (12.5%) |
| Single Unit, Attached | 0 (0.0%) | 3 (100.0%) |
| 2 Unit Apartments | 18 (48.6%) | 19 (51.3%) |
| 3 or 4 Unit Apartments | 0 (0.0%) | 11 (100.0%) |
| 5 to 9 Unit Apartments | 0 (0.0%) | 16 (100.0%) |
| 10 or more Apartments | 12 (11.4%) | 93 (88.6%) |
| Mobile Home / Other | 0 (0.0%) | 0 (0.0%) |
| Total | 359 (65.5%) | 189 (34.5%) |
Housing Structures by Number of Rooms in Cairo
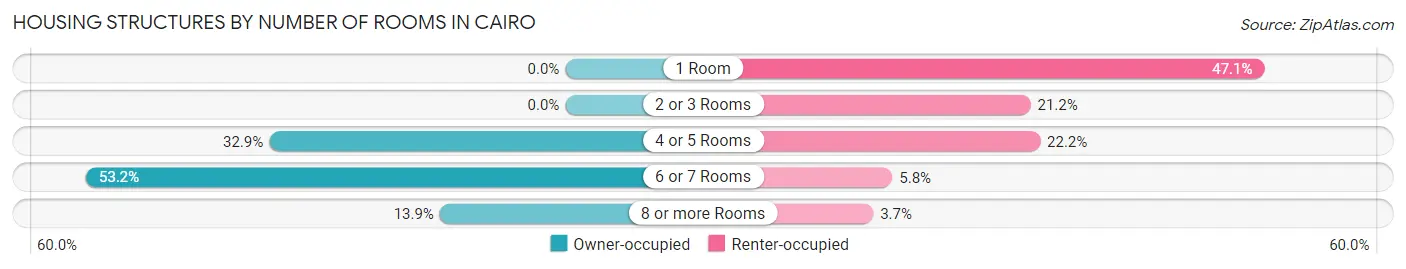
| Number of Rooms | Owner-occupied | Renter-occupied |
| 1 Room | 0 (0.0%) | 89 (47.1%) |
| 2 or 3 Rooms | 0 (0.0%) | 40 (21.2%) |
| 4 or 5 Rooms | 118 (32.9%) | 42 (22.2%) |
| 6 or 7 Rooms | 191 (53.2%) | 11 (5.8%) |
| 8 or more Rooms | 50 (13.9%) | 7 (3.7%) |
| Total | 359 (100.0%) | 189 (100.0%) |
Housing Structure by Heating Type in Cairo
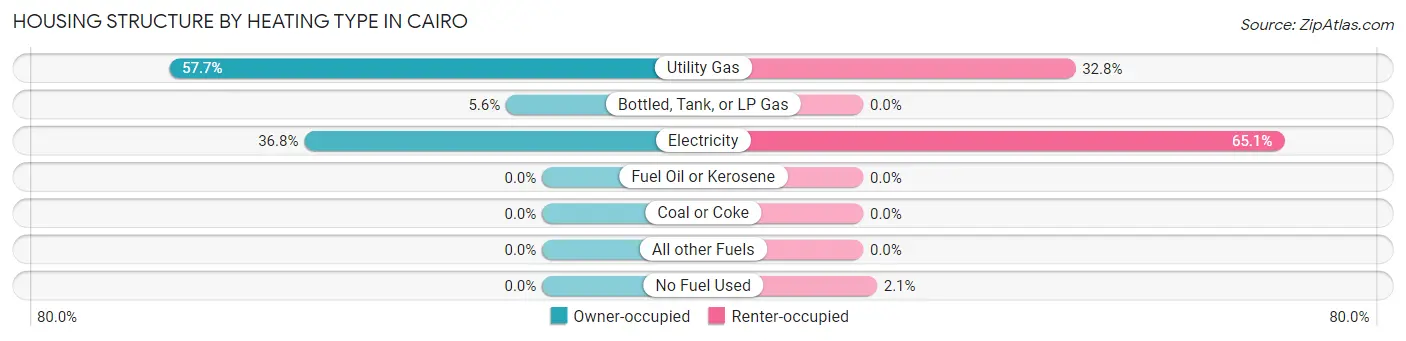
| Heating Type | Owner-occupied | Renter-occupied |
| Utility Gas | 207 (57.7%) | 62 (32.8%) |
| Bottled, Tank, or LP Gas | 20 (5.6%) | 0 (0.0%) |
| Electricity | 132 (36.8%) | 123 (65.1%) |
| Fuel Oil or Kerosene | 0 (0.0%) | 0 (0.0%) |
| Coal or Coke | 0 (0.0%) | 0 (0.0%) |
| All other Fuels | 0 (0.0%) | 0 (0.0%) |
| No Fuel Used | 0 (0.0%) | 4 (2.1%) |
| Total | 359 (100.0%) | 189 (100.0%) |
Household Vehicle Usage in Cairo
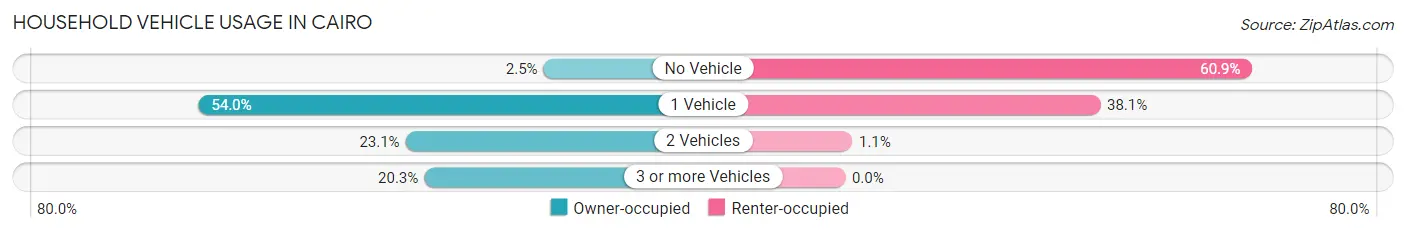
| Vehicles per Household | Owner-occupied | Renter-occupied |
| No Vehicle | 9 (2.5%) | 115 (60.9%) |
| 1 Vehicle | 194 (54.0%) | 72 (38.1%) |
| 2 Vehicles | 83 (23.1%) | 2 (1.1%) |
| 3 or more Vehicles | 73 (20.3%) | 0 (0.0%) |
| Total | 359 (100.0%) | 189 (100.0%) |
Real Estate & Mortgages in Cairo
Real Estate and Mortgage Overview in Cairo
| Characteristic | Without Mortgage | With Mortgage |
| Housing Units | 232 | 127 |
| Median Property Value | $24,400 | $163,600 |
| Median Household Income | $35,833 | $12 |
| Monthly Housing Costs | $431 | $0 |
| Real Estate Taxes | $367 | $13 |
Property Value by Mortgage Status in Cairo
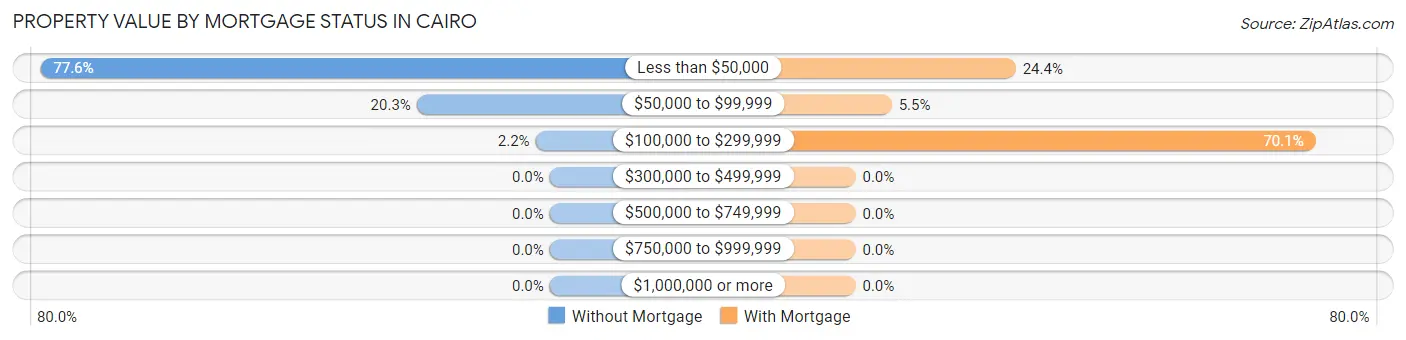
| Property Value | Without Mortgage | With Mortgage |
| Less than $50,000 | 180 (77.6%) | 31 (24.4%) |
| $50,000 to $99,999 | 47 (20.3%) | 7 (5.5%) |
| $100,000 to $299,999 | 5 (2.2%) | 89 (70.1%) |
| $300,000 to $499,999 | 0 (0.0%) | 0 (0.0%) |
| $500,000 to $749,999 | 0 (0.0%) | 0 (0.0%) |
| $750,000 to $999,999 | 0 (0.0%) | 0 (0.0%) |
| $1,000,000 or more | 0 (0.0%) | 0 (0.0%) |
| Total | 232 (100.0%) | 127 (100.0%) |
Household Income by Mortgage Status in Cairo
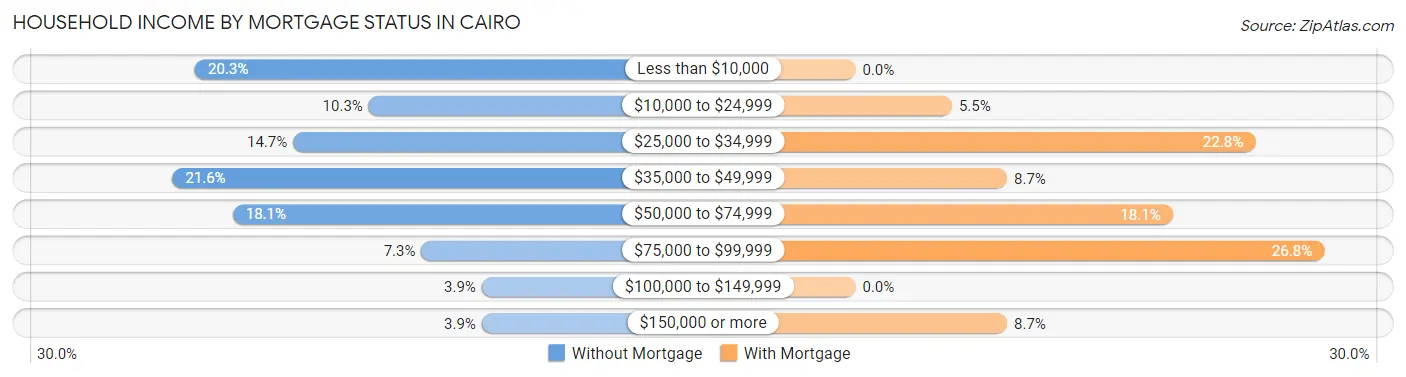
| Household Income | Without Mortgage | With Mortgage |
| Less than $10,000 | 47 (20.3%) | 0 (0.0%) |
| $10,000 to $24,999 | 24 (10.3%) | 7 (5.5%) |
| $25,000 to $34,999 | 34 (14.7%) | 29 (22.8%) |
| $35,000 to $49,999 | 50 (21.5%) | 11 (8.7%) |
| $50,000 to $74,999 | 42 (18.1%) | 23 (18.1%) |
| $75,000 to $99,999 | 17 (7.3%) | 34 (26.8%) |
| $100,000 to $149,999 | 9 (3.9%) | 0 (0.0%) |
| $150,000 or more | 9 (3.9%) | 11 (8.7%) |
| Total | 232 (100.0%) | 127 (100.0%) |
Property Value to Household Income Ratio in Cairo
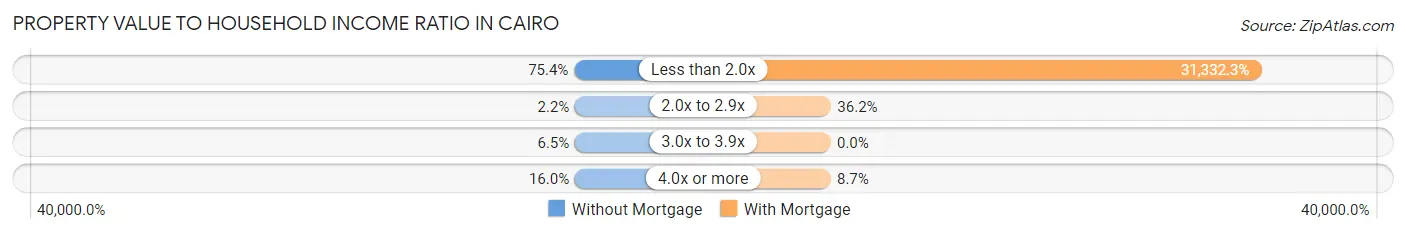
| Value-to-Income Ratio | Without Mortgage | With Mortgage |
| Less than 2.0x | 175 (75.4%) | 39,792 (31,332.3%) |
| 2.0x to 2.9x | 5 (2.2%) | 46 (36.2%) |
| 3.0x to 3.9x | 15 (6.5%) | 0 (0.0%) |
| 4.0x or more | 37 (16.0%) | 11 (8.7%) |
| Total | 232 (100.0%) | 127 (100.0%) |
Real Estate Taxes by Mortgage Status in Cairo
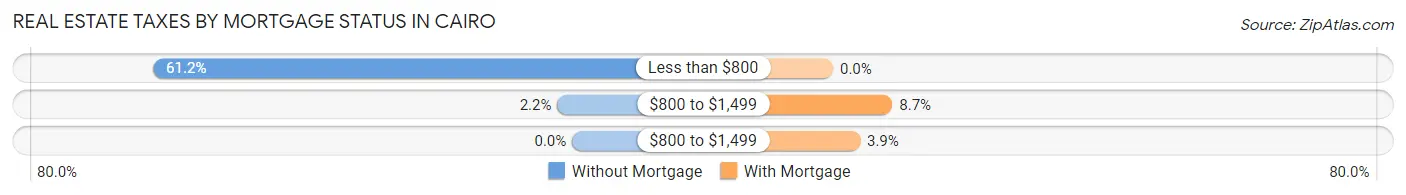
| Property Taxes | Without Mortgage | With Mortgage |
| Less than $800 | 142 (61.2%) | 0 (0.0%) |
| $800 to $1,499 | 5 (2.2%) | 11 (8.7%) |
| $800 to $1,499 | 0 (0.0%) | 5 (3.9%) |
| Total | 232 (100.0%) | 127 (100.0%) |
Health & Disability in Cairo
Health Insurance Coverage by Age in Cairo
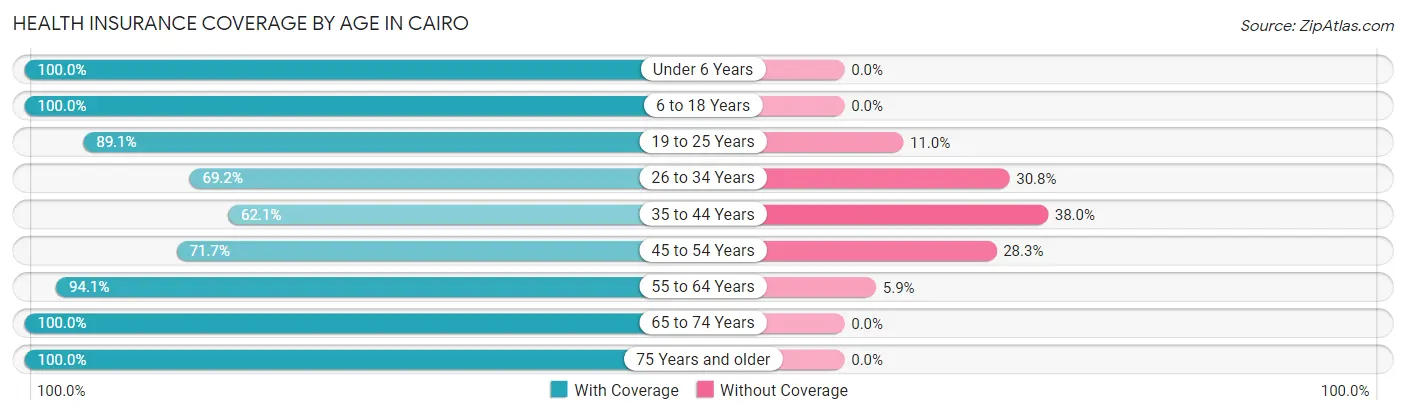
| Age Bracket | With Coverage | Without Coverage |
| Under 6 Years | 95 (100.0%) | 0 (0.0%) |
| 6 to 18 Years | 222 (100.0%) | 0 (0.0%) |
| 19 to 25 Years | 122 (89.0%) | 15 (11.0%) |
| 26 to 34 Years | 117 (69.2%) | 52 (30.8%) |
| 35 to 44 Years | 103 (62.1%) | 63 (38.0%) |
| 45 to 54 Years | 86 (71.7%) | 34 (28.3%) |
| 55 to 64 Years | 208 (94.1%) | 13 (5.9%) |
| 65 to 74 Years | 204 (100.0%) | 0 (0.0%) |
| 75 Years and older | 113 (100.0%) | 0 (0.0%) |
| Total | 1,270 (87.8%) | 177 (12.2%) |
Health Insurance Coverage by Citizenship Status in Cairo
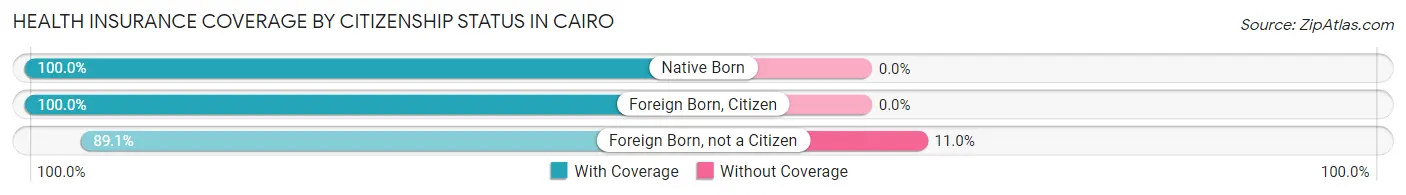
| Citizenship Status | With Coverage | Without Coverage |
| Native Born | 95 (100.0%) | 0 (0.0%) |
| Foreign Born, Citizen | 222 (100.0%) | 0 (0.0%) |
| Foreign Born, not a Citizen | 122 (89.0%) | 15 (11.0%) |
Health Insurance Coverage by Household Income in Cairo
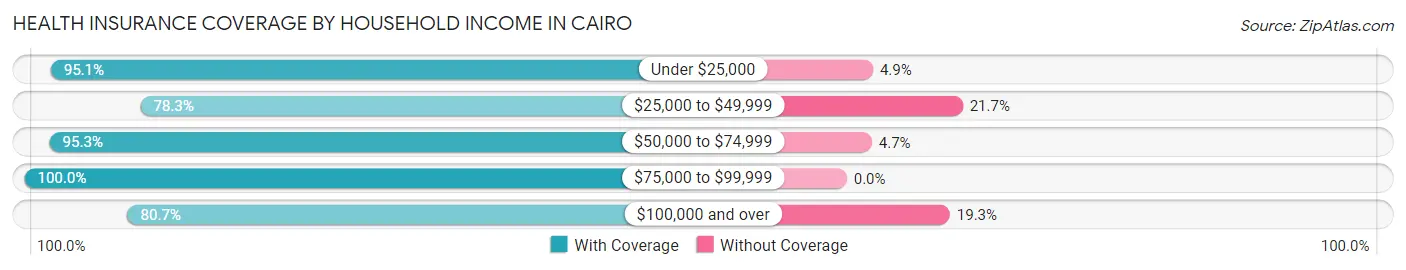
| Household Income | With Coverage | Without Coverage |
| Under $25,000 | 445 (95.1%) | 23 (4.9%) |
| $25,000 to $49,999 | 292 (78.3%) | 81 (21.7%) |
| $50,000 to $74,999 | 223 (95.3%) | 11 (4.7%) |
| $75,000 to $99,999 | 35 (100.0%) | 0 (0.0%) |
| $100,000 and over | 259 (80.7%) | 62 (19.3%) |
Public vs Private Health Insurance Coverage by Age in Cairo
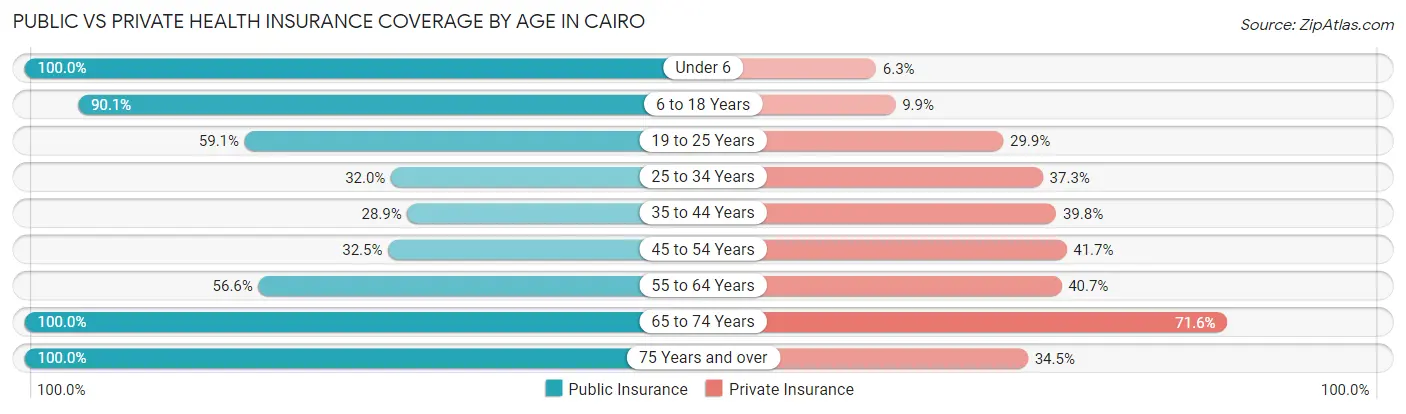
| Age Bracket | Public Insurance | Private Insurance |
| Under 6 | 95 (100.0%) | 6 (6.3%) |
| 6 to 18 Years | 200 (90.1%) | 22 (9.9%) |
| 19 to 25 Years | 81 (59.1%) | 41 (29.9%) |
| 25 to 34 Years | 54 (32.0%) | 63 (37.3%) |
| 35 to 44 Years | 48 (28.9%) | 66 (39.8%) |
| 45 to 54 Years | 39 (32.5%) | 50 (41.7%) |
| 55 to 64 Years | 125 (56.6%) | 90 (40.7%) |
| 65 to 74 Years | 204 (100.0%) | 146 (71.6%) |
| 75 Years and over | 113 (100.0%) | 39 (34.5%) |
| Total | 959 (66.3%) | 523 (36.1%) |
Disability Status by Sex by Age in Cairo
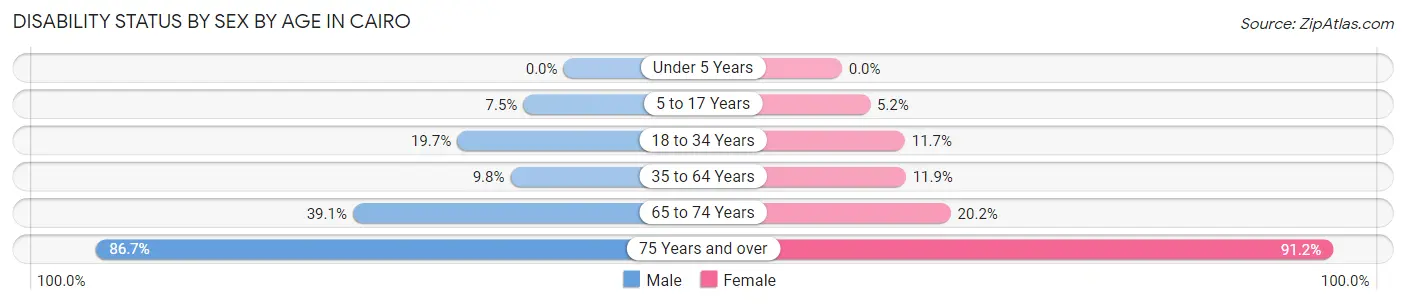
| Age Bracket | Male | Female |
| Under 5 Years | 0 (0.0%) | 0 (0.0%) |
| 5 to 17 Years | 7 (7.4%) | 8 (5.2%) |
| 18 to 34 Years | 30 (19.7%) | 18 (11.7%) |
| 35 to 64 Years | 25 (9.8%) | 30 (11.9%) |
| 65 to 74 Years | 43 (39.1%) | 19 (20.2%) |
| 75 Years and over | 39 (86.7%) | 62 (91.2%) |
Disability Class by Sex by Age in Cairo
Disability Class: Hearing Difficulty
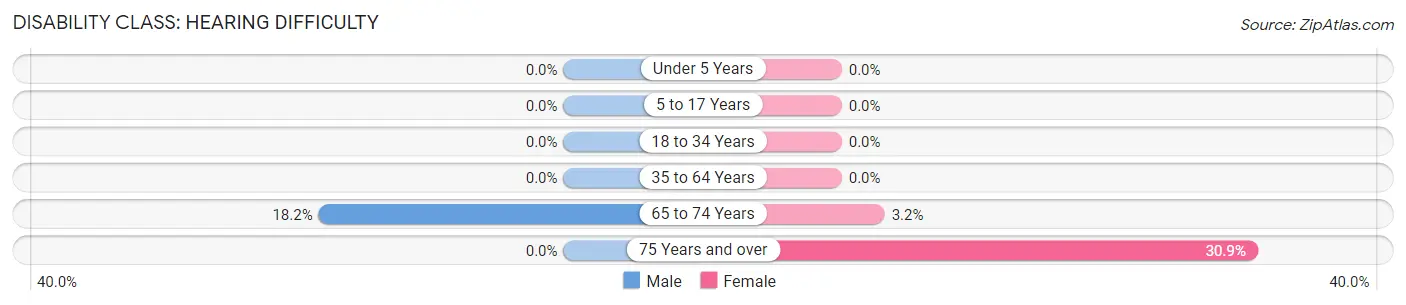
| Age Bracket | Male | Female |
| Under 5 Years | 0 (0.0%) | 0 (0.0%) |
| 5 to 17 Years | 0 (0.0%) | 0 (0.0%) |
| 18 to 34 Years | 0 (0.0%) | 0 (0.0%) |
| 35 to 64 Years | 0 (0.0%) | 0 (0.0%) |
| 65 to 74 Years | 20 (18.2%) | 3 (3.2%) |
| 75 Years and over | 0 (0.0%) | 21 (30.9%) |
Disability Class: Vision Difficulty
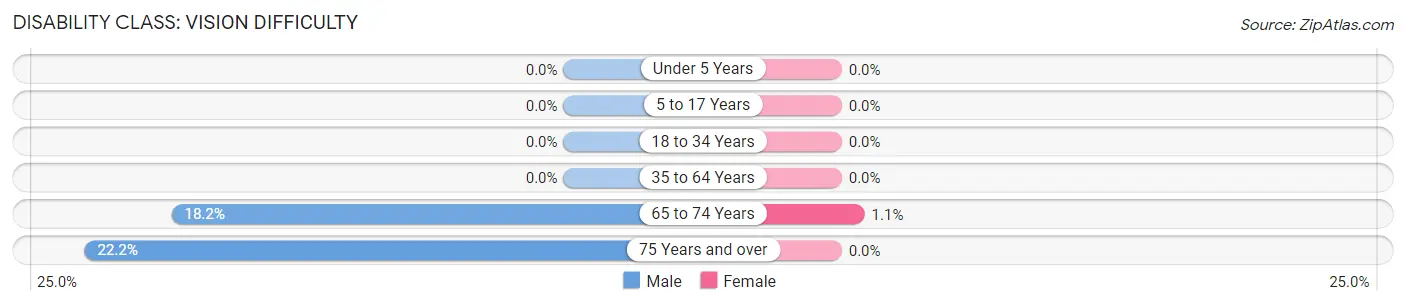
| Age Bracket | Male | Female |
| Under 5 Years | 0 (0.0%) | 0 (0.0%) |
| 5 to 17 Years | 0 (0.0%) | 0 (0.0%) |
| 18 to 34 Years | 0 (0.0%) | 0 (0.0%) |
| 35 to 64 Years | 0 (0.0%) | 0 (0.0%) |
| 65 to 74 Years | 20 (18.2%) | 1 (1.1%) |
| 75 Years and over | 10 (22.2%) | 0 (0.0%) |
Disability Class: Cognitive Difficulty
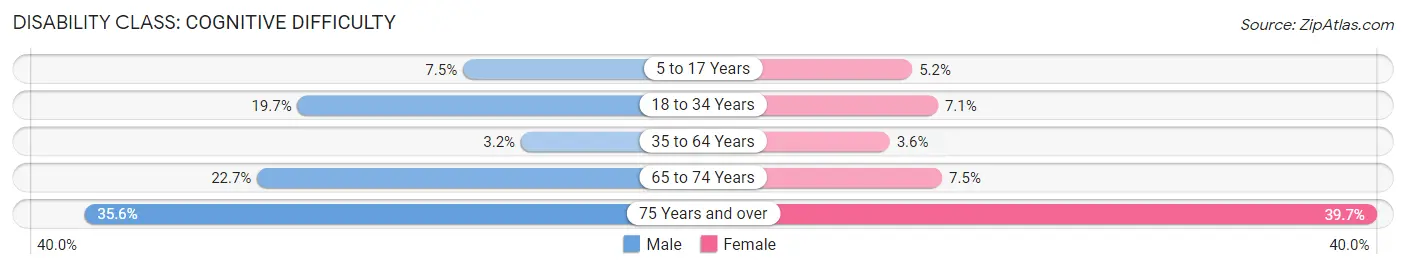
| Age Bracket | Male | Female |
| 5 to 17 Years | 7 (7.4%) | 8 (5.2%) |
| 18 to 34 Years | 30 (19.7%) | 11 (7.1%) |
| 35 to 64 Years | 8 (3.2%) | 9 (3.6%) |
| 65 to 74 Years | 25 (22.7%) | 7 (7.4%) |
| 75 Years and over | 16 (35.6%) | 27 (39.7%) |
Disability Class: Ambulatory Difficulty
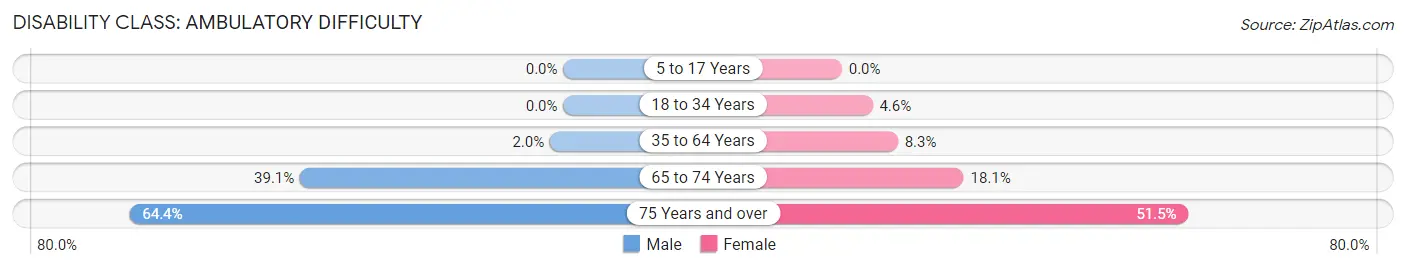
| Age Bracket | Male | Female |
| 5 to 17 Years | 0 (0.0%) | 0 (0.0%) |
| 18 to 34 Years | 0 (0.0%) | 7 (4.5%) |
| 35 to 64 Years | 5 (2.0%) | 21 (8.3%) |
| 65 to 74 Years | 43 (39.1%) | 17 (18.1%) |
| 75 Years and over | 29 (64.4%) | 35 (51.5%) |
Disability Class: Self-Care Difficulty
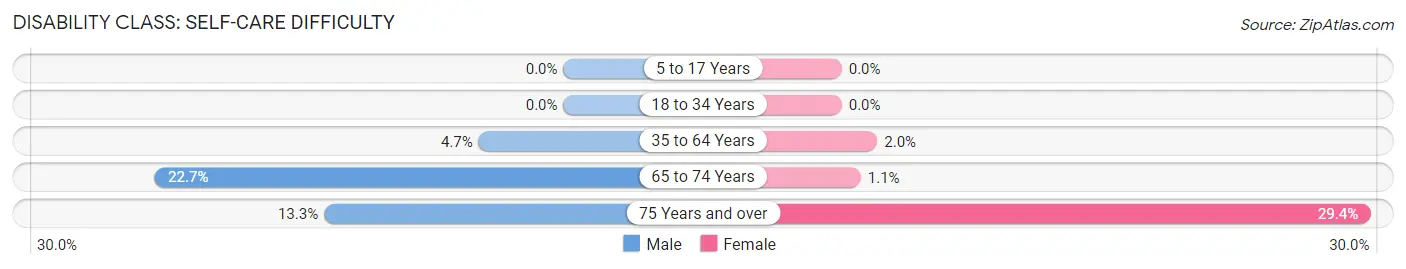
| Age Bracket | Male | Female |
| 5 to 17 Years | 0 (0.0%) | 0 (0.0%) |
| 18 to 34 Years | 0 (0.0%) | 0 (0.0%) |
| 35 to 64 Years | 12 (4.7%) | 5 (2.0%) |
| 65 to 74 Years | 25 (22.7%) | 1 (1.1%) |
| 75 Years and over | 6 (13.3%) | 20 (29.4%) |
Technology Access in Cairo
Computing Device Access in Cairo
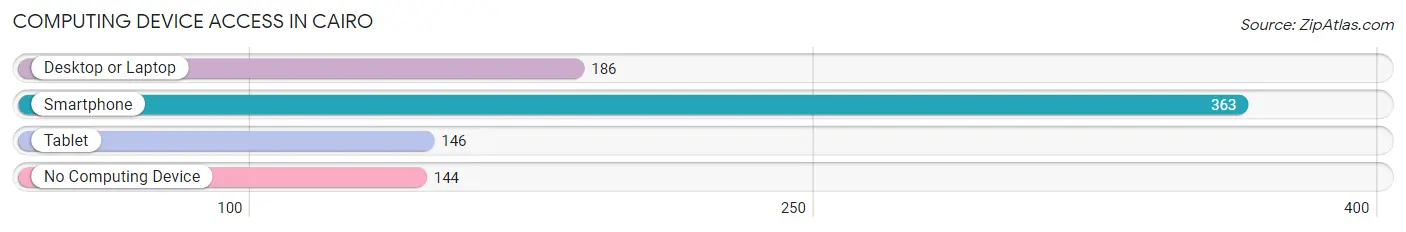
| Device Type | # Households | % Households |
| Desktop or Laptop | 186 | 33.9% |
| Smartphone | 363 | 66.2% |
| Tablet | 146 | 26.6% |
| No Computing Device | 144 | 26.3% |
| Total | 548 | 100.0% |
Internet Access in Cairo
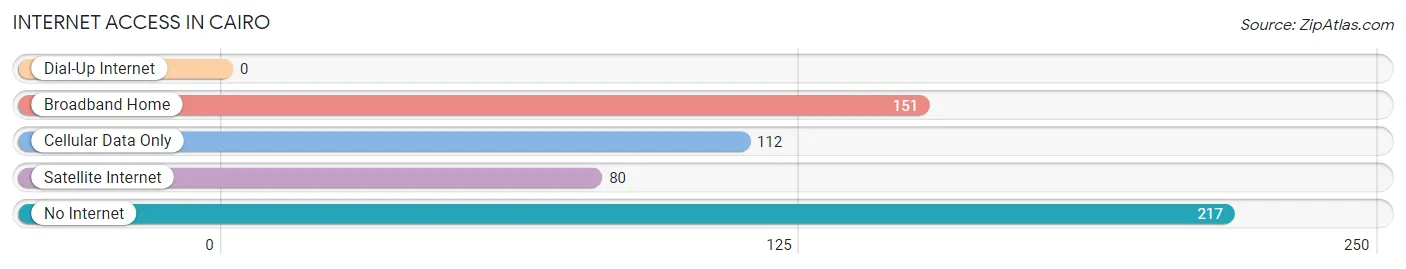
| Internet Type | # Households | % Households |
| Dial-Up Internet | 0 | 0.0% |
| Broadband Home | 151 | 27.6% |
| Cellular Data Only | 112 | 20.4% |
| Satellite Internet | 80 | 14.6% |
| No Internet | 217 | 39.6% |
| Total | 548 | 100.0% |
Cairo Summary
Cairo, Illinois is a small city located in the extreme southern tip of the state, at the confluence of the Ohio and Mississippi Rivers. It is the county seat of Alexander County, and is the only city in the county. The city has a population of 2,831 as of the 2010 census, and is the largest city in the region.
Geography
Cairo is located at the confluence of the Ohio and Mississippi Rivers, and is the southernmost city in Illinois. It is situated on a peninsula, with the Mississippi River to the west and the Ohio River to the east. The city is surrounded by the Shawnee National Forest, and is located approximately 120 miles south of St. Louis, Missouri.
The city has a total area of 2.2 square miles, all of which is land. The terrain is mostly flat, with some rolling hills in the surrounding area. The climate is humid subtropical, with hot, humid summers and mild winters.
History
Cairo was founded in 1837 by a group of settlers from Ohio, led by John D. Campbell. The city was named after the city of Cairo, Egypt, and was intended to be a major port city on the Mississippi River. The city was incorporated in 1854, and quickly became a major hub for riverboat traffic.
During the Civil War, Cairo was a major supply center for the Union Army, and was the site of several battles. After the war, the city continued to grow, and by the late 19th century, it was a major center for trade and industry.
In the early 20th century, the city began to decline, as the riverboat traffic shifted to other cities. The Great Mississippi Flood of 1927 caused extensive damage to the city, and the population began to decline. The city has since stabilized, and is now a small, quiet city.
Economy
Cairo’s economy is largely based on tourism and agriculture. The city is home to several tourist attractions, including the Cairo Historic District, the Cairo Museum, and the Cairo National Cemetery. The city is also home to several agricultural businesses, including a large poultry processing plant.
The city is also home to several manufacturing businesses, including a furniture factory and a metal fabrication plant. The city is also home to several retail businesses, including several antique stores and a few restaurants.
Demographics
As of the 2010 census, the population of Cairo was 2,831. The racial makeup of the city was 79.2% White, 18.2% African American, 0.3% Native American, 0.2% Asian, 0.1% Pacific Islander, 0.7% from other races, and 1.3% from two or more races. Hispanic or Latino of any race were 1.7% of the population.
The median household income in the city was $25,972, and the median family income was $31,250. The per capita income for the city was $14,845. About 24.2% of the population was below the poverty line.
Cairo is a small city with a rich history and a diverse economy. It is home to several tourist attractions, and is a major center for agriculture and manufacturing. The city has a diverse population, and is a great place to live and work.
Common Questions
What is Per Capita Income in Cairo?
Per Capita income in Cairo is $19,511.
What is the Median Family Income in Cairo?
Median Family Income in Cairo is $43,958.
What is the Median Household income in Cairo?
Median Household Income in Cairo is $31,429.
What is Income or Wage Gap in Cairo?
Income or Wage Gap in Cairo is 66.7%.
Women in Cairo earn 33.3 cents for every dollar earned by a man.
What is Inequality or Gini Index in Cairo?
Inequality or Gini Index in Cairo is 0.45.
What is the Total Population of Cairo?
Total Population of Cairo is 1,510.
What is the Total Male Population of Cairo?
Total Male Population of Cairo is 731.
What is the Total Female Population of Cairo?
Total Female Population of Cairo is 779.
What is the Ratio of Males per 100 Females in Cairo?
There are 93.84 Males per 100 Females in Cairo.
What is the Ratio of Females per 100 Males in Cairo?
There are 106.57 Females per 100 Males in Cairo.
What is the Median Population Age in Cairo?
Median Population Age in Cairo is 42.6 Years.
What is the Average Family Size in Cairo
Average Family Size in Cairo is 5.1 People.
What is the Average Household Size in Cairo
Average Household Size in Cairo is 2.6 People.
How Large is the Labor Force in Cairo?
There are 593 People in the Labor Forcein in Cairo.
What is the Percentage of People in the Labor Force in Cairo?
47.2% of People are in the Labor Force in Cairo.
What is the Unemployment Rate in Cairo?
Unemployment Rate in Cairo is 16.2%.