Zip Codes with the Highest Percentage of Black / African American Population in Illinois
RELATED REPORTS & OPTIONS
Black / African American
Illinois
Compare Zip Codes
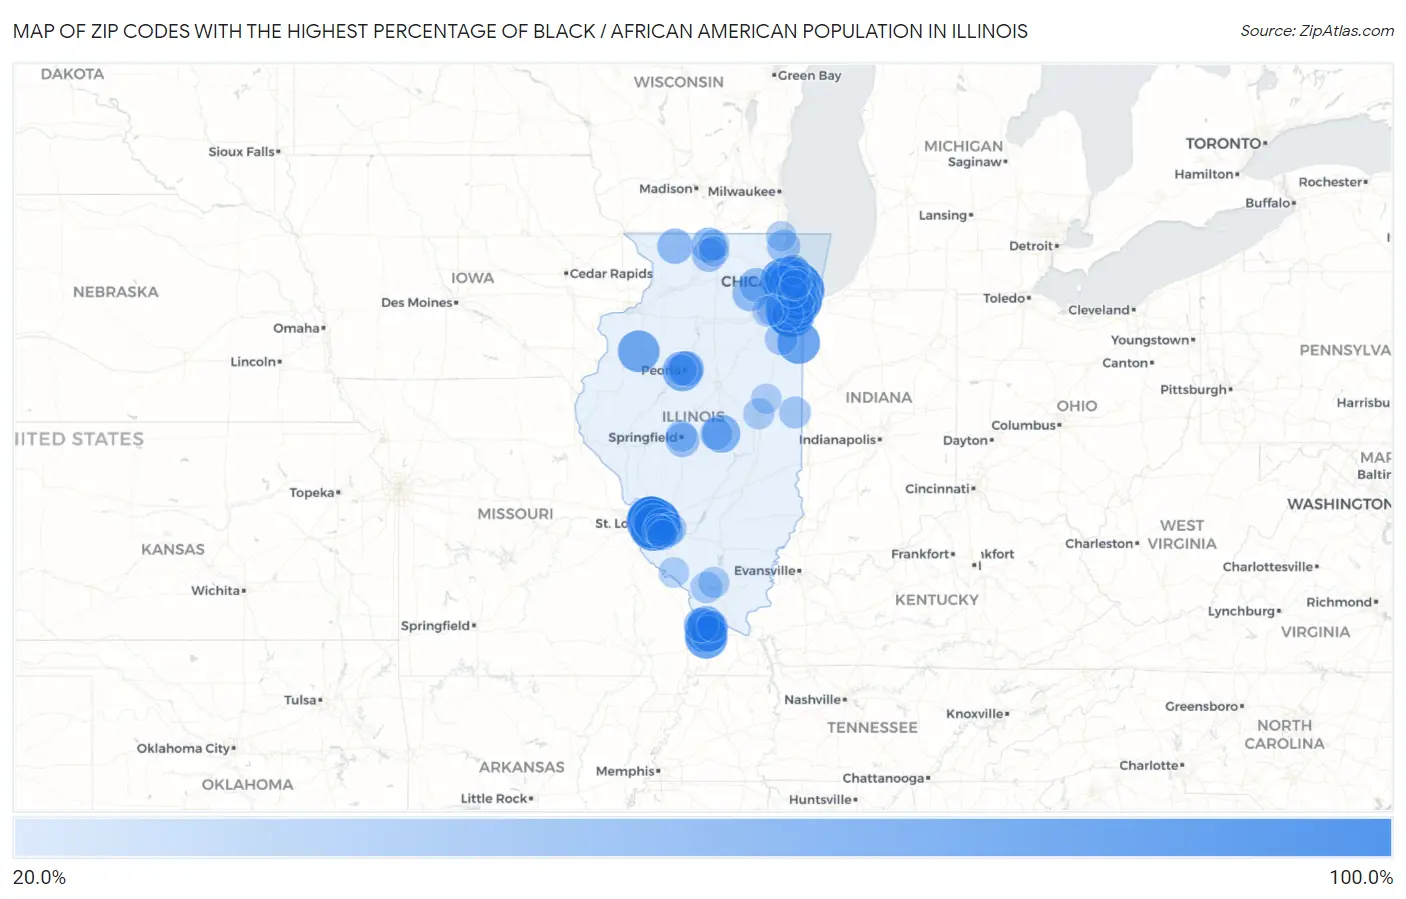
Map of Zip Codes with the Highest Percentage of Black / African American Population in Illinois
20.0%
100.0%
Zip Codes with the Highest Percentage of Black / African American Population in Illinois
| Zip Code | Black / African American | vs State | vs National | |
| 1. | 62059 | 95.9% | 13.9%(+82.0)#1 | 12.5%(+83.4)#70 |
| 2. | 62205 | 95.9% | 13.9%(+82.0)#2 | 12.5%(+83.4)#71 |
| 3. | 62207 | 94.3% | 13.9%(+80.4)#3 | 12.5%(+81.8)#85 |
| 4. | 60620 | 93.8% | 13.9%(+79.9)#4 | 12.5%(+81.3)#92 |
| 5. | 60619 | 93.7% | 13.9%(+79.7)#5 | 12.5%(+81.2)#93 |
| 6. | 60649 | 92.7% | 13.9%(+78.8)#6 | 12.5%(+80.2)#111 |
| 7. | 62203 | 92.6% | 13.9%(+78.7)#7 | 12.5%(+80.2)#112 |
| 8. | 60621 | 92.5% | 13.9%(+78.6)#8 | 12.5%(+80.1)#113 |
| 9. | 60628 | 91.7% | 13.9%(+77.8)#9 | 12.5%(+79.2)#124 |
| 10. | 60419 | 91.2% | 13.9%(+77.3)#10 | 12.5%(+78.7)#131 |
| 11. | 60471 | 91.2% | 13.9%(+77.2)#11 | 12.5%(+78.7)#133 |
| 12. | 60827 | 89.6% | 13.9%(+75.7)#12 | 12.5%(+77.2)#157 |
| 13. | 60478 | 88.8% | 13.9%(+74.9)#13 | 12.5%(+76.3)#170 |
| 14. | 62204 | 88.1% | 13.9%(+74.2)#14 | 12.5%(+75.6)#183 |
| 15. | 60472 | 87.9% | 13.9%(+74.0)#15 | 12.5%(+75.5)#184 |
| 16. | 60484 | 87.0% | 13.9%(+73.1)#16 | 12.5%(+74.6)#205 |
| 17. | 60624 | 86.3% | 13.9%(+72.4)#17 | 12.5%(+73.8)#218 |
| 18. | 62090 | 86.1% | 13.9%(+72.2)#18 | 12.5%(+73.7)#220 |
| 19. | 60653 | 85.2% | 13.9%(+71.3)#19 | 12.5%(+72.7)#236 |
| 20. | 60429 | 84.3% | 13.9%(+70.4)#20 | 12.5%(+71.8)#249 |
| 21. | 60644 | 82.2% | 13.9%(+68.3)#21 | 12.5%(+69.7)#273 |
| 22. | 60461 | 79.2% | 13.9%(+65.3)#22 | 12.5%(+66.8)#344 |
| 23. | 60473 | 79.2% | 13.9%(+65.3)#23 | 12.5%(+66.7)#345 |
| 24. | 60636 | 78.8% | 13.9%(+64.8)#24 | 12.5%(+66.3)#359 |
| 25. | 60443 | 74.2% | 13.9%(+60.3)#25 | 12.5%(+61.7)#449 |
| 26. | 60428 | 72.5% | 13.9%(+58.6)#26 | 12.5%(+60.1)#482 |
| 27. | 60637 | 72.4% | 13.9%(+58.4)#27 | 12.5%(+59.9)#485 |
| 28. | 60104 | 71.8% | 13.9%(+57.9)#28 | 12.5%(+59.4)#496 |
| 29. | 60409 | 71.5% | 13.9%(+57.6)#29 | 12.5%(+59.0)#505 |
| 30. | 60466 | 71.1% | 13.9%(+57.2)#30 | 12.5%(+58.6)#514 |
| 31. | 60643 | 70.4% | 13.9%(+56.5)#31 | 12.5%(+58.0)#536 |
| 32. | 62964 | 69.4% | 13.9%(+55.5)#32 | 12.5%(+56.9)#562 |
| 33. | 60958 | 68.6% | 13.9%(+54.7)#33 | 12.5%(+56.2)#578 |
| 34. | 60155 | 68.6% | 13.9%(+54.7)#34 | 12.5%(+56.1)#584 |
| 35. | 62914 | 68.0% | 13.9%(+54.1)#35 | 12.5%(+55.6)#598 |
| 36. | 62206 | 65.8% | 13.9%(+51.9)#36 | 12.5%(+53.3)#664 |
| 37. | 61402 | 65.1% | 13.9%(+51.2)#37 | 12.5%(+52.6)#680 |
| 38. | 60425 | 63.8% | 13.9%(+49.9)#38 | 12.5%(+51.3)#736 |
| 39. | 60422 | 62.8% | 13.9%(+48.9)#39 | 12.5%(+50.3)#765 |
| 40. | 62060 | 62.1% | 13.9%(+48.2)#40 | 12.5%(+49.7)#790 |
| 41. | 60426 | 60.8% | 13.9%(+46.9)#41 | 12.5%(+48.4)#836 |
| 42. | 60153 | 60.6% | 13.9%(+46.7)#42 | 12.5%(+48.1)#850 |
| 43. | 61605 | 58.2% | 13.9%(+44.3)#43 | 12.5%(+45.7)#927 |
| 44. | 62201 | 56.4% | 13.9%(+42.5)#44 | 12.5%(+43.9)#984 |
| 45. | 60612 | 55.5% | 13.9%(+41.6)#45 | 12.5%(+43.0)#1,024 |
| 46. | 60617 | 54.7% | 13.9%(+40.7)#46 | 12.5%(+42.2)#1,052 |
| 47. | 60651 | 54.4% | 13.9%(+40.5)#47 | 12.5%(+42.0)#1,060 |
| 48. | 60615 | 54.0% | 13.9%(+40.1)#48 | 12.5%(+41.6)#1,077 |
| 49. | 62523 | 51.1% | 13.9%(+37.2)#49 | 12.5%(+38.7)#1,196 |
| 50. | 60411 | 51.0% | 13.9%(+37.1)#50 | 12.5%(+38.5)#1,201 |
| 51. | 60162 | 49.9% | 13.9%(+36.0)#51 | 12.5%(+37.5)#1,260 |
| 52. | 60430 | 49.9% | 13.9%(+36.0)#52 | 12.5%(+37.4)#1,263 |
| 53. | 62976 | 49.3% | 13.9%(+35.4)#53 | 12.5%(+36.8)#1,299 |
| 54. | 60438 | 46.9% | 13.9%(+33.0)#54 | 12.5%(+34.4)#1,409 |
| 55. | 62963 | 43.2% | 13.9%(+29.3)#55 | 12.5%(+30.8)#1,620 |
| 56. | 60652 | 41.6% | 13.9%(+27.7)#56 | 12.5%(+29.2)#1,724 |
| 57. | 61603 | 40.8% | 13.9%(+26.9)#57 | 12.5%(+28.3)#1,788 |
| 58. | 61027 | 40.2% | 13.9%(+26.3)#58 | 12.5%(+27.7)#1,832 |
| 59. | 60512 | 39.8% | 13.9%(+25.9)#59 | 12.5%(+27.3)#1,866 |
| 60. | 61101 | 38.4% | 13.9%(+24.5)#60 | 12.5%(+25.9)#1,976 |
| 61. | 62988 | 38.1% | 13.9%(+24.2)#61 | 12.5%(+25.7)#1,987 |
| 62. | 60417 | 37.5% | 13.9%(+23.6)#62 | 12.5%(+25.1)#2,030 |
| 63. | 60141 | 37.1% | 13.9%(+23.2)#63 | 12.5%(+24.7)#2,057 |
| 64. | 60539 | 35.8% | 13.9%(+21.9)#64 | 12.5%(+23.3)#2,148 |
| 65. | 62703 | 35.2% | 13.9%(+21.3)#65 | 12.5%(+22.8)#2,199 |
| 66. | 61102 | 34.1% | 13.9%(+20.2)#66 | 12.5%(+21.6)#2,301 |
| 67. | 60406 | 33.1% | 13.9%(+19.2)#67 | 12.5%(+20.7)#2,375 |
| 68. | 60064 | 32.9% | 13.9%(+19.0)#68 | 12.5%(+20.4)#2,394 |
| 69. | 60633 | 31.2% | 13.9%(+17.3)#69 | 12.5%(+18.7)#2,540 |
| 70. | 62208 | 31.1% | 13.9%(+17.2)#70 | 12.5%(+18.6)#2,547 |
| 71. | 60901 | 31.0% | 13.9%(+17.1)#71 | 12.5%(+18.5)#2,555 |
| 72. | 62225 | 29.8% | 13.9%(+15.9)#72 | 12.5%(+17.3)#2,660 |
| 73. | 62522 | 29.3% | 13.9%(+15.4)#73 | 12.5%(+16.9)#2,714 |
| 74. | 60476 | 28.9% | 13.9%(+15.0)#74 | 12.5%(+16.4)#2,767 |
| 75. | 61832 | 27.5% | 13.9%(+13.6)#75 | 12.5%(+15.1)#2,896 |
| 76. | 62221 | 27.2% | 13.9%(+13.3)#76 | 12.5%(+14.7)#2,939 |
| 77. | 60623 | 27.0% | 13.9%(+13.1)#77 | 12.5%(+14.6)#2,958 |
| 78. | 62223 | 27.0% | 13.9%(+13.1)#78 | 12.5%(+14.5)#2,975 |
| 79. | 62701 | 26.2% | 13.9%(+12.2)#79 | 12.5%(+13.7)#3,064 |
| 80. | 60449 | 26.1% | 13.9%(+12.2)#80 | 12.5%(+13.6)#3,076 |
| 81. | 62226 | 25.9% | 13.9%(+12.0)#81 | 12.5%(+13.5)#3,093 |
| 82. | 61604 | 25.8% | 13.9%(+11.9)#82 | 12.5%(+13.3)#3,110 |
| 83. | 62901 | 25.7% | 13.9%(+11.8)#83 | 12.5%(+13.3)#3,118 |
| 84. | 60130 | 25.3% | 13.9%(+11.3)#84 | 12.5%(+12.8)#3,187 |
| 85. | 62921 | 25.1% | 13.9%(+11.2)#85 | 12.5%(+12.6)#3,199 |
| 86. | 60163 | 25.1% | 13.9%(+11.2)#86 | 12.5%(+12.6)#3,203 |
| 87. | 60616 | 25.1% | 13.9%(+11.1)#87 | 12.5%(+12.6)#3,206 |
| 88. | 60433 | 24.6% | 13.9%(+10.7)#88 | 12.5%(+12.2)#3,255 |
| 89. | 60626 | 24.0% | 13.9%(+10.1)#89 | 12.5%(+11.6)#3,348 |
| 90. | 61821 | 23.9% | 13.9%(+10.0)#90 | 12.5%(+11.4)#3,371 |
| 91. | 61103 | 23.7% | 13.9%(+9.82)#91 | 12.5%(+11.3)#3,394 |
| 92. | 62970 | 23.5% | 13.9%(+9.55)#92 | 12.5%(+11.0)#3,426 |
| 93. | 60436 | 23.4% | 13.9%(+9.52)#93 | 12.5%(+11.0)#3,430 |
| 94. | 60805 | 23.1% | 13.9%(+9.16)#94 | 12.5%(+10.6)#3,478 |
| 95. | 61104 | 22.7% | 13.9%(+8.83)#95 | 12.5%(+10.3)#3,526 |
| 96. | 60609 | 22.7% | 13.9%(+8.75)#96 | 12.5%(+10.2)#3,539 |
| 97. | 62233 | 21.9% | 13.9%(+7.98)#97 | 12.5%(+9.42)#3,651 |
| 98. | 62220 | 21.7% | 13.9%(+7.79)#98 | 12.5%(+9.23)#3,685 |
| 99. | 60099 | 21.5% | 13.9%(+7.54)#99 | 12.5%(+8.98)#3,721 |
| 100. | 61866 | 21.4% | 13.9%(+7.49)#100 | 12.5%(+8.93)#3,733 |
Common Questions
What are the Top 10 Zip Codes with the Highest Percentage of Black / African American Population in Illinois?
Top 10 Zip Codes with the Highest Percentage of Black / African American Population in Illinois are:
What zip code has the Highest Percentage of Black / African American Population in Illinois?
62059 has the Highest Percentage of Black / African American Population in Illinois with 95.9%.
What is the Percentage of Black / African American Population in the State of Illinois?
Percentage of Black / African American Population in Illinois is 13.9%.
What is the Percentage of Black / African American Population in the United States?
Percentage of Black / African American Population in the United States is 12.5%.