Rosewood Heights, IL Map & Demographics
Rosewood Heights Map
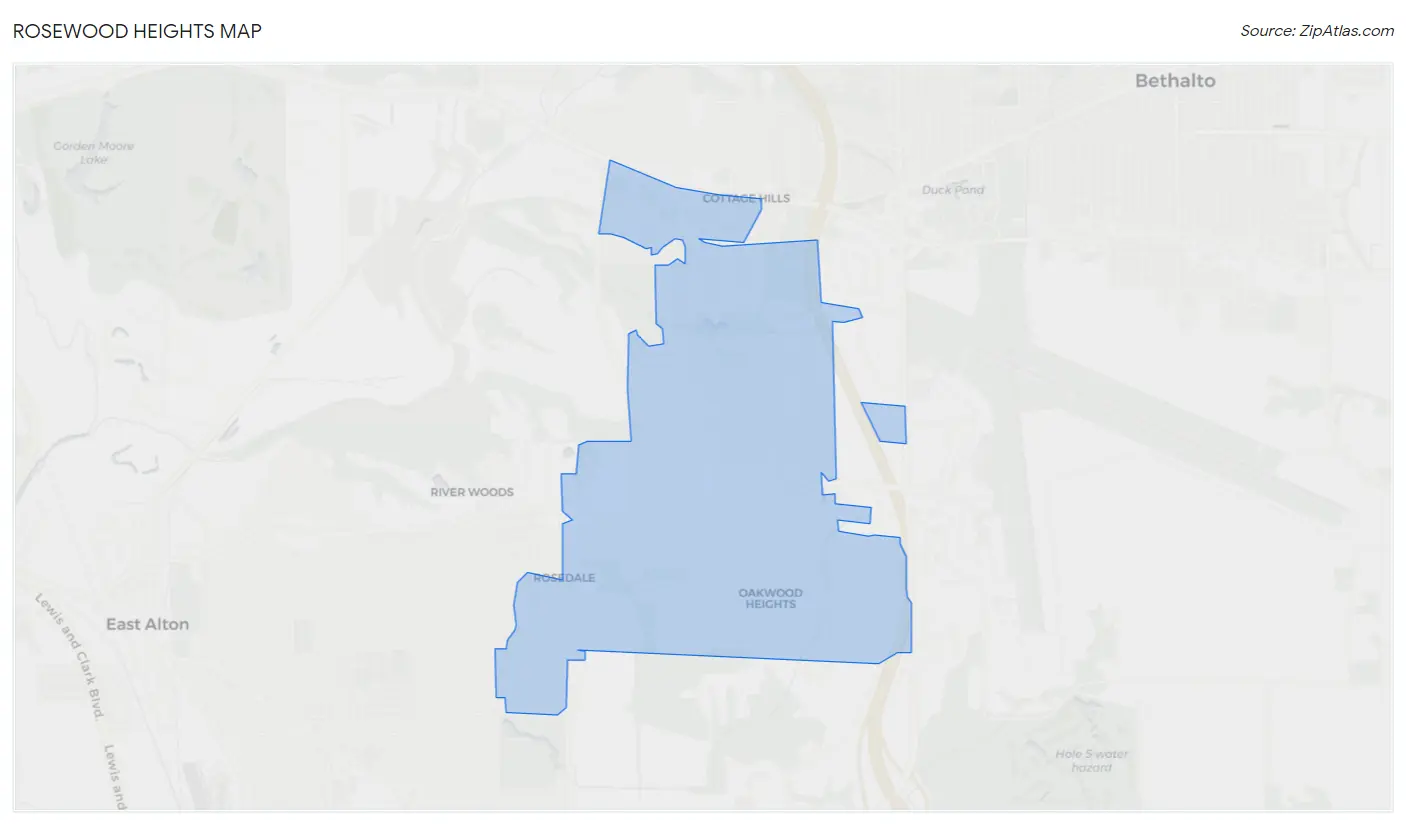
Rosewood Heights Overview
$33,806
PER CAPITA INCOME
$84,320
AVG FAMILY INCOME
$79,842
AVG HOUSEHOLD INCOME
45.9%
WAGE / INCOME GAP [ % ]
54.1¢/ $1
WAGE / INCOME GAP [ $ ]
0.36
INEQUALITY / GINI INDEX
3,920
TOTAL POPULATION
1,893
MALE POPULATION
2,027
FEMALE POPULATION
93.39
MALES / 100 FEMALES
107.08
FEMALES / 100 MALES
45.1
MEDIAN AGE
2.9
AVG FAMILY SIZE
2.5
AVG HOUSEHOLD SIZE
2,001
LABOR FORCE [ PEOPLE ]
60.7%
PERCENT IN LABOR FORCE
5.0%
UNEMPLOYMENT RATE
Income in Rosewood Heights
Income Overview in Rosewood Heights
Per Capita Income in Rosewood Heights is $33,806, while median incomes of families and households are $84,320 and $79,842 respectively.
| Characteristic | Number | Measure |
| Per Capita Income | 3,920 | $33,806 |
| Median Family Income | 1,127 | $84,320 |
| Mean Family Income | 1,127 | $90,421 |
| Median Household Income | 1,594 | $79,842 |
| Mean Household Income | 1,594 | $81,900 |
| Income Deficit | 1,127 | $0 |
| Wage / Income Gap (%) | 3,920 | 45.94% |
| Wage / Income Gap ($) | 3,920 | 54.06¢ per $1 |
| Gini / Inequality Index | 3,920 | 0.36 |
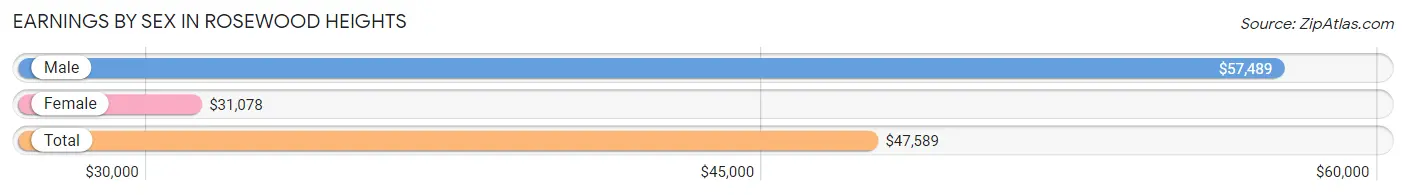
Earnings by Sex in Rosewood Heights
Average Earnings in Rosewood Heights are $47,589, $57,489 for men and $31,078 for women, a difference of 45.9%.
| Sex | Number | Average Earnings |
| Male | 1,167 (57.3%) | $57,489 |
| Female | 870 (42.7%) | $31,078 |
| Total | 2,037 (100.0%) | $47,589 |
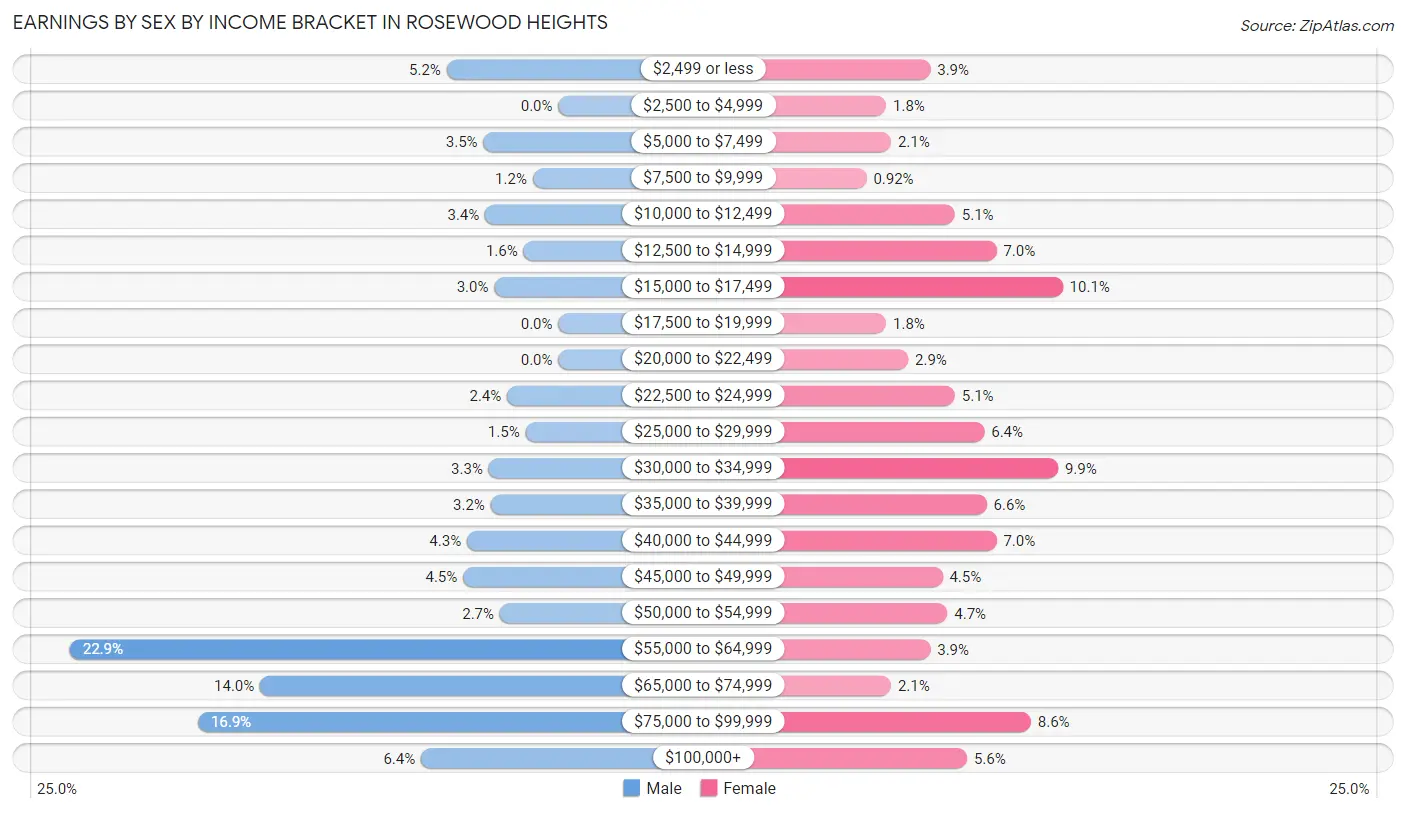
Earnings by Sex by Income Bracket in Rosewood Heights
The most common earnings brackets in Rosewood Heights are $55,000 to $64,999 for men (267 | 22.9%) and $15,000 to $17,499 for women (88 | 10.1%).
| Income | Male | Female |
| $2,499 or less | 61 (5.2%) | 34 (3.9%) |
| $2,500 to $4,999 | 0 (0.0%) | 16 (1.8%) |
| $5,000 to $7,499 | 41 (3.5%) | 18 (2.1%) |
| $7,500 to $9,999 | 14 (1.2%) | 8 (0.9%) |
| $10,000 to $12,499 | 40 (3.4%) | 44 (5.1%) |
| $12,500 to $14,999 | 19 (1.6%) | 61 (7.0%) |
| $15,000 to $17,499 | 35 (3.0%) | 88 (10.1%) |
| $17,500 to $19,999 | 0 (0.0%) | 16 (1.8%) |
| $20,000 to $22,499 | 0 (0.0%) | 25 (2.9%) |
| $22,500 to $24,999 | 28 (2.4%) | 44 (5.1%) |
| $25,000 to $29,999 | 18 (1.5%) | 56 (6.4%) |
| $30,000 to $34,999 | 38 (3.3%) | 86 (9.9%) |
| $35,000 to $39,999 | 37 (3.2%) | 57 (6.6%) |
| $40,000 to $44,999 | 50 (4.3%) | 61 (7.0%) |
| $45,000 to $49,999 | 52 (4.5%) | 39 (4.5%) |
| $50,000 to $54,999 | 32 (2.7%) | 41 (4.7%) |
| $55,000 to $64,999 | 267 (22.9%) | 34 (3.9%) |
| $65,000 to $74,999 | 163 (14.0%) | 18 (2.1%) |
| $75,000 to $99,999 | 197 (16.9%) | 75 (8.6%) |
| $100,000+ | 75 (6.4%) | 49 (5.6%) |
| Total | 1,167 (100.0%) | 870 (100.0%) |
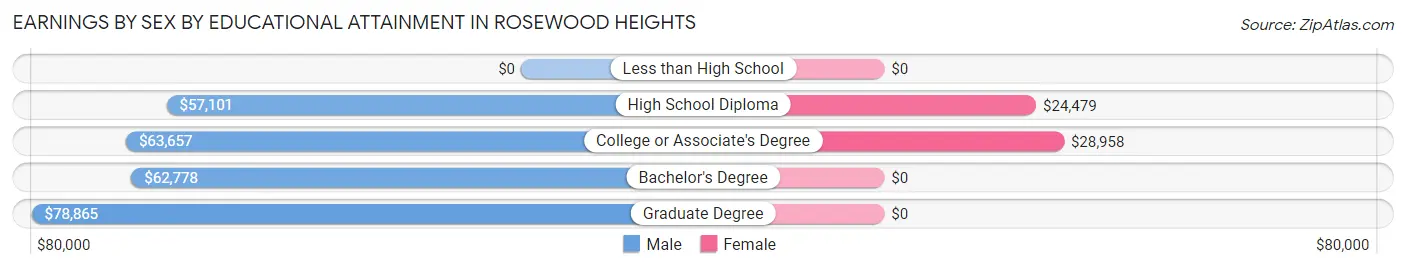
Earnings by Sex by Educational Attainment in Rosewood Heights
Average earnings in Rosewood Heights are $63,242 for men and $34,643 for women, a difference of 45.2%. Men with an educational attainment of graduate degree enjoy the highest average annual earnings of $78,865, while those with high school diploma education earn the least with $57,101. Women with an educational attainment of college or associate's degree earn the most with the average annual earnings of $28,958, while those with high school diploma education have the smallest earnings of $24,479.
| Educational Attainment | Male Income | Female Income |
| Less than High School | - | - |
| High School Diploma | $57,101 | $24,479 |
| College or Associate's Degree | $63,657 | $28,958 |
| Bachelor's Degree | $62,778 | $0 |
| Graduate Degree | $78,865 | $0 |
| Total | $63,242 | $34,643 |
Family Income in Rosewood Heights
Family Income Brackets in Rosewood Heights
According to the Rosewood Heights family income data, there are 330 families falling into the $75,000 to $99,999 income range, which is the most common income bracket and makes up 29.3% of all families.
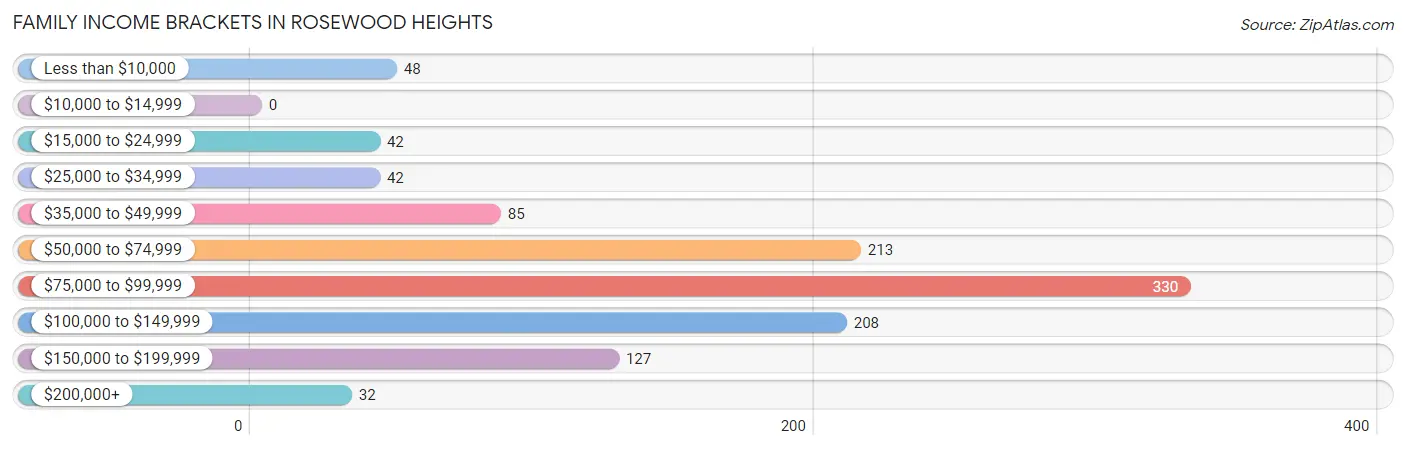
| Income Bracket | # Families | % Families |
| Less than $10,000 | 48 | 4.3% |
| $10,000 to $14,999 | 0 | 0.0% |
| $15,000 to $24,999 | 42 | 3.7% |
| $25,000 to $34,999 | 42 | 3.7% |
| $35,000 to $49,999 | 85 | 7.5% |
| $50,000 to $74,999 | 213 | 18.9% |
| $75,000 to $99,999 | 330 | 29.3% |
| $100,000 to $149,999 | 208 | 18.5% |
| $150,000 to $199,999 | 127 | 11.3% |
| $200,000+ | 32 | 2.8% |
Family Income by Famaliy Size in Rosewood Heights
3-person families (356 | 31.6%) account for the highest median family income in Rosewood Heights with $113,013 per family, while 3-person families (356 | 31.6%) have the highest median income of $37,671 per family member.
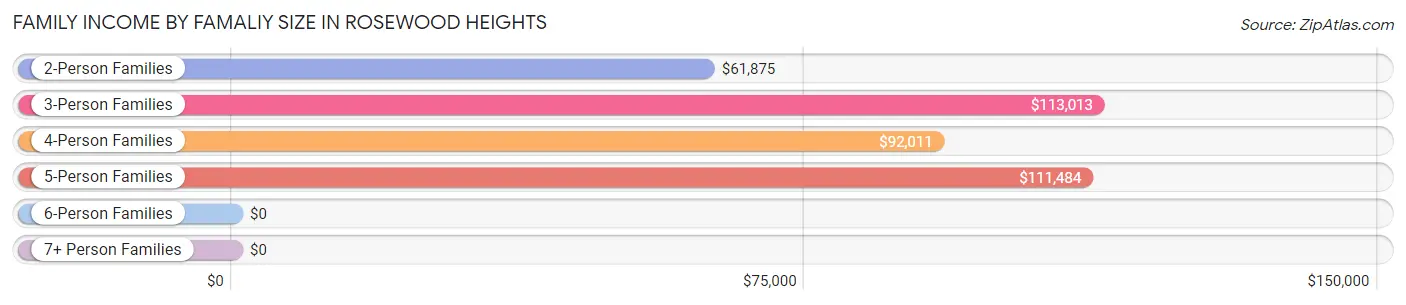
| Income Bracket | # Families | Median Income |
| 2-Person Families | 495 (43.9%) | $61,875 |
| 3-Person Families | 356 (31.6%) | $113,013 |
| 4-Person Families | 191 (17.0%) | $92,011 |
| 5-Person Families | 35 (3.1%) | $111,484 |
| 6-Person Families | 22 (1.9%) | $0 |
| 7+ Person Families | 28 (2.5%) | $0 |
| Total | 1,127 (100.0%) | $84,320 |
Family Income by Number of Earners in Rosewood Heights
The median family income in Rosewood Heights is $84,320, with families comprising 3+ earners (166) having the highest median family income of $131,250, while families with no earners (249) have the lowest median family income of $53,047, accounting for 14.7% and 22.1% of families, respectively.
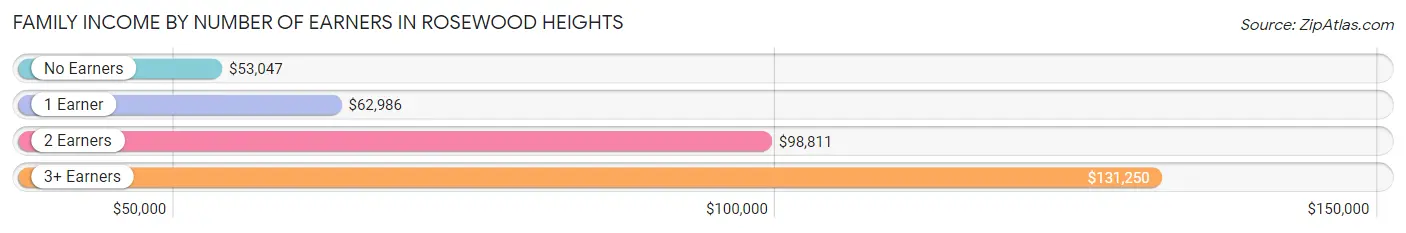
| Number of Earners | # Families | Median Income |
| No Earners | 249 (22.1%) | $53,047 |
| 1 Earner | 323 (28.7%) | $62,986 |
| 2 Earners | 389 (34.5%) | $98,811 |
| 3+ Earners | 166 (14.7%) | $131,250 |
| Total | 1,127 (100.0%) | $84,320 |
Household Income in Rosewood Heights
Household Income Brackets in Rosewood Heights
With 465 households falling in the category, the $75,000 to $99,999 income range is the most frequent in Rosewood Heights, accounting for 29.2% of all households. In contrast, only 41 households (2.6%) fall into the $200,000+ income bracket, making it the least populous group.
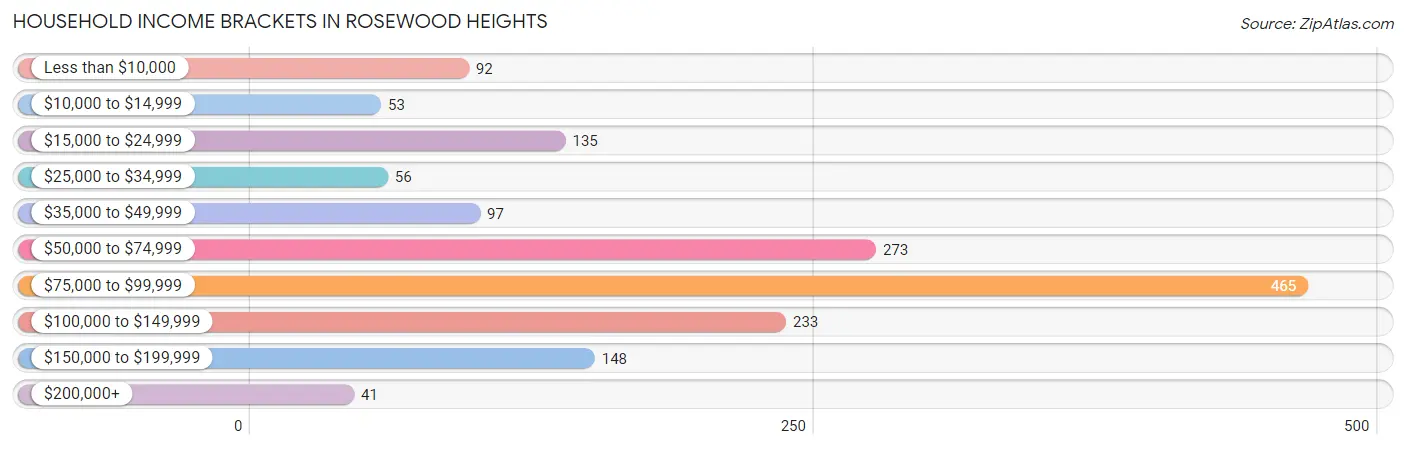
| Income Bracket | # Households | % Households |
| Less than $10,000 | 92 | 5.8% |
| $10,000 to $14,999 | 53 | 3.3% |
| $15,000 to $24,999 | 135 | 8.5% |
| $25,000 to $34,999 | 56 | 3.5% |
| $35,000 to $49,999 | 97 | 6.1% |
| $50,000 to $74,999 | 273 | 17.1% |
| $75,000 to $99,999 | 465 | 29.2% |
| $100,000 to $149,999 | 233 | 14.6% |
| $150,000 to $199,999 | 148 | 9.3% |
| $200,000+ | 41 | 2.6% |
Household Income by Householder Age in Rosewood Heights
The median household income in Rosewood Heights is $79,842, with the highest median household income of $92,337 found in the 25 to 44 years age bracket for the primary householder. A total of 409 households (25.7%) fall into this category. Meanwhile, the 15 to 24 years age bracket for the primary householder has the lowest median household income of $0, with 55 households (3.5%) in this group.
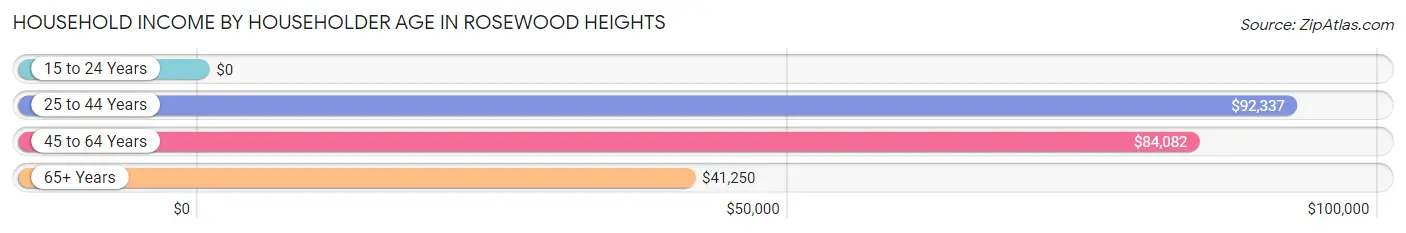
| Income Bracket | # Households | Median Income |
| 15 to 24 Years | 55 (3.5%) | $0 |
| 25 to 44 Years | 409 (25.7%) | $92,337 |
| 45 to 64 Years | 552 (34.6%) | $84,082 |
| 65+ Years | 578 (36.3%) | $41,250 |
| Total | 1,594 (100.0%) | $79,842 |
Poverty in Rosewood Heights
Income Below Poverty by Sex and Age in Rosewood Heights
With 2.1% poverty level for males and 11.8% for females among the residents of Rosewood Heights, 65 to 74 year old males and 75 year old and over females are the most vulnerable to poverty, with 34 males (14.1%) and 98 females (40.5%) in their respective age groups living below the poverty level.
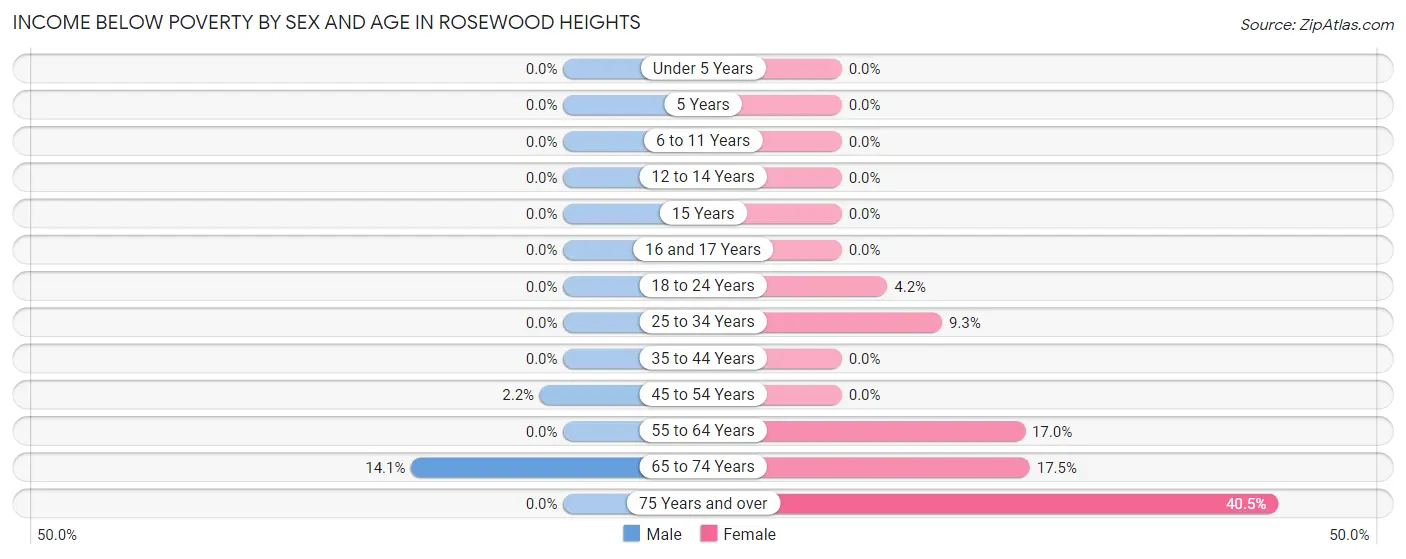
| Age Bracket | Male | Female |
| Under 5 Years | 0 (0.0%) | 0 (0.0%) |
| 5 Years | 0 (0.0%) | 0 (0.0%) |
| 6 to 11 Years | 0 (0.0%) | 0 (0.0%) |
| 12 to 14 Years | 0 (0.0%) | 0 (0.0%) |
| 15 Years | 0 (0.0%) | 0 (0.0%) |
| 16 and 17 Years | 0 (0.0%) | 0 (0.0%) |
| 18 to 24 Years | 0 (0.0%) | 6 (4.2%) |
| 25 to 34 Years | 0 (0.0%) | 24 (9.3%) |
| 35 to 44 Years | 0 (0.0%) | 0 (0.0%) |
| 45 to 54 Years | 6 (2.2%) | 0 (0.0%) |
| 55 to 64 Years | 0 (0.0%) | 59 (17.0%) |
| 65 to 74 Years | 34 (14.1%) | 52 (17.4%) |
| 75 Years and over | 0 (0.0%) | 98 (40.5%) |
| Total | 40 (2.1%) | 239 (11.8%) |
Income Above Poverty by Sex and Age in Rosewood Heights
According to the poverty statistics in Rosewood Heights, males aged under 5 years and females aged under 5 years are the age groups that are most secure financially, with 100.0% of males and 100.0% of females in these age groups living above the poverty line.
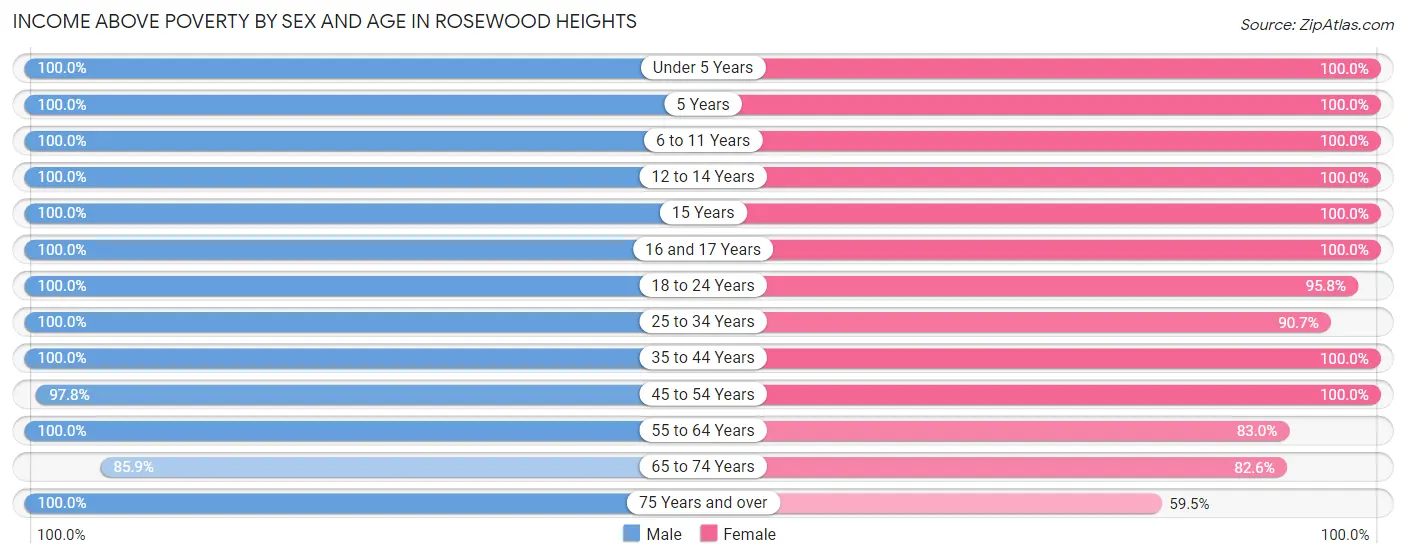
| Age Bracket | Male | Female |
| Under 5 Years | 82 (100.0%) | 115 (100.0%) |
| 5 Years | 21 (100.0%) | 16 (100.0%) |
| 6 to 11 Years | 62 (100.0%) | 162 (100.0%) |
| 12 to 14 Years | 77 (100.0%) | 31 (100.0%) |
| 15 Years | 10 (100.0%) | 47 (100.0%) |
| 16 and 17 Years | 64 (100.0%) | 10 (100.0%) |
| 18 to 24 Years | 135 (100.0%) | 136 (95.8%) |
| 25 to 34 Years | 347 (100.0%) | 234 (90.7%) |
| 35 to 44 Years | 191 (100.0%) | 185 (100.0%) |
| 45 to 54 Years | 271 (97.8%) | 174 (100.0%) |
| 55 to 64 Years | 278 (100.0%) | 288 (83.0%) |
| 65 to 74 Years | 207 (85.9%) | 246 (82.6%) |
| 75 Years and over | 108 (100.0%) | 144 (59.5%) |
| Total | 1,853 (97.9%) | 1,788 (88.2%) |
Income Below Poverty Among Married-Couple Families in Rosewood Heights
The poverty statistics for married-couple families in Rosewood Heights show that 2.0% or 18 of the total 913 families live below the poverty line. Families with no children have the highest poverty rate of 3.2%, comprising of 18 families. On the other hand, families with 1 or 2 children have the lowest poverty rate of 0.0%, which includes 0 families.
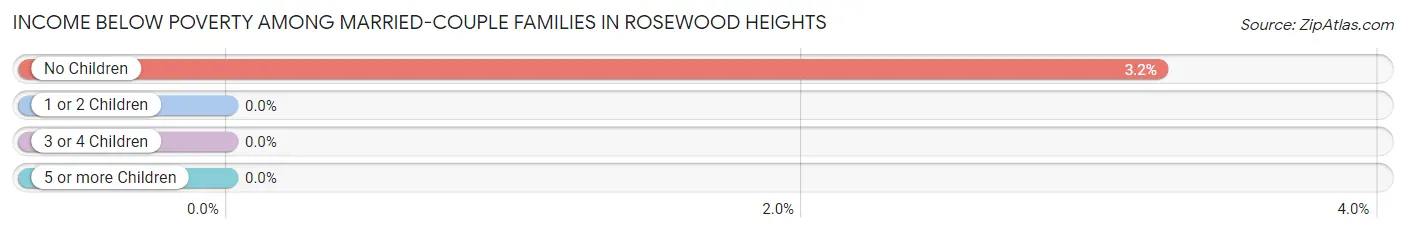
| Children | Above Poverty | Below Poverty |
| No Children | 538 (96.8%) | 18 (3.2%) |
| 1 or 2 Children | 308 (100.0%) | 0 (0.0%) |
| 3 or 4 Children | 49 (100.0%) | 0 (0.0%) |
| 5 or more Children | 0 (0.0%) | 0 (0.0%) |
| Total | 895 (98.0%) | 18 (2.0%) |
Income Below Poverty Among Single-Parent Households in Rosewood Heights
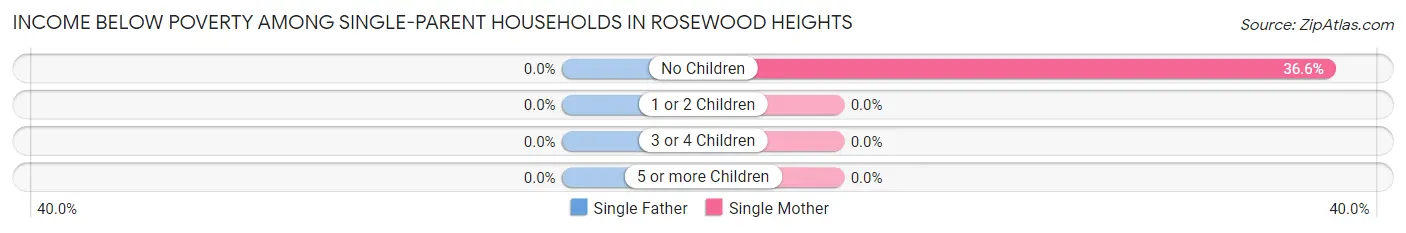
| Children | Single Father | Single Mother |
| No Children | 0 (0.0%) | 48 (36.6%) |
| 1 or 2 Children | 0 (0.0%) | 0 (0.0%) |
| 3 or 4 Children | 0 (0.0%) | 0 (0.0%) |
| 5 or more Children | 0 (0.0%) | 0 (0.0%) |
| Total | 0 (0.0%) | 48 (28.6%) |
Income Below Poverty Among Married-Couple vs Single-Parent Households in Rosewood Heights
The poverty data for Rosewood Heights shows that 18 of the married-couple family households (2.0%) and 48 of the single-parent households (22.4%) are living below the poverty level. Within the married-couple family households, those with no children have the highest poverty rate, with 18 households (3.2%) falling below the poverty line. Among the single-parent households, those with no children have the highest poverty rate, with 48 household (36.6%) living below poverty.
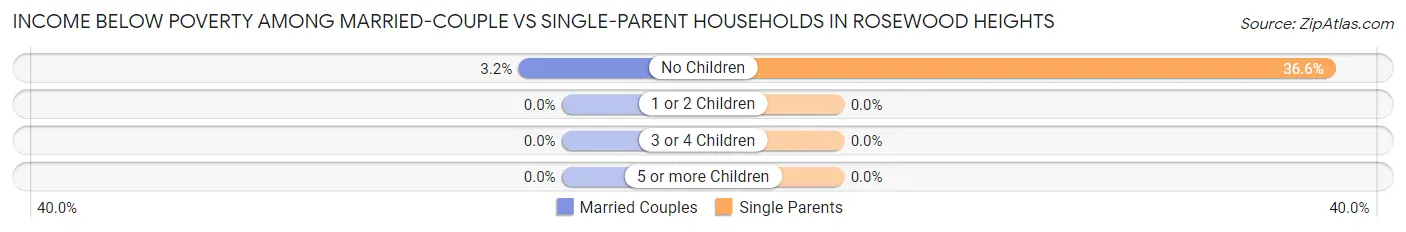
| Children | Married-Couple Families | Single-Parent Households |
| No Children | 18 (3.2%) | 48 (36.6%) |
| 1 or 2 Children | 0 (0.0%) | 0 (0.0%) |
| 3 or 4 Children | 0 (0.0%) | 0 (0.0%) |
| 5 or more Children | 0 (0.0%) | 0 (0.0%) |
| Total | 18 (2.0%) | 48 (22.4%) |
Race in Rosewood Heights
The most populous races in Rosewood Heights are White / Caucasian (3,789 | 96.7%), Hispanic or Latino (119 | 3.0%), and Two or more Races (103 | 2.6%).
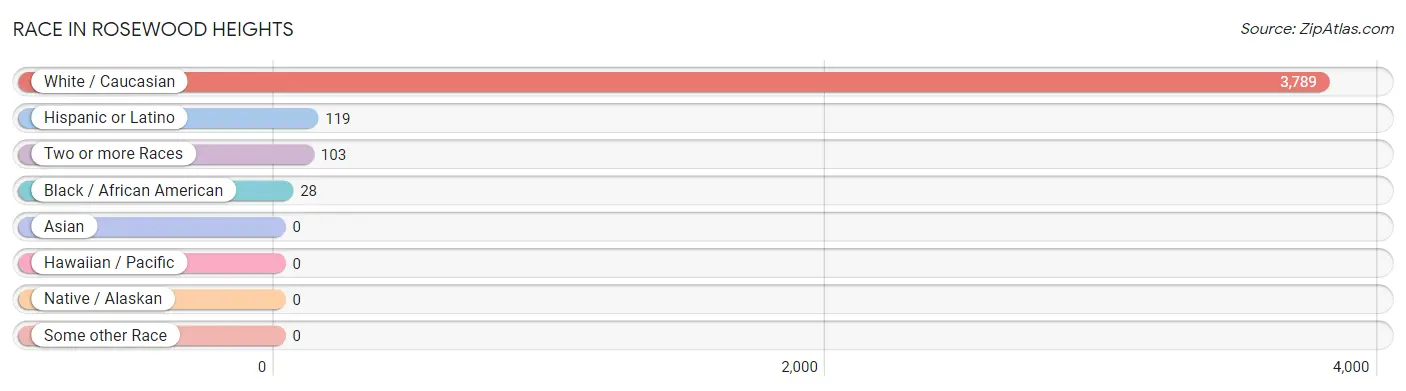
| Race | # Population | % Population |
| Asian | 0 | 0.0% |
| Black / African American | 28 | 0.7% |
| Hawaiian / Pacific | 0 | 0.0% |
| Hispanic or Latino | 119 | 3.0% |
| Native / Alaskan | 0 | 0.0% |
| White / Caucasian | 3,789 | 96.7% |
| Two or more Races | 103 | 2.6% |
| Some other Race | 0 | 0.0% |
| Total | 3,920 | 100.0% |
Ancestry in Rosewood Heights
The most populous ancestries reported in Rosewood Heights are German (1,340 | 34.2%), English (668 | 17.0%), Irish (597 | 15.2%), American (263 | 6.7%), and Italian (168 | 4.3%), together accounting for 77.5% of all Rosewood Heights residents.
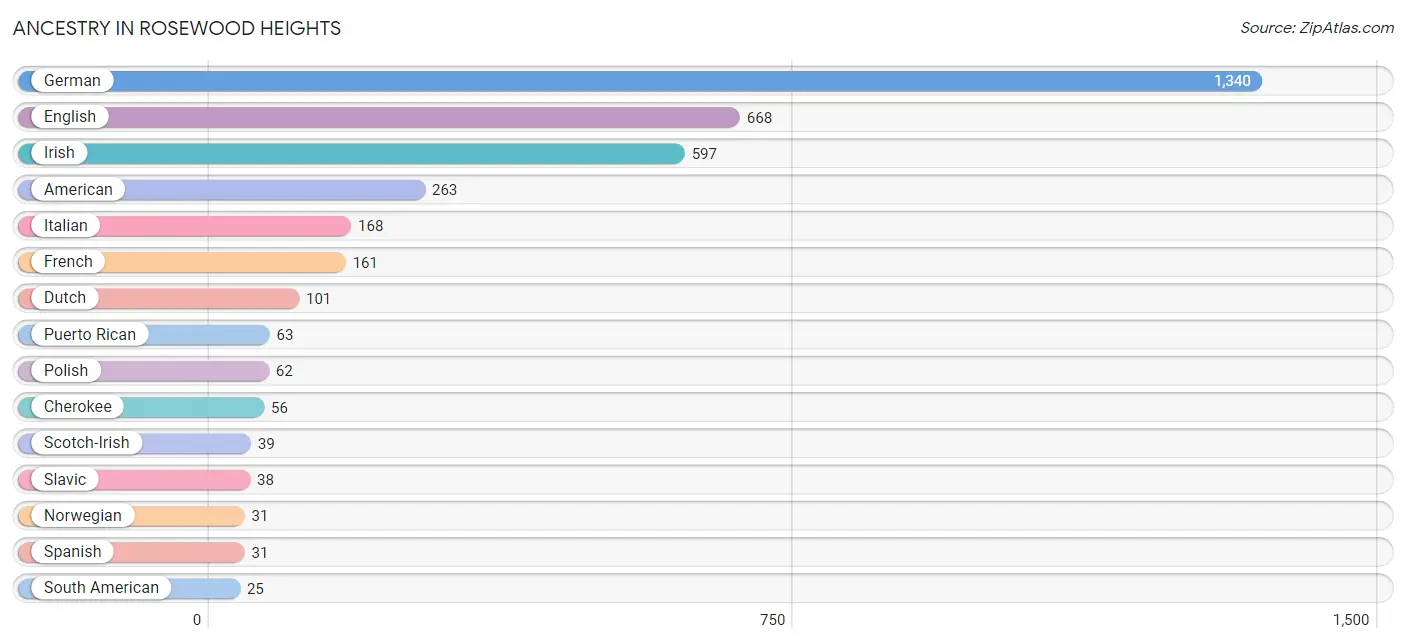
| Ancestry | # Population | % Population |
| American | 263 | 6.7% |
| British | 14 | 0.4% |
| Cherokee | 56 | 1.4% |
| Croatian | 23 | 0.6% |
| Dutch | 101 | 2.6% |
| English | 668 | 17.0% |
| European | 21 | 0.5% |
| French | 161 | 4.1% |
| German | 1,340 | 34.2% |
| Irish | 597 | 15.2% |
| Italian | 168 | 4.3% |
| Macedonian | 24 | 0.6% |
| Norwegian | 31 | 0.8% |
| Polish | 62 | 1.6% |
| Puerto Rican | 63 | 1.6% |
| Russian | 18 | 0.5% |
| Scotch-Irish | 39 | 1.0% |
| Serbian | 21 | 0.5% |
| Slavic | 38 | 1.0% |
| Slovak | 23 | 0.6% |
| South American | 25 | 0.6% |
| Spanish | 31 | 0.8% |
| Welsh | 19 | 0.5% | View All 23 Rows |
Immigrants in Rosewood Heights
The most numerous immigrant groups reported in Rosewood Heights came from Latin America (25 | 0.6%), and South America (25 | 0.6%), together accounting for 1.3% of all Rosewood Heights residents.
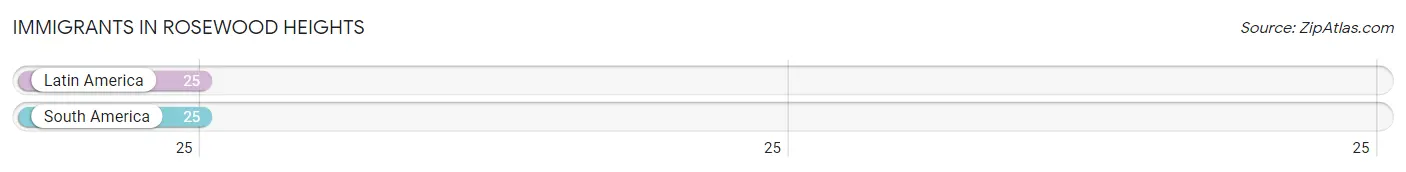
| Immigration Origin | # Population | % Population |
| Latin America | 25 | 0.6% |
| South America | 25 | 0.6% | View All 2 Rows |
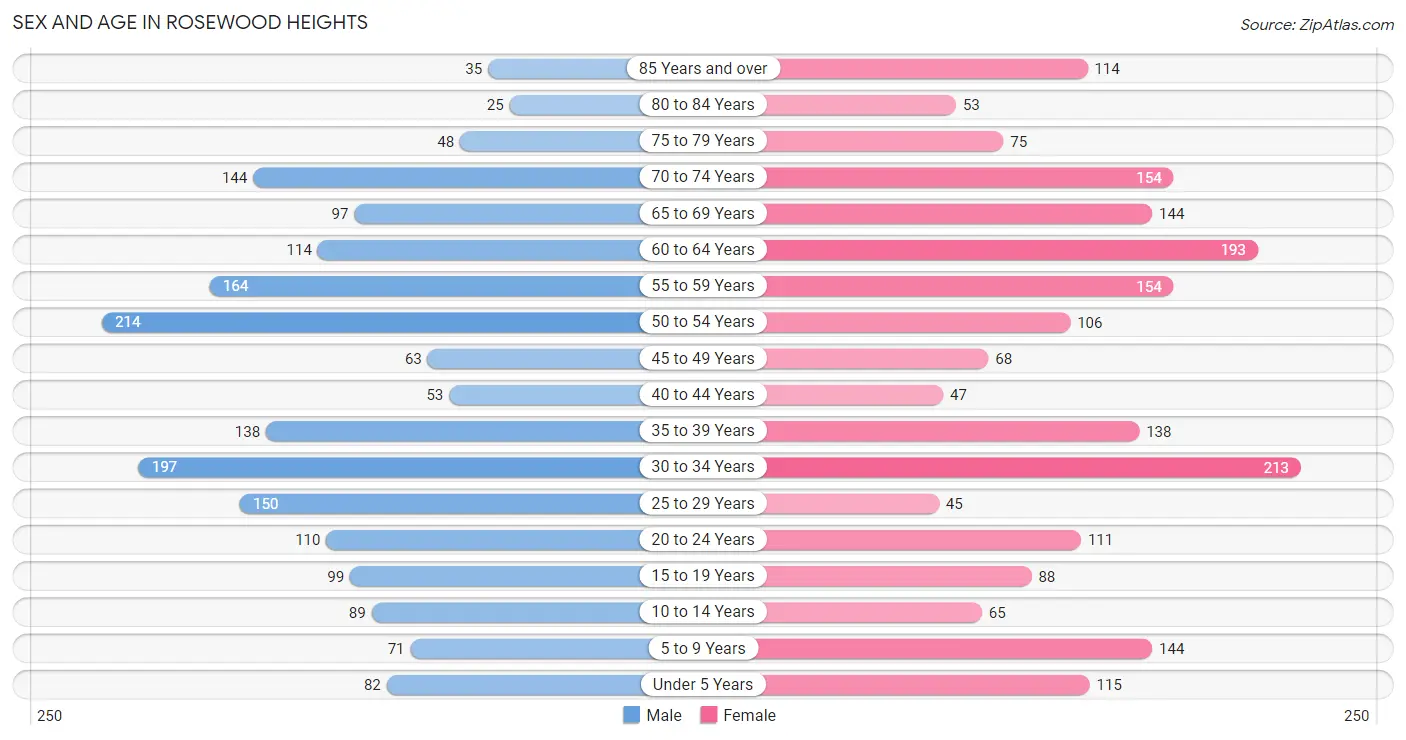
Sex and Age in Rosewood Heights
Sex and Age in Rosewood Heights
The most populous age groups in Rosewood Heights are 50 to 54 Years (214 | 11.3%) for men and 30 to 34 Years (213 | 10.5%) for women.
| Age Bracket | Male | Female |
| Under 5 Years | 82 (4.3%) | 115 (5.7%) |
| 5 to 9 Years | 71 (3.7%) | 144 (7.1%) |
| 10 to 14 Years | 89 (4.7%) | 65 (3.2%) |
| 15 to 19 Years | 99 (5.2%) | 88 (4.3%) |
| 20 to 24 Years | 110 (5.8%) | 111 (5.5%) |
| 25 to 29 Years | 150 (7.9%) | 45 (2.2%) |
| 30 to 34 Years | 197 (10.4%) | 213 (10.5%) |
| 35 to 39 Years | 138 (7.3%) | 138 (6.8%) |
| 40 to 44 Years | 53 (2.8%) | 47 (2.3%) |
| 45 to 49 Years | 63 (3.3%) | 68 (3.4%) |
| 50 to 54 Years | 214 (11.3%) | 106 (5.2%) |
| 55 to 59 Years | 164 (8.7%) | 154 (7.6%) |
| 60 to 64 Years | 114 (6.0%) | 193 (9.5%) |
| 65 to 69 Years | 97 (5.1%) | 144 (7.1%) |
| 70 to 74 Years | 144 (7.6%) | 154 (7.6%) |
| 75 to 79 Years | 48 (2.5%) | 75 (3.7%) |
| 80 to 84 Years | 25 (1.3%) | 53 (2.6%) |
| 85 Years and over | 35 (1.8%) | 114 (5.6%) |
| Total | 1,893 (100.0%) | 2,027 (100.0%) |
Families and Households in Rosewood Heights
Median Family Size in Rosewood Heights
The median family size in Rosewood Heights is 2.94 persons per family, with single male/father families (46 | 4.1%) accounting for the largest median family size of 5.83 persons per family. On the other hand, single female/mother families (168 | 14.9%) represent the smallest median family size with 2.69 persons per family.
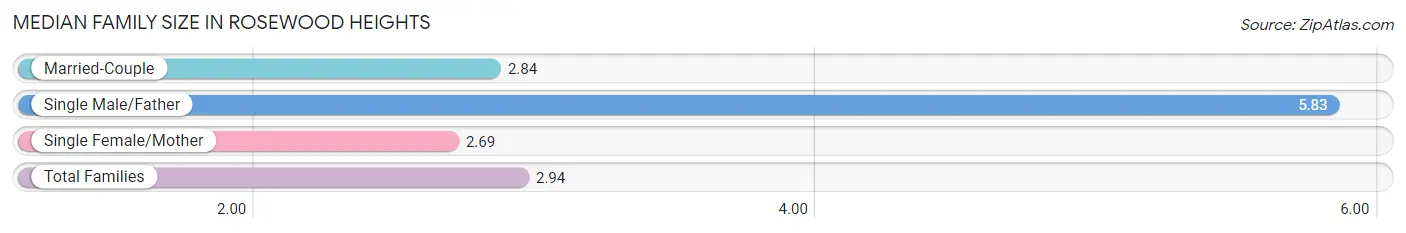
| Family Type | # Families | Family Size |
| Married-Couple | 913 (81.0%) | 2.84 |
| Single Male/Father | 46 (4.1%) | 5.83 |
| Single Female/Mother | 168 (14.9%) | 2.69 |
| Total Families | 1,127 (100.0%) | 2.94 |
Median Household Size in Rosewood Heights
The median household size in Rosewood Heights is 2.45 persons per household, with single male/father households (46 | 2.9%) accounting for the largest median household size of 6.13 persons per household. non-family households (467 | 29.3%) represent the smallest median household size with 1.18 persons per household.
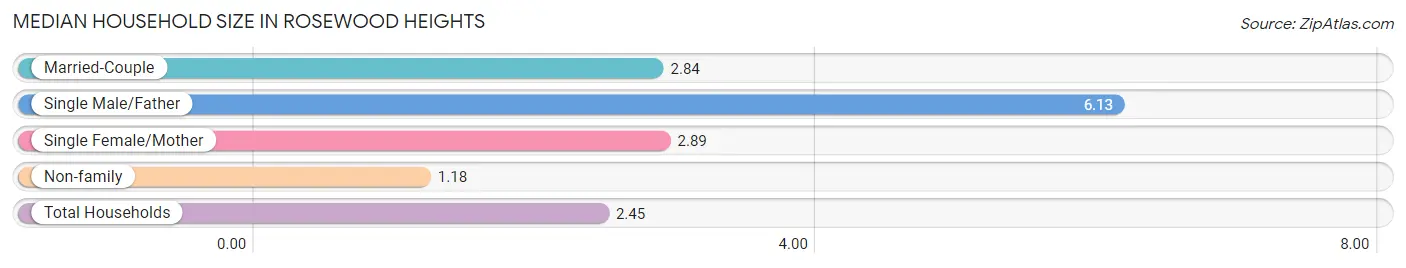
| Household Type | # Households | Household Size |
| Married-Couple | 913 (57.3%) | 2.84 |
| Single Male/Father | 46 (2.9%) | 6.13 |
| Single Female/Mother | 168 (10.5%) | 2.89 |
| Non-family | 467 (29.3%) | 1.18 |
| Total Households | 1,594 (100.0%) | 2.45 |
Household Size by Marriage Status in Rosewood Heights
Out of a total of 1,594 households in Rosewood Heights, 1,127 (70.7%) are family households, while 467 (29.3%) are nonfamily households. The most numerous type of family households are 2-person households, comprising 466, and the most common type of nonfamily households are 1-person households, comprising 396.
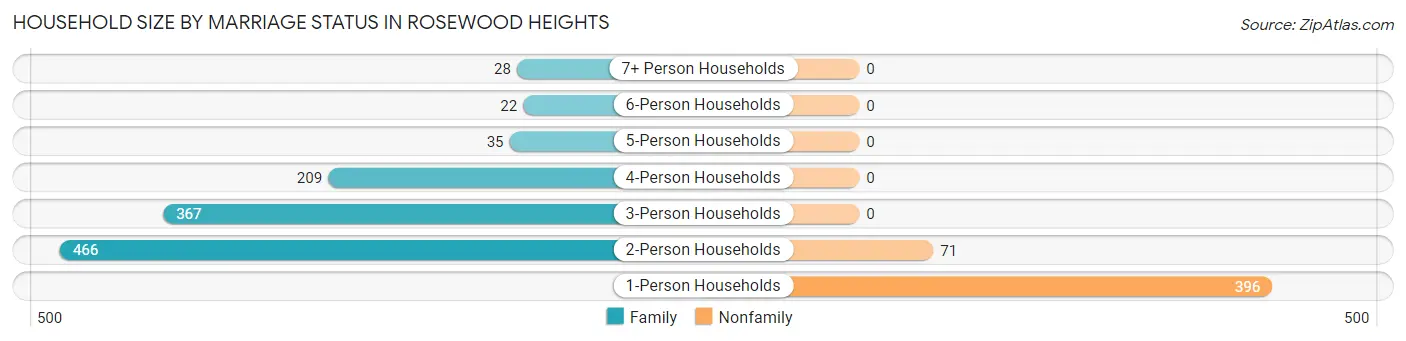
| Household Size | Family Households | Nonfamily Households |
| 1-Person Households | - | 396 (24.8%) |
| 2-Person Households | 466 (29.2%) | 71 (4.4%) |
| 3-Person Households | 367 (23.0%) | 0 (0.0%) |
| 4-Person Households | 209 (13.1%) | 0 (0.0%) |
| 5-Person Households | 35 (2.2%) | 0 (0.0%) |
| 6-Person Households | 22 (1.4%) | 0 (0.0%) |
| 7+ Person Households | 28 (1.8%) | 0 (0.0%) |
| Total | 1,127 (70.7%) | 467 (29.3%) |
Female Fertility in Rosewood Heights
Fertility by Age in Rosewood Heights
Average fertility rate in Rosewood Heights is 84.0 births per 1,000 women. Women in the age bracket of 20 to 34 years have the highest fertility rate with 95.0 births per 1,000 women. Women in the age bracket of 20 to 34 years acount for 57.4% of all women with births.
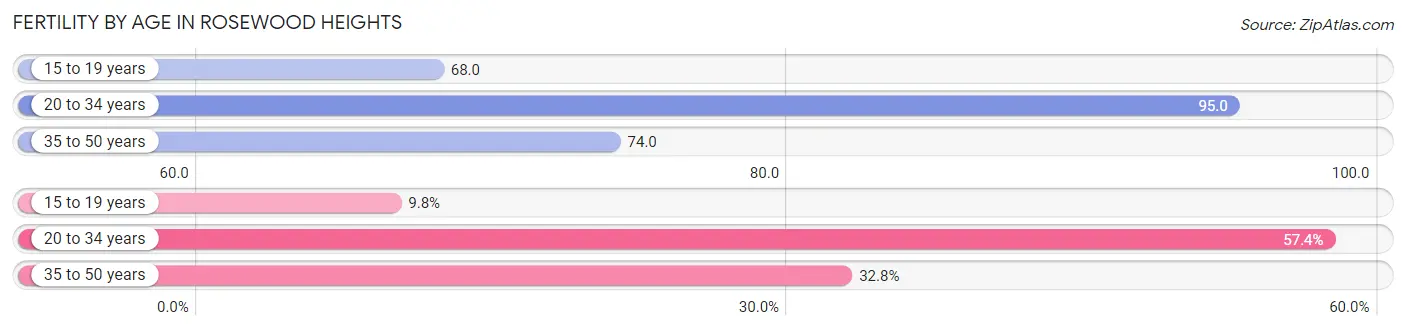
| Age Bracket | Women with Births | Births / 1,000 Women |
| 15 to 19 years | 6 (9.8%) | 68.0 |
| 20 to 34 years | 35 (57.4%) | 95.0 |
| 35 to 50 years | 20 (32.8%) | 74.0 |
| Total | 61 (100.0%) | 84.0 |
Fertility by Age by Marriage Status in Rosewood Heights
67.2% of women with births (61) in Rosewood Heights are married. The highest percentage of unmarried women with births falls into 15 to 19 years age bracket with 100.0% of them unmarried at the time of birth, while the lowest percentage of unmarried women with births belong to 35 to 50 years age bracket with 0.0% of them unmarried.
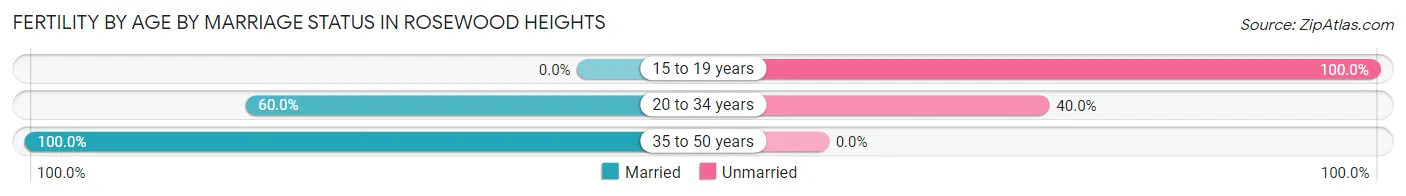
| Age Bracket | Married | Unmarried |
| 15 to 19 years | 0 (0.0%) | 6 (100.0%) |
| 20 to 34 years | 21 (60.0%) | 14 (40.0%) |
| 35 to 50 years | 20 (100.0%) | 0 (0.0%) |
| Total | 41 (67.2%) | 20 (32.8%) |
Fertility by Education in Rosewood Heights
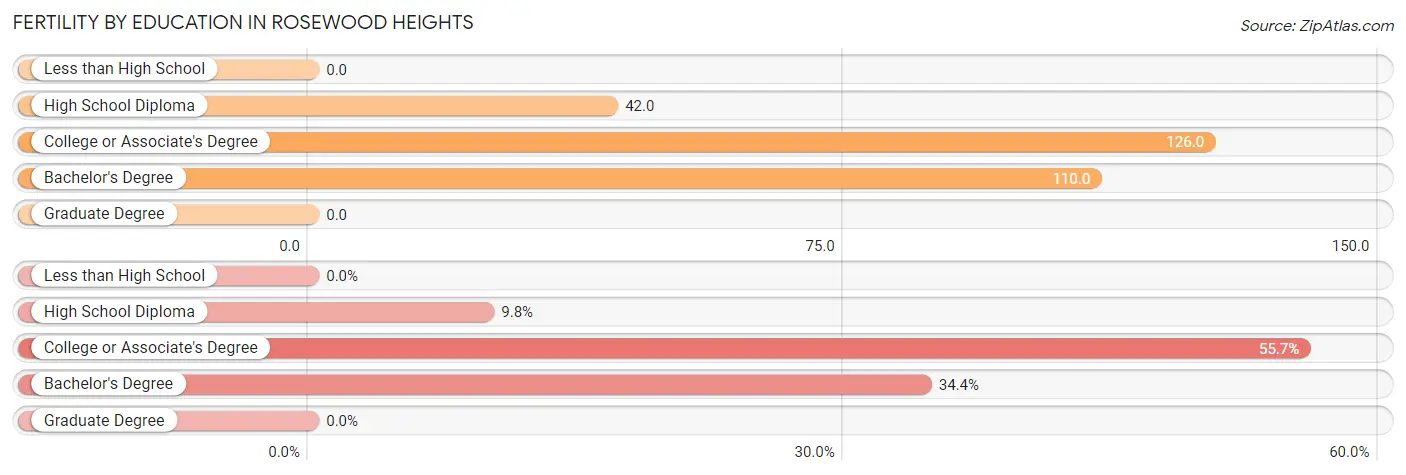
| Educational Attainment | Women with Births | Births / 1,000 Women |
| Less than High School | 0 (0.0%) | 0.0 |
| High School Diploma | 6 (9.8%) | 42.0 |
| College or Associate's Degree | 34 (55.7%) | 126.0 |
| Bachelor's Degree | 21 (34.4%) | 110.0 |
| Graduate Degree | 0 (0.0%) | 0.0 |
| Total | 61 (100.0%) | 84.0 |
Fertility by Education by Marriage Status in Rosewood Heights
32.8% of women with births in Rosewood Heights are unmarried. Women with the educational attainment of bachelor's degree are most likely to be married with 100.0% of them married at childbirth, while women with the educational attainment of high school diploma are least likely to be married with 100.0% of them unmarried at childbirth.
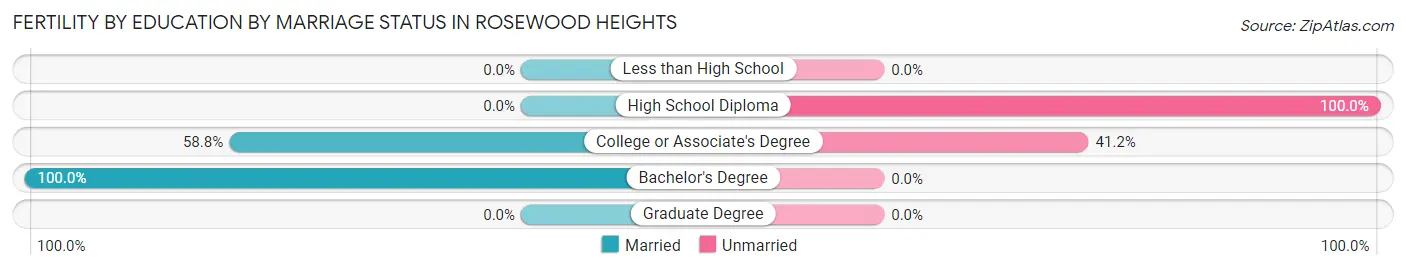
| Educational Attainment | Married | Unmarried |
| Less than High School | 0 (0.0%) | 0 (0.0%) |
| High School Diploma | 0 (0.0%) | 6 (100.0%) |
| College or Associate's Degree | 20 (58.8%) | 14 (41.2%) |
| Bachelor's Degree | 21 (100.0%) | 0 (0.0%) |
| Graduate Degree | 0 (0.0%) | 0 (0.0%) |
| Total | 41 (67.2%) | 20 (32.8%) |
Employment Characteristics in Rosewood Heights
Employment by Class of Employer in Rosewood Heights
Among the 1,802 employed individuals in Rosewood Heights, private company employees (1,329 | 73.8%), local government employees (151 | 8.4%), and not-for-profit organizations (116 | 6.4%) make up the most common classes of employment.
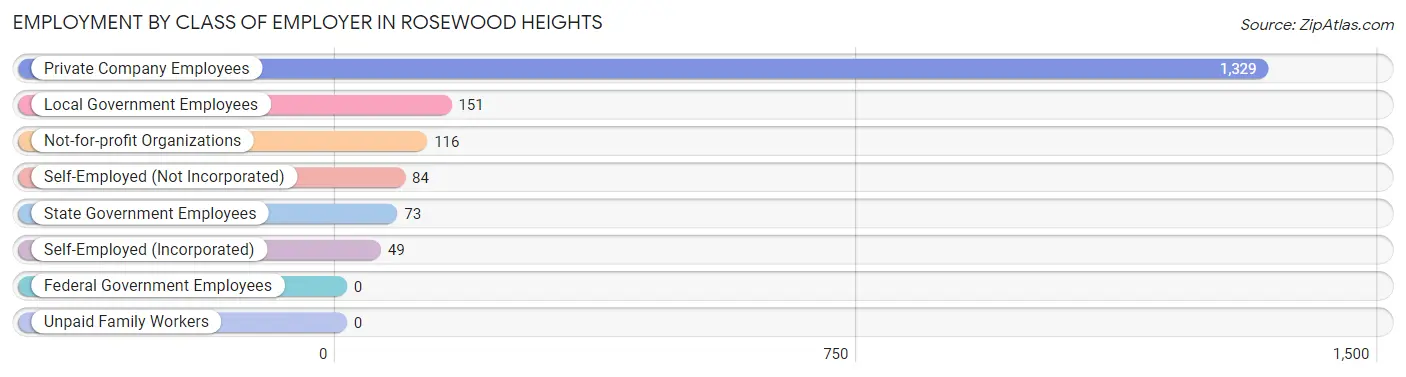
| Employer Class | # Employees | % Employees |
| Private Company Employees | 1,329 | 73.8% |
| Self-Employed (Incorporated) | 49 | 2.7% |
| Self-Employed (Not Incorporated) | 84 | 4.7% |
| Not-for-profit Organizations | 116 | 6.4% |
| Local Government Employees | 151 | 8.4% |
| State Government Employees | 73 | 4.1% |
| Federal Government Employees | 0 | 0.0% |
| Unpaid Family Workers | 0 | 0.0% |
| Total | 1,802 | 100.0% |
Employment Status by Age in Rosewood Heights
According to the labor force statistics for Rosewood Heights, out of the total population over 16 years of age (3,297), 60.7% or 2,001 individuals are in the labor force, with 5.0% or 100 of them unemployed. The age group with the highest labor force participation rate is 25 to 29 years, with 100.0% or 195 individuals in the labor force. Within the labor force, the 20 to 24 years age range has the highest percentage of unemployed individuals, with 15.4% or 29 of them being unemployed.
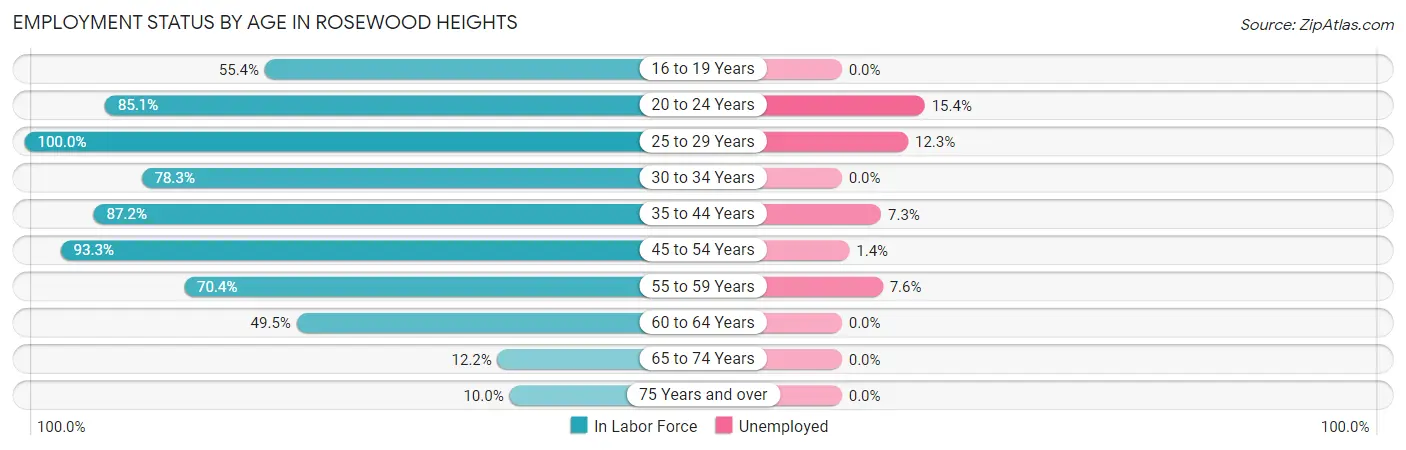
| Age Bracket | In Labor Force | Unemployed |
| 16 to 19 Years | 72 (55.4%) | 0 (0.0%) |
| 20 to 24 Years | 188 (85.1%) | 29 (15.4%) |
| 25 to 29 Years | 195 (100.0%) | 24 (12.3%) |
| 30 to 34 Years | 321 (78.3%) | 0 (0.0%) |
| 35 to 44 Years | 328 (87.2%) | 24 (7.3%) |
| 45 to 54 Years | 421 (93.3%) | 6 (1.4%) |
| 55 to 59 Years | 224 (70.4%) | 17 (7.6%) |
| 60 to 64 Years | 152 (49.5%) | 0 (0.0%) |
| 65 to 74 Years | 66 (12.2%) | 0 (0.0%) |
| 75 Years and over | 35 (10.0%) | 0 (0.0%) |
| Total | 2,001 (60.7%) | 100 (5.0%) |
Employment Status by Educational Attainment in Rosewood Heights
According to labor force statistics for Rosewood Heights, 79.8% of individuals (1,641) out of the total population between 25 and 64 years of age (2,057) are in the labor force, with 4.3% or 71 of them being unemployed. The group with the highest labor force participation rate are those with the educational attainment of college / associate degree, with 91.0% or 671 individuals in the labor force. Within the labor force, individuals with college / associate degree education have the highest percentage of unemployment, with 6.1% or 41 of them being unemployed.
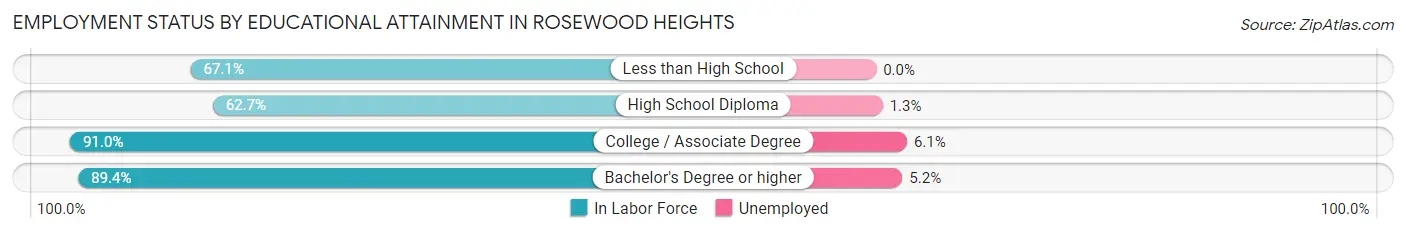
| Educational Attainment | In Labor Force | Unemployed |
| Less than High School | 49 (67.1%) | 0 (0.0%) |
| High School Diploma | 455 (62.7%) | 9 (1.3%) |
| College / Associate Degree | 671 (91.0%) | 45 (6.1%) |
| Bachelor's Degree or higher | 466 (89.4%) | 27 (5.2%) |
| Total | 1,641 (79.8%) | 88 (4.3%) |
Employment Occupations by Sex in Rosewood Heights
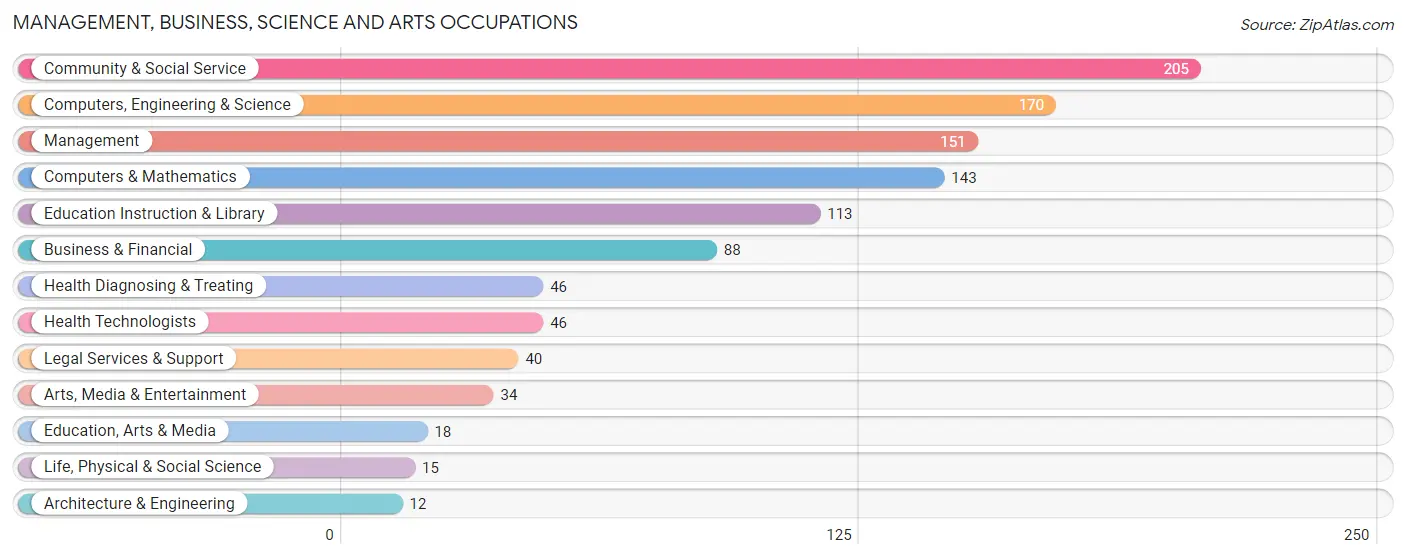
Management, Business, Science and Arts Occupations
The most common Management, Business, Science and Arts occupations in Rosewood Heights are Community & Social Service (205 | 10.8%), Computers, Engineering & Science (170 | 8.9%), Management (151 | 7.9%), Computers & Mathematics (143 | 7.5%), and Education Instruction & Library (113 | 5.9%).
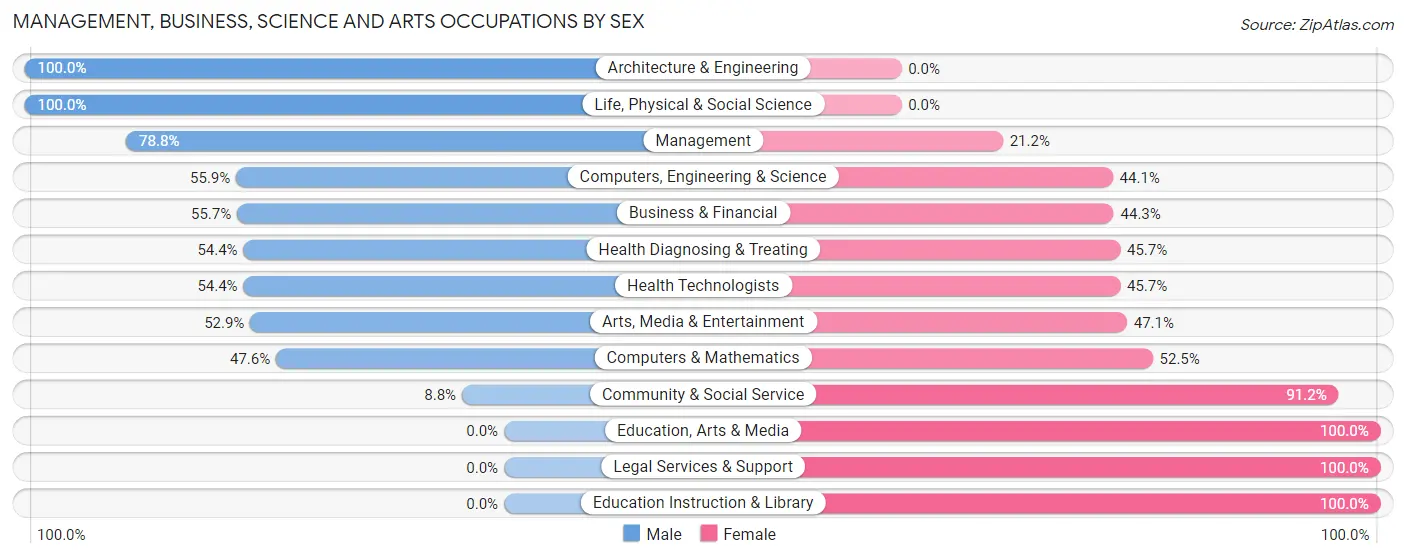
Management, Business, Science and Arts Occupations by Sex
Within the Management, Business, Science and Arts occupations in Rosewood Heights, the most male-oriented occupations are Architecture & Engineering (100.0%), Life, Physical & Social Science (100.0%), and Management (78.8%), while the most female-oriented occupations are Education, Arts & Media (100.0%), Legal Services & Support (100.0%), and Education Instruction & Library (100.0%).
| Occupation | Male | Female |
| Management | 119 (78.8%) | 32 (21.2%) |
| Business & Financial | 49 (55.7%) | 39 (44.3%) |
| Computers, Engineering & Science | 95 (55.9%) | 75 (44.1%) |
| Computers & Mathematics | 68 (47.5%) | 75 (52.4%) |
| Architecture & Engineering | 12 (100.0%) | 0 (0.0%) |
| Life, Physical & Social Science | 15 (100.0%) | 0 (0.0%) |
| Community & Social Service | 18 (8.8%) | 187 (91.2%) |
| Education, Arts & Media | 0 (0.0%) | 18 (100.0%) |
| Legal Services & Support | 0 (0.0%) | 40 (100.0%) |
| Education Instruction & Library | 0 (0.0%) | 113 (100.0%) |
| Arts, Media & Entertainment | 18 (52.9%) | 16 (47.1%) |
| Health Diagnosing & Treating | 25 (54.3%) | 21 (45.7%) |
| Health Technologists | 25 (54.3%) | 21 (45.7%) |
| Total (Category) | 306 (46.4%) | 354 (53.6%) |
| Total (Overall) | 1,090 (57.3%) | 812 (42.7%) |
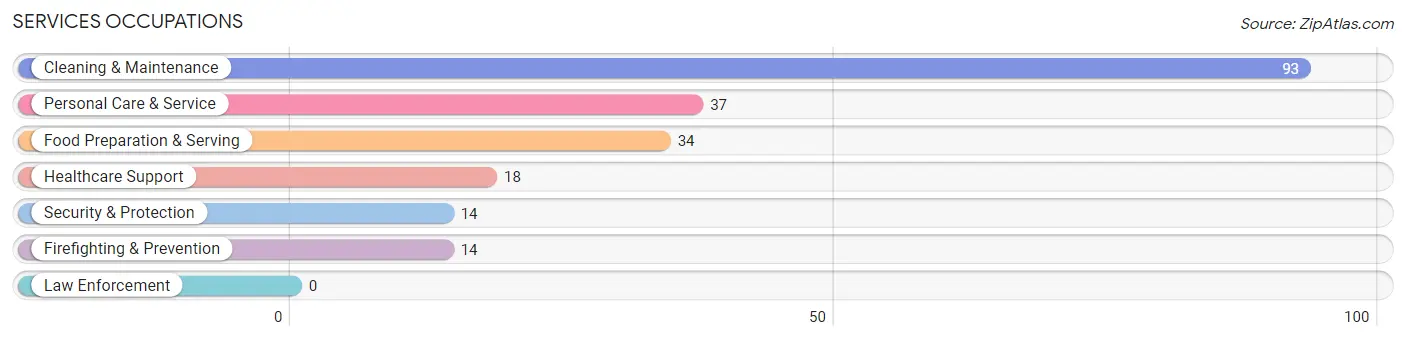
Services Occupations
The most common Services occupations in Rosewood Heights are Cleaning & Maintenance (93 | 4.9%), Personal Care & Service (37 | 1.9%), Food Preparation & Serving (34 | 1.8%), Healthcare Support (18 | 0.9%), and Security & Protection (14 | 0.7%).
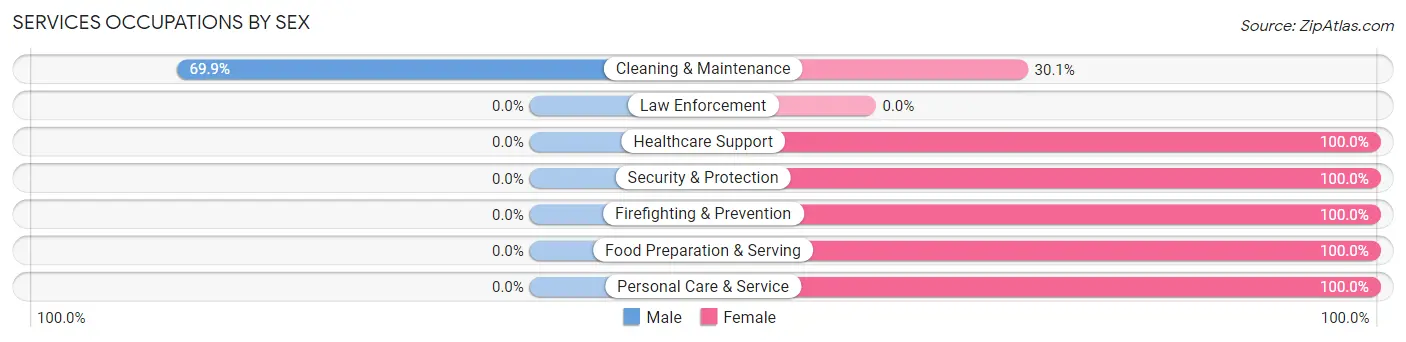
Services Occupations by Sex
| Occupation | Male | Female |
| Healthcare Support | 0 (0.0%) | 18 (100.0%) |
| Security & Protection | 0 (0.0%) | 14 (100.0%) |
| Firefighting & Prevention | 0 (0.0%) | 14 (100.0%) |
| Law Enforcement | 0 (0.0%) | 0 (0.0%) |
| Food Preparation & Serving | 0 (0.0%) | 34 (100.0%) |
| Cleaning & Maintenance | 65 (69.9%) | 28 (30.1%) |
| Personal Care & Service | 0 (0.0%) | 37 (100.0%) |
| Total (Category) | 65 (33.2%) | 131 (66.8%) |
| Total (Overall) | 1,090 (57.3%) | 812 (42.7%) |
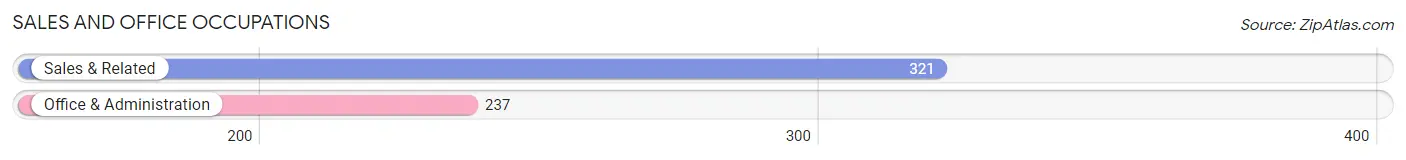
Sales and Office Occupations
The most common Sales and Office occupations in Rosewood Heights are Sales & Related (321 | 16.9%), and Office & Administration (237 | 12.5%).
Sales and Office Occupations by Sex
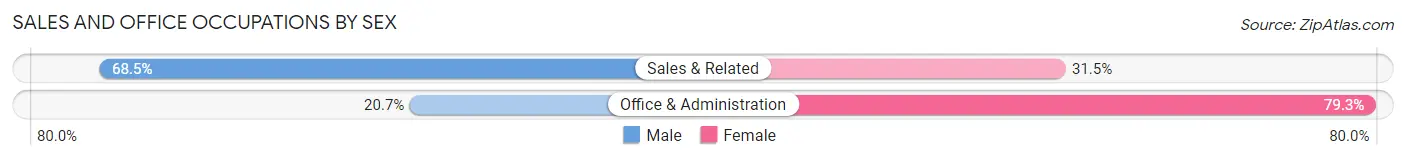
| Occupation | Male | Female |
| Sales & Related | 220 (68.5%) | 101 (31.5%) |
| Office & Administration | 49 (20.7%) | 188 (79.3%) |
| Total (Category) | 269 (48.2%) | 289 (51.8%) |
| Total (Overall) | 1,090 (57.3%) | 812 (42.7%) |
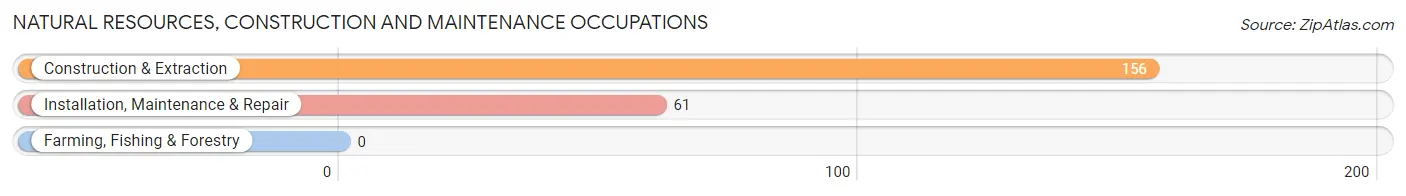
Natural Resources, Construction and Maintenance Occupations
The most common Natural Resources, Construction and Maintenance occupations in Rosewood Heights are Construction & Extraction (156 | 8.2%), and Installation, Maintenance & Repair (61 | 3.2%).
Natural Resources, Construction and Maintenance Occupations by Sex
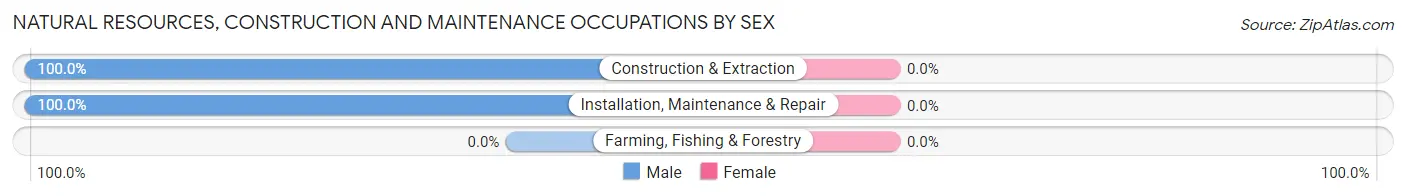
| Occupation | Male | Female |
| Farming, Fishing & Forestry | 0 (0.0%) | 0 (0.0%) |
| Construction & Extraction | 156 (100.0%) | 0 (0.0%) |
| Installation, Maintenance & Repair | 61 (100.0%) | 0 (0.0%) |
| Total (Category) | 217 (100.0%) | 0 (0.0%) |
| Total (Overall) | 1,090 (57.3%) | 812 (42.7%) |
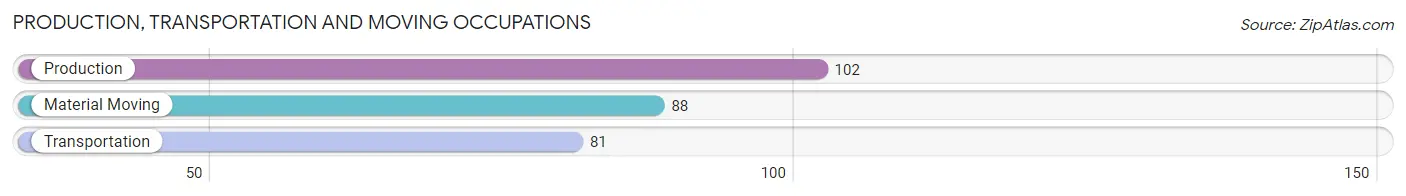
Production, Transportation and Moving Occupations
The most common Production, Transportation and Moving occupations in Rosewood Heights are Production (102 | 5.4%), Material Moving (88 | 4.6%), and Transportation (81 | 4.3%).
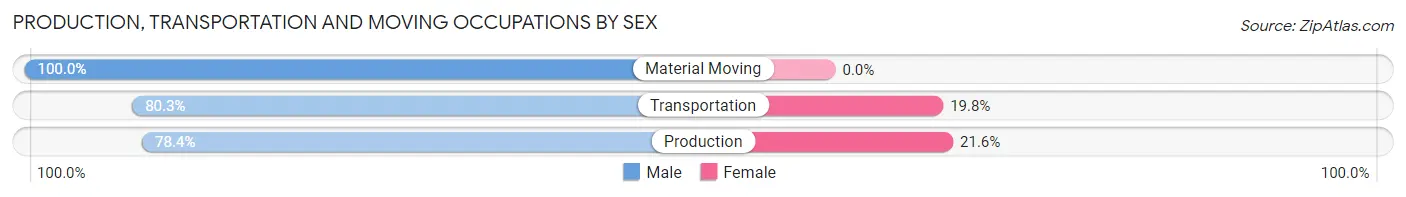
Production, Transportation and Moving Occupations by Sex
| Occupation | Male | Female |
| Production | 80 (78.4%) | 22 (21.6%) |
| Transportation | 65 (80.2%) | 16 (19.8%) |
| Material Moving | 88 (100.0%) | 0 (0.0%) |
| Total (Category) | 233 (86.0%) | 38 (14.0%) |
| Total (Overall) | 1,090 (57.3%) | 812 (42.7%) |
Employment Industries by Sex in Rosewood Heights
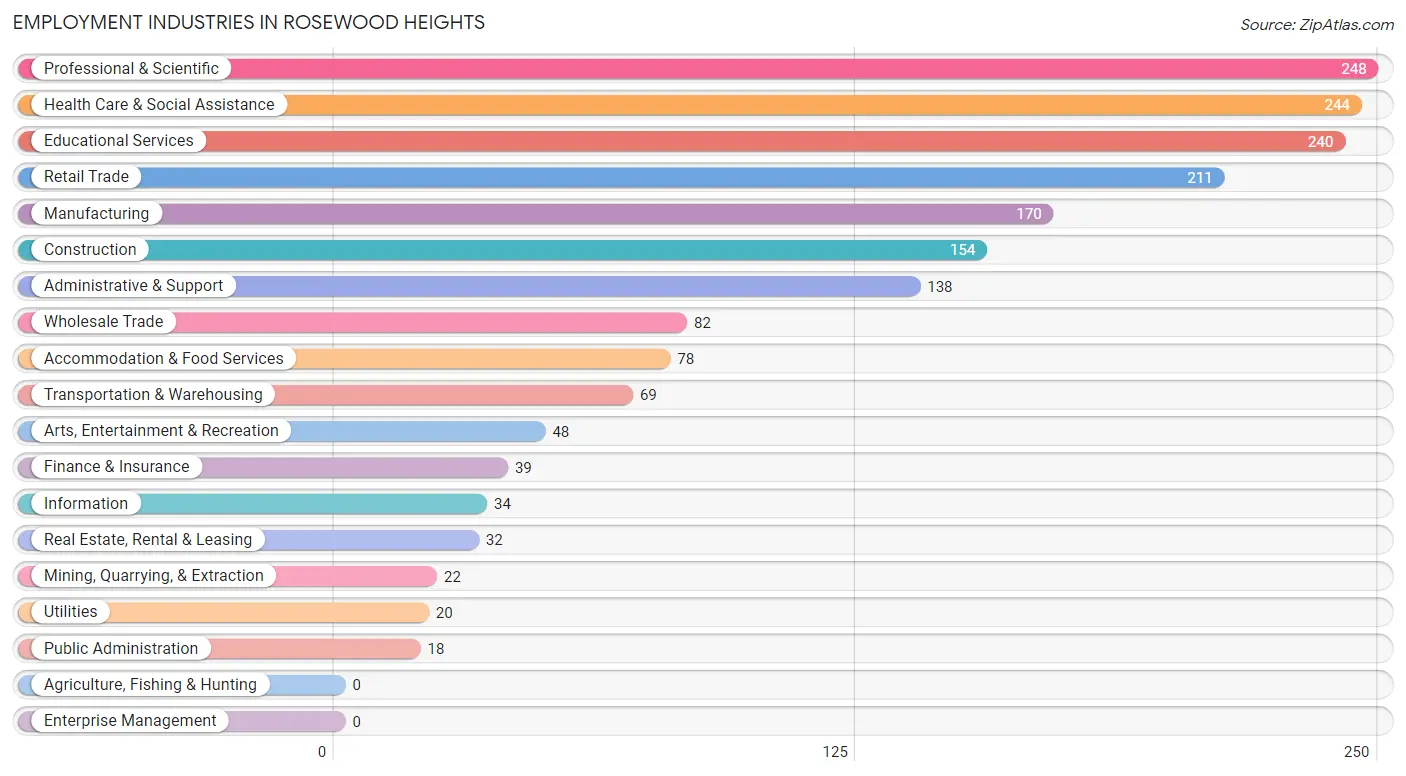
Employment Industries in Rosewood Heights
The major employment industries in Rosewood Heights include Professional & Scientific (248 | 13.0%), Health Care & Social Assistance (244 | 12.8%), Educational Services (240 | 12.6%), Retail Trade (211 | 11.1%), and Manufacturing (170 | 8.9%).
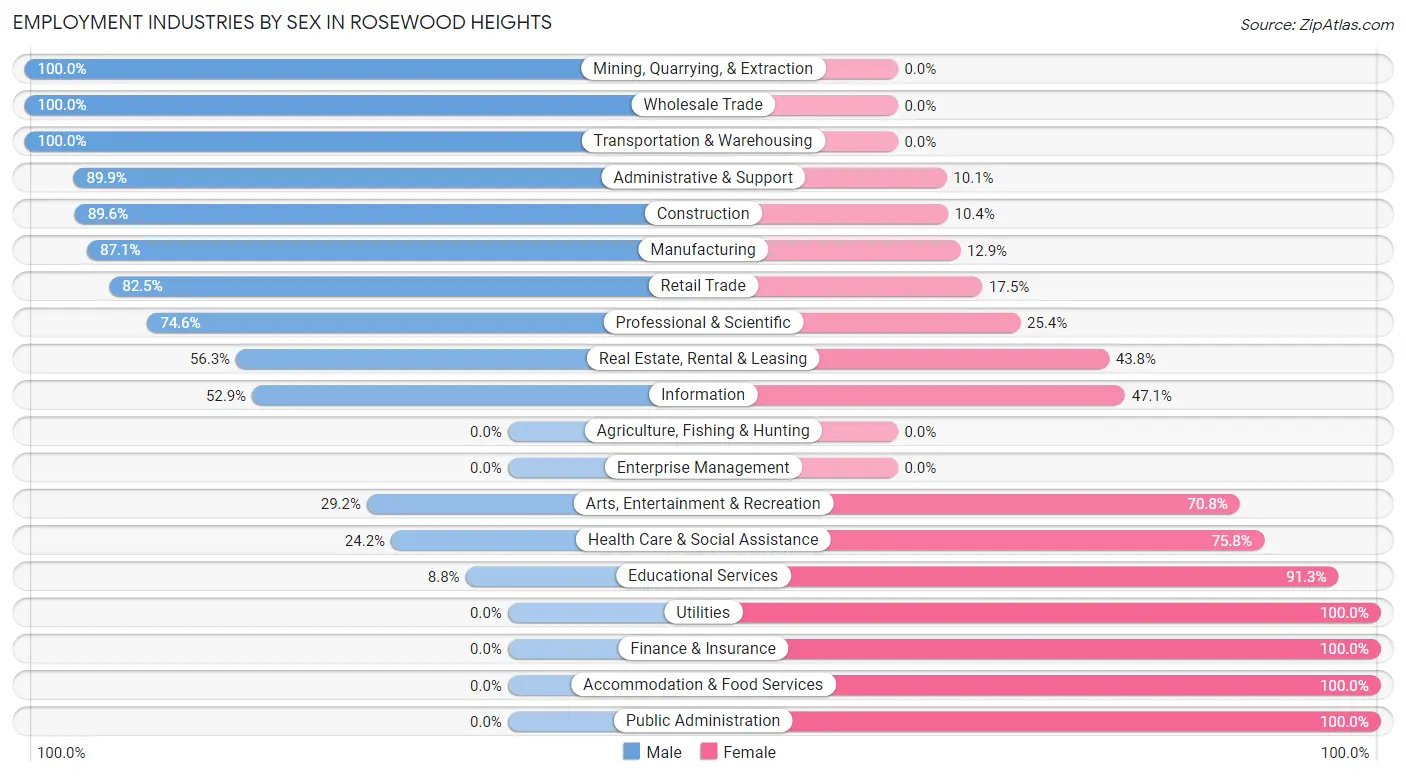
Employment Industries by Sex in Rosewood Heights
The Rosewood Heights industries that see more men than women are Mining, Quarrying, & Extraction (100.0%), Wholesale Trade (100.0%), and Transportation & Warehousing (100.0%), whereas the industries that tend to have a higher number of women are Utilities (100.0%), Finance & Insurance (100.0%), and Accommodation & Food Services (100.0%).
| Industry | Male | Female |
| Agriculture, Fishing & Hunting | 0 (0.0%) | 0 (0.0%) |
| Mining, Quarrying, & Extraction | 22 (100.0%) | 0 (0.0%) |
| Construction | 138 (89.6%) | 16 (10.4%) |
| Manufacturing | 148 (87.1%) | 22 (12.9%) |
| Wholesale Trade | 82 (100.0%) | 0 (0.0%) |
| Retail Trade | 174 (82.5%) | 37 (17.5%) |
| Transportation & Warehousing | 69 (100.0%) | 0 (0.0%) |
| Utilities | 0 (0.0%) | 20 (100.0%) |
| Information | 18 (52.9%) | 16 (47.1%) |
| Finance & Insurance | 0 (0.0%) | 39 (100.0%) |
| Real Estate, Rental & Leasing | 18 (56.2%) | 14 (43.8%) |
| Professional & Scientific | 185 (74.6%) | 63 (25.4%) |
| Enterprise Management | 0 (0.0%) | 0 (0.0%) |
| Administrative & Support | 124 (89.9%) | 14 (10.1%) |
| Educational Services | 21 (8.7%) | 219 (91.2%) |
| Health Care & Social Assistance | 59 (24.2%) | 185 (75.8%) |
| Arts, Entertainment & Recreation | 14 (29.2%) | 34 (70.8%) |
| Accommodation & Food Services | 0 (0.0%) | 78 (100.0%) |
| Public Administration | 0 (0.0%) | 18 (100.0%) |
| Total | 1,090 (57.3%) | 812 (42.7%) |
Education in Rosewood Heights
School Enrollment in Rosewood Heights
The most common levels of schooling among the 755 students in Rosewood Heights are elementary school (206 | 27.3%), high school (174 | 23.1%), and college / undergraduate (106 | 14.0%).

| School Level | # Students | % Students |
| Nursery / Preschool | 68 | 9.0% |
| Kindergarten | 0 | 0.0% |
| Elementary School | 206 | 27.3% |
| Middle School | 97 | 12.9% |
| High School | 174 | 23.1% |
| College / Undergraduate | 106 | 14.0% |
| Graduate / Professional | 104 | 13.8% |
| Total | 755 | 100.0% |
School Enrollment by Age by Funding Source in Rosewood Heights
Out of a total of 755 students who are enrolled in schools in Rosewood Heights, 44 (5.8%) attend a private institution, while the remaining 711 (94.2%) are enrolled in public schools. The age group of 20 to 24 year olds has the highest likelihood of being enrolled in private schools, with 28 (50.0% in the age bracket) enrolled. Conversely, the age group of 3 to 4 year olds has the lowest likelihood of being enrolled in a private school, with 31 (100.0% in the age bracket) attending a public institution.
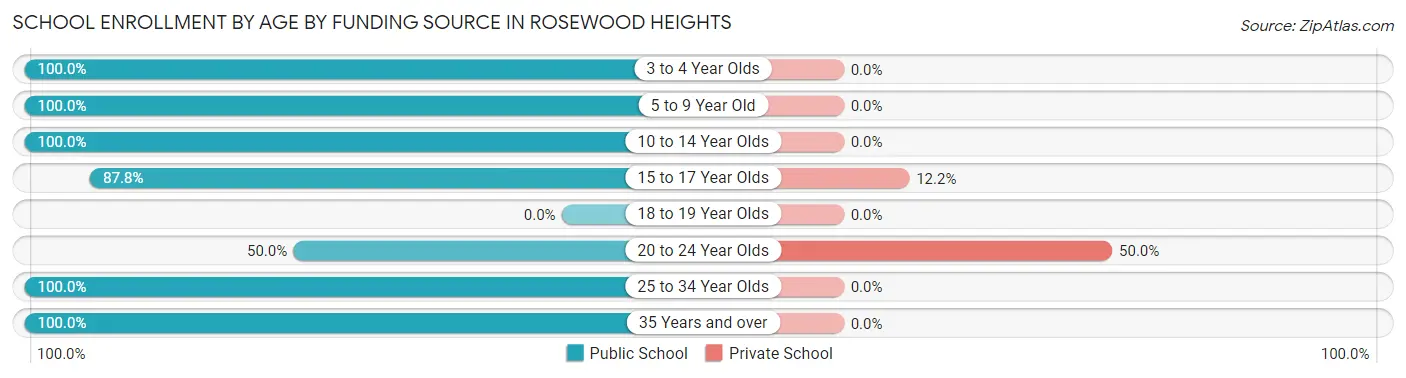
| Age Bracket | Public School | Private School |
| 3 to 4 Year Olds | 31 (100.0%) | 0 (0.0%) |
| 5 to 9 Year Old | 215 (100.0%) | 0 (0.0%) |
| 10 to 14 Year Olds | 154 (100.0%) | 0 (0.0%) |
| 15 to 17 Year Olds | 115 (87.8%) | 16 (12.2%) |
| 18 to 19 Year Olds | 0 (0.0%) | 0 (0.0%) |
| 20 to 24 Year Olds | 28 (50.0%) | 28 (50.0%) |
| 25 to 34 Year Olds | 134 (100.0%) | 0 (0.0%) |
| 35 Years and over | 34 (100.0%) | 0 (0.0%) |
| Total | 711 (94.2%) | 44 (5.8%) |
Educational Attainment by Field of Study in Rosewood Heights
Business (151 | 19.2%), computers & mathematics (149 | 18.9%), education (130 | 16.5%), science & technology (113 | 14.3%), and liberal arts & history (98 | 12.4%) are the most common fields of study among 788 individuals in Rosewood Heights who have obtained a bachelor's degree or higher.
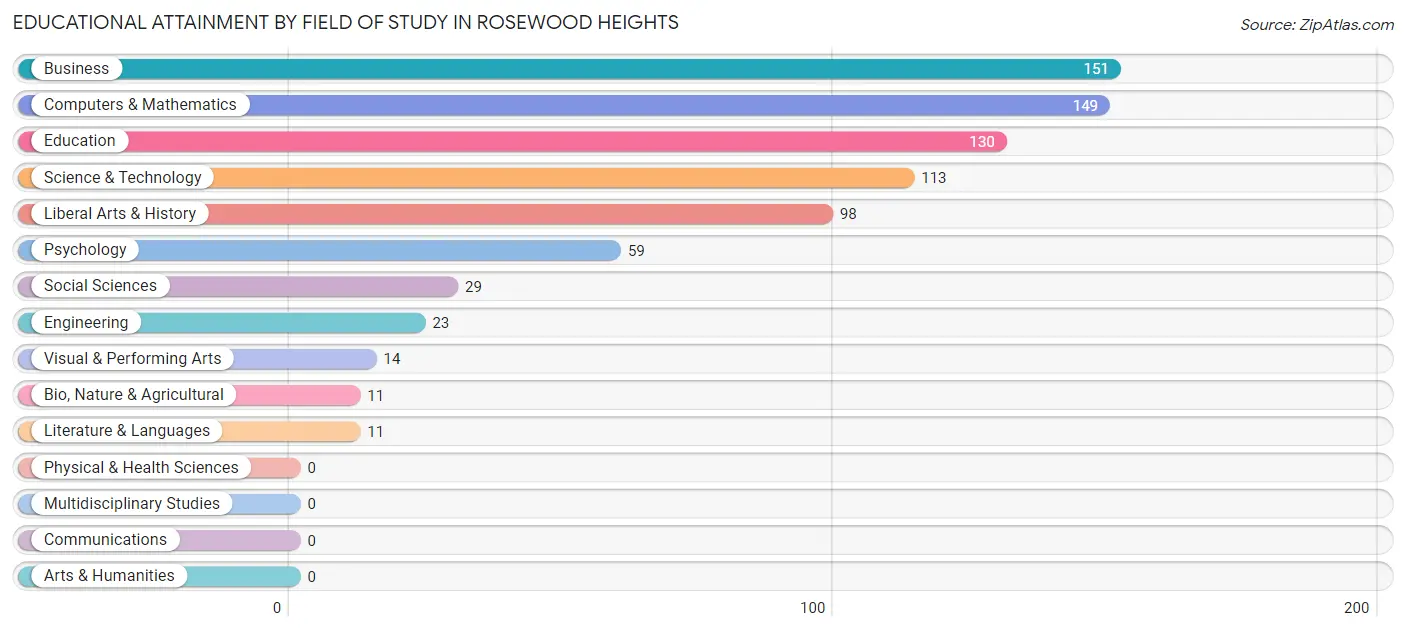
| Field of Study | # Graduates | % Graduates |
| Computers & Mathematics | 149 | 18.9% |
| Bio, Nature & Agricultural | 11 | 1.4% |
| Physical & Health Sciences | 0 | 0.0% |
| Psychology | 59 | 7.5% |
| Social Sciences | 29 | 3.7% |
| Engineering | 23 | 2.9% |
| Multidisciplinary Studies | 0 | 0.0% |
| Science & Technology | 113 | 14.3% |
| Business | 151 | 19.2% |
| Education | 130 | 16.5% |
| Literature & Languages | 11 | 1.4% |
| Liberal Arts & History | 98 | 12.4% |
| Visual & Performing Arts | 14 | 1.8% |
| Communications | 0 | 0.0% |
| Arts & Humanities | 0 | 0.0% |
| Total | 788 | 100.0% |
Transportation & Commute in Rosewood Heights
Vehicle Availability by Sex in Rosewood Heights
The most prevalent vehicle ownership categories in Rosewood Heights are males with 2 vehicles (505, accounting for 48.3%) and females with 2 vehicles (470, making up 66.7%).
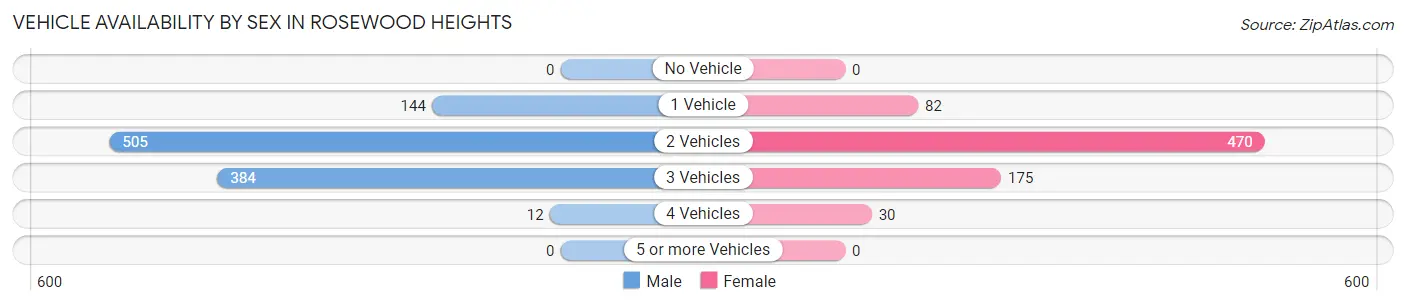
| Vehicles Available | Male | Female |
| No Vehicle | 0 (0.0%) | 0 (0.0%) |
| 1 Vehicle | 144 (13.8%) | 82 (10.8%) |
| 2 Vehicles | 505 (48.3%) | 470 (62.1%) |
| 3 Vehicles | 384 (36.7%) | 175 (23.1%) |
| 4 Vehicles | 12 (1.1%) | 30 (4.0%) |
| 5 or more Vehicles | 0 (0.0%) | 0 (0.0%) |
| Total | 1,045 (100.0%) | 757 (100.0%) |
Commute Time in Rosewood Heights
The most frequently occuring commute durations in Rosewood Heights are 15 to 19 minutes (378 commuters, 24.4%), 5 to 9 minutes (203 commuters, 13.1%), and 10 to 14 minutes (199 commuters, 12.9%).
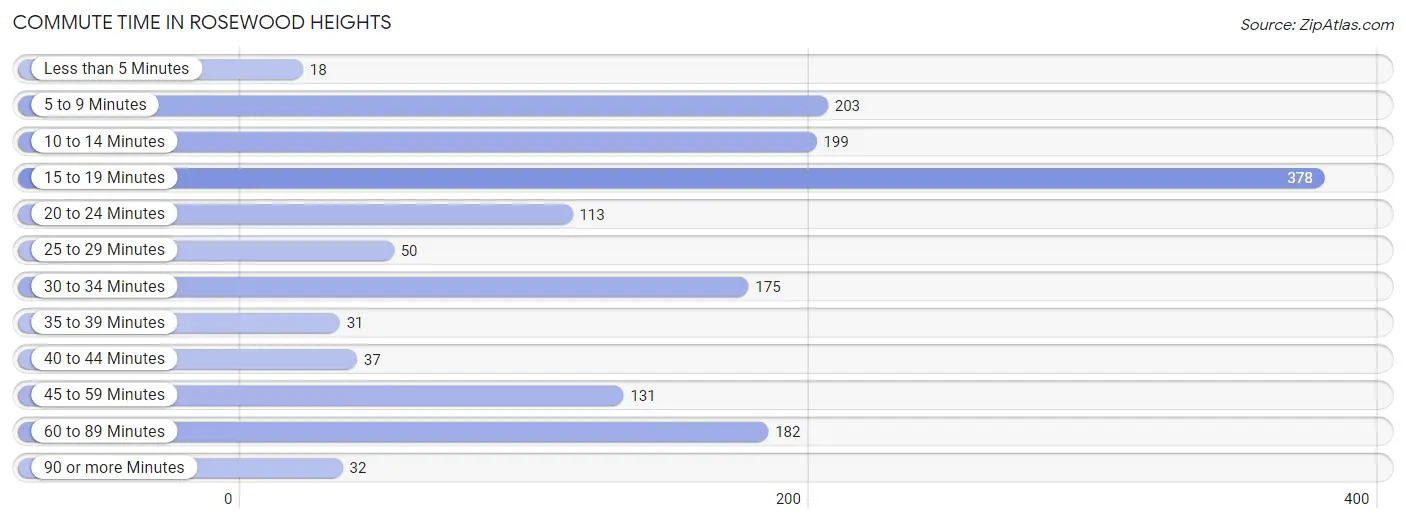
| Commute Time | # Commuters | % Commuters |
| Less than 5 Minutes | 18 | 1.2% |
| 5 to 9 Minutes | 203 | 13.1% |
| 10 to 14 Minutes | 199 | 12.9% |
| 15 to 19 Minutes | 378 | 24.4% |
| 20 to 24 Minutes | 113 | 7.3% |
| 25 to 29 Minutes | 50 | 3.2% |
| 30 to 34 Minutes | 175 | 11.3% |
| 35 to 39 Minutes | 31 | 2.0% |
| 40 to 44 Minutes | 37 | 2.4% |
| 45 to 59 Minutes | 131 | 8.5% |
| 60 to 89 Minutes | 182 | 11.7% |
| 90 or more Minutes | 32 | 2.1% |
Commute Time by Sex in Rosewood Heights
The most common commute times in Rosewood Heights are 15 to 19 minutes (299 commuters, 32.1%) for males and 5 to 9 minutes (129 commuters, 20.9%) for females.
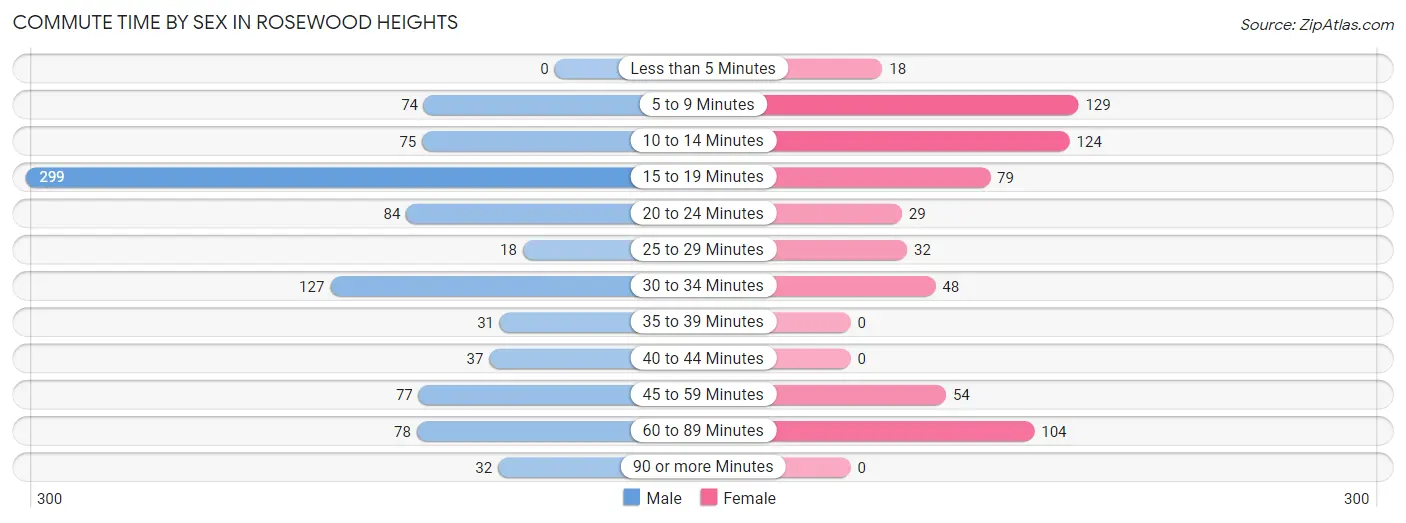
| Commute Time | Male | Female |
| Less than 5 Minutes | 0 (0.0%) | 18 (2.9%) |
| 5 to 9 Minutes | 74 (7.9%) | 129 (20.9%) |
| 10 to 14 Minutes | 75 (8.1%) | 124 (20.1%) |
| 15 to 19 Minutes | 299 (32.1%) | 79 (12.8%) |
| 20 to 24 Minutes | 84 (9.0%) | 29 (4.7%) |
| 25 to 29 Minutes | 18 (1.9%) | 32 (5.2%) |
| 30 to 34 Minutes | 127 (13.6%) | 48 (7.8%) |
| 35 to 39 Minutes | 31 (3.3%) | 0 (0.0%) |
| 40 to 44 Minutes | 37 (4.0%) | 0 (0.0%) |
| 45 to 59 Minutes | 77 (8.3%) | 54 (8.7%) |
| 60 to 89 Minutes | 78 (8.4%) | 104 (16.9%) |
| 90 or more Minutes | 32 (3.4%) | 0 (0.0%) |
Time of Departure to Work by Sex in Rosewood Heights
The most frequent times of departure to work in Rosewood Heights are 6:30 AM to 6:59 AM (201, 21.6%) for males and 7:30 AM to 7:59 AM (189, 30.6%) for females.
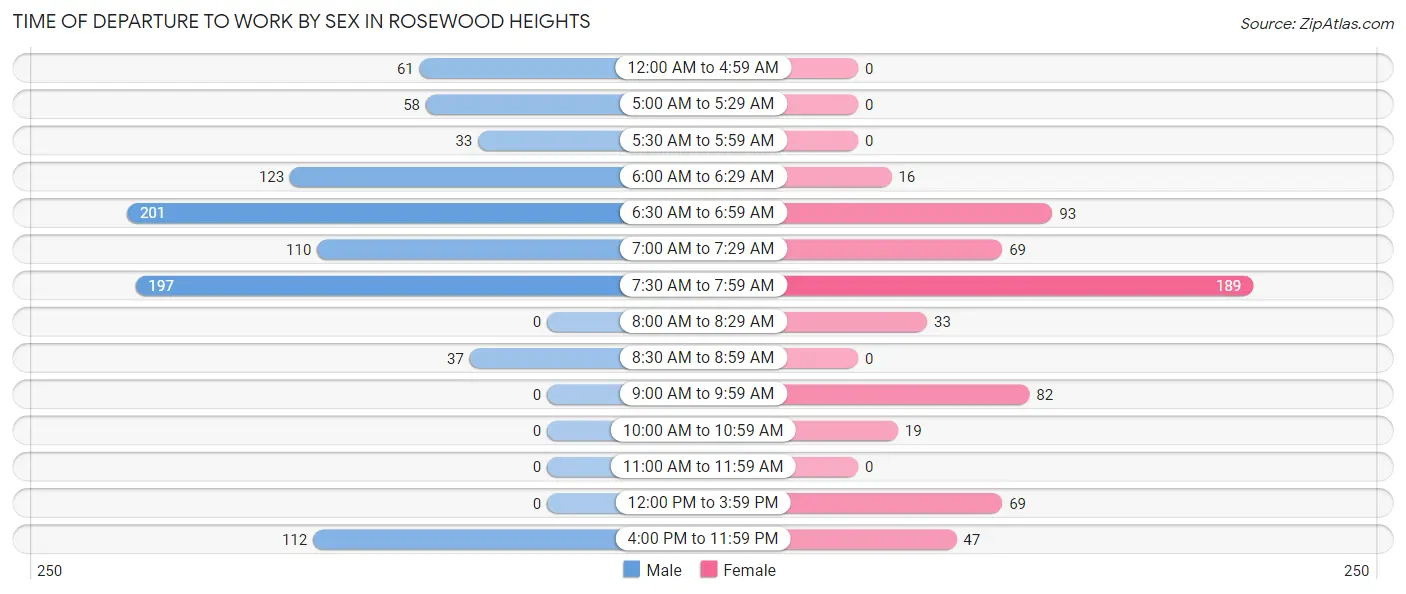
| Time of Departure | Male | Female |
| 12:00 AM to 4:59 AM | 61 (6.6%) | 0 (0.0%) |
| 5:00 AM to 5:29 AM | 58 (6.2%) | 0 (0.0%) |
| 5:30 AM to 5:59 AM | 33 (3.5%) | 0 (0.0%) |
| 6:00 AM to 6:29 AM | 123 (13.2%) | 16 (2.6%) |
| 6:30 AM to 6:59 AM | 201 (21.6%) | 93 (15.1%) |
| 7:00 AM to 7:29 AM | 110 (11.8%) | 69 (11.2%) |
| 7:30 AM to 7:59 AM | 197 (21.1%) | 189 (30.6%) |
| 8:00 AM to 8:29 AM | 0 (0.0%) | 33 (5.3%) |
| 8:30 AM to 8:59 AM | 37 (4.0%) | 0 (0.0%) |
| 9:00 AM to 9:59 AM | 0 (0.0%) | 82 (13.3%) |
| 10:00 AM to 10:59 AM | 0 (0.0%) | 19 (3.1%) |
| 11:00 AM to 11:59 AM | 0 (0.0%) | 0 (0.0%) |
| 12:00 PM to 3:59 PM | 0 (0.0%) | 69 (11.2%) |
| 4:00 PM to 11:59 PM | 112 (12.0%) | 47 (7.6%) |
| Total | 932 (100.0%) | 617 (100.0%) |
Housing Occupancy in Rosewood Heights
Occupancy by Ownership in Rosewood Heights
Of the total 1,594 dwellings in Rosewood Heights, owner-occupied units account for 1,563 (98.1%), while renter-occupied units make up 31 (1.9%).
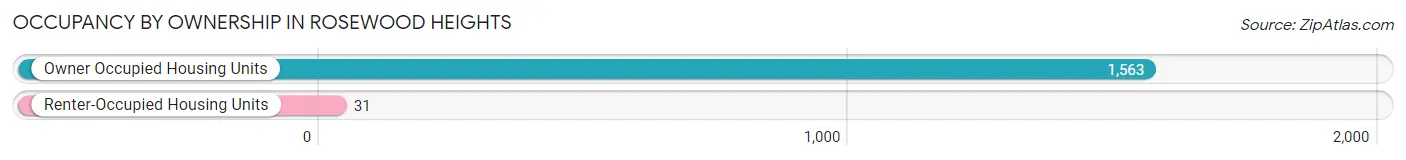
| Occupancy | # Housing Units | % Housing Units |
| Owner Occupied Housing Units | 1,563 | 98.1% |
| Renter-Occupied Housing Units | 31 | 1.9% |
| Total Occupied Housing Units | 1,594 | 100.0% |
Occupancy by Household Size in Rosewood Heights
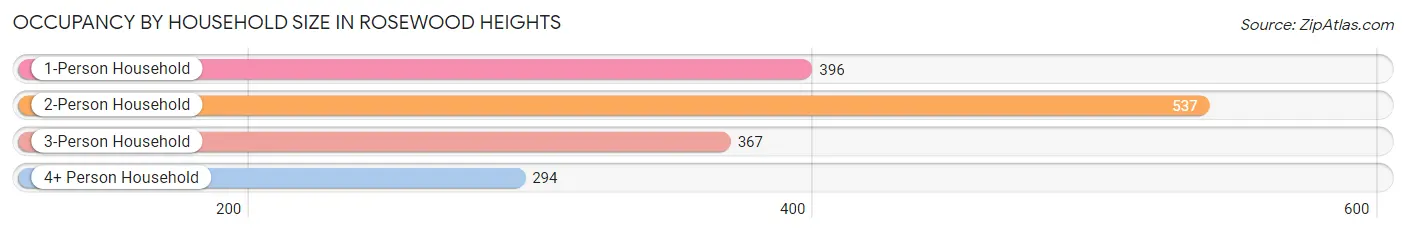
| Household Size | # Housing Units | % Housing Units |
| 1-Person Household | 396 | 24.8% |
| 2-Person Household | 537 | 33.7% |
| 3-Person Household | 367 | 23.0% |
| 4+ Person Household | 294 | 18.4% |
| Total Housing Units | 1,594 | 100.0% |
Occupancy by Ownership by Household Size in Rosewood Heights
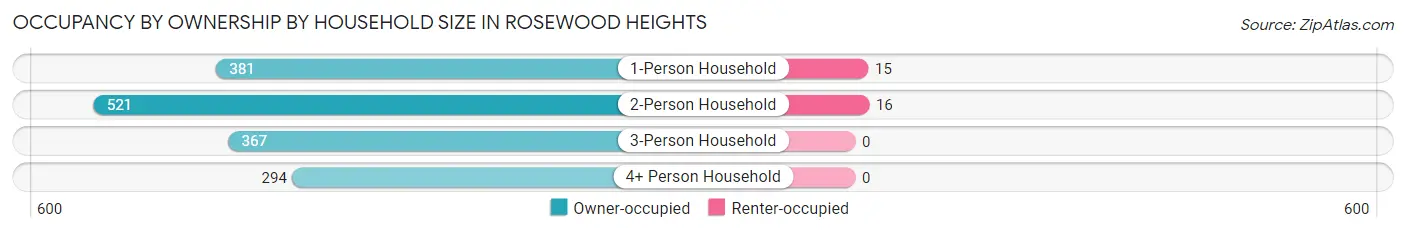
| Household Size | Owner-occupied | Renter-occupied |
| 1-Person Household | 381 (96.2%) | 15 (3.8%) |
| 2-Person Household | 521 (97.0%) | 16 (3.0%) |
| 3-Person Household | 367 (100.0%) | 0 (0.0%) |
| 4+ Person Household | 294 (100.0%) | 0 (0.0%) |
| Total Housing Units | 1,563 (98.1%) | 31 (1.9%) |
Occupancy by Educational Attainment in Rosewood Heights
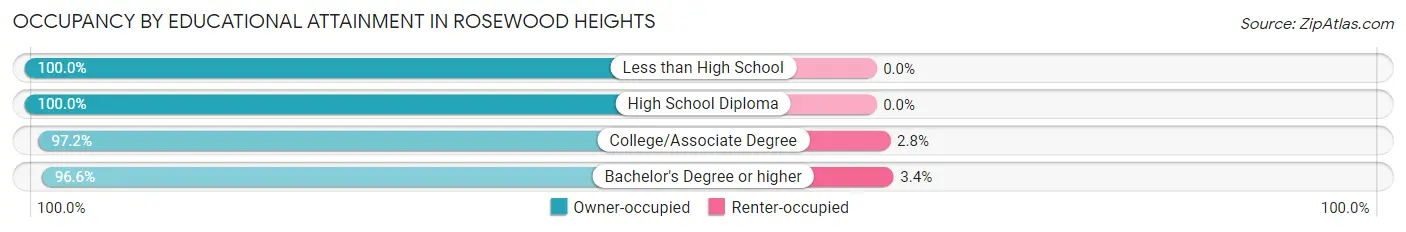
| Household Size | Owner-occupied | Renter-occupied |
| Less than High School | 72 (100.0%) | 0 (0.0%) |
| High School Diploma | 513 (100.0%) | 0 (0.0%) |
| College/Associate Degree | 526 (97.2%) | 15 (2.8%) |
| Bachelor's Degree or higher | 452 (96.6%) | 16 (3.4%) |
Occupancy by Age of Householder in Rosewood Heights
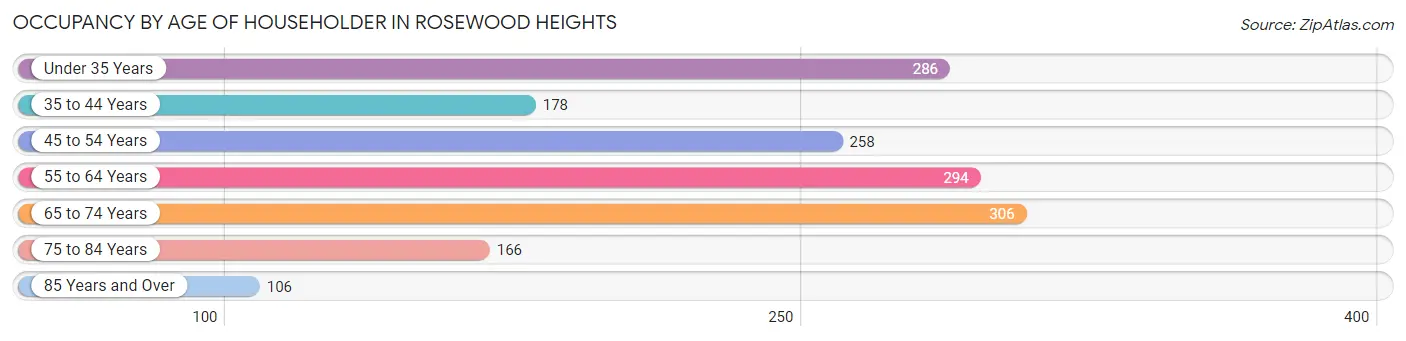
| Age Bracket | # Households | % Households |
| Under 35 Years | 286 | 17.9% |
| 35 to 44 Years | 178 | 11.2% |
| 45 to 54 Years | 258 | 16.2% |
| 55 to 64 Years | 294 | 18.4% |
| 65 to 74 Years | 306 | 19.2% |
| 75 to 84 Years | 166 | 10.4% |
| 85 Years and Over | 106 | 6.7% |
| Total | 1,594 | 100.0% |
Housing Finances in Rosewood Heights
Median Income by Occupancy in Rosewood Heights
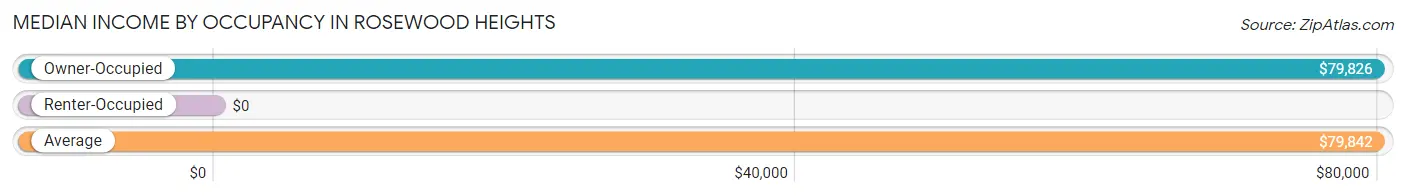
| Occupancy Type | # Households | Median Income |
| Owner-Occupied | 1,563 (98.1%) | $79,826 |
| Renter-Occupied | 31 (1.9%) | $0 |
| Average | 1,594 (100.0%) | $79,842 |
Occupancy by Householder Income Bracket in Rosewood Heights
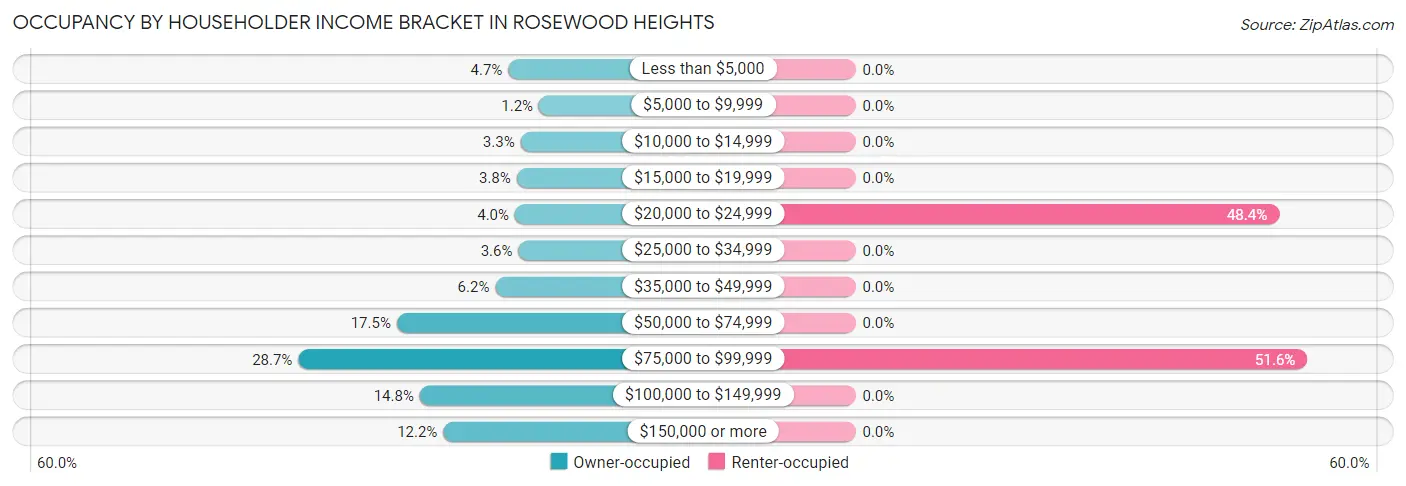
| Income Bracket | Owner-occupied | Renter-occupied |
| Less than $5,000 | 74 (4.7%) | 0 (0.0%) |
| $5,000 to $9,999 | 19 (1.2%) | 0 (0.0%) |
| $10,000 to $14,999 | 52 (3.3%) | 0 (0.0%) |
| $15,000 to $19,999 | 59 (3.8%) | 0 (0.0%) |
| $20,000 to $24,999 | 62 (4.0%) | 15 (48.4%) |
| $25,000 to $34,999 | 56 (3.6%) | 0 (0.0%) |
| $35,000 to $49,999 | 97 (6.2%) | 0 (0.0%) |
| $50,000 to $74,999 | 273 (17.5%) | 0 (0.0%) |
| $75,000 to $99,999 | 449 (28.7%) | 16 (51.6%) |
| $100,000 to $149,999 | 232 (14.8%) | 0 (0.0%) |
| $150,000 or more | 190 (12.2%) | 0 (0.0%) |
| Total | 1,563 (100.0%) | 31 (100.0%) |
Monthly Housing Cost Tiers in Rosewood Heights
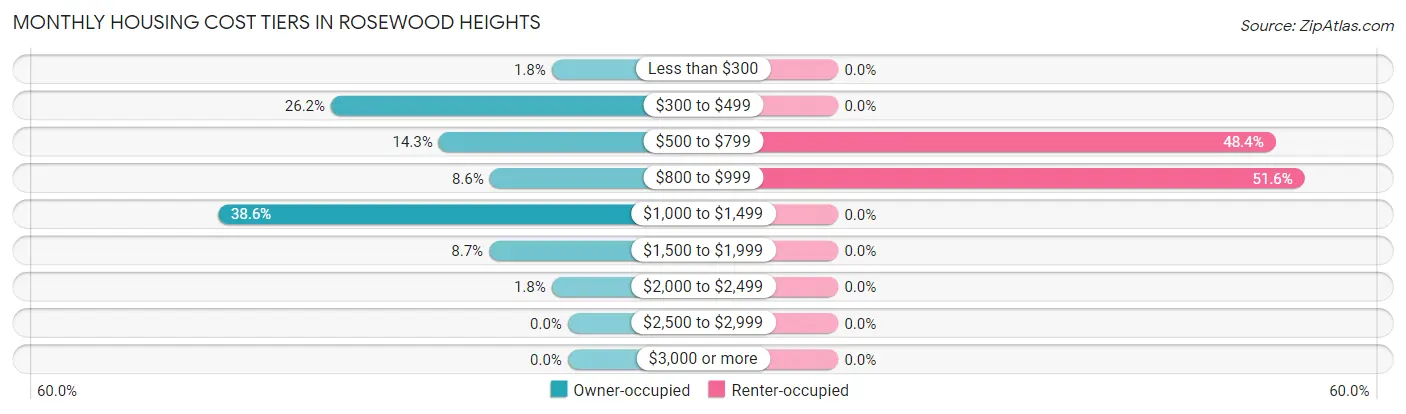
| Monthly Cost | Owner-occupied | Renter-occupied |
| Less than $300 | 28 (1.8%) | 0 (0.0%) |
| $300 to $499 | 409 (26.2%) | 0 (0.0%) |
| $500 to $799 | 223 (14.3%) | 15 (48.4%) |
| $800 to $999 | 135 (8.6%) | 16 (51.6%) |
| $1,000 to $1,499 | 604 (38.6%) | 0 (0.0%) |
| $1,500 to $1,999 | 136 (8.7%) | 0 (0.0%) |
| $2,000 to $2,499 | 28 (1.8%) | 0 (0.0%) |
| $2,500 to $2,999 | 0 (0.0%) | 0 (0.0%) |
| $3,000 or more | 0 (0.0%) | 0 (0.0%) |
| Total | 1,563 (100.0%) | 31 (100.0%) |
Physical Housing Characteristics in Rosewood Heights
Housing Structures in Rosewood Heights
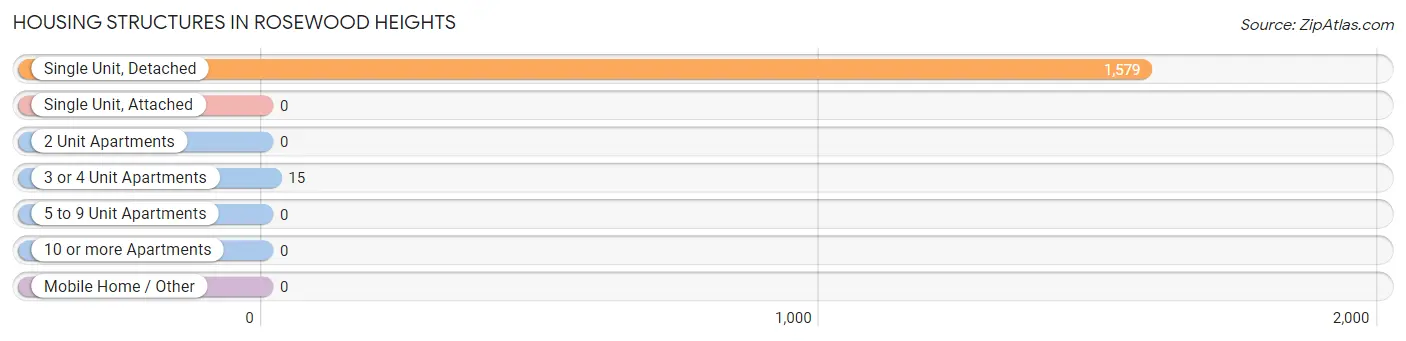
| Structure Type | # Housing Units | % Housing Units |
| Single Unit, Detached | 1,579 | 99.1% |
| Single Unit, Attached | 0 | 0.0% |
| 2 Unit Apartments | 0 | 0.0% |
| 3 or 4 Unit Apartments | 15 | 0.9% |
| 5 to 9 Unit Apartments | 0 | 0.0% |
| 10 or more Apartments | 0 | 0.0% |
| Mobile Home / Other | 0 | 0.0% |
| Total | 1,594 | 100.0% |
Housing Structures by Occupancy in Rosewood Heights
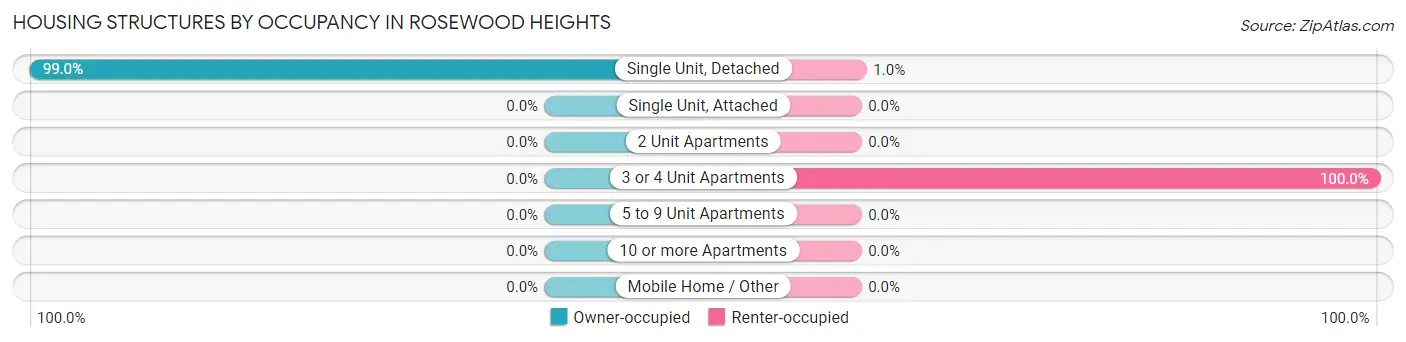
| Structure Type | Owner-occupied | Renter-occupied |
| Single Unit, Detached | 1,563 (99.0%) | 16 (1.0%) |
| Single Unit, Attached | 0 (0.0%) | 0 (0.0%) |
| 2 Unit Apartments | 0 (0.0%) | 0 (0.0%) |
| 3 or 4 Unit Apartments | 0 (0.0%) | 15 (100.0%) |
| 5 to 9 Unit Apartments | 0 (0.0%) | 0 (0.0%) |
| 10 or more Apartments | 0 (0.0%) | 0 (0.0%) |
| Mobile Home / Other | 0 (0.0%) | 0 (0.0%) |
| Total | 1,563 (98.1%) | 31 (1.9%) |
Housing Structures by Number of Rooms in Rosewood Heights
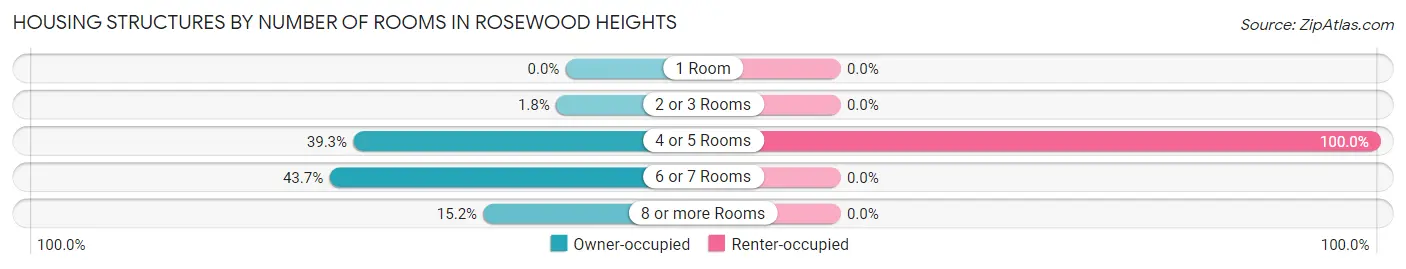
| Number of Rooms | Owner-occupied | Renter-occupied |
| 1 Room | 0 (0.0%) | 0 (0.0%) |
| 2 or 3 Rooms | 28 (1.8%) | 0 (0.0%) |
| 4 or 5 Rooms | 614 (39.3%) | 31 (100.0%) |
| 6 or 7 Rooms | 683 (43.7%) | 0 (0.0%) |
| 8 or more Rooms | 238 (15.2%) | 0 (0.0%) |
| Total | 1,563 (100.0%) | 31 (100.0%) |
Housing Structure by Heating Type in Rosewood Heights
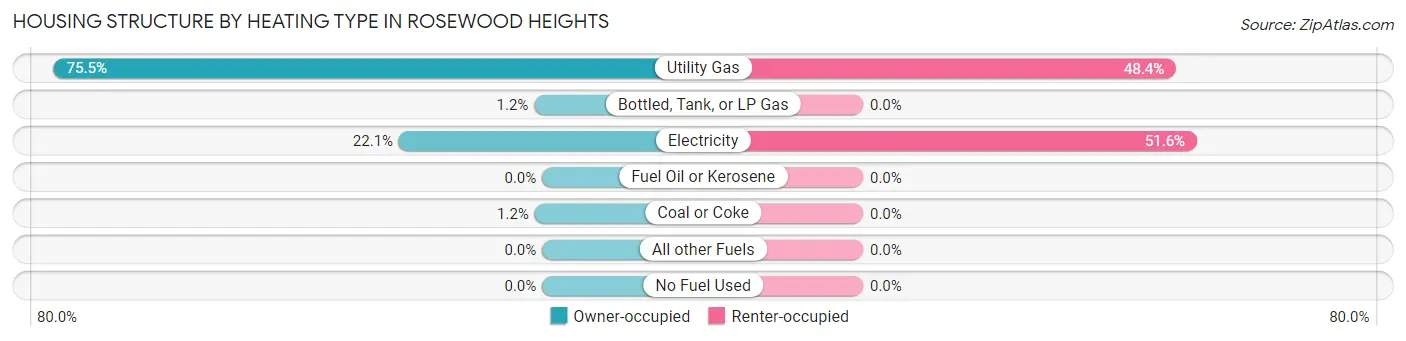
| Heating Type | Owner-occupied | Renter-occupied |
| Utility Gas | 1,180 (75.5%) | 15 (48.4%) |
| Bottled, Tank, or LP Gas | 19 (1.2%) | 0 (0.0%) |
| Electricity | 346 (22.1%) | 16 (51.6%) |
| Fuel Oil or Kerosene | 0 (0.0%) | 0 (0.0%) |
| Coal or Coke | 18 (1.1%) | 0 (0.0%) |
| All other Fuels | 0 (0.0%) | 0 (0.0%) |
| No Fuel Used | 0 (0.0%) | 0 (0.0%) |
| Total | 1,563 (100.0%) | 31 (100.0%) |
Household Vehicle Usage in Rosewood Heights
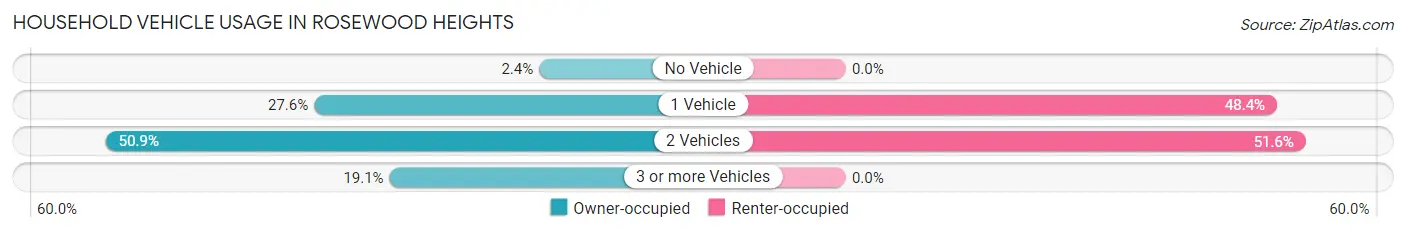
| Vehicles per Household | Owner-occupied | Renter-occupied |
| No Vehicle | 37 (2.4%) | 0 (0.0%) |
| 1 Vehicle | 431 (27.6%) | 15 (48.4%) |
| 2 Vehicles | 796 (50.9%) | 16 (51.6%) |
| 3 or more Vehicles | 299 (19.1%) | 0 (0.0%) |
| Total | 1,563 (100.0%) | 31 (100.0%) |
Real Estate & Mortgages in Rosewood Heights
Real Estate and Mortgage Overview in Rosewood Heights
| Characteristic | Without Mortgage | With Mortgage |
| Housing Units | 640 | 923 |
| Median Property Value | $104,400 | $129,800 |
| Median Household Income | $54,844 | $159 |
| Monthly Housing Costs | $432 | $0 |
| Real Estate Taxes | $1,660 | $0 |
Property Value by Mortgage Status in Rosewood Heights
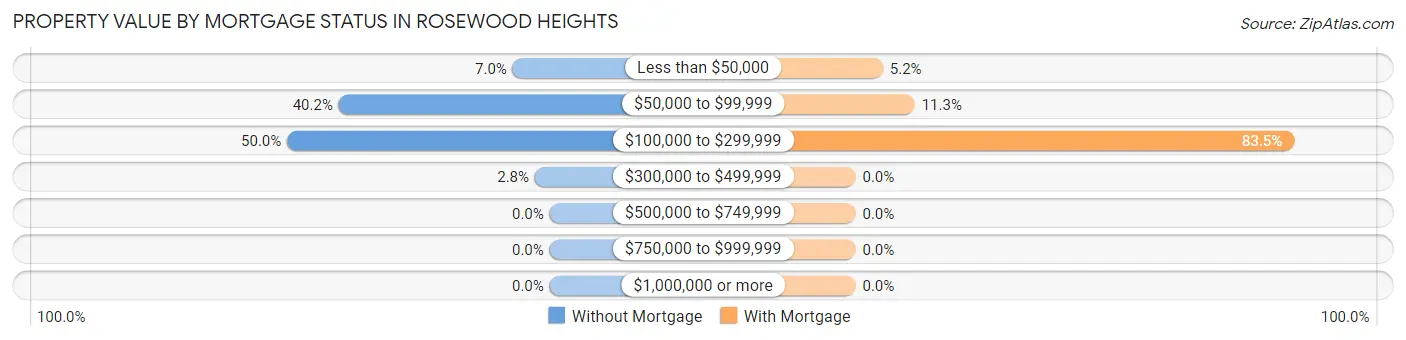
| Property Value | Without Mortgage | With Mortgage |
| Less than $50,000 | 45 (7.0%) | 48 (5.2%) |
| $50,000 to $99,999 | 257 (40.2%) | 104 (11.3%) |
| $100,000 to $299,999 | 320 (50.0%) | 771 (83.5%) |
| $300,000 to $499,999 | 18 (2.8%) | 0 (0.0%) |
| $500,000 to $749,999 | 0 (0.0%) | 0 (0.0%) |
| $750,000 to $999,999 | 0 (0.0%) | 0 (0.0%) |
| $1,000,000 or more | 0 (0.0%) | 0 (0.0%) |
| Total | 640 (100.0%) | 923 (100.0%) |
Household Income by Mortgage Status in Rosewood Heights
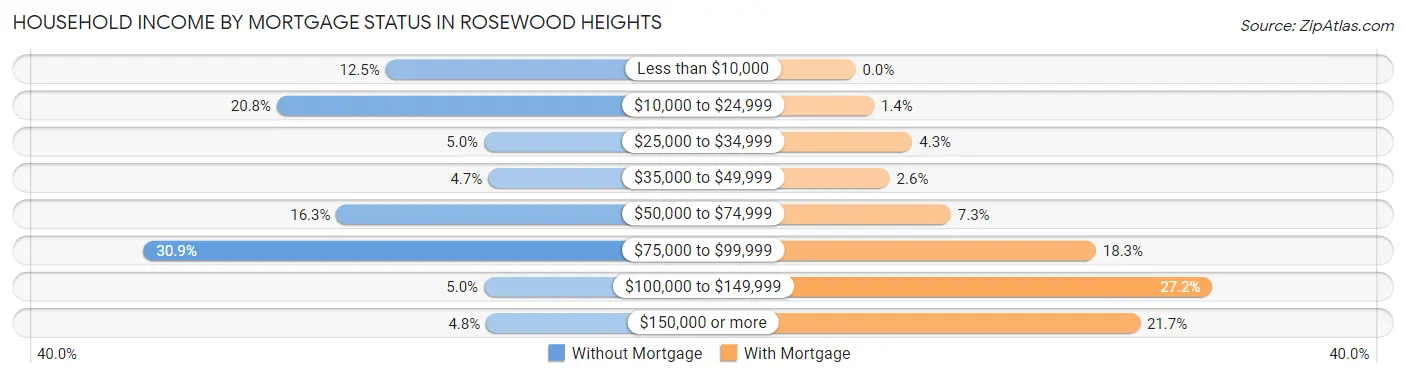
| Household Income | Without Mortgage | With Mortgage |
| Less than $10,000 | 80 (12.5%) | 0 (0.0%) |
| $10,000 to $24,999 | 133 (20.8%) | 13 (1.4%) |
| $25,000 to $34,999 | 32 (5.0%) | 40 (4.3%) |
| $35,000 to $49,999 | 30 (4.7%) | 24 (2.6%) |
| $50,000 to $74,999 | 104 (16.3%) | 67 (7.3%) |
| $75,000 to $99,999 | 198 (30.9%) | 169 (18.3%) |
| $100,000 to $149,999 | 32 (5.0%) | 251 (27.2%) |
| $150,000 or more | 31 (4.8%) | 200 (21.7%) |
| Total | 640 (100.0%) | 923 (100.0%) |
Property Value to Household Income Ratio in Rosewood Heights
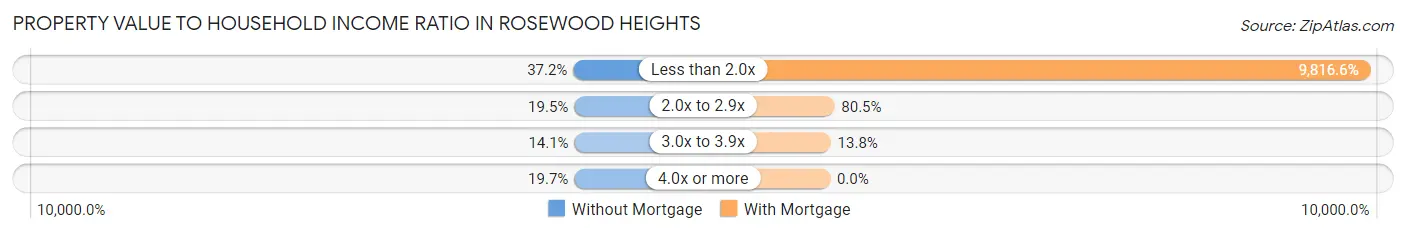
| Value-to-Income Ratio | Without Mortgage | With Mortgage |
| Less than 2.0x | 238 (37.2%) | 90,607 (9,816.6%) |
| 2.0x to 2.9x | 125 (19.5%) | 743 (80.5%) |
| 3.0x to 3.9x | 90 (14.1%) | 127 (13.8%) |
| 4.0x or more | 126 (19.7%) | 0 (0.0%) |
| Total | 640 (100.0%) | 923 (100.0%) |
Real Estate Taxes by Mortgage Status in Rosewood Heights
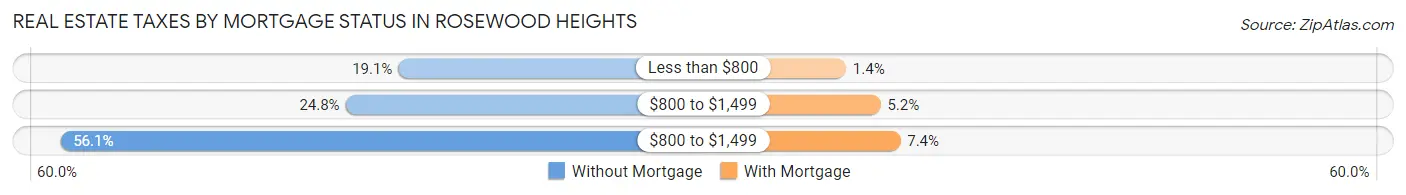
| Property Taxes | Without Mortgage | With Mortgage |
| Less than $800 | 122 (19.1%) | 13 (1.4%) |
| $800 to $1,499 | 159 (24.8%) | 48 (5.2%) |
| $800 to $1,499 | 359 (56.1%) | 68 (7.4%) |
| Total | 640 (100.0%) | 923 (100.0%) |
Health & Disability in Rosewood Heights
Health Insurance Coverage by Age in Rosewood Heights
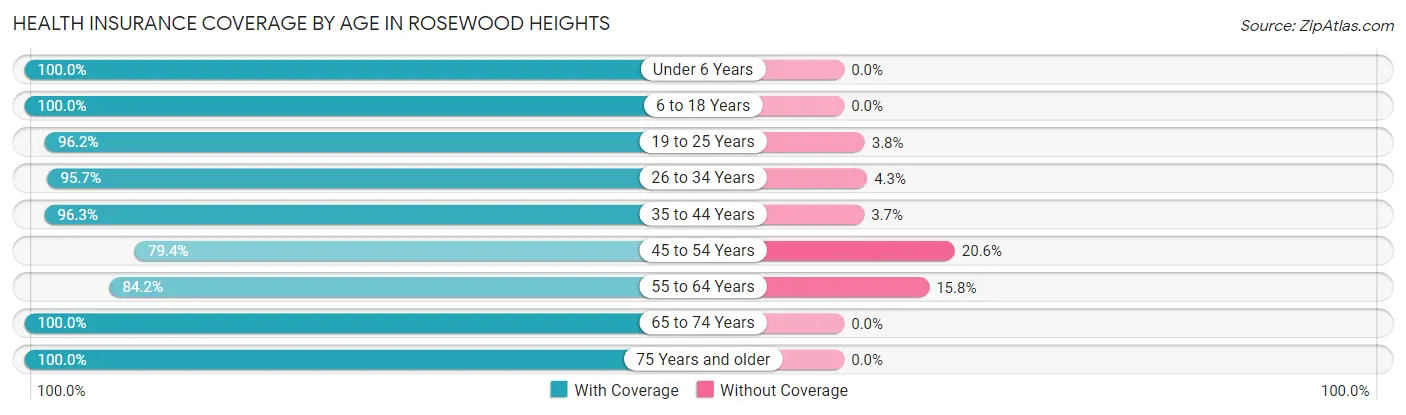
| Age Bracket | With Coverage | Without Coverage |
| Under 6 Years | 234 (100.0%) | 0 (0.0%) |
| 6 to 18 Years | 469 (100.0%) | 0 (0.0%) |
| 19 to 25 Years | 302 (96.2%) | 12 (3.8%) |
| 26 to 34 Years | 538 (95.7%) | 24 (4.3%) |
| 35 to 44 Years | 362 (96.3%) | 14 (3.7%) |
| 45 to 54 Years | 358 (79.4%) | 93 (20.6%) |
| 55 to 64 Years | 526 (84.2%) | 99 (15.8%) |
| 65 to 74 Years | 539 (100.0%) | 0 (0.0%) |
| 75 Years and older | 350 (100.0%) | 0 (0.0%) |
| Total | 3,678 (93.8%) | 242 (6.2%) |
Health Insurance Coverage by Citizenship Status in Rosewood Heights
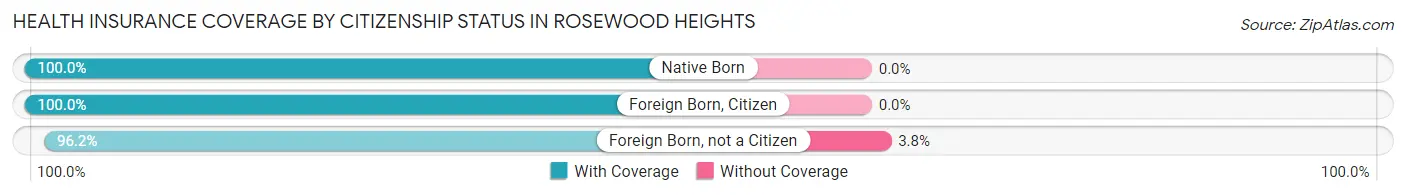
| Citizenship Status | With Coverage | Without Coverage |
| Native Born | 234 (100.0%) | 0 (0.0%) |
| Foreign Born, Citizen | 469 (100.0%) | 0 (0.0%) |
| Foreign Born, not a Citizen | 302 (96.2%) | 12 (3.8%) |
Health Insurance Coverage by Household Income in Rosewood Heights
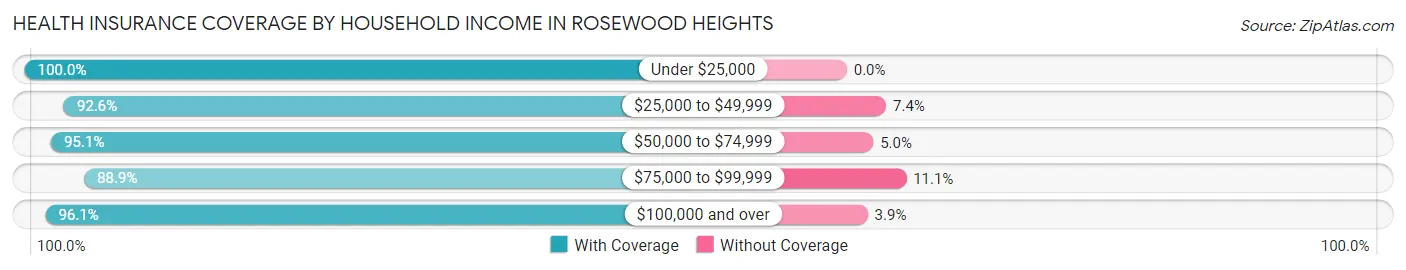
| Household Income | With Coverage | Without Coverage |
| Under $25,000 | 388 (100.0%) | 0 (0.0%) |
| $25,000 to $49,999 | 302 (92.6%) | 24 (7.4%) |
| $50,000 to $74,999 | 692 (95.1%) | 36 (5.0%) |
| $75,000 to $99,999 | 1,054 (88.9%) | 132 (11.1%) |
| $100,000 and over | 1,230 (96.1%) | 50 (3.9%) |
Public vs Private Health Insurance Coverage by Age in Rosewood Heights
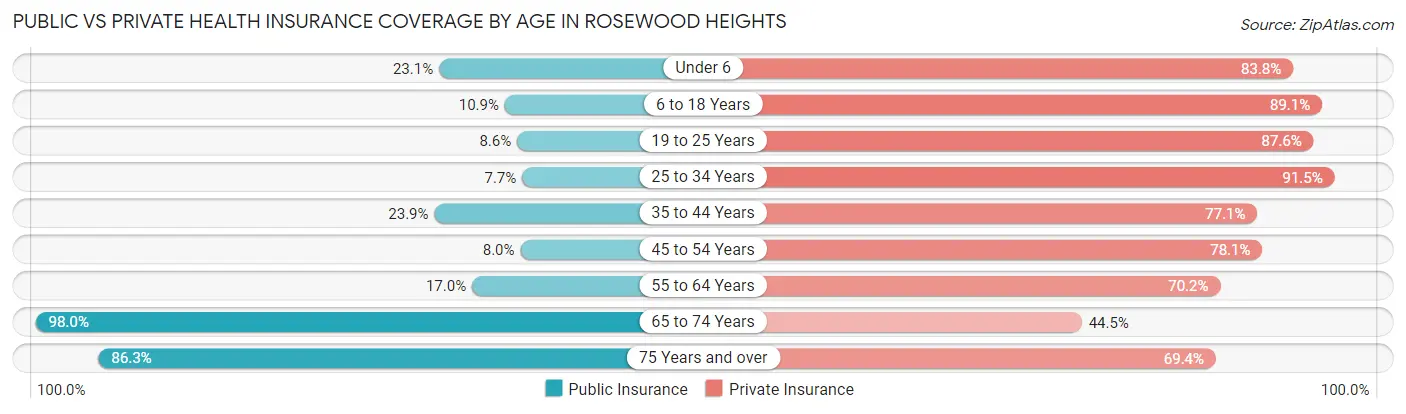
| Age Bracket | Public Insurance | Private Insurance |
| Under 6 | 54 (23.1%) | 196 (83.8%) |
| 6 to 18 Years | 51 (10.9%) | 418 (89.1%) |
| 19 to 25 Years | 27 (8.6%) | 275 (87.6%) |
| 25 to 34 Years | 43 (7.6%) | 514 (91.5%) |
| 35 to 44 Years | 90 (23.9%) | 290 (77.1%) |
| 45 to 54 Years | 36 (8.0%) | 352 (78.0%) |
| 55 to 64 Years | 106 (17.0%) | 439 (70.2%) |
| 65 to 74 Years | 528 (98.0%) | 240 (44.5%) |
| 75 Years and over | 302 (86.3%) | 243 (69.4%) |
| Total | 1,237 (31.6%) | 2,967 (75.7%) |
Disability Status by Sex by Age in Rosewood Heights
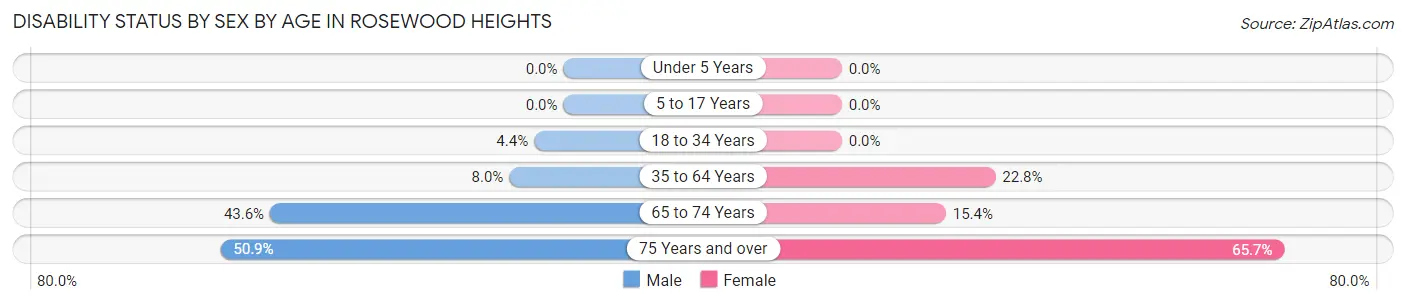
| Age Bracket | Male | Female |
| Under 5 Years | 0 (0.0%) | 0 (0.0%) |
| 5 to 17 Years | 0 (0.0%) | 0 (0.0%) |
| 18 to 34 Years | 21 (4.4%) | 0 (0.0%) |
| 35 to 64 Years | 60 (8.0%) | 161 (22.8%) |
| 65 to 74 Years | 105 (43.6%) | 46 (15.4%) |
| 75 Years and over | 55 (50.9%) | 159 (65.7%) |
Disability Class by Sex by Age in Rosewood Heights
Disability Class: Hearing Difficulty
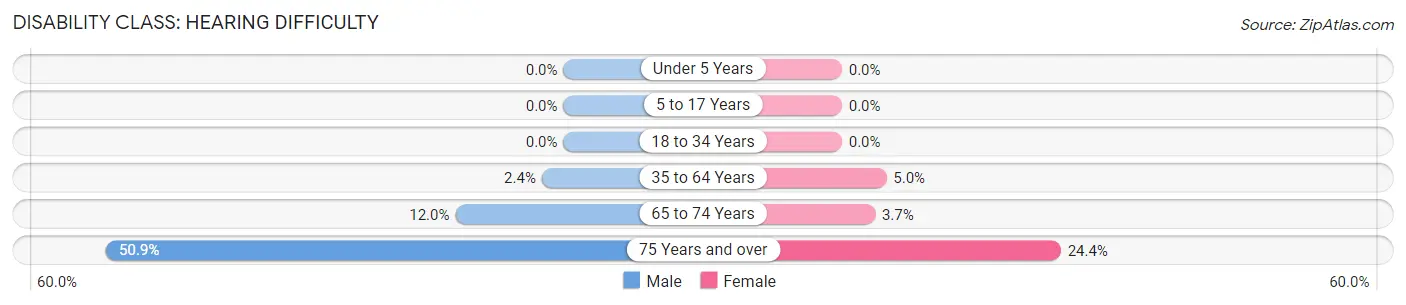
| Age Bracket | Male | Female |
| Under 5 Years | 0 (0.0%) | 0 (0.0%) |
| 5 to 17 Years | 0 (0.0%) | 0 (0.0%) |
| 18 to 34 Years | 0 (0.0%) | 0 (0.0%) |
| 35 to 64 Years | 18 (2.4%) | 35 (5.0%) |
| 65 to 74 Years | 29 (12.0%) | 11 (3.7%) |
| 75 Years and over | 55 (50.9%) | 59 (24.4%) |
Disability Class: Vision Difficulty
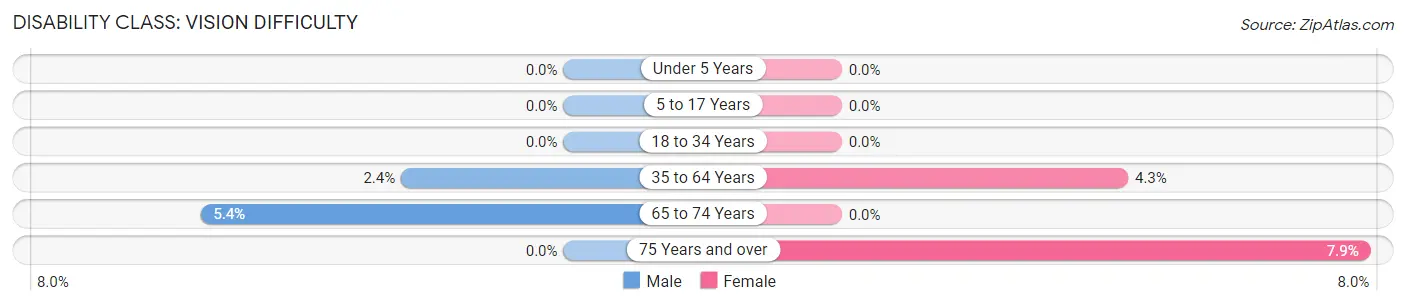
| Age Bracket | Male | Female |
| Under 5 Years | 0 (0.0%) | 0 (0.0%) |
| 5 to 17 Years | 0 (0.0%) | 0 (0.0%) |
| 18 to 34 Years | 0 (0.0%) | 0 (0.0%) |
| 35 to 64 Years | 18 (2.4%) | 30 (4.3%) |
| 65 to 74 Years | 13 (5.4%) | 0 (0.0%) |
| 75 Years and over | 0 (0.0%) | 19 (7.9%) |
Disability Class: Cognitive Difficulty
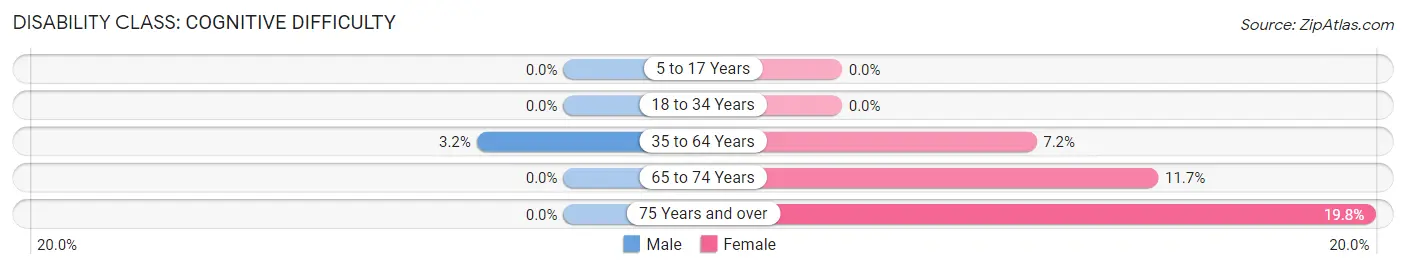
| Age Bracket | Male | Female |
| 5 to 17 Years | 0 (0.0%) | 0 (0.0%) |
| 18 to 34 Years | 0 (0.0%) | 0 (0.0%) |
| 35 to 64 Years | 24 (3.2%) | 51 (7.2%) |
| 65 to 74 Years | 0 (0.0%) | 35 (11.7%) |
| 75 Years and over | 0 (0.0%) | 48 (19.8%) |
Disability Class: Ambulatory Difficulty
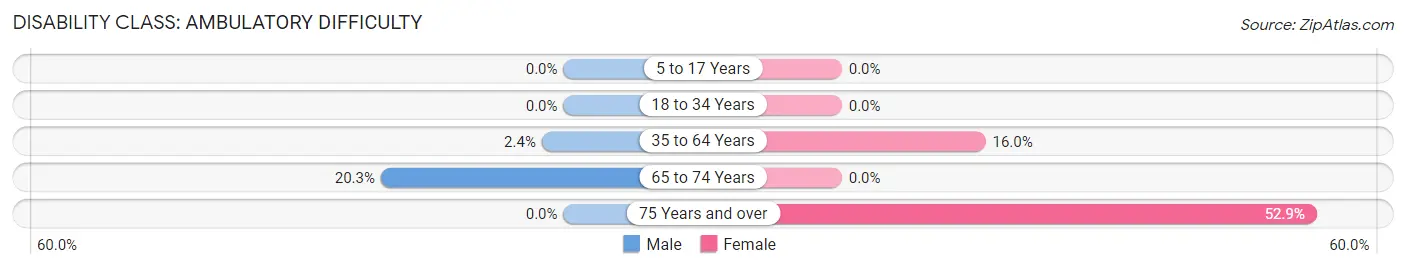
| Age Bracket | Male | Female |
| 5 to 17 Years | 0 (0.0%) | 0 (0.0%) |
| 18 to 34 Years | 0 (0.0%) | 0 (0.0%) |
| 35 to 64 Years | 18 (2.4%) | 113 (16.0%) |
| 65 to 74 Years | 49 (20.3%) | 0 (0.0%) |
| 75 Years and over | 0 (0.0%) | 128 (52.9%) |
Disability Class: Self-Care Difficulty
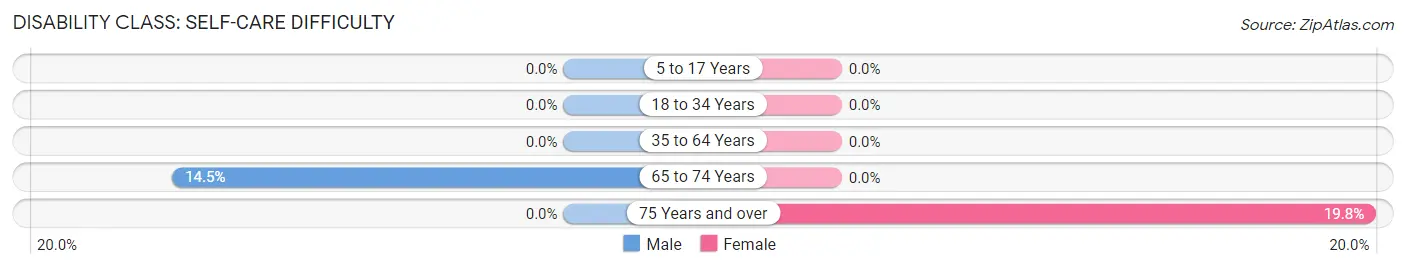
| Age Bracket | Male | Female |
| 5 to 17 Years | 0 (0.0%) | 0 (0.0%) |
| 18 to 34 Years | 0 (0.0%) | 0 (0.0%) |
| 35 to 64 Years | 0 (0.0%) | 0 (0.0%) |
| 65 to 74 Years | 35 (14.5%) | 0 (0.0%) |
| 75 Years and over | 0 (0.0%) | 48 (19.8%) |
Technology Access in Rosewood Heights
Computing Device Access in Rosewood Heights
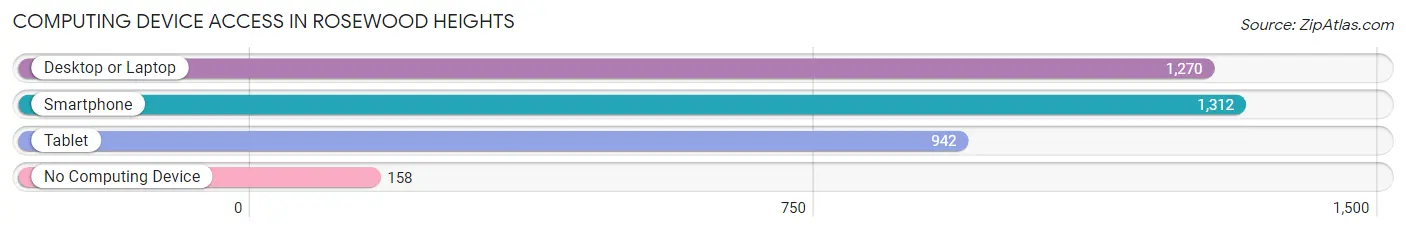
| Device Type | # Households | % Households |
| Desktop or Laptop | 1,270 | 79.7% |
| Smartphone | 1,312 | 82.3% |
| Tablet | 942 | 59.1% |
| No Computing Device | 158 | 9.9% |
| Total | 1,594 | 100.0% |
Internet Access in Rosewood Heights
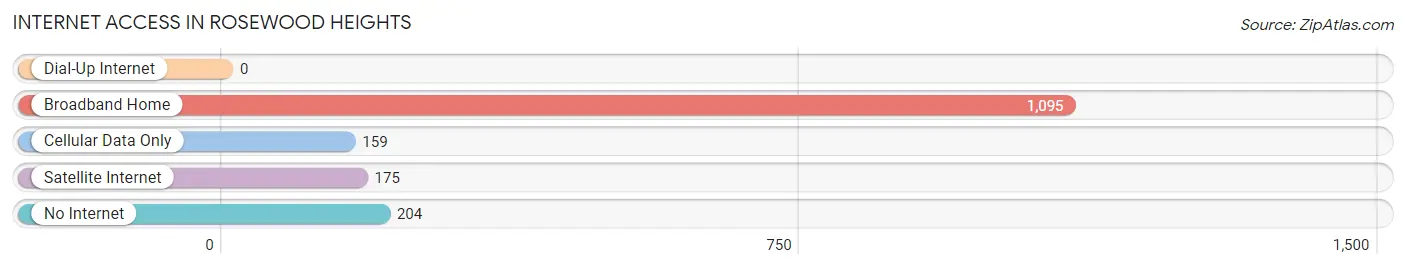
| Internet Type | # Households | % Households |
| Dial-Up Internet | 0 | 0.0% |
| Broadband Home | 1,095 | 68.7% |
| Cellular Data Only | 159 | 10.0% |
| Satellite Internet | 175 | 11.0% |
| No Internet | 204 | 12.8% |
| Total | 1,594 | 100.0% |
Rosewood Heights Summary
History
The history of Rosewood Heights, Illinois dates back to the early 1800s when the area was first settled by European immigrants. The first settlers were mostly German and Irish immigrants who were attracted to the area due to its fertile soil and abundant natural resources. The area was originally known as “Rosewood” and was part of the original Madison County. In 1837, the area was officially incorporated as the Village of Rosewood Heights.
The early settlers of Rosewood Heights were primarily farmers and the area was known for its production of corn, wheat, and other grains. The area also had a thriving lumber industry, with several sawmills located in the area. The area was also known for its brickyards, which produced bricks for the construction of homes and other buildings.
In the late 1800s, the area began to experience a population boom as more people moved to the area. This population growth was largely due to the construction of the Chicago and Alton Railroad, which ran through the area. The railroad provided easy access to the city of Chicago and allowed for the transportation of goods and people.
The population of Rosewood Heights continued to grow throughout the early 1900s and the area began to develop into a small town. The town was home to several businesses, including a grocery store, a bank, a post office, and a hotel. The town also had a school, a library, and several churches.
In the 1950s, the population of Rosewood Heights began to decline as people moved away from the area in search of better job opportunities. The decline in population was also due to the construction of Interstate 55, which bypassed the town.
Geography
Rosewood Heights is located in Madison County, Illinois, approximately 25 miles northeast of St. Louis, Missouri. The town is situated on the banks of the Mississippi River and is bordered by the towns of Alton, East Alton, and Wood River. The town covers an area of approximately 2.5 square miles and has a population of approximately 4,000 people.
The terrain of Rosewood Heights is mostly flat, with some rolling hills in the area. The town is located in the American Bottom region of the Midwest, which is characterized by its flat terrain and fertile soil. The area is also known for its abundance of natural resources, including timber, coal, and limestone.
Economy
The economy of Rosewood Heights is largely based on agriculture and manufacturing. The town is home to several large farms, which produce corn, wheat, and other grains. The town is also home to several manufacturing companies, which produce a variety of products, including furniture, clothing, and automotive parts.
The town is also home to several small businesses, including restaurants, retail stores, and service providers. The town is also home to several banks, which provide financial services to the local community.
Demographics
As of the 2010 census, the population of Rosewood Heights was 4,039. The racial makeup of the town was 94.3% White, 1.7% African American, 0.3% Native American, 0.7% Asian, 0.1% Pacific Islander, 1.2% from other races, and 1.9% from two or more races. Hispanic or Latino of any race were 3.2% of the population.
The median household income in Rosewood Heights was $45,938, and the median family income was $51,938. The per capita income for the town was $20,938. About 8.3% of families and 10.2% of the population were below the poverty line, including 14.2% of those under age 18 and 6.2% of those age 65 or over.
Common Questions
What is Per Capita Income in Rosewood Heights?
Per Capita income in Rosewood Heights is $33,806.
What is the Median Family Income in Rosewood Heights?
Median Family Income in Rosewood Heights is $84,320.
What is the Median Household income in Rosewood Heights?
Median Household Income in Rosewood Heights is $79,842.
What is Income or Wage Gap in Rosewood Heights?
Income or Wage Gap in Rosewood Heights is 45.9%.
Women in Rosewood Heights earn 54.1 cents for every dollar earned by a man.
What is Inequality or Gini Index in Rosewood Heights?
Inequality or Gini Index in Rosewood Heights is 0.36.
What is the Total Population of Rosewood Heights?
Total Population of Rosewood Heights is 3,920.
What is the Total Male Population of Rosewood Heights?
Total Male Population of Rosewood Heights is 1,893.
What is the Total Female Population of Rosewood Heights?
Total Female Population of Rosewood Heights is 2,027.
What is the Ratio of Males per 100 Females in Rosewood Heights?
There are 93.39 Males per 100 Females in Rosewood Heights.
What is the Ratio of Females per 100 Males in Rosewood Heights?
There are 107.08 Females per 100 Males in Rosewood Heights.
What is the Median Population Age in Rosewood Heights?
Median Population Age in Rosewood Heights is 45.1 Years.
What is the Average Family Size in Rosewood Heights
Average Family Size in Rosewood Heights is 2.9 People.
What is the Average Household Size in Rosewood Heights
Average Household Size in Rosewood Heights is 2.5 People.
How Large is the Labor Force in Rosewood Heights?
There are 2,001 People in the Labor Forcein in Rosewood Heights.
What is the Percentage of People in the Labor Force in Rosewood Heights?
60.7% of People are in the Labor Force in Rosewood Heights.
What is the Unemployment Rate in Rosewood Heights?
Unemployment Rate in Rosewood Heights is 5.0%.