Standard City, IL Map & Demographics
Standard City Map
Standard City Overview
$20,501
PER CAPITA INCOME
$52,000
AVG FAMILY INCOME
$60,833
AVG HOUSEHOLD INCOME
40.3%
WAGE / INCOME GAP [ % ]
59.7¢/ $1
WAGE / INCOME GAP [ $ ]
0.24
INEQUALITY / GINI INDEX
194
TOTAL POPULATION
112
MALE POPULATION
82
FEMALE POPULATION
136.59
MALES / 100 FEMALES
73.21
FEMALES / 100 MALES
32.5
MEDIAN AGE
3.3
AVG FAMILY SIZE
3.2
AVG HOUSEHOLD SIZE
71
LABOR FORCE [ PEOPLE ]
49.3%
PERCENT IN LABOR FORCE
5.6%
UNEMPLOYMENT RATE
Standard City Area Codes
Income in Standard City
Income Overview in Standard City
Per Capita Income in Standard City is $20,501, while median incomes of families and households are $52,000 and $60,833 respectively.
| Characteristic | Number | Measure |
| Per Capita Income | 194 | $20,501 |
| Median Family Income | 50 | $52,000 |
| Mean Family Income | 50 | $65,936 |
| Median Household Income | 60 | $60,833 |
| Mean Household Income | 60 | $67,792 |
| Income Deficit | 50 | $0 |
| Wage / Income Gap (%) | 194 | 40.27% |
| Wage / Income Gap ($) | 194 | 59.73¢ per $1 |
| Gini / Inequality Index | 194 | 0.24 |
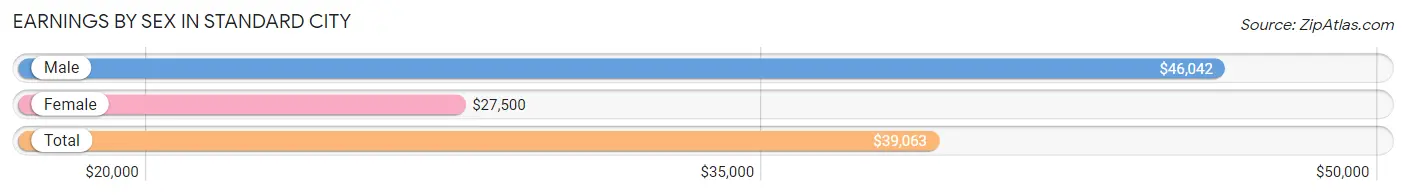
Earnings by Sex in Standard City
Average Earnings in Standard City are $39,063, $46,042 for men and $27,500 for women, a difference of 40.3%.
| Sex | Number | Average Earnings |
| Male | 43 (55.8%) | $46,042 |
| Female | 34 (44.2%) | $27,500 |
| Total | 77 (100.0%) | $39,063 |
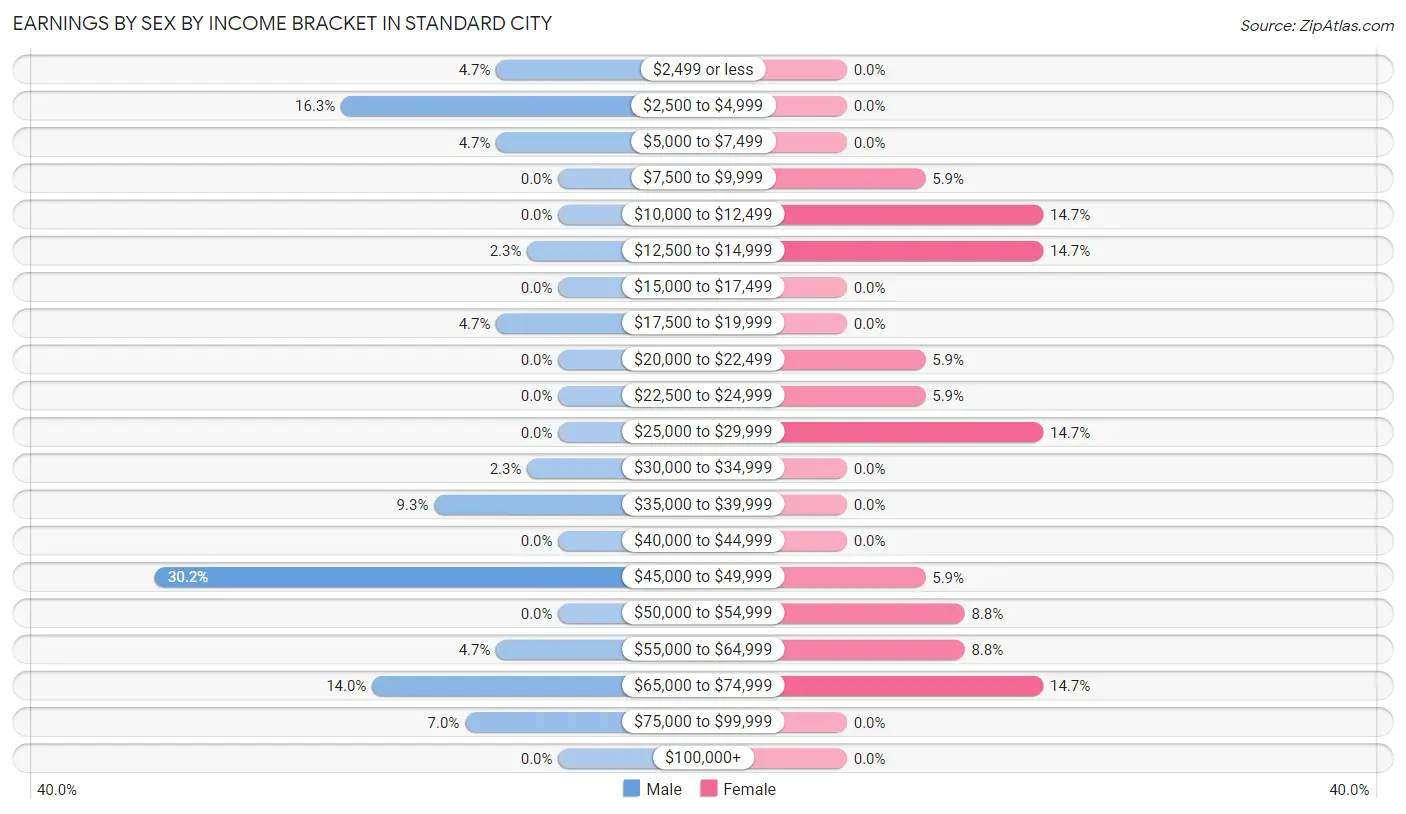
Earnings by Sex by Income Bracket in Standard City
The most common earnings brackets in Standard City are $45,000 to $49,999 for men (13 | 30.2%) and $10,000 to $12,499 for women (5 | 14.7%).
| Income | Male | Female |
| $2,499 or less | 2 (4.6%) | 0 (0.0%) |
| $2,500 to $4,999 | 7 (16.3%) | 0 (0.0%) |
| $5,000 to $7,499 | 2 (4.6%) | 0 (0.0%) |
| $7,500 to $9,999 | 0 (0.0%) | 2 (5.9%) |
| $10,000 to $12,499 | 0 (0.0%) | 5 (14.7%) |
| $12,500 to $14,999 | 1 (2.3%) | 5 (14.7%) |
| $15,000 to $17,499 | 0 (0.0%) | 0 (0.0%) |
| $17,500 to $19,999 | 2 (4.6%) | 0 (0.0%) |
| $20,000 to $22,499 | 0 (0.0%) | 2 (5.9%) |
| $22,500 to $24,999 | 0 (0.0%) | 2 (5.9%) |
| $25,000 to $29,999 | 0 (0.0%) | 5 (14.7%) |
| $30,000 to $34,999 | 1 (2.3%) | 0 (0.0%) |
| $35,000 to $39,999 | 4 (9.3%) | 0 (0.0%) |
| $40,000 to $44,999 | 0 (0.0%) | 0 (0.0%) |
| $45,000 to $49,999 | 13 (30.2%) | 2 (5.9%) |
| $50,000 to $54,999 | 0 (0.0%) | 3 (8.8%) |
| $55,000 to $64,999 | 2 (4.6%) | 3 (8.8%) |
| $65,000 to $74,999 | 6 (14.0%) | 5 (14.7%) |
| $75,000 to $99,999 | 3 (7.0%) | 0 (0.0%) |
| $100,000+ | 0 (0.0%) | 0 (0.0%) |
| Total | 43 (100.0%) | 34 (100.0%) |
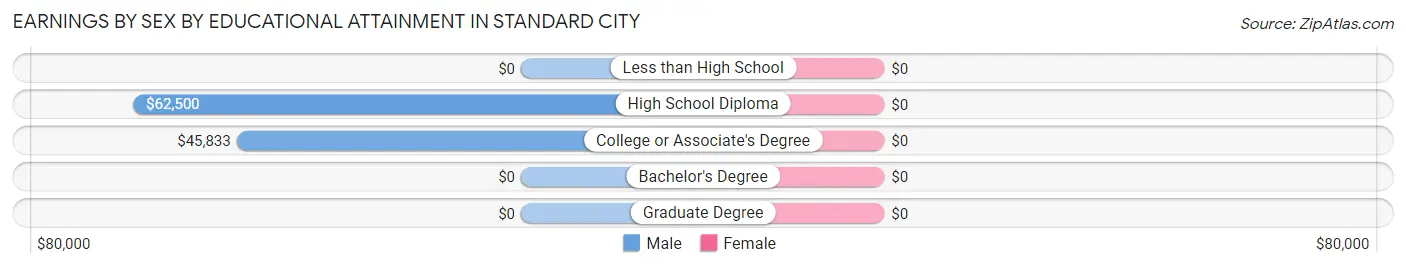
Earnings by Sex by Educational Attainment in Standard City
| Educational Attainment | Male Income | Female Income |
| Less than High School | - | - |
| High School Diploma | $62,500 | $0 |
| College or Associate's Degree | $45,833 | $0 |
| Bachelor's Degree | - | - |
| Graduate Degree | - | - |
| Total | $48,214 | $0 |
Family Income in Standard City
Family Income Brackets in Standard City
According to the Standard City family income data, there are 15 families falling into the $35,000 to $49,999 income range, which is the most common income bracket and makes up 30.0% of all families.
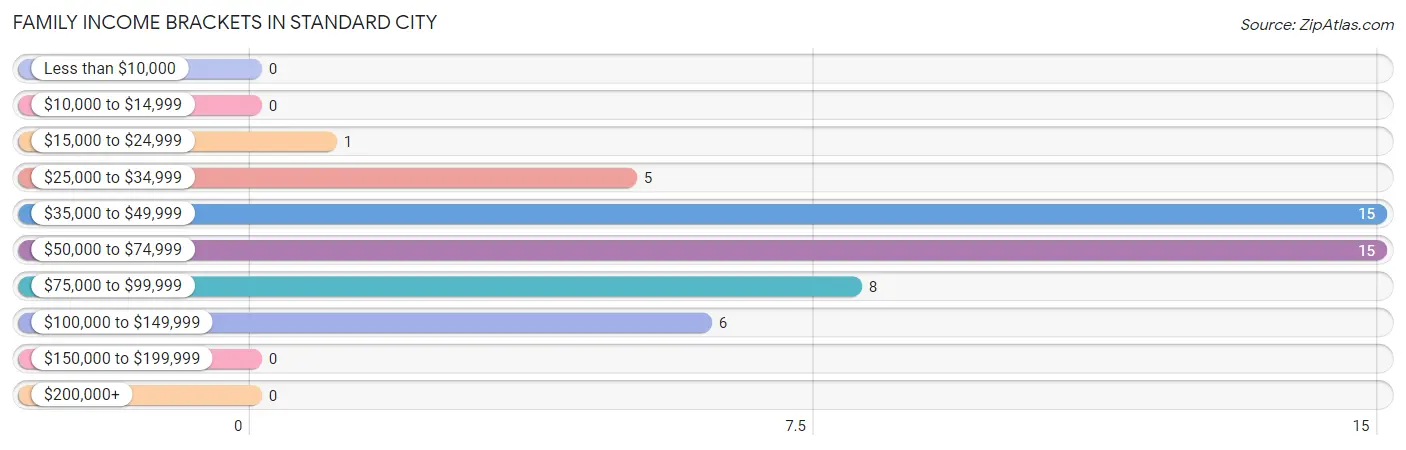
| Income Bracket | # Families | % Families |
| Less than $10,000 | 0 | 0.0% |
| $10,000 to $14,999 | 0 | 0.0% |
| $15,000 to $24,999 | 1 | 2.0% |
| $25,000 to $34,999 | 5 | 10.0% |
| $35,000 to $49,999 | 15 | 30.0% |
| $50,000 to $74,999 | 15 | 30.0% |
| $75,000 to $99,999 | 8 | 16.0% |
| $100,000 to $149,999 | 6 | 12.0% |
| $150,000 to $199,999 | 0 | 0.0% |
| $200,000+ | 0 | 0.0% |
Family Income by Famaliy Size in Standard City
3-person families (8 | 16.0%) account for the highest median family income in Standard City with $91,250 per family, while 3-person families (8 | 16.0%) have the highest median income of $30,417 per family member.
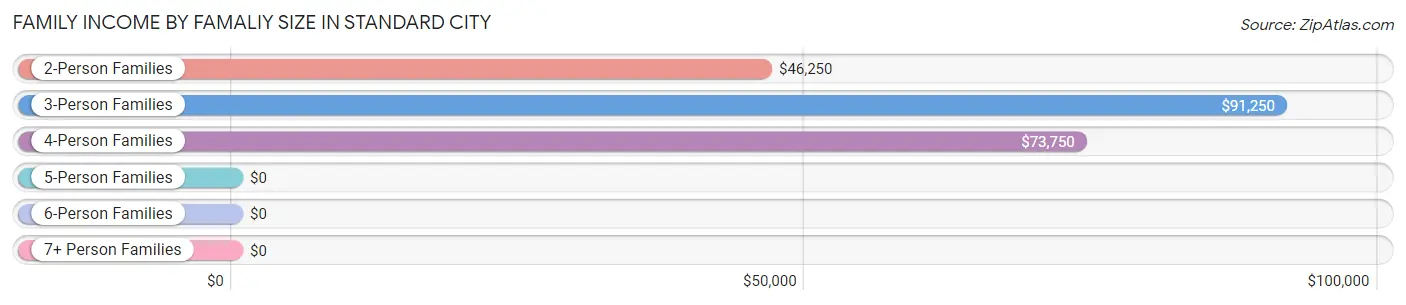
| Income Bracket | # Families | Median Income |
| 2-Person Families | 23 (46.0%) | $46,250 |
| 3-Person Families | 8 (16.0%) | $91,250 |
| 4-Person Families | 18 (36.0%) | $73,750 |
| 5-Person Families | 1 (2.0%) | $0 |
| 6-Person Families | 0 (0.0%) | $0 |
| 7+ Person Families | 0 (0.0%) | $0 |
| Total | 50 (100.0%) | $52,000 |
Family Income by Number of Earners in Standard City
The median family income in Standard City is $52,000, with families comprising 3+ earners (6) having the highest median family income of $83,750, while families with no earners (17) have the lowest median family income of $46,161, accounting for 12.0% and 34.0% of families, respectively.
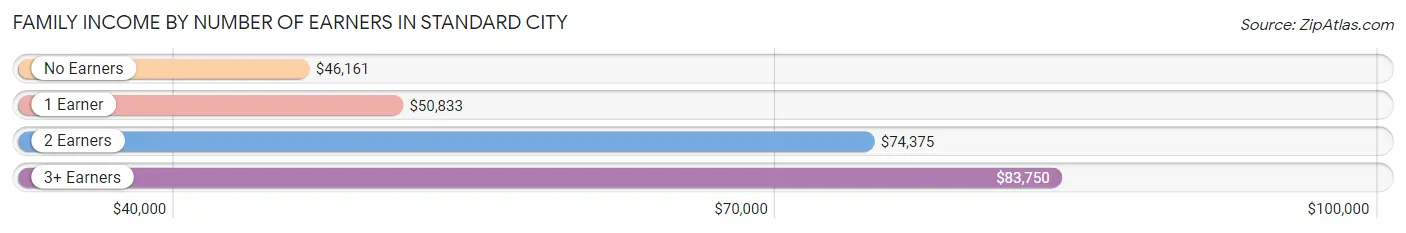
| Number of Earners | # Families | Median Income |
| No Earners | 17 (34.0%) | $46,161 |
| 1 Earner | 12 (24.0%) | $50,833 |
| 2 Earners | 15 (30.0%) | $74,375 |
| 3+ Earners | 6 (12.0%) | $83,750 |
| Total | 50 (100.0%) | $52,000 |
Household Income in Standard City
Household Income Brackets in Standard City
With 17 households falling in the category, the $35,000 to $49,999 income range is the most frequent in Standard City, accounting for 28.3% of all households.
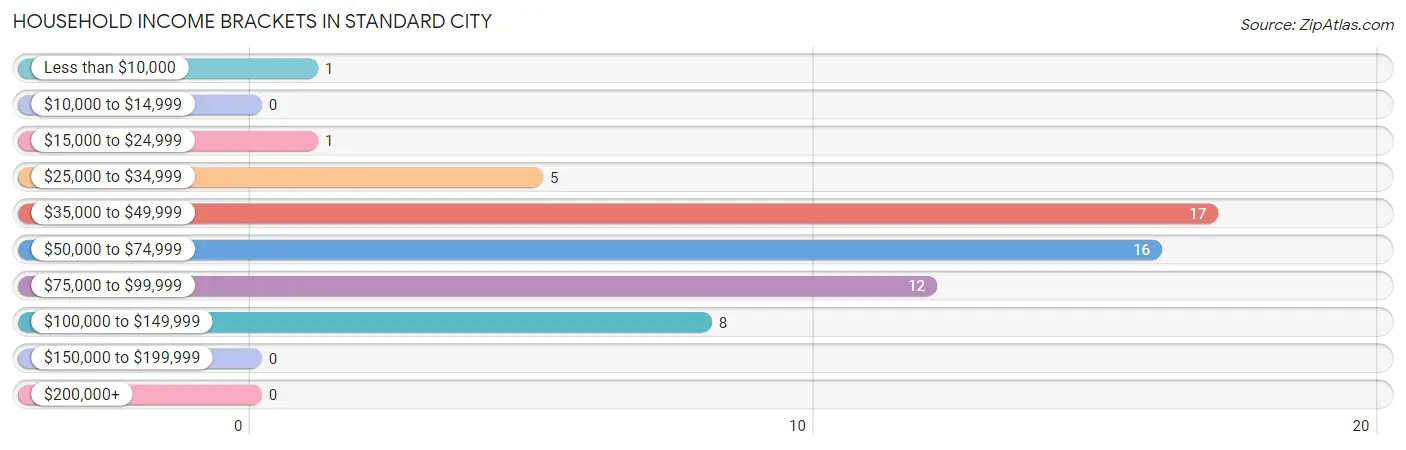
| Income Bracket | # Households | % Households |
| Less than $10,000 | 1 | 1.7% |
| $10,000 to $14,999 | 0 | 0.0% |
| $15,000 to $24,999 | 1 | 1.7% |
| $25,000 to $34,999 | 5 | 8.3% |
| $35,000 to $49,999 | 17 | 28.3% |
| $50,000 to $74,999 | 16 | 26.7% |
| $75,000 to $99,999 | 12 | 20.0% |
| $100,000 to $149,999 | 8 | 13.3% |
| $150,000 to $199,999 | 0 | 0.0% |
| $200,000+ | 0 | 0.0% |
Household Income by Householder Age in Standard City
The median household income in Standard City is $60,833, with the highest median household income of $97,750 found in the 25 to 44 years age bracket for the primary householder. A total of 23 households (38.3%) fall into this category.
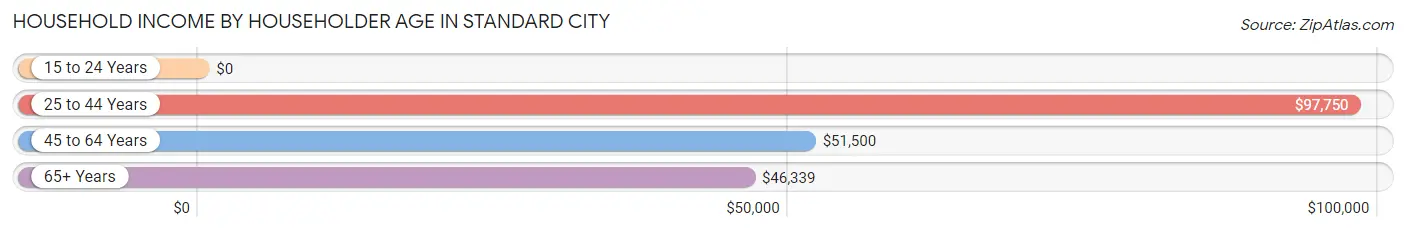
| Income Bracket | # Households | Median Income |
| 15 to 24 Years | 0 (0.0%) | $0 |
| 25 to 44 Years | 23 (38.3%) | $97,750 |
| 45 to 64 Years | 18 (30.0%) | $51,500 |
| 65+ Years | 19 (31.7%) | $46,339 |
| Total | 60 (100.0%) | $60,833 |
Poverty in Standard City
Income Below Poverty by Sex and Age in Standard City
With 5.8% poverty level for males and 7.3% for females among the residents of Standard City, 55 to 64 year old males and 18 to 24 year old females are the most vulnerable to poverty, with 1 males (33.3%) and 2 females (40.0%) in their respective age groups living below the poverty level.
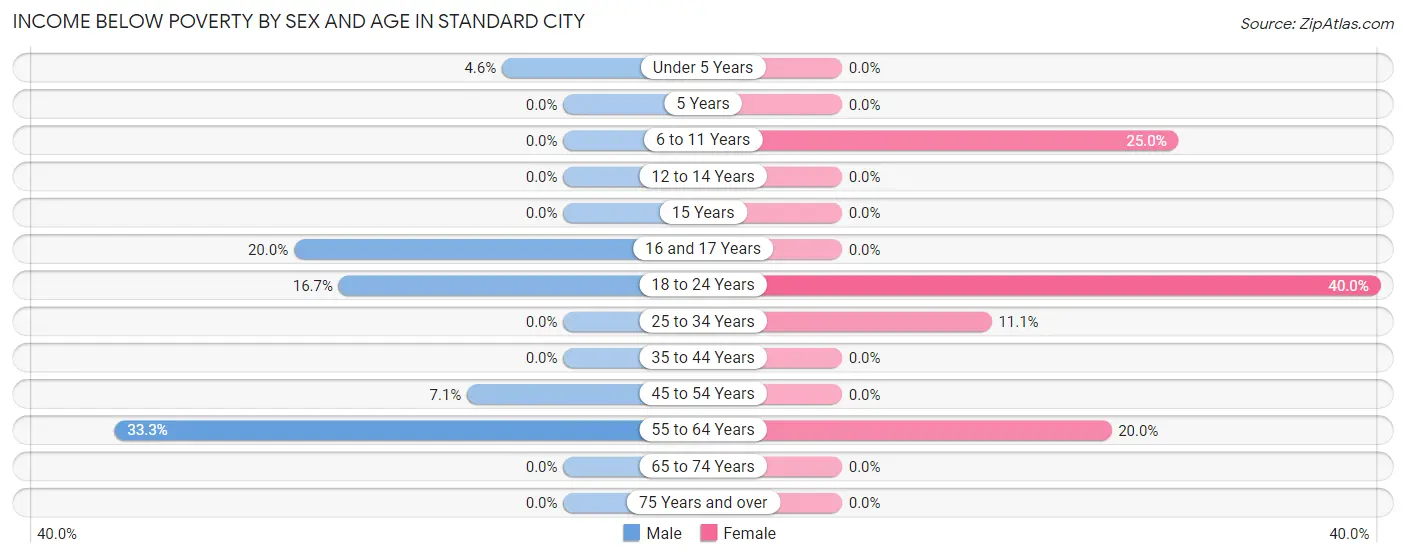
| Age Bracket | Male | Female |
| Under 5 Years | 1 (4.5%) | 0 (0.0%) |
| 5 Years | 0 (0.0%) | 0 (0.0%) |
| 6 to 11 Years | 0 (0.0%) | 1 (25.0%) |
| 12 to 14 Years | 0 (0.0%) | 0 (0.0%) |
| 15 Years | 0 (0.0%) | 0 (0.0%) |
| 16 and 17 Years | 1 (20.0%) | 0 (0.0%) |
| 18 to 24 Years | 2 (16.7%) | 2 (40.0%) |
| 25 to 34 Years | 0 (0.0%) | 1 (11.1%) |
| 35 to 44 Years | 0 (0.0%) | 0 (0.0%) |
| 45 to 54 Years | 1 (7.1%) | 0 (0.0%) |
| 55 to 64 Years | 1 (33.3%) | 2 (20.0%) |
| 65 to 74 Years | 0 (0.0%) | 0 (0.0%) |
| 75 Years and over | 0 (0.0%) | 0 (0.0%) |
| Total | 6 (5.8%) | 6 (7.3%) |
Income Above Poverty by Sex and Age in Standard City
According to the poverty statistics in Standard City, males aged 6 to 11 years and females aged 12 to 14 years are the age groups that are most secure financially, with 100.0% of males and 100.0% of females in these age groups living above the poverty line.
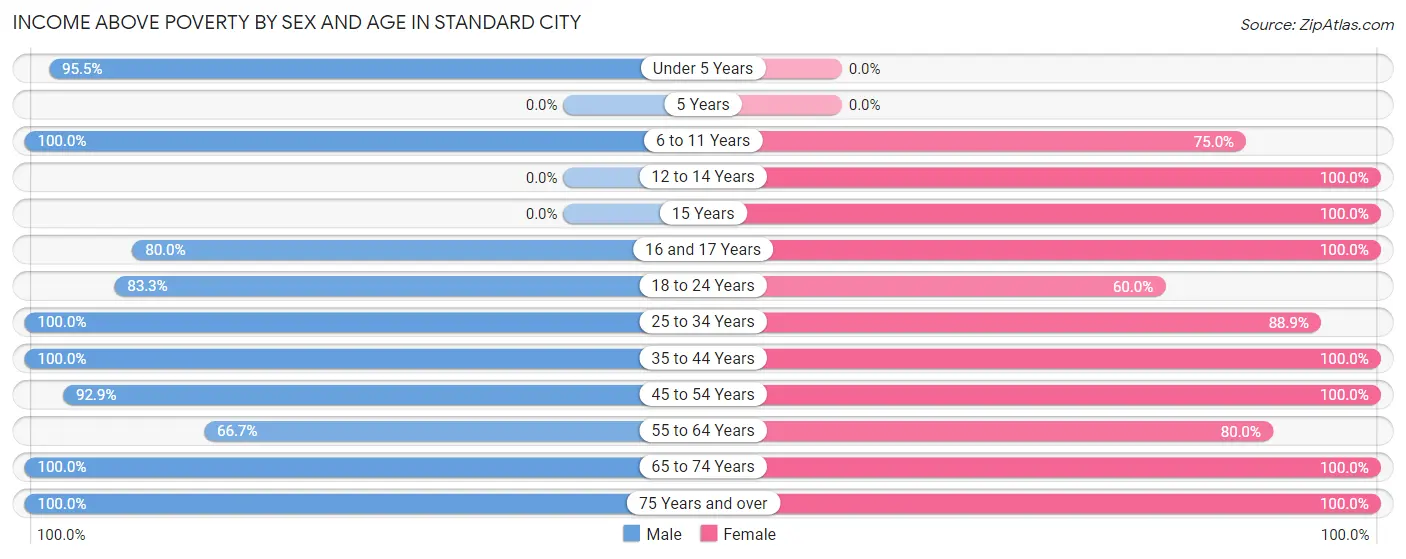
| Age Bracket | Male | Female |
| Under 5 Years | 21 (95.5%) | 0 (0.0%) |
| 5 Years | 0 (0.0%) | 0 (0.0%) |
| 6 to 11 Years | 2 (100.0%) | 3 (75.0%) |
| 12 to 14 Years | 0 (0.0%) | 9 (100.0%) |
| 15 Years | 0 (0.0%) | 4 (100.0%) |
| 16 and 17 Years | 4 (80.0%) | 7 (100.0%) |
| 18 to 24 Years | 10 (83.3%) | 3 (60.0%) |
| 25 to 34 Years | 13 (100.0%) | 8 (88.9%) |
| 35 to 44 Years | 11 (100.0%) | 9 (100.0%) |
| 45 to 54 Years | 13 (92.9%) | 9 (100.0%) |
| 55 to 64 Years | 2 (66.7%) | 8 (80.0%) |
| 65 to 74 Years | 17 (100.0%) | 15 (100.0%) |
| 75 Years and over | 4 (100.0%) | 1 (100.0%) |
| Total | 97 (94.2%) | 76 (92.7%) |
Income Below Poverty Among Married-Couple Families in Standard City
The poverty statistics for married-couple families in Standard City show that 4.0% or 2 of the total 50 families live below the poverty line. Families with 1 or 2 children have the highest poverty rate of 4.3%, comprising of 1 families. On the other hand, families with 3 or 4 children have the lowest poverty rate of 0.0%, which includes 0 families.
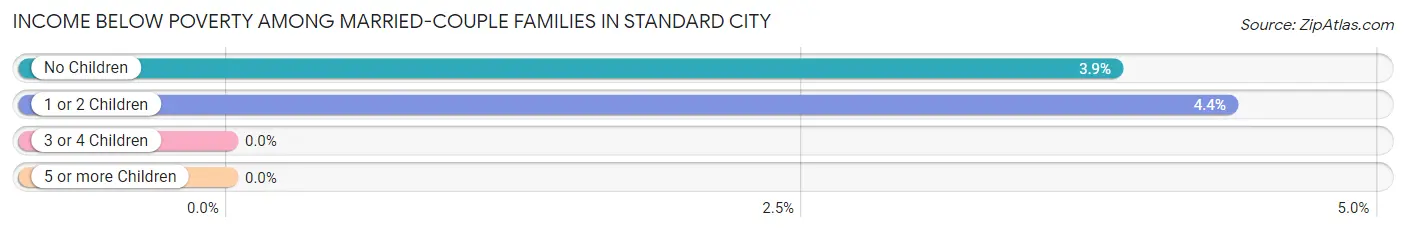
| Children | Above Poverty | Below Poverty |
| No Children | 25 (96.2%) | 1 (3.8%) |
| 1 or 2 Children | 22 (95.7%) | 1 (4.3%) |
| 3 or 4 Children | 1 (100.0%) | 0 (0.0%) |
| 5 or more Children | 0 (0.0%) | 0 (0.0%) |
| Total | 48 (96.0%) | 2 (4.0%) |
Income Below Poverty Among Single-Parent Households in Standard City
| Children | Single Father | Single Mother |
| No Children | 0 (0.0%) | 0 (0.0%) |
| 1 or 2 Children | 0 (0.0%) | 0 (0.0%) |
| 3 or 4 Children | 0 (0.0%) | 0 (0.0%) |
| 5 or more Children | 0 (0.0%) | 0 (0.0%) |
| Total | 0 (0.0%) | 0 (0.0%) |
Income Below Poverty Among Married-Couple vs Single-Parent Households in Standard City
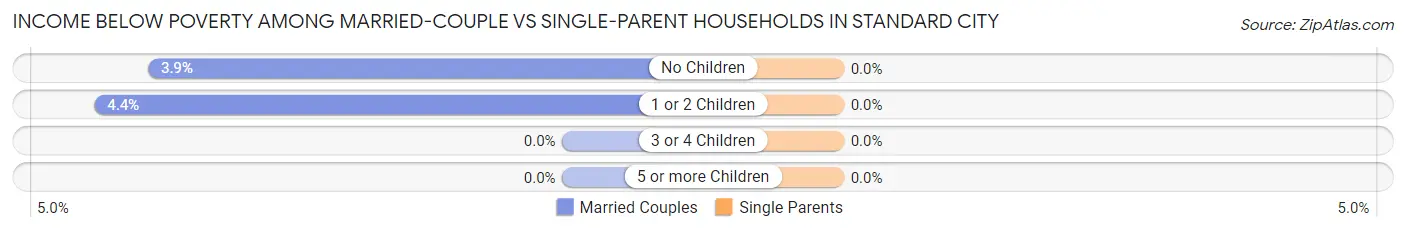
| Children | Married-Couple Families | Single-Parent Households |
| No Children | 1 (3.8%) | 0 (0.0%) |
| 1 or 2 Children | 1 (4.3%) | 0 (0.0%) |
| 3 or 4 Children | 0 (0.0%) | 0 (0.0%) |
| 5 or more Children | 0 (0.0%) | 0 (0.0%) |
| Total | 2 (4.0%) | 0 (0.0%) |
Race in Standard City
The most populous races in Standard City are White / Caucasian (192 | 99.0%), and Two or more Races (2 | 1.0%).
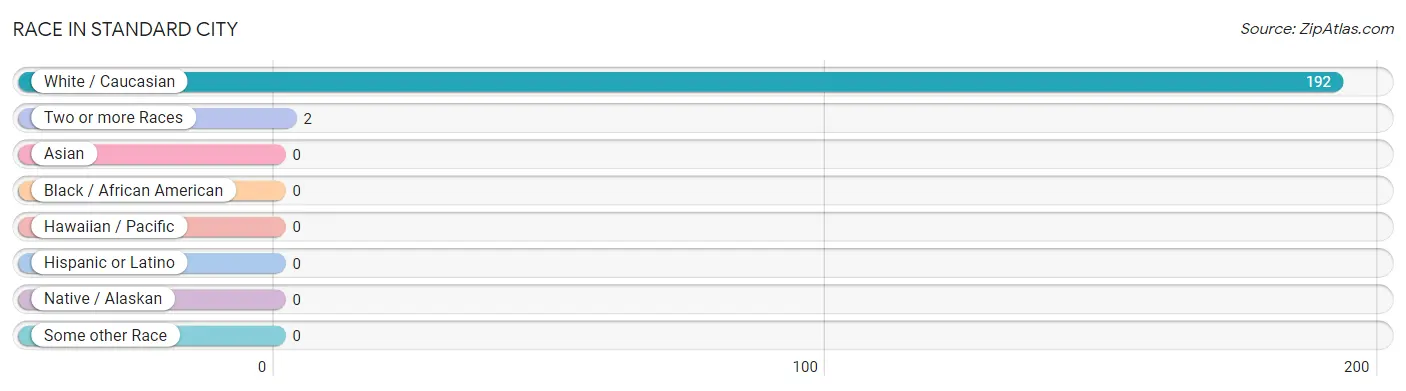
| Race | # Population | % Population |
| Asian | 0 | 0.0% |
| Black / African American | 0 | 0.0% |
| Hawaiian / Pacific | 0 | 0.0% |
| Hispanic or Latino | 0 | 0.0% |
| Native / Alaskan | 0 | 0.0% |
| White / Caucasian | 192 | 99.0% |
| Two or more Races | 2 | 1.0% |
| Some other Race | 0 | 0.0% |
| Total | 194 | 100.0% |
Ancestry in Standard City
The most populous ancestries reported in Standard City are German (42 | 21.6%), English (24 | 12.4%), Irish (21 | 10.8%), Italian (19 | 9.8%), and American (6 | 3.1%), together accounting for 57.7% of all Standard City residents.
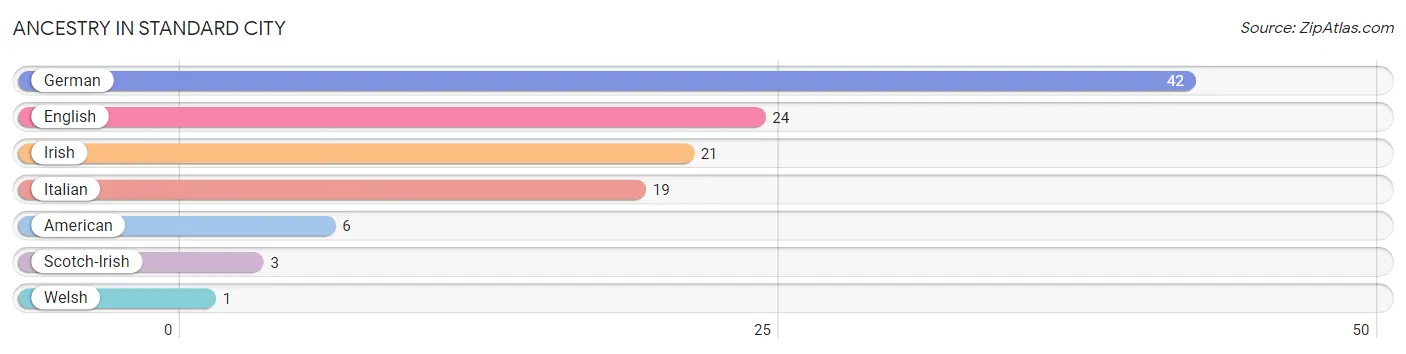
| Ancestry | # Population | % Population |
| American | 6 | 3.1% |
| English | 24 | 12.4% |
| German | 42 | 21.6% |
| Irish | 21 | 10.8% |
| Italian | 19 | 9.8% |
| Scotch-Irish | 3 | 1.5% |
| Welsh | 1 | 0.5% | View All 7 Rows |
Immigrants in Standard City
The most numerous immigrant groups reported in Standard City came from Eastern Europe (2 | 1.0%), Europe (2 | 1.0%), and Russia (2 | 1.0%), together accounting for 3.1% of all Standard City residents.
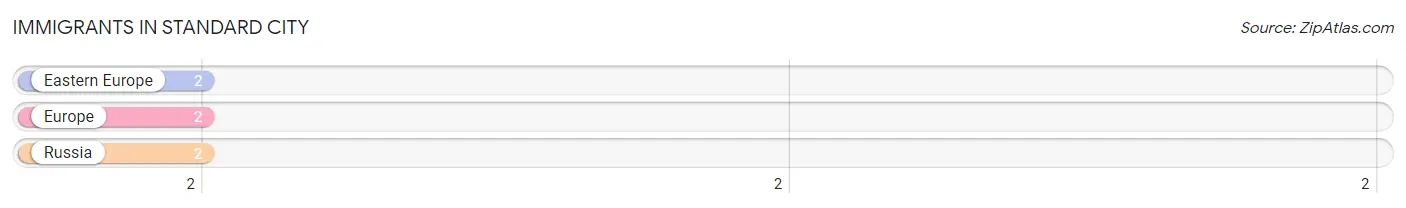
| Immigration Origin | # Population | % Population |
| Eastern Europe | 2 | 1.0% |
| Europe | 2 | 1.0% |
| Russia | 2 | 1.0% | View All 3 Rows |
Sex and Age in Standard City
Sex and Age in Standard City
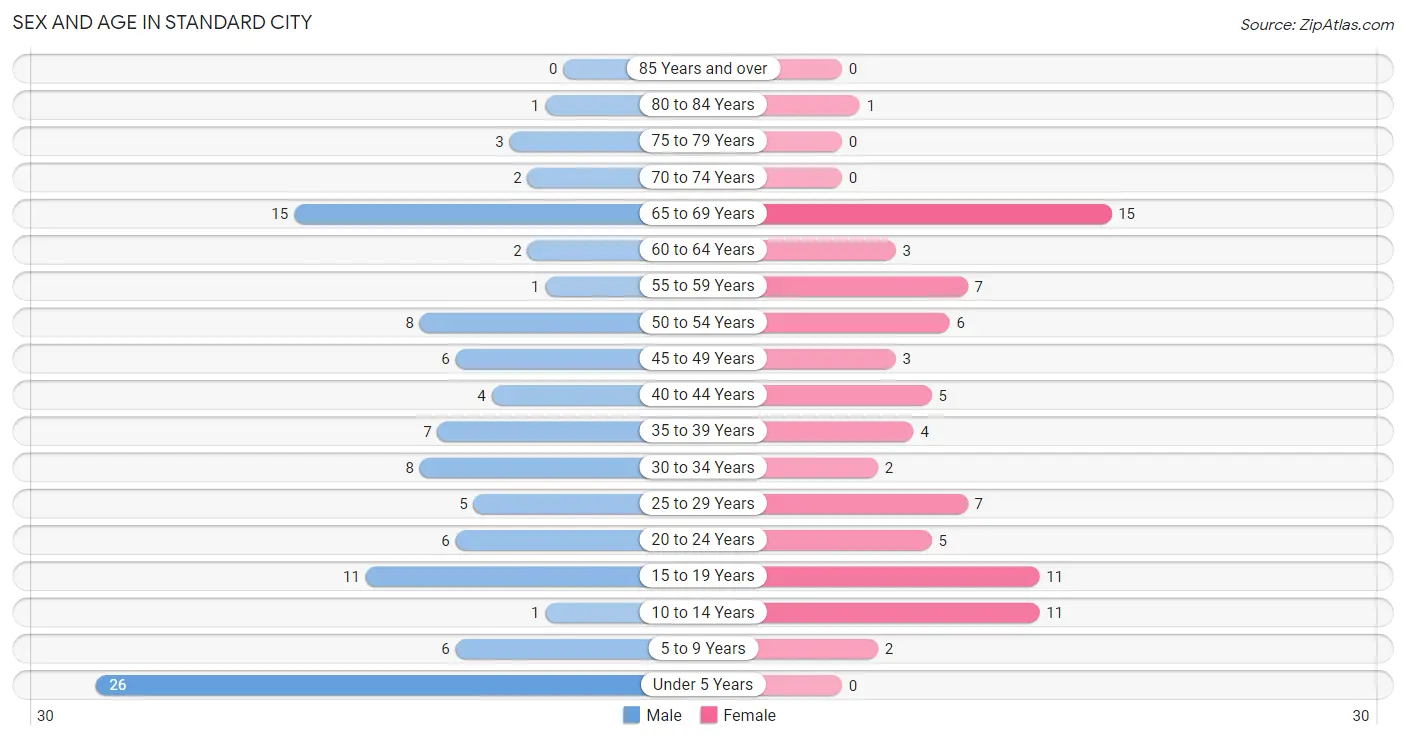
The most populous age groups in Standard City are Under 5 Years (26 | 23.2%) for men and 65 to 69 Years (15 | 18.3%) for women.
| Age Bracket | Male | Female |
| Under 5 Years | 26 (23.2%) | 0 (0.0%) |
| 5 to 9 Years | 6 (5.4%) | 2 (2.4%) |
| 10 to 14 Years | 1 (0.9%) | 11 (13.4%) |
| 15 to 19 Years | 11 (9.8%) | 11 (13.4%) |
| 20 to 24 Years | 6 (5.4%) | 5 (6.1%) |
| 25 to 29 Years | 5 (4.5%) | 7 (8.5%) |
| 30 to 34 Years | 8 (7.1%) | 2 (2.4%) |
| 35 to 39 Years | 7 (6.2%) | 4 (4.9%) |
| 40 to 44 Years | 4 (3.6%) | 5 (6.1%) |
| 45 to 49 Years | 6 (5.4%) | 3 (3.7%) |
| 50 to 54 Years | 8 (7.1%) | 6 (7.3%) |
| 55 to 59 Years | 1 (0.9%) | 7 (8.5%) |
| 60 to 64 Years | 2 (1.8%) | 3 (3.7%) |
| 65 to 69 Years | 15 (13.4%) | 15 (18.3%) |
| 70 to 74 Years | 2 (1.8%) | 0 (0.0%) |
| 75 to 79 Years | 3 (2.7%) | 0 (0.0%) |
| 80 to 84 Years | 1 (0.9%) | 1 (1.2%) |
| 85 Years and over | 0 (0.0%) | 0 (0.0%) |
| Total | 112 (100.0%) | 82 (100.0%) |
Families and Households in Standard City
Median Family Size in Standard City
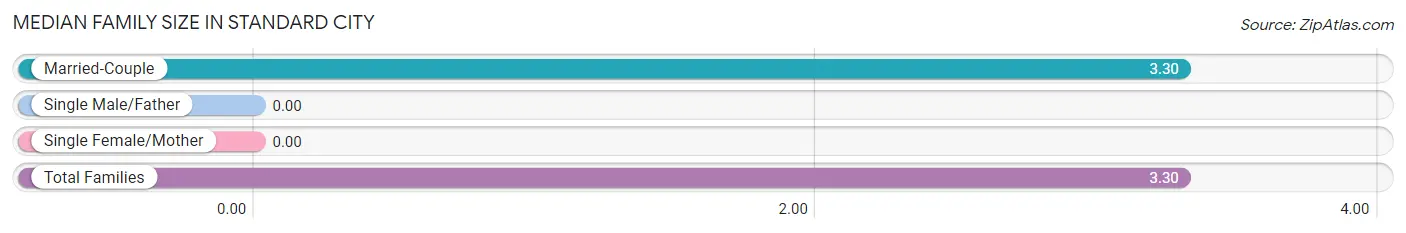
| Family Type | # Families | Family Size |
| Married-Couple | 50 (100.0%) | 3.30 |
| Single Male/Father | 0 (0.0%) | - |
| Single Female/Mother | 0 (0.0%) | - |
| Total Families | 50 (100.0%) | 3.30 |
Median Household Size in Standard City
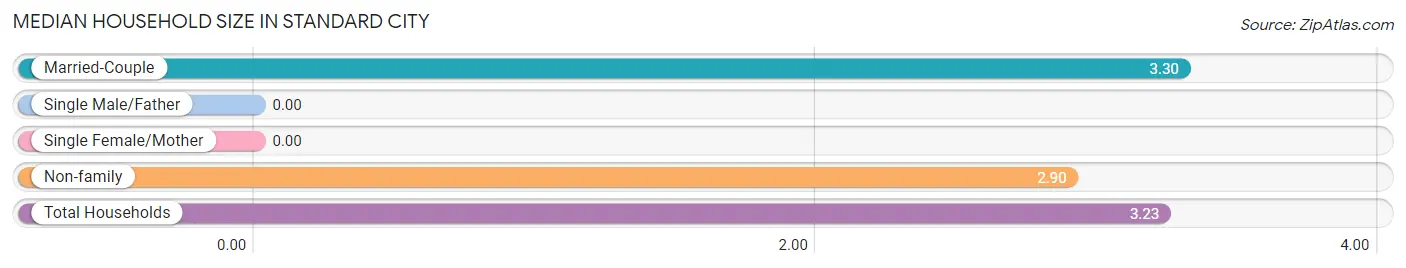
| Household Type | # Households | Household Size |
| Married-Couple | 50 (83.3%) | 3.30 |
| Single Male/Father | 0 (0.0%) | - |
| Single Female/Mother | 0 (0.0%) | - |
| Non-family | 10 (16.7%) | 2.90 |
| Total Households | 60 (100.0%) | 3.23 |
Household Size by Marriage Status in Standard City
Out of a total of 60 households in Standard City, 50 (83.3%) are family households, while 10 (16.7%) are nonfamily households. The most numerous type of family households are 2-person households, comprising 23, and the most common type of nonfamily households are 1-person households, comprising 4.
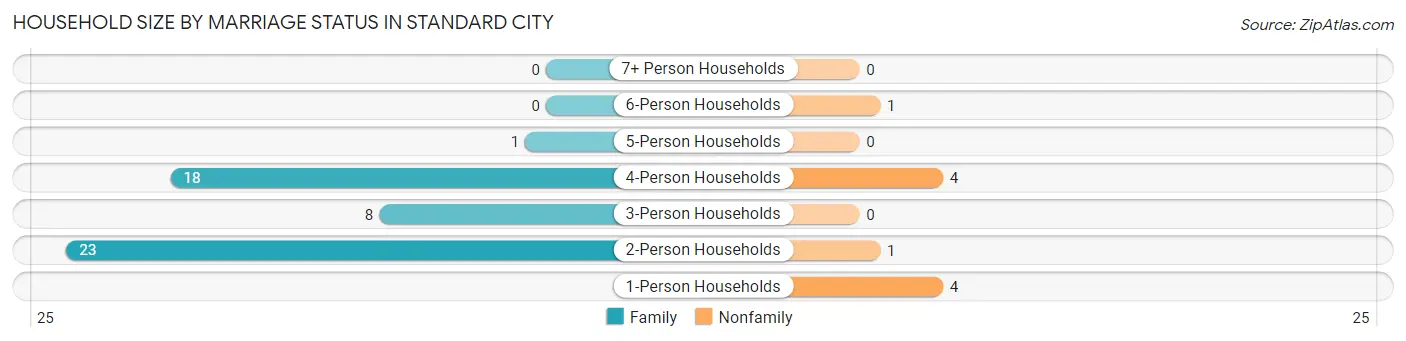
| Household Size | Family Households | Nonfamily Households |
| 1-Person Households | - | 4 (6.7%) |
| 2-Person Households | 23 (38.3%) | 1 (1.7%) |
| 3-Person Households | 8 (13.3%) | 0 (0.0%) |
| 4-Person Households | 18 (30.0%) | 4 (6.7%) |
| 5-Person Households | 1 (1.7%) | 0 (0.0%) |
| 6-Person Households | 0 (0.0%) | 1 (1.7%) |
| 7+ Person Households | 0 (0.0%) | 0 (0.0%) |
| Total | 50 (83.3%) | 10 (16.7%) |
Female Fertility in Standard City
Fertility by Age in Standard City
Average fertility rate in Standard City is 98.0 births per 1,000 women. Women in the age bracket of 20 to 34 years have the highest fertility rate with 286.0 births per 1,000 women. Women in the age bracket of 20 to 34 years acount for 100.0% of all women with births.
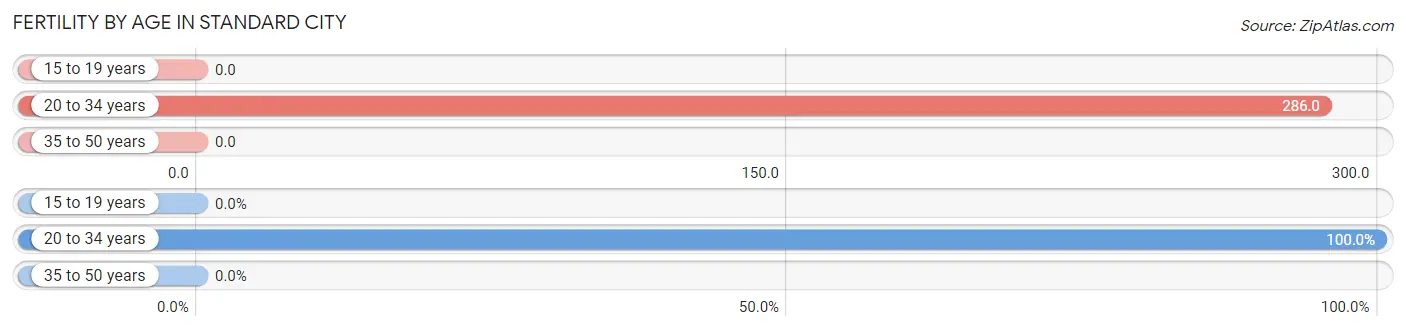
| Age Bracket | Women with Births | Births / 1,000 Women |
| 15 to 19 years | 0 (0.0%) | 0.0 |
| 20 to 34 years | 4 (100.0%) | 286.0 |
| 35 to 50 years | 0 (0.0%) | 0.0 |
| Total | 4 (100.0%) | 98.0 |
Fertility by Age by Marriage Status in Standard City
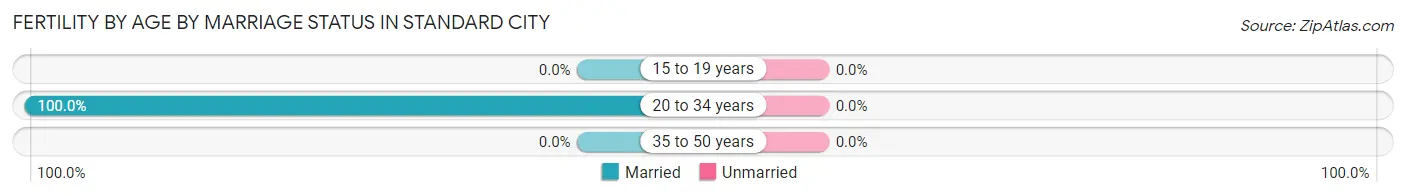
| Age Bracket | Married | Unmarried |
| 15 to 19 years | 0 (0.0%) | 0 (0.0%) |
| 20 to 34 years | 4 (100.0%) | 0 (0.0%) |
| 35 to 50 years | 0 (0.0%) | 0 (0.0%) |
| Total | 4 (100.0%) | 0 (0.0%) |
Fertility by Education in Standard City
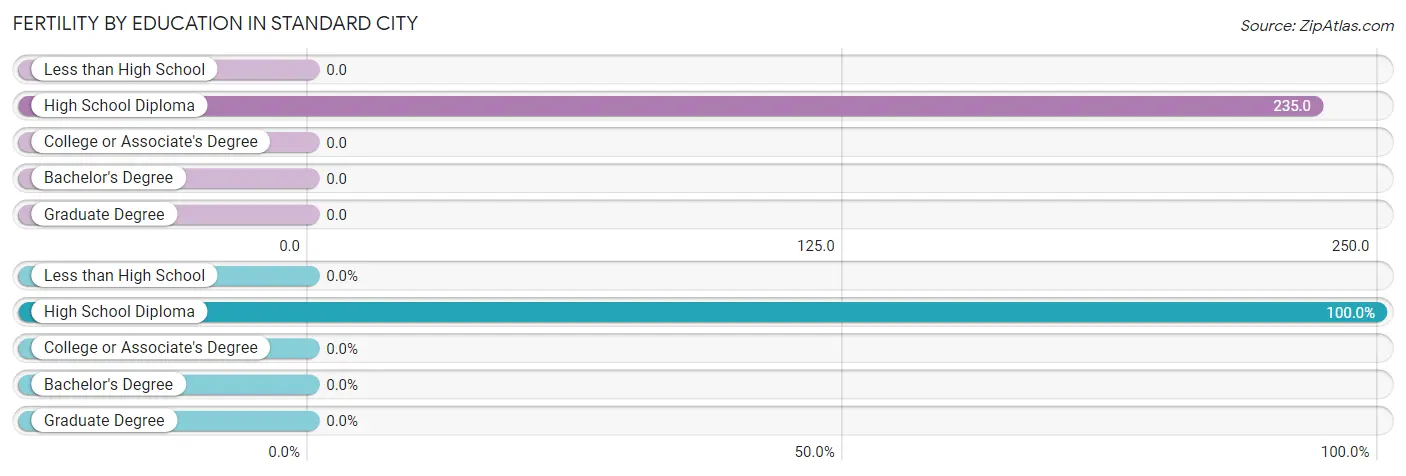
| Educational Attainment | Women with Births | Births / 1,000 Women |
| Less than High School | 0 (0.0%) | 0.0 |
| High School Diploma | 4 (100.0%) | 235.0 |
| College or Associate's Degree | 0 (0.0%) | 0.0 |
| Bachelor's Degree | 0 (0.0%) | 0.0 |
| Graduate Degree | 0 (0.0%) | 0.0 |
| Total | 4 (100.0%) | 98.0 |
Fertility by Education by Marriage Status in Standard City
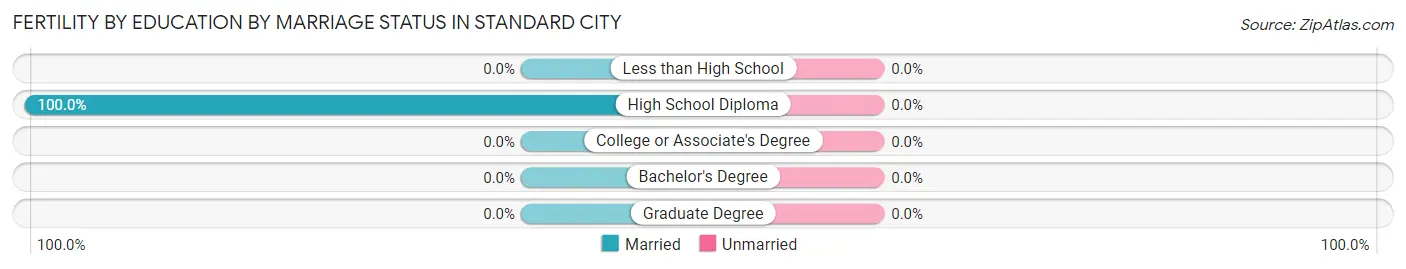
| Educational Attainment | Married | Unmarried |
| Less than High School | 0 (0.0%) | 0 (0.0%) |
| High School Diploma | 4 (100.0%) | 0 (0.0%) |
| College or Associate's Degree | 0 (0.0%) | 0 (0.0%) |
| Bachelor's Degree | 0 (0.0%) | 0 (0.0%) |
| Graduate Degree | 0 (0.0%) | 0 (0.0%) |
| Total | 4 (100.0%) | 0 (0.0%) |
Employment Characteristics in Standard City
Employment by Class of Employer in Standard City
Among the 66 employed individuals in Standard City, private company employees (60 | 90.9%), not-for-profit organizations (4 | 6.1%), and self-employed (not incorporated) (1 | 1.5%) make up the most common classes of employment.
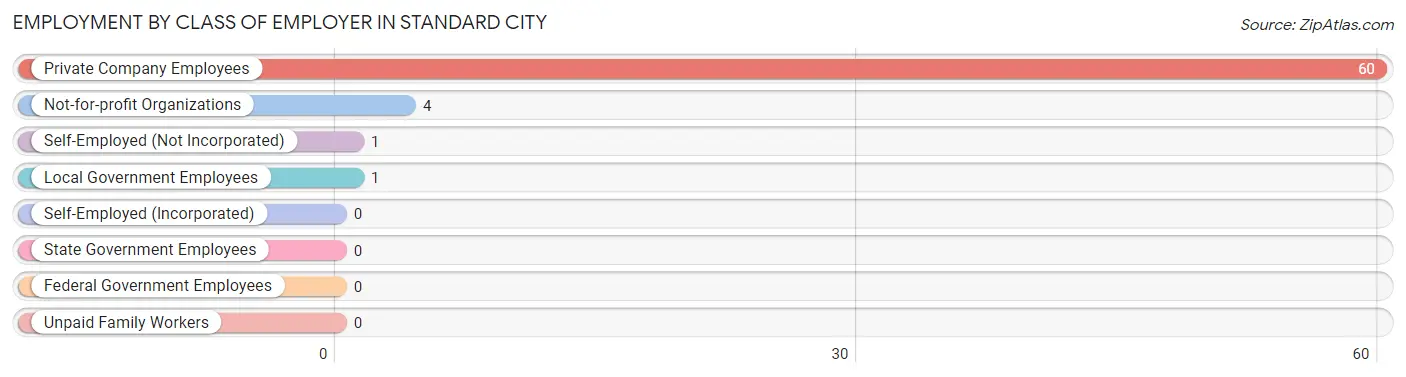
| Employer Class | # Employees | % Employees |
| Private Company Employees | 60 | 90.9% |
| Self-Employed (Incorporated) | 0 | 0.0% |
| Self-Employed (Not Incorporated) | 1 | 1.5% |
| Not-for-profit Organizations | 4 | 6.1% |
| Local Government Employees | 1 | 1.5% |
| State Government Employees | 0 | 0.0% |
| Federal Government Employees | 0 | 0.0% |
| Unpaid Family Workers | 0 | 0.0% |
| Total | 66 | 100.0% |
Employment Status by Age in Standard City
According to the labor force statistics for Standard City, out of the total population over 16 years of age (144), 49.3% or 71 individuals are in the labor force, with 5.6% or 4 of them unemployed. The age group with the highest labor force participation rate is 25 to 29 years, with 100.0% or 12 individuals in the labor force. Within the labor force, the 20 to 24 years age range has the highest percentage of unemployed individuals, with 22.2% or 2 of them being unemployed.
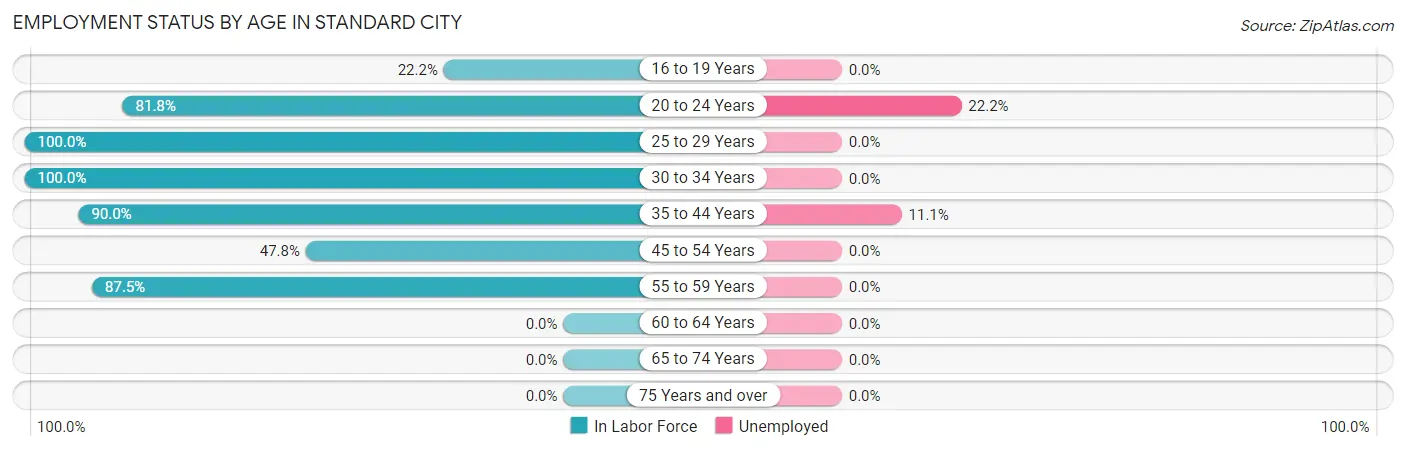
| Age Bracket | In Labor Force | Unemployed |
| 16 to 19 Years | 4 (22.2%) | 0 (0.0%) |
| 20 to 24 Years | 9 (81.8%) | 2 (22.2%) |
| 25 to 29 Years | 12 (100.0%) | 0 (0.0%) |
| 30 to 34 Years | 10 (100.0%) | 0 (0.0%) |
| 35 to 44 Years | 18 (90.0%) | 2 (11.1%) |
| 45 to 54 Years | 11 (47.8%) | 0 (0.0%) |
| 55 to 59 Years | 7 (87.5%) | 0 (0.0%) |
| 60 to 64 Years | 0 (0.0%) | 0 (0.0%) |
| 65 to 74 Years | 0 (0.0%) | 0 (0.0%) |
| 75 Years and over | 0 (0.0%) | 0 (0.0%) |
| Total | 71 (49.3%) | 4 (5.6%) |
Employment Status by Educational Attainment in Standard City
According to labor force statistics for Standard City, 74.4% of individuals (58) out of the total population between 25 and 64 years of age (78) are in the labor force, with 3.4% or 2 of them being unemployed. The group with the highest labor force participation rate are those with the educational attainment of bachelor's degree or higher, with 100.0% or 3 individuals in the labor force. Within the labor force, individuals with college / associate degree education have the highest percentage of unemployment, with 9.5% or 2 of them being unemployed.
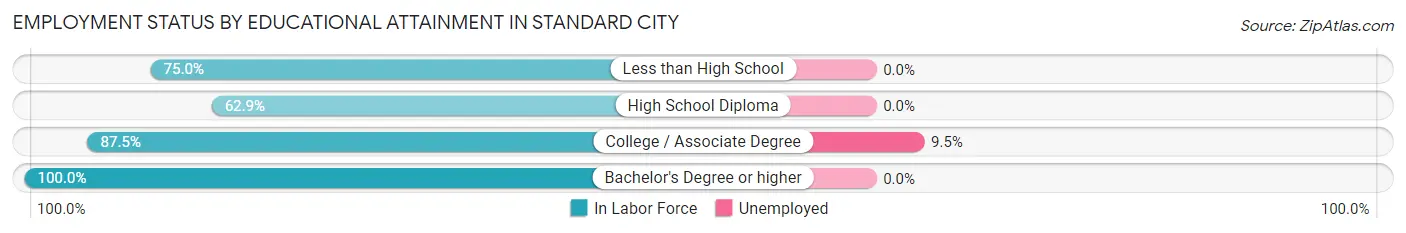
| Educational Attainment | In Labor Force | Unemployed |
| Less than High School | 12 (75.0%) | 0 (0.0%) |
| High School Diploma | 22 (62.9%) | 0 (0.0%) |
| College / Associate Degree | 21 (87.5%) | 2 (9.5%) |
| Bachelor's Degree or higher | 3 (100.0%) | 0 (0.0%) |
| Total | 58 (74.4%) | 3 (3.4%) |
Employment Occupations by Sex in Standard City
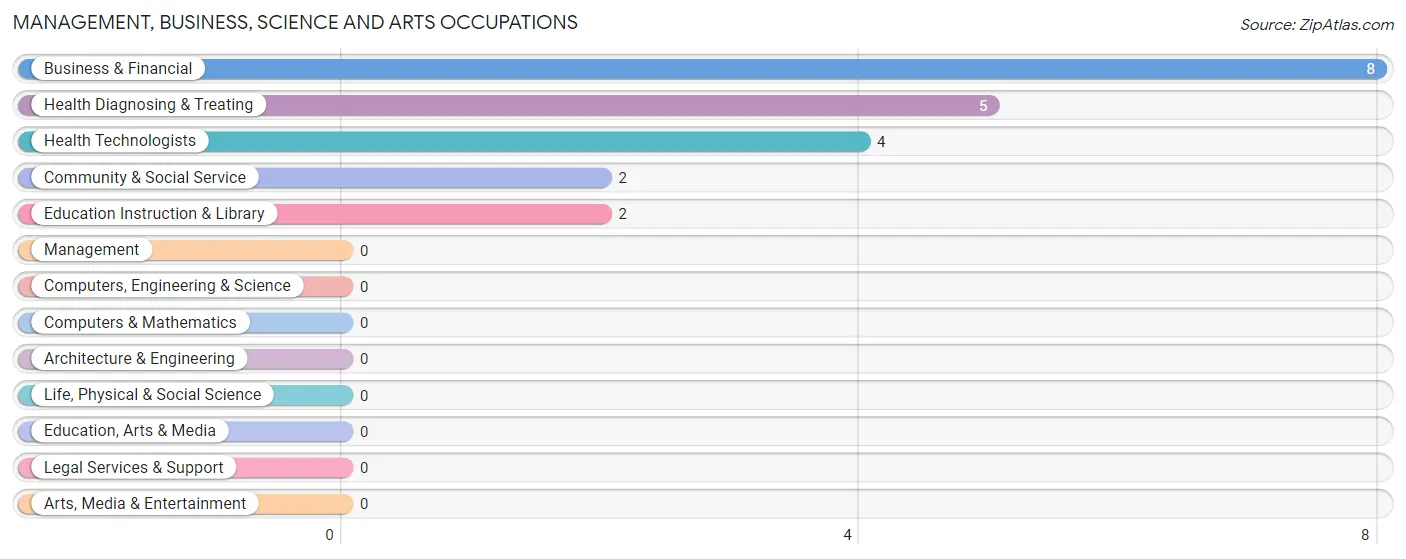
Management, Business, Science and Arts Occupations
The most common Management, Business, Science and Arts occupations in Standard City are Business & Financial (8 | 11.9%), Health Diagnosing & Treating (5 | 7.5%), Health Technologists (4 | 6.0%), Community & Social Service (2 | 3.0%), and Education Instruction & Library (2 | 3.0%).
Management, Business, Science and Arts Occupations by Sex
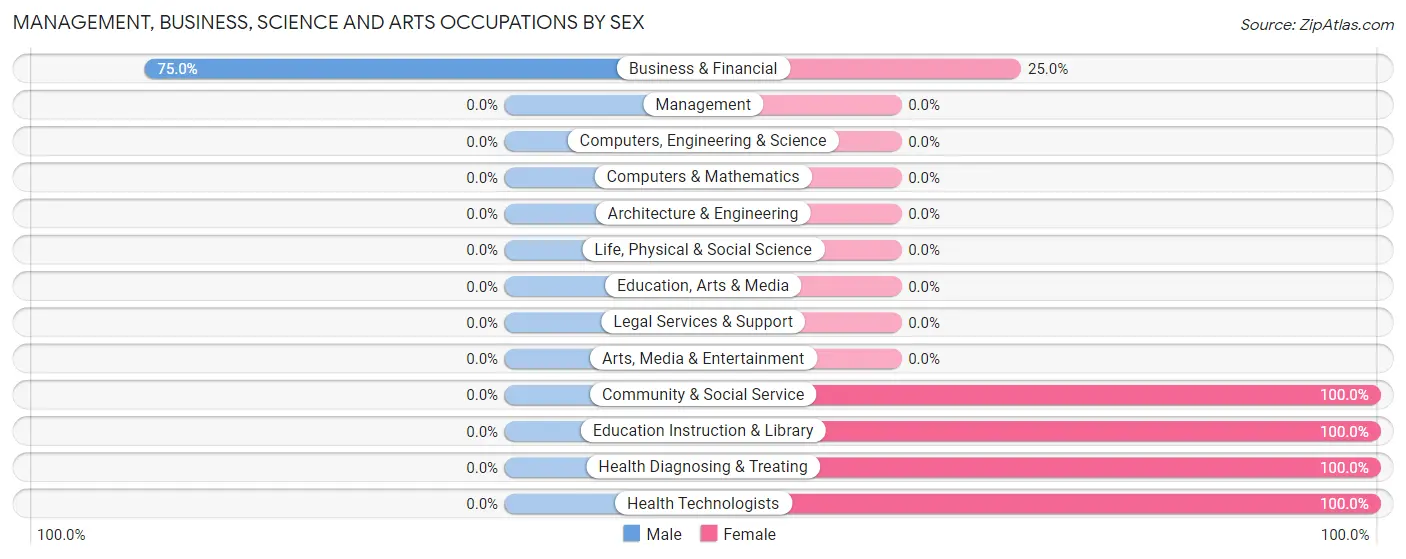
| Occupation | Male | Female |
| Management | 0 (0.0%) | 0 (0.0%) |
| Business & Financial | 6 (75.0%) | 2 (25.0%) |
| Computers, Engineering & Science | 0 (0.0%) | 0 (0.0%) |
| Computers & Mathematics | 0 (0.0%) | 0 (0.0%) |
| Architecture & Engineering | 0 (0.0%) | 0 (0.0%) |
| Life, Physical & Social Science | 0 (0.0%) | 0 (0.0%) |
| Community & Social Service | 0 (0.0%) | 2 (100.0%) |
| Education, Arts & Media | 0 (0.0%) | 0 (0.0%) |
| Legal Services & Support | 0 (0.0%) | 0 (0.0%) |
| Education Instruction & Library | 0 (0.0%) | 2 (100.0%) |
| Arts, Media & Entertainment | 0 (0.0%) | 0 (0.0%) |
| Health Diagnosing & Treating | 0 (0.0%) | 5 (100.0%) |
| Health Technologists | 0 (0.0%) | 4 (100.0%) |
| Total (Category) | 6 (40.0%) | 9 (60.0%) |
| Total (Overall) | 35 (52.2%) | 32 (47.8%) |
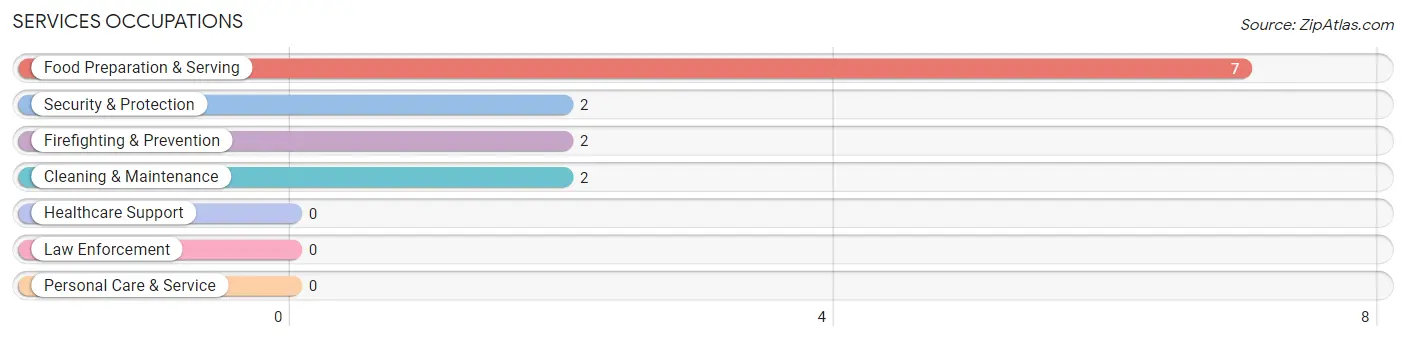
Services Occupations
The most common Services occupations in Standard City are Food Preparation & Serving (7 | 10.4%), Security & Protection (2 | 3.0%), Firefighting & Prevention (2 | 3.0%), and Cleaning & Maintenance (2 | 3.0%).
Services Occupations by Sex
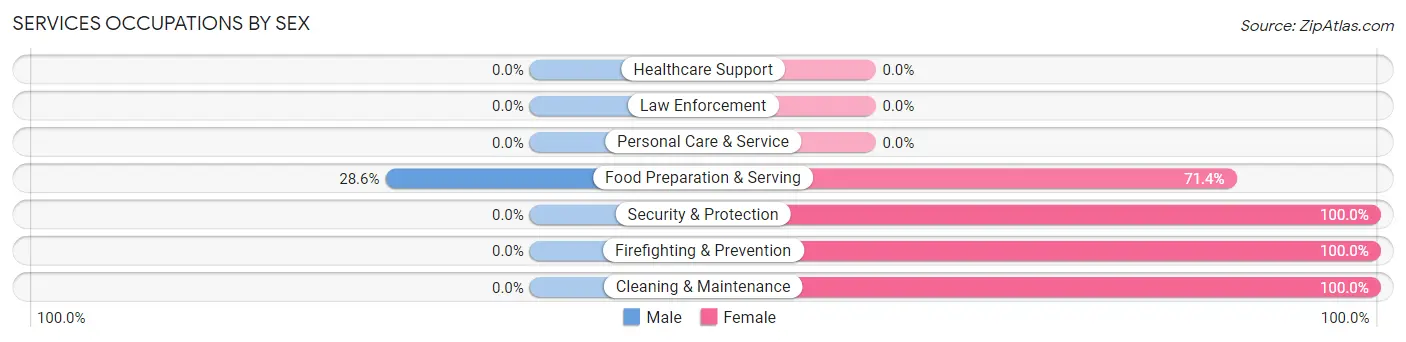
| Occupation | Male | Female |
| Healthcare Support | 0 (0.0%) | 0 (0.0%) |
| Security & Protection | 0 (0.0%) | 2 (100.0%) |
| Firefighting & Prevention | 0 (0.0%) | 2 (100.0%) |
| Law Enforcement | 0 (0.0%) | 0 (0.0%) |
| Food Preparation & Serving | 2 (28.6%) | 5 (71.4%) |
| Cleaning & Maintenance | 0 (0.0%) | 2 (100.0%) |
| Personal Care & Service | 0 (0.0%) | 0 (0.0%) |
| Total (Category) | 2 (18.2%) | 9 (81.8%) |
| Total (Overall) | 35 (52.2%) | 32 (47.8%) |
Sales and Office Occupations
The most common Sales and Office occupations in Standard City are Office & Administration (9 | 13.4%), and Sales & Related (2 | 3.0%).
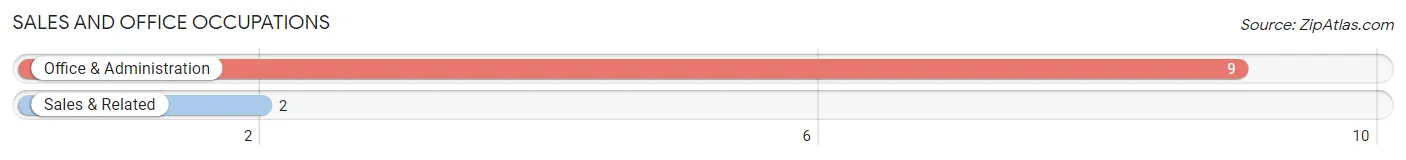
Sales and Office Occupations by Sex
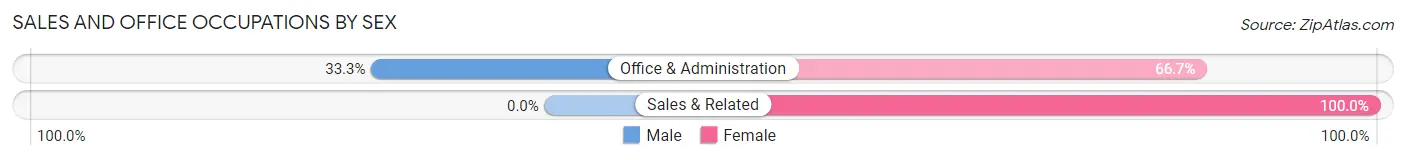
| Occupation | Male | Female |
| Sales & Related | 0 (0.0%) | 2 (100.0%) |
| Office & Administration | 3 (33.3%) | 6 (66.7%) |
| Total (Category) | 3 (27.3%) | 8 (72.7%) |
| Total (Overall) | 35 (52.2%) | 32 (47.8%) |
Natural Resources, Construction and Maintenance Occupations
The most common Natural Resources, Construction and Maintenance occupations in Standard City are Construction & Extraction (8 | 11.9%), and Installation, Maintenance & Repair (7 | 10.4%).
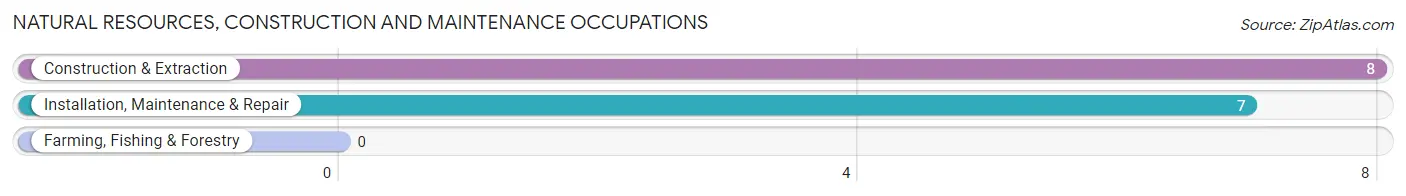
Natural Resources, Construction and Maintenance Occupations by Sex
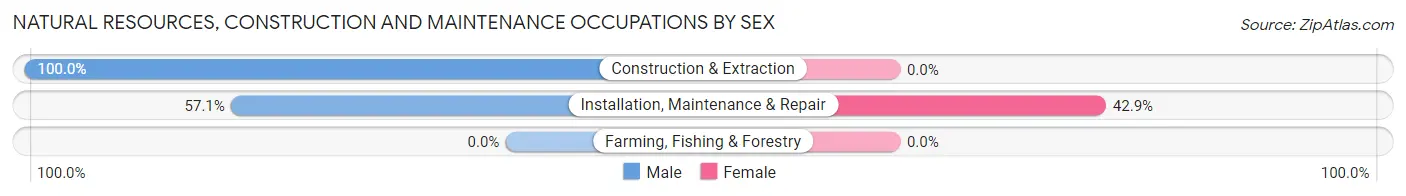
| Occupation | Male | Female |
| Farming, Fishing & Forestry | 0 (0.0%) | 0 (0.0%) |
| Construction & Extraction | 8 (100.0%) | 0 (0.0%) |
| Installation, Maintenance & Repair | 4 (57.1%) | 3 (42.9%) |
| Total (Category) | 12 (80.0%) | 3 (20.0%) |
| Total (Overall) | 35 (52.2%) | 32 (47.8%) |
Production, Transportation and Moving Occupations
The most common Production, Transportation and Moving occupations in Standard City are Material Moving (12 | 17.9%), and Production (3 | 4.5%).
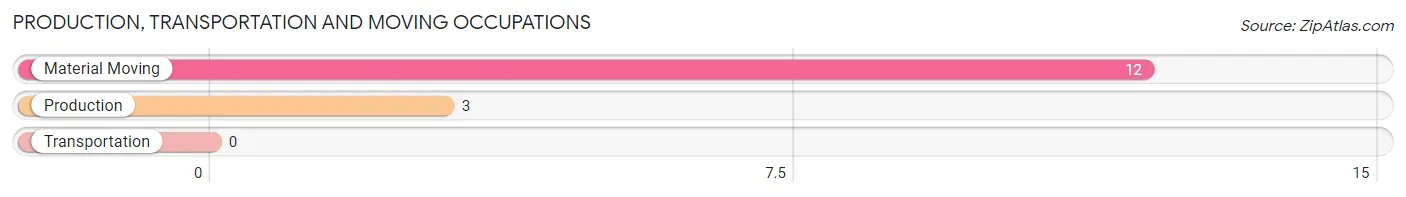
Production, Transportation and Moving Occupations by Sex
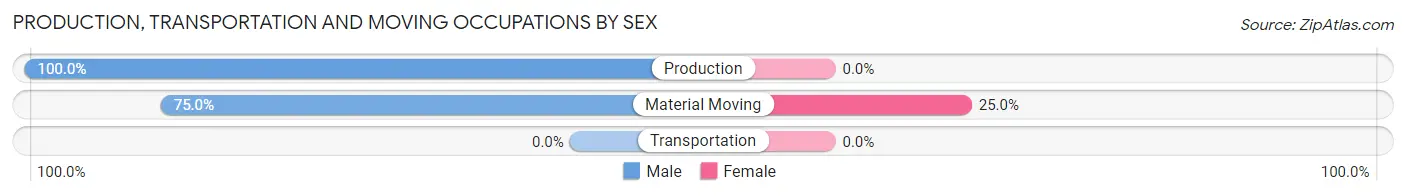
| Occupation | Male | Female |
| Production | 3 (100.0%) | 0 (0.0%) |
| Transportation | 0 (0.0%) | 0 (0.0%) |
| Material Moving | 9 (75.0%) | 3 (25.0%) |
| Total (Category) | 12 (80.0%) | 3 (20.0%) |
| Total (Overall) | 35 (52.2%) | 32 (47.8%) |
Employment Industries by Sex in Standard City
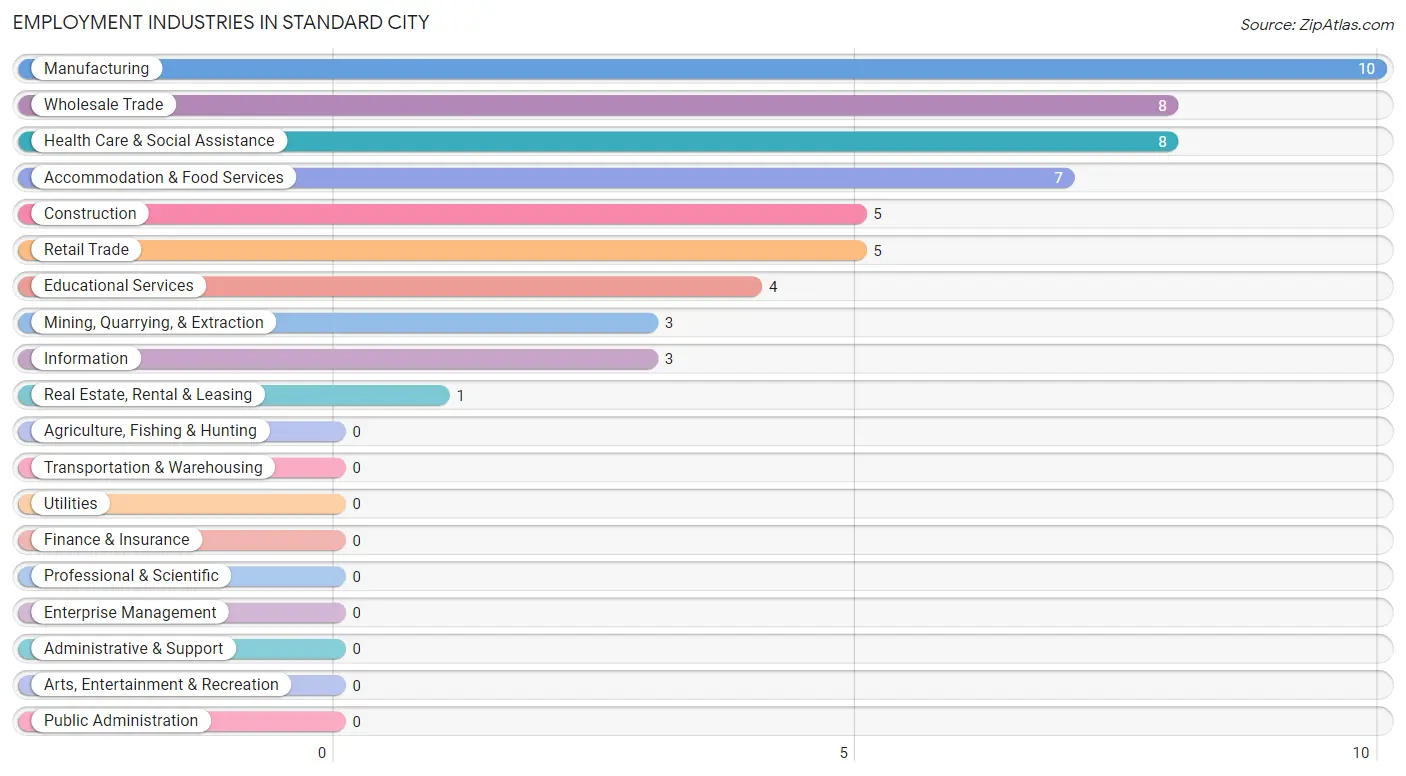
Employment Industries in Standard City
The major employment industries in Standard City include Manufacturing (10 | 14.9%), Wholesale Trade (8 | 11.9%), Health Care & Social Assistance (8 | 11.9%), Accommodation & Food Services (7 | 10.4%), and Construction (5 | 7.5%).
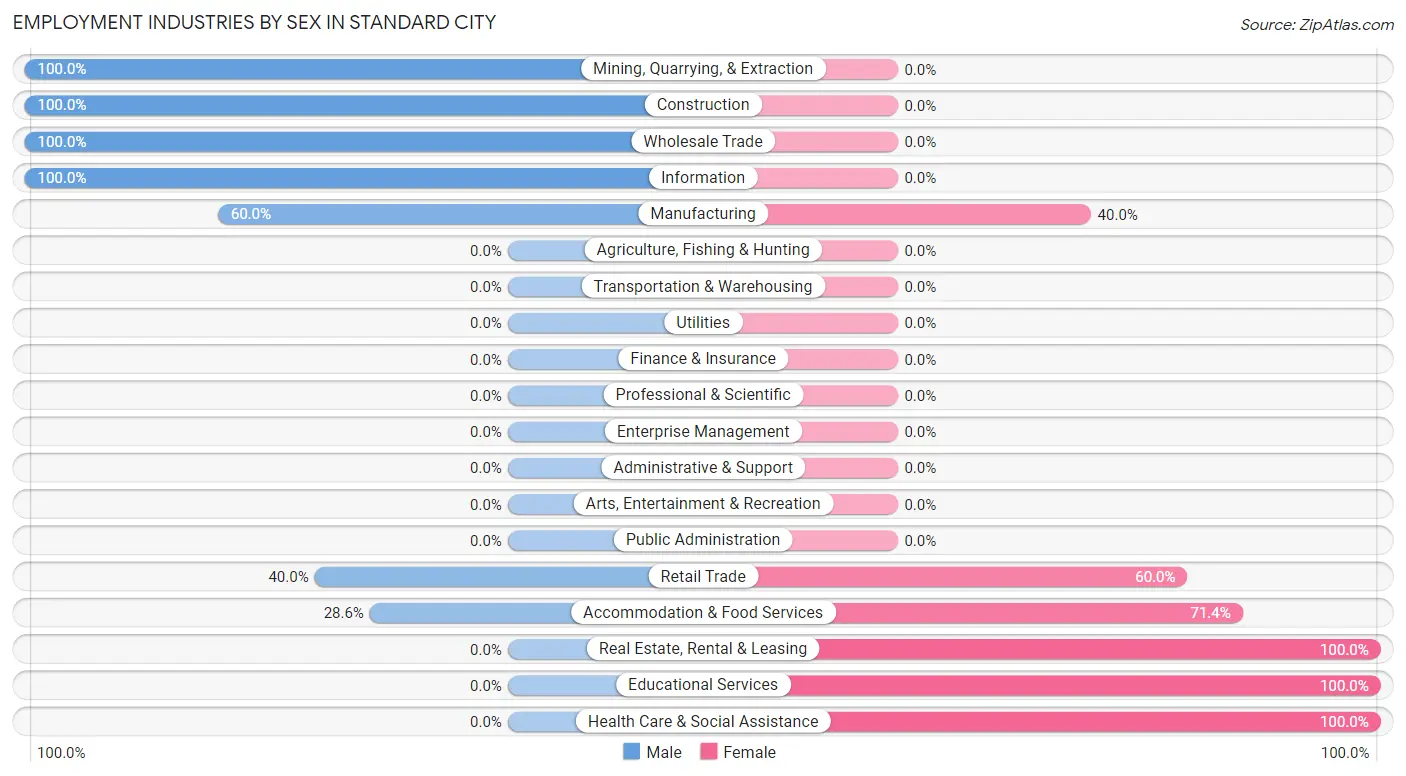
Employment Industries by Sex in Standard City
The Standard City industries that see more men than women are Mining, Quarrying, & Extraction (100.0%), Construction (100.0%), and Wholesale Trade (100.0%), whereas the industries that tend to have a higher number of women are Real Estate, Rental & Leasing (100.0%), Educational Services (100.0%), and Health Care & Social Assistance (100.0%).
| Industry | Male | Female |
| Agriculture, Fishing & Hunting | 0 (0.0%) | 0 (0.0%) |
| Mining, Quarrying, & Extraction | 3 (100.0%) | 0 (0.0%) |
| Construction | 5 (100.0%) | 0 (0.0%) |
| Manufacturing | 6 (60.0%) | 4 (40.0%) |
| Wholesale Trade | 8 (100.0%) | 0 (0.0%) |
| Retail Trade | 2 (40.0%) | 3 (60.0%) |
| Transportation & Warehousing | 0 (0.0%) | 0 (0.0%) |
| Utilities | 0 (0.0%) | 0 (0.0%) |
| Information | 3 (100.0%) | 0 (0.0%) |
| Finance & Insurance | 0 (0.0%) | 0 (0.0%) |
| Real Estate, Rental & Leasing | 0 (0.0%) | 1 (100.0%) |
| Professional & Scientific | 0 (0.0%) | 0 (0.0%) |
| Enterprise Management | 0 (0.0%) | 0 (0.0%) |
| Administrative & Support | 0 (0.0%) | 0 (0.0%) |
| Educational Services | 0 (0.0%) | 4 (100.0%) |
| Health Care & Social Assistance | 0 (0.0%) | 8 (100.0%) |
| Arts, Entertainment & Recreation | 0 (0.0%) | 0 (0.0%) |
| Accommodation & Food Services | 2 (28.6%) | 5 (71.4%) |
| Public Administration | 0 (0.0%) | 0 (0.0%) |
| Total | 35 (52.2%) | 32 (47.8%) |
Education in Standard City
School Enrollment in Standard City
The most common levels of schooling among the 47 students in Standard City are high school (23 | 48.9%), college / undergraduate (11 | 23.4%), and middle school (8 | 17.0%).
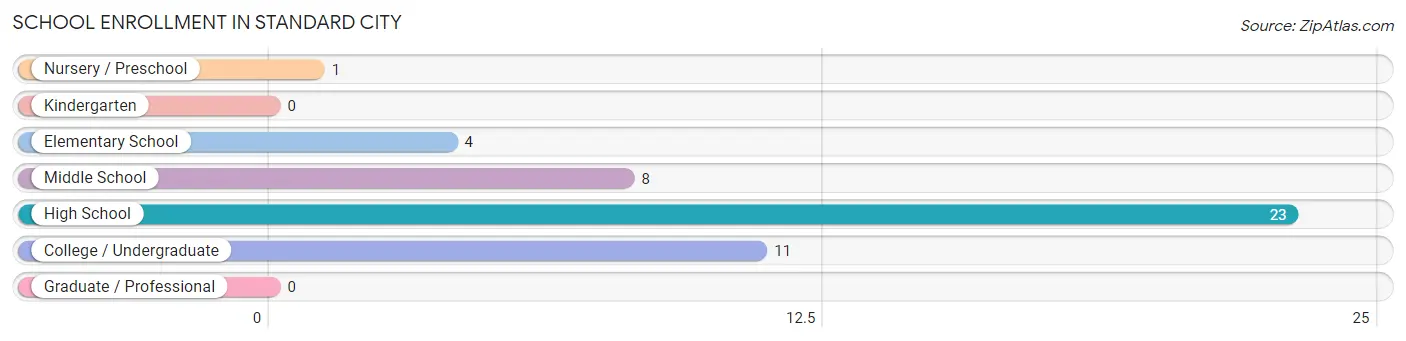
| School Level | # Students | % Students |
| Nursery / Preschool | 1 | 2.1% |
| Kindergarten | 0 | 0.0% |
| Elementary School | 4 | 8.5% |
| Middle School | 8 | 17.0% |
| High School | 23 | 48.9% |
| College / Undergraduate | 11 | 23.4% |
| Graduate / Professional | 0 | 0.0% |
| Total | 47 | 100.0% |
School Enrollment by Age by Funding Source in Standard City
Out of a total of 47 students who are enrolled in schools in Standard City, 2 (4.3%) attend a private institution, while the remaining 45 (95.7%) are enrolled in public schools. The age group of 20 to 24 year olds has the highest likelihood of being enrolled in private schools, with 2 (25.0% in the age bracket) enrolled. Conversely, the age group of 3 to 4 year olds has the lowest likelihood of being enrolled in a private school, with 1 (100.0% in the age bracket) attending a public institution.
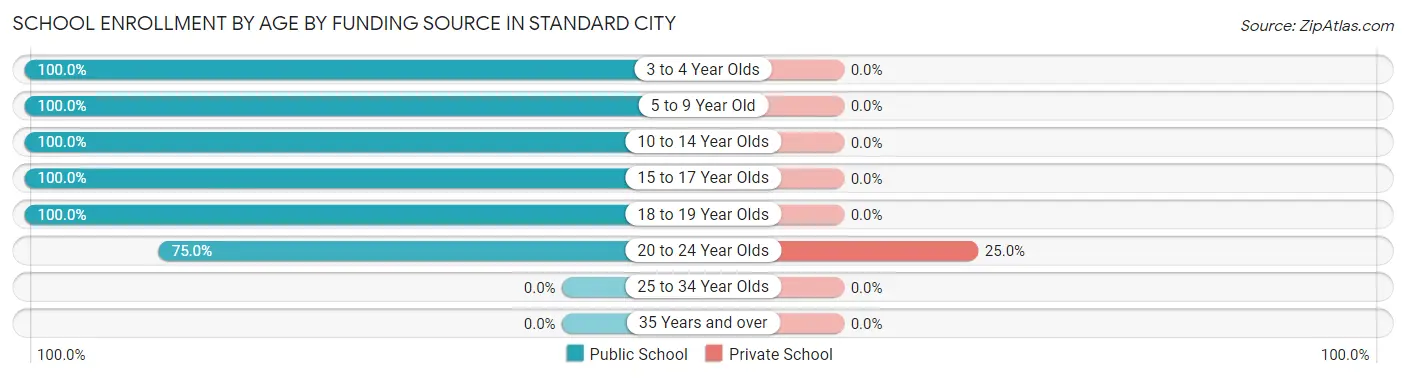
| Age Bracket | Public School | Private School |
| 3 to 4 Year Olds | 1 (100.0%) | 0 (0.0%) |
| 5 to 9 Year Old | 4 (100.0%) | 0 (0.0%) |
| 10 to 14 Year Olds | 12 (100.0%) | 0 (0.0%) |
| 15 to 17 Year Olds | 16 (100.0%) | 0 (0.0%) |
| 18 to 19 Year Olds | 6 (100.0%) | 0 (0.0%) |
| 20 to 24 Year Olds | 6 (75.0%) | 2 (25.0%) |
| 25 to 34 Year Olds | 0 (0.0%) | 0 (0.0%) |
| 35 Years and over | 0 (0.0%) | 0 (0.0%) |
| Total | 45 (95.7%) | 2 (4.3%) |
Educational Attainment by Field of Study in Standard City
Business (2 | 66.7%), and arts & humanities (1 | 33.3%) are the most common fields of study among 3 individuals in Standard City who have obtained a bachelor's degree or higher.
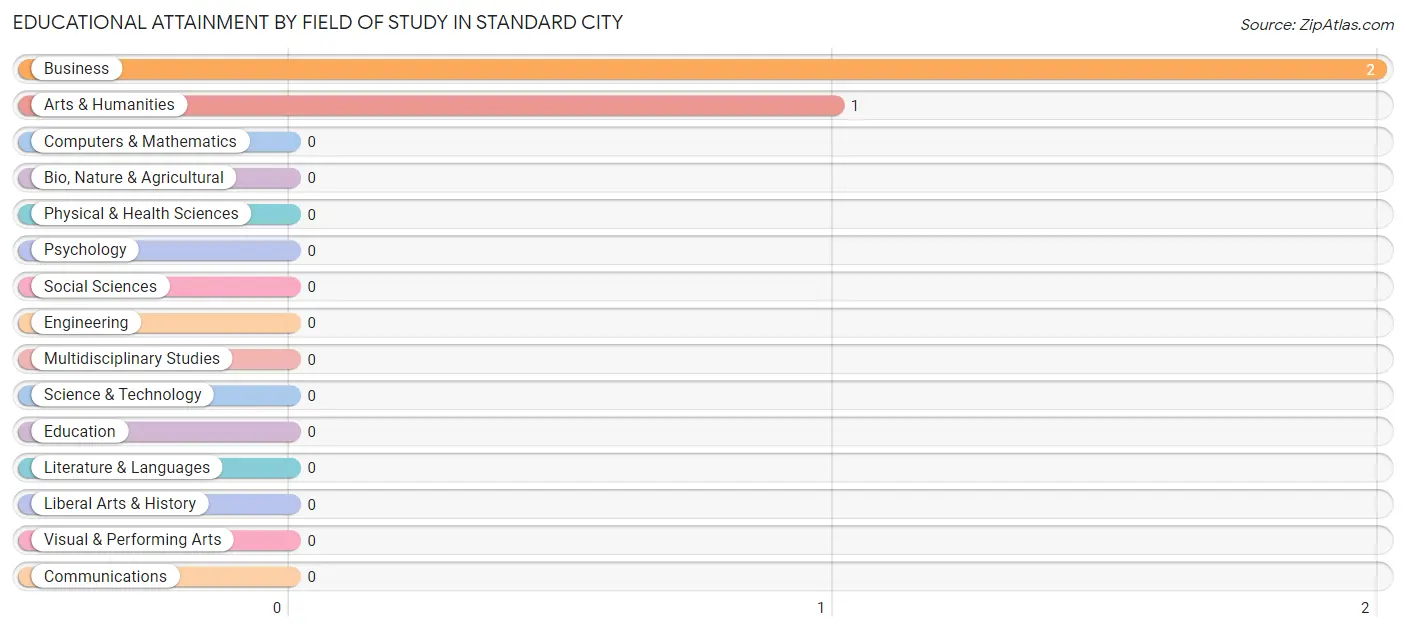
| Field of Study | # Graduates | % Graduates |
| Computers & Mathematics | 0 | 0.0% |
| Bio, Nature & Agricultural | 0 | 0.0% |
| Physical & Health Sciences | 0 | 0.0% |
| Psychology | 0 | 0.0% |
| Social Sciences | 0 | 0.0% |
| Engineering | 0 | 0.0% |
| Multidisciplinary Studies | 0 | 0.0% |
| Science & Technology | 0 | 0.0% |
| Business | 2 | 66.7% |
| Education | 0 | 0.0% |
| Literature & Languages | 0 | 0.0% |
| Liberal Arts & History | 0 | 0.0% |
| Visual & Performing Arts | 0 | 0.0% |
| Communications | 0 | 0.0% |
| Arts & Humanities | 1 | 33.3% |
| Total | 3 | 100.0% |
Transportation & Commute in Standard City
Vehicle Availability by Sex in Standard City
The most prevalent vehicle ownership categories in Standard City are males with 4 vehicles (18, accounting for 52.9%) and females with 4 vehicles (16, making up 56.2%).
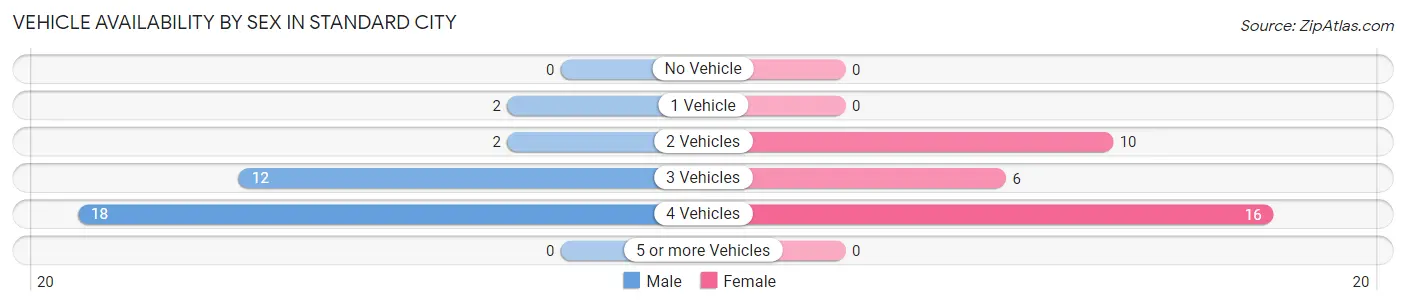
| Vehicles Available | Male | Female |
| No Vehicle | 0 (0.0%) | 0 (0.0%) |
| 1 Vehicle | 2 (5.9%) | 0 (0.0%) |
| 2 Vehicles | 2 (5.9%) | 10 (31.2%) |
| 3 Vehicles | 12 (35.3%) | 6 (18.8%) |
| 4 Vehicles | 18 (52.9%) | 16 (50.0%) |
| 5 or more Vehicles | 0 (0.0%) | 0 (0.0%) |
| Total | 34 (100.0%) | 32 (100.0%) |
Commute Time in Standard City
The most frequently occuring commute durations in Standard City are 15 to 19 minutes (14 commuters, 21.2%), 20 to 24 minutes (14 commuters, 21.2%), and 60 to 89 minutes (13 commuters, 19.7%).
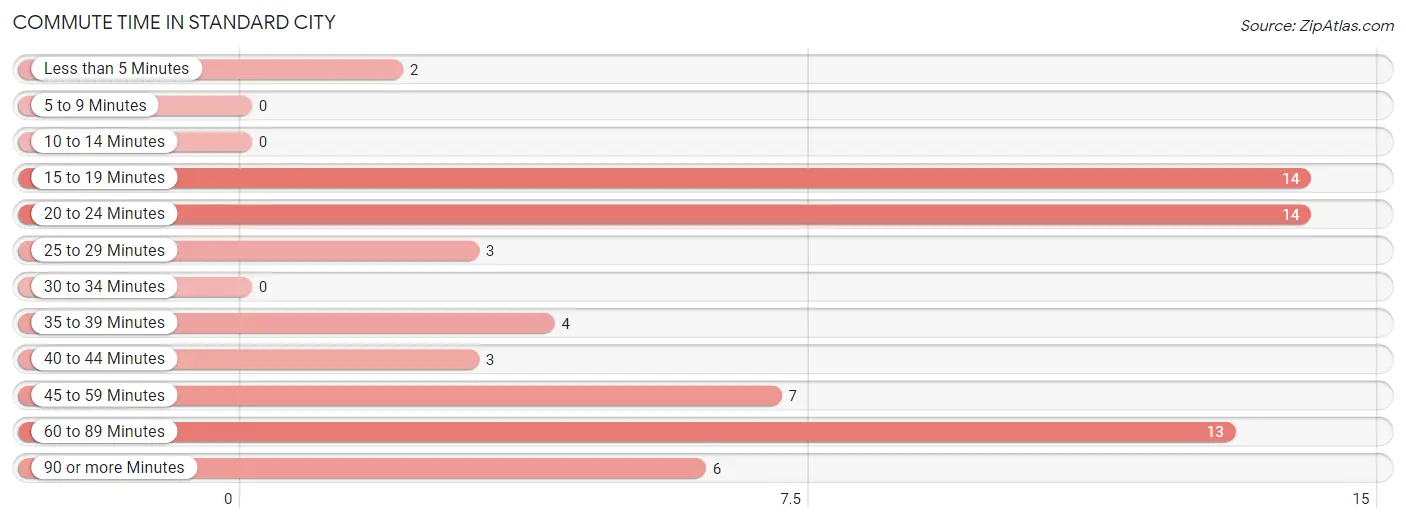
| Commute Time | # Commuters | % Commuters |
| Less than 5 Minutes | 2 | 3.0% |
| 5 to 9 Minutes | 0 | 0.0% |
| 10 to 14 Minutes | 0 | 0.0% |
| 15 to 19 Minutes | 14 | 21.2% |
| 20 to 24 Minutes | 14 | 21.2% |
| 25 to 29 Minutes | 3 | 4.5% |
| 30 to 34 Minutes | 0 | 0.0% |
| 35 to 39 Minutes | 4 | 6.1% |
| 40 to 44 Minutes | 3 | 4.5% |
| 45 to 59 Minutes | 7 | 10.6% |
| 60 to 89 Minutes | 13 | 19.7% |
| 90 or more Minutes | 6 | 9.1% |
Commute Time by Sex in Standard City
The most common commute times in Standard City are 60 to 89 minutes (9 commuters, 26.5%) for males and 20 to 24 minutes (10 commuters, 31.2%) for females.
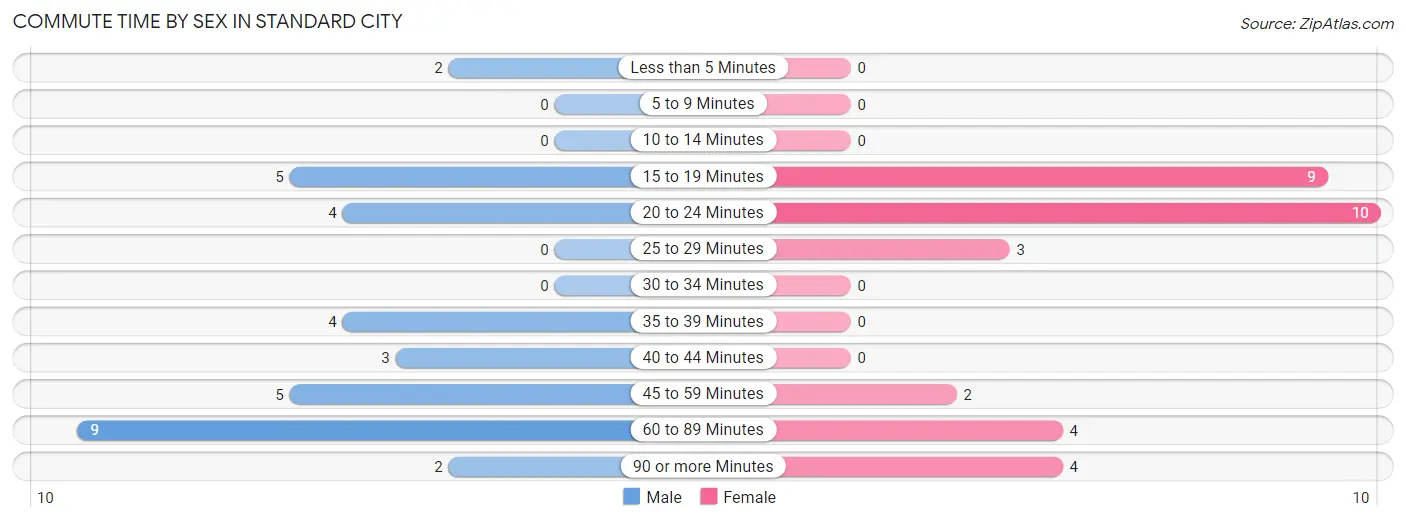
| Commute Time | Male | Female |
| Less than 5 Minutes | 2 (5.9%) | 0 (0.0%) |
| 5 to 9 Minutes | 0 (0.0%) | 0 (0.0%) |
| 10 to 14 Minutes | 0 (0.0%) | 0 (0.0%) |
| 15 to 19 Minutes | 5 (14.7%) | 9 (28.1%) |
| 20 to 24 Minutes | 4 (11.8%) | 10 (31.2%) |
| 25 to 29 Minutes | 0 (0.0%) | 3 (9.4%) |
| 30 to 34 Minutes | 0 (0.0%) | 0 (0.0%) |
| 35 to 39 Minutes | 4 (11.8%) | 0 (0.0%) |
| 40 to 44 Minutes | 3 (8.8%) | 0 (0.0%) |
| 45 to 59 Minutes | 5 (14.7%) | 2 (6.2%) |
| 60 to 89 Minutes | 9 (26.5%) | 4 (12.5%) |
| 90 or more Minutes | 2 (5.9%) | 4 (12.5%) |
Time of Departure to Work by Sex in Standard City
The most frequent times of departure to work in Standard City are 6:30 AM to 6:59 AM (7, 20.6%) for males and 5:30 AM to 5:59 AM (10, 31.2%) for females.
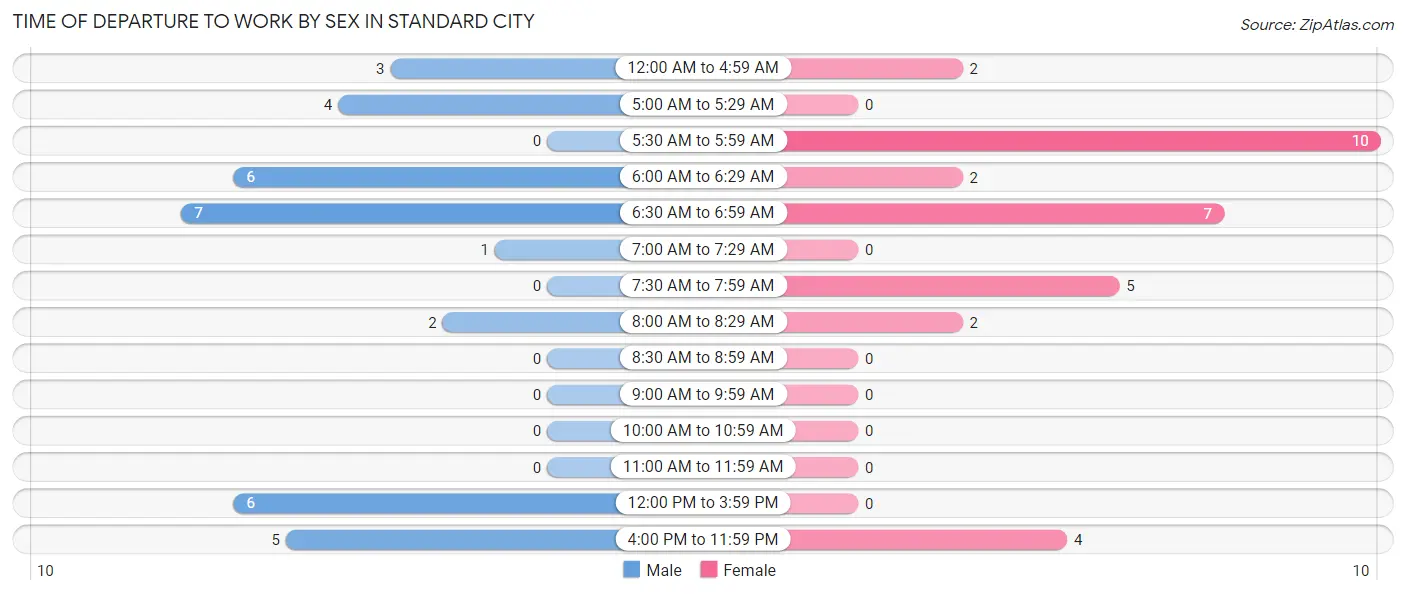
| Time of Departure | Male | Female |
| 12:00 AM to 4:59 AM | 3 (8.8%) | 2 (6.2%) |
| 5:00 AM to 5:29 AM | 4 (11.8%) | 0 (0.0%) |
| 5:30 AM to 5:59 AM | 0 (0.0%) | 10 (31.2%) |
| 6:00 AM to 6:29 AM | 6 (17.6%) | 2 (6.2%) |
| 6:30 AM to 6:59 AM | 7 (20.6%) | 7 (21.9%) |
| 7:00 AM to 7:29 AM | 1 (2.9%) | 0 (0.0%) |
| 7:30 AM to 7:59 AM | 0 (0.0%) | 5 (15.6%) |
| 8:00 AM to 8:29 AM | 2 (5.9%) | 2 (6.2%) |
| 8:30 AM to 8:59 AM | 0 (0.0%) | 0 (0.0%) |
| 9:00 AM to 9:59 AM | 0 (0.0%) | 0 (0.0%) |
| 10:00 AM to 10:59 AM | 0 (0.0%) | 0 (0.0%) |
| 11:00 AM to 11:59 AM | 0 (0.0%) | 0 (0.0%) |
| 12:00 PM to 3:59 PM | 6 (17.6%) | 0 (0.0%) |
| 4:00 PM to 11:59 PM | 5 (14.7%) | 4 (12.5%) |
| Total | 34 (100.0%) | 32 (100.0%) |
Housing Occupancy in Standard City
Occupancy by Ownership in Standard City
Of the total 60 dwellings in Standard City, owner-occupied units account for 57 (95.0%), while renter-occupied units make up 3 (5.0%).
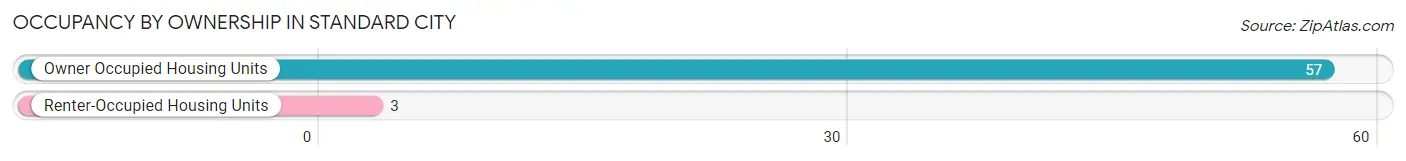
| Occupancy | # Housing Units | % Housing Units |
| Owner Occupied Housing Units | 57 | 95.0% |
| Renter-Occupied Housing Units | 3 | 5.0% |
| Total Occupied Housing Units | 60 | 100.0% |
Occupancy by Household Size in Standard City
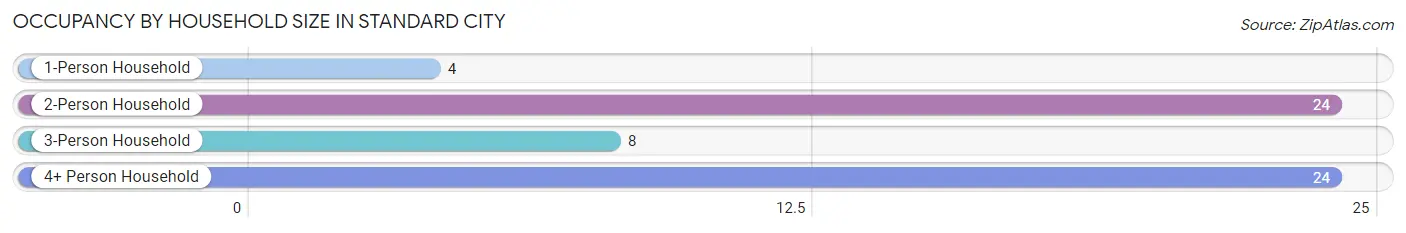
| Household Size | # Housing Units | % Housing Units |
| 1-Person Household | 4 | 6.7% |
| 2-Person Household | 24 | 40.0% |
| 3-Person Household | 8 | 13.3% |
| 4+ Person Household | 24 | 40.0% |
| Total Housing Units | 60 | 100.0% |
Occupancy by Ownership by Household Size in Standard City
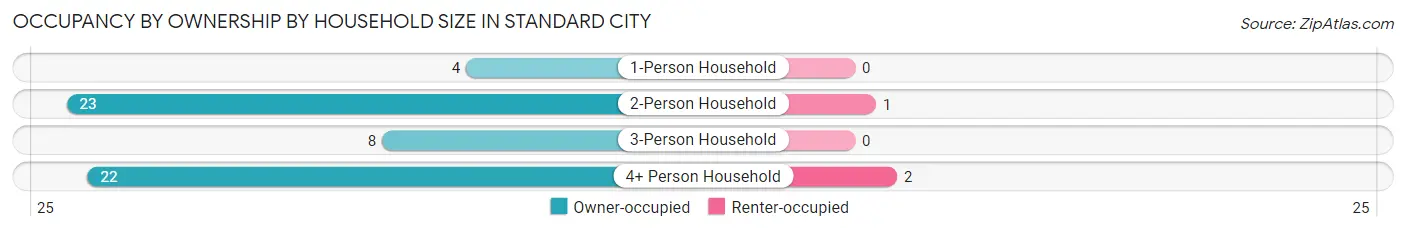
| Household Size | Owner-occupied | Renter-occupied |
| 1-Person Household | 4 (100.0%) | 0 (0.0%) |
| 2-Person Household | 23 (95.8%) | 1 (4.2%) |
| 3-Person Household | 8 (100.0%) | 0 (0.0%) |
| 4+ Person Household | 22 (91.7%) | 2 (8.3%) |
| Total Housing Units | 57 (95.0%) | 3 (5.0%) |
Occupancy by Educational Attainment in Standard City
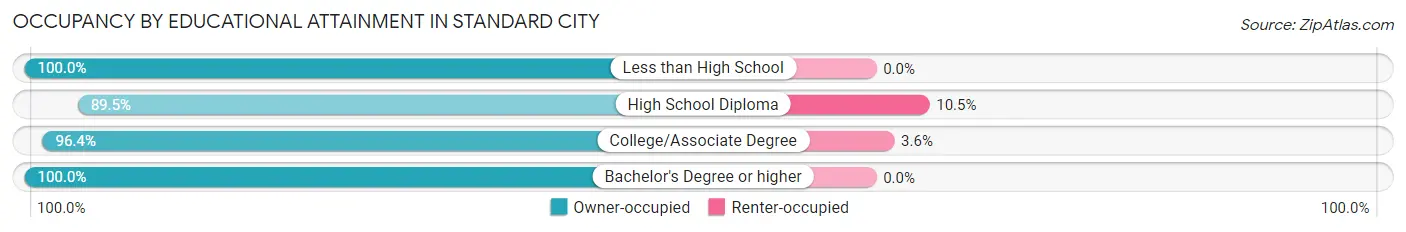
| Household Size | Owner-occupied | Renter-occupied |
| Less than High School | 11 (100.0%) | 0 (0.0%) |
| High School Diploma | 17 (89.5%) | 2 (10.5%) |
| College/Associate Degree | 27 (96.4%) | 1 (3.6%) |
| Bachelor's Degree or higher | 2 (100.0%) | 0 (0.0%) |
Occupancy by Age of Householder in Standard City
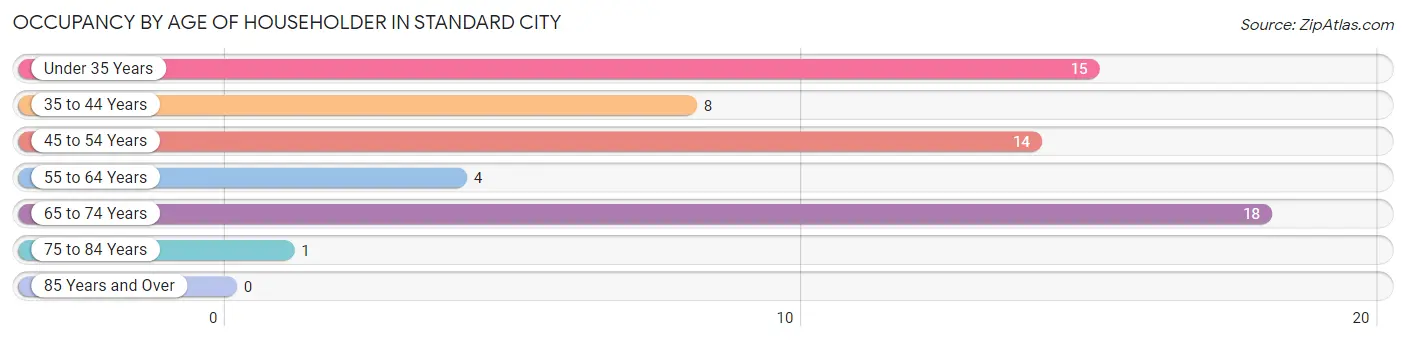
| Age Bracket | # Households | % Households |
| Under 35 Years | 15 | 25.0% |
| 35 to 44 Years | 8 | 13.3% |
| 45 to 54 Years | 14 | 23.3% |
| 55 to 64 Years | 4 | 6.7% |
| 65 to 74 Years | 18 | 30.0% |
| 75 to 84 Years | 1 | 1.7% |
| 85 Years and Over | 0 | 0.0% |
| Total | 60 | 100.0% |
Housing Finances in Standard City
Median Income by Occupancy in Standard City
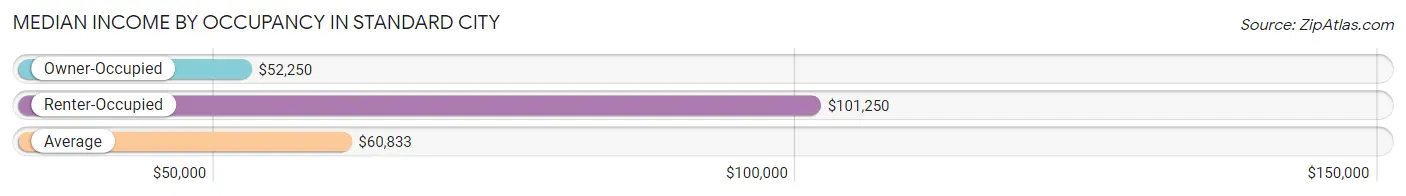
| Occupancy Type | # Households | Median Income |
| Owner-Occupied | 57 (95.0%) | $52,250 |
| Renter-Occupied | 3 (5.0%) | $101,250 |
| Average | 60 (100.0%) | $60,833 |
Occupancy by Householder Income Bracket in Standard City
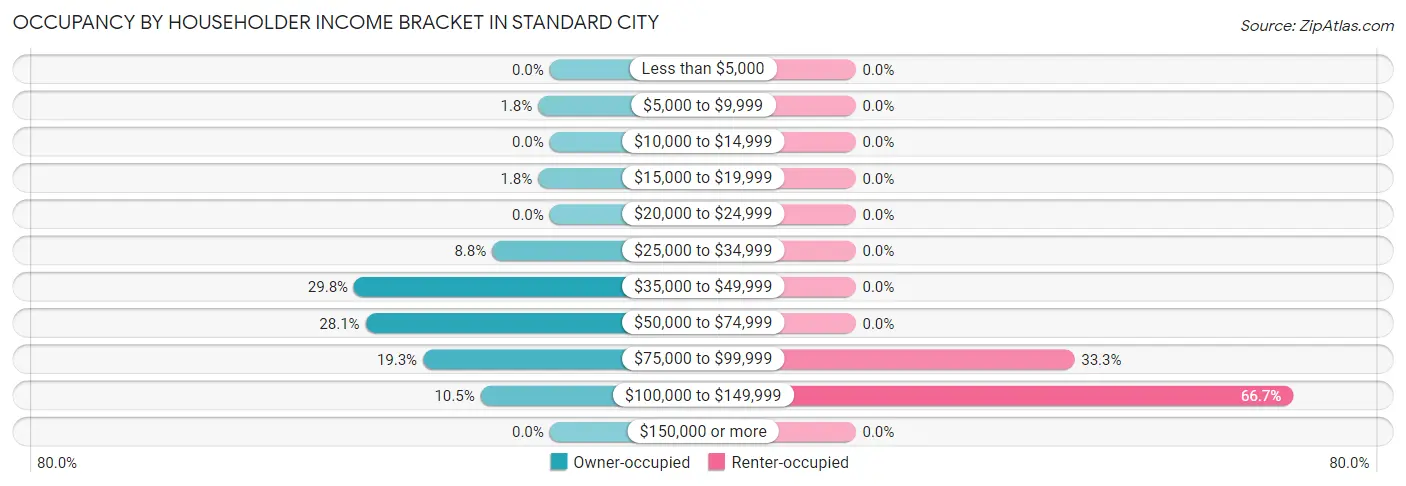
| Income Bracket | Owner-occupied | Renter-occupied |
| Less than $5,000 | 0 (0.0%) | 0 (0.0%) |
| $5,000 to $9,999 | 1 (1.8%) | 0 (0.0%) |
| $10,000 to $14,999 | 0 (0.0%) | 0 (0.0%) |
| $15,000 to $19,999 | 1 (1.8%) | 0 (0.0%) |
| $20,000 to $24,999 | 0 (0.0%) | 0 (0.0%) |
| $25,000 to $34,999 | 5 (8.8%) | 0 (0.0%) |
| $35,000 to $49,999 | 17 (29.8%) | 0 (0.0%) |
| $50,000 to $74,999 | 16 (28.1%) | 0 (0.0%) |
| $75,000 to $99,999 | 11 (19.3%) | 1 (33.3%) |
| $100,000 to $149,999 | 6 (10.5%) | 2 (66.7%) |
| $150,000 or more | 0 (0.0%) | 0 (0.0%) |
| Total | 57 (100.0%) | 3 (100.0%) |
Monthly Housing Cost Tiers in Standard City
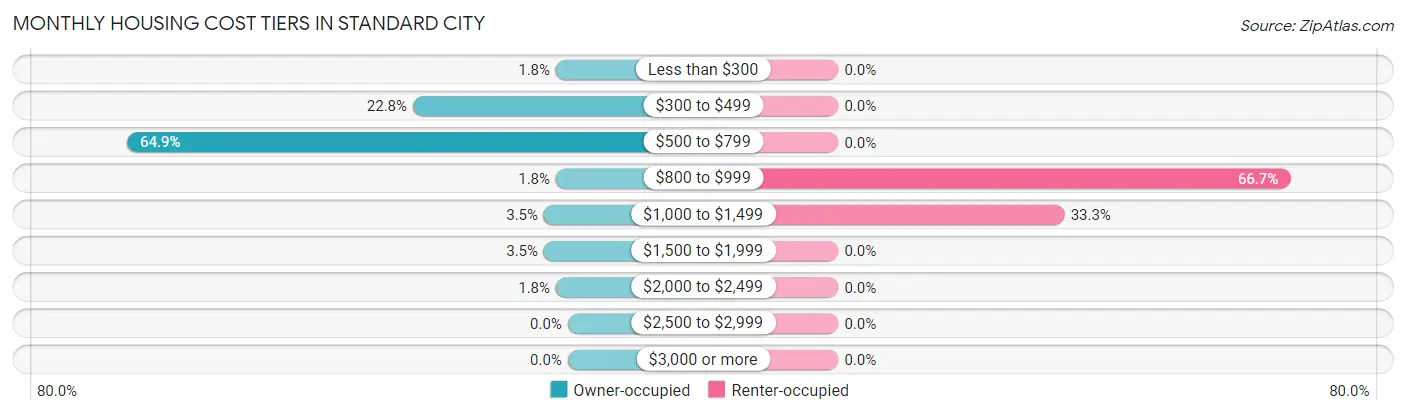
| Monthly Cost | Owner-occupied | Renter-occupied |
| Less than $300 | 1 (1.8%) | 0 (0.0%) |
| $300 to $499 | 13 (22.8%) | 0 (0.0%) |
| $500 to $799 | 37 (64.9%) | 0 (0.0%) |
| $800 to $999 | 1 (1.8%) | 2 (66.7%) |
| $1,000 to $1,499 | 2 (3.5%) | 1 (33.3%) |
| $1,500 to $1,999 | 2 (3.5%) | 0 (0.0%) |
| $2,000 to $2,499 | 1 (1.8%) | 0 (0.0%) |
| $2,500 to $2,999 | 0 (0.0%) | 0 (0.0%) |
| $3,000 or more | 0 (0.0%) | 0 (0.0%) |
| Total | 57 (100.0%) | 3 (100.0%) |
Physical Housing Characteristics in Standard City
Housing Structures in Standard City
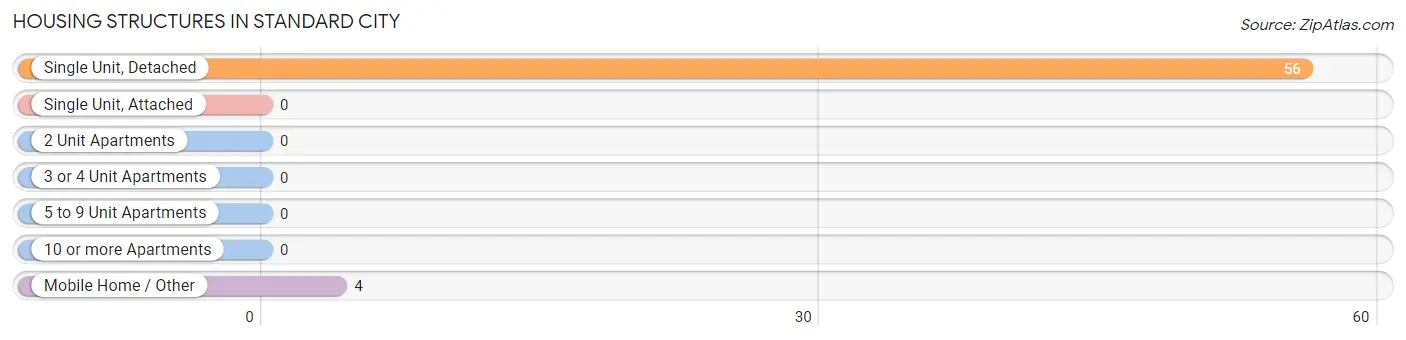
| Structure Type | # Housing Units | % Housing Units |
| Single Unit, Detached | 56 | 93.3% |
| Single Unit, Attached | 0 | 0.0% |
| 2 Unit Apartments | 0 | 0.0% |
| 3 or 4 Unit Apartments | 0 | 0.0% |
| 5 to 9 Unit Apartments | 0 | 0.0% |
| 10 or more Apartments | 0 | 0.0% |
| Mobile Home / Other | 4 | 6.7% |
| Total | 60 | 100.0% |
Housing Structures by Occupancy in Standard City
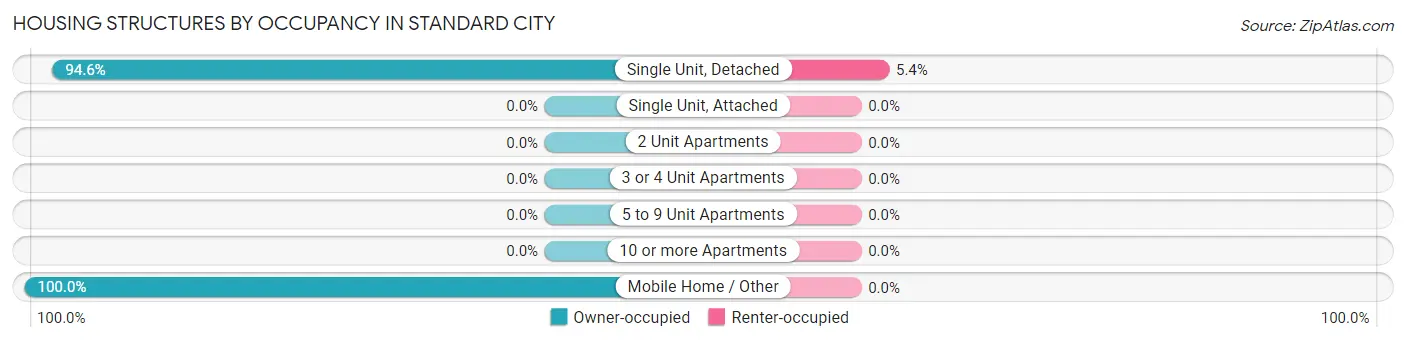
| Structure Type | Owner-occupied | Renter-occupied |
| Single Unit, Detached | 53 (94.6%) | 3 (5.4%) |
| Single Unit, Attached | 0 (0.0%) | 0 (0.0%) |
| 2 Unit Apartments | 0 (0.0%) | 0 (0.0%) |
| 3 or 4 Unit Apartments | 0 (0.0%) | 0 (0.0%) |
| 5 to 9 Unit Apartments | 0 (0.0%) | 0 (0.0%) |
| 10 or more Apartments | 0 (0.0%) | 0 (0.0%) |
| Mobile Home / Other | 4 (100.0%) | 0 (0.0%) |
| Total | 57 (95.0%) | 3 (5.0%) |
Housing Structures by Number of Rooms in Standard City
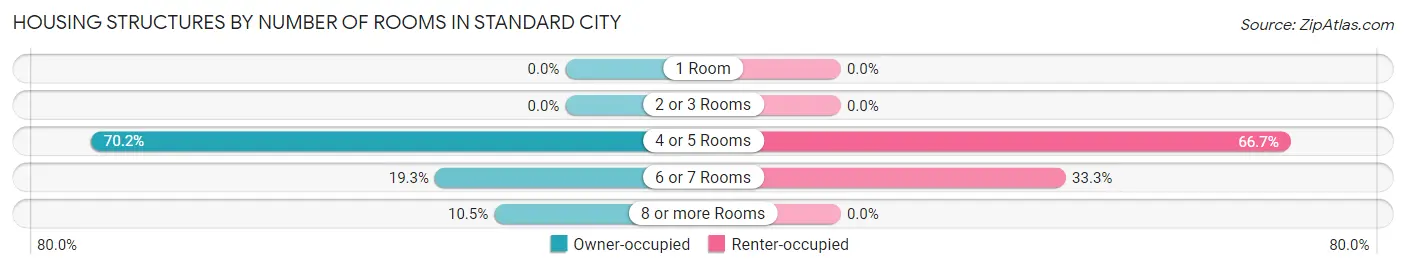
| Number of Rooms | Owner-occupied | Renter-occupied |
| 1 Room | 0 (0.0%) | 0 (0.0%) |
| 2 or 3 Rooms | 0 (0.0%) | 0 (0.0%) |
| 4 or 5 Rooms | 40 (70.2%) | 2 (66.7%) |
| 6 or 7 Rooms | 11 (19.3%) | 1 (33.3%) |
| 8 or more Rooms | 6 (10.5%) | 0 (0.0%) |
| Total | 57 (100.0%) | 3 (100.0%) |
Housing Structure by Heating Type in Standard City
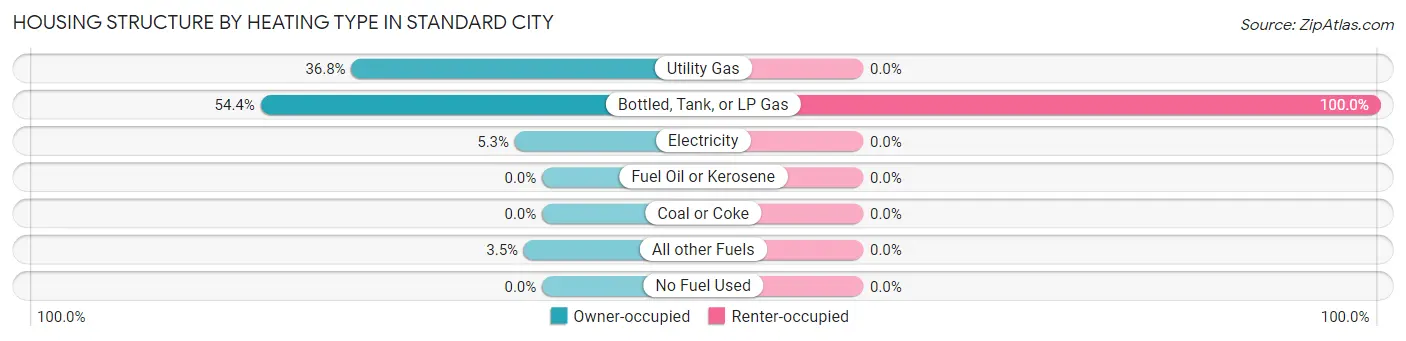
| Heating Type | Owner-occupied | Renter-occupied |
| Utility Gas | 21 (36.8%) | 0 (0.0%) |
| Bottled, Tank, or LP Gas | 31 (54.4%) | 3 (100.0%) |
| Electricity | 3 (5.3%) | 0 (0.0%) |
| Fuel Oil or Kerosene | 0 (0.0%) | 0 (0.0%) |
| Coal or Coke | 0 (0.0%) | 0 (0.0%) |
| All other Fuels | 2 (3.5%) | 0 (0.0%) |
| No Fuel Used | 0 (0.0%) | 0 (0.0%) |
| Total | 57 (100.0%) | 3 (100.0%) |
Household Vehicle Usage in Standard City
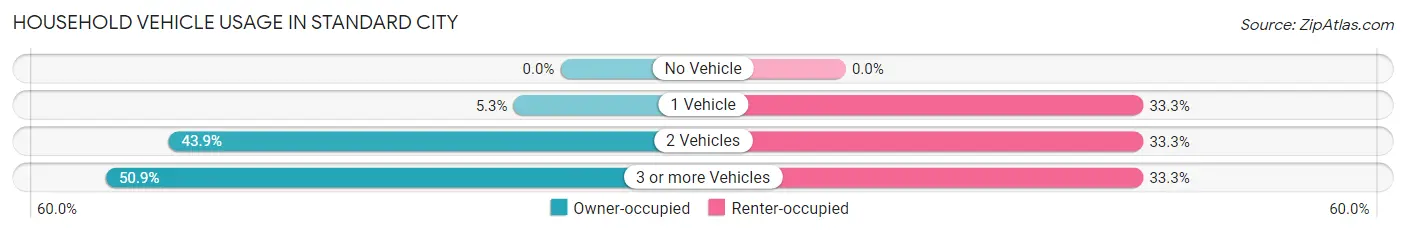
| Vehicles per Household | Owner-occupied | Renter-occupied |
| No Vehicle | 0 (0.0%) | 0 (0.0%) |
| 1 Vehicle | 3 (5.3%) | 1 (33.3%) |
| 2 Vehicles | 25 (43.9%) | 1 (33.3%) |
| 3 or more Vehicles | 29 (50.9%) | 1 (33.3%) |
| Total | 57 (100.0%) | 3 (100.0%) |
Real Estate & Mortgages in Standard City
Real Estate and Mortgage Overview in Standard City
| Characteristic | Without Mortgage | With Mortgage |
| Housing Units | 34 | 23 |
| Median Property Value | - | - |
| Median Household Income | $46,833 | $0 |
| Monthly Housing Costs | $516 | $0 |
| Real Estate Taxes | - | - |
Property Value by Mortgage Status in Standard City
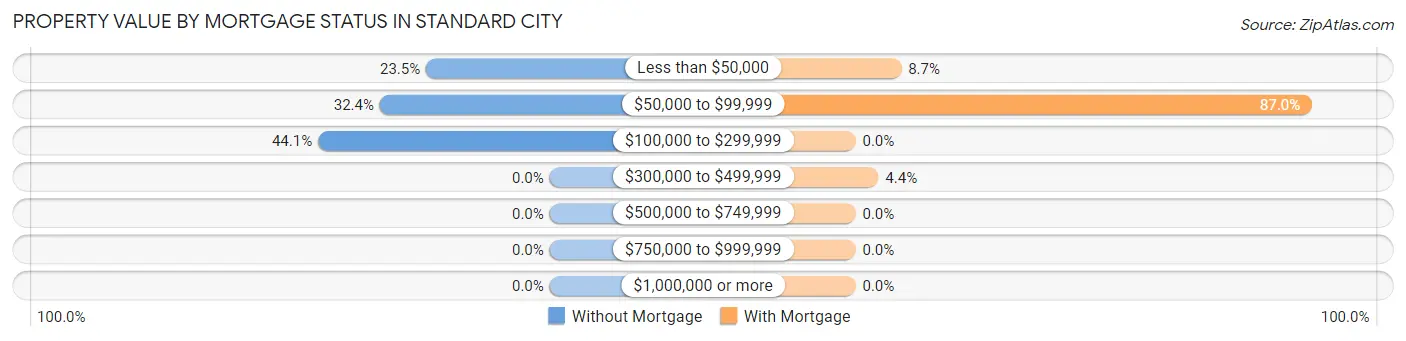
| Property Value | Without Mortgage | With Mortgage |
| Less than $50,000 | 8 (23.5%) | 2 (8.7%) |
| $50,000 to $99,999 | 11 (32.4%) | 20 (87.0%) |
| $100,000 to $299,999 | 15 (44.1%) | 0 (0.0%) |
| $300,000 to $499,999 | 0 (0.0%) | 1 (4.3%) |
| $500,000 to $749,999 | 0 (0.0%) | 0 (0.0%) |
| $750,000 to $999,999 | 0 (0.0%) | 0 (0.0%) |
| $1,000,000 or more | 0 (0.0%) | 0 (0.0%) |
| Total | 34 (100.0%) | 23 (100.0%) |
Household Income by Mortgage Status in Standard City
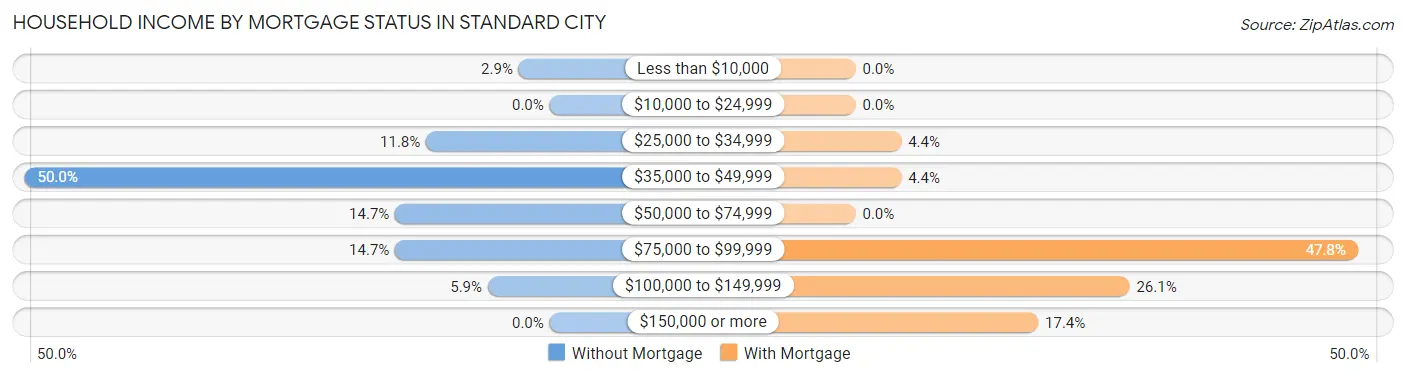
| Household Income | Without Mortgage | With Mortgage |
| Less than $10,000 | 1 (2.9%) | 0 (0.0%) |
| $10,000 to $24,999 | 0 (0.0%) | 0 (0.0%) |
| $25,000 to $34,999 | 4 (11.8%) | 1 (4.3%) |
| $35,000 to $49,999 | 17 (50.0%) | 1 (4.3%) |
| $50,000 to $74,999 | 5 (14.7%) | 0 (0.0%) |
| $75,000 to $99,999 | 5 (14.7%) | 11 (47.8%) |
| $100,000 to $149,999 | 2 (5.9%) | 6 (26.1%) |
| $150,000 or more | 0 (0.0%) | 4 (17.4%) |
| Total | 34 (100.0%) | 23 (100.0%) |
Property Value to Household Income Ratio in Standard City
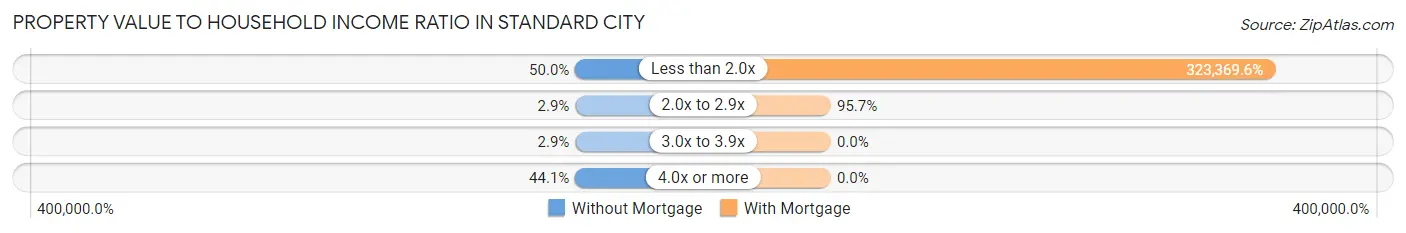
| Value-to-Income Ratio | Without Mortgage | With Mortgage |
| Less than 2.0x | 17 (50.0%) | 74,375 (323,369.6%) |
| 2.0x to 2.9x | 1 (2.9%) | 22 (95.7%) |
| 3.0x to 3.9x | 1 (2.9%) | 0 (0.0%) |
| 4.0x or more | 15 (44.1%) | 0 (0.0%) |
| Total | 34 (100.0%) | 23 (100.0%) |
Real Estate Taxes by Mortgage Status in Standard City
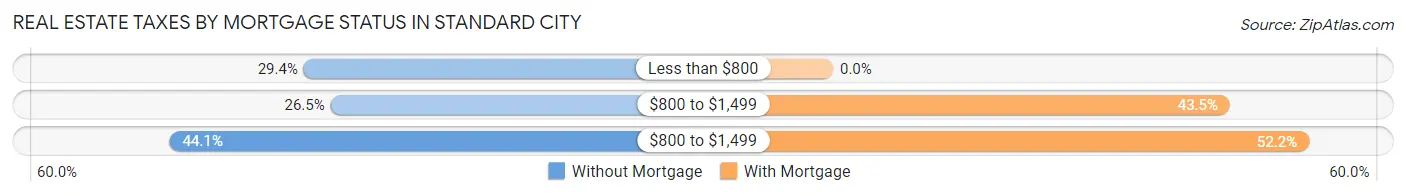
| Property Taxes | Without Mortgage | With Mortgage |
| Less than $800 | 10 (29.4%) | 0 (0.0%) |
| $800 to $1,499 | 9 (26.5%) | 10 (43.5%) |
| $800 to $1,499 | 15 (44.1%) | 12 (52.2%) |
| Total | 34 (100.0%) | 23 (100.0%) |
Health & Disability in Standard City
Health Insurance Coverage by Age in Standard City
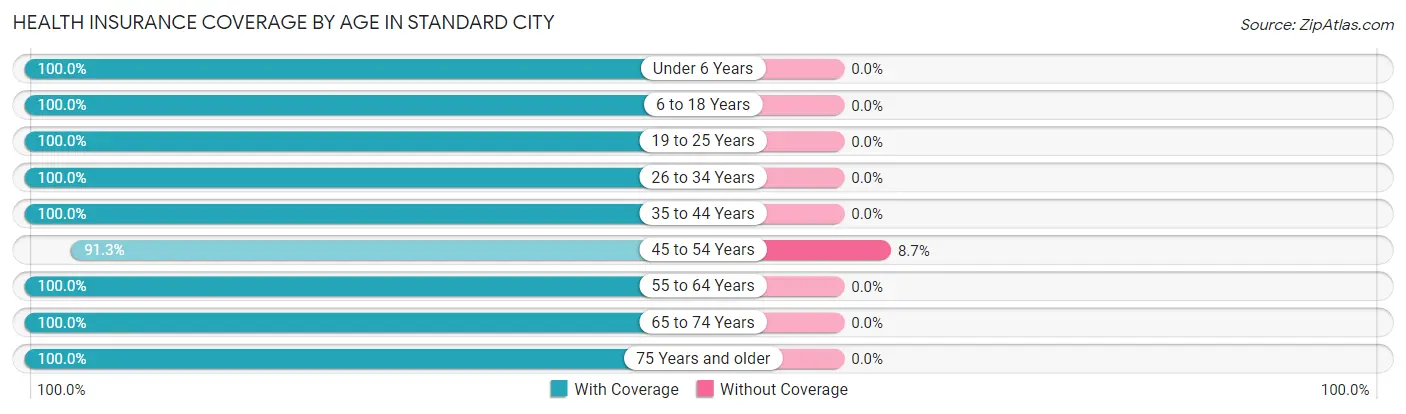
| Age Bracket | With Coverage | Without Coverage |
| Under 6 Years | 30 (100.0%) | 0 (0.0%) |
| 6 to 18 Years | 35 (100.0%) | 0 (0.0%) |
| 19 to 25 Years | 18 (100.0%) | 0 (0.0%) |
| 26 to 34 Years | 18 (100.0%) | 0 (0.0%) |
| 35 to 44 Years | 20 (100.0%) | 0 (0.0%) |
| 45 to 54 Years | 21 (91.3%) | 2 (8.7%) |
| 55 to 64 Years | 13 (100.0%) | 0 (0.0%) |
| 65 to 74 Years | 32 (100.0%) | 0 (0.0%) |
| 75 Years and older | 5 (100.0%) | 0 (0.0%) |
| Total | 192 (99.0%) | 2 (1.0%) |
Health Insurance Coverage by Citizenship Status in Standard City
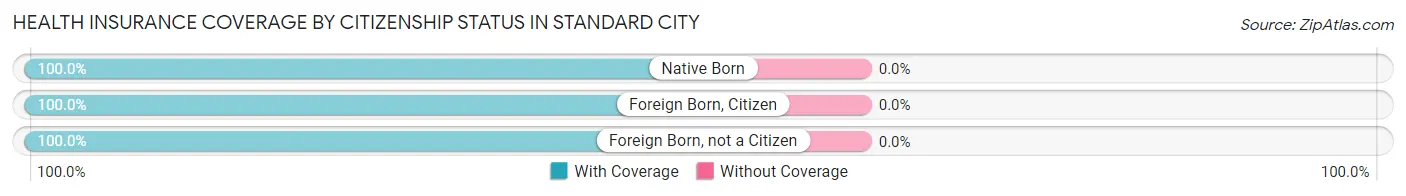
| Citizenship Status | With Coverage | Without Coverage |
| Native Born | 30 (100.0%) | 0 (0.0%) |
| Foreign Born, Citizen | 35 (100.0%) | 0 (0.0%) |
| Foreign Born, not a Citizen | 18 (100.0%) | 0 (0.0%) |
Health Insurance Coverage by Household Income in Standard City
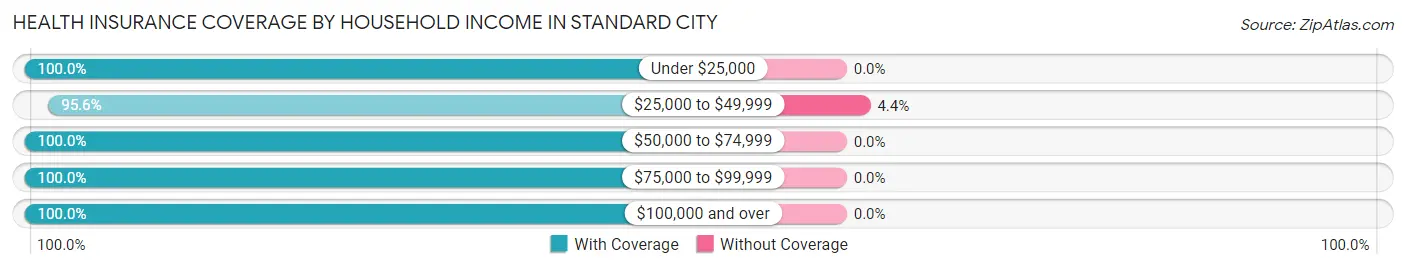
| Household Income | With Coverage | Without Coverage |
| Under $25,000 | 3 (100.0%) | 0 (0.0%) |
| $25,000 to $49,999 | 43 (95.6%) | 2 (4.4%) |
| $50,000 to $74,999 | 62 (100.0%) | 0 (0.0%) |
| $75,000 to $99,999 | 51 (100.0%) | 0 (0.0%) |
| $100,000 and over | 33 (100.0%) | 0 (0.0%) |
Public vs Private Health Insurance Coverage by Age in Standard City
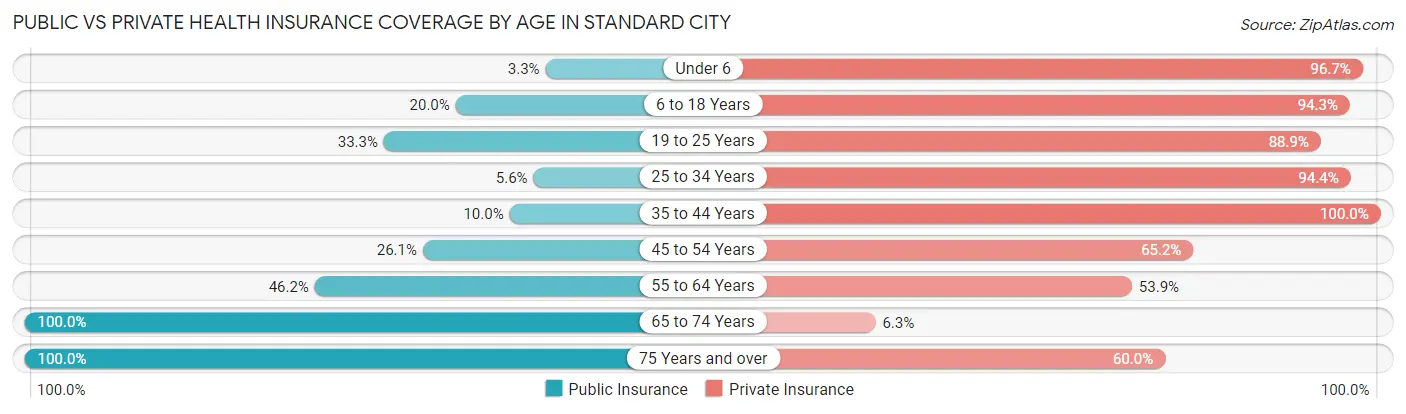
| Age Bracket | Public Insurance | Private Insurance |
| Under 6 | 1 (3.3%) | 29 (96.7%) |
| 6 to 18 Years | 7 (20.0%) | 33 (94.3%) |
| 19 to 25 Years | 6 (33.3%) | 16 (88.9%) |
| 25 to 34 Years | 1 (5.6%) | 17 (94.4%) |
| 35 to 44 Years | 2 (10.0%) | 20 (100.0%) |
| 45 to 54 Years | 6 (26.1%) | 15 (65.2%) |
| 55 to 64 Years | 6 (46.2%) | 7 (53.8%) |
| 65 to 74 Years | 32 (100.0%) | 2 (6.2%) |
| 75 Years and over | 5 (100.0%) | 3 (60.0%) |
| Total | 66 (34.0%) | 142 (73.2%) |
Disability Status by Sex by Age in Standard City
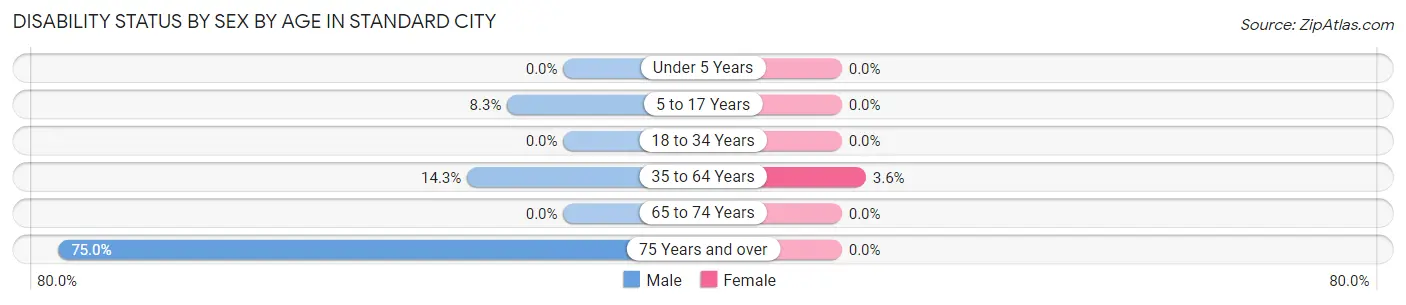
| Age Bracket | Male | Female |
| Under 5 Years | 0 (0.0%) | 0 (0.0%) |
| 5 to 17 Years | 1 (8.3%) | 0 (0.0%) |
| 18 to 34 Years | 0 (0.0%) | 0 (0.0%) |
| 35 to 64 Years | 4 (14.3%) | 1 (3.6%) |
| 65 to 74 Years | 0 (0.0%) | 0 (0.0%) |
| 75 Years and over | 3 (75.0%) | 0 (0.0%) |
Disability Class by Sex by Age in Standard City
Disability Class: Hearing Difficulty
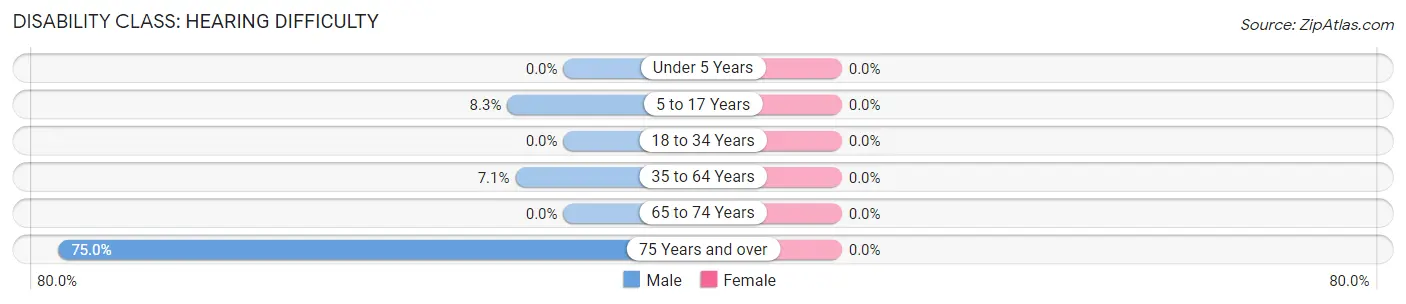
| Age Bracket | Male | Female |
| Under 5 Years | 0 (0.0%) | 0 (0.0%) |
| 5 to 17 Years | 1 (8.3%) | 0 (0.0%) |
| 18 to 34 Years | 0 (0.0%) | 0 (0.0%) |
| 35 to 64 Years | 2 (7.1%) | 0 (0.0%) |
| 65 to 74 Years | 0 (0.0%) | 0 (0.0%) |
| 75 Years and over | 3 (75.0%) | 0 (0.0%) |
Disability Class: Vision Difficulty
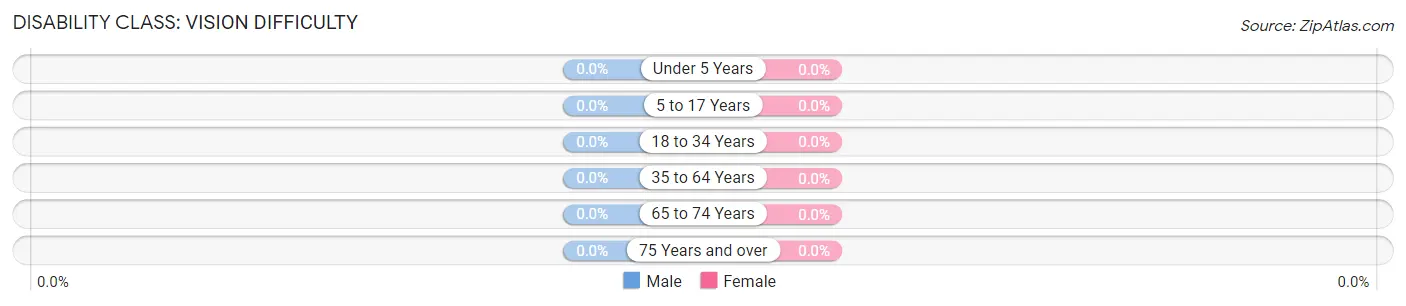
| Age Bracket | Male | Female |
| Under 5 Years | 0 (0.0%) | 0 (0.0%) |
| 5 to 17 Years | 0 (0.0%) | 0 (0.0%) |
| 18 to 34 Years | 0 (0.0%) | 0 (0.0%) |
| 35 to 64 Years | 0 (0.0%) | 0 (0.0%) |
| 65 to 74 Years | 0 (0.0%) | 0 (0.0%) |
| 75 Years and over | 0 (0.0%) | 0 (0.0%) |
Disability Class: Cognitive Difficulty
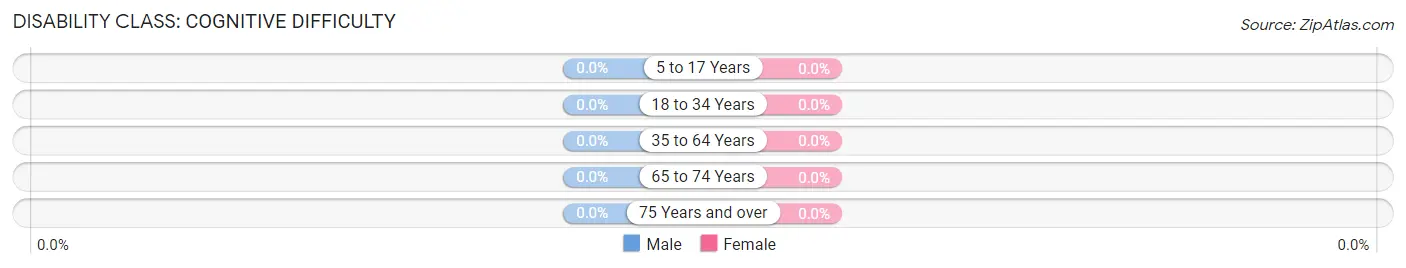
| Age Bracket | Male | Female |
| 5 to 17 Years | 0 (0.0%) | 0 (0.0%) |
| 18 to 34 Years | 0 (0.0%) | 0 (0.0%) |
| 35 to 64 Years | 0 (0.0%) | 0 (0.0%) |
| 65 to 74 Years | 0 (0.0%) | 0 (0.0%) |
| 75 Years and over | 0 (0.0%) | 0 (0.0%) |
Disability Class: Ambulatory Difficulty
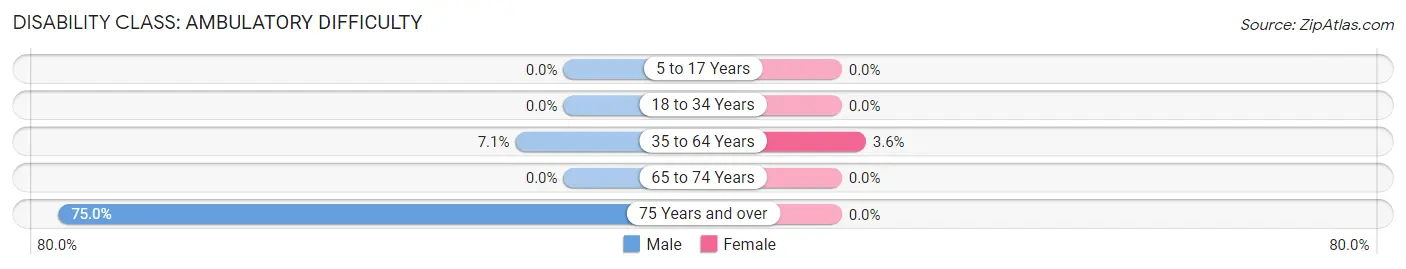
| Age Bracket | Male | Female |
| 5 to 17 Years | 0 (0.0%) | 0 (0.0%) |
| 18 to 34 Years | 0 (0.0%) | 0 (0.0%) |
| 35 to 64 Years | 2 (7.1%) | 1 (3.6%) |
| 65 to 74 Years | 0 (0.0%) | 0 (0.0%) |
| 75 Years and over | 3 (75.0%) | 0 (0.0%) |
Disability Class: Self-Care Difficulty
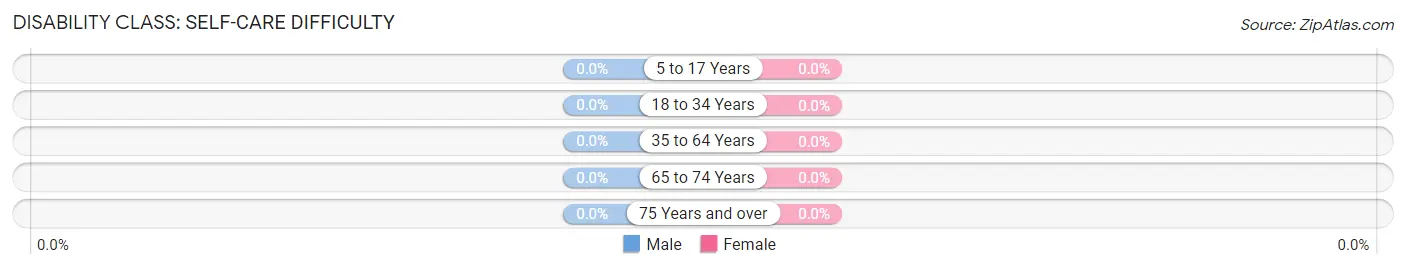
| Age Bracket | Male | Female |
| 5 to 17 Years | 0 (0.0%) | 0 (0.0%) |
| 18 to 34 Years | 0 (0.0%) | 0 (0.0%) |
| 35 to 64 Years | 0 (0.0%) | 0 (0.0%) |
| 65 to 74 Years | 0 (0.0%) | 0 (0.0%) |
| 75 Years and over | 0 (0.0%) | 0 (0.0%) |
Technology Access in Standard City
Computing Device Access in Standard City
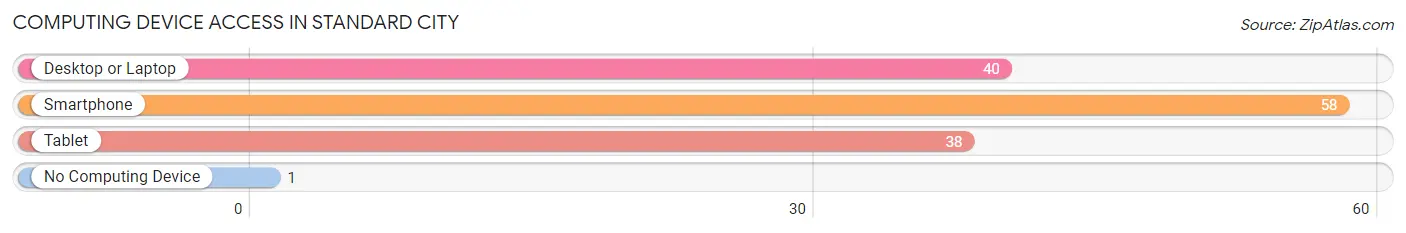
| Device Type | # Households | % Households |
| Desktop or Laptop | 40 | 66.7% |
| Smartphone | 58 | 96.7% |
| Tablet | 38 | 63.3% |
| No Computing Device | 1 | 1.7% |
| Total | 60 | 100.0% |
Internet Access in Standard City
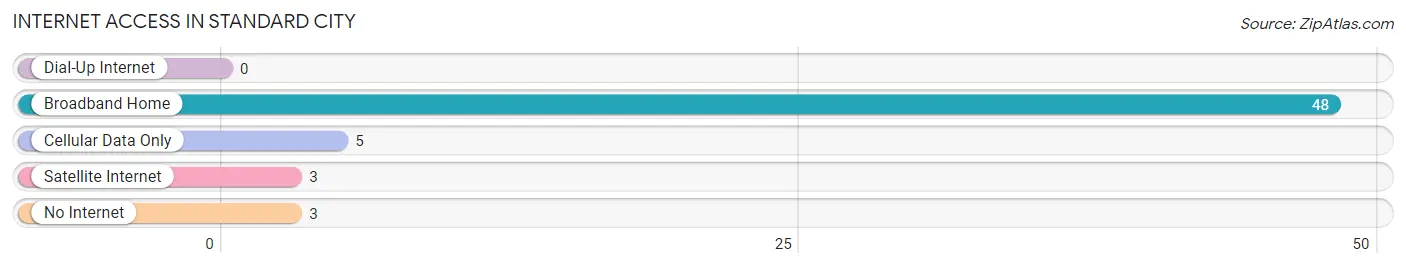
| Internet Type | # Households | % Households |
| Dial-Up Internet | 0 | 0.0% |
| Broadband Home | 48 | 80.0% |
| Cellular Data Only | 5 | 8.3% |
| Satellite Internet | 3 | 5.0% |
| No Internet | 3 | 5.0% |
| Total | 60 | 100.0% |
Standard City Summary
City of Standard Illinois
History
The City of Standard, Illinois is located in the northern part of the state, in the county of McHenry. It is a small city, with a population of just over 1,000 people. The city was founded in 1836 by a group of settlers from New York. The settlers were looking for a place to settle and start a new life, and they chose the area that is now Standard.
The city was originally called Standardville, and it was named after the Standard Oil Company, which had a refinery in the area. The city was incorporated in 1854, and it has remained a small, rural community ever since.
The city has a rich history, and it has been home to many different industries over the years. In the late 1800s, the city was home to a large number of sawmills, which provided lumber for the area. In the early 1900s, the city was home to a large number of brickyards, which provided bricks for the area.
The city also had a large number of farms, which provided food for the area. The city was also home to a large number of factories, which provided jobs for the area.
Geography
The City of Standard is located in the northern part of the state, in the county of McHenry. It is a small city, with a population of just over 1,000 people. The city is located on the banks of the Fox River, and it is surrounded by rolling hills and farmland.
The city is located about 40 miles northwest of Chicago, and it is about 20 miles east of Rockford. The city is located in a rural area, and it is surrounded by small towns and villages.
Economy
The economy of the City of Standard is largely based on agriculture and manufacturing. The city is home to a number of small businesses, including a few restaurants, a grocery store, and a few other small shops. The city also has a few small factories, which provide jobs for the area.
The city is also home to a number of farms, which provide food for the area. The city is also home to a few small manufacturing companies, which provide jobs for the area.
Demographics
The population of the City of Standard is just over 1,000 people. The city is predominantly white, with about 95% of the population being white. The city also has a small Hispanic population, with about 4% of the population being Hispanic. The city also has a small African American population, with about 1% of the population being African American.
The median household income in the city is about $50,000, and the median home value is about $150,000. The city has a low unemployment rate, and the poverty rate is about 8%.
Conclusion
The City of Standard, Illinois is a small city, with a population of just over 1,000 people. The city has a rich history, and it has been home to many different industries over the years. The city is predominantly white, with about 95% of the population being white. The city also has a small Hispanic population, with about 4% of the population being Hispanic. The city also has a small African American population, with about 1% of the population being African American. The economy of the city is largely based on agriculture and manufacturing, and the city has a low unemployment rate and a median household income of about $50,000.
Common Questions
What is Per Capita Income in Standard City?
Per Capita income in Standard City is $20,501.
What is the Median Family Income in Standard City?
Median Family Income in Standard City is $52,000.
What is the Median Household income in Standard City?
Median Household Income in Standard City is $60,833.
What is Income or Wage Gap in Standard City?
Income or Wage Gap in Standard City is 40.3%.
Women in Standard City earn 59.7 cents for every dollar earned by a man.
What is Inequality or Gini Index in Standard City?
Inequality or Gini Index in Standard City is 0.24.
What is the Total Population of Standard City?
Total Population of Standard City is 194.
What is the Total Male Population of Standard City?
Total Male Population of Standard City is 112.
What is the Total Female Population of Standard City?
Total Female Population of Standard City is 82.
What is the Ratio of Males per 100 Females in Standard City?
There are 136.59 Males per 100 Females in Standard City.
What is the Ratio of Females per 100 Males in Standard City?
There are 73.21 Females per 100 Males in Standard City.
What is the Median Population Age in Standard City?
Median Population Age in Standard City is 32.5 Years.
What is the Average Family Size in Standard City
Average Family Size in Standard City is 3.3 People.
What is the Average Household Size in Standard City
Average Household Size in Standard City is 3.2 People.
How Large is the Labor Force in Standard City?
There are 71 People in the Labor Forcein in Standard City.
What is the Percentage of People in the Labor Force in Standard City?
49.3% of People are in the Labor Force in Standard City.
What is the Unemployment Rate in Standard City?
Unemployment Rate in Standard City is 5.6%.