Jeisyville, IL Map & Demographics
Jeisyville Map
Jeisyville Overview
$44,647
PER CAPITA INCOME
$77,375
AVG HOUSEHOLD INCOME
29.3%
WAGE / INCOME GAP [ % ]
70.7¢/ $1
WAGE / INCOME GAP [ $ ]
0.28
INEQUALITY / GINI INDEX
92
TOTAL POPULATION
50
MALE POPULATION
42
FEMALE POPULATION
119.05
MALES / 100 FEMALES
84.00
FEMALES / 100 MALES
33.5
MEDIAN AGE
3.6
AVG FAMILY SIZE
2.2
AVG HOUSEHOLD SIZE
52
LABOR FORCE [ PEOPLE ]
76.5%
PERCENT IN LABOR FORCE
Income in Jeisyville
Income Overview in Jeisyville
| Characteristic | Number | Measure |
| Per Capita Income | 92 | $44,647 |
| Median Family Income | 18 | $0 |
| Mean Family Income | 18 | $119,983 |
| Median Household Income | 41 | $77,375 |
| Mean Household Income | 41 | $102,876 |
| Income Deficit | 18 | $0 |
| Wage / Income Gap (%) | 92 | 29.34% |
| Wage / Income Gap ($) | 92 | 70.66¢ per $1 |
| Gini / Inequality Index | 92 | 0.28 |
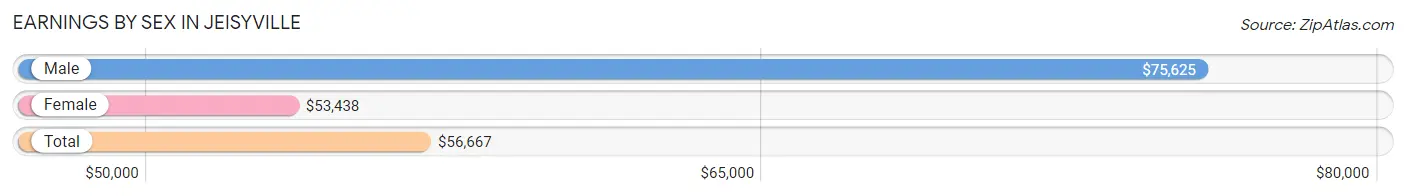
Earnings by Sex in Jeisyville
Average Earnings in Jeisyville are $56,667, $75,625 for men and $53,438 for women, a difference of 29.3%.
| Sex | Number | Average Earnings |
| Male | 33 (63.5%) | $75,625 |
| Female | 19 (36.5%) | $53,438 |
| Total | 52 (100.0%) | $56,667 |
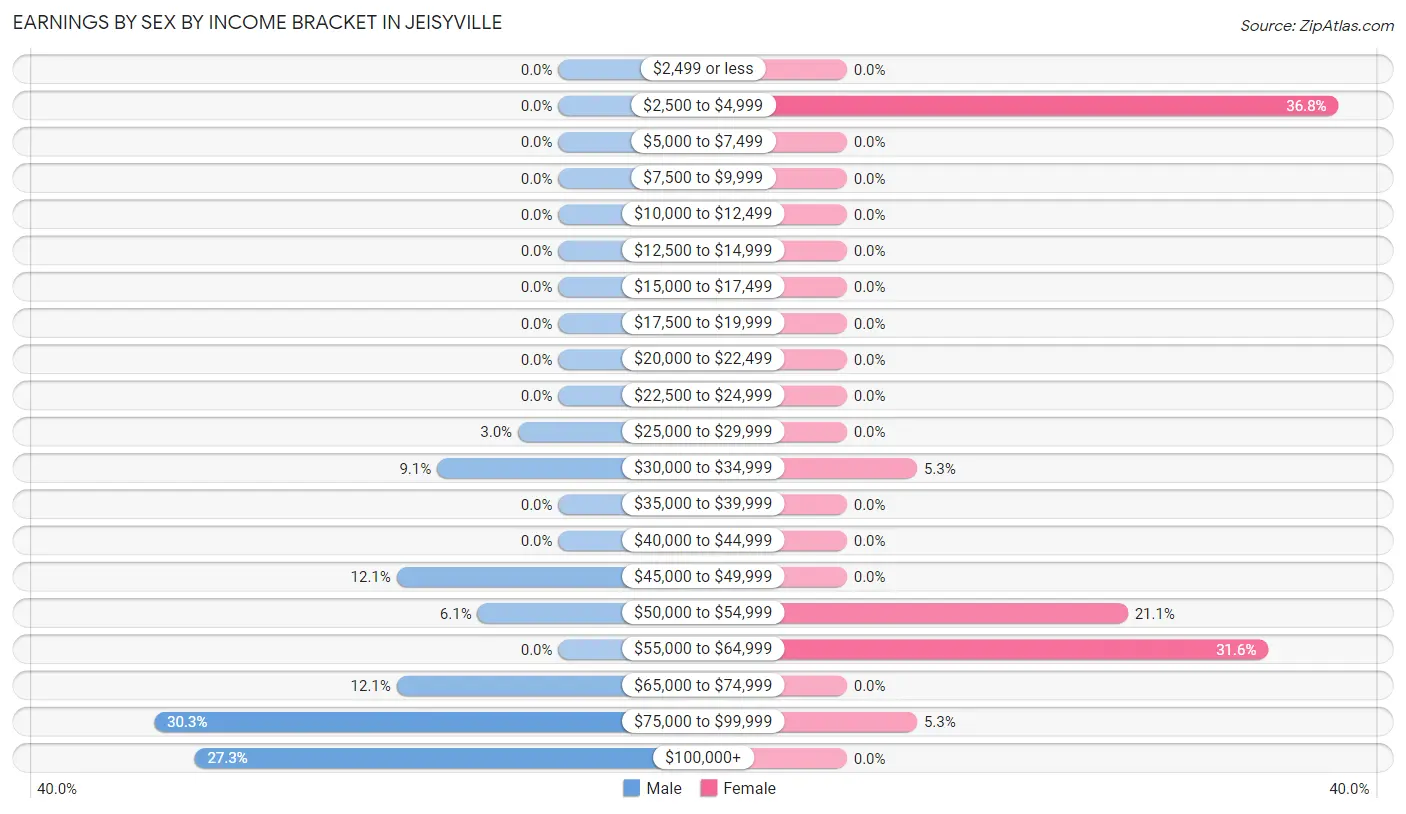
Earnings by Sex by Income Bracket in Jeisyville
The most common earnings brackets in Jeisyville are $75,000 to $99,999 for men (10 | 30.3%) and $2,500 to $4,999 for women (7 | 36.8%).
| Income | Male | Female |
| $2,499 or less | 0 (0.0%) | 0 (0.0%) |
| $2,500 to $4,999 | 0 (0.0%) | 7 (36.8%) |
| $5,000 to $7,499 | 0 (0.0%) | 0 (0.0%) |
| $7,500 to $9,999 | 0 (0.0%) | 0 (0.0%) |
| $10,000 to $12,499 | 0 (0.0%) | 0 (0.0%) |
| $12,500 to $14,999 | 0 (0.0%) | 0 (0.0%) |
| $15,000 to $17,499 | 0 (0.0%) | 0 (0.0%) |
| $17,500 to $19,999 | 0 (0.0%) | 0 (0.0%) |
| $20,000 to $22,499 | 0 (0.0%) | 0 (0.0%) |
| $22,500 to $24,999 | 0 (0.0%) | 0 (0.0%) |
| $25,000 to $29,999 | 1 (3.0%) | 0 (0.0%) |
| $30,000 to $34,999 | 3 (9.1%) | 1 (5.3%) |
| $35,000 to $39,999 | 0 (0.0%) | 0 (0.0%) |
| $40,000 to $44,999 | 0 (0.0%) | 0 (0.0%) |
| $45,000 to $49,999 | 4 (12.1%) | 0 (0.0%) |
| $50,000 to $54,999 | 2 (6.1%) | 4 (21.0%) |
| $55,000 to $64,999 | 0 (0.0%) | 6 (31.6%) |
| $65,000 to $74,999 | 4 (12.1%) | 0 (0.0%) |
| $75,000 to $99,999 | 10 (30.3%) | 1 (5.3%) |
| $100,000+ | 9 (27.3%) | 0 (0.0%) |
| Total | 33 (100.0%) | 19 (100.0%) |
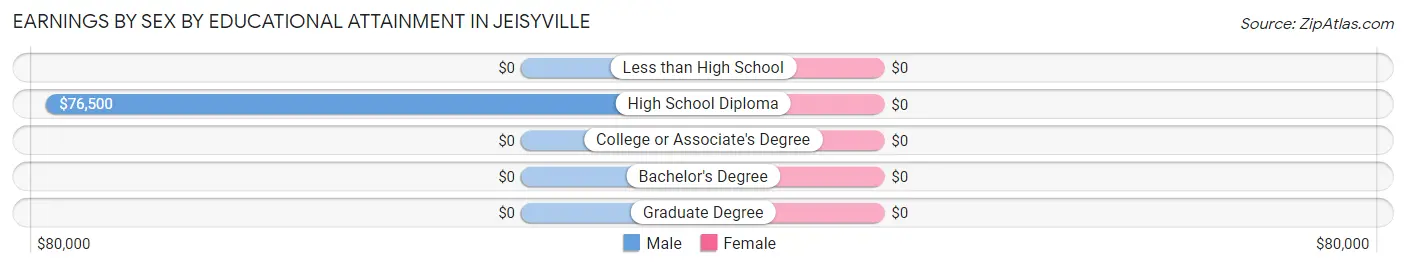
Earnings by Sex by Educational Attainment in Jeisyville
| Educational Attainment | Male Income | Female Income |
| Less than High School | - | - |
| High School Diploma | $76,500 | $0 |
| College or Associate's Degree | - | - |
| Bachelor's Degree | - | - |
| Graduate Degree | - | - |
| Total | $75,625 | $55,417 |
Family Income in Jeisyville
Family Income Brackets in Jeisyville
According to the Jeisyville family income data, there are 9 families falling into the $150,000 to $199,999 income range, which is the most common income bracket and makes up 50.0% of all families.
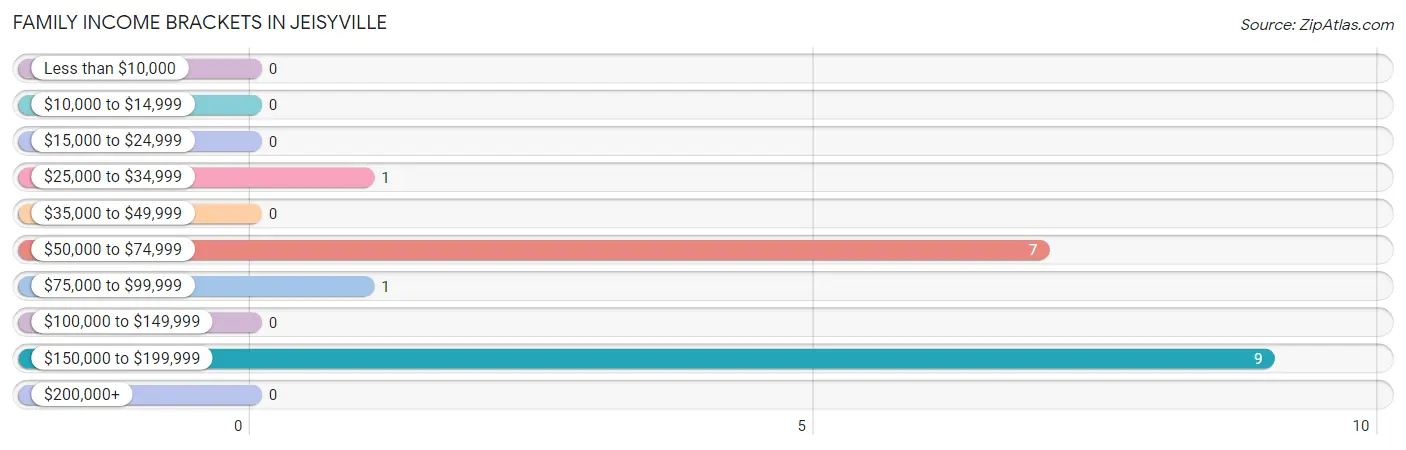
| Income Bracket | # Families | % Families |
| Less than $10,000 | 0 | 0.0% |
| $10,000 to $14,999 | 0 | 0.0% |
| $15,000 to $24,999 | 0 | 0.0% |
| $25,000 to $34,999 | 1 | 5.6% |
| $35,000 to $49,999 | 0 | 0.0% |
| $50,000 to $74,999 | 7 | 38.9% |
| $75,000 to $99,999 | 1 | 5.6% |
| $100,000 to $149,999 | 0 | 0.0% |
| $150,000 to $199,999 | 9 | 50.0% |
| $200,000+ | 0 | 0.0% |
Family Income by Famaliy Size in Jeisyville
2-person families (8 | 44.4%) account for the highest median family income in Jeisyville with $56,250 per family, while 2-person families (8 | 44.4%) have the highest median income of $28,125 per family member.
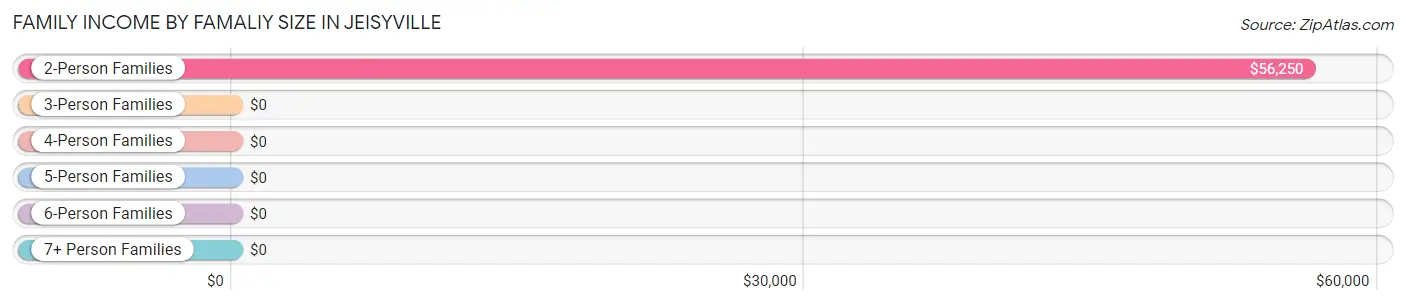
| Income Bracket | # Families | Median Income |
| 2-Person Families | 8 (44.4%) | $56,250 |
| 3-Person Families | 1 (5.6%) | $0 |
| 4-Person Families | 0 (0.0%) | $0 |
| 5-Person Families | 7 (38.9%) | $0 |
| 6-Person Families | 0 (0.0%) | $0 |
| 7+ Person Families | 2 (11.1%) | $0 |
| Total | 18 (100.0%) | $0 |
Family Income by Number of Earners in Jeisyville
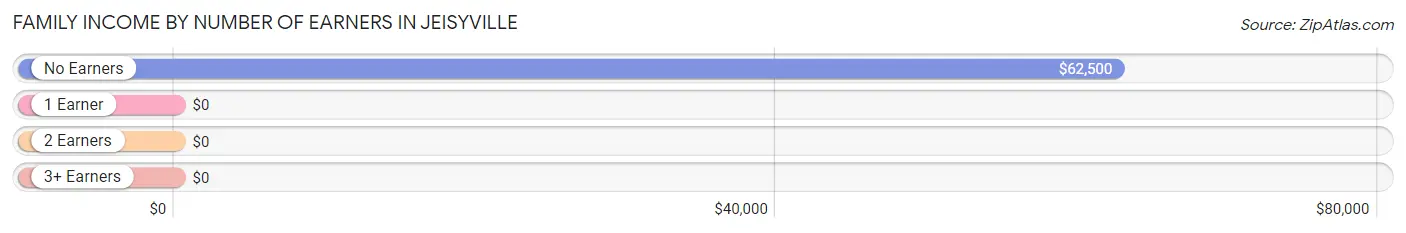
| Number of Earners | # Families | Median Income |
| No Earners | 4 (22.2%) | $62,500 |
| 1 Earner | 6 (33.3%) | $0 |
| 2 Earners | 1 (5.6%) | $0 |
| 3+ Earners | 7 (38.9%) | $0 |
| Total | 18 (100.0%) | $0 |
Household Income in Jeisyville
Household Income Brackets in Jeisyville
With 15 households falling in the category, the $75,000 to $99,999 income range is the most frequent in Jeisyville, accounting for 36.6% of all households.
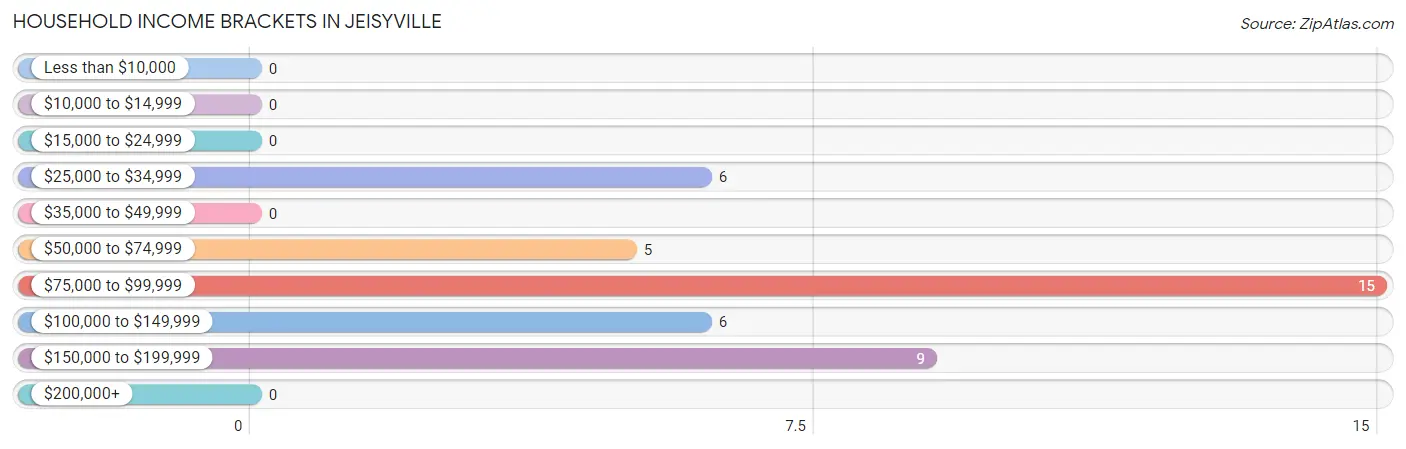
| Income Bracket | # Households | % Households |
| Less than $10,000 | 0 | 0.0% |
| $10,000 to $14,999 | 0 | 0.0% |
| $15,000 to $24,999 | 0 | 0.0% |
| $25,000 to $34,999 | 6 | 14.6% |
| $35,000 to $49,999 | 0 | 0.0% |
| $50,000 to $74,999 | 5 | 12.2% |
| $75,000 to $99,999 | 15 | 36.6% |
| $100,000 to $149,999 | 6 | 14.6% |
| $150,000 to $199,999 | 9 | 22.0% |
| $200,000+ | 0 | 0.0% |
Household Income by Householder Age in Jeisyville
The median household income in Jeisyville is $77,375, with the highest median household income of $180,357 found in the 45 to 64 years age bracket for the primary householder. A total of 12 households (29.3%) fall into this category.
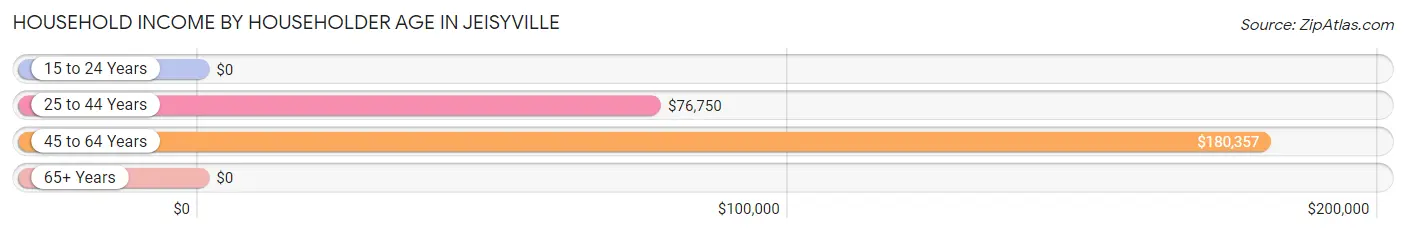
| Income Bracket | # Households | Median Income |
| 15 to 24 Years | 0 (0.0%) | $0 |
| 25 to 44 Years | 14 (34.2%) | $76,750 |
| 45 to 64 Years | 12 (29.3%) | $180,357 |
| 65+ Years | 15 (36.6%) | $0 |
| Total | 41 (100.0%) | $77,375 |
Poverty in Jeisyville
Income Below Poverty by Sex and Age in Jeisyville
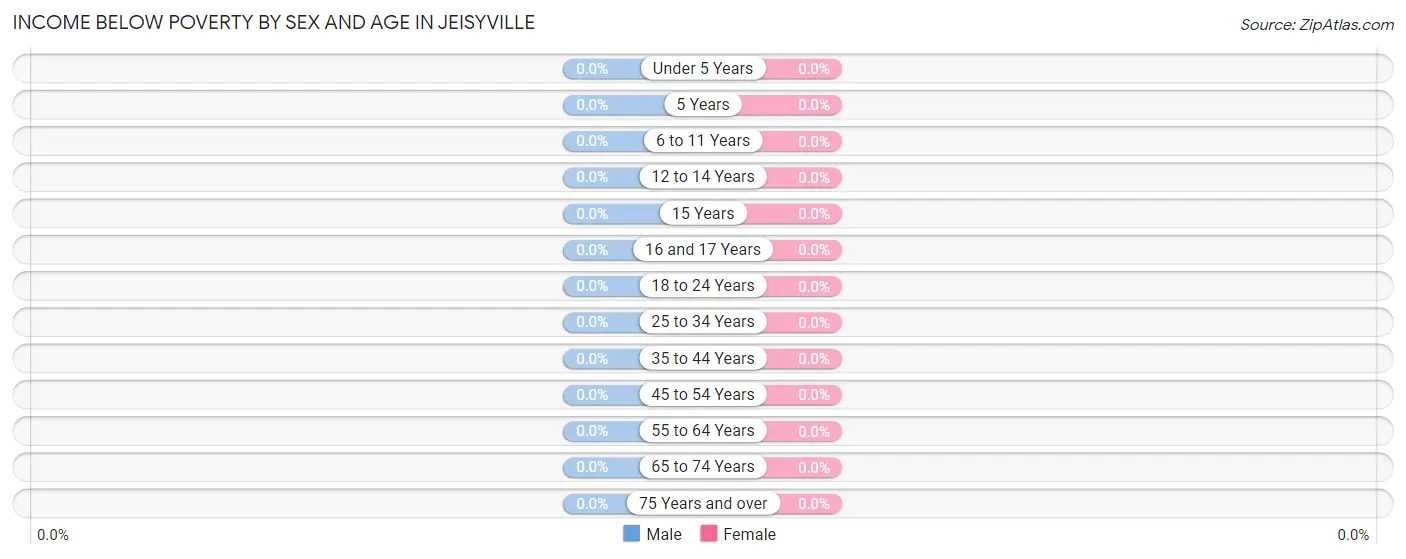
| Age Bracket | Male | Female |
| Under 5 Years | 0 (0.0%) | 0 (0.0%) |
| 5 Years | 0 (0.0%) | 0 (0.0%) |
| 6 to 11 Years | 0 (0.0%) | 0 (0.0%) |
| 12 to 14 Years | 0 (0.0%) | 0 (0.0%) |
| 15 Years | 0 (0.0%) | 0 (0.0%) |
| 16 and 17 Years | 0 (0.0%) | 0 (0.0%) |
| 18 to 24 Years | 0 (0.0%) | 0 (0.0%) |
| 25 to 34 Years | 0 (0.0%) | 0 (0.0%) |
| 35 to 44 Years | 0 (0.0%) | 0 (0.0%) |
| 45 to 54 Years | 0 (0.0%) | 0 (0.0%) |
| 55 to 64 Years | 0 (0.0%) | 0 (0.0%) |
| 65 to 74 Years | 0 (0.0%) | 0 (0.0%) |
| 75 Years and over | 0 (0.0%) | 0 (0.0%) |
| Total | 0 (0.0%) | 0 (0.0%) |
Income Above Poverty by Sex and Age in Jeisyville
According to the poverty statistics in Jeisyville, males aged 6 to 11 years and females aged under 5 years are the age groups that are most secure financially, with 100.0% of males and 100.0% of females in these age groups living above the poverty line.
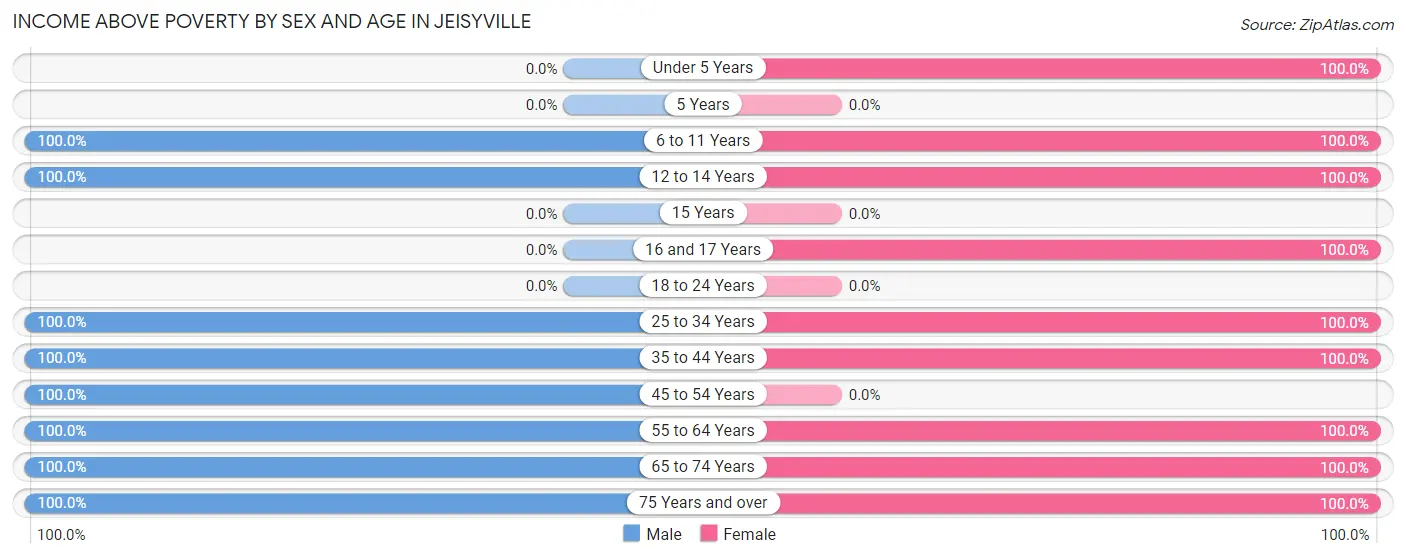
| Age Bracket | Male | Female |
| Under 5 Years | 0 (0.0%) | 2 (100.0%) |
| 5 Years | 0 (0.0%) | 0 (0.0%) |
| 6 to 11 Years | 3 (100.0%) | 10 (100.0%) |
| 12 to 14 Years | 4 (100.0%) | 5 (100.0%) |
| 15 Years | 0 (0.0%) | 0 (0.0%) |
| 16 and 17 Years | 0 (0.0%) | 7 (100.0%) |
| 18 to 24 Years | 0 (0.0%) | 0 (0.0%) |
| 25 to 34 Years | 15 (100.0%) | 2 (100.0%) |
| 35 to 44 Years | 2 (100.0%) | 6 (100.0%) |
| 45 to 54 Years | 11 (100.0%) | 0 (0.0%) |
| 55 to 64 Years | 1 (100.0%) | 5 (100.0%) |
| 65 to 74 Years | 9 (100.0%) | 4 (100.0%) |
| 75 Years and over | 5 (100.0%) | 1 (100.0%) |
| Total | 50 (100.0%) | 42 (100.0%) |
Income Below Poverty Among Married-Couple Families in Jeisyville
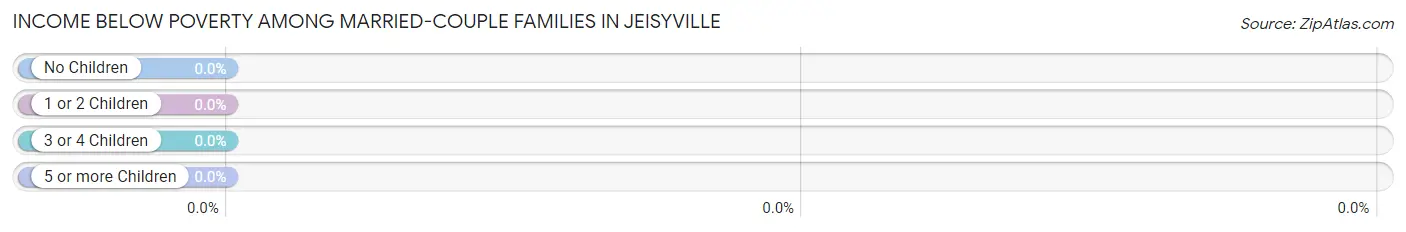
| Children | Above Poverty | Below Poverty |
| No Children | 4 (100.0%) | 0 (0.0%) |
| 1 or 2 Children | 1 (100.0%) | 0 (0.0%) |
| 3 or 4 Children | 7 (100.0%) | 0 (0.0%) |
| 5 or more Children | 2 (100.0%) | 0 (0.0%) |
| Total | 14 (100.0%) | 0 (0.0%) |
Income Below Poverty Among Single-Parent Households in Jeisyville
| Children | Single Father | Single Mother |
| No Children | 0 (0.0%) | 0 (0.0%) |
| 1 or 2 Children | 0 (0.0%) | 0 (0.0%) |
| 3 or 4 Children | 0 (0.0%) | 0 (0.0%) |
| 5 or more Children | 0 (0.0%) | 0 (0.0%) |
| Total | 0 (0.0%) | 0 (0.0%) |
Income Below Poverty Among Married-Couple vs Single-Parent Households in Jeisyville
| Children | Married-Couple Families | Single-Parent Households |
| No Children | 0 (0.0%) | 0 (0.0%) |
| 1 or 2 Children | 0 (0.0%) | 0 (0.0%) |
| 3 or 4 Children | 0 (0.0%) | 0 (0.0%) |
| 5 or more Children | 0 (0.0%) | 0 (0.0%) |
| Total | 0 (0.0%) | 0 (0.0%) |
Race in Jeisyville
The most populous races in Jeisyville are White / Caucasian (89 | 96.7%), Two or more Races (2 | 2.2%), and Asian (1 | 1.1%).
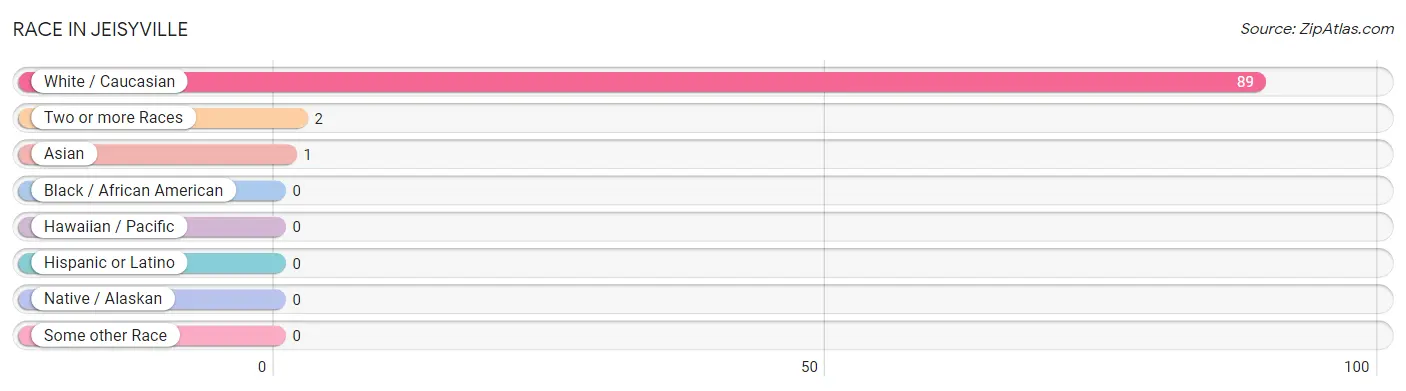
| Race | # Population | % Population |
| Asian | 1 | 1.1% |
| Black / African American | 0 | 0.0% |
| Hawaiian / Pacific | 0 | 0.0% |
| Hispanic or Latino | 0 | 0.0% |
| Native / Alaskan | 0 | 0.0% |
| White / Caucasian | 89 | 96.7% |
| Two or more Races | 2 | 2.2% |
| Some other Race | 0 | 0.0% |
| Total | 92 | 100.0% |
Ancestry in Jeisyville
The most populous ancestries reported in Jeisyville are Irish (24 | 26.1%), German (13 | 14.1%), European (12 | 13.0%), Czechoslovakian (6 | 6.5%), and Dutch (4 | 4.3%), together accounting for 64.1% of all Jeisyville residents.
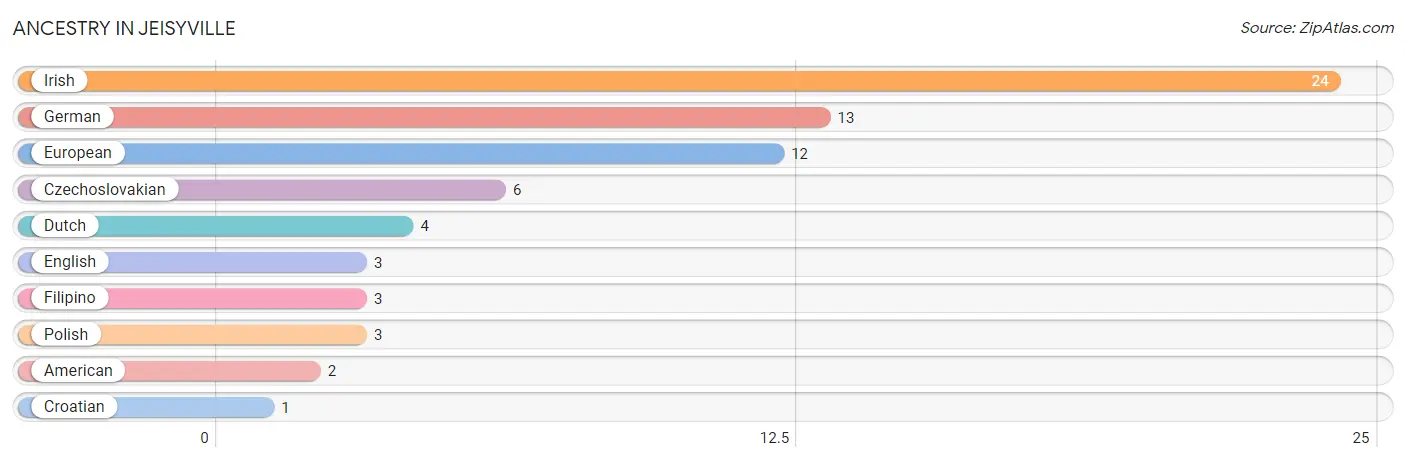
| Ancestry | # Population | % Population |
| American | 2 | 2.2% |
| Croatian | 1 | 1.1% |
| Czechoslovakian | 6 | 6.5% |
| Dutch | 4 | 4.3% |
| English | 3 | 3.3% |
| European | 12 | 13.0% |
| Filipino | 3 | 3.3% |
| German | 13 | 14.1% |
| Irish | 24 | 26.1% |
| Polish | 3 | 3.3% | View All 10 Rows |
Immigrants in Jeisyville
The most numerous immigrant groups reported in Jeisyville came from Asia (1 | 1.1%), Indonesia (1 | 1.1%), and South Eastern Asia (1 | 1.1%), together accounting for 3.3% of all Jeisyville residents.
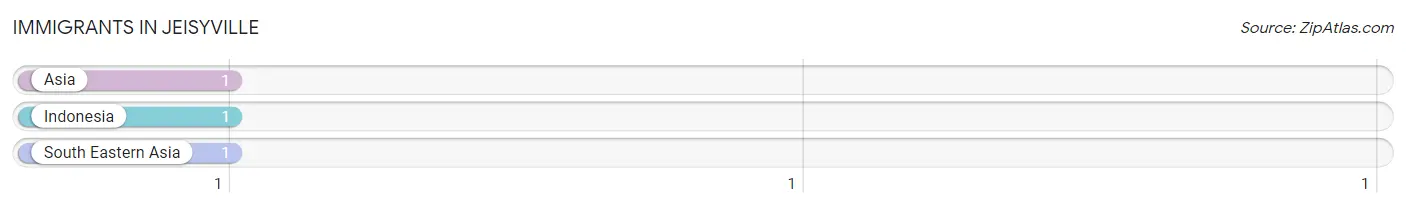
| Immigration Origin | # Population | % Population |
| Asia | 1 | 1.1% |
| Indonesia | 1 | 1.1% |
| South Eastern Asia | 1 | 1.1% | View All 3 Rows |
Sex and Age in Jeisyville
Sex and Age in Jeisyville
The most populous age groups in Jeisyville are 25 to 29 Years (10 | 20.0%) for men and 5 to 9 Years (10 | 23.8%) for women.
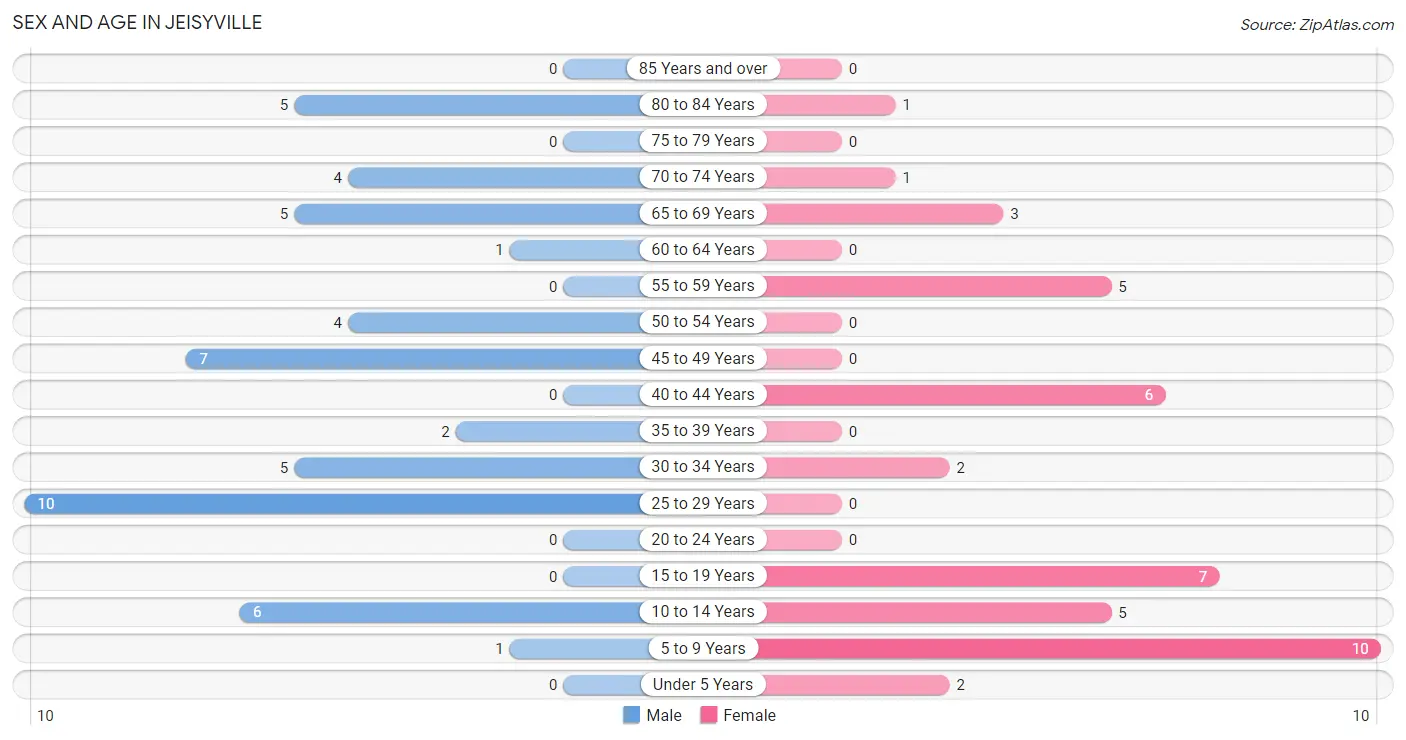
| Age Bracket | Male | Female |
| Under 5 Years | 0 (0.0%) | 2 (4.8%) |
| 5 to 9 Years | 1 (2.0%) | 10 (23.8%) |
| 10 to 14 Years | 6 (12.0%) | 5 (11.9%) |
| 15 to 19 Years | 0 (0.0%) | 7 (16.7%) |
| 20 to 24 Years | 0 (0.0%) | 0 (0.0%) |
| 25 to 29 Years | 10 (20.0%) | 0 (0.0%) |
| 30 to 34 Years | 5 (10.0%) | 2 (4.8%) |
| 35 to 39 Years | 2 (4.0%) | 0 (0.0%) |
| 40 to 44 Years | 0 (0.0%) | 6 (14.3%) |
| 45 to 49 Years | 7 (14.0%) | 0 (0.0%) |
| 50 to 54 Years | 4 (8.0%) | 0 (0.0%) |
| 55 to 59 Years | 0 (0.0%) | 5 (11.9%) |
| 60 to 64 Years | 1 (2.0%) | 0 (0.0%) |
| 65 to 69 Years | 5 (10.0%) | 3 (7.1%) |
| 70 to 74 Years | 4 (8.0%) | 1 (2.4%) |
| 75 to 79 Years | 0 (0.0%) | 0 (0.0%) |
| 80 to 84 Years | 5 (10.0%) | 1 (2.4%) |
| 85 Years and over | 0 (0.0%) | 0 (0.0%) |
| Total | 50 (100.0%) | 42 (100.0%) |
Families and Households in Jeisyville
Median Family Size in Jeisyville
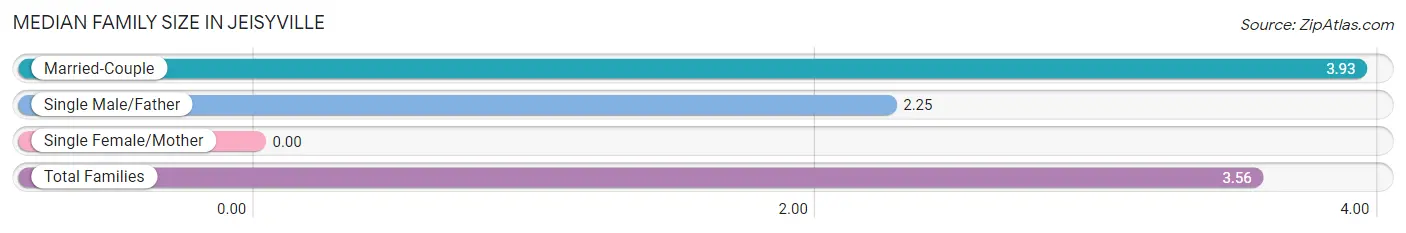
| Family Type | # Families | Family Size |
| Married-Couple | 14 (77.8%) | 3.93 |
| Single Male/Father | 4 (22.2%) | 2.25 |
| Single Female/Mother | 0 (0.0%) | - |
| Total Families | 18 (100.0%) | 3.56 |
Median Household Size in Jeisyville
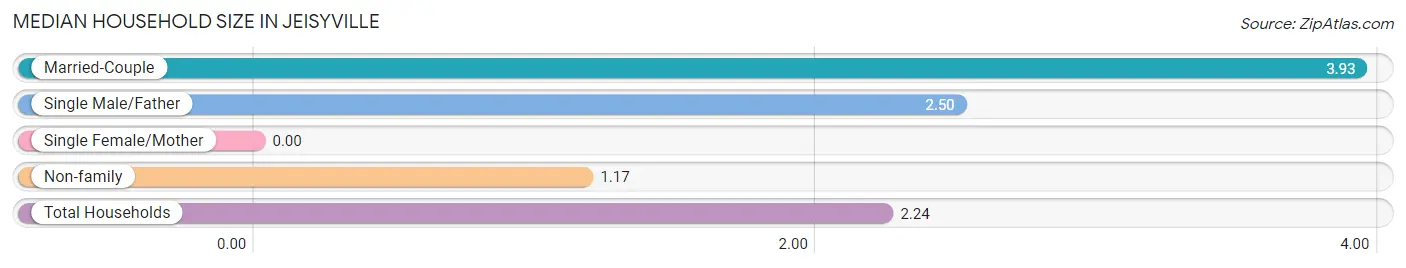
| Household Type | # Households | Household Size |
| Married-Couple | 14 (34.2%) | 3.93 |
| Single Male/Father | 4 (9.8%) | 2.50 |
| Single Female/Mother | 0 (0.0%) | - |
| Non-family | 23 (56.1%) | 1.17 |
| Total Households | 41 (100.0%) | 2.24 |
Household Size by Marriage Status in Jeisyville
Out of a total of 41 households in Jeisyville, 18 (43.9%) are family households, while 23 (56.1%) are nonfamily households. The most numerous type of family households are 5-person households, comprising 7, and the most common type of nonfamily households are 1-person households, comprising 19.
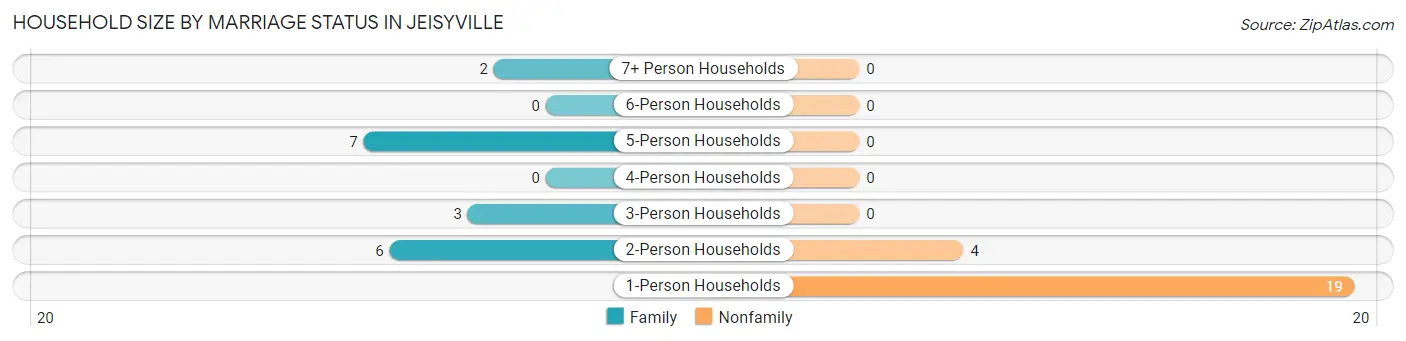
| Household Size | Family Households | Nonfamily Households |
| 1-Person Households | - | 19 (46.3%) |
| 2-Person Households | 6 (14.6%) | 4 (9.8%) |
| 3-Person Households | 3 (7.3%) | 0 (0.0%) |
| 4-Person Households | 0 (0.0%) | 0 (0.0%) |
| 5-Person Households | 7 (17.1%) | 0 (0.0%) |
| 6-Person Households | 0 (0.0%) | 0 (0.0%) |
| 7+ Person Households | 2 (4.9%) | 0 (0.0%) |
| Total | 18 (43.9%) | 23 (56.1%) |
Female Fertility in Jeisyville
Fertility by Age in Jeisyville
| Age Bracket | Women with Births | Births / 1,000 Women |
| 15 to 19 years | 0 (0.0%) | 0.0 |
| 20 to 34 years | 0 (0.0%) | 0.0 |
| 35 to 50 years | 0 (0.0%) | 0.0 |
| Total | 0 (0.0%) | 0.0 |
Fertility by Age by Marriage Status in Jeisyville
| Age Bracket | Married | Unmarried |
| 15 to 19 years | 0 (0.0%) | 0 (0.0%) |
| 20 to 34 years | 0 (0.0%) | 0 (0.0%) |
| 35 to 50 years | 0 (0.0%) | 0 (0.0%) |
| Total | 0 (0.0%) | 0 (0.0%) |
Fertility by Education in Jeisyville
| Educational Attainment | Women with Births | Births / 1,000 Women |
| Less than High School | 0 (0.0%) | 0.0 |
| High School Diploma | 0 (0.0%) | 0.0 |
| College or Associate's Degree | 0 (0.0%) | 0.0 |
| Bachelor's Degree | 0 (0.0%) | 0.0 |
| Graduate Degree | 0 (0.0%) | 0.0 |
| Total | 0 (0.0%) | 0.0 |
Fertility by Education by Marriage Status in Jeisyville
| Educational Attainment | Married | Unmarried |
| Less than High School | 0 (0.0%) | 0 (0.0%) |
| High School Diploma | 0 (0.0%) | 0 (0.0%) |
| College or Associate's Degree | 0 (0.0%) | 0 (0.0%) |
| Bachelor's Degree | 0 (0.0%) | 0 (0.0%) |
| Graduate Degree | 0 (0.0%) | 0 (0.0%) |
| Total | 0 (0.0%) | 0 (0.0%) |
Employment Characteristics in Jeisyville
Employment by Class of Employer in Jeisyville
Among the 52 employed individuals in Jeisyville, private company employees (42 | 80.8%), state government employees (9 | 17.3%), and local government employees (1 | 1.9%) make up the most common classes of employment.
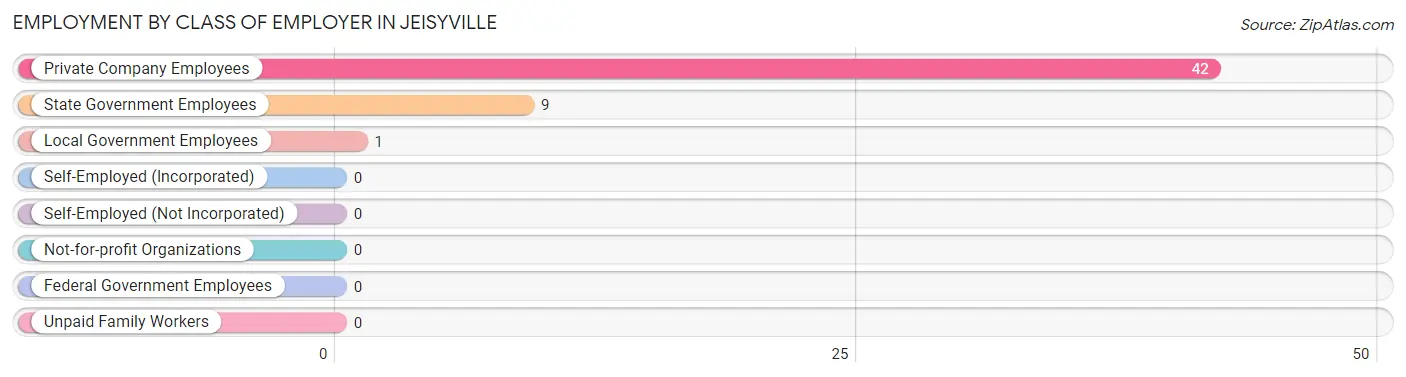
| Employer Class | # Employees | % Employees |
| Private Company Employees | 42 | 80.8% |
| Self-Employed (Incorporated) | 0 | 0.0% |
| Self-Employed (Not Incorporated) | 0 | 0.0% |
| Not-for-profit Organizations | 0 | 0.0% |
| Local Government Employees | 1 | 1.9% |
| State Government Employees | 9 | 17.3% |
| Federal Government Employees | 0 | 0.0% |
| Unpaid Family Workers | 0 | 0.0% |
| Total | 52 | 100.0% |
Employment Status by Age in Jeisyville
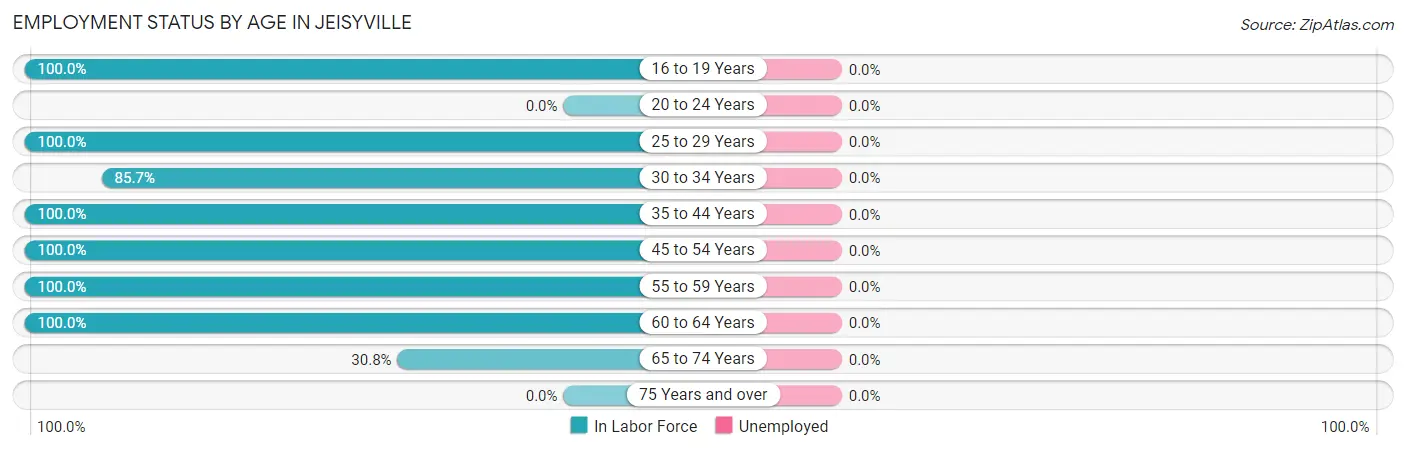
| Age Bracket | In Labor Force | Unemployed |
| 16 to 19 Years | 7 (100.0%) | 0 (0.0%) |
| 20 to 24 Years | 0 (0.0%) | 0 (0.0%) |
| 25 to 29 Years | 10 (100.0%) | 0 (0.0%) |
| 30 to 34 Years | 6 (85.7%) | 0 (0.0%) |
| 35 to 44 Years | 8 (100.0%) | 0 (0.0%) |
| 45 to 54 Years | 11 (100.0%) | 0 (0.0%) |
| 55 to 59 Years | 5 (100.0%) | 0 (0.0%) |
| 60 to 64 Years | 1 (100.0%) | 0 (0.0%) |
| 65 to 74 Years | 4 (30.8%) | 0 (0.0%) |
| 75 Years and over | 0 (0.0%) | 0 (0.0%) |
| Total | 52 (76.5%) | 0 (0.0%) |
Employment Status by Educational Attainment in Jeisyville
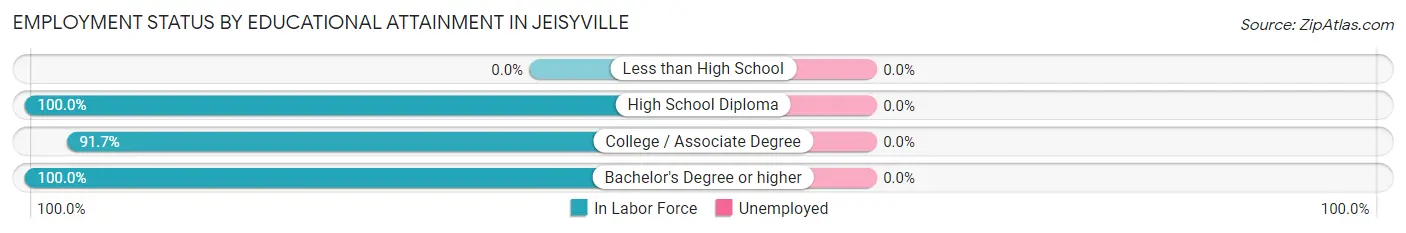
| Educational Attainment | In Labor Force | Unemployed |
| Less than High School | 0 (0.0%) | 0 (0.0%) |
| High School Diploma | 26 (100.0%) | 0 (0.0%) |
| College / Associate Degree | 11 (91.7%) | 0 (0.0%) |
| Bachelor's Degree or higher | 4 (100.0%) | 0 (0.0%) |
| Total | 41 (97.6%) | 0 (0.0%) |
Employment Occupations by Sex in Jeisyville
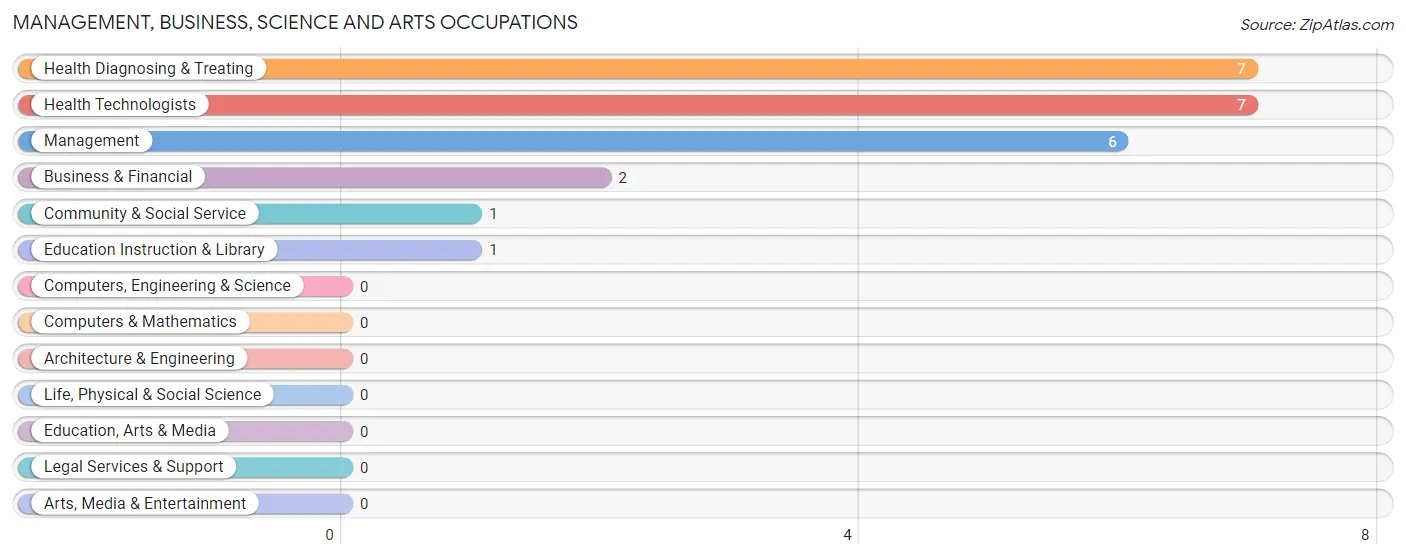
Management, Business, Science and Arts Occupations
The most common Management, Business, Science and Arts occupations in Jeisyville are Health Diagnosing & Treating (7 | 13.5%), Health Technologists (7 | 13.5%), Management (6 | 11.5%), Business & Financial (2 | 3.8%), and Community & Social Service (1 | 1.9%).
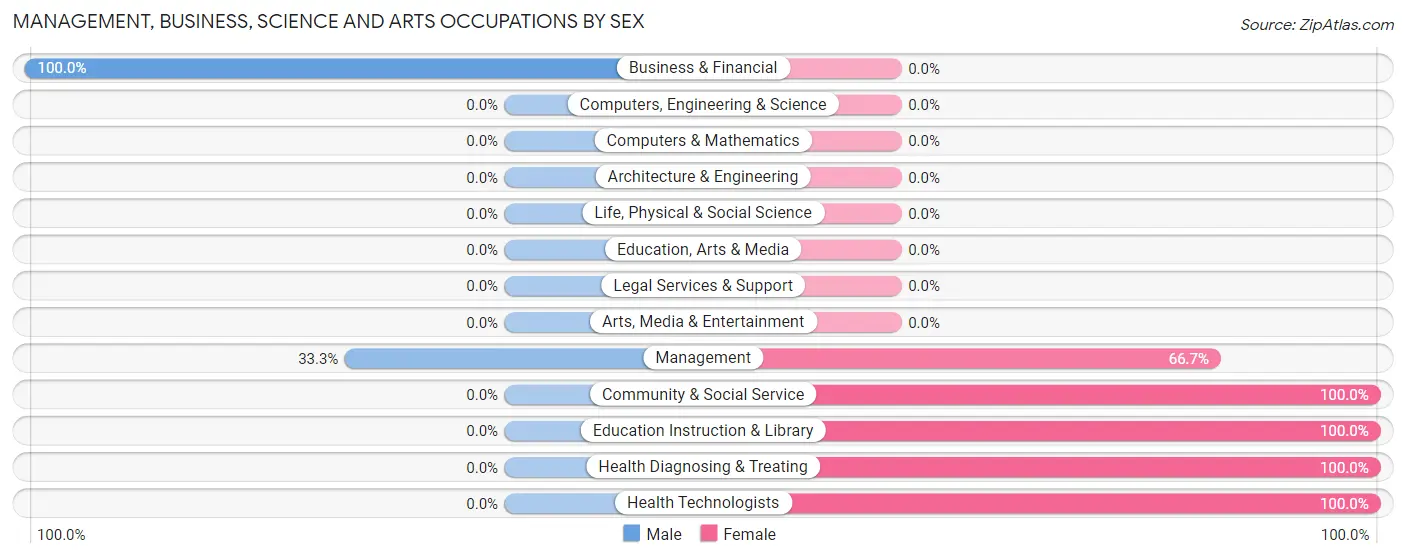
Management, Business, Science and Arts Occupations by Sex
Within the Management, Business, Science and Arts occupations in Jeisyville, the most male-oriented occupations are Business & Financial (100.0%), and Management (33.3%), while the most female-oriented occupations are Community & Social Service (100.0%), Education Instruction & Library (100.0%), and Health Diagnosing & Treating (100.0%).
| Occupation | Male | Female |
| Management | 2 (33.3%) | 4 (66.7%) |
| Business & Financial | 2 (100.0%) | 0 (0.0%) |
| Computers, Engineering & Science | 0 (0.0%) | 0 (0.0%) |
| Computers & Mathematics | 0 (0.0%) | 0 (0.0%) |
| Architecture & Engineering | 0 (0.0%) | 0 (0.0%) |
| Life, Physical & Social Science | 0 (0.0%) | 0 (0.0%) |
| Community & Social Service | 0 (0.0%) | 1 (100.0%) |
| Education, Arts & Media | 0 (0.0%) | 0 (0.0%) |
| Legal Services & Support | 0 (0.0%) | 0 (0.0%) |
| Education Instruction & Library | 0 (0.0%) | 1 (100.0%) |
| Arts, Media & Entertainment | 0 (0.0%) | 0 (0.0%) |
| Health Diagnosing & Treating | 0 (0.0%) | 7 (100.0%) |
| Health Technologists | 0 (0.0%) | 7 (100.0%) |
| Total (Category) | 4 (25.0%) | 12 (75.0%) |
| Total (Overall) | 33 (63.5%) | 19 (36.5%) |
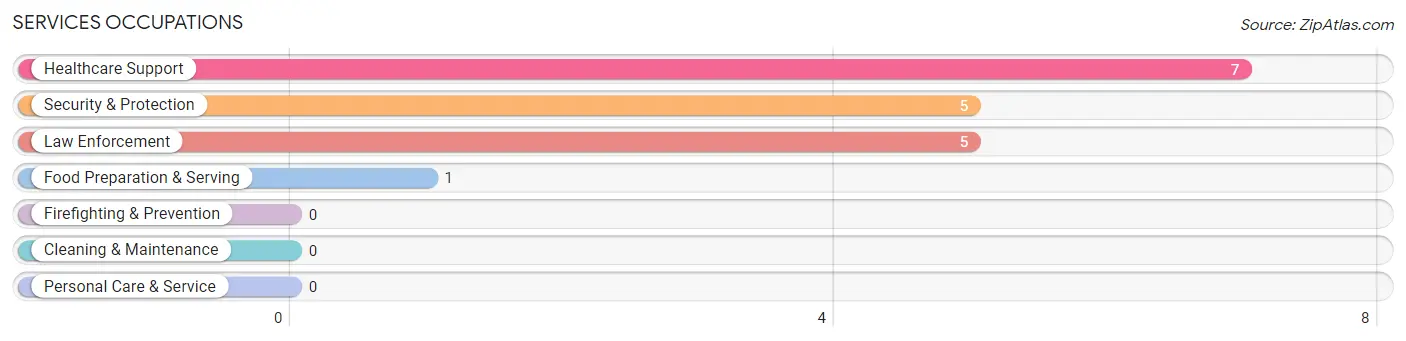
Services Occupations
The most common Services occupations in Jeisyville are Healthcare Support (7 | 13.5%), Security & Protection (5 | 9.6%), Law Enforcement (5 | 9.6%), and Food Preparation & Serving (1 | 1.9%).
Services Occupations by Sex
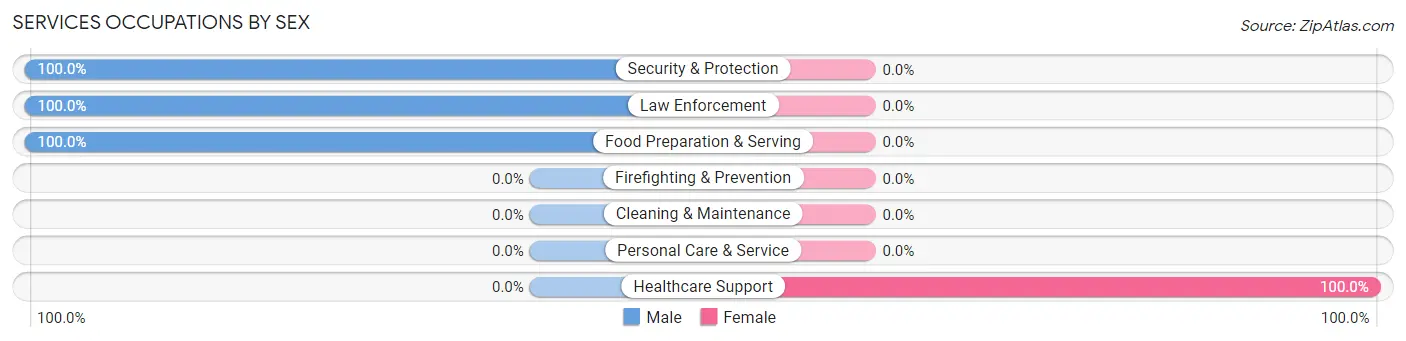
| Occupation | Male | Female |
| Healthcare Support | 0 (0.0%) | 7 (100.0%) |
| Security & Protection | 5 (100.0%) | 0 (0.0%) |
| Firefighting & Prevention | 0 (0.0%) | 0 (0.0%) |
| Law Enforcement | 5 (100.0%) | 0 (0.0%) |
| Food Preparation & Serving | 1 (100.0%) | 0 (0.0%) |
| Cleaning & Maintenance | 0 (0.0%) | 0 (0.0%) |
| Personal Care & Service | 0 (0.0%) | 0 (0.0%) |
| Total (Category) | 6 (46.2%) | 7 (53.8%) |
| Total (Overall) | 33 (63.5%) | 19 (36.5%) |
Sales and Office Occupations
Sales and Office Occupations by Sex
| Occupation | Male | Female |
| Sales & Related | 0 (0.0%) | 0 (0.0%) |
| Office & Administration | 0 (0.0%) | 0 (0.0%) |
| Total (Category) | 0 (0.0%) | 0 (0.0%) |
| Total (Overall) | 33 (63.5%) | 19 (36.5%) |
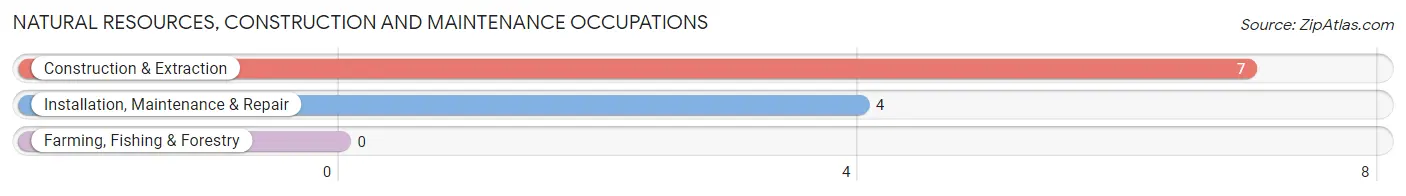
Natural Resources, Construction and Maintenance Occupations
The most common Natural Resources, Construction and Maintenance occupations in Jeisyville are Construction & Extraction (7 | 13.5%), and Installation, Maintenance & Repair (4 | 7.7%).
Natural Resources, Construction and Maintenance Occupations by Sex
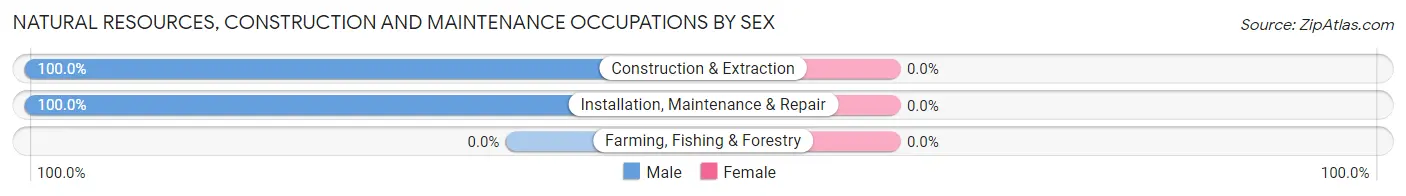
| Occupation | Male | Female |
| Farming, Fishing & Forestry | 0 (0.0%) | 0 (0.0%) |
| Construction & Extraction | 7 (100.0%) | 0 (0.0%) |
| Installation, Maintenance & Repair | 4 (100.0%) | 0 (0.0%) |
| Total (Category) | 11 (100.0%) | 0 (0.0%) |
| Total (Overall) | 33 (63.5%) | 19 (36.5%) |
Production, Transportation and Moving Occupations
The most common Production, Transportation and Moving occupations in Jeisyville are Production (8 | 15.4%), and Transportation (4 | 7.7%).
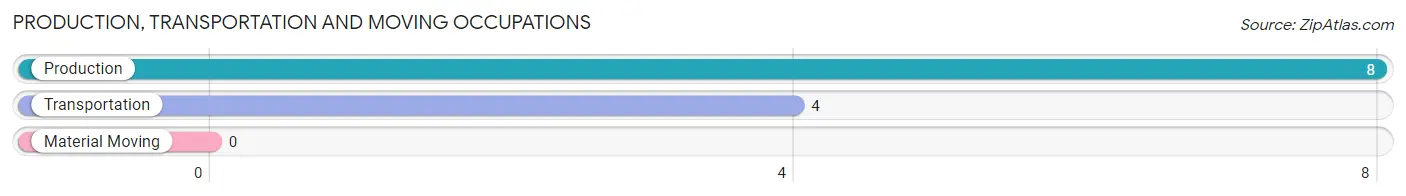
Production, Transportation and Moving Occupations by Sex
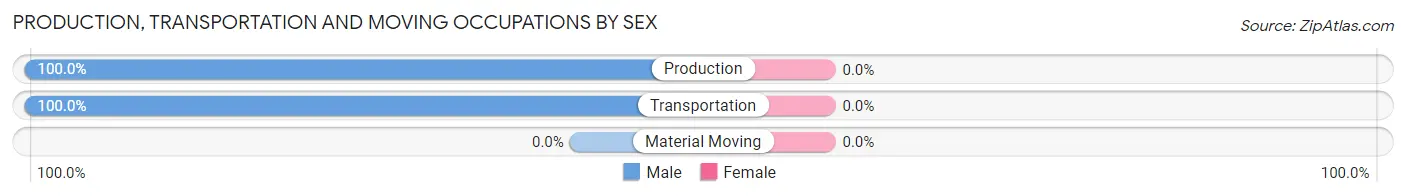
| Occupation | Male | Female |
| Production | 8 (100.0%) | 0 (0.0%) |
| Transportation | 4 (100.0%) | 0 (0.0%) |
| Material Moving | 0 (0.0%) | 0 (0.0%) |
| Total (Category) | 12 (100.0%) | 0 (0.0%) |
| Total (Overall) | 33 (63.5%) | 19 (36.5%) |
Employment Industries by Sex in Jeisyville
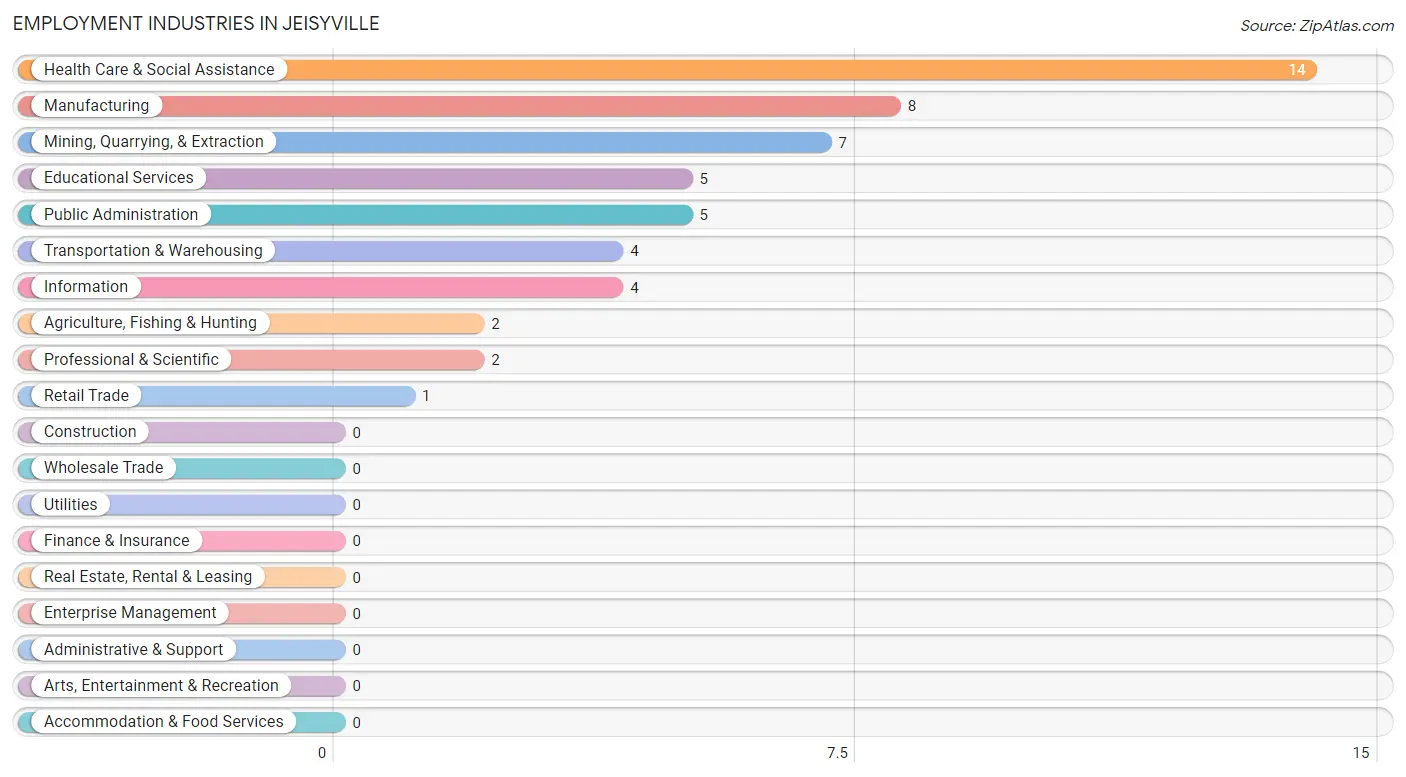
Employment Industries in Jeisyville
The major employment industries in Jeisyville include Health Care & Social Assistance (14 | 26.9%), Manufacturing (8 | 15.4%), Mining, Quarrying, & Extraction (7 | 13.5%), Educational Services (5 | 9.6%), and Public Administration (5 | 9.6%).
Employment Industries by Sex in Jeisyville
The Jeisyville industries that see more men than women are Agriculture, Fishing & Hunting (100.0%), Mining, Quarrying, & Extraction (100.0%), and Manufacturing (100.0%), whereas the industries that tend to have a higher number of women are Information (100.0%), Health Care & Social Assistance (100.0%), and Educational Services (20.0%).
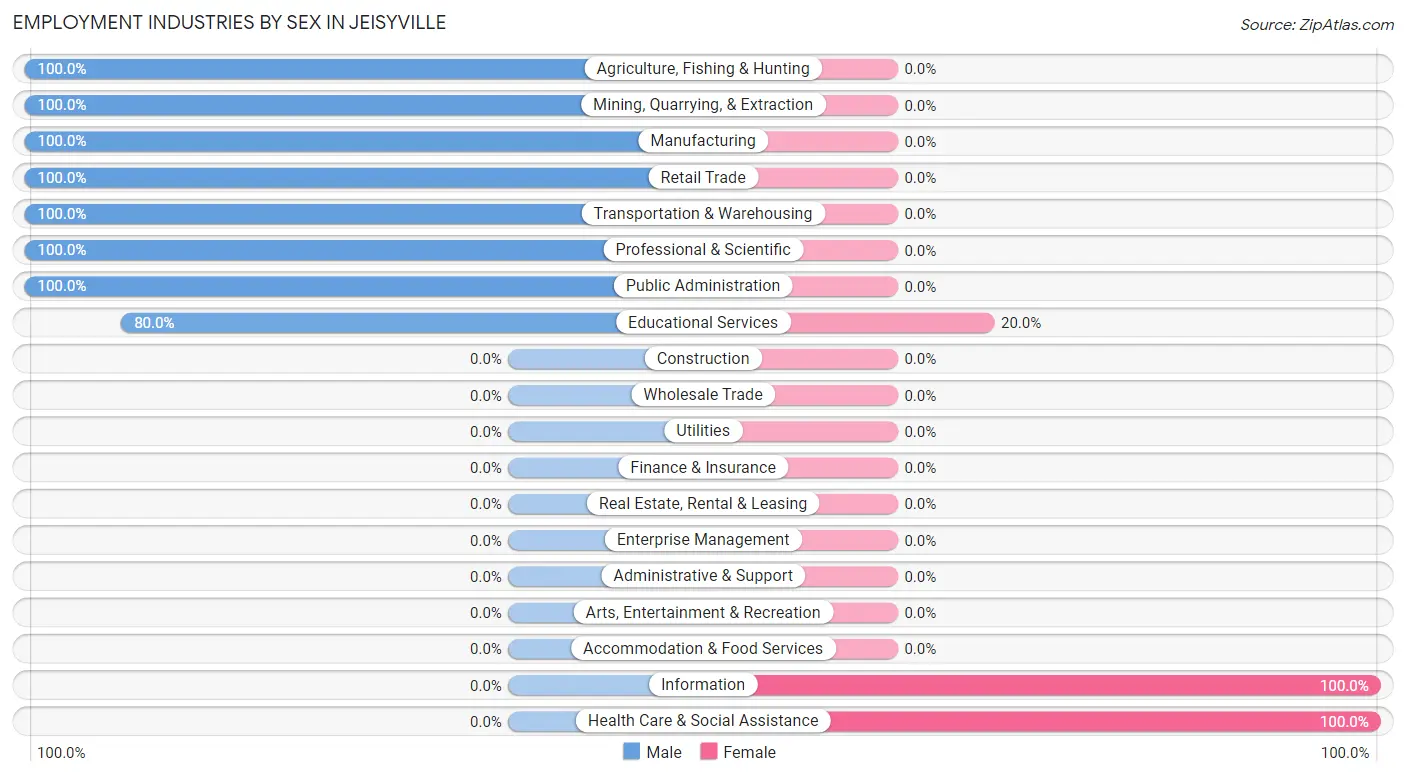
| Industry | Male | Female |
| Agriculture, Fishing & Hunting | 2 (100.0%) | 0 (0.0%) |
| Mining, Quarrying, & Extraction | 7 (100.0%) | 0 (0.0%) |
| Construction | 0 (0.0%) | 0 (0.0%) |
| Manufacturing | 8 (100.0%) | 0 (0.0%) |
| Wholesale Trade | 0 (0.0%) | 0 (0.0%) |
| Retail Trade | 1 (100.0%) | 0 (0.0%) |
| Transportation & Warehousing | 4 (100.0%) | 0 (0.0%) |
| Utilities | 0 (0.0%) | 0 (0.0%) |
| Information | 0 (0.0%) | 4 (100.0%) |
| Finance & Insurance | 0 (0.0%) | 0 (0.0%) |
| Real Estate, Rental & Leasing | 0 (0.0%) | 0 (0.0%) |
| Professional & Scientific | 2 (100.0%) | 0 (0.0%) |
| Enterprise Management | 0 (0.0%) | 0 (0.0%) |
| Administrative & Support | 0 (0.0%) | 0 (0.0%) |
| Educational Services | 4 (80.0%) | 1 (20.0%) |
| Health Care & Social Assistance | 0 (0.0%) | 14 (100.0%) |
| Arts, Entertainment & Recreation | 0 (0.0%) | 0 (0.0%) |
| Accommodation & Food Services | 0 (0.0%) | 0 (0.0%) |
| Public Administration | 5 (100.0%) | 0 (0.0%) |
| Total | 33 (63.5%) | 19 (36.5%) |
Education in Jeisyville
School Enrollment in Jeisyville
The most common levels of schooling among the 29 students in Jeisyville are middle school (11 | 37.9%), elementary school (9 | 31.0%), and high school (7 | 24.1%).
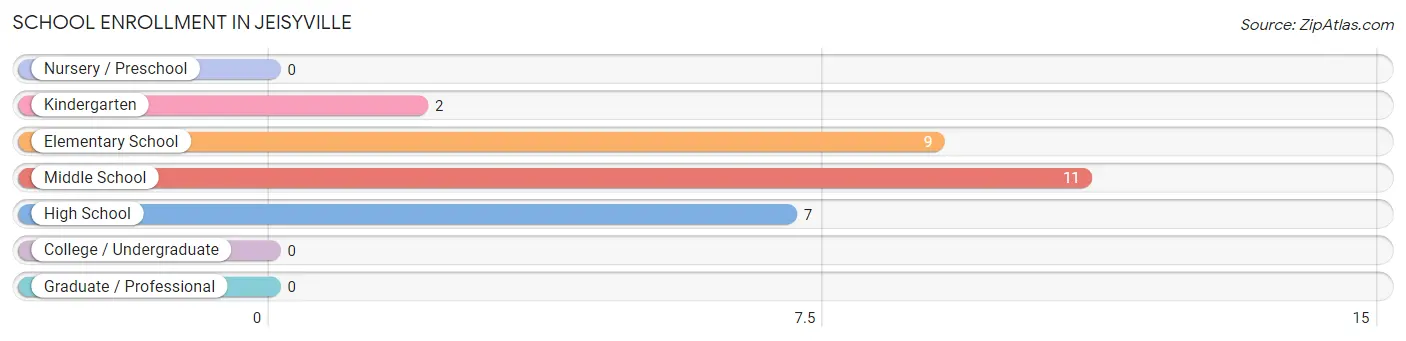
| School Level | # Students | % Students |
| Nursery / Preschool | 0 | 0.0% |
| Kindergarten | 2 | 6.9% |
| Elementary School | 9 | 31.0% |
| Middle School | 11 | 37.9% |
| High School | 7 | 24.1% |
| College / Undergraduate | 0 | 0.0% |
| Graduate / Professional | 0 | 0.0% |
| Total | 29 | 100.0% |
School Enrollment by Age by Funding Source in Jeisyville
Out of a total of 29 students who are enrolled in schools in Jeisyville, 5 (17.2%) attend a private institution, while the remaining 24 (82.8%) are enrolled in public schools. The age group of 5 to 9 year old has the highest likelihood of being enrolled in private schools, with 3 (27.3% in the age bracket) enrolled. Conversely, the age group of 15 to 17 year olds has the lowest likelihood of being enrolled in a private school, with 7 (100.0% in the age bracket) attending a public institution.
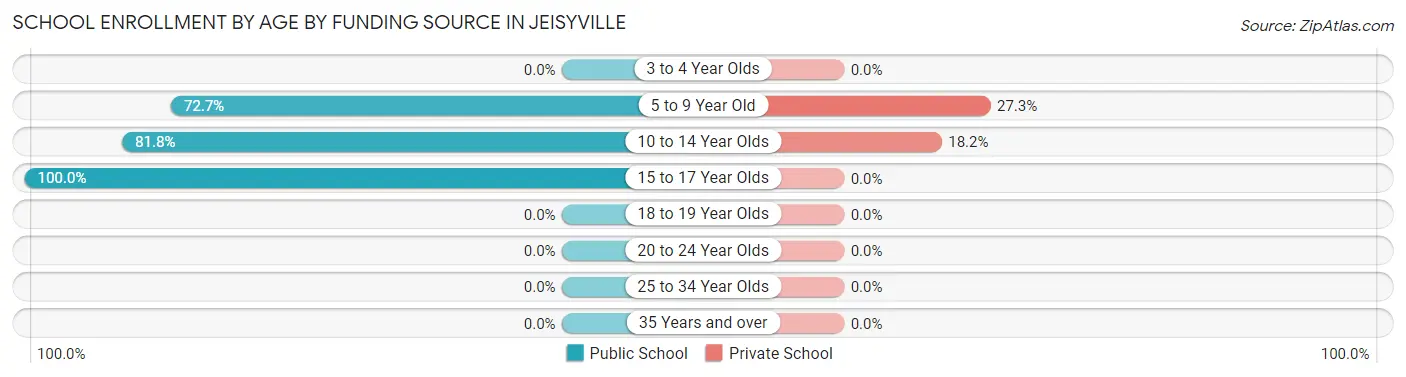
| Age Bracket | Public School | Private School |
| 3 to 4 Year Olds | 0 (0.0%) | 0 (0.0%) |
| 5 to 9 Year Old | 8 (72.7%) | 3 (27.3%) |
| 10 to 14 Year Olds | 9 (81.8%) | 2 (18.2%) |
| 15 to 17 Year Olds | 7 (100.0%) | 0 (0.0%) |
| 18 to 19 Year Olds | 0 (0.0%) | 0 (0.0%) |
| 20 to 24 Year Olds | 0 (0.0%) | 0 (0.0%) |
| 25 to 34 Year Olds | 0 (0.0%) | 0 (0.0%) |
| 35 Years and over | 0 (0.0%) | 0 (0.0%) |
| Total | 24 (82.8%) | 5 (17.2%) |
Educational Attainment by Field of Study in Jeisyville
Computers & mathematics (6 | 75.0%), science & technology (1 | 12.5%), and education (1 | 12.5%) are the most common fields of study among 8 individuals in Jeisyville who have obtained a bachelor's degree or higher.
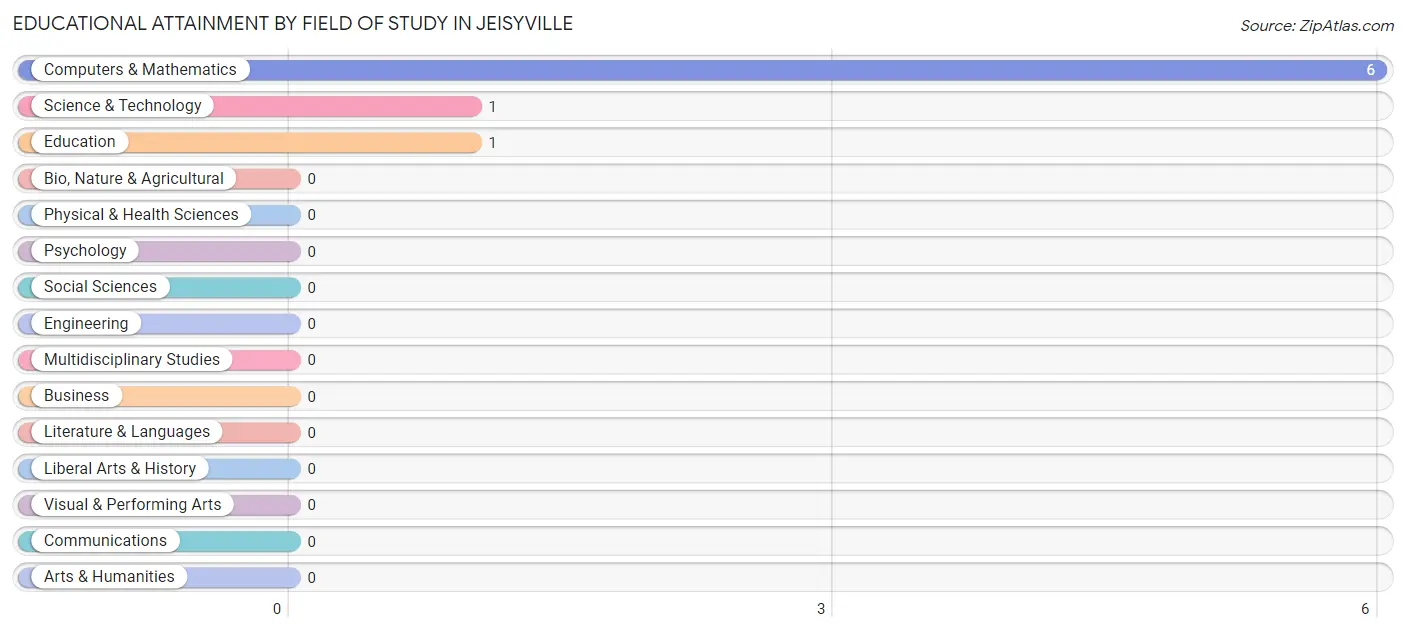
| Field of Study | # Graduates | % Graduates |
| Computers & Mathematics | 6 | 75.0% |
| Bio, Nature & Agricultural | 0 | 0.0% |
| Physical & Health Sciences | 0 | 0.0% |
| Psychology | 0 | 0.0% |
| Social Sciences | 0 | 0.0% |
| Engineering | 0 | 0.0% |
| Multidisciplinary Studies | 0 | 0.0% |
| Science & Technology | 1 | 12.5% |
| Business | 0 | 0.0% |
| Education | 1 | 12.5% |
| Literature & Languages | 0 | 0.0% |
| Liberal Arts & History | 0 | 0.0% |
| Visual & Performing Arts | 0 | 0.0% |
| Communications | 0 | 0.0% |
| Arts & Humanities | 0 | 0.0% |
| Total | 8 | 100.0% |
Transportation & Commute in Jeisyville
Vehicle Availability by Sex in Jeisyville
The most prevalent vehicle ownership categories in Jeisyville are males with 2 vehicles (17, accounting for 51.5%) and females with 2 vehicles (5, making up 89.5%).
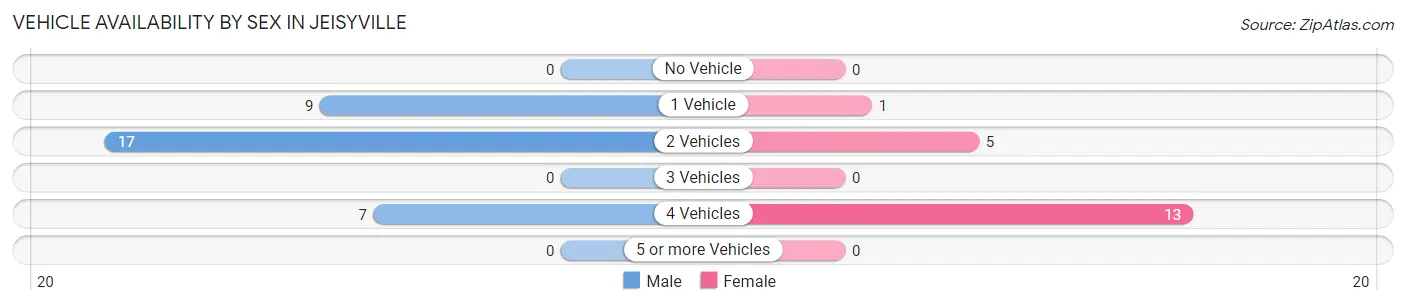
| Vehicles Available | Male | Female |
| No Vehicle | 0 (0.0%) | 0 (0.0%) |
| 1 Vehicle | 9 (27.3%) | 1 (5.3%) |
| 2 Vehicles | 17 (51.5%) | 5 (26.3%) |
| 3 Vehicles | 0 (0.0%) | 0 (0.0%) |
| 4 Vehicles | 7 (21.2%) | 13 (68.4%) |
| 5 or more Vehicles | 0 (0.0%) | 0 (0.0%) |
| Total | 33 (100.0%) | 19 (100.0%) |
Commute Time in Jeisyville
The most frequently occuring commute durations in Jeisyville are 20 to 24 minutes (21 commuters, 42.0%), 15 to 19 minutes (13 commuters, 26.0%), and 45 to 59 minutes (9 commuters, 18.0%).
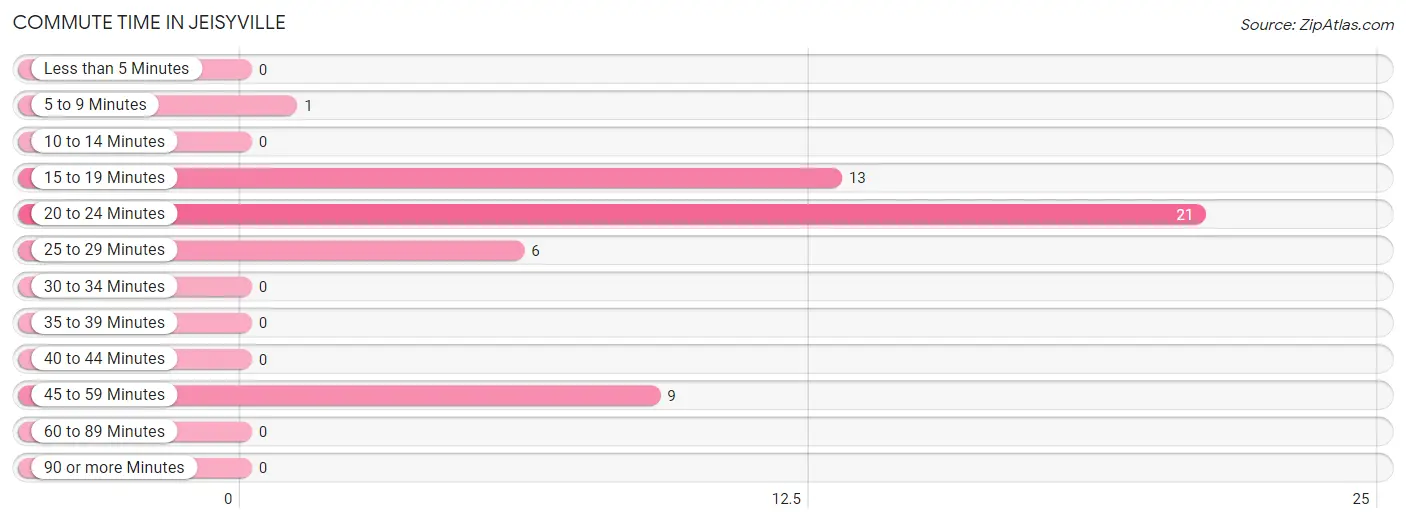
| Commute Time | # Commuters | % Commuters |
| Less than 5 Minutes | 0 | 0.0% |
| 5 to 9 Minutes | 1 | 2.0% |
| 10 to 14 Minutes | 0 | 0.0% |
| 15 to 19 Minutes | 13 | 26.0% |
| 20 to 24 Minutes | 21 | 42.0% |
| 25 to 29 Minutes | 6 | 12.0% |
| 30 to 34 Minutes | 0 | 0.0% |
| 35 to 39 Minutes | 0 | 0.0% |
| 40 to 44 Minutes | 0 | 0.0% |
| 45 to 59 Minutes | 9 | 18.0% |
| 60 to 89 Minutes | 0 | 0.0% |
| 90 or more Minutes | 0 | 0.0% |
Commute Time by Sex in Jeisyville
The most common commute times in Jeisyville are 20 to 24 minutes (17 commuters, 54.8%) for males and 15 to 19 minutes (13 commuters, 68.4%) for females.
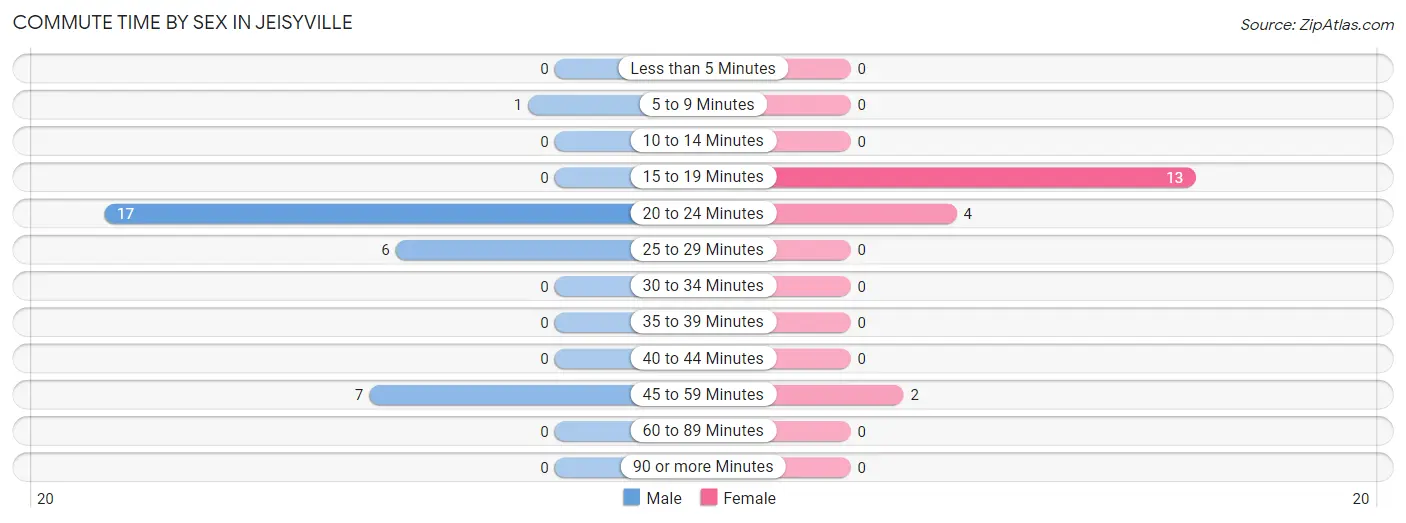
| Commute Time | Male | Female |
| Less than 5 Minutes | 0 (0.0%) | 0 (0.0%) |
| 5 to 9 Minutes | 1 (3.2%) | 0 (0.0%) |
| 10 to 14 Minutes | 0 (0.0%) | 0 (0.0%) |
| 15 to 19 Minutes | 0 (0.0%) | 13 (68.4%) |
| 20 to 24 Minutes | 17 (54.8%) | 4 (21.0%) |
| 25 to 29 Minutes | 6 (19.4%) | 0 (0.0%) |
| 30 to 34 Minutes | 0 (0.0%) | 0 (0.0%) |
| 35 to 39 Minutes | 0 (0.0%) | 0 (0.0%) |
| 40 to 44 Minutes | 0 (0.0%) | 0 (0.0%) |
| 45 to 59 Minutes | 7 (22.6%) | 2 (10.5%) |
| 60 to 89 Minutes | 0 (0.0%) | 0 (0.0%) |
| 90 or more Minutes | 0 (0.0%) | 0 (0.0%) |
Time of Departure to Work by Sex in Jeisyville
The most frequent times of departure to work in Jeisyville are 7:00 AM to 7:29 AM (10, 32.3%) for males and 12:00 PM to 3:59 PM (7, 36.8%) for females.
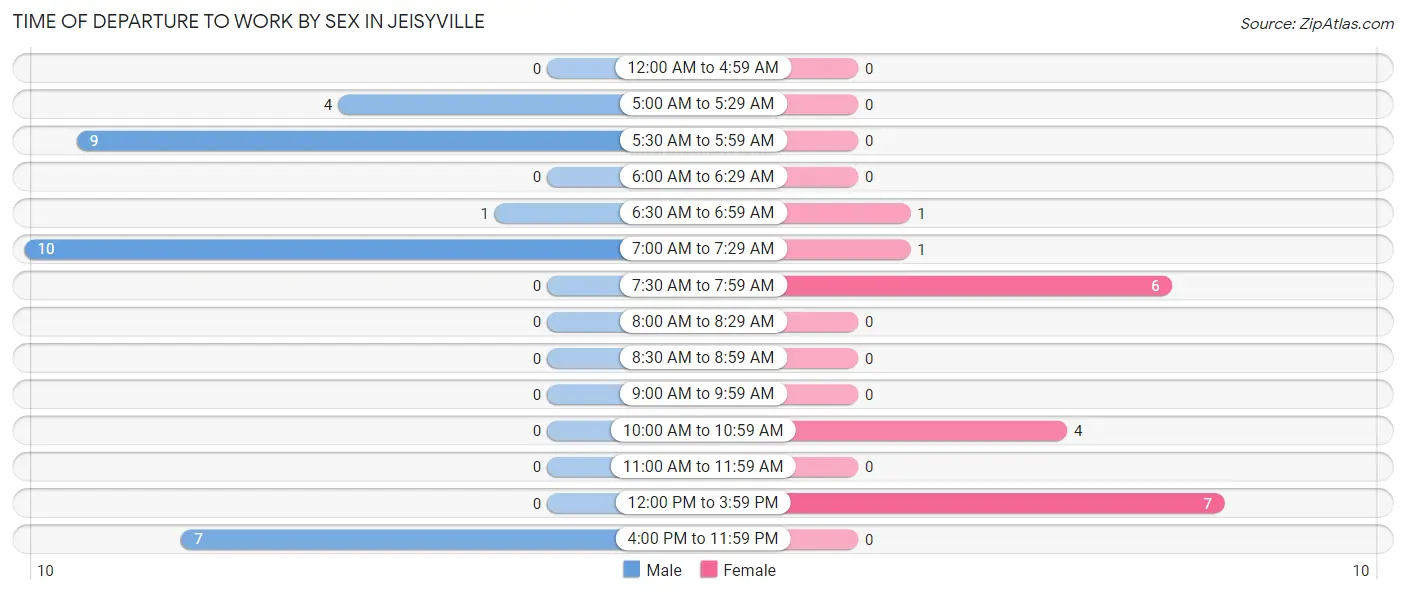
| Time of Departure | Male | Female |
| 12:00 AM to 4:59 AM | 0 (0.0%) | 0 (0.0%) |
| 5:00 AM to 5:29 AM | 4 (12.9%) | 0 (0.0%) |
| 5:30 AM to 5:59 AM | 9 (29.0%) | 0 (0.0%) |
| 6:00 AM to 6:29 AM | 0 (0.0%) | 0 (0.0%) |
| 6:30 AM to 6:59 AM | 1 (3.2%) | 1 (5.3%) |
| 7:00 AM to 7:29 AM | 10 (32.3%) | 1 (5.3%) |
| 7:30 AM to 7:59 AM | 0 (0.0%) | 6 (31.6%) |
| 8:00 AM to 8:29 AM | 0 (0.0%) | 0 (0.0%) |
| 8:30 AM to 8:59 AM | 0 (0.0%) | 0 (0.0%) |
| 9:00 AM to 9:59 AM | 0 (0.0%) | 0 (0.0%) |
| 10:00 AM to 10:59 AM | 0 (0.0%) | 4 (21.0%) |
| 11:00 AM to 11:59 AM | 0 (0.0%) | 0 (0.0%) |
| 12:00 PM to 3:59 PM | 0 (0.0%) | 7 (36.8%) |
| 4:00 PM to 11:59 PM | 7 (22.6%) | 0 (0.0%) |
| Total | 31 (100.0%) | 19 (100.0%) |
Housing Occupancy in Jeisyville
Occupancy by Ownership in Jeisyville
Of the total 41 dwellings in Jeisyville, owner-occupied units account for 40 (97.6%), while renter-occupied units make up 1 (2.4%).
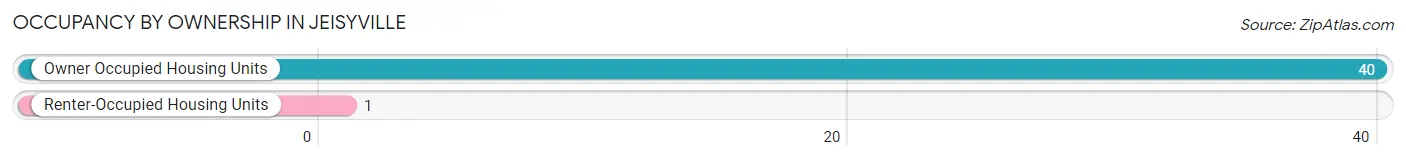
| Occupancy | # Housing Units | % Housing Units |
| Owner Occupied Housing Units | 40 | 97.6% |
| Renter-Occupied Housing Units | 1 | 2.4% |
| Total Occupied Housing Units | 41 | 100.0% |
Occupancy by Household Size in Jeisyville
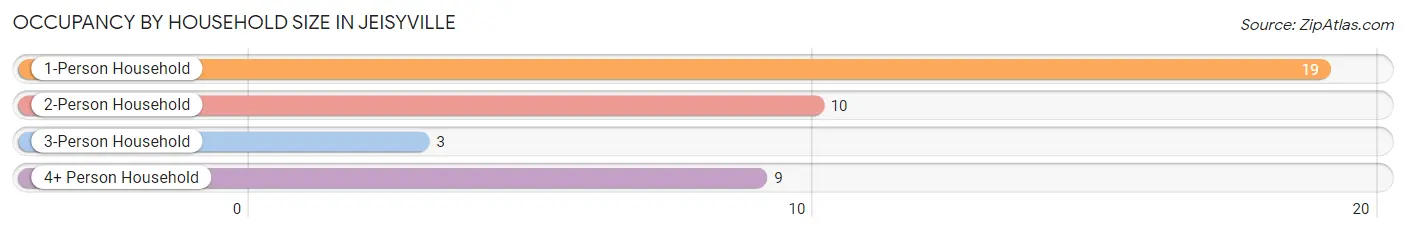
| Household Size | # Housing Units | % Housing Units |
| 1-Person Household | 19 | 46.3% |
| 2-Person Household | 10 | 24.4% |
| 3-Person Household | 3 | 7.3% |
| 4+ Person Household | 9 | 22.0% |
| Total Housing Units | 41 | 100.0% |
Occupancy by Ownership by Household Size in Jeisyville
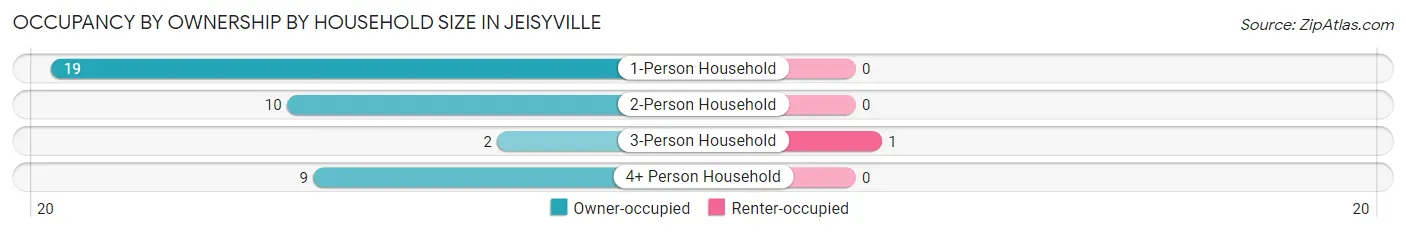
| Household Size | Owner-occupied | Renter-occupied |
| 1-Person Household | 19 (100.0%) | 0 (0.0%) |
| 2-Person Household | 10 (100.0%) | 0 (0.0%) |
| 3-Person Household | 2 (66.7%) | 1 (33.3%) |
| 4+ Person Household | 9 (100.0%) | 0 (0.0%) |
| Total Housing Units | 40 (97.6%) | 1 (2.4%) |
Occupancy by Educational Attainment in Jeisyville
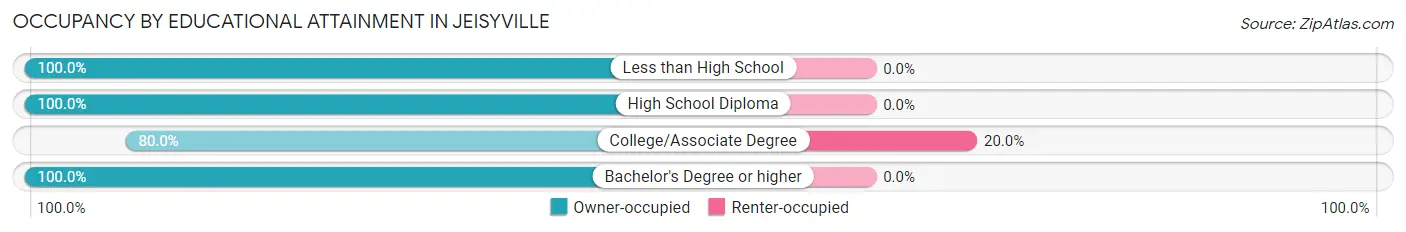
| Household Size | Owner-occupied | Renter-occupied |
| Less than High School | 1 (100.0%) | 0 (0.0%) |
| High School Diploma | 29 (100.0%) | 0 (0.0%) |
| College/Associate Degree | 4 (80.0%) | 1 (20.0%) |
| Bachelor's Degree or higher | 6 (100.0%) | 0 (0.0%) |
Occupancy by Age of Householder in Jeisyville
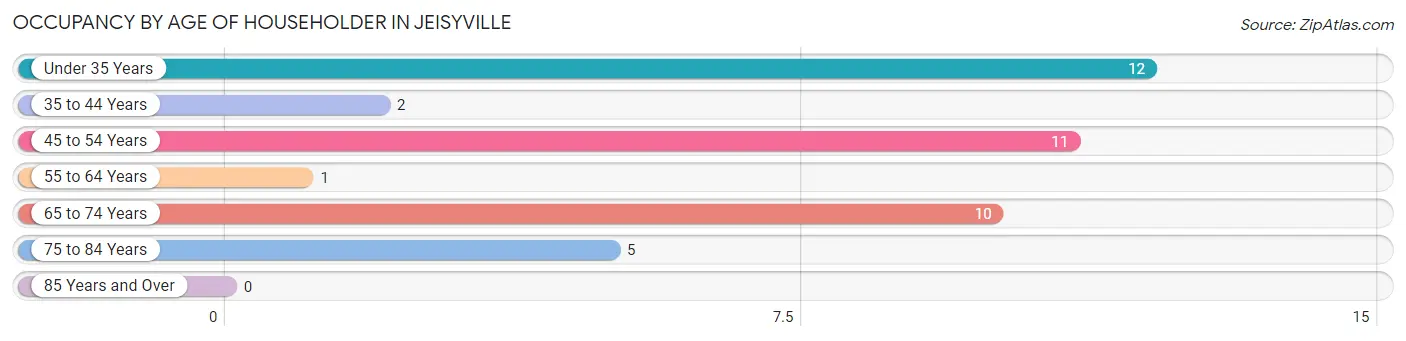
| Age Bracket | # Households | % Households |
| Under 35 Years | 12 | 29.3% |
| 35 to 44 Years | 2 | 4.9% |
| 45 to 54 Years | 11 | 26.8% |
| 55 to 64 Years | 1 | 2.4% |
| 65 to 74 Years | 10 | 24.4% |
| 75 to 84 Years | 5 | 12.2% |
| 85 Years and Over | 0 | 0.0% |
| Total | 41 | 100.0% |
Housing Finances in Jeisyville
Median Income by Occupancy in Jeisyville
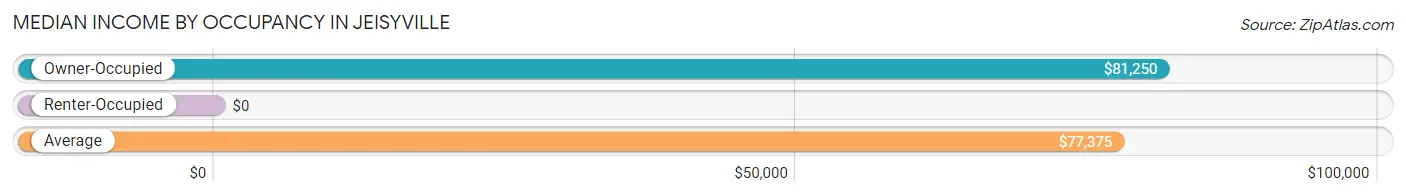
| Occupancy Type | # Households | Median Income |
| Owner-Occupied | 40 (97.6%) | $81,250 |
| Renter-Occupied | 1 (2.4%) | $0 |
| Average | 41 (100.0%) | $77,375 |
Occupancy by Householder Income Bracket in Jeisyville
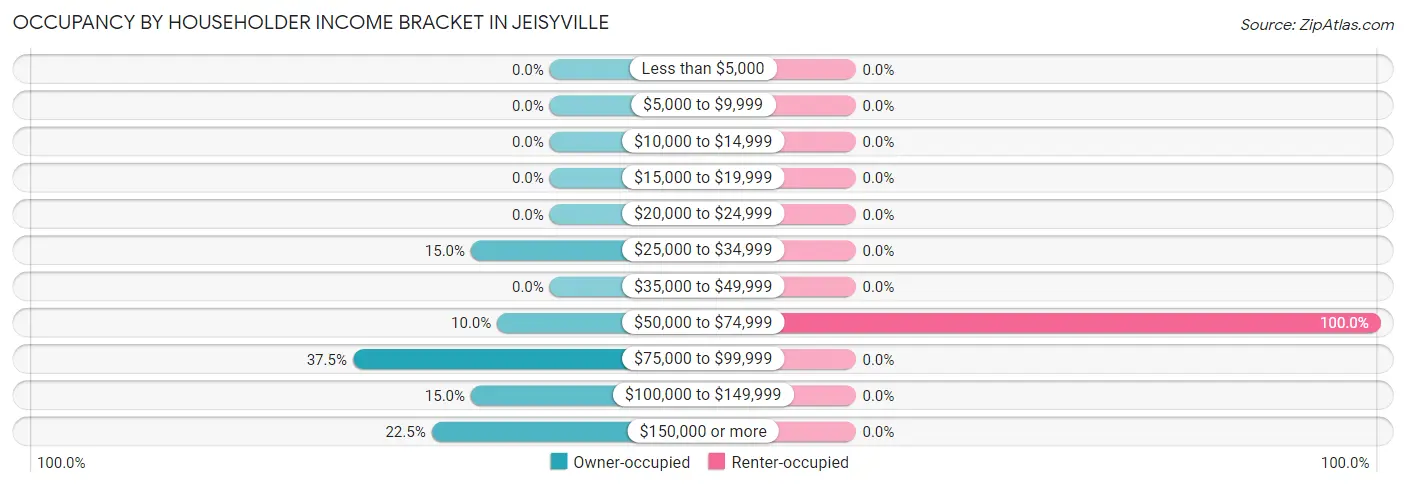
| Income Bracket | Owner-occupied | Renter-occupied |
| Less than $5,000 | 0 (0.0%) | 0 (0.0%) |
| $5,000 to $9,999 | 0 (0.0%) | 0 (0.0%) |
| $10,000 to $14,999 | 0 (0.0%) | 0 (0.0%) |
| $15,000 to $19,999 | 0 (0.0%) | 0 (0.0%) |
| $20,000 to $24,999 | 0 (0.0%) | 0 (0.0%) |
| $25,000 to $34,999 | 6 (15.0%) | 0 (0.0%) |
| $35,000 to $49,999 | 0 (0.0%) | 0 (0.0%) |
| $50,000 to $74,999 | 4 (10.0%) | 1 (100.0%) |
| $75,000 to $99,999 | 15 (37.5%) | 0 (0.0%) |
| $100,000 to $149,999 | 6 (15.0%) | 0 (0.0%) |
| $150,000 or more | 9 (22.5%) | 0 (0.0%) |
| Total | 40 (100.0%) | 1 (100.0%) |
Monthly Housing Cost Tiers in Jeisyville
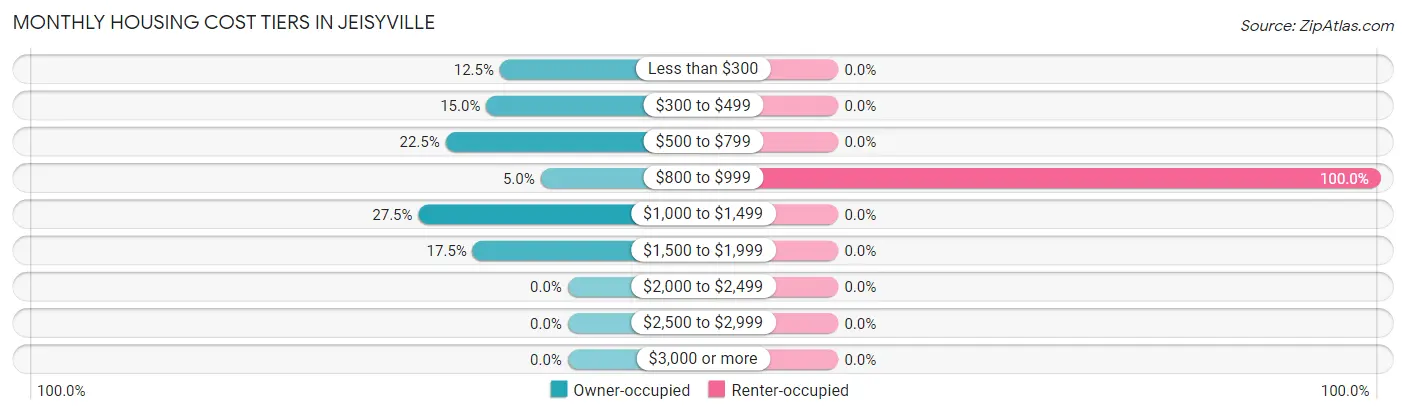
| Monthly Cost | Owner-occupied | Renter-occupied |
| Less than $300 | 5 (12.5%) | 0 (0.0%) |
| $300 to $499 | 6 (15.0%) | 0 (0.0%) |
| $500 to $799 | 9 (22.5%) | 0 (0.0%) |
| $800 to $999 | 2 (5.0%) | 1 (100.0%) |
| $1,000 to $1,499 | 11 (27.5%) | 0 (0.0%) |
| $1,500 to $1,999 | 7 (17.5%) | 0 (0.0%) |
| $2,000 to $2,499 | 0 (0.0%) | 0 (0.0%) |
| $2,500 to $2,999 | 0 (0.0%) | 0 (0.0%) |
| $3,000 or more | 0 (0.0%) | 0 (0.0%) |
| Total | 40 (100.0%) | 1 (100.0%) |
Physical Housing Characteristics in Jeisyville
Housing Structures in Jeisyville
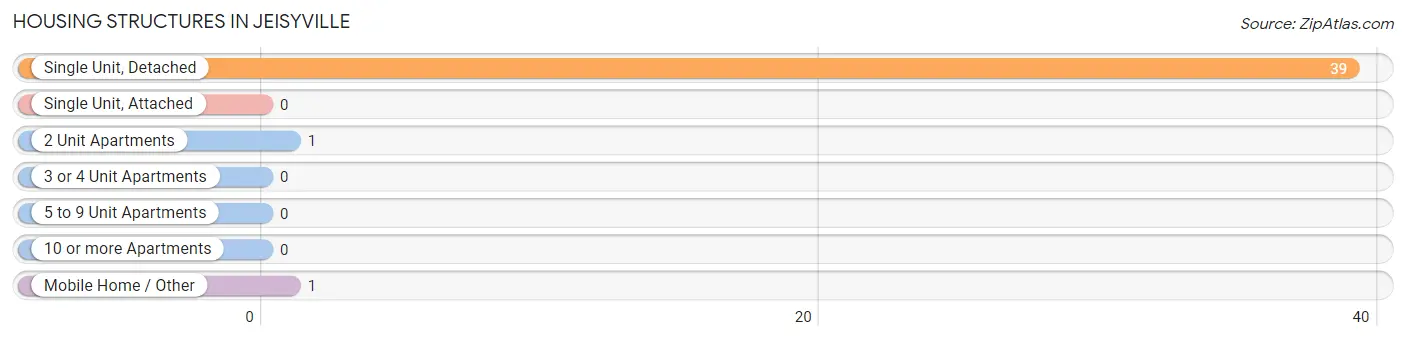
| Structure Type | # Housing Units | % Housing Units |
| Single Unit, Detached | 39 | 95.1% |
| Single Unit, Attached | 0 | 0.0% |
| 2 Unit Apartments | 1 | 2.4% |
| 3 or 4 Unit Apartments | 0 | 0.0% |
| 5 to 9 Unit Apartments | 0 | 0.0% |
| 10 or more Apartments | 0 | 0.0% |
| Mobile Home / Other | 1 | 2.4% |
| Total | 41 | 100.0% |
Housing Structures by Occupancy in Jeisyville
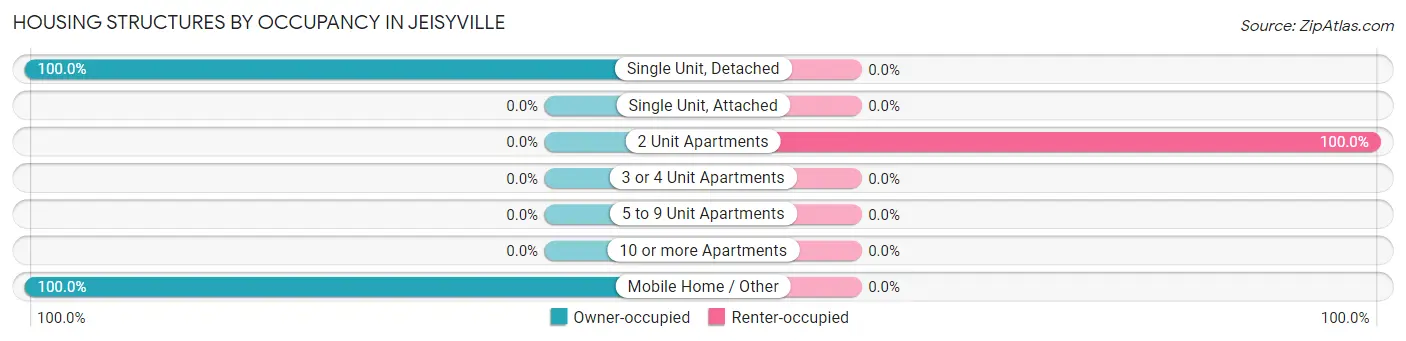
| Structure Type | Owner-occupied | Renter-occupied |
| Single Unit, Detached | 39 (100.0%) | 0 (0.0%) |
| Single Unit, Attached | 0 (0.0%) | 0 (0.0%) |
| 2 Unit Apartments | 0 (0.0%) | 1 (100.0%) |
| 3 or 4 Unit Apartments | 0 (0.0%) | 0 (0.0%) |
| 5 to 9 Unit Apartments | 0 (0.0%) | 0 (0.0%) |
| 10 or more Apartments | 0 (0.0%) | 0 (0.0%) |
| Mobile Home / Other | 1 (100.0%) | 0 (0.0%) |
| Total | 40 (97.6%) | 1 (2.4%) |
Housing Structures by Number of Rooms in Jeisyville
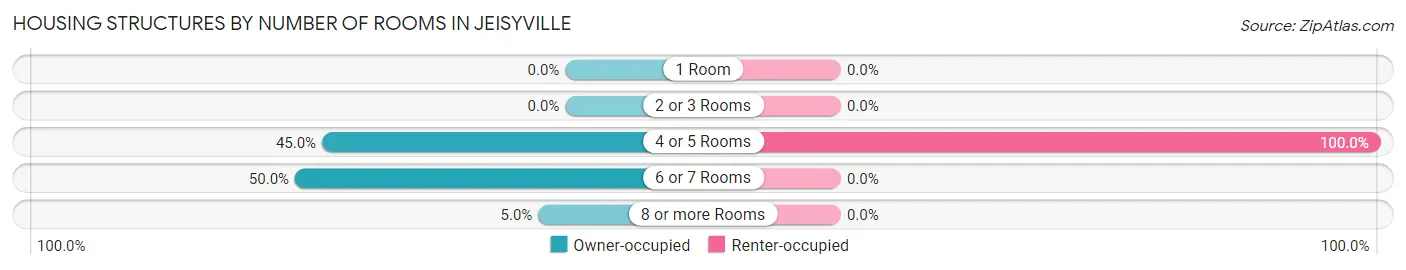
| Number of Rooms | Owner-occupied | Renter-occupied |
| 1 Room | 0 (0.0%) | 0 (0.0%) |
| 2 or 3 Rooms | 0 (0.0%) | 0 (0.0%) |
| 4 or 5 Rooms | 18 (45.0%) | 1 (100.0%) |
| 6 or 7 Rooms | 20 (50.0%) | 0 (0.0%) |
| 8 or more Rooms | 2 (5.0%) | 0 (0.0%) |
| Total | 40 (100.0%) | 1 (100.0%) |
Housing Structure by Heating Type in Jeisyville
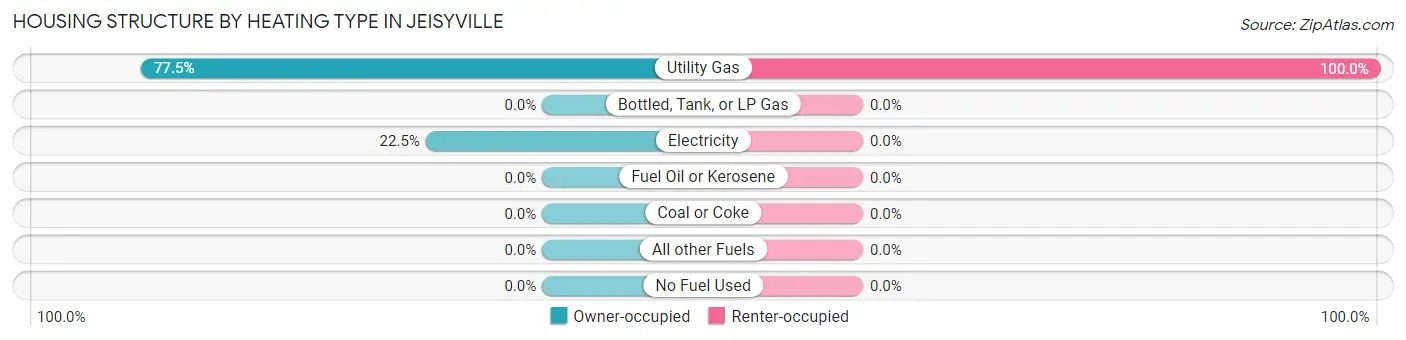
| Heating Type | Owner-occupied | Renter-occupied |
| Utility Gas | 31 (77.5%) | 1 (100.0%) |
| Bottled, Tank, or LP Gas | 0 (0.0%) | 0 (0.0%) |
| Electricity | 9 (22.5%) | 0 (0.0%) |
| Fuel Oil or Kerosene | 0 (0.0%) | 0 (0.0%) |
| Coal or Coke | 0 (0.0%) | 0 (0.0%) |
| All other Fuels | 0 (0.0%) | 0 (0.0%) |
| No Fuel Used | 0 (0.0%) | 0 (0.0%) |
| Total | 40 (100.0%) | 1 (100.0%) |
Household Vehicle Usage in Jeisyville
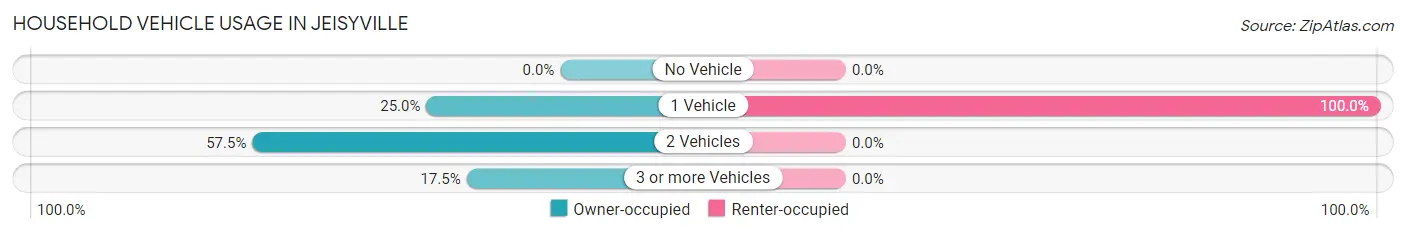
| Vehicles per Household | Owner-occupied | Renter-occupied |
| No Vehicle | 0 (0.0%) | 0 (0.0%) |
| 1 Vehicle | 10 (25.0%) | 1 (100.0%) |
| 2 Vehicles | 23 (57.5%) | 0 (0.0%) |
| 3 or more Vehicles | 7 (17.5%) | 0 (0.0%) |
| Total | 40 (100.0%) | 1 (100.0%) |
Real Estate & Mortgages in Jeisyville
Real Estate and Mortgage Overview in Jeisyville
| Characteristic | Without Mortgage | With Mortgage |
| Housing Units | 16 | 24 |
| Median Property Value | - | - |
| Median Household Income | - | - |
| Monthly Housing Costs | $338 | $0 |
| Real Estate Taxes | $943 | $0 |
Property Value by Mortgage Status in Jeisyville
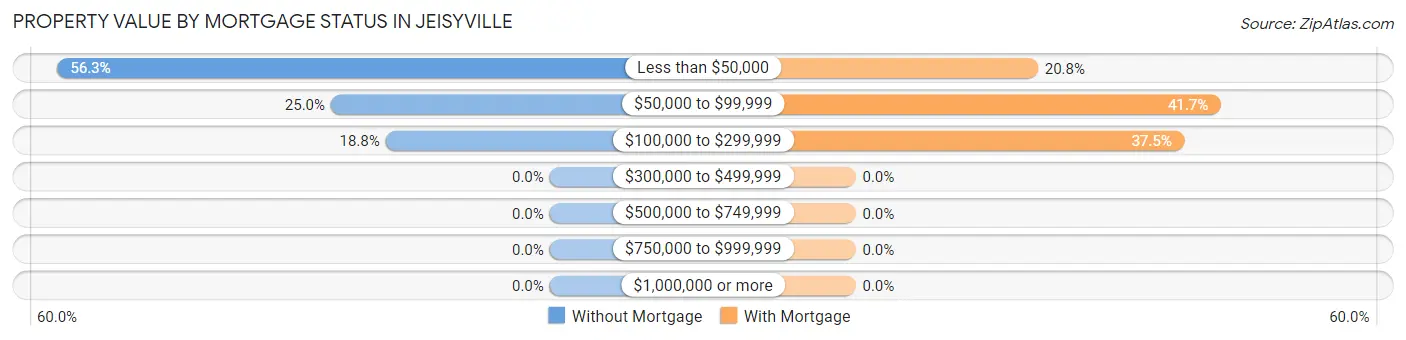
| Property Value | Without Mortgage | With Mortgage |
| Less than $50,000 | 9 (56.2%) | 5 (20.8%) |
| $50,000 to $99,999 | 4 (25.0%) | 10 (41.7%) |
| $100,000 to $299,999 | 3 (18.8%) | 9 (37.5%) |
| $300,000 to $499,999 | 0 (0.0%) | 0 (0.0%) |
| $500,000 to $749,999 | 0 (0.0%) | 0 (0.0%) |
| $750,000 to $999,999 | 0 (0.0%) | 0 (0.0%) |
| $1,000,000 or more | 0 (0.0%) | 0 (0.0%) |
| Total | 16 (100.0%) | 24 (100.0%) |
Household Income by Mortgage Status in Jeisyville
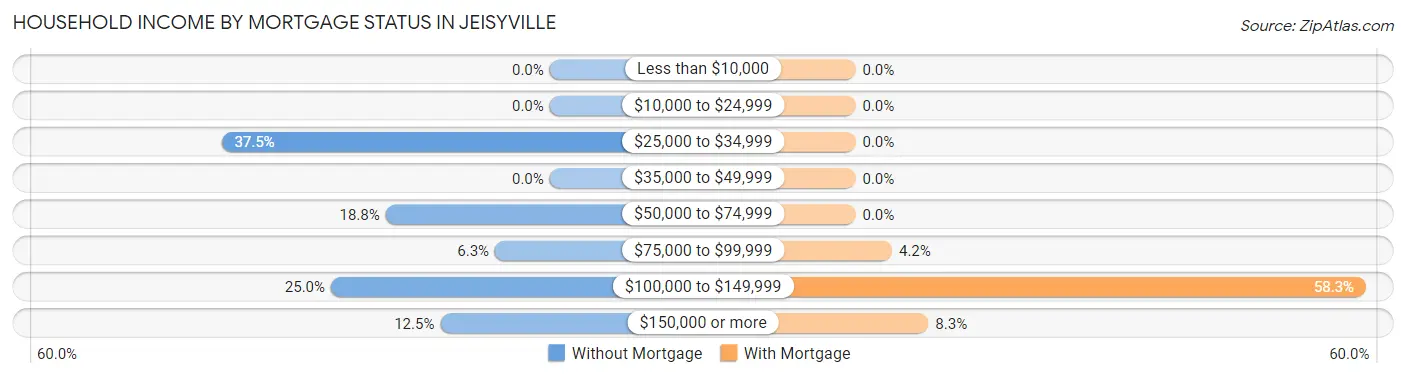
| Household Income | Without Mortgage | With Mortgage |
| Less than $10,000 | 0 (0.0%) | 0 (0.0%) |
| $10,000 to $24,999 | 0 (0.0%) | 0 (0.0%) |
| $25,000 to $34,999 | 6 (37.5%) | 0 (0.0%) |
| $35,000 to $49,999 | 0 (0.0%) | 0 (0.0%) |
| $50,000 to $74,999 | 3 (18.8%) | 0 (0.0%) |
| $75,000 to $99,999 | 1 (6.2%) | 1 (4.2%) |
| $100,000 to $149,999 | 4 (25.0%) | 14 (58.3%) |
| $150,000 or more | 2 (12.5%) | 2 (8.3%) |
| Total | 16 (100.0%) | 24 (100.0%) |
Property Value to Household Income Ratio in Jeisyville
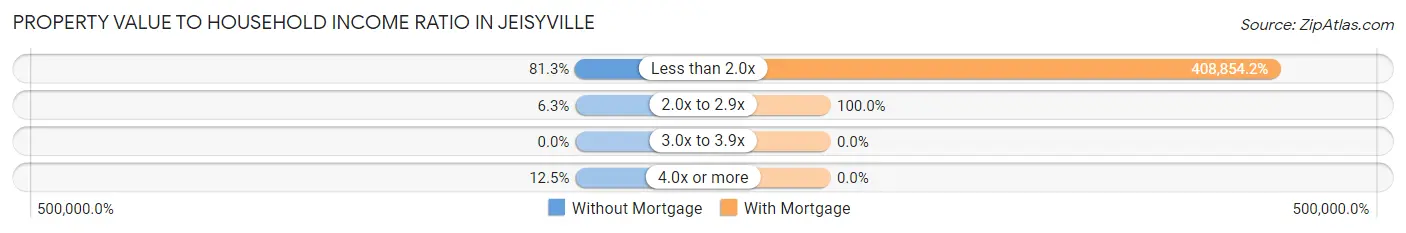
| Value-to-Income Ratio | Without Mortgage | With Mortgage |
| Less than 2.0x | 13 (81.2%) | 98,125 (408,854.2%) |
| 2.0x to 2.9x | 1 (6.2%) | 24 (100.0%) |
| 3.0x to 3.9x | 0 (0.0%) | 0 (0.0%) |
| 4.0x or more | 2 (12.5%) | 0 (0.0%) |
| Total | 16 (100.0%) | 24 (100.0%) |
Real Estate Taxes by Mortgage Status in Jeisyville
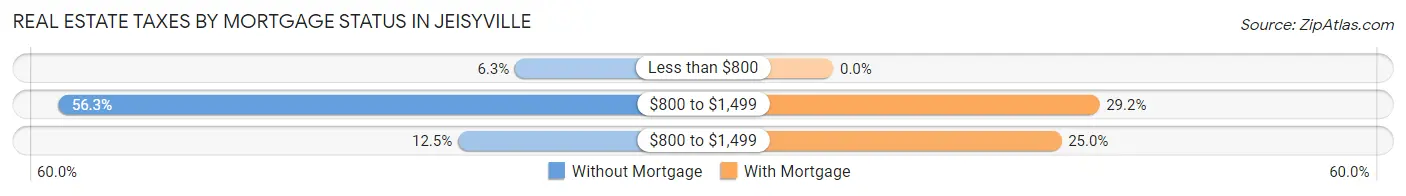
| Property Taxes | Without Mortgage | With Mortgage |
| Less than $800 | 1 (6.2%) | 0 (0.0%) |
| $800 to $1,499 | 9 (56.2%) | 7 (29.2%) |
| $800 to $1,499 | 2 (12.5%) | 6 (25.0%) |
| Total | 16 (100.0%) | 24 (100.0%) |
Health & Disability in Jeisyville
Health Insurance Coverage by Age in Jeisyville
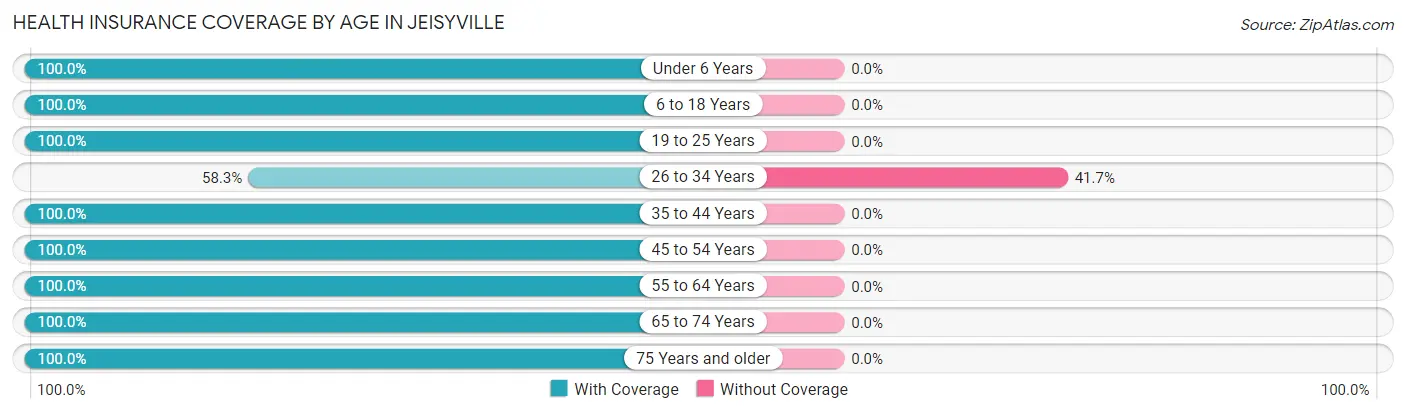
| Age Bracket | With Coverage | Without Coverage |
| Under 6 Years | 2 (100.0%) | 0 (0.0%) |
| 6 to 18 Years | 29 (100.0%) | 0 (0.0%) |
| 19 to 25 Years | 5 (100.0%) | 0 (0.0%) |
| 26 to 34 Years | 7 (58.3%) | 5 (41.7%) |
| 35 to 44 Years | 8 (100.0%) | 0 (0.0%) |
| 45 to 54 Years | 11 (100.0%) | 0 (0.0%) |
| 55 to 64 Years | 6 (100.0%) | 0 (0.0%) |
| 65 to 74 Years | 13 (100.0%) | 0 (0.0%) |
| 75 Years and older | 6 (100.0%) | 0 (0.0%) |
| Total | 87 (94.6%) | 5 (5.4%) |
Health Insurance Coverage by Citizenship Status in Jeisyville
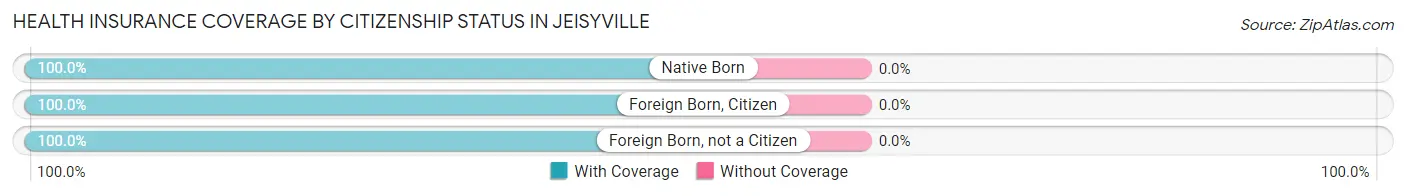
| Citizenship Status | With Coverage | Without Coverage |
| Native Born | 2 (100.0%) | 0 (0.0%) |
| Foreign Born, Citizen | 29 (100.0%) | 0 (0.0%) |
| Foreign Born, not a Citizen | 5 (100.0%) | 0 (0.0%) |
Health Insurance Coverage by Household Income in Jeisyville
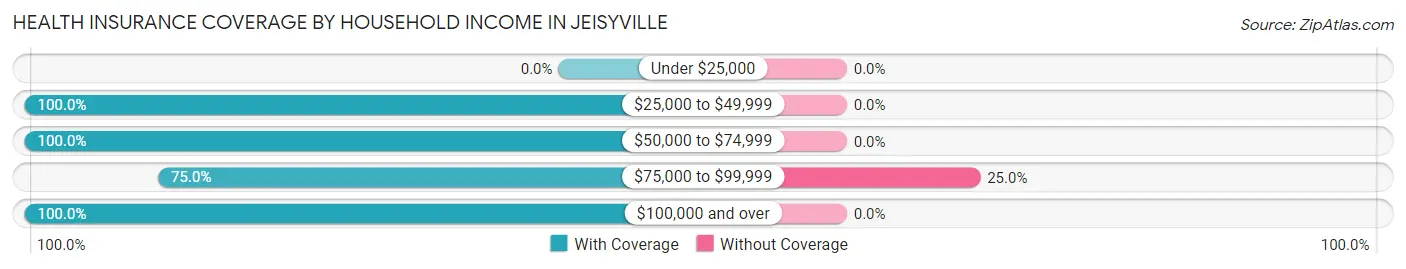
| Household Income | With Coverage | Without Coverage |
| Under $25,000 | 0 (0.0%) | 0 (0.0%) |
| $25,000 to $49,999 | 7 (100.0%) | 0 (0.0%) |
| $50,000 to $74,999 | 13 (100.0%) | 0 (0.0%) |
| $75,000 to $99,999 | 15 (75.0%) | 5 (25.0%) |
| $100,000 and over | 52 (100.0%) | 0 (0.0%) |
Public vs Private Health Insurance Coverage by Age in Jeisyville
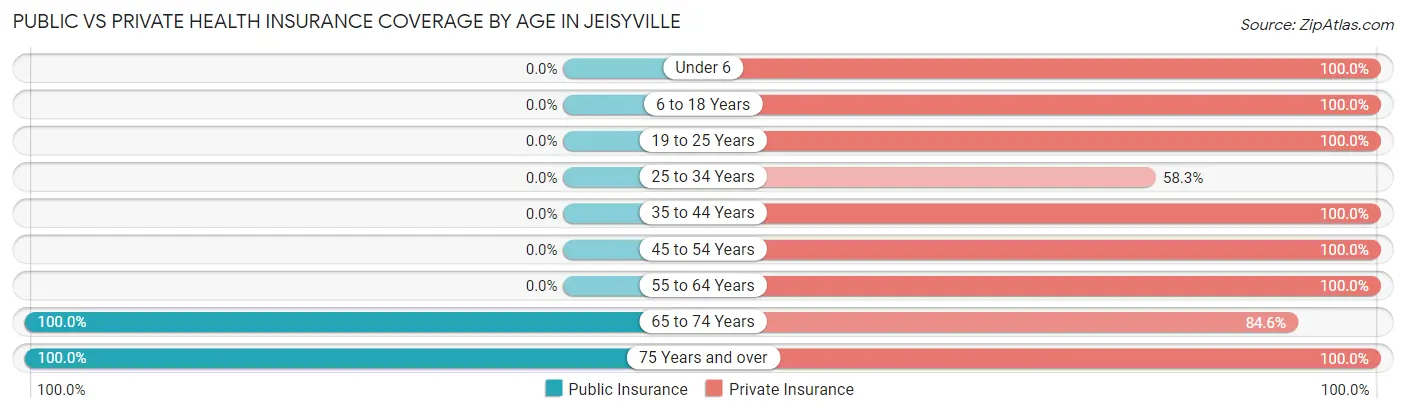
| Age Bracket | Public Insurance | Private Insurance |
| Under 6 | 0 (0.0%) | 2 (100.0%) |
| 6 to 18 Years | 0 (0.0%) | 29 (100.0%) |
| 19 to 25 Years | 0 (0.0%) | 5 (100.0%) |
| 25 to 34 Years | 0 (0.0%) | 7 (58.3%) |
| 35 to 44 Years | 0 (0.0%) | 8 (100.0%) |
| 45 to 54 Years | 0 (0.0%) | 11 (100.0%) |
| 55 to 64 Years | 0 (0.0%) | 6 (100.0%) |
| 65 to 74 Years | 13 (100.0%) | 11 (84.6%) |
| 75 Years and over | 6 (100.0%) | 6 (100.0%) |
| Total | 19 (20.6%) | 85 (92.4%) |
Disability Status by Sex by Age in Jeisyville
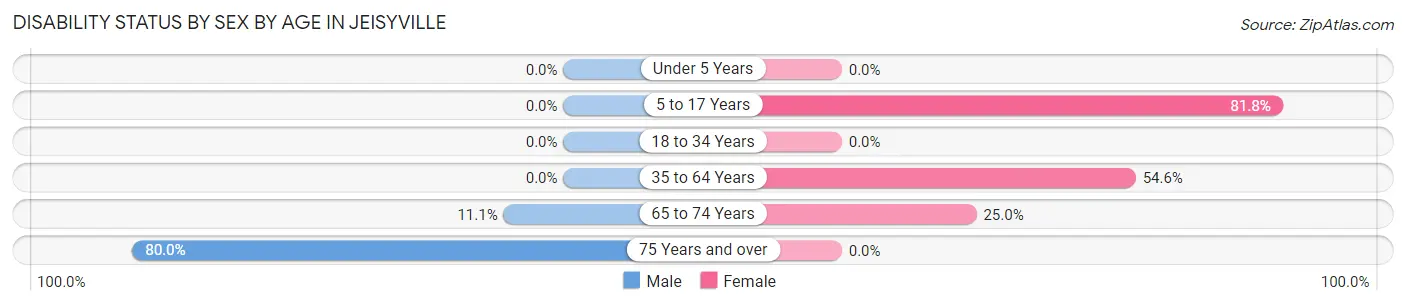
| Age Bracket | Male | Female |
| Under 5 Years | 0 (0.0%) | 0 (0.0%) |
| 5 to 17 Years | 0 (0.0%) | 18 (81.8%) |
| 18 to 34 Years | 0 (0.0%) | 0 (0.0%) |
| 35 to 64 Years | 0 (0.0%) | 6 (54.5%) |
| 65 to 74 Years | 1 (11.1%) | 1 (25.0%) |
| 75 Years and over | 4 (80.0%) | 0 (0.0%) |
Disability Class by Sex by Age in Jeisyville
Disability Class: Hearing Difficulty
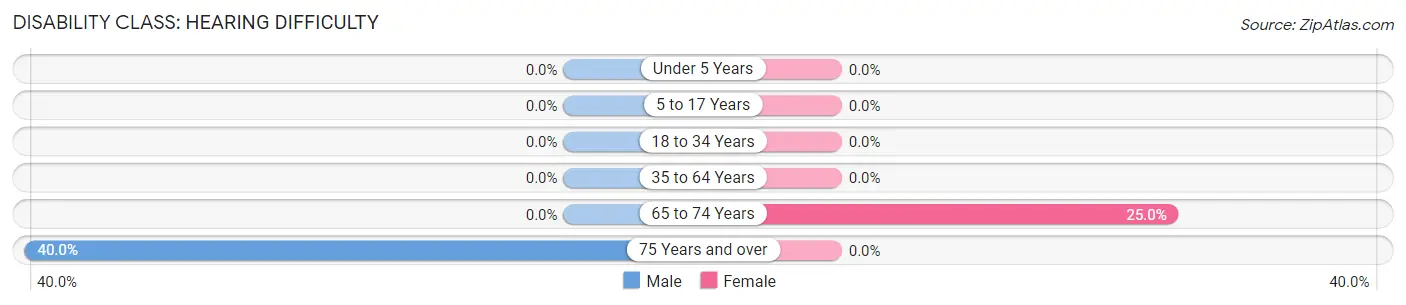
| Age Bracket | Male | Female |
| Under 5 Years | 0 (0.0%) | 0 (0.0%) |
| 5 to 17 Years | 0 (0.0%) | 0 (0.0%) |
| 18 to 34 Years | 0 (0.0%) | 0 (0.0%) |
| 35 to 64 Years | 0 (0.0%) | 0 (0.0%) |
| 65 to 74 Years | 0 (0.0%) | 1 (25.0%) |
| 75 Years and over | 2 (40.0%) | 0 (0.0%) |
Disability Class: Vision Difficulty
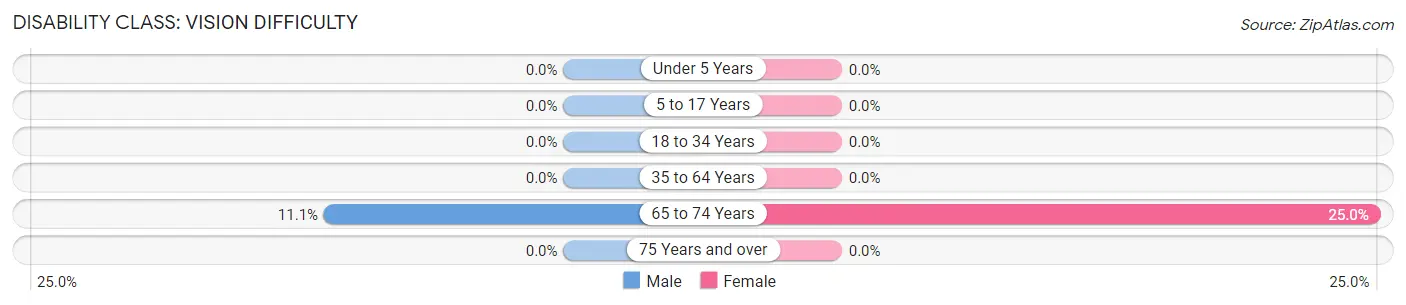
| Age Bracket | Male | Female |
| Under 5 Years | 0 (0.0%) | 0 (0.0%) |
| 5 to 17 Years | 0 (0.0%) | 0 (0.0%) |
| 18 to 34 Years | 0 (0.0%) | 0 (0.0%) |
| 35 to 64 Years | 0 (0.0%) | 0 (0.0%) |
| 65 to 74 Years | 1 (11.1%) | 1 (25.0%) |
| 75 Years and over | 0 (0.0%) | 0 (0.0%) |
Disability Class: Cognitive Difficulty
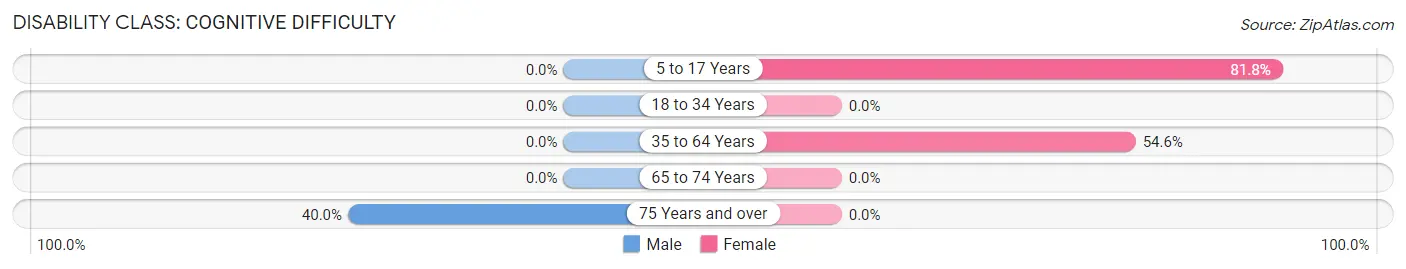
| Age Bracket | Male | Female |
| 5 to 17 Years | 0 (0.0%) | 18 (81.8%) |
| 18 to 34 Years | 0 (0.0%) | 0 (0.0%) |
| 35 to 64 Years | 0 (0.0%) | 6 (54.5%) |
| 65 to 74 Years | 0 (0.0%) | 0 (0.0%) |
| 75 Years and over | 2 (40.0%) | 0 (0.0%) |
Disability Class: Ambulatory Difficulty
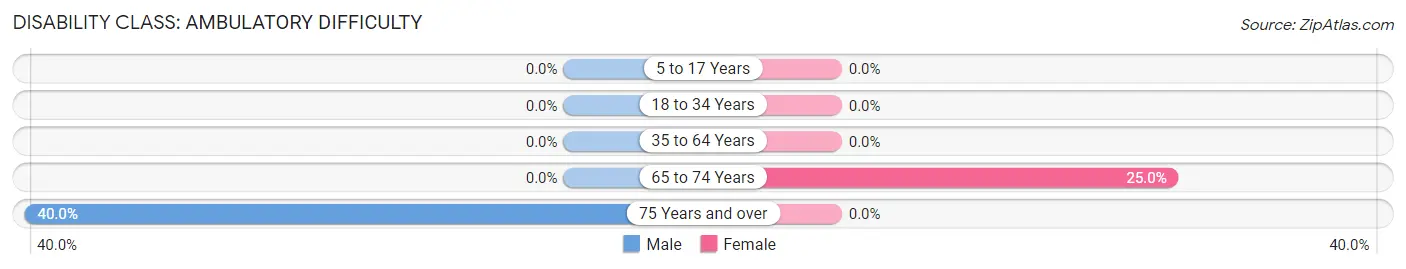
| Age Bracket | Male | Female |
| 5 to 17 Years | 0 (0.0%) | 0 (0.0%) |
| 18 to 34 Years | 0 (0.0%) | 0 (0.0%) |
| 35 to 64 Years | 0 (0.0%) | 0 (0.0%) |
| 65 to 74 Years | 0 (0.0%) | 1 (25.0%) |
| 75 Years and over | 2 (40.0%) | 0 (0.0%) |
Disability Class: Self-Care Difficulty
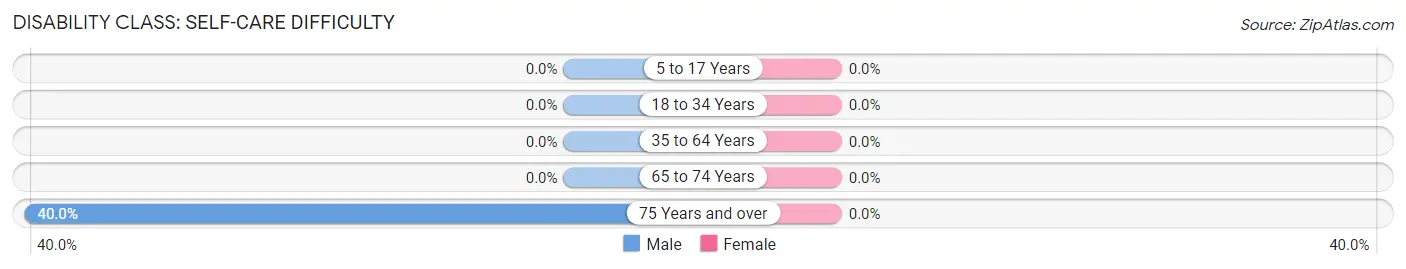
| Age Bracket | Male | Female |
| 5 to 17 Years | 0 (0.0%) | 0 (0.0%) |
| 18 to 34 Years | 0 (0.0%) | 0 (0.0%) |
| 35 to 64 Years | 0 (0.0%) | 0 (0.0%) |
| 65 to 74 Years | 0 (0.0%) | 0 (0.0%) |
| 75 Years and over | 2 (40.0%) | 0 (0.0%) |
Technology Access in Jeisyville
Computing Device Access in Jeisyville
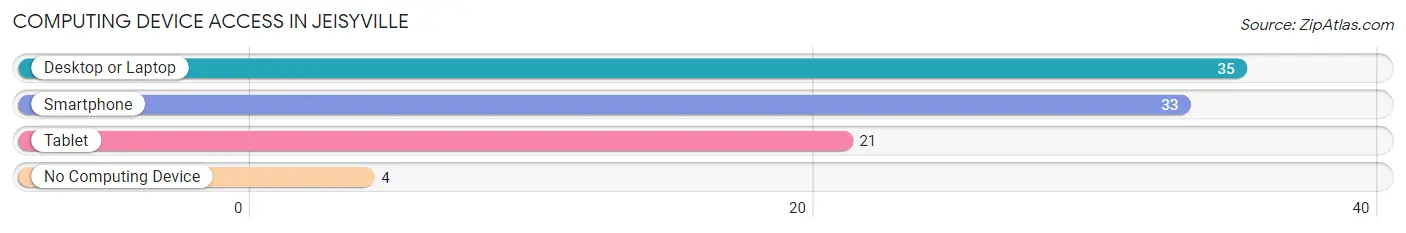
| Device Type | # Households | % Households |
| Desktop or Laptop | 35 | 85.4% |
| Smartphone | 33 | 80.5% |
| Tablet | 21 | 51.2% |
| No Computing Device | 4 | 9.8% |
| Total | 41 | 100.0% |
Internet Access in Jeisyville
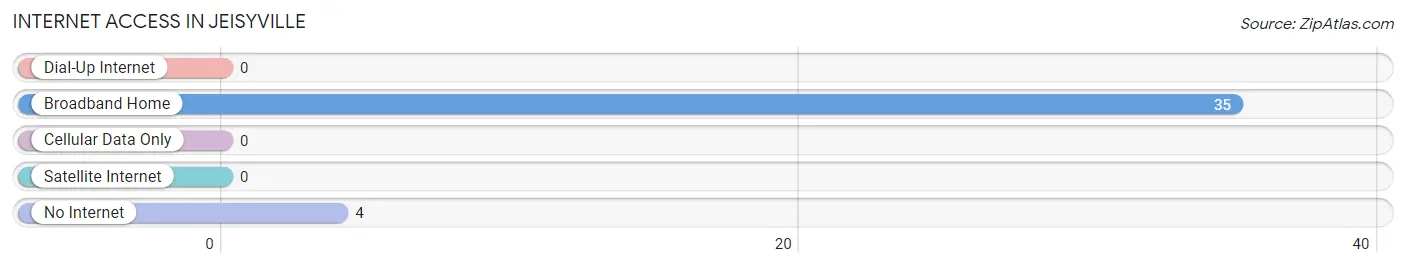
| Internet Type | # Households | % Households |
| Dial-Up Internet | 0 | 0.0% |
| Broadband Home | 35 | 85.4% |
| Cellular Data Only | 0 | 0.0% |
| Satellite Internet | 0 | 0.0% |
| No Internet | 4 | 9.8% |
| Total | 41 | 100.0% |
Jeisyville Summary
Jeisyville is a small village located in the state of Illinois, United States. It is situated in the county of Will, and is part of the Chicago metropolitan area. The village has a population of approximately 1,500 people, and is located about 30 miles southwest of Chicago.
Geography
Jeisyville is located in the northeastern part of Will County, Illinois. It is situated on the banks of the Des Plaines River, and is bordered by the towns of Homer Glen, Lockport, and Joliet. The village is located in a rural area, and is surrounded by farmland and wooded areas. The village is located at an elevation of 645 feet above sea level.
The climate in Jeisyville is classified as humid continental, with hot summers and cold winters. The average annual temperature is around 50 degrees Fahrenheit, with average highs in the summer reaching around 85 degrees Fahrenheit and average lows in the winter reaching around 20 degrees Fahrenheit. The average annual precipitation is around 40 inches.
Demographics
As of the 2010 census, the population of Jeisyville was 1,500 people. The racial makeup of the village was 97.3% White, 0.7% African American, 0.3% Native American, 0.3% Asian, 0.3% from other races, and 1.3% from two or more races. Hispanic or Latino of any race were 1.3% of the population.
The median household income in Jeisyville was $50,000, and the median family income was $54,000. The per capita income for the village was $20,000. About 8.3% of families and 10.3% of the population were below the poverty line, including 14.3% of those under age 18 and none of those age 65 or over.
Economy
The economy of Jeisyville is largely based on agriculture and small businesses. The village is home to several small businesses, including a grocery store, a hardware store, a restaurant, and a gas station. The village also has a few small manufacturing companies, as well as a few farms.
The village is also home to a few tourist attractions, including the Des Plaines River Trail, which is a popular hiking and biking trail. The village also has a few parks, including the Jeisyville Park, which features a playground, picnic areas, and a fishing pond.
Conclusion
Jeisyville is a small village located in the state of Illinois, United States. It is situated in the county of Will, and is part of the Chicago metropolitan area. The village has a population of approximately 1,500 people, and is located about 30 miles southwest of Chicago. The village is located in a rural area, and is surrounded by farmland and wooded areas. The economy of Jeisyville is largely based on agriculture and small businesses. The village is also home to a few tourist attractions, including the Des Plaines River Trail, which is a popular hiking and biking trail. The village also has a few parks, including the Jeisyville Park, which features a playground, picnic areas, and a fishing pond.
Common Questions
What is Per Capita Income in Jeisyville?
Per Capita income in Jeisyville is $44,647.
What is the Median Household income in Jeisyville?
Median Household Income in Jeisyville is $77,375.
What is Income or Wage Gap in Jeisyville?
Income or Wage Gap in Jeisyville is 29.3%.
Women in Jeisyville earn 70.7 cents for every dollar earned by a man.
What is Inequality or Gini Index in Jeisyville?
Inequality or Gini Index in Jeisyville is 0.28.
What is the Total Population of Jeisyville?
Total Population of Jeisyville is 92.
What is the Total Male Population of Jeisyville?
Total Male Population of Jeisyville is 50.
What is the Total Female Population of Jeisyville?
Total Female Population of Jeisyville is 42.
What is the Ratio of Males per 100 Females in Jeisyville?
There are 119.05 Males per 100 Females in Jeisyville.
What is the Ratio of Females per 100 Males in Jeisyville?
There are 84.00 Females per 100 Males in Jeisyville.
What is the Median Population Age in Jeisyville?
Median Population Age in Jeisyville is 33.5 Years.
What is the Average Family Size in Jeisyville
Average Family Size in Jeisyville is 3.6 People.
What is the Average Household Size in Jeisyville
Average Household Size in Jeisyville is 2.2 People.
How Large is the Labor Force in Jeisyville?
There are 52 People in the Labor Forcein in Jeisyville.
What is the Percentage of People in the Labor Force in Jeisyville?
76.5% of People are in the Labor Force in Jeisyville.