Rapids City, IL Map & Demographics
Rapids City Map
Rapids City Overview
$40,457
PER CAPITA INCOME
$115,139
AVG FAMILY INCOME
$89,500
AVG HOUSEHOLD INCOME
27.9%
WAGE / INCOME GAP [ % ]
72.1¢/ $1
WAGE / INCOME GAP [ $ ]
0.40
INEQUALITY / GINI INDEX
984
TOTAL POPULATION
482
MALE POPULATION
502
FEMALE POPULATION
96.02
MALES / 100 FEMALES
104.15
FEMALES / 100 MALES
43.8
MEDIAN AGE
2.9
AVG FAMILY SIZE
2.5
AVG HOUSEHOLD SIZE
455
LABOR FORCE [ PEOPLE ]
60.3%
PERCENT IN LABOR FORCE
4.8%
UNEMPLOYMENT RATE
Rapids City Zip Codes
Rapids City Area Codes
Income in Rapids City
Income Overview in Rapids City
Per Capita Income in Rapids City is $40,457, while median incomes of families and households are $115,139 and $89,500 respectively.
| Characteristic | Number | Measure |
| Per Capita Income | 984 | $40,457 |
| Median Family Income | 309 | $115,139 |
| Mean Family Income | 309 | $125,847 |
| Median Household Income | 388 | $89,500 |
| Mean Household Income | 388 | $106,924 |
| Income Deficit | 309 | $0 |
| Wage / Income Gap (%) | 984 | 27.88% |
| Wage / Income Gap ($) | 984 | 72.12¢ per $1 |
| Gini / Inequality Index | 984 | 0.40 |
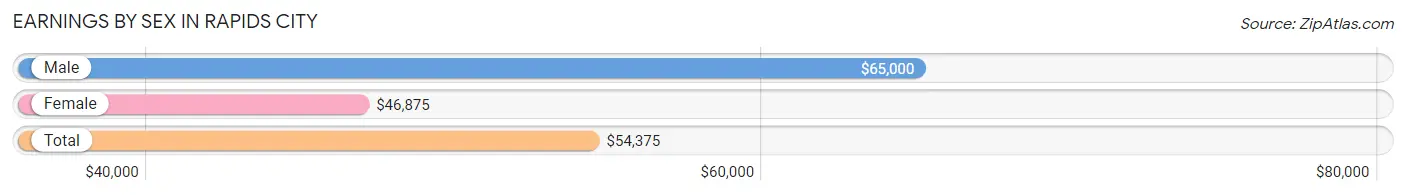
Earnings by Sex in Rapids City
Average Earnings in Rapids City are $54,375, $65,000 for men and $46,875 for women, a difference of 27.9%.
| Sex | Number | Average Earnings |
| Male | 234 (51.5%) | $65,000 |
| Female | 220 (48.5%) | $46,875 |
| Total | 454 (100.0%) | $54,375 |
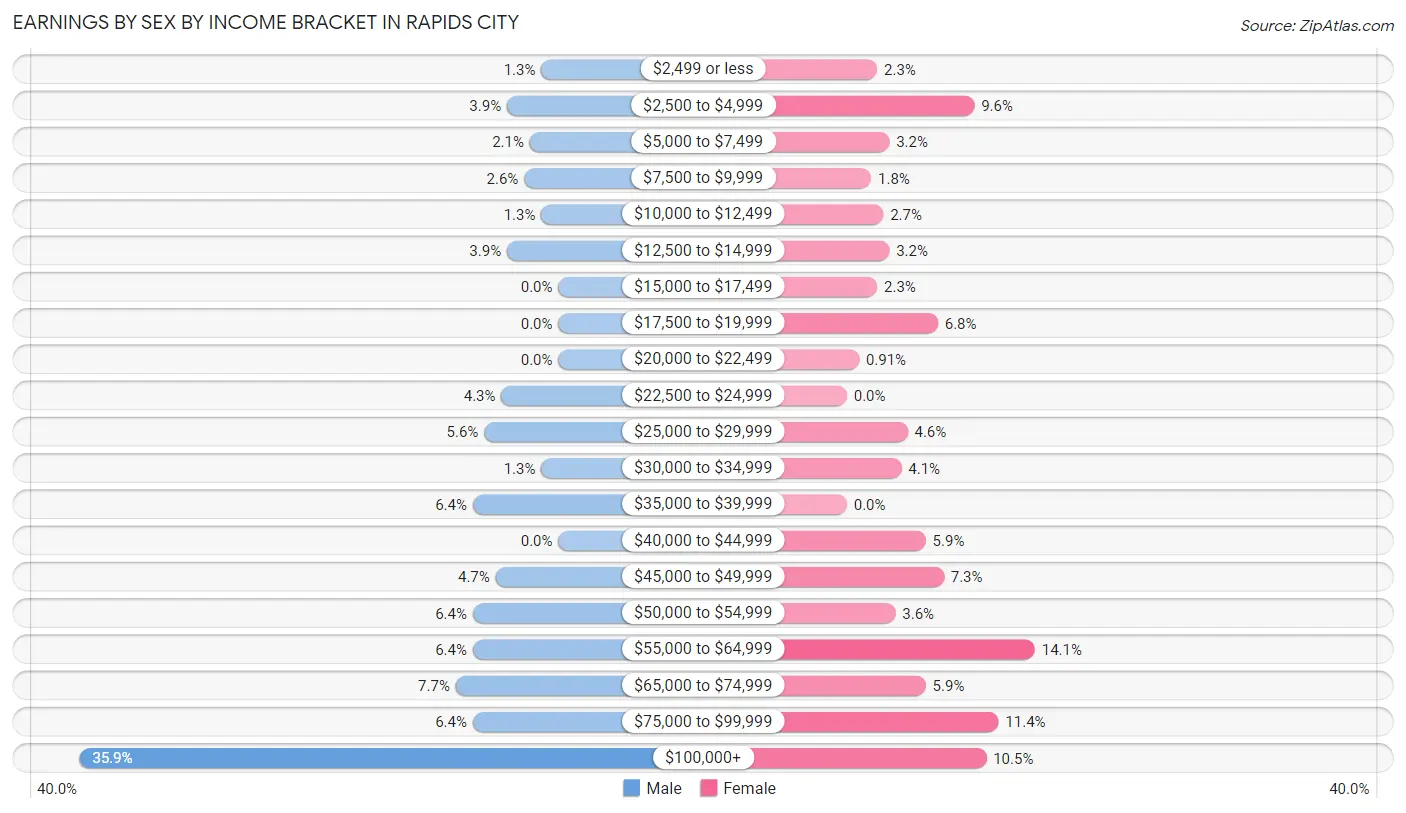
Earnings by Sex by Income Bracket in Rapids City
The most common earnings brackets in Rapids City are $100,000+ for men (84 | 35.9%) and $55,000 to $64,999 for women (31 | 14.1%).
| Income | Male | Female |
| $2,499 or less | 3 (1.3%) | 5 (2.3%) |
| $2,500 to $4,999 | 9 (3.8%) | 21 (9.6%) |
| $5,000 to $7,499 | 5 (2.1%) | 7 (3.2%) |
| $7,500 to $9,999 | 6 (2.6%) | 4 (1.8%) |
| $10,000 to $12,499 | 3 (1.3%) | 6 (2.7%) |
| $12,500 to $14,999 | 9 (3.8%) | 7 (3.2%) |
| $15,000 to $17,499 | 0 (0.0%) | 5 (2.3%) |
| $17,500 to $19,999 | 0 (0.0%) | 15 (6.8%) |
| $20,000 to $22,499 | 0 (0.0%) | 2 (0.9%) |
| $22,500 to $24,999 | 10 (4.3%) | 0 (0.0%) |
| $25,000 to $29,999 | 13 (5.6%) | 10 (4.5%) |
| $30,000 to $34,999 | 3 (1.3%) | 9 (4.1%) |
| $35,000 to $39,999 | 15 (6.4%) | 0 (0.0%) |
| $40,000 to $44,999 | 0 (0.0%) | 13 (5.9%) |
| $45,000 to $49,999 | 11 (4.7%) | 16 (7.3%) |
| $50,000 to $54,999 | 15 (6.4%) | 8 (3.6%) |
| $55,000 to $64,999 | 15 (6.4%) | 31 (14.1%) |
| $65,000 to $74,999 | 18 (7.7%) | 13 (5.9%) |
| $75,000 to $99,999 | 15 (6.4%) | 25 (11.4%) |
| $100,000+ | 84 (35.9%) | 23 (10.4%) |
| Total | 234 (100.0%) | 220 (100.0%) |
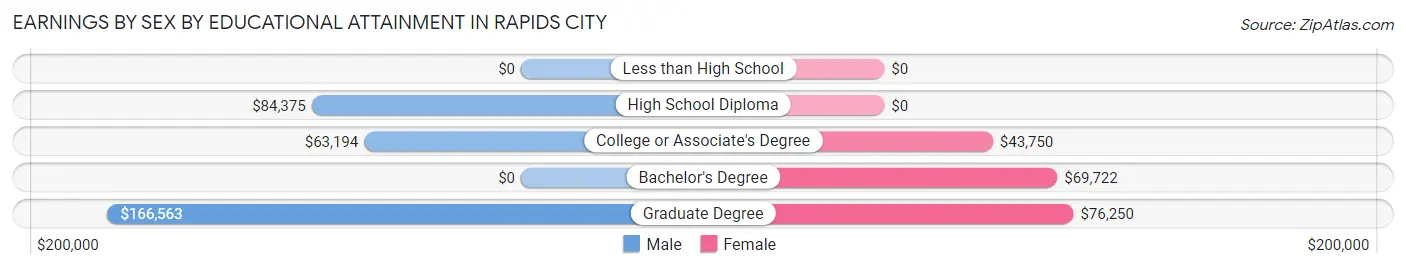
Earnings by Sex by Educational Attainment in Rapids City
Average earnings in Rapids City are $86,250 for men and $49,063 for women, a difference of 43.1%. Men with an educational attainment of graduate degree enjoy the highest average annual earnings of $166,563, while those with college or associate's degree education earn the least with $63,194. Women with an educational attainment of graduate degree earn the most with the average annual earnings of $76,250, while those with college or associate's degree education have the smallest earnings of $43,750.
| Educational Attainment | Male Income | Female Income |
| Less than High School | - | - |
| High School Diploma | $84,375 | $0 |
| College or Associate's Degree | $63,194 | $43,750 |
| Bachelor's Degree | - | - |
| Graduate Degree | $166,563 | $76,250 |
| Total | $86,250 | $49,063 |
Family Income in Rapids City
Family Income Brackets in Rapids City
According to the Rapids City family income data, there are 82 families falling into the $100,000 to $149,999 income range, which is the most common income bracket and makes up 26.5% of all families.
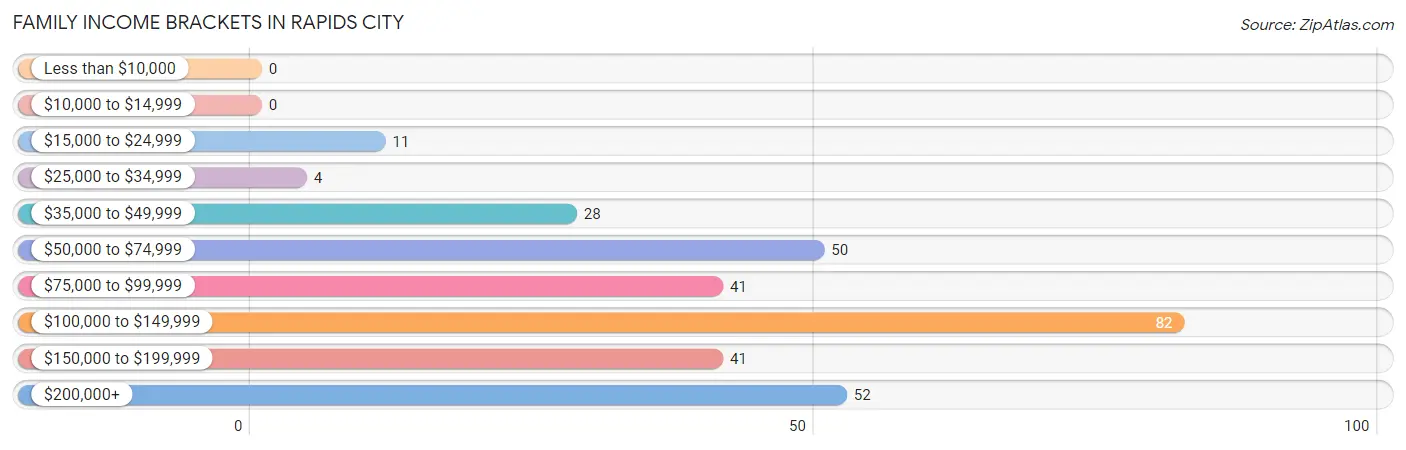
| Income Bracket | # Families | % Families |
| Less than $10,000 | 0 | 0.0% |
| $10,000 to $14,999 | 0 | 0.0% |
| $15,000 to $24,999 | 11 | 3.6% |
| $25,000 to $34,999 | 4 | 1.3% |
| $35,000 to $49,999 | 28 | 9.1% |
| $50,000 to $74,999 | 50 | 16.2% |
| $75,000 to $99,999 | 41 | 13.3% |
| $100,000 to $149,999 | 82 | 26.5% |
| $150,000 to $199,999 | 41 | 13.3% |
| $200,000+ | 52 | 16.8% |
Family Income by Famaliy Size in Rapids City
6-person families (11 | 3.6%) account for the highest median family income in Rapids City with $164,464 per family, while 2-person families (155 | 50.2%) have the highest median income of $45,375 per family member.
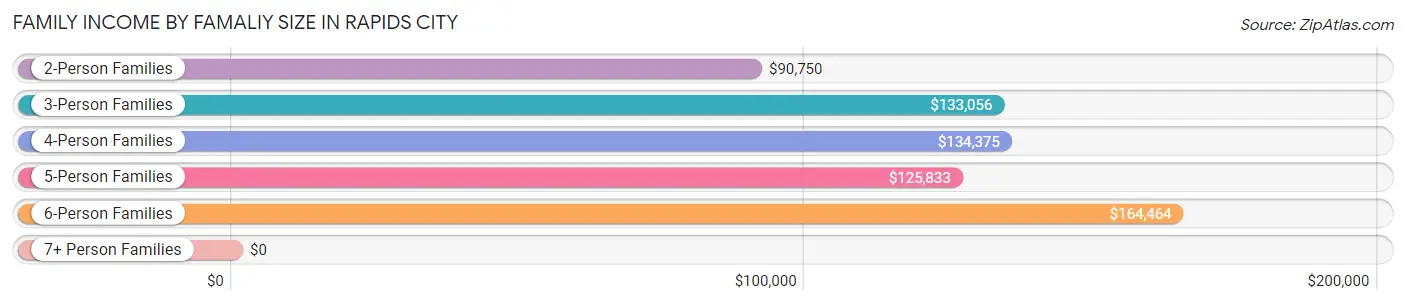
| Income Bracket | # Families | Median Income |
| 2-Person Families | 155 (50.2%) | $90,750 |
| 3-Person Families | 60 (19.4%) | $133,056 |
| 4-Person Families | 69 (22.3%) | $134,375 |
| 5-Person Families | 14 (4.5%) | $125,833 |
| 6-Person Families | 11 (3.6%) | $164,464 |
| 7+ Person Families | 0 (0.0%) | $0 |
| Total | 309 (100.0%) | $115,139 |
Family Income by Number of Earners in Rapids City
The median family income in Rapids City is $115,139, with families comprising 3+ earners (15) having the highest median family income of $215,250, while families with 1 earner (92) have the lowest median family income of $70,625, accounting for 4.9% and 29.8% of families, respectively.
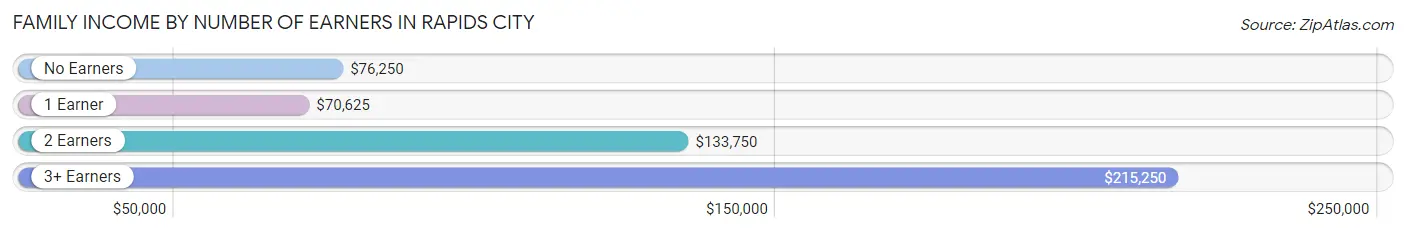
| Number of Earners | # Families | Median Income |
| No Earners | 46 (14.9%) | $76,250 |
| 1 Earner | 92 (29.8%) | $70,625 |
| 2 Earners | 156 (50.5%) | $133,750 |
| 3+ Earners | 15 (4.9%) | $215,250 |
| Total | 309 (100.0%) | $115,139 |
Household Income in Rapids City
Household Income Brackets in Rapids City
With 84 households falling in the category, the $100,000 to $149,999 income range is the most frequent in Rapids City, accounting for 21.6% of all households. In contrast, only 10 households (2.6%) fall into the $25,000 to $34,999 income bracket, making it the least populous group.
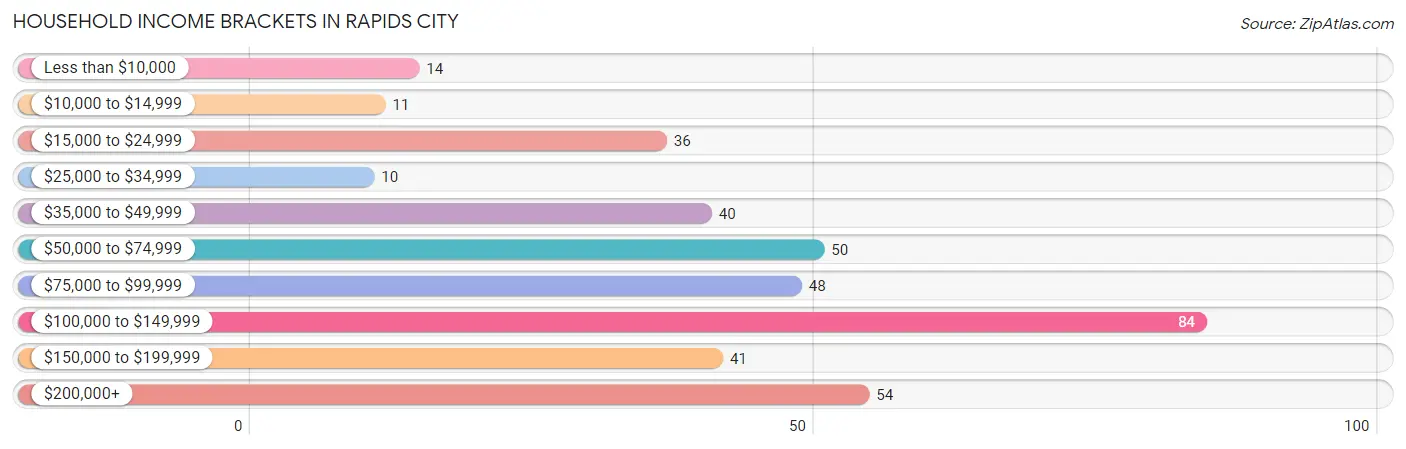
| Income Bracket | # Households | % Households |
| Less than $10,000 | 14 | 3.6% |
| $10,000 to $14,999 | 11 | 2.8% |
| $15,000 to $24,999 | 36 | 9.3% |
| $25,000 to $34,999 | 10 | 2.6% |
| $35,000 to $49,999 | 40 | 10.3% |
| $50,000 to $74,999 | 50 | 12.9% |
| $75,000 to $99,999 | 48 | 12.4% |
| $100,000 to $149,999 | 84 | 21.6% |
| $150,000 to $199,999 | 41 | 10.6% |
| $200,000+ | 54 | 13.9% |
Household Income by Householder Age in Rapids City
The median household income in Rapids City is $89,500, with the highest median household income of $133,672 found in the 25 to 44 years age bracket for the primary householder. A total of 119 households (30.7%) fall into this category. Meanwhile, the 15 to 24 years age bracket for the primary householder has the lowest median household income of $0, with 10 households (2.6%) in this group.
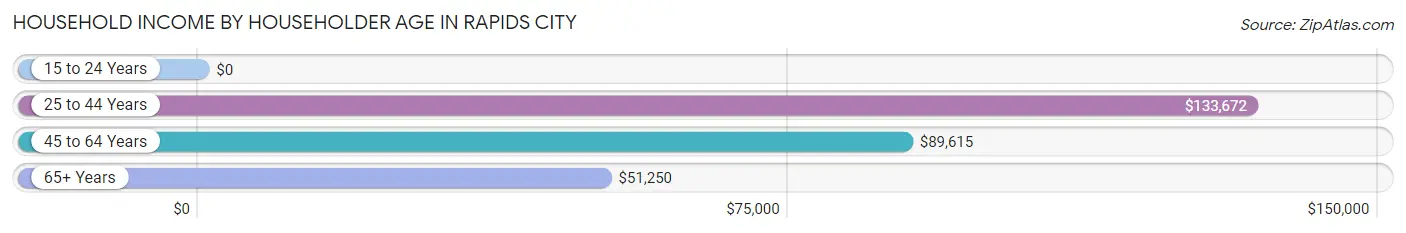
| Income Bracket | # Households | Median Income |
| 15 to 24 Years | 10 (2.6%) | $0 |
| 25 to 44 Years | 119 (30.7%) | $133,672 |
| 45 to 64 Years | 114 (29.4%) | $89,615 |
| 65+ Years | 145 (37.4%) | $51,250 |
| Total | 388 (100.0%) | $89,500 |
Poverty in Rapids City
Income Below Poverty by Sex and Age in Rapids City
With 7.0% poverty level for males and 5.2% for females among the residents of Rapids City, 45 to 54 year old males and 18 to 24 year old females are the most vulnerable to poverty, with 12 males (31.6%) and 8 females (34.8%) in their respective age groups living below the poverty level.
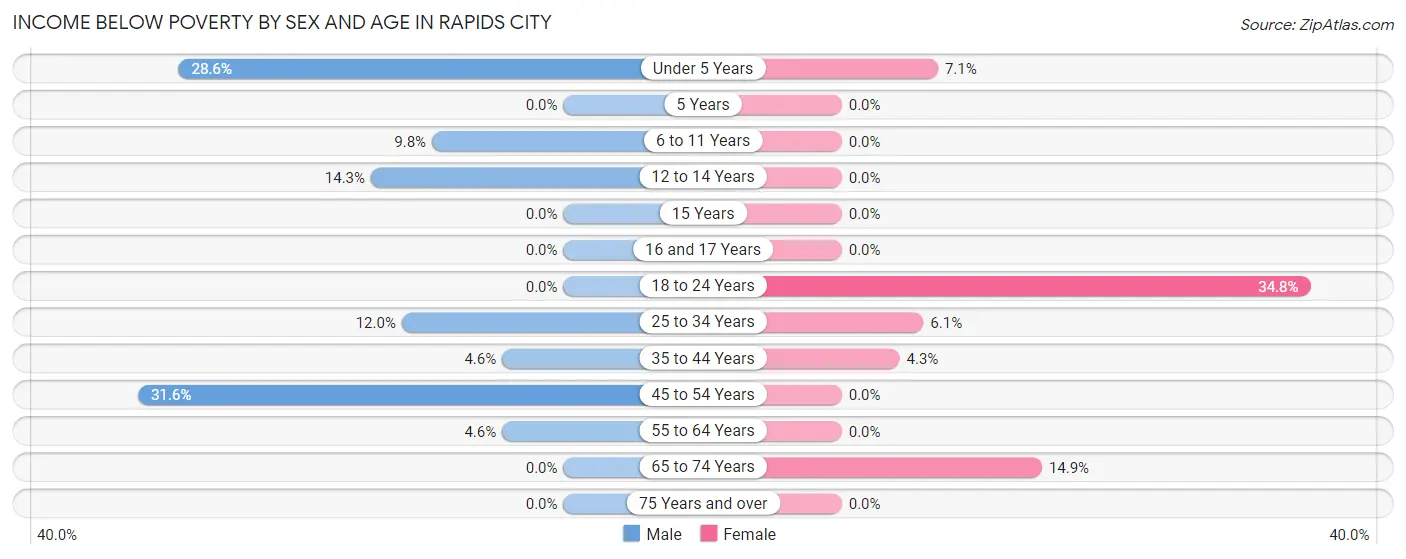
| Age Bracket | Male | Female |
| Under 5 Years | 2 (28.6%) | 2 (7.1%) |
| 5 Years | 0 (0.0%) | 0 (0.0%) |
| 6 to 11 Years | 8 (9.8%) | 0 (0.0%) |
| 12 to 14 Years | 3 (14.3%) | 0 (0.0%) |
| 15 Years | 0 (0.0%) | 0 (0.0%) |
| 16 and 17 Years | 0 (0.0%) | 0 (0.0%) |
| 18 to 24 Years | 0 (0.0%) | 8 (34.8%) |
| 25 to 34 Years | 3 (12.0%) | 2 (6.1%) |
| 35 to 44 Years | 3 (4.5%) | 3 (4.3%) |
| 45 to 54 Years | 12 (31.6%) | 0 (0.0%) |
| 55 to 64 Years | 3 (4.5%) | 0 (0.0%) |
| 65 to 74 Years | 0 (0.0%) | 11 (14.9%) |
| 75 Years and over | 0 (0.0%) | 0 (0.0%) |
| Total | 34 (7.0%) | 26 (5.2%) |
Income Above Poverty by Sex and Age in Rapids City
According to the poverty statistics in Rapids City, males aged 5 years and females aged 5 years are the age groups that are most secure financially, with 100.0% of males and 100.0% of females in these age groups living above the poverty line.
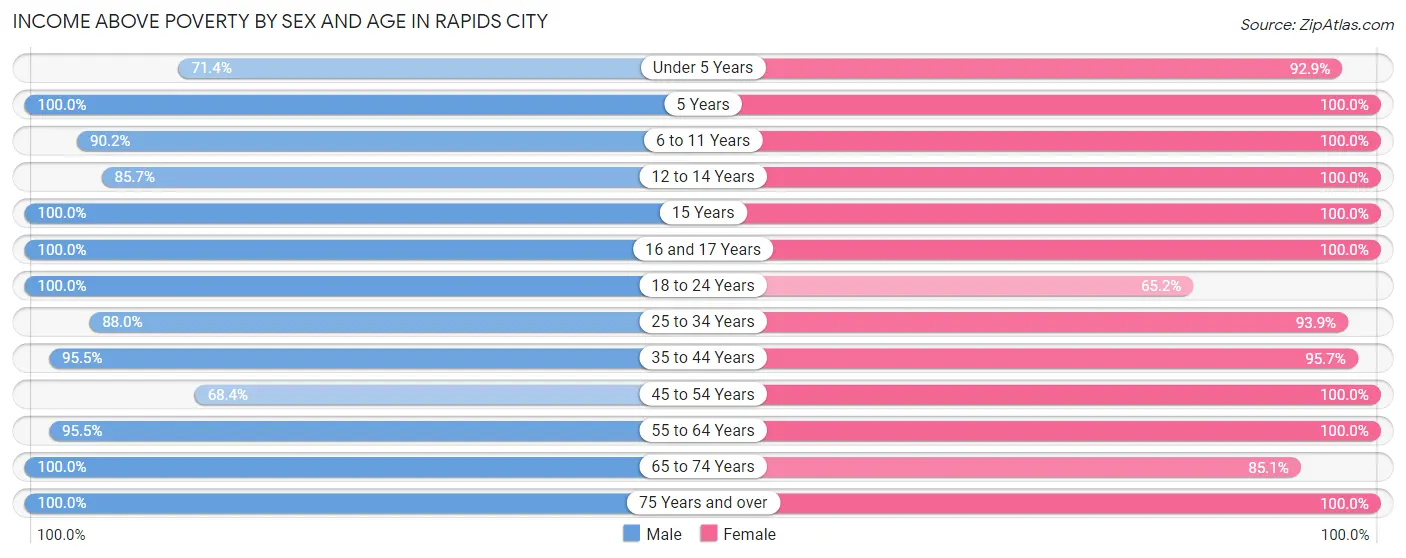
| Age Bracket | Male | Female |
| Under 5 Years | 5 (71.4%) | 26 (92.9%) |
| 5 Years | 2 (100.0%) | 4 (100.0%) |
| 6 to 11 Years | 74 (90.2%) | 41 (100.0%) |
| 12 to 14 Years | 18 (85.7%) | 13 (100.0%) |
| 15 Years | 15 (100.0%) | 16 (100.0%) |
| 16 and 17 Years | 2 (100.0%) | 14 (100.0%) |
| 18 to 24 Years | 44 (100.0%) | 15 (65.2%) |
| 25 to 34 Years | 22 (88.0%) | 31 (93.9%) |
| 35 to 44 Years | 63 (95.5%) | 67 (95.7%) |
| 45 to 54 Years | 26 (68.4%) | 43 (100.0%) |
| 55 to 64 Years | 63 (95.5%) | 97 (100.0%) |
| 65 to 74 Years | 89 (100.0%) | 63 (85.1%) |
| 75 Years and over | 25 (100.0%) | 46 (100.0%) |
| Total | 448 (92.9%) | 476 (94.8%) |
Income Below Poverty Among Married-Couple Families in Rapids City
The poverty statistics for married-couple families in Rapids City show that 1.2% or 3 of the total 248 families live below the poverty line. Families with 3 or 4 children have the highest poverty rate of 13.0%, comprising of 3 families. On the other hand, families with no children have the lowest poverty rate of 0.0%, which includes 0 families.
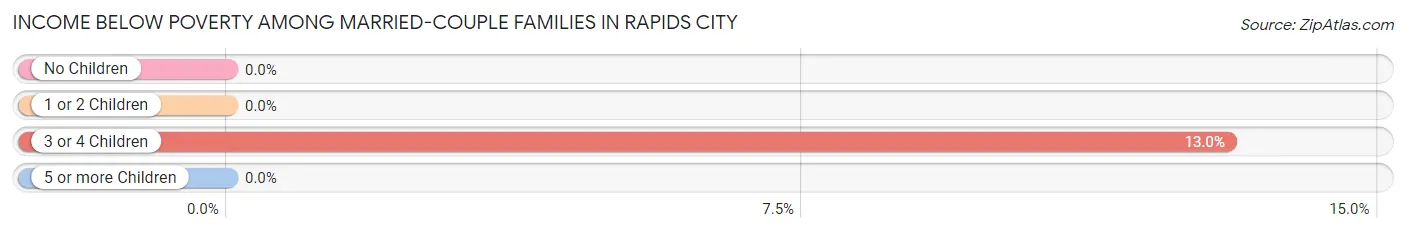
| Children | Above Poverty | Below Poverty |
| No Children | 175 (100.0%) | 0 (0.0%) |
| 1 or 2 Children | 50 (100.0%) | 0 (0.0%) |
| 3 or 4 Children | 20 (87.0%) | 3 (13.0%) |
| 5 or more Children | 0 (0.0%) | 0 (0.0%) |
| Total | 245 (98.8%) | 3 (1.2%) |
Income Below Poverty Among Single-Parent Households in Rapids City
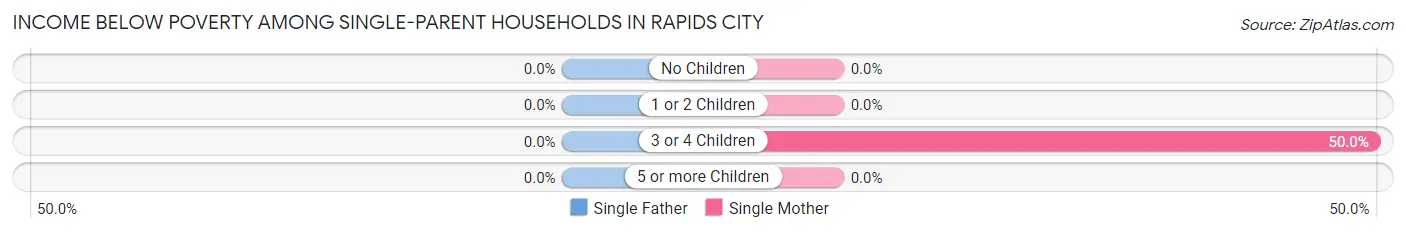
| Children | Single Father | Single Mother |
| No Children | 0 (0.0%) | 0 (0.0%) |
| 1 or 2 Children | 0 (0.0%) | 0 (0.0%) |
| 3 or 4 Children | 0 (0.0%) | 2 (50.0%) |
| 5 or more Children | 0 (0.0%) | 0 (0.0%) |
| Total | 0 (0.0%) | 2 (5.1%) |
Income Below Poverty Among Married-Couple vs Single-Parent Households in Rapids City
The poverty data for Rapids City shows that 3 of the married-couple family households (1.2%) and 2 of the single-parent households (3.3%) are living below the poverty level. Within the married-couple family households, those with 3 or 4 children have the highest poverty rate, with 3 households (13.0%) falling below the poverty line. Among the single-parent households, those with 3 or 4 children have the highest poverty rate, with 2 household (15.4%) living below poverty.
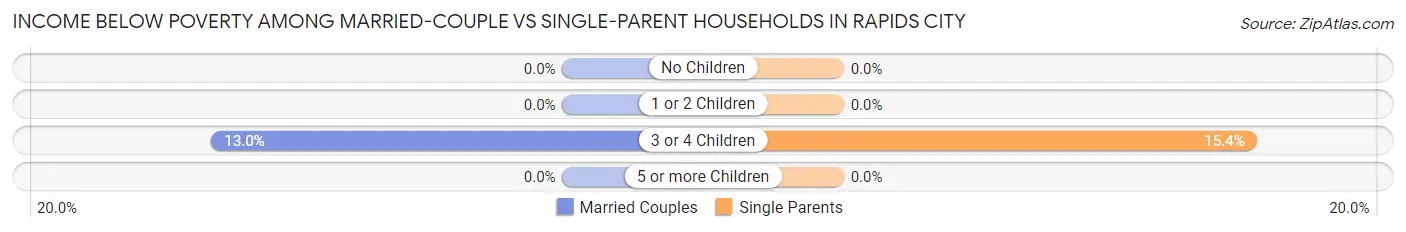
| Children | Married-Couple Families | Single-Parent Households |
| No Children | 0 (0.0%) | 0 (0.0%) |
| 1 or 2 Children | 0 (0.0%) | 0 (0.0%) |
| 3 or 4 Children | 3 (13.0%) | 2 (15.4%) |
| 5 or more Children | 0 (0.0%) | 0 (0.0%) |
| Total | 3 (1.2%) | 2 (3.3%) |
Race in Rapids City
The most populous races in Rapids City are White / Caucasian (904 | 91.9%), Two or more Races (51 | 5.2%), and Asian (21 | 2.1%).
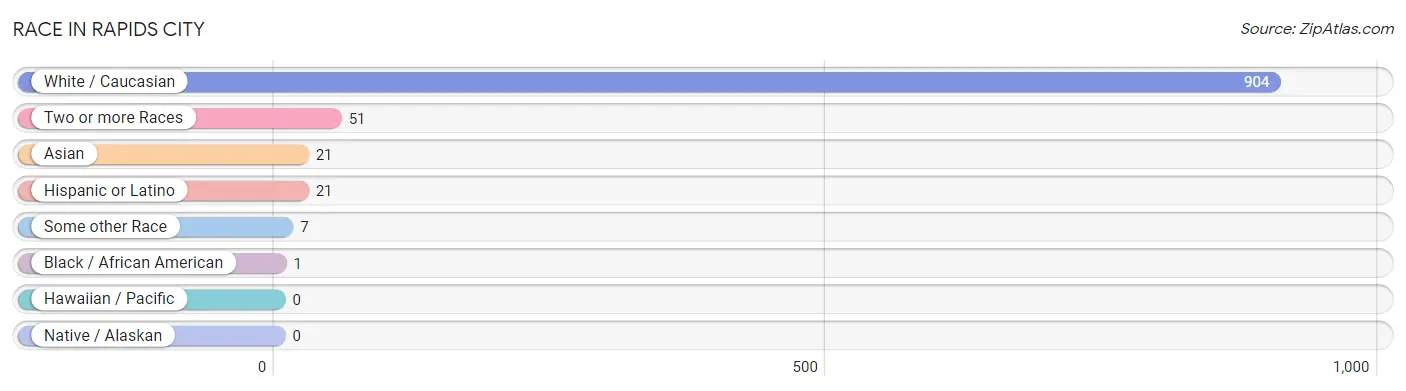
| Race | # Population | % Population |
| Asian | 21 | 2.1% |
| Black / African American | 1 | 0.1% |
| Hawaiian / Pacific | 0 | 0.0% |
| Hispanic or Latino | 21 | 2.1% |
| Native / Alaskan | 0 | 0.0% |
| White / Caucasian | 904 | 91.9% |
| Two or more Races | 51 | 5.2% |
| Some other Race | 7 | 0.7% |
| Total | 984 | 100.0% |
Ancestry in Rapids City
The most populous ancestries reported in Rapids City are German (242 | 24.6%), Irish (182 | 18.5%), English (118 | 12.0%), Swedish (58 | 5.9%), and Norwegian (42 | 4.3%), together accounting for 65.2% of all Rapids City residents.
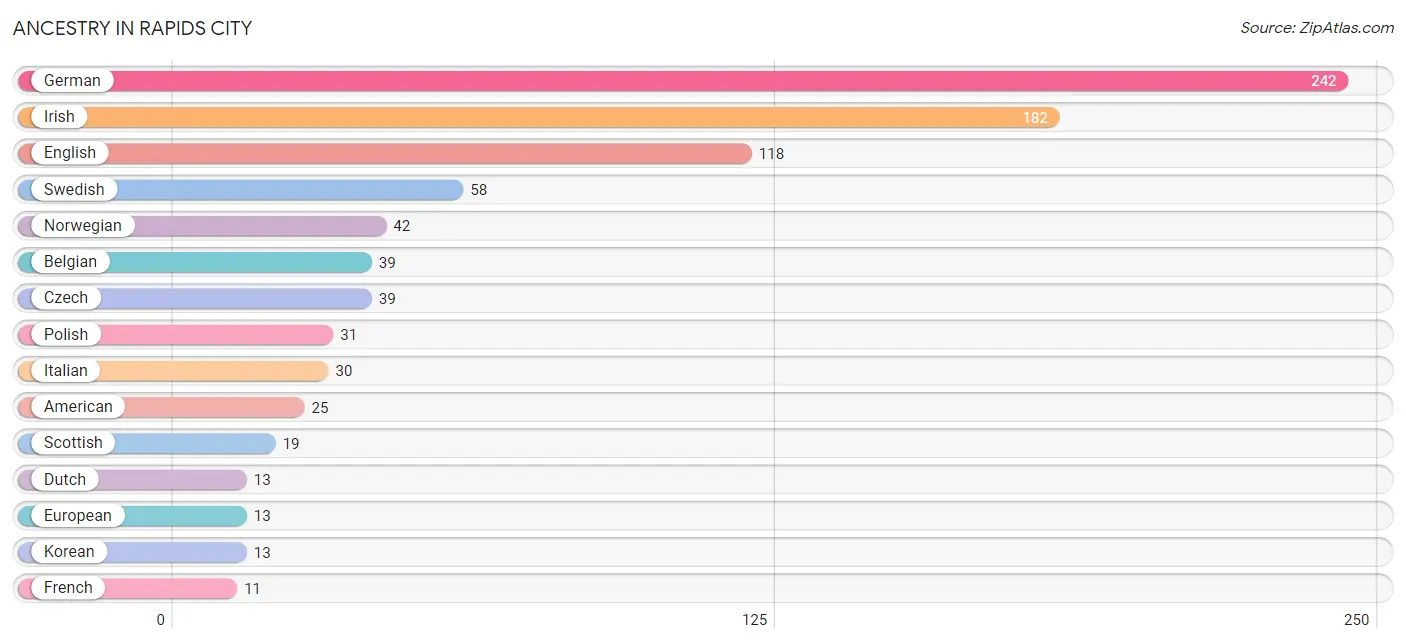
| Ancestry | # Population | % Population |
| American | 25 | 2.5% |
| Austrian | 7 | 0.7% |
| Belgian | 39 | 4.0% |
| Burmese | 9 | 0.9% |
| Croatian | 9 | 0.9% |
| Cuban | 6 | 0.6% |
| Czech | 39 | 4.0% |
| Danish | 6 | 0.6% |
| Dutch | 13 | 1.3% |
| English | 118 | 12.0% |
| European | 13 | 1.3% |
| French | 11 | 1.1% |
| German | 242 | 24.6% |
| Hungarian | 3 | 0.3% |
| Indian (Asian) | 3 | 0.3% |
| Irish | 182 | 18.5% |
| Italian | 30 | 3.0% |
| Korean | 13 | 1.3% |
| Mexican | 9 | 0.9% |
| Norwegian | 42 | 4.3% |
| Polish | 31 | 3.2% |
| Scotch-Irish | 1 | 0.1% |
| Scottish | 19 | 1.9% |
| Spaniard | 6 | 0.6% |
| Sri Lankan | 3 | 0.3% |
| Swedish | 58 | 5.9% |
| Ukrainian | 5 | 0.5% |
| Welsh | 1 | 0.1% | View All 28 Rows |
Immigrants in Rapids City
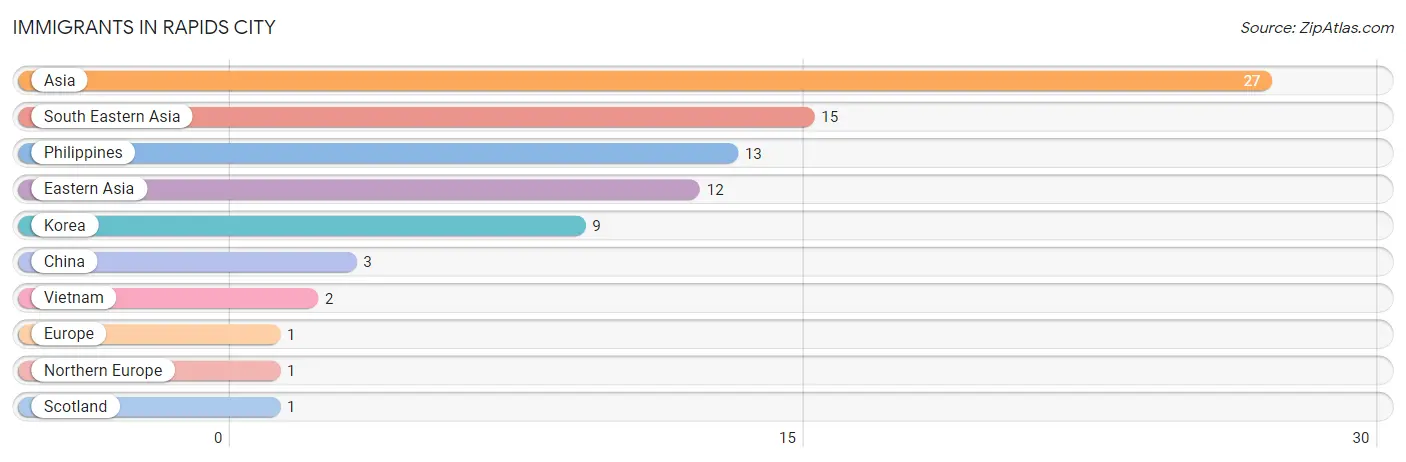
The most numerous immigrant groups reported in Rapids City came from Asia (27 | 2.7%), South Eastern Asia (15 | 1.5%), Philippines (13 | 1.3%), Eastern Asia (12 | 1.2%), and Korea (9 | 0.9%), together accounting for 7.7% of all Rapids City residents.
| Immigration Origin | # Population | % Population |
| Asia | 27 | 2.7% |
| China | 3 | 0.3% |
| Eastern Asia | 12 | 1.2% |
| Europe | 1 | 0.1% |
| Korea | 9 | 0.9% |
| Northern Europe | 1 | 0.1% |
| Philippines | 13 | 1.3% |
| Scotland | 1 | 0.1% |
| South Eastern Asia | 15 | 1.5% |
| Vietnam | 2 | 0.2% | View All 10 Rows |
Sex and Age in Rapids City
Sex and Age in Rapids City
The most populous age groups in Rapids City are 5 to 9 Years (69 | 14.3%) for men and 60 to 64 Years (66 | 13.2%) for women.
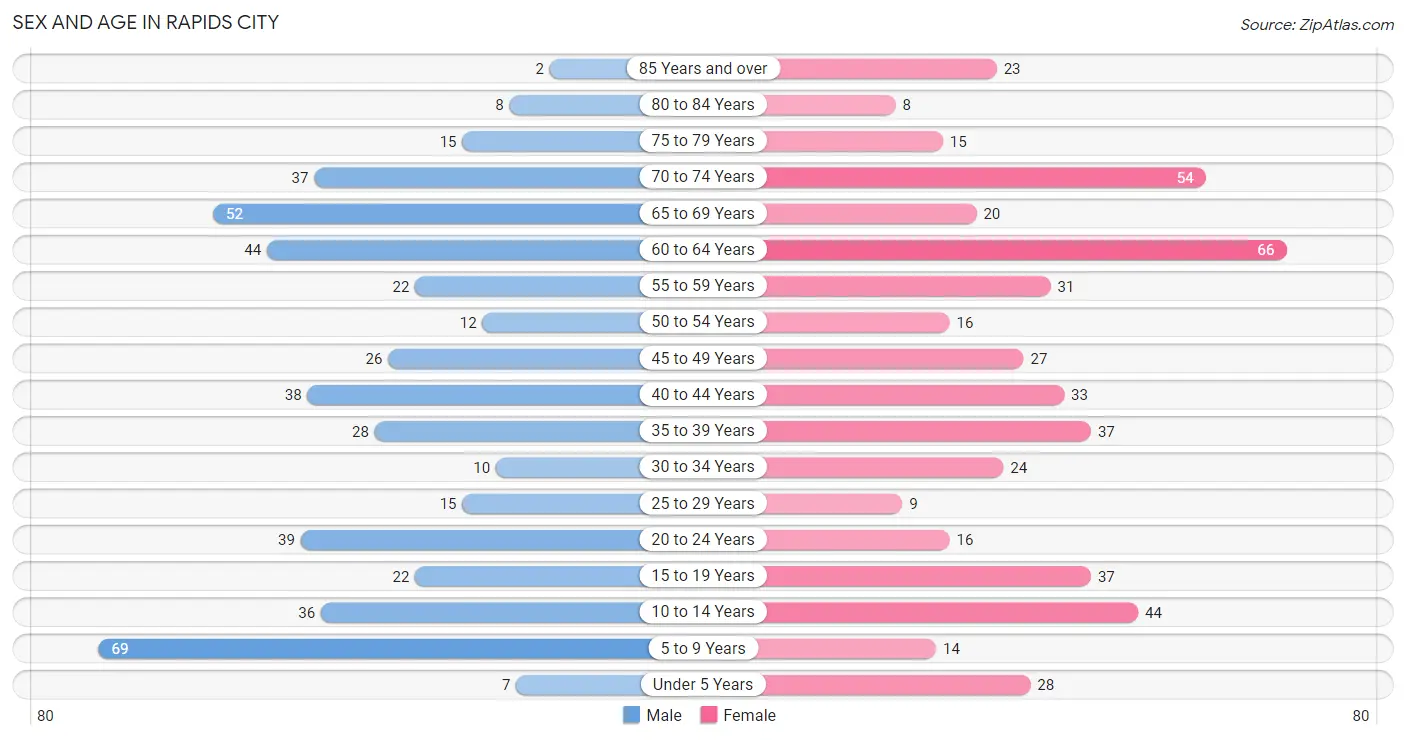
| Age Bracket | Male | Female |
| Under 5 Years | 7 (1.5%) | 28 (5.6%) |
| 5 to 9 Years | 69 (14.3%) | 14 (2.8%) |
| 10 to 14 Years | 36 (7.5%) | 44 (8.8%) |
| 15 to 19 Years | 22 (4.6%) | 37 (7.4%) |
| 20 to 24 Years | 39 (8.1%) | 16 (3.2%) |
| 25 to 29 Years | 15 (3.1%) | 9 (1.8%) |
| 30 to 34 Years | 10 (2.1%) | 24 (4.8%) |
| 35 to 39 Years | 28 (5.8%) | 37 (7.4%) |
| 40 to 44 Years | 38 (7.9%) | 33 (6.6%) |
| 45 to 49 Years | 26 (5.4%) | 27 (5.4%) |
| 50 to 54 Years | 12 (2.5%) | 16 (3.2%) |
| 55 to 59 Years | 22 (4.6%) | 31 (6.2%) |
| 60 to 64 Years | 44 (9.1%) | 66 (13.2%) |
| 65 to 69 Years | 52 (10.8%) | 20 (4.0%) |
| 70 to 74 Years | 37 (7.7%) | 54 (10.8%) |
| 75 to 79 Years | 15 (3.1%) | 15 (3.0%) |
| 80 to 84 Years | 8 (1.7%) | 8 (1.6%) |
| 85 Years and over | 2 (0.4%) | 23 (4.6%) |
| Total | 482 (100.0%) | 502 (100.0%) |
Families and Households in Rapids City
Median Family Size in Rapids City
The median family size in Rapids City is 2.87 persons per family, with single female/mother families (39 | 12.6%) accounting for the largest median family size of 3.13 persons per family. On the other hand, married-couple families (248 | 80.3%) represent the smallest median family size with 2.82 persons per family.
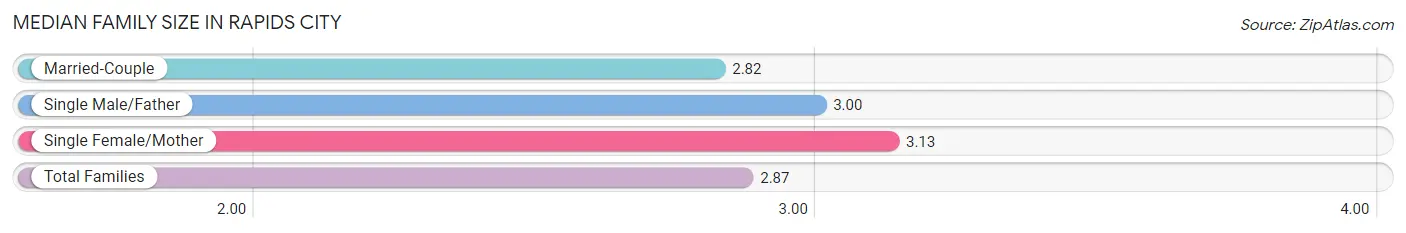
| Family Type | # Families | Family Size |
| Married-Couple | 248 (80.3%) | 2.82 |
| Single Male/Father | 22 (7.1%) | 3.00 |
| Single Female/Mother | 39 (12.6%) | 3.13 |
| Total Families | 309 (100.0%) | 2.87 |
Median Household Size in Rapids City
The median household size in Rapids City is 2.54 persons per household, with single female/mother households (39 | 10.1%) accounting for the largest median household size of 3.13 persons per household. non-family households (79 | 20.4%) represent the smallest median household size with 1.23 persons per household.
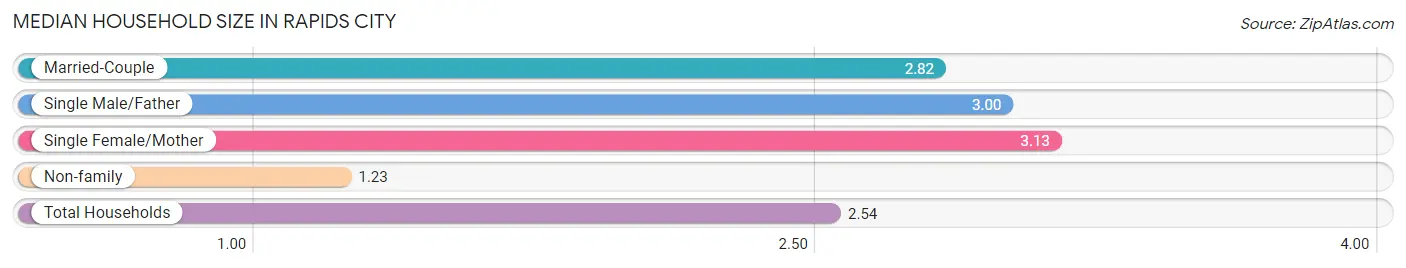
| Household Type | # Households | Household Size |
| Married-Couple | 248 (63.9%) | 2.82 |
| Single Male/Father | 22 (5.7%) | 3.00 |
| Single Female/Mother | 39 (10.1%) | 3.13 |
| Non-family | 79 (20.4%) | 1.23 |
| Total Households | 388 (100.0%) | 2.54 |
Household Size by Marriage Status in Rapids City
Out of a total of 388 households in Rapids City, 309 (79.6%) are family households, while 79 (20.4%) are nonfamily households. The most numerous type of family households are 2-person households, comprising 155, and the most common type of nonfamily households are 1-person households, comprising 61.
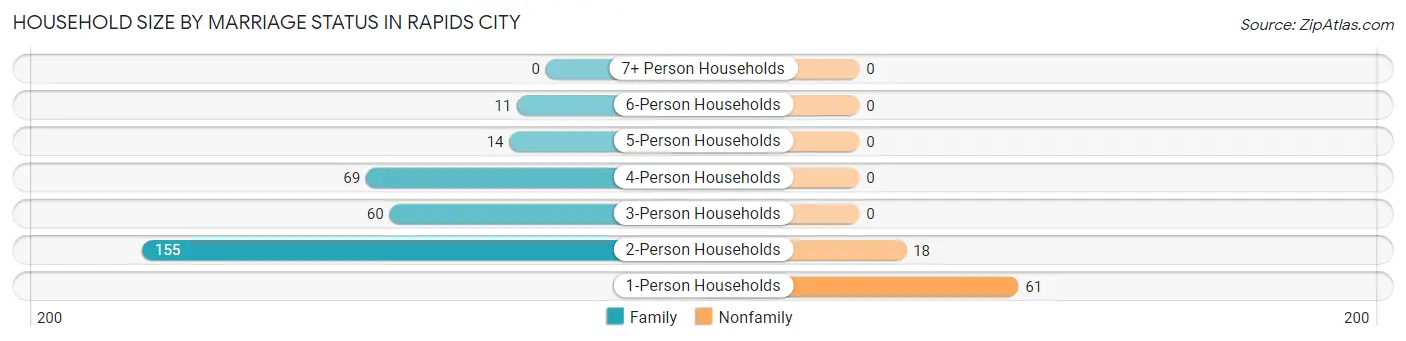
| Household Size | Family Households | Nonfamily Households |
| 1-Person Households | - | 61 (15.7%) |
| 2-Person Households | 155 (40.0%) | 18 (4.6%) |
| 3-Person Households | 60 (15.5%) | 0 (0.0%) |
| 4-Person Households | 69 (17.8%) | 0 (0.0%) |
| 5-Person Households | 14 (3.6%) | 0 (0.0%) |
| 6-Person Households | 11 (2.8%) | 0 (0.0%) |
| 7+ Person Households | 0 (0.0%) | 0 (0.0%) |
| Total | 309 (79.6%) | 79 (20.4%) |
Female Fertility in Rapids City
Fertility by Age in Rapids City
Average fertility rate in Rapids City is 48.0 births per 1,000 women. Women in the age bracket of 20 to 34 years have the highest fertility rate with 184.0 births per 1,000 women. Women in the age bracket of 20 to 34 years acount for 100.0% of all women with births.
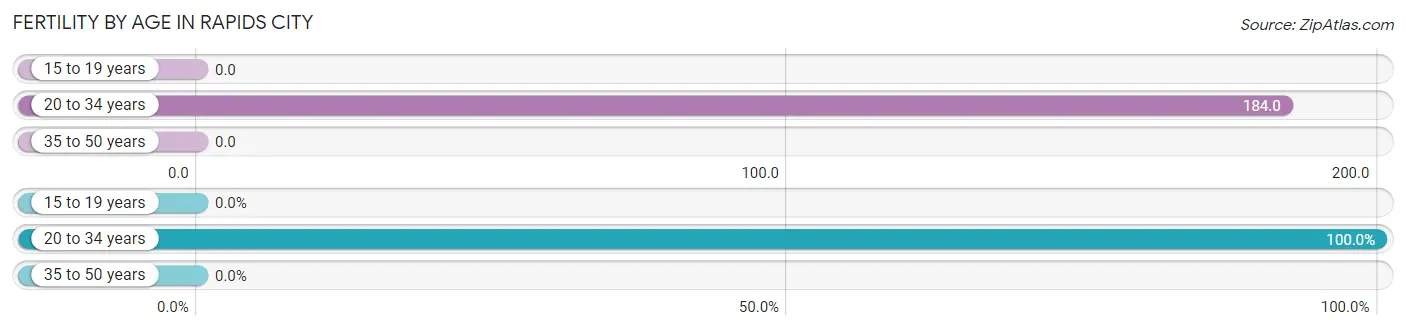
| Age Bracket | Women with Births | Births / 1,000 Women |
| 15 to 19 years | 0 (0.0%) | 0.0 |
| 20 to 34 years | 9 (100.0%) | 184.0 |
| 35 to 50 years | 0 (0.0%) | 0.0 |
| Total | 9 (100.0%) | 48.0 |
Fertility by Age by Marriage Status in Rapids City
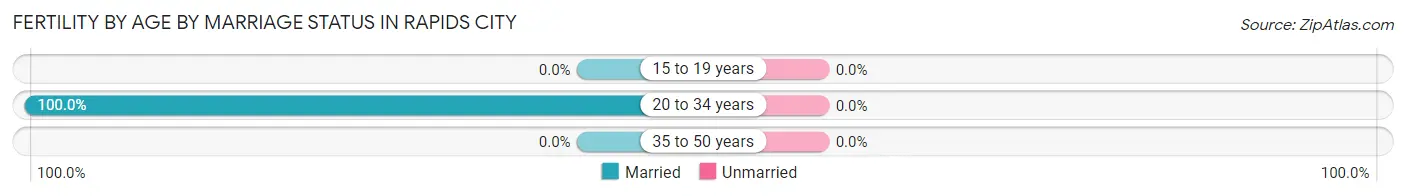
| Age Bracket | Married | Unmarried |
| 15 to 19 years | 0 (0.0%) | 0 (0.0%) |
| 20 to 34 years | 9 (100.0%) | 0 (0.0%) |
| 35 to 50 years | 0 (0.0%) | 0 (0.0%) |
| Total | 9 (100.0%) | 0 (0.0%) |
Fertility by Education in Rapids City
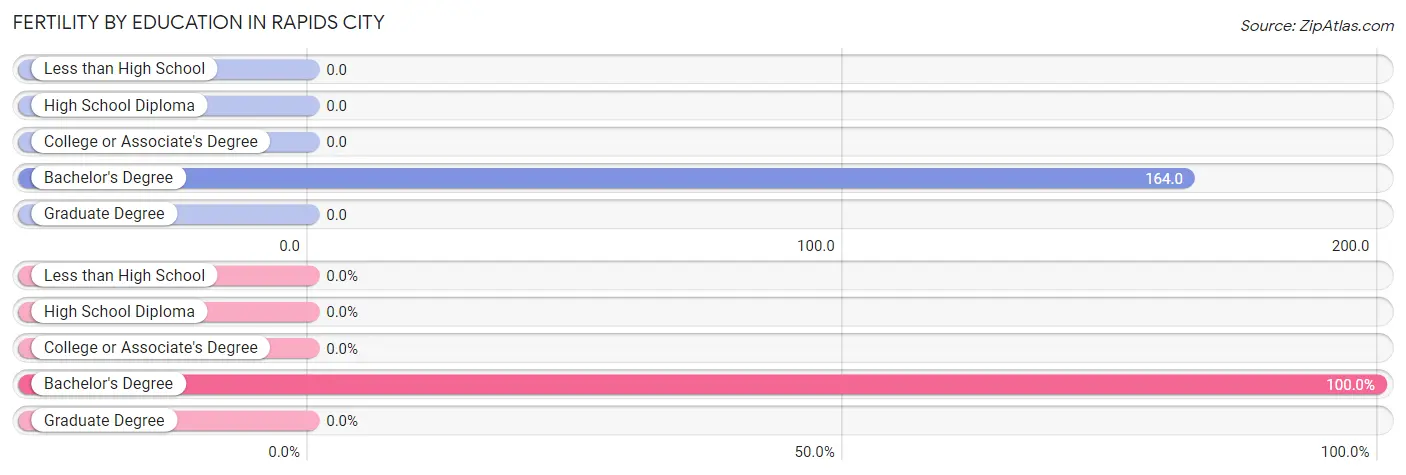
| Educational Attainment | Women with Births | Births / 1,000 Women |
| Less than High School | 0 (0.0%) | 0.0 |
| High School Diploma | 0 (0.0%) | 0.0 |
| College or Associate's Degree | 0 (0.0%) | 0.0 |
| Bachelor's Degree | 9 (100.0%) | 164.0 |
| Graduate Degree | 0 (0.0%) | 0.0 |
| Total | 9 (100.0%) | 48.0 |
Fertility by Education by Marriage Status in Rapids City
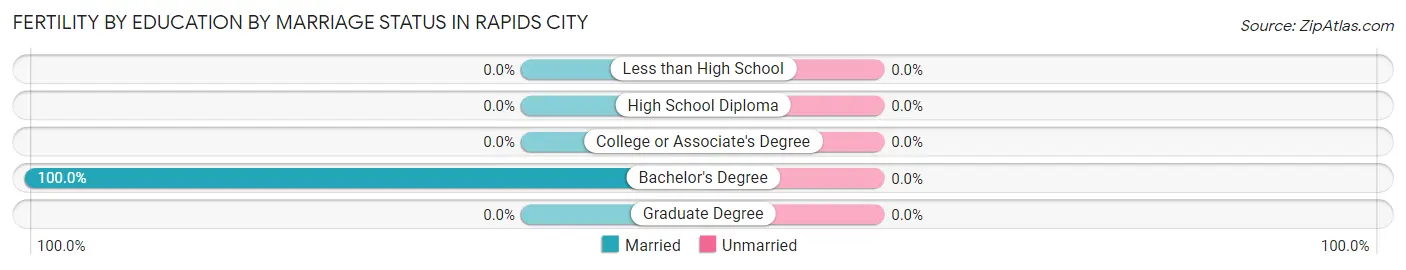
| Educational Attainment | Married | Unmarried |
| Less than High School | 0 (0.0%) | 0 (0.0%) |
| High School Diploma | 0 (0.0%) | 0 (0.0%) |
| College or Associate's Degree | 0 (0.0%) | 0 (0.0%) |
| Bachelor's Degree | 9 (100.0%) | 0 (0.0%) |
| Graduate Degree | 0 (0.0%) | 0 (0.0%) |
| Total | 9 (100.0%) | 0 (0.0%) |
Employment Characteristics in Rapids City
Employment by Class of Employer in Rapids City
Among the 424 employed individuals in Rapids City, private company employees (299 | 70.5%), self-employed (not incorporated) (35 | 8.3%), and not-for-profit organizations (29 | 6.8%) make up the most common classes of employment.
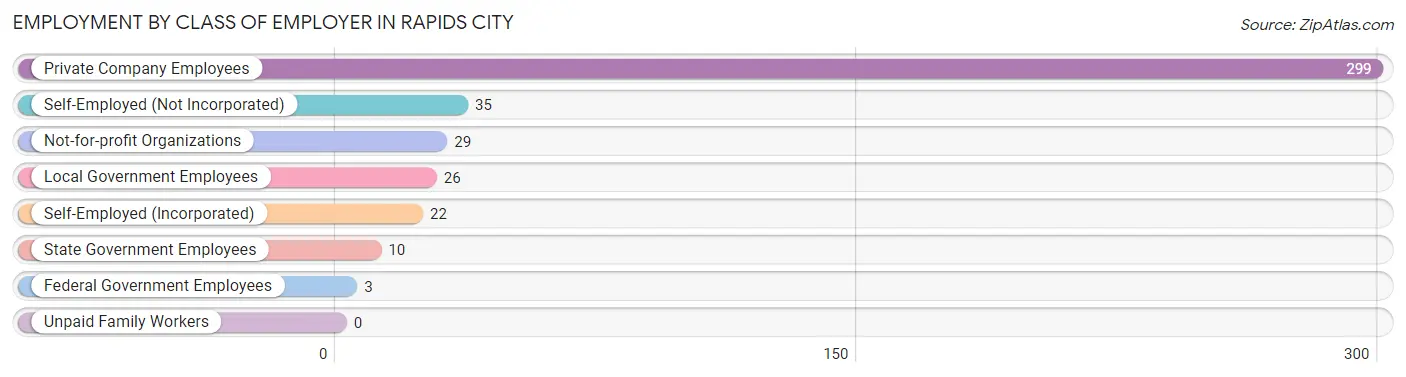
| Employer Class | # Employees | % Employees |
| Private Company Employees | 299 | 70.5% |
| Self-Employed (Incorporated) | 22 | 5.2% |
| Self-Employed (Not Incorporated) | 35 | 8.3% |
| Not-for-profit Organizations | 29 | 6.8% |
| Local Government Employees | 26 | 6.1% |
| State Government Employees | 10 | 2.4% |
| Federal Government Employees | 3 | 0.7% |
| Unpaid Family Workers | 0 | 0.0% |
| Total | 424 | 100.0% |
Employment Status by Age in Rapids City
According to the labor force statistics for Rapids City, out of the total population over 16 years of age (755), 60.3% or 455 individuals are in the labor force, with 4.8% or 22 of them unemployed. The age group with the highest labor force participation rate is 25 to 29 years, with 100.0% or 24 individuals in the labor force. Within the labor force, the 16 to 19 years age range has the highest percentage of unemployed individuals, with 50.0% or 7 of them being unemployed.
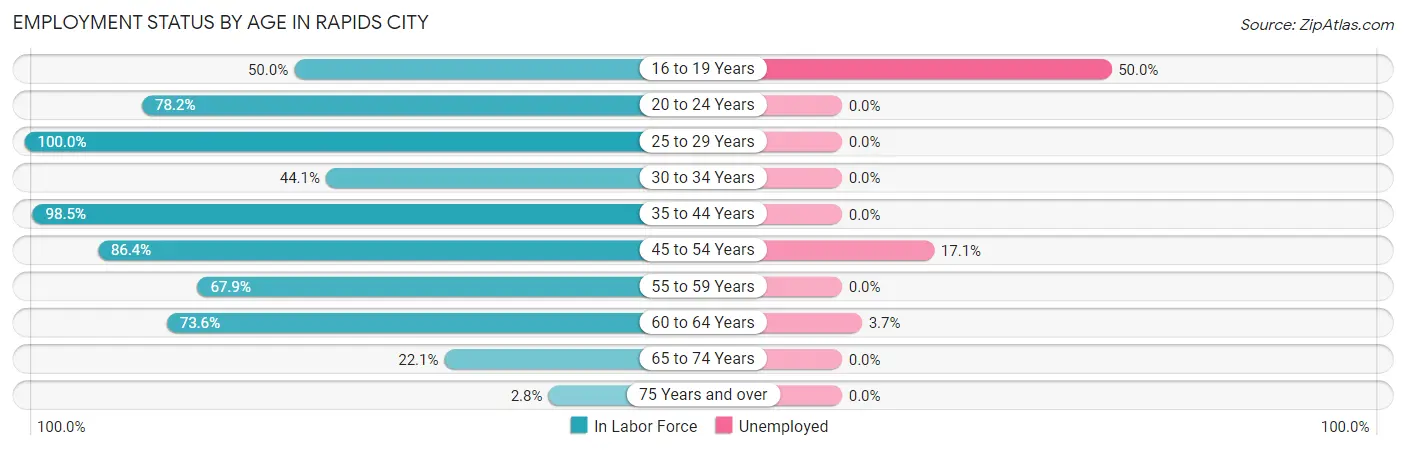
| Age Bracket | In Labor Force | Unemployed |
| 16 to 19 Years | 14 (50.0%) | 7 (50.0%) |
| 20 to 24 Years | 43 (78.2%) | 0 (0.0%) |
| 25 to 29 Years | 24 (100.0%) | 0 (0.0%) |
| 30 to 34 Years | 15 (44.1%) | 0 (0.0%) |
| 35 to 44 Years | 134 (98.5%) | 0 (0.0%) |
| 45 to 54 Years | 70 (86.4%) | 12 (17.1%) |
| 55 to 59 Years | 36 (67.9%) | 0 (0.0%) |
| 60 to 64 Years | 81 (73.6%) | 3 (3.7%) |
| 65 to 74 Years | 36 (22.1%) | 0 (0.0%) |
| 75 Years and over | 2 (2.8%) | 0 (0.0%) |
| Total | 455 (60.3%) | 22 (4.8%) |
Employment Status by Educational Attainment in Rapids City
According to labor force statistics for Rapids City, 82.2% of individuals (360) out of the total population between 25 and 64 years of age (438) are in the labor force, with 4.2% or 15 of them being unemployed. The group with the highest labor force participation rate are those with the educational attainment of college / associate degree, with 91.8% or 135 individuals in the labor force. Within the labor force, individuals with high school diploma education have the highest percentage of unemployment, with 13.5% or 15 of them being unemployed.
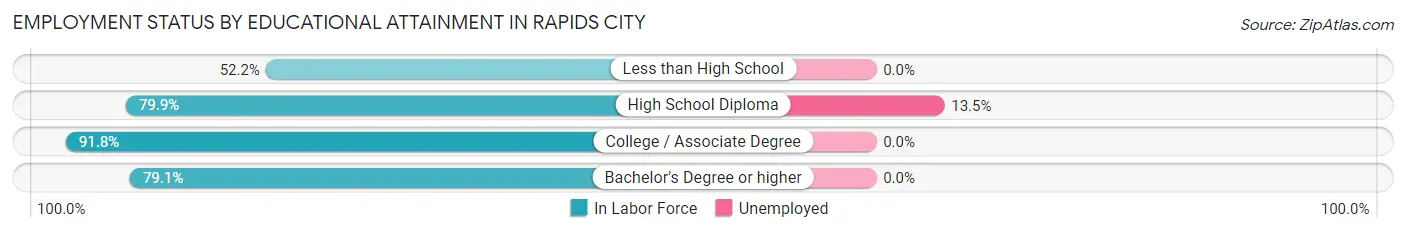
| Educational Attainment | In Labor Force | Unemployed |
| Less than High School | 12 (52.2%) | 0 (0.0%) |
| High School Diploma | 111 (79.9%) | 19 (13.5%) |
| College / Associate Degree | 135 (91.8%) | 0 (0.0%) |
| Bachelor's Degree or higher | 102 (79.1%) | 0 (0.0%) |
| Total | 360 (82.2%) | 18 (4.2%) |
Employment Occupations by Sex in Rapids City
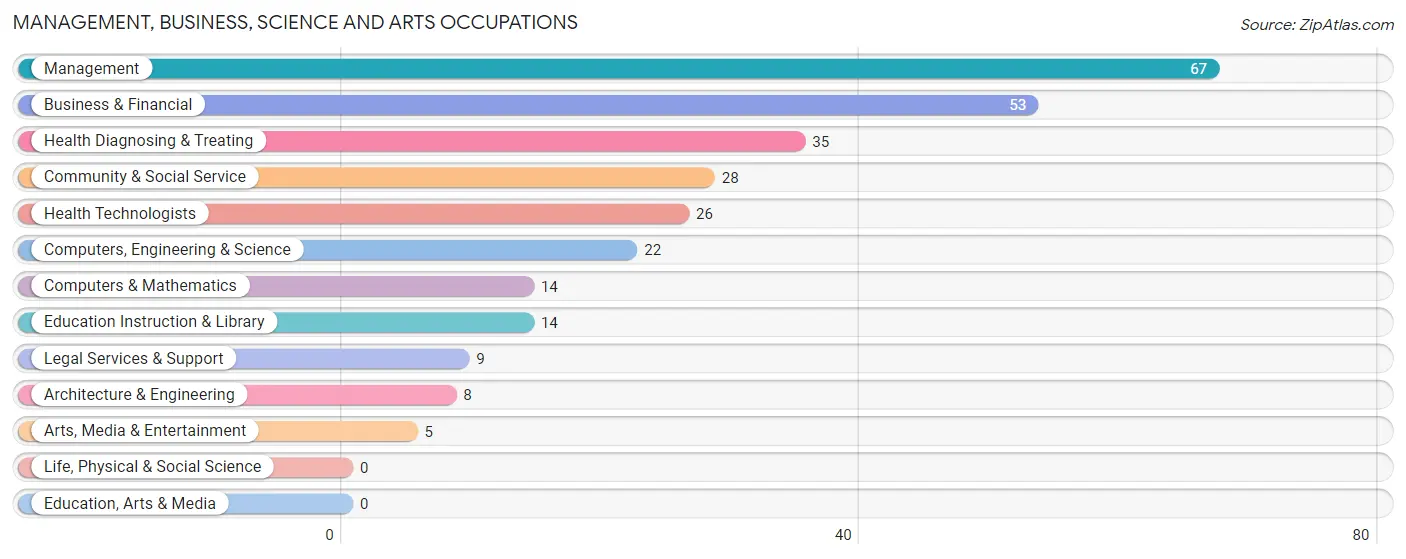
Management, Business, Science and Arts Occupations
The most common Management, Business, Science and Arts occupations in Rapids City are Management (67 | 15.5%), Business & Financial (53 | 12.2%), Health Diagnosing & Treating (35 | 8.1%), Community & Social Service (28 | 6.5%), and Health Technologists (26 | 6.0%).
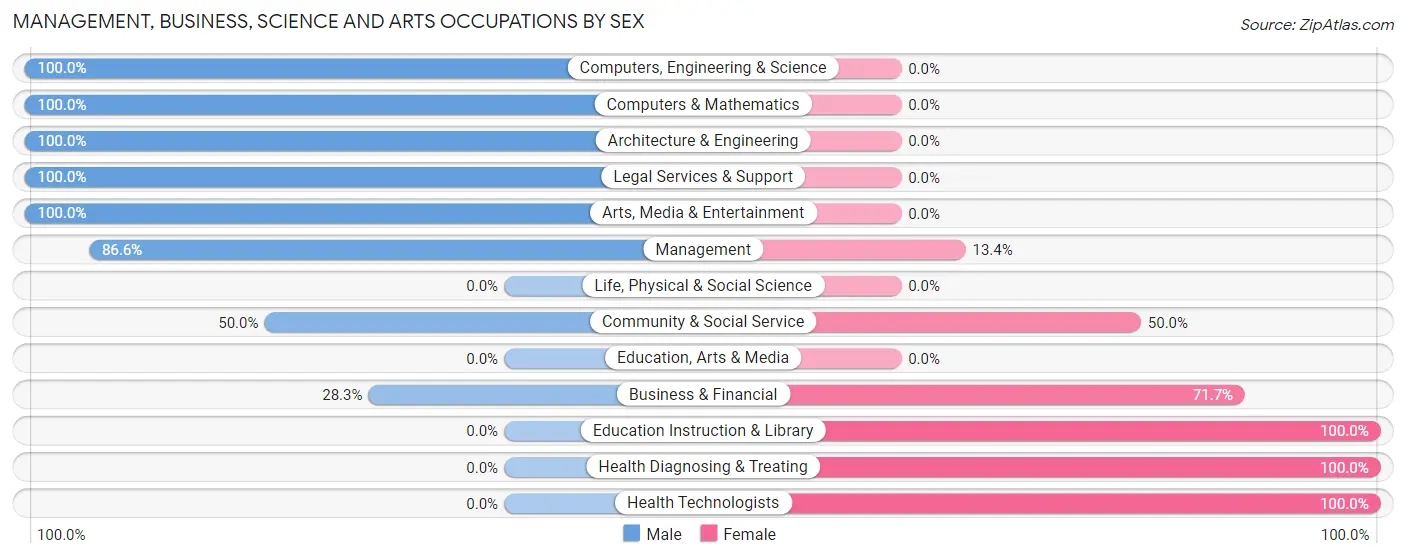
Management, Business, Science and Arts Occupations by Sex
Within the Management, Business, Science and Arts occupations in Rapids City, the most male-oriented occupations are Computers, Engineering & Science (100.0%), Computers & Mathematics (100.0%), and Architecture & Engineering (100.0%), while the most female-oriented occupations are Education Instruction & Library (100.0%), Health Diagnosing & Treating (100.0%), and Health Technologists (100.0%).
| Occupation | Male | Female |
| Management | 58 (86.6%) | 9 (13.4%) |
| Business & Financial | 15 (28.3%) | 38 (71.7%) |
| Computers, Engineering & Science | 22 (100.0%) | 0 (0.0%) |
| Computers & Mathematics | 14 (100.0%) | 0 (0.0%) |
| Architecture & Engineering | 8 (100.0%) | 0 (0.0%) |
| Life, Physical & Social Science | 0 (0.0%) | 0 (0.0%) |
| Community & Social Service | 14 (50.0%) | 14 (50.0%) |
| Education, Arts & Media | 0 (0.0%) | 0 (0.0%) |
| Legal Services & Support | 9 (100.0%) | 0 (0.0%) |
| Education Instruction & Library | 0 (0.0%) | 14 (100.0%) |
| Arts, Media & Entertainment | 5 (100.0%) | 0 (0.0%) |
| Health Diagnosing & Treating | 0 (0.0%) | 35 (100.0%) |
| Health Technologists | 0 (0.0%) | 26 (100.0%) |
| Total (Category) | 109 (53.2%) | 96 (46.8%) |
| Total (Overall) | 222 (51.3%) | 211 (48.7%) |
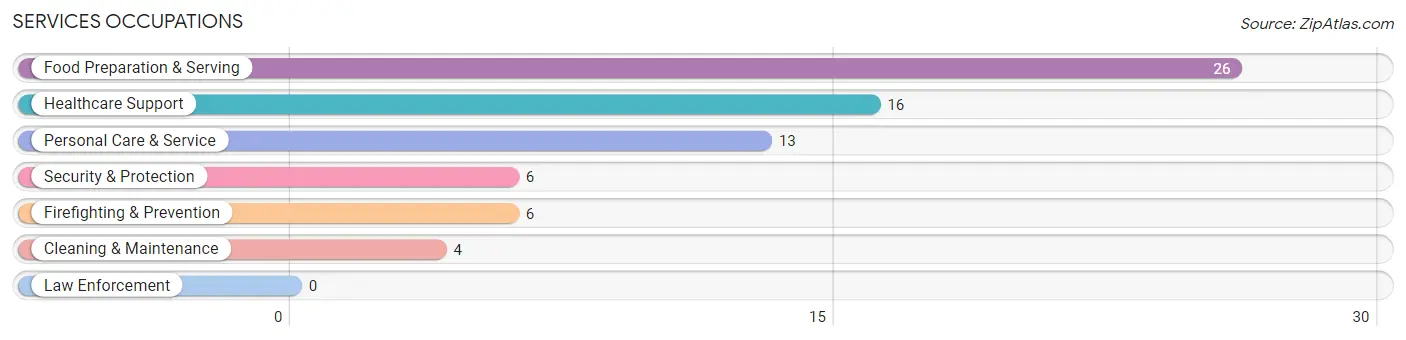
Services Occupations
The most common Services occupations in Rapids City are Food Preparation & Serving (26 | 6.0%), Healthcare Support (16 | 3.7%), Personal Care & Service (13 | 3.0%), Security & Protection (6 | 1.4%), and Firefighting & Prevention (6 | 1.4%).
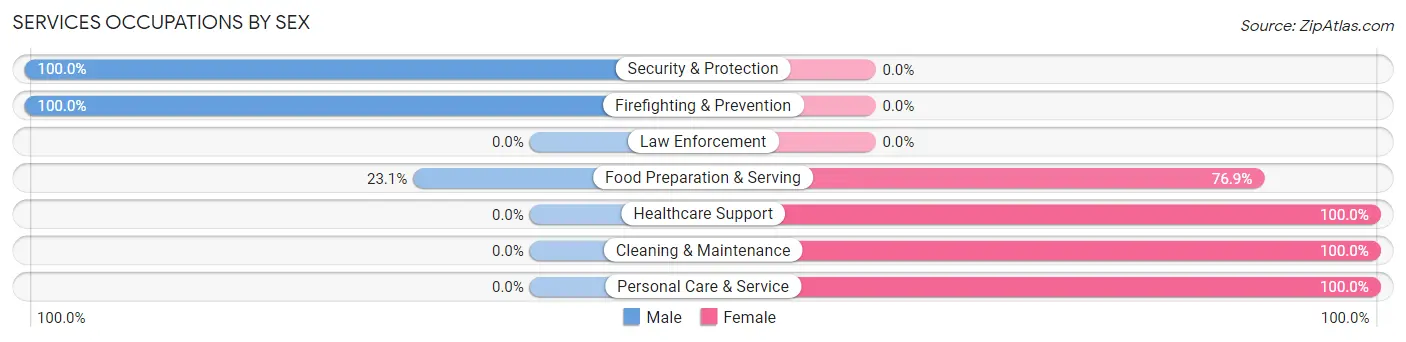
Services Occupations by Sex
Within the Services occupations in Rapids City, the most male-oriented occupations are Security & Protection (100.0%), Firefighting & Prevention (100.0%), and Food Preparation & Serving (23.1%), while the most female-oriented occupations are Healthcare Support (100.0%), Cleaning & Maintenance (100.0%), and Personal Care & Service (100.0%).
| Occupation | Male | Female |
| Healthcare Support | 0 (0.0%) | 16 (100.0%) |
| Security & Protection | 6 (100.0%) | 0 (0.0%) |
| Firefighting & Prevention | 6 (100.0%) | 0 (0.0%) |
| Law Enforcement | 0 (0.0%) | 0 (0.0%) |
| Food Preparation & Serving | 6 (23.1%) | 20 (76.9%) |
| Cleaning & Maintenance | 0 (0.0%) | 4 (100.0%) |
| Personal Care & Service | 0 (0.0%) | 13 (100.0%) |
| Total (Category) | 12 (18.5%) | 53 (81.5%) |
| Total (Overall) | 222 (51.3%) | 211 (48.7%) |
Sales and Office Occupations
The most common Sales and Office occupations in Rapids City are Office & Administration (50 | 11.6%), and Sales & Related (24 | 5.5%).
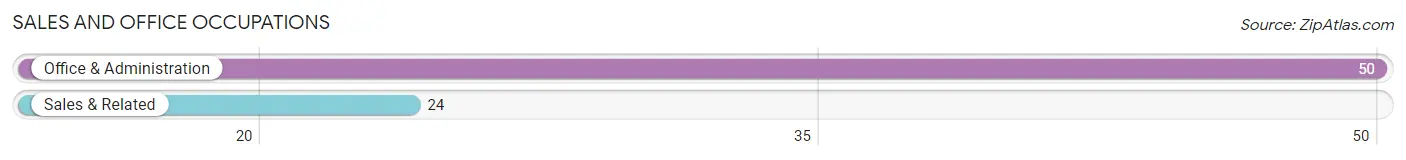
Sales and Office Occupations by Sex
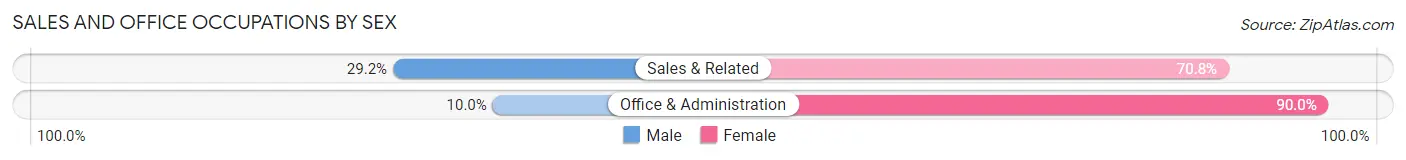
| Occupation | Male | Female |
| Sales & Related | 7 (29.2%) | 17 (70.8%) |
| Office & Administration | 5 (10.0%) | 45 (90.0%) |
| Total (Category) | 12 (16.2%) | 62 (83.8%) |
| Total (Overall) | 222 (51.3%) | 211 (48.7%) |
Natural Resources, Construction and Maintenance Occupations
The most common Natural Resources, Construction and Maintenance occupations in Rapids City are Installation, Maintenance & Repair (26 | 6.0%), and Construction & Extraction (14 | 3.2%).
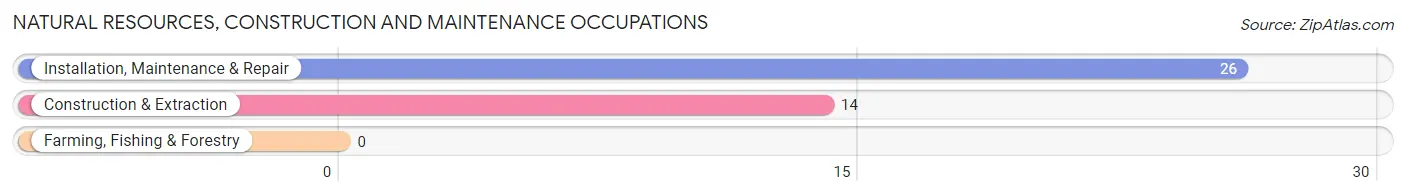
Natural Resources, Construction and Maintenance Occupations by Sex
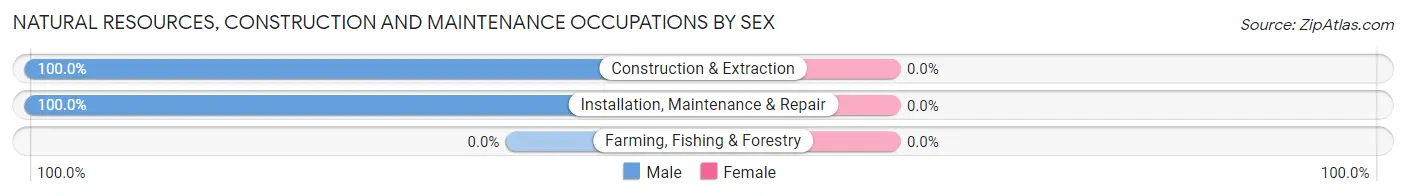
| Occupation | Male | Female |
| Farming, Fishing & Forestry | 0 (0.0%) | 0 (0.0%) |
| Construction & Extraction | 14 (100.0%) | 0 (0.0%) |
| Installation, Maintenance & Repair | 26 (100.0%) | 0 (0.0%) |
| Total (Category) | 40 (100.0%) | 0 (0.0%) |
| Total (Overall) | 222 (51.3%) | 211 (48.7%) |
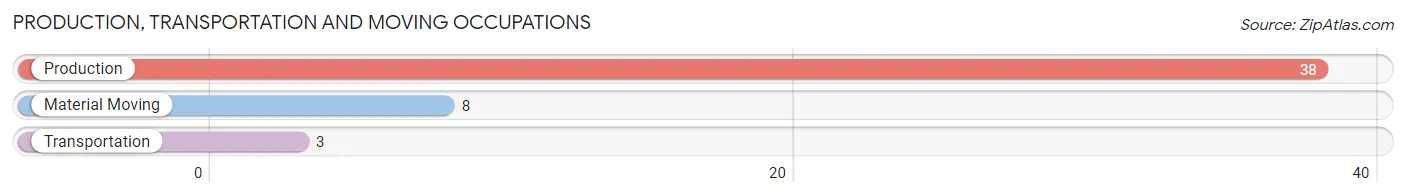
Production, Transportation and Moving Occupations
The most common Production, Transportation and Moving occupations in Rapids City are Production (38 | 8.8%), Material Moving (8 | 1.8%), and Transportation (3 | 0.7%).
Production, Transportation and Moving Occupations by Sex
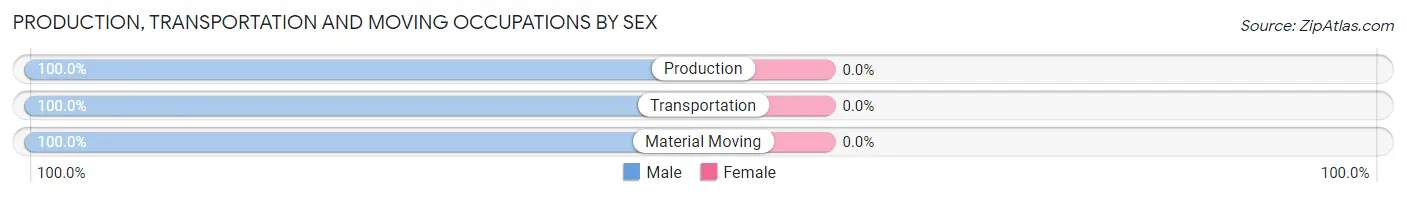
| Occupation | Male | Female |
| Production | 38 (100.0%) | 0 (0.0%) |
| Transportation | 3 (100.0%) | 0 (0.0%) |
| Material Moving | 8 (100.0%) | 0 (0.0%) |
| Total (Category) | 49 (100.0%) | 0 (0.0%) |
| Total (Overall) | 222 (51.3%) | 211 (48.7%) |
Employment Industries by Sex in Rapids City
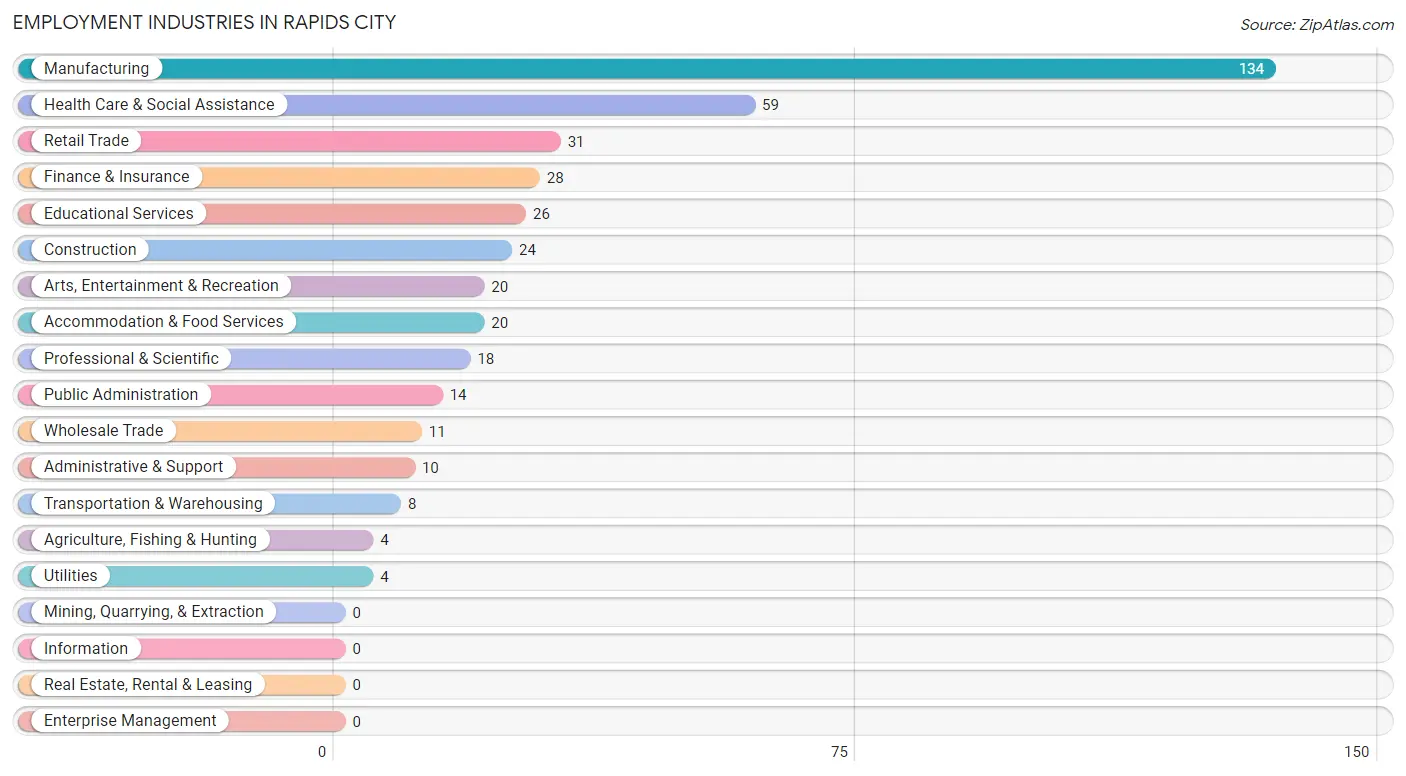
Employment Industries in Rapids City
The major employment industries in Rapids City include Manufacturing (134 | 30.9%), Health Care & Social Assistance (59 | 13.6%), Retail Trade (31 | 7.2%), Finance & Insurance (28 | 6.5%), and Educational Services (26 | 6.0%).
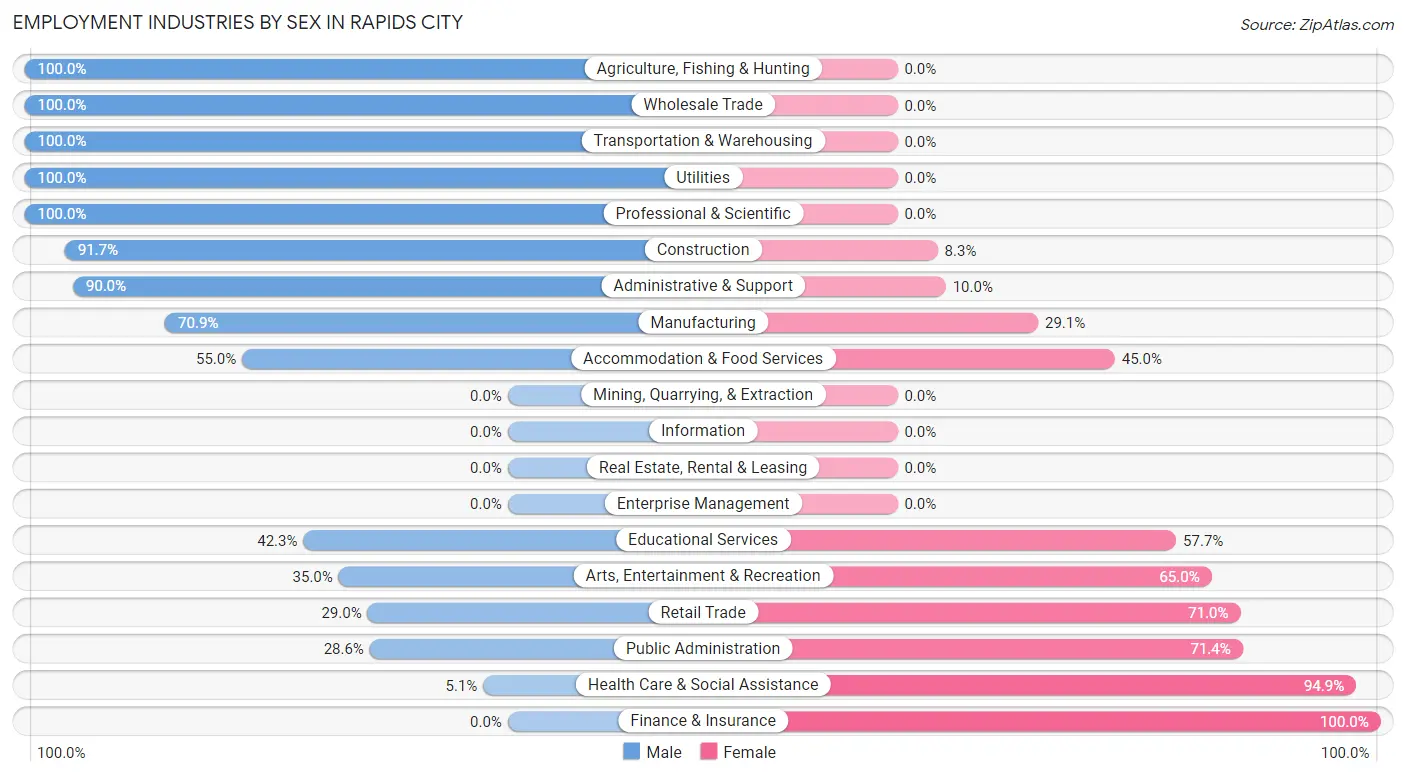
Employment Industries by Sex in Rapids City
The Rapids City industries that see more men than women are Agriculture, Fishing & Hunting (100.0%), Wholesale Trade (100.0%), and Transportation & Warehousing (100.0%), whereas the industries that tend to have a higher number of women are Finance & Insurance (100.0%), Health Care & Social Assistance (94.9%), and Public Administration (71.4%).
| Industry | Male | Female |
| Agriculture, Fishing & Hunting | 4 (100.0%) | 0 (0.0%) |
| Mining, Quarrying, & Extraction | 0 (0.0%) | 0 (0.0%) |
| Construction | 22 (91.7%) | 2 (8.3%) |
| Manufacturing | 95 (70.9%) | 39 (29.1%) |
| Wholesale Trade | 11 (100.0%) | 0 (0.0%) |
| Retail Trade | 9 (29.0%) | 22 (71.0%) |
| Transportation & Warehousing | 8 (100.0%) | 0 (0.0%) |
| Utilities | 4 (100.0%) | 0 (0.0%) |
| Information | 0 (0.0%) | 0 (0.0%) |
| Finance & Insurance | 0 (0.0%) | 28 (100.0%) |
| Real Estate, Rental & Leasing | 0 (0.0%) | 0 (0.0%) |
| Professional & Scientific | 18 (100.0%) | 0 (0.0%) |
| Enterprise Management | 0 (0.0%) | 0 (0.0%) |
| Administrative & Support | 9 (90.0%) | 1 (10.0%) |
| Educational Services | 11 (42.3%) | 15 (57.7%) |
| Health Care & Social Assistance | 3 (5.1%) | 56 (94.9%) |
| Arts, Entertainment & Recreation | 7 (35.0%) | 13 (65.0%) |
| Accommodation & Food Services | 11 (55.0%) | 9 (45.0%) |
| Public Administration | 4 (28.6%) | 10 (71.4%) |
| Total | 222 (51.3%) | 211 (48.7%) |
Education in Rapids City
School Enrollment in Rapids City
The most common levels of schooling among the 283 students in Rapids City are elementary school (78 | 27.6%), middle school (67 | 23.7%), and high school (58 | 20.5%).
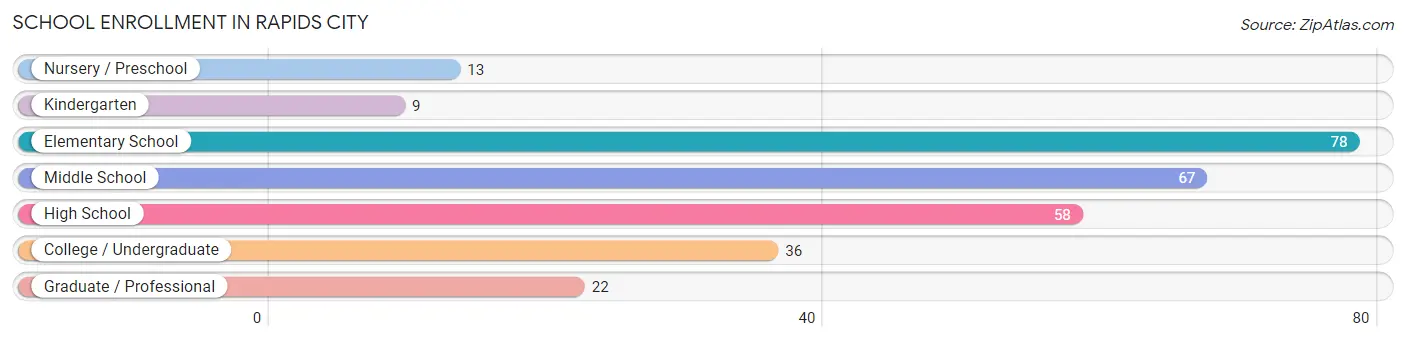
| School Level | # Students | % Students |
| Nursery / Preschool | 13 | 4.6% |
| Kindergarten | 9 | 3.2% |
| Elementary School | 78 | 27.6% |
| Middle School | 67 | 23.7% |
| High School | 58 | 20.5% |
| College / Undergraduate | 36 | 12.7% |
| Graduate / Professional | 22 | 7.8% |
| Total | 283 | 100.0% |
School Enrollment by Age by Funding Source in Rapids City
Out of a total of 283 students who are enrolled in schools in Rapids City, 31 (11.0%) attend a private institution, while the remaining 252 (89.0%) are enrolled in public schools. The age group of 20 to 24 year olds has the highest likelihood of being enrolled in private schools, with 8 (66.7% in the age bracket) enrolled. Conversely, the age group of 18 to 19 year olds has the lowest likelihood of being enrolled in a private school, with 12 (100.0% in the age bracket) attending a public institution.
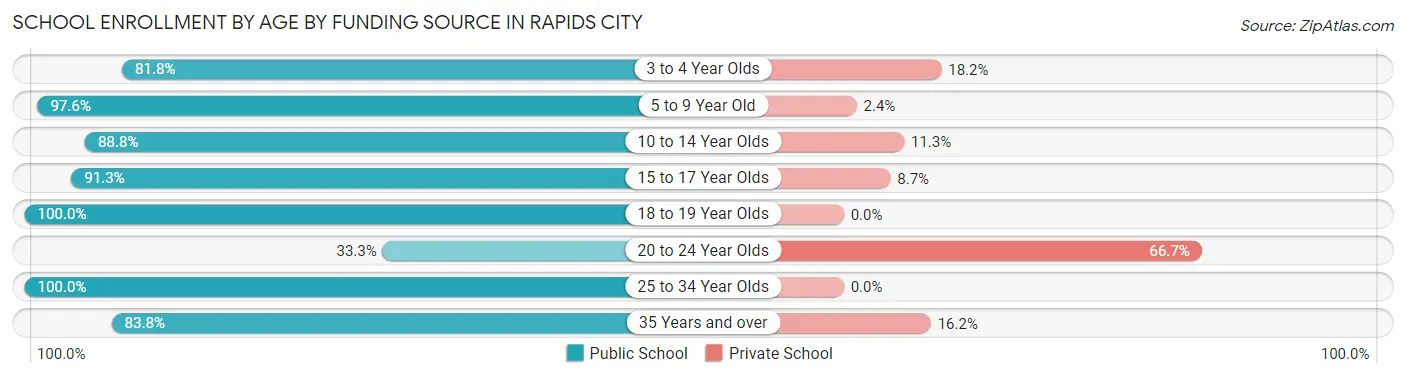
| Age Bracket | Public School | Private School |
| 3 to 4 Year Olds | 9 (81.8%) | 2 (18.2%) |
| 5 to 9 Year Old | 81 (97.6%) | 2 (2.4%) |
| 10 to 14 Year Olds | 71 (88.7%) | 9 (11.3%) |
| 15 to 17 Year Olds | 42 (91.3%) | 4 (8.7%) |
| 18 to 19 Year Olds | 12 (100.0%) | 0 (0.0%) |
| 20 to 24 Year Olds | 4 (33.3%) | 8 (66.7%) |
| 25 to 34 Year Olds | 2 (100.0%) | 0 (0.0%) |
| 35 Years and over | 31 (83.8%) | 6 (16.2%) |
| Total | 252 (89.0%) | 31 (11.0%) |
Educational Attainment by Field of Study in Rapids City
Business (51 | 24.9%), science & technology (28 | 13.7%), bio, nature & agricultural (19 | 9.3%), liberal arts & history (18 | 8.8%), and engineering (17 | 8.3%) are the most common fields of study among 205 individuals in Rapids City who have obtained a bachelor's degree or higher.
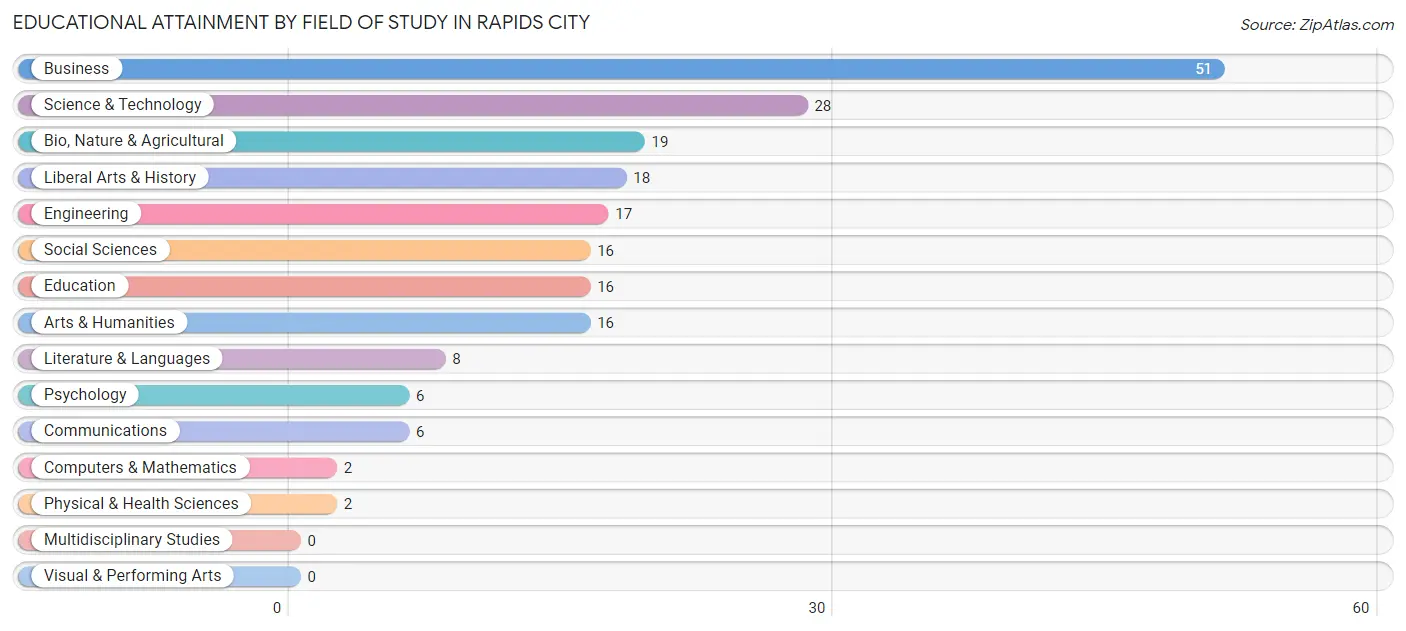
| Field of Study | # Graduates | % Graduates |
| Computers & Mathematics | 2 | 1.0% |
| Bio, Nature & Agricultural | 19 | 9.3% |
| Physical & Health Sciences | 2 | 1.0% |
| Psychology | 6 | 2.9% |
| Social Sciences | 16 | 7.8% |
| Engineering | 17 | 8.3% |
| Multidisciplinary Studies | 0 | 0.0% |
| Science & Technology | 28 | 13.7% |
| Business | 51 | 24.9% |
| Education | 16 | 7.8% |
| Literature & Languages | 8 | 3.9% |
| Liberal Arts & History | 18 | 8.8% |
| Visual & Performing Arts | 0 | 0.0% |
| Communications | 6 | 2.9% |
| Arts & Humanities | 16 | 7.8% |
| Total | 205 | 100.0% |
Transportation & Commute in Rapids City
Vehicle Availability by Sex in Rapids City
The most prevalent vehicle ownership categories in Rapids City are males with 2 vehicles (118, accounting for 53.1%) and females with 2 vehicles (99, making up 58.4%).
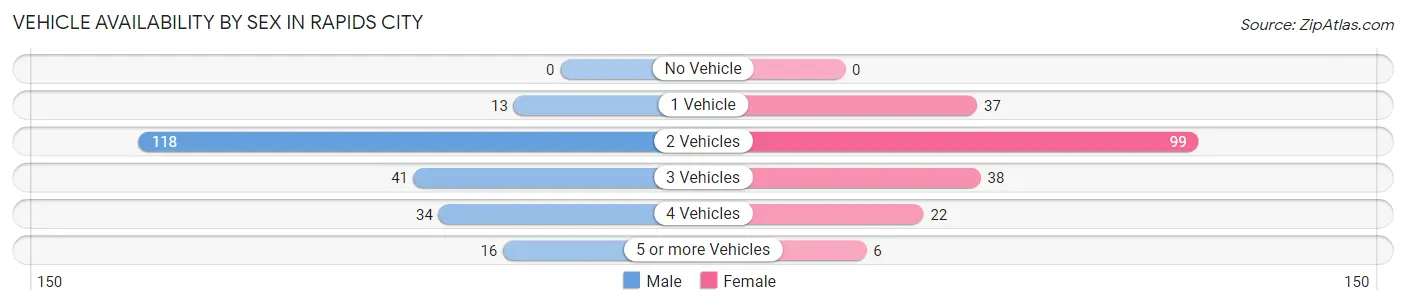
| Vehicles Available | Male | Female |
| No Vehicle | 0 (0.0%) | 0 (0.0%) |
| 1 Vehicle | 13 (5.9%) | 37 (18.3%) |
| 2 Vehicles | 118 (53.1%) | 99 (49.0%) |
| 3 Vehicles | 41 (18.5%) | 38 (18.8%) |
| 4 Vehicles | 34 (15.3%) | 22 (10.9%) |
| 5 or more Vehicles | 16 (7.2%) | 6 (3.0%) |
| Total | 222 (100.0%) | 202 (100.0%) |
Commute Time in Rapids City
The most frequently occuring commute durations in Rapids City are 20 to 24 minutes (131 commuters, 33.7%), 15 to 19 minutes (79 commuters, 20.3%), and 25 to 29 minutes (65 commuters, 16.7%).
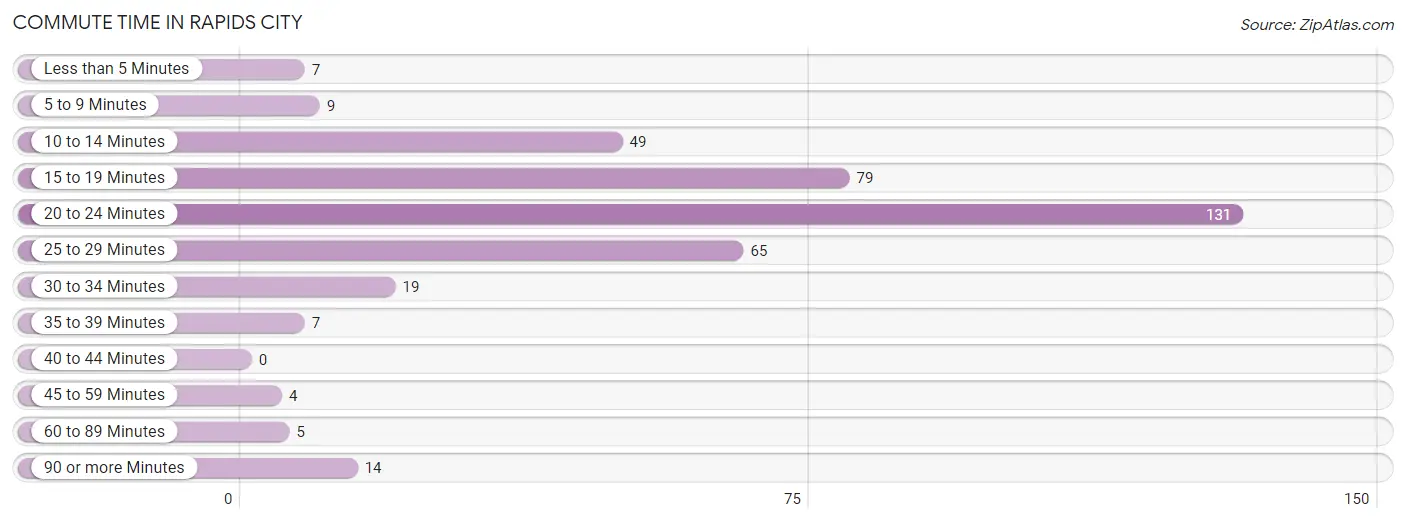
| Commute Time | # Commuters | % Commuters |
| Less than 5 Minutes | 7 | 1.8% |
| 5 to 9 Minutes | 9 | 2.3% |
| 10 to 14 Minutes | 49 | 12.6% |
| 15 to 19 Minutes | 79 | 20.3% |
| 20 to 24 Minutes | 131 | 33.7% |
| 25 to 29 Minutes | 65 | 16.7% |
| 30 to 34 Minutes | 19 | 4.9% |
| 35 to 39 Minutes | 7 | 1.8% |
| 40 to 44 Minutes | 0 | 0.0% |
| 45 to 59 Minutes | 4 | 1.0% |
| 60 to 89 Minutes | 5 | 1.3% |
| 90 or more Minutes | 14 | 3.6% |
Commute Time by Sex in Rapids City
The most common commute times in Rapids City are 20 to 24 minutes (79 commuters, 39.5%) for males and 20 to 24 minutes (52 commuters, 27.5%) for females.
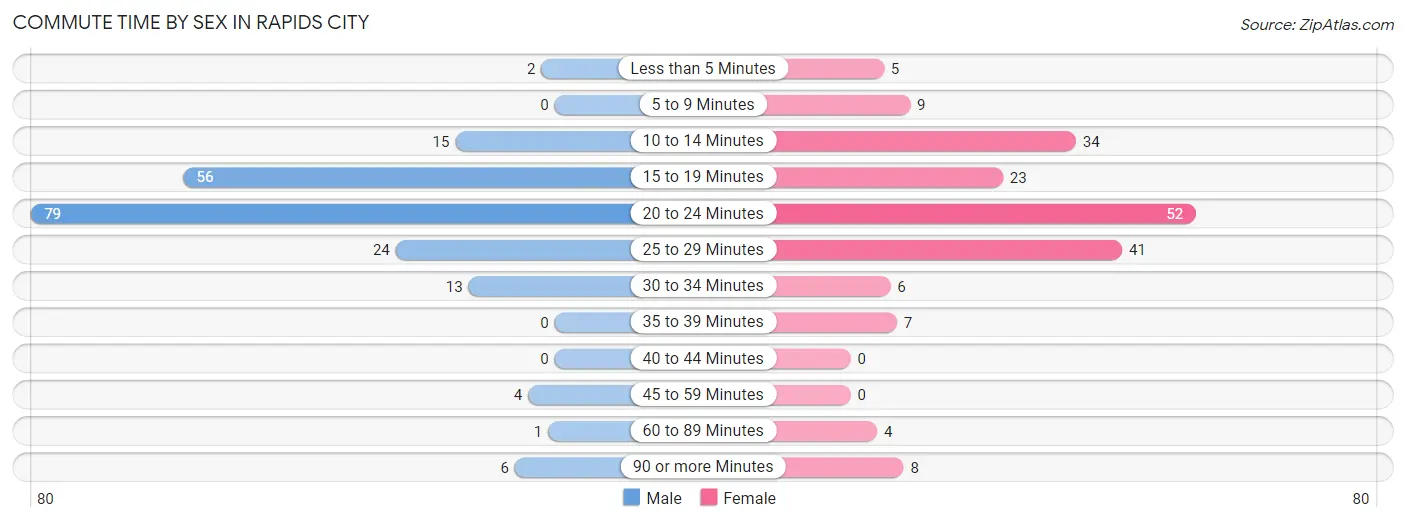
| Commute Time | Male | Female |
| Less than 5 Minutes | 2 (1.0%) | 5 (2.6%) |
| 5 to 9 Minutes | 0 (0.0%) | 9 (4.8%) |
| 10 to 14 Minutes | 15 (7.5%) | 34 (18.0%) |
| 15 to 19 Minutes | 56 (28.0%) | 23 (12.2%) |
| 20 to 24 Minutes | 79 (39.5%) | 52 (27.5%) |
| 25 to 29 Minutes | 24 (12.0%) | 41 (21.7%) |
| 30 to 34 Minutes | 13 (6.5%) | 6 (3.2%) |
| 35 to 39 Minutes | 0 (0.0%) | 7 (3.7%) |
| 40 to 44 Minutes | 0 (0.0%) | 0 (0.0%) |
| 45 to 59 Minutes | 4 (2.0%) | 0 (0.0%) |
| 60 to 89 Minutes | 1 (0.5%) | 4 (2.1%) |
| 90 or more Minutes | 6 (3.0%) | 8 (4.2%) |
Time of Departure to Work by Sex in Rapids City
The most frequent times of departure to work in Rapids City are 7:00 AM to 7:29 AM (54, 27.0%) for males and 7:00 AM to 7:29 AM (47, 24.9%) for females.
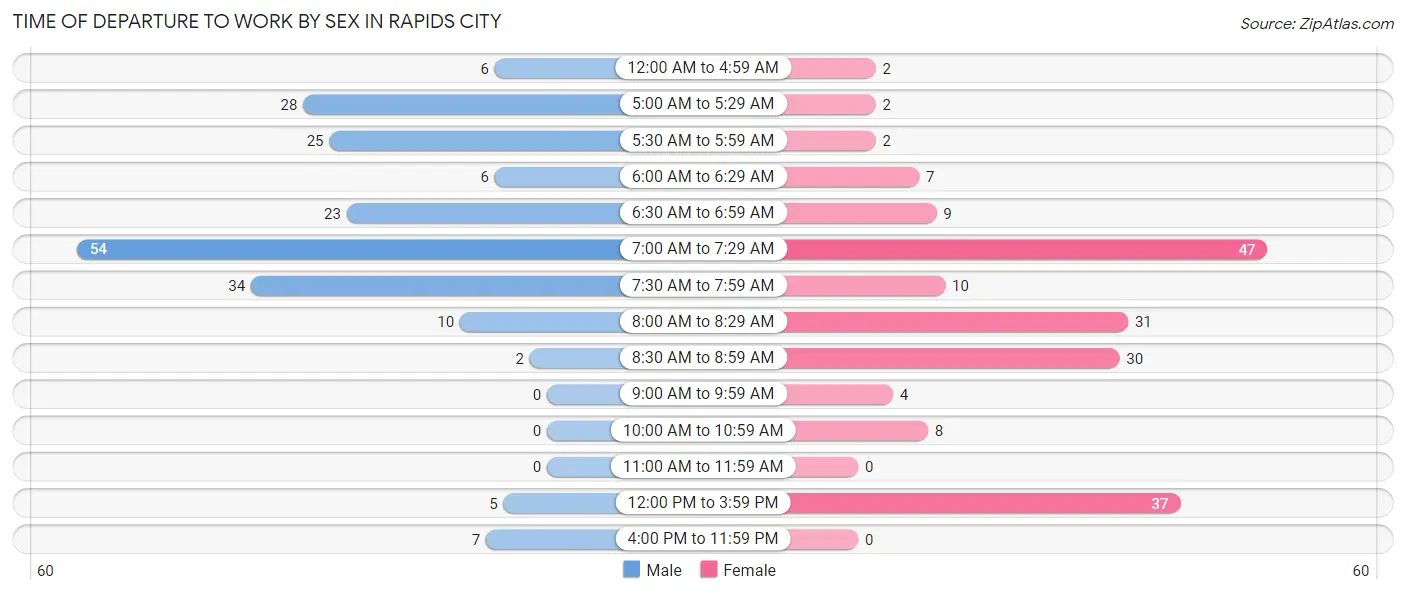
| Time of Departure | Male | Female |
| 12:00 AM to 4:59 AM | 6 (3.0%) | 2 (1.1%) |
| 5:00 AM to 5:29 AM | 28 (14.0%) | 2 (1.1%) |
| 5:30 AM to 5:59 AM | 25 (12.5%) | 2 (1.1%) |
| 6:00 AM to 6:29 AM | 6 (3.0%) | 7 (3.7%) |
| 6:30 AM to 6:59 AM | 23 (11.5%) | 9 (4.8%) |
| 7:00 AM to 7:29 AM | 54 (27.0%) | 47 (24.9%) |
| 7:30 AM to 7:59 AM | 34 (17.0%) | 10 (5.3%) |
| 8:00 AM to 8:29 AM | 10 (5.0%) | 31 (16.4%) |
| 8:30 AM to 8:59 AM | 2 (1.0%) | 30 (15.9%) |
| 9:00 AM to 9:59 AM | 0 (0.0%) | 4 (2.1%) |
| 10:00 AM to 10:59 AM | 0 (0.0%) | 8 (4.2%) |
| 11:00 AM to 11:59 AM | 0 (0.0%) | 0 (0.0%) |
| 12:00 PM to 3:59 PM | 5 (2.5%) | 37 (19.6%) |
| 4:00 PM to 11:59 PM | 7 (3.5%) | 0 (0.0%) |
| Total | 200 (100.0%) | 189 (100.0%) |
Housing Occupancy in Rapids City
Occupancy by Ownership in Rapids City
Of the total 388 dwellings in Rapids City, owner-occupied units account for 364 (93.8%), while renter-occupied units make up 24 (6.2%).
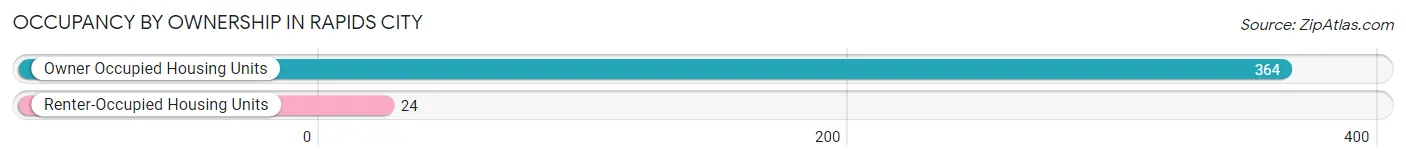
| Occupancy | # Housing Units | % Housing Units |
| Owner Occupied Housing Units | 364 | 93.8% |
| Renter-Occupied Housing Units | 24 | 6.2% |
| Total Occupied Housing Units | 388 | 100.0% |
Occupancy by Household Size in Rapids City
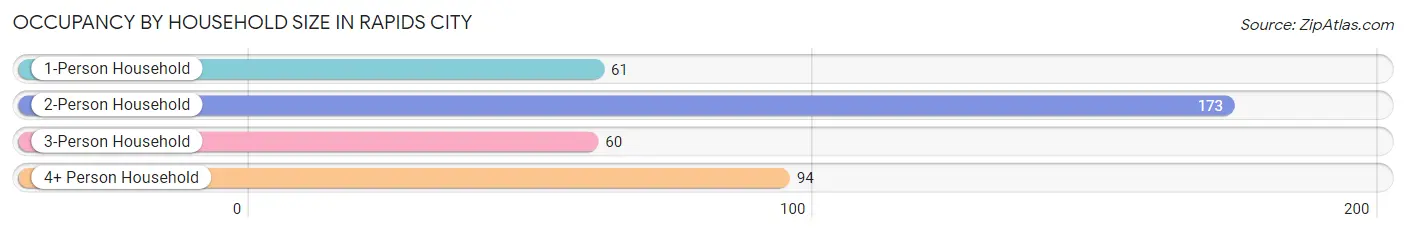
| Household Size | # Housing Units | % Housing Units |
| 1-Person Household | 61 | 15.7% |
| 2-Person Household | 173 | 44.6% |
| 3-Person Household | 60 | 15.5% |
| 4+ Person Household | 94 | 24.2% |
| Total Housing Units | 388 | 100.0% |
Occupancy by Ownership by Household Size in Rapids City
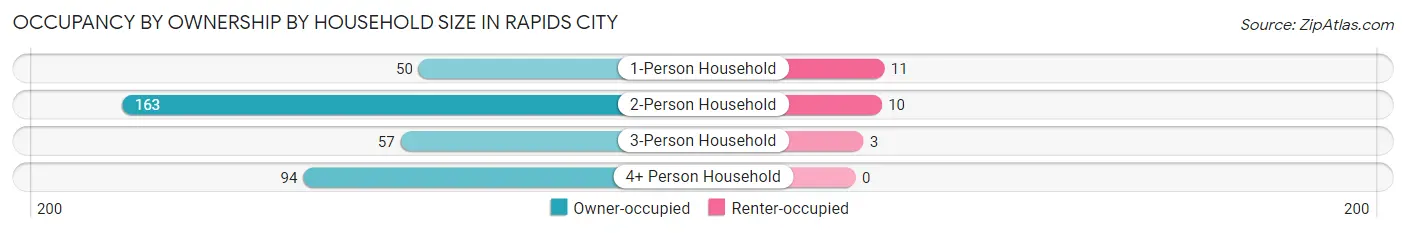
| Household Size | Owner-occupied | Renter-occupied |
| 1-Person Household | 50 (82.0%) | 11 (18.0%) |
| 2-Person Household | 163 (94.2%) | 10 (5.8%) |
| 3-Person Household | 57 (95.0%) | 3 (5.0%) |
| 4+ Person Household | 94 (100.0%) | 0 (0.0%) |
| Total Housing Units | 364 (93.8%) | 24 (6.2%) |
Occupancy by Educational Attainment in Rapids City
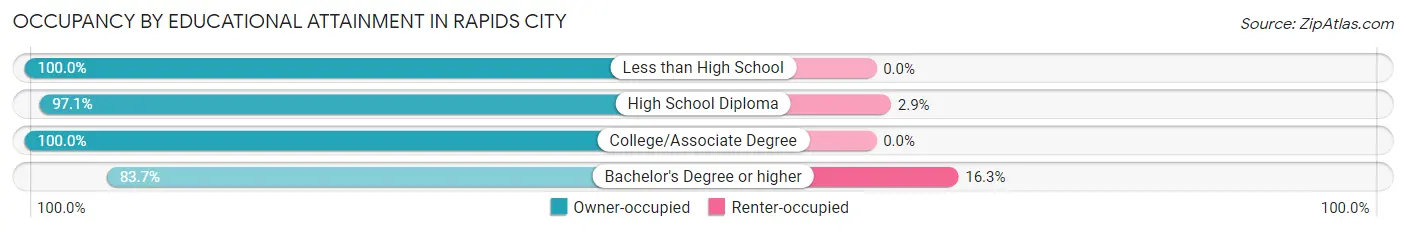
| Household Size | Owner-occupied | Renter-occupied |
| Less than High School | 29 (100.0%) | 0 (0.0%) |
| High School Diploma | 100 (97.1%) | 3 (2.9%) |
| College/Associate Degree | 127 (100.0%) | 0 (0.0%) |
| Bachelor's Degree or higher | 108 (83.7%) | 21 (16.3%) |
Occupancy by Age of Householder in Rapids City
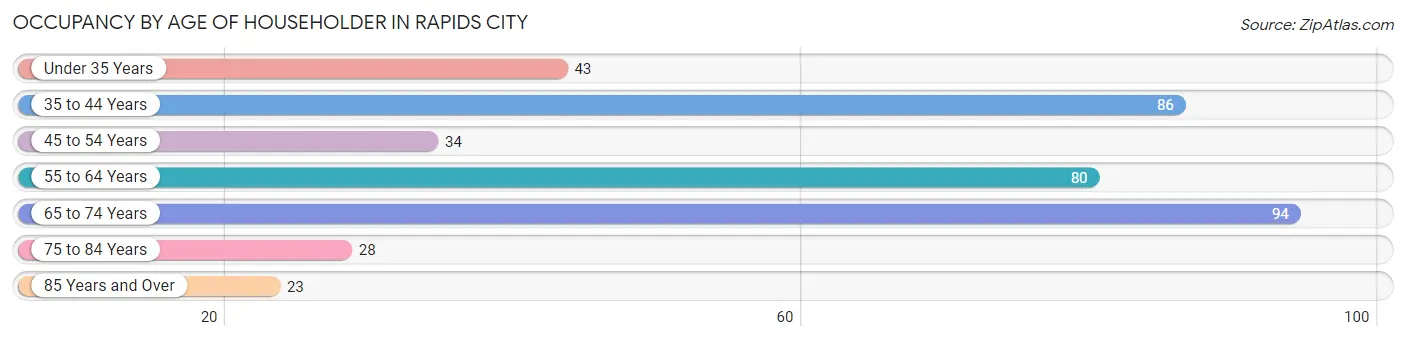
| Age Bracket | # Households | % Households |
| Under 35 Years | 43 | 11.1% |
| 35 to 44 Years | 86 | 22.2% |
| 45 to 54 Years | 34 | 8.8% |
| 55 to 64 Years | 80 | 20.6% |
| 65 to 74 Years | 94 | 24.2% |
| 75 to 84 Years | 28 | 7.2% |
| 85 Years and Over | 23 | 5.9% |
| Total | 388 | 100.0% |
Housing Finances in Rapids City
Median Income by Occupancy in Rapids City
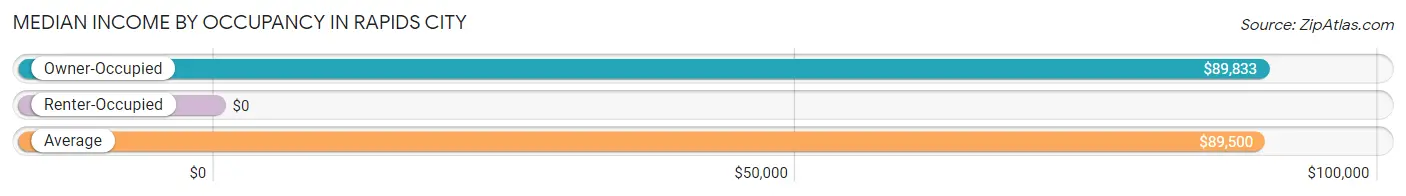
| Occupancy Type | # Households | Median Income |
| Owner-Occupied | 364 (93.8%) | $89,833 |
| Renter-Occupied | 24 (6.2%) | $0 |
| Average | 388 (100.0%) | $89,500 |
Occupancy by Householder Income Bracket in Rapids City
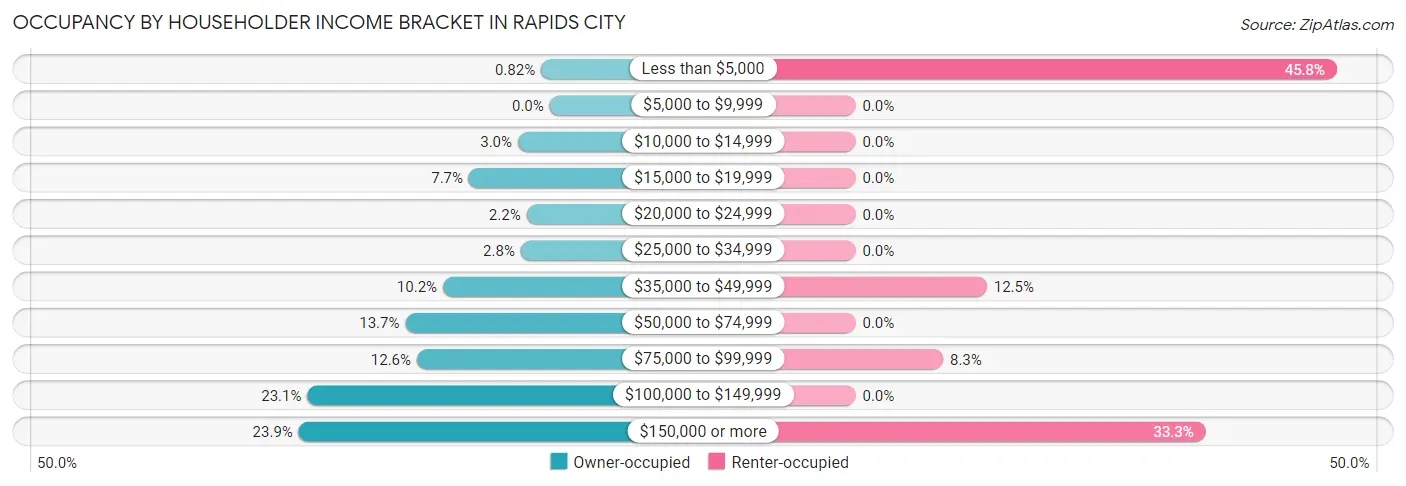
| Income Bracket | Owner-occupied | Renter-occupied |
| Less than $5,000 | 3 (0.8%) | 11 (45.8%) |
| $5,000 to $9,999 | 0 (0.0%) | 0 (0.0%) |
| $10,000 to $14,999 | 11 (3.0%) | 0 (0.0%) |
| $15,000 to $19,999 | 28 (7.7%) | 0 (0.0%) |
| $20,000 to $24,999 | 8 (2.2%) | 0 (0.0%) |
| $25,000 to $34,999 | 10 (2.8%) | 0 (0.0%) |
| $35,000 to $49,999 | 37 (10.2%) | 3 (12.5%) |
| $50,000 to $74,999 | 50 (13.7%) | 0 (0.0%) |
| $75,000 to $99,999 | 46 (12.6%) | 2 (8.3%) |
| $100,000 to $149,999 | 84 (23.1%) | 0 (0.0%) |
| $150,000 or more | 87 (23.9%) | 8 (33.3%) |
| Total | 364 (100.0%) | 24 (100.0%) |
Monthly Housing Cost Tiers in Rapids City
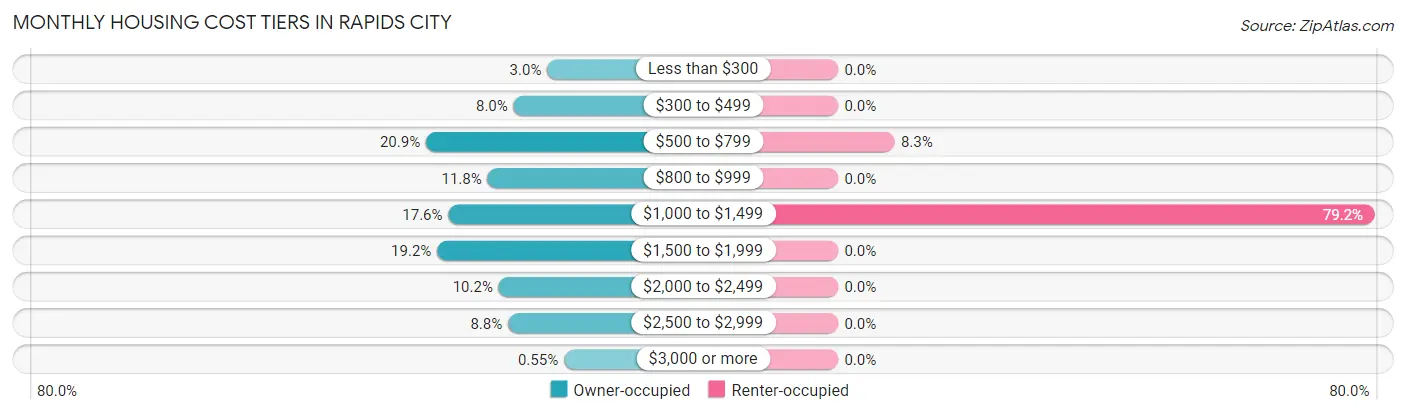
| Monthly Cost | Owner-occupied | Renter-occupied |
| Less than $300 | 11 (3.0%) | 0 (0.0%) |
| $300 to $499 | 29 (8.0%) | 0 (0.0%) |
| $500 to $799 | 76 (20.9%) | 2 (8.3%) |
| $800 to $999 | 43 (11.8%) | 0 (0.0%) |
| $1,000 to $1,499 | 64 (17.6%) | 19 (79.2%) |
| $1,500 to $1,999 | 70 (19.2%) | 0 (0.0%) |
| $2,000 to $2,499 | 37 (10.2%) | 0 (0.0%) |
| $2,500 to $2,999 | 32 (8.8%) | 0 (0.0%) |
| $3,000 or more | 2 (0.5%) | 0 (0.0%) |
| Total | 364 (100.0%) | 24 (100.0%) |
Physical Housing Characteristics in Rapids City
Housing Structures in Rapids City
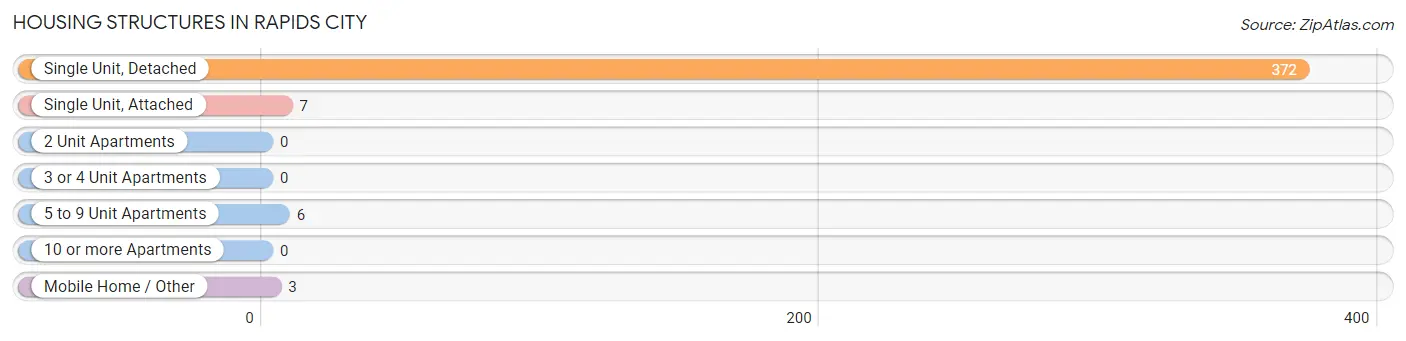
| Structure Type | # Housing Units | % Housing Units |
| Single Unit, Detached | 372 | 95.9% |
| Single Unit, Attached | 7 | 1.8% |
| 2 Unit Apartments | 0 | 0.0% |
| 3 or 4 Unit Apartments | 0 | 0.0% |
| 5 to 9 Unit Apartments | 6 | 1.5% |
| 10 or more Apartments | 0 | 0.0% |
| Mobile Home / Other | 3 | 0.8% |
| Total | 388 | 100.0% |
Housing Structures by Occupancy in Rapids City
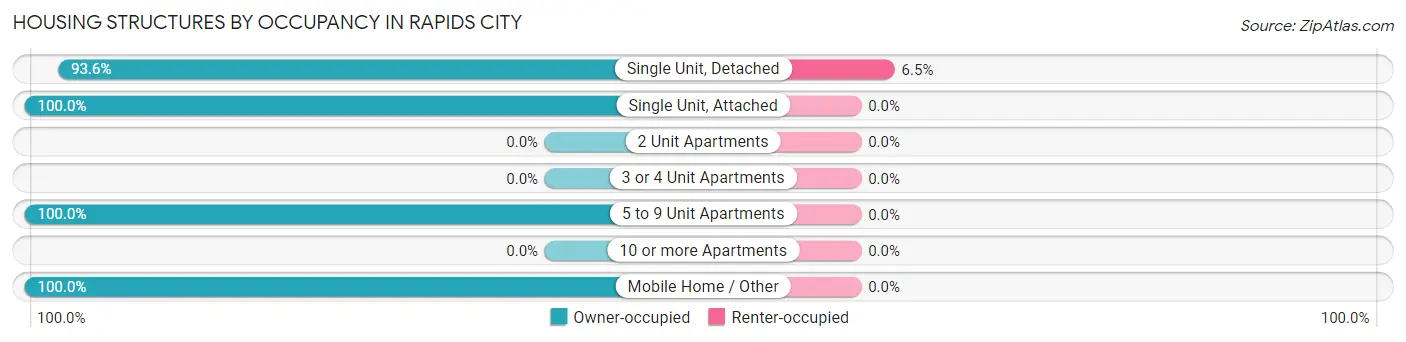
| Structure Type | Owner-occupied | Renter-occupied |
| Single Unit, Detached | 348 (93.5%) | 24 (6.5%) |
| Single Unit, Attached | 7 (100.0%) | 0 (0.0%) |
| 2 Unit Apartments | 0 (0.0%) | 0 (0.0%) |
| 3 or 4 Unit Apartments | 0 (0.0%) | 0 (0.0%) |
| 5 to 9 Unit Apartments | 6 (100.0%) | 0 (0.0%) |
| 10 or more Apartments | 0 (0.0%) | 0 (0.0%) |
| Mobile Home / Other | 3 (100.0%) | 0 (0.0%) |
| Total | 364 (93.8%) | 24 (6.2%) |
Housing Structures by Number of Rooms in Rapids City
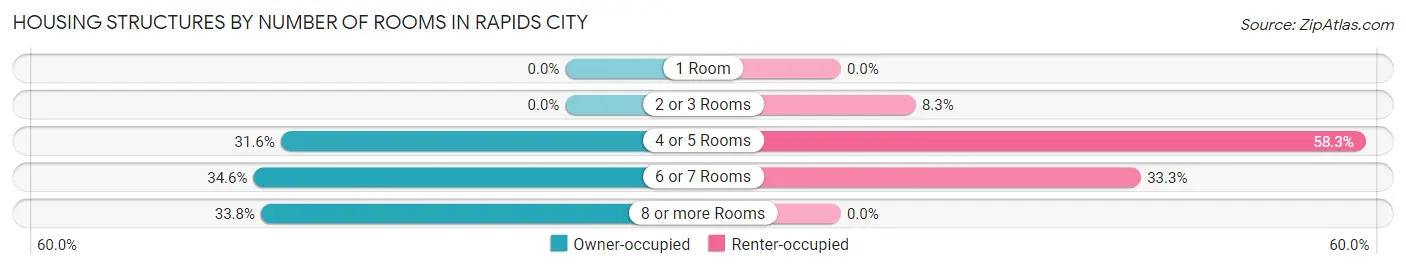
| Number of Rooms | Owner-occupied | Renter-occupied |
| 1 Room | 0 (0.0%) | 0 (0.0%) |
| 2 or 3 Rooms | 0 (0.0%) | 2 (8.3%) |
| 4 or 5 Rooms | 115 (31.6%) | 14 (58.3%) |
| 6 or 7 Rooms | 126 (34.6%) | 8 (33.3%) |
| 8 or more Rooms | 123 (33.8%) | 0 (0.0%) |
| Total | 364 (100.0%) | 24 (100.0%) |
Housing Structure by Heating Type in Rapids City
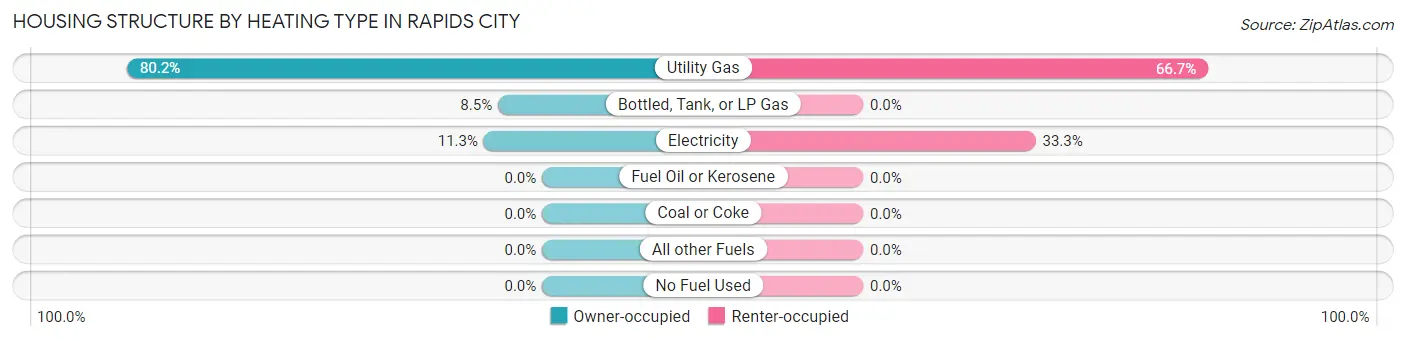
| Heating Type | Owner-occupied | Renter-occupied |
| Utility Gas | 292 (80.2%) | 16 (66.7%) |
| Bottled, Tank, or LP Gas | 31 (8.5%) | 0 (0.0%) |
| Electricity | 41 (11.3%) | 8 (33.3%) |
| Fuel Oil or Kerosene | 0 (0.0%) | 0 (0.0%) |
| Coal or Coke | 0 (0.0%) | 0 (0.0%) |
| All other Fuels | 0 (0.0%) | 0 (0.0%) |
| No Fuel Used | 0 (0.0%) | 0 (0.0%) |
| Total | 364 (100.0%) | 24 (100.0%) |
Household Vehicle Usage in Rapids City
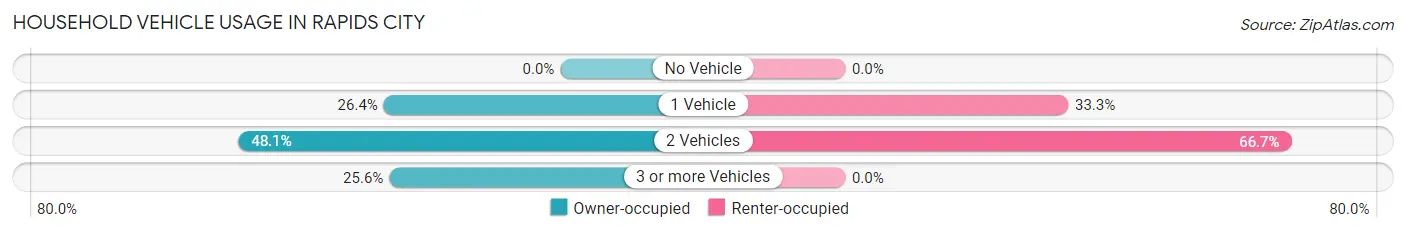
| Vehicles per Household | Owner-occupied | Renter-occupied |
| No Vehicle | 0 (0.0%) | 0 (0.0%) |
| 1 Vehicle | 96 (26.4%) | 8 (33.3%) |
| 2 Vehicles | 175 (48.1%) | 16 (66.7%) |
| 3 or more Vehicles | 93 (25.6%) | 0 (0.0%) |
| Total | 364 (100.0%) | 24 (100.0%) |
Real Estate & Mortgages in Rapids City
Real Estate and Mortgage Overview in Rapids City
| Characteristic | Without Mortgage | With Mortgage |
| Housing Units | 170 | 194 |
| Median Property Value | $161,800 | $257,800 |
| Median Household Income | $73,750 | $61 |
| Monthly Housing Costs | $598 | $2 |
| Real Estate Taxes | $3,259 | $0 |
Property Value by Mortgage Status in Rapids City
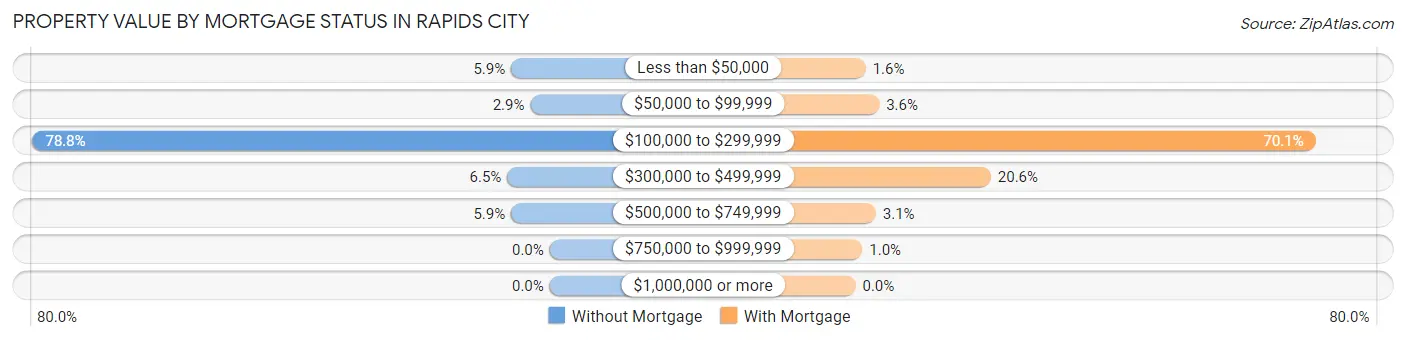
| Property Value | Without Mortgage | With Mortgage |
| Less than $50,000 | 10 (5.9%) | 3 (1.5%) |
| $50,000 to $99,999 | 5 (2.9%) | 7 (3.6%) |
| $100,000 to $299,999 | 134 (78.8%) | 136 (70.1%) |
| $300,000 to $499,999 | 11 (6.5%) | 40 (20.6%) |
| $500,000 to $749,999 | 10 (5.9%) | 6 (3.1%) |
| $750,000 to $999,999 | 0 (0.0%) | 2 (1.0%) |
| $1,000,000 or more | 0 (0.0%) | 0 (0.0%) |
| Total | 170 (100.0%) | 194 (100.0%) |
Household Income by Mortgage Status in Rapids City
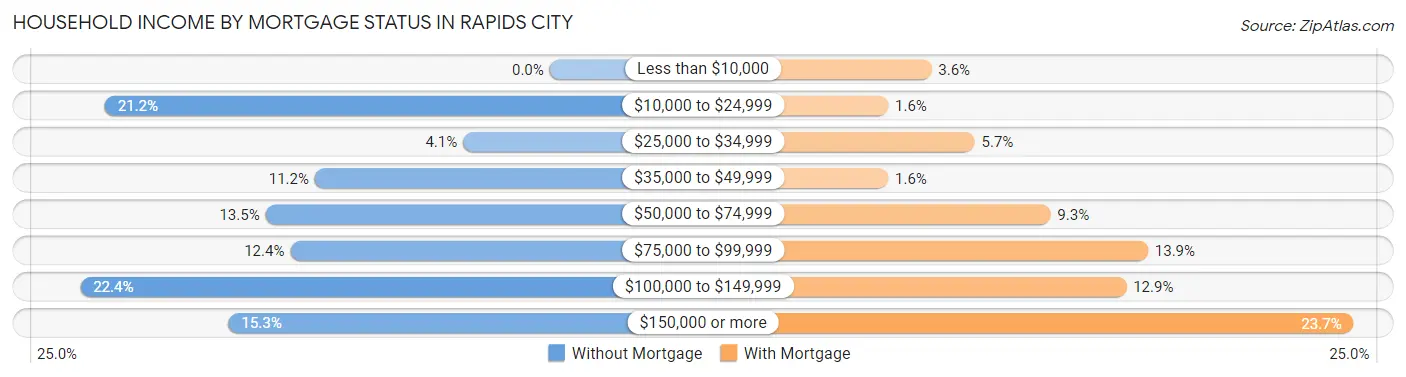
| Household Income | Without Mortgage | With Mortgage |
| Less than $10,000 | 0 (0.0%) | 7 (3.6%) |
| $10,000 to $24,999 | 36 (21.2%) | 3 (1.5%) |
| $25,000 to $34,999 | 7 (4.1%) | 11 (5.7%) |
| $35,000 to $49,999 | 19 (11.2%) | 3 (1.5%) |
| $50,000 to $74,999 | 23 (13.5%) | 18 (9.3%) |
| $75,000 to $99,999 | 21 (12.3%) | 27 (13.9%) |
| $100,000 to $149,999 | 38 (22.4%) | 25 (12.9%) |
| $150,000 or more | 26 (15.3%) | 46 (23.7%) |
| Total | 170 (100.0%) | 194 (100.0%) |
Property Value to Household Income Ratio in Rapids City
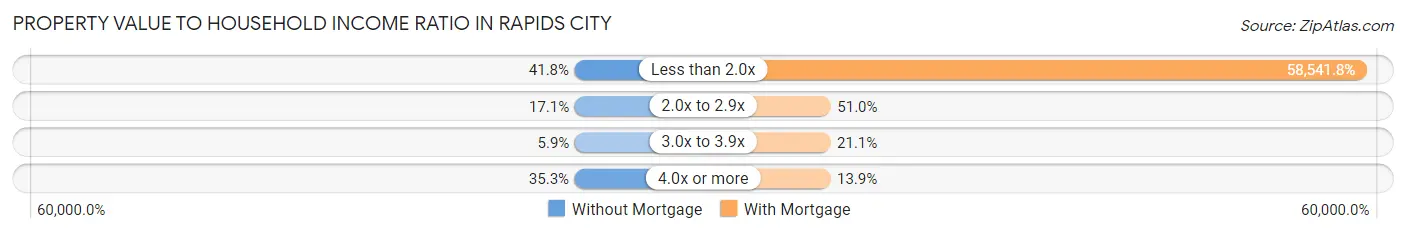
| Value-to-Income Ratio | Without Mortgage | With Mortgage |
| Less than 2.0x | 71 (41.8%) | 113,571 (58,541.8%) |
| 2.0x to 2.9x | 29 (17.1%) | 99 (51.0%) |
| 3.0x to 3.9x | 10 (5.9%) | 41 (21.1%) |
| 4.0x or more | 60 (35.3%) | 27 (13.9%) |
| Total | 170 (100.0%) | 194 (100.0%) |
Real Estate Taxes by Mortgage Status in Rapids City
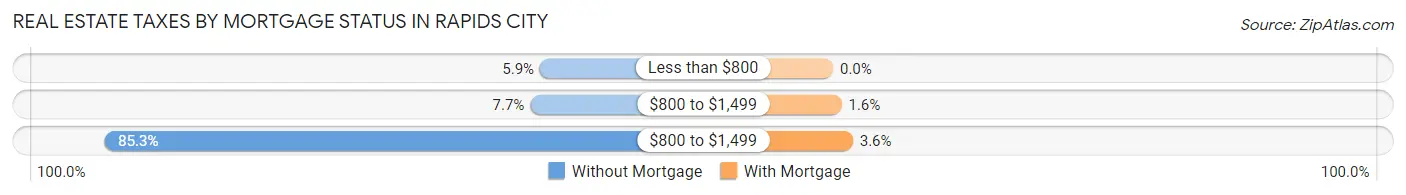
| Property Taxes | Without Mortgage | With Mortgage |
| Less than $800 | 10 (5.9%) | 0 (0.0%) |
| $800 to $1,499 | 13 (7.6%) | 3 (1.5%) |
| $800 to $1,499 | 145 (85.3%) | 7 (3.6%) |
| Total | 170 (100.0%) | 194 (100.0%) |
Health & Disability in Rapids City
Health Insurance Coverage by Age in Rapids City
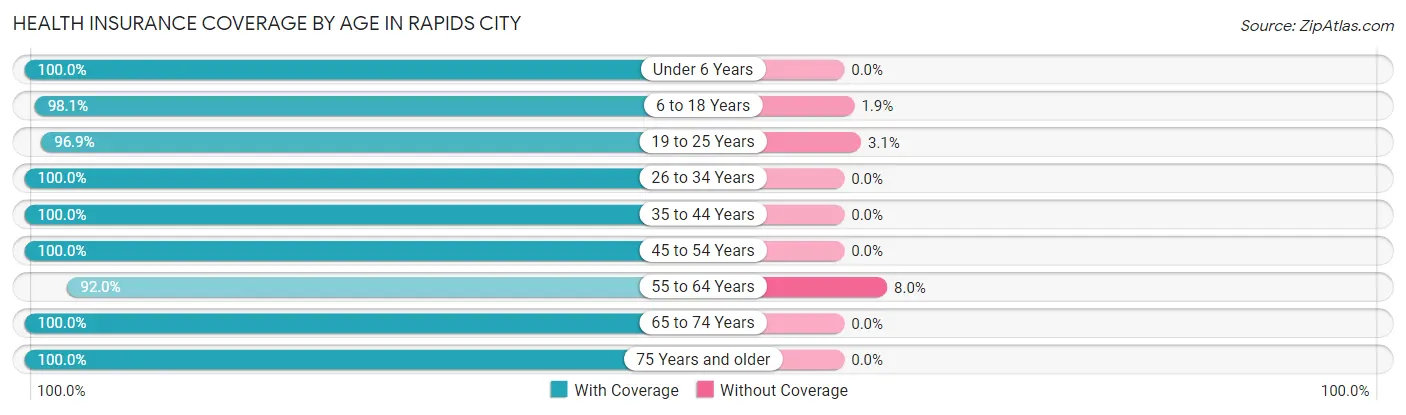
| Age Bracket | With Coverage | Without Coverage |
| Under 6 Years | 41 (100.0%) | 0 (0.0%) |
| 6 to 18 Years | 207 (98.1%) | 4 (1.9%) |
| 19 to 25 Years | 62 (96.9%) | 2 (3.1%) |
| 26 to 34 Years | 54 (100.0%) | 0 (0.0%) |
| 35 to 44 Years | 136 (100.0%) | 0 (0.0%) |
| 45 to 54 Years | 81 (100.0%) | 0 (0.0%) |
| 55 to 64 Years | 150 (92.0%) | 13 (8.0%) |
| 65 to 74 Years | 163 (100.0%) | 0 (0.0%) |
| 75 Years and older | 71 (100.0%) | 0 (0.0%) |
| Total | 965 (98.1%) | 19 (1.9%) |
Health Insurance Coverage by Citizenship Status in Rapids City
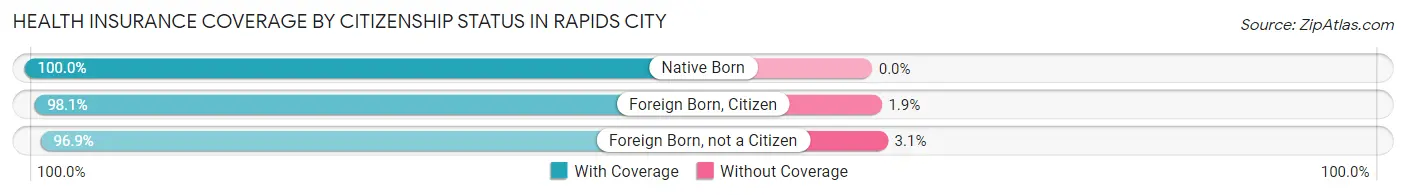
| Citizenship Status | With Coverage | Without Coverage |
| Native Born | 41 (100.0%) | 0 (0.0%) |
| Foreign Born, Citizen | 207 (98.1%) | 4 (1.9%) |
| Foreign Born, not a Citizen | 62 (96.9%) | 2 (3.1%) |
Health Insurance Coverage by Household Income in Rapids City
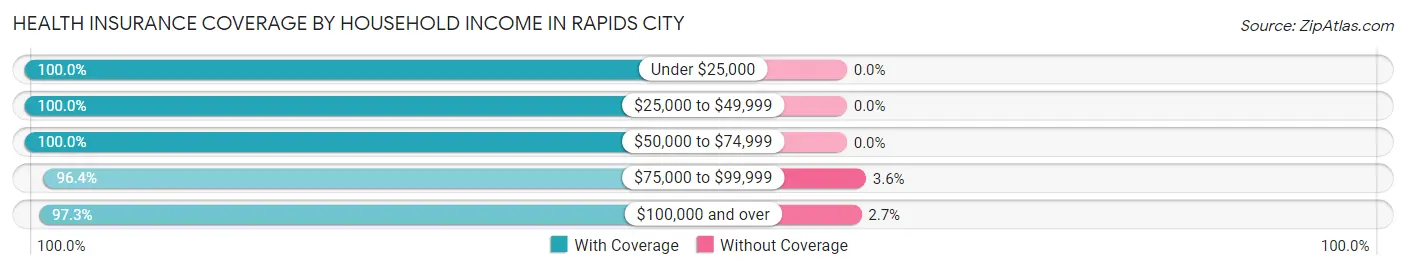
| Household Income | With Coverage | Without Coverage |
| Under $25,000 | 95 (100.0%) | 0 (0.0%) |
| $25,000 to $49,999 | 90 (100.0%) | 0 (0.0%) |
| $50,000 to $74,999 | 138 (100.0%) | 0 (0.0%) |
| $75,000 to $99,999 | 108 (96.4%) | 4 (3.6%) |
| $100,000 and over | 534 (97.3%) | 15 (2.7%) |
Public vs Private Health Insurance Coverage by Age in Rapids City
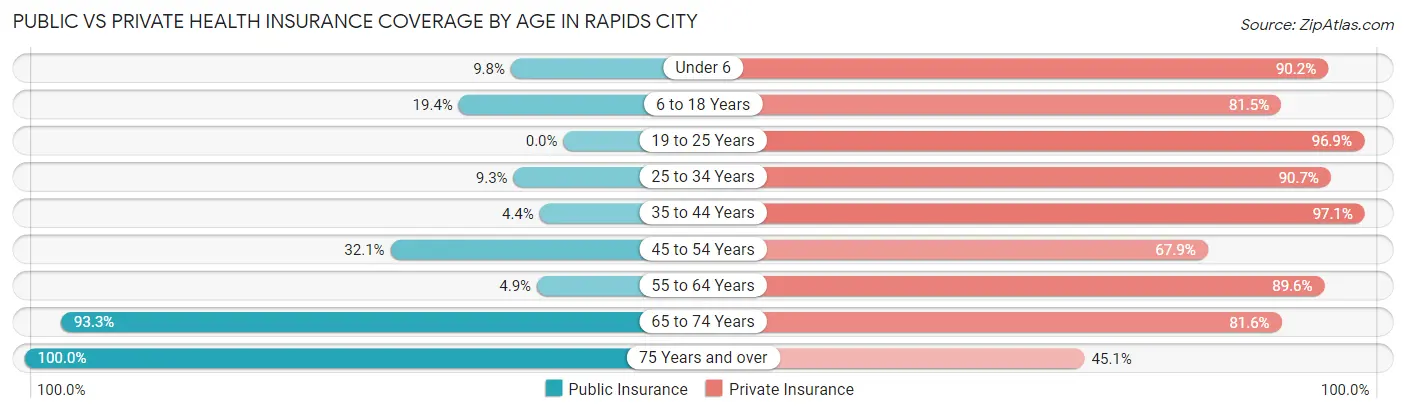
| Age Bracket | Public Insurance | Private Insurance |
| Under 6 | 4 (9.8%) | 37 (90.2%) |
| 6 to 18 Years | 41 (19.4%) | 172 (81.5%) |
| 19 to 25 Years | 0 (0.0%) | 62 (96.9%) |
| 25 to 34 Years | 5 (9.3%) | 49 (90.7%) |
| 35 to 44 Years | 6 (4.4%) | 132 (97.1%) |
| 45 to 54 Years | 26 (32.1%) | 55 (67.9%) |
| 55 to 64 Years | 8 (4.9%) | 146 (89.6%) |
| 65 to 74 Years | 152 (93.2%) | 133 (81.6%) |
| 75 Years and over | 71 (100.0%) | 32 (45.1%) |
| Total | 313 (31.8%) | 818 (83.1%) |
Disability Status by Sex by Age in Rapids City
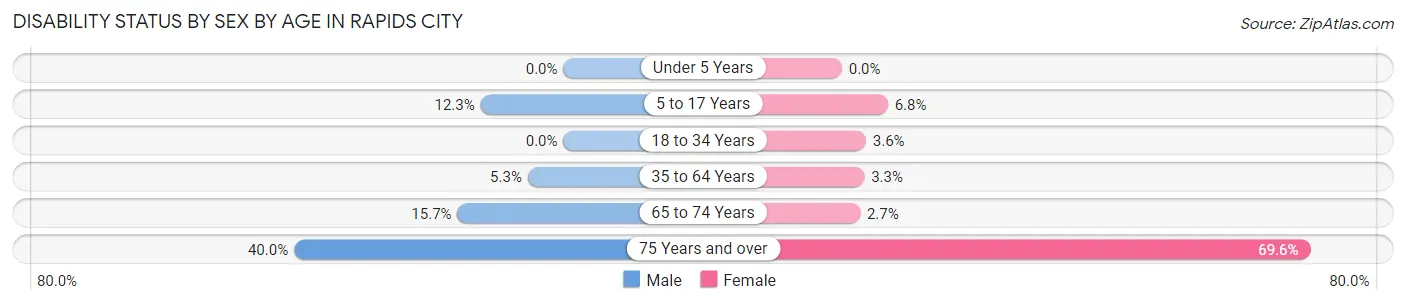
| Age Bracket | Male | Female |
| Under 5 Years | 0 (0.0%) | 0 (0.0%) |
| 5 to 17 Years | 15 (12.3%) | 6 (6.8%) |
| 18 to 34 Years | 0 (0.0%) | 2 (3.6%) |
| 35 to 64 Years | 9 (5.3%) | 7 (3.3%) |
| 65 to 74 Years | 14 (15.7%) | 2 (2.7%) |
| 75 Years and over | 10 (40.0%) | 32 (69.6%) |
Disability Class by Sex by Age in Rapids City
Disability Class: Hearing Difficulty
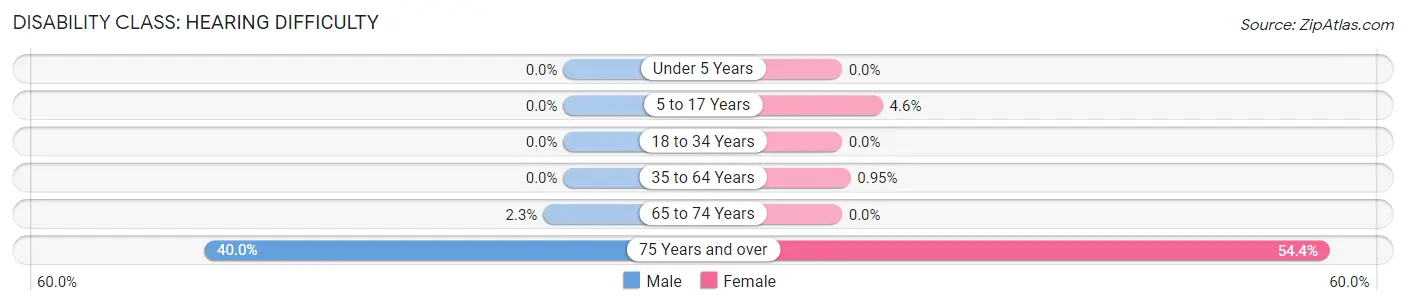
| Age Bracket | Male | Female |
| Under 5 Years | 0 (0.0%) | 0 (0.0%) |
| 5 to 17 Years | 0 (0.0%) | 4 (4.5%) |
| 18 to 34 Years | 0 (0.0%) | 0 (0.0%) |
| 35 to 64 Years | 0 (0.0%) | 2 (0.9%) |
| 65 to 74 Years | 2 (2.2%) | 0 (0.0%) |
| 75 Years and over | 10 (40.0%) | 25 (54.3%) |
Disability Class: Vision Difficulty
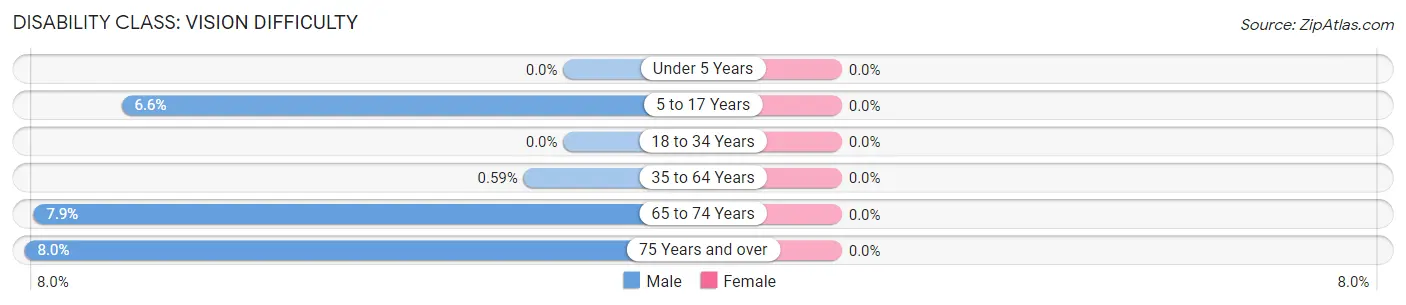
| Age Bracket | Male | Female |
| Under 5 Years | 0 (0.0%) | 0 (0.0%) |
| 5 to 17 Years | 8 (6.6%) | 0 (0.0%) |
| 18 to 34 Years | 0 (0.0%) | 0 (0.0%) |
| 35 to 64 Years | 1 (0.6%) | 0 (0.0%) |
| 65 to 74 Years | 7 (7.9%) | 0 (0.0%) |
| 75 Years and over | 2 (8.0%) | 0 (0.0%) |
Disability Class: Cognitive Difficulty
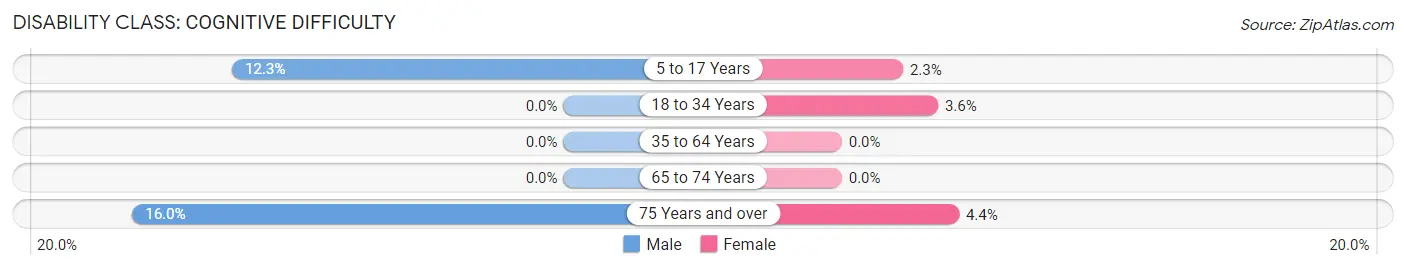
| Age Bracket | Male | Female |
| 5 to 17 Years | 15 (12.3%) | 2 (2.3%) |
| 18 to 34 Years | 0 (0.0%) | 2 (3.6%) |
| 35 to 64 Years | 0 (0.0%) | 0 (0.0%) |
| 65 to 74 Years | 0 (0.0%) | 0 (0.0%) |
| 75 Years and over | 4 (16.0%) | 2 (4.3%) |
Disability Class: Ambulatory Difficulty
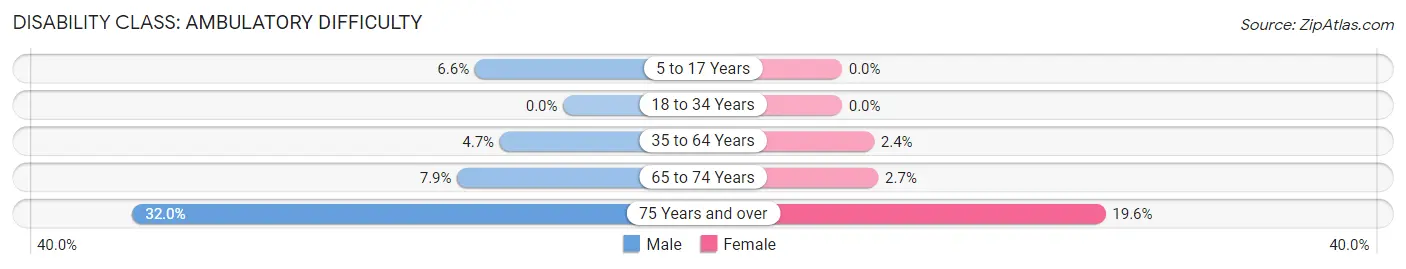
| Age Bracket | Male | Female |
| 5 to 17 Years | 8 (6.6%) | 0 (0.0%) |
| 18 to 34 Years | 0 (0.0%) | 0 (0.0%) |
| 35 to 64 Years | 8 (4.7%) | 5 (2.4%) |
| 65 to 74 Years | 7 (7.9%) | 2 (2.7%) |
| 75 Years and over | 8 (32.0%) | 9 (19.6%) |
Disability Class: Self-Care Difficulty
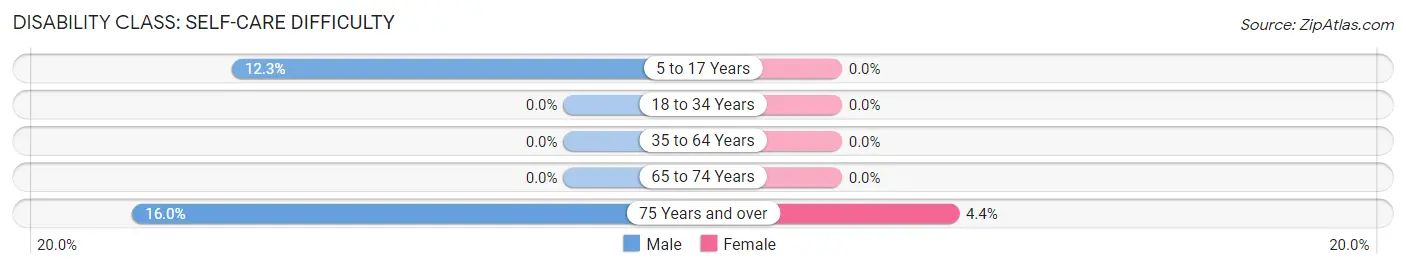
| Age Bracket | Male | Female |
| 5 to 17 Years | 15 (12.3%) | 0 (0.0%) |
| 18 to 34 Years | 0 (0.0%) | 0 (0.0%) |
| 35 to 64 Years | 0 (0.0%) | 0 (0.0%) |
| 65 to 74 Years | 0 (0.0%) | 0 (0.0%) |
| 75 Years and over | 4 (16.0%) | 2 (4.3%) |
Technology Access in Rapids City
Computing Device Access in Rapids City
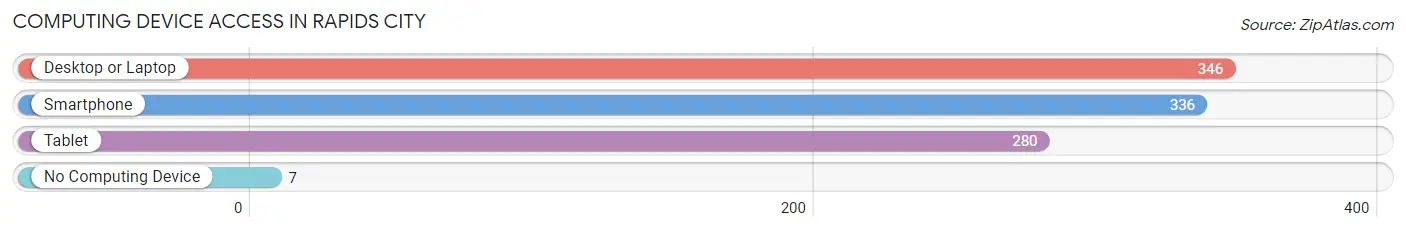
| Device Type | # Households | % Households |
| Desktop or Laptop | 346 | 89.2% |
| Smartphone | 336 | 86.6% |
| Tablet | 280 | 72.2% |
| No Computing Device | 7 | 1.8% |
| Total | 388 | 100.0% |
Internet Access in Rapids City
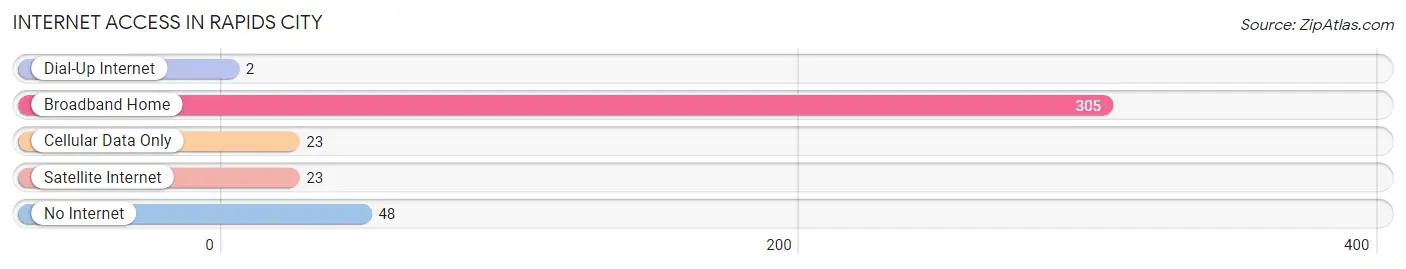
| Internet Type | # Households | % Households |
| Dial-Up Internet | 2 | 0.5% |
| Broadband Home | 305 | 78.6% |
| Cellular Data Only | 23 | 5.9% |
| Satellite Internet | 23 | 5.9% |
| No Internet | 48 | 12.4% |
| Total | 388 | 100.0% |
Rapids City Summary
Rapids City, Illinois is a small village located in Rock Island County, Illinois. It is situated on the Mississippi River, just south of the Quad Cities. The population of Rapids City was 1,845 at the 2010 census.
History
Rapids City was founded in 1836 by a group of settlers from the nearby town of Rapids. The settlers were looking for a place to settle and build a new town. The town was named after the rapids in the Mississippi River, which were a major obstacle to navigation. The rapids were eventually tamed by the construction of a series of locks and dams, which allowed for easier navigation of the river.
Rapids City was incorporated in 1854 and was a thriving river town for many years. The town was home to a number of businesses, including a sawmill, a grist mill, a blacksmith shop, and a general store. The town also had a number of churches, including the First Baptist Church, which was founded in 1856.
In the late 19th century, Rapids City was a popular destination for tourists. The town was home to a number of hotels, including the Rapids City Hotel, which was built in 1876. The hotel was a popular destination for travelers, and it was also a popular spot for locals to gather and socialize.
Geography
Rapids City is located in Rock Island County, Illinois. It is situated on the Mississippi River, just south of the Quad Cities. The town is located on the east side of the river, and is bordered by the towns of Rapids and Port Byron to the north, and the towns of Hampton and Carbon Cliff to the south. The town is located approximately 10 miles south of Moline, Illinois, and approximately 20 miles north of Davenport, Iowa.
The terrain of Rapids City is mostly flat, with some rolling hills in the area. The town is located in the Driftless Area, which is an area of the Midwest that was not affected by the last glacial period. The area is characterized by its rugged terrain and steep river valleys.
Economy
Rapids City is a small, rural community with a population of just over 1,800 people. The town is home to a number of small businesses, including a grocery store, a hardware store, a gas station, and a few restaurants. The town is also home to a number of manufacturing companies, including a plastics manufacturer and a metal fabrication company.
The town is also home to a number of agricultural businesses, including a dairy farm, a hog farm, and a number of crop farms. The town is also home to a number of small businesses, including a number of antique stores, a bakery, and a number of other small businesses.
Demographics
As of the 2010 census, the population of Rapids City was 1,845. The racial makeup of the town was 97.2% White, 0.7% African American, 0.2% Native American, 0.3% Asian, 0.1% Pacific Islander, 0.4% from other races, and 1.1% from two or more races. Hispanic or Latino of any race were 1.3% of the population.
The median income for a household in Rapids City was $45,938, and the median income for a family was $51,250. The per capita income for the town was $20,945. About 8.2% of families and 10.2% of the population were below the poverty line, including 14.2% of those under age 18 and 5.2% of those age 65 or over.
Common Questions
What is Per Capita Income in Rapids City?
Per Capita income in Rapids City is $40,457.
What is the Median Family Income in Rapids City?
Median Family Income in Rapids City is $115,139.
What is the Median Household income in Rapids City?
Median Household Income in Rapids City is $89,500.
What is Income or Wage Gap in Rapids City?
Income or Wage Gap in Rapids City is 27.9%.
Women in Rapids City earn 72.1 cents for every dollar earned by a man.
What is Inequality or Gini Index in Rapids City?
Inequality or Gini Index in Rapids City is 0.40.
What is the Total Population of Rapids City?
Total Population of Rapids City is 984.
What is the Total Male Population of Rapids City?
Total Male Population of Rapids City is 482.
What is the Total Female Population of Rapids City?
Total Female Population of Rapids City is 502.
What is the Ratio of Males per 100 Females in Rapids City?
There are 96.02 Males per 100 Females in Rapids City.
What is the Ratio of Females per 100 Males in Rapids City?
There are 104.15 Females per 100 Males in Rapids City.
What is the Median Population Age in Rapids City?
Median Population Age in Rapids City is 43.8 Years.
What is the Average Family Size in Rapids City
Average Family Size in Rapids City is 2.9 People.
What is the Average Household Size in Rapids City
Average Household Size in Rapids City is 2.5 People.
How Large is the Labor Force in Rapids City?
There are 455 People in the Labor Forcein in Rapids City.
What is the Percentage of People in the Labor Force in Rapids City?
60.3% of People are in the Labor Force in Rapids City.
What is the Unemployment Rate in Rapids City?
Unemployment Rate in Rapids City is 4.8%.