Grundy, VA Map & Demographics
Grundy Map
Grundy Overview
$24,893
PER CAPITA INCOME
$86,875
AVG FAMILY INCOME
11.0%
WAGE / INCOME GAP [ % ]
89.0¢/ $1
WAGE / INCOME GAP [ $ ]
0.51
INEQUALITY / GINI INDEX
777
TOTAL POPULATION
401
MALE POPULATION
376
FEMALE POPULATION
106.65
MALES / 100 FEMALES
93.77
FEMALES / 100 MALES
52.7
MEDIAN AGE
2.7
AVG FAMILY SIZE
1.9
AVG HOUSEHOLD SIZE
236
LABOR FORCE [ PEOPLE ]
35.9%
PERCENT IN LABOR FORCE
Grundy Zip Codes
Grundy Area Codes
Income in Grundy
Income Overview in Grundy
| Characteristic | Number | Measure |
| Per Capita Income | 777 | $24,893 |
| Median Family Income | 150 | $86,875 |
| Mean Family Income | 150 | $88,618 |
| Median Household Income | 358 | $0 |
| Mean Household Income | 358 | $52,789 |
| Income Deficit | 150 | $0 |
| Wage / Income Gap (%) | 777 | 10.97% |
| Wage / Income Gap ($) | 777 | 89.03¢ per $1 |
| Gini / Inequality Index | 777 | 0.51 |
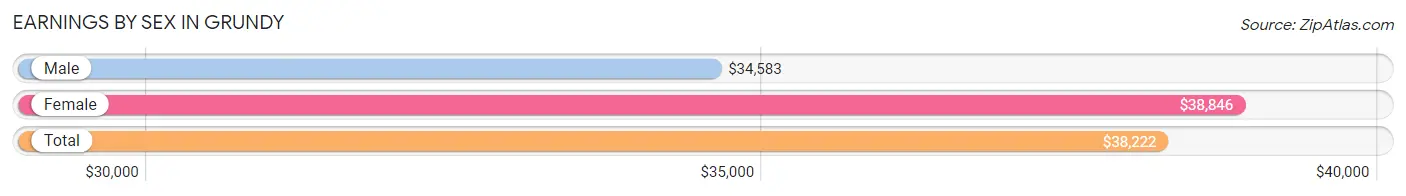
Earnings by Sex in Grundy
Average Earnings in Grundy are $38,222, $34,583 for men and $38,846 for women, a difference of 11.0%.
| Sex | Number | Average Earnings |
| Male | 128 (47.4%) | $34,583 |
| Female | 142 (52.6%) | $38,846 |
| Total | 270 (100.0%) | $38,222 |
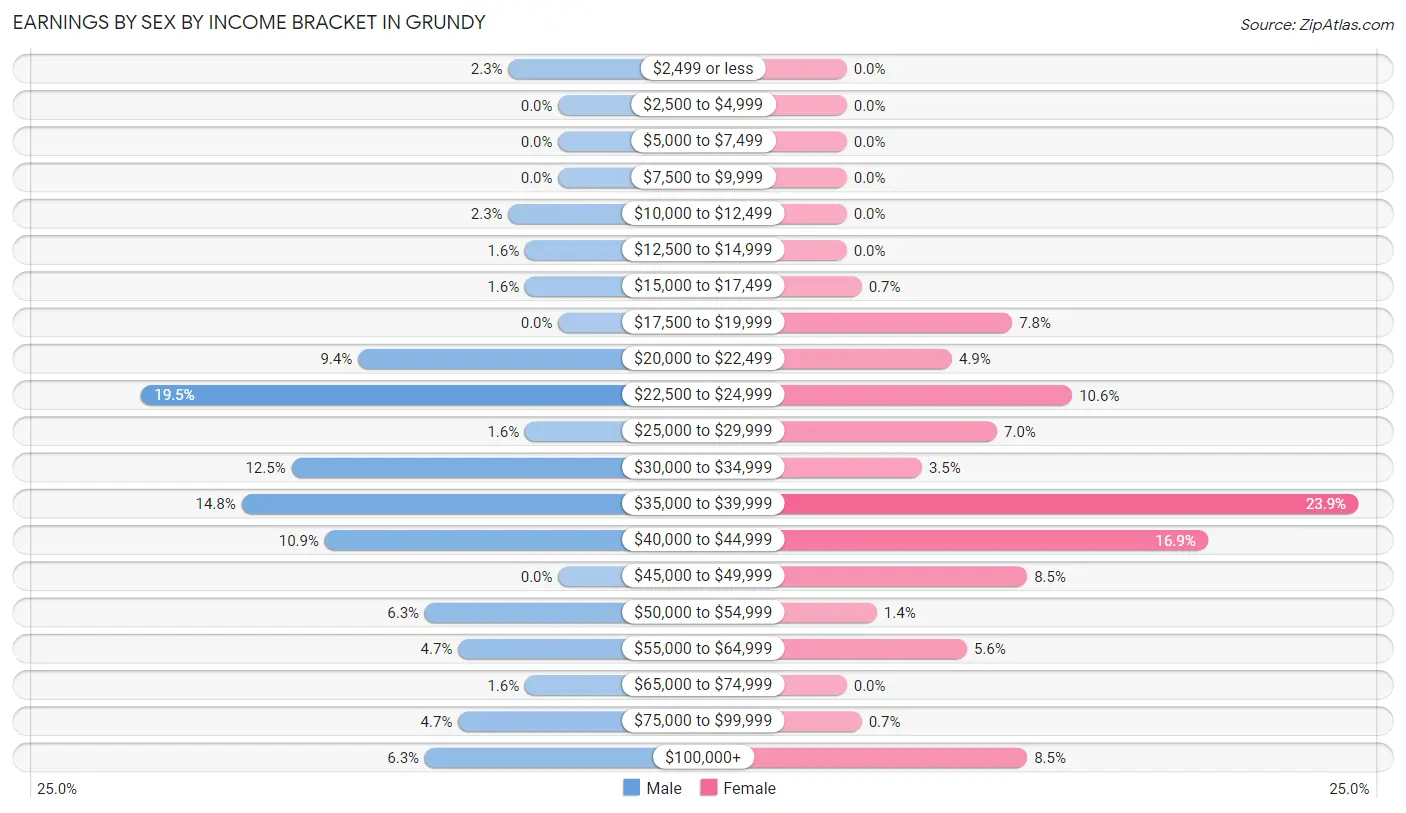
Earnings by Sex by Income Bracket in Grundy
The most common earnings brackets in Grundy are $22,500 to $24,999 for men (25 | 19.5%) and $35,000 to $39,999 for women (34 | 23.9%).
| Income | Male | Female |
| $2,499 or less | 3 (2.3%) | 0 (0.0%) |
| $2,500 to $4,999 | 0 (0.0%) | 0 (0.0%) |
| $5,000 to $7,499 | 0 (0.0%) | 0 (0.0%) |
| $7,500 to $9,999 | 0 (0.0%) | 0 (0.0%) |
| $10,000 to $12,499 | 3 (2.3%) | 0 (0.0%) |
| $12,500 to $14,999 | 2 (1.6%) | 0 (0.0%) |
| $15,000 to $17,499 | 2 (1.6%) | 1 (0.7%) |
| $17,500 to $19,999 | 0 (0.0%) | 11 (7.7%) |
| $20,000 to $22,499 | 12 (9.4%) | 7 (4.9%) |
| $22,500 to $24,999 | 25 (19.5%) | 15 (10.6%) |
| $25,000 to $29,999 | 2 (1.6%) | 10 (7.0%) |
| $30,000 to $34,999 | 16 (12.5%) | 5 (3.5%) |
| $35,000 to $39,999 | 19 (14.8%) | 34 (23.9%) |
| $40,000 to $44,999 | 14 (10.9%) | 24 (16.9%) |
| $45,000 to $49,999 | 0 (0.0%) | 12 (8.5%) |
| $50,000 to $54,999 | 8 (6.2%) | 2 (1.4%) |
| $55,000 to $64,999 | 6 (4.7%) | 8 (5.6%) |
| $65,000 to $74,999 | 2 (1.6%) | 0 (0.0%) |
| $75,000 to $99,999 | 6 (4.7%) | 1 (0.7%) |
| $100,000+ | 8 (6.2%) | 12 (8.5%) |
| Total | 128 (100.0%) | 142 (100.0%) |
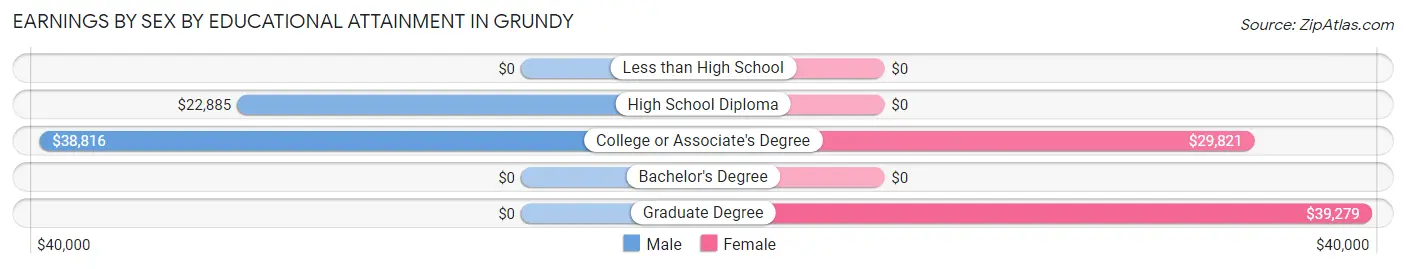
Earnings by Sex by Educational Attainment in Grundy
Average earnings in Grundy are $37,829 for men and $38,798 for women, a difference of 2.5%. Men with an educational attainment of college or associate's degree enjoy the highest average annual earnings of $38,816, while those with high school diploma education earn the least with $22,885. Women with an educational attainment of graduate degree earn the most with the average annual earnings of $39,279, while those with college or associate's degree education have the smallest earnings of $29,821.
| Educational Attainment | Male Income | Female Income |
| Less than High School | - | - |
| High School Diploma | $22,885 | $0 |
| College or Associate's Degree | $38,816 | $29,821 |
| Bachelor's Degree | - | - |
| Graduate Degree | - | - |
| Total | $37,829 | $38,798 |
Family Income in Grundy
Family Income Brackets in Grundy
According to the Grundy family income data, there are 38 families falling into the $100,000 to $149,999 income range, which is the most common income bracket and makes up 25.3% of all families.
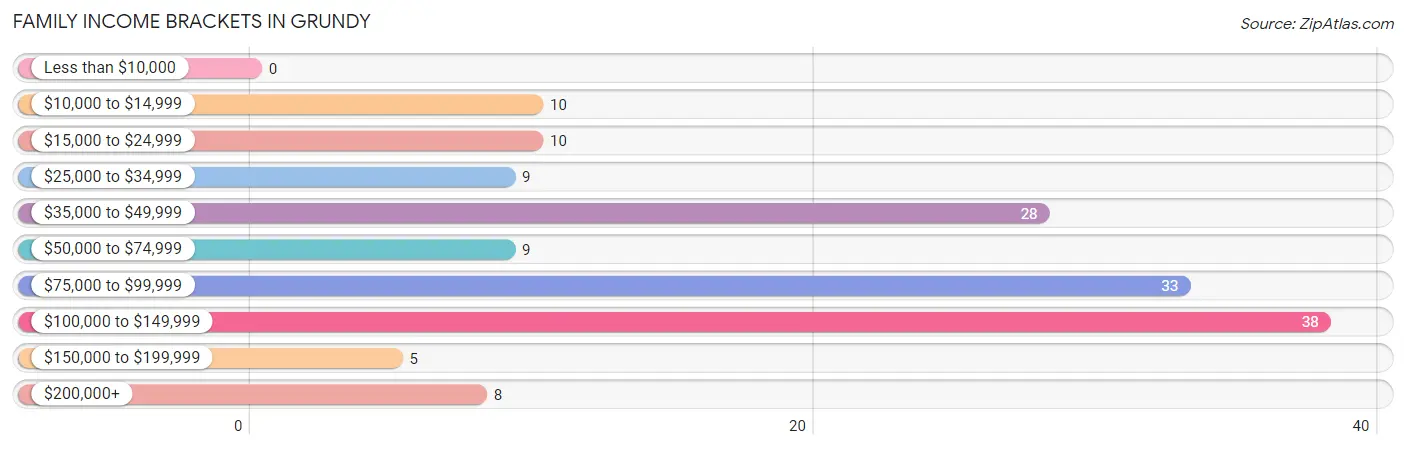
| Income Bracket | # Families | % Families |
| Less than $10,000 | 0 | 0.0% |
| $10,000 to $14,999 | 10 | 6.7% |
| $15,000 to $24,999 | 10 | 6.7% |
| $25,000 to $34,999 | 9 | 6.0% |
| $35,000 to $49,999 | 28 | 18.7% |
| $50,000 to $74,999 | 9 | 6.0% |
| $75,000 to $99,999 | 33 | 22.0% |
| $100,000 to $149,999 | 38 | 25.3% |
| $150,000 to $199,999 | 5 | 3.3% |
| $200,000+ | 8 | 5.3% |
Family Income by Famaliy Size in Grundy
2-person families (118 | 78.7%) account for the highest median family income in Grundy with $73,750 per family, while 2-person families (118 | 78.7%) have the highest median income of $36,875 per family member.
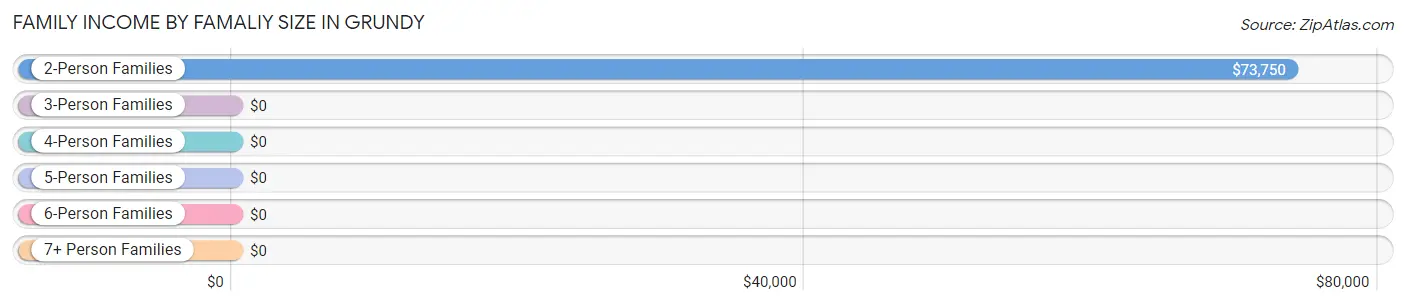
| Income Bracket | # Families | Median Income |
| 2-Person Families | 118 (78.7%) | $73,750 |
| 3-Person Families | 25 (16.7%) | $0 |
| 4-Person Families | 0 (0.0%) | $0 |
| 5-Person Families | 7 (4.7%) | $0 |
| 6-Person Families | 0 (0.0%) | $0 |
| 7+ Person Families | 0 (0.0%) | $0 |
| Total | 150 (100.0%) | $86,875 |
Family Income by Number of Earners in Grundy
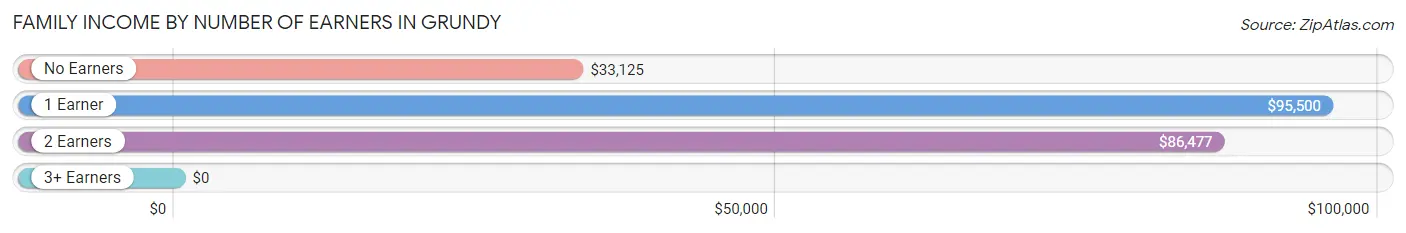
| Number of Earners | # Families | Median Income |
| No Earners | 28 (18.7%) | $33,125 |
| 1 Earner | 62 (41.3%) | $95,500 |
| 2 Earners | 53 (35.3%) | $86,477 |
| 3+ Earners | 7 (4.7%) | $0 |
| Total | 150 (100.0%) | $86,875 |
Household Income in Grundy
Household Income Brackets in Grundy
With 111 households falling in the category, the $15,000 to $24,999 income range is the most frequent in Grundy, accounting for 31.0% of all households. In contrast, only 5 households (1.4%) fall into the $150,000 to $199,999 income bracket, making it the least populous group.
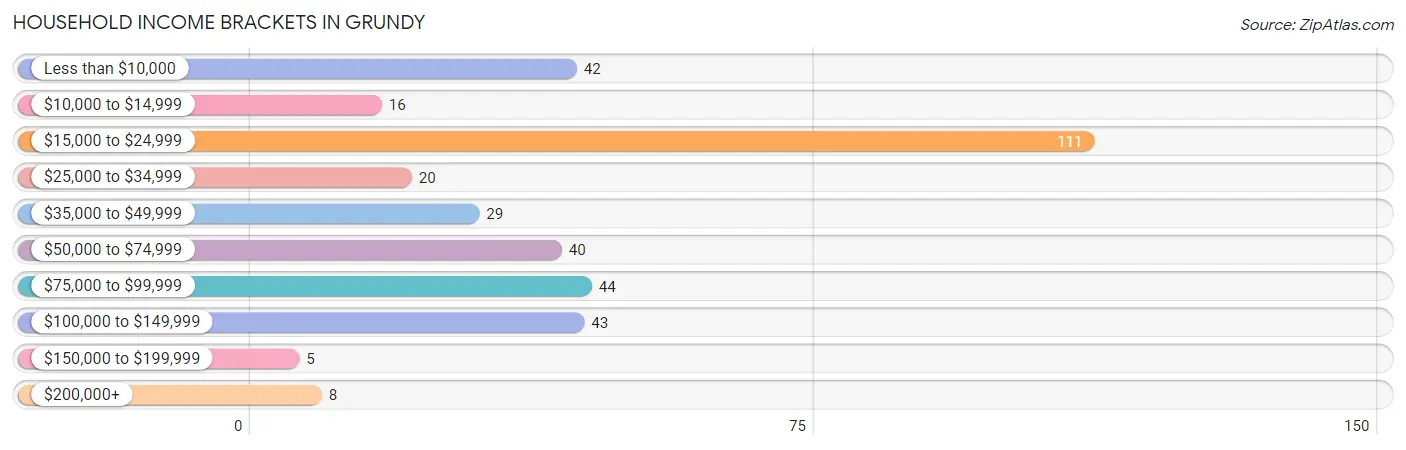
| Income Bracket | # Households | % Households |
| Less than $10,000 | 42 | 11.7% |
| $10,000 to $14,999 | 16 | 4.5% |
| $15,000 to $24,999 | 111 | 31.0% |
| $25,000 to $34,999 | 20 | 5.6% |
| $35,000 to $49,999 | 29 | 8.1% |
| $50,000 to $74,999 | 40 | 11.2% |
| $75,000 to $99,999 | 44 | 12.3% |
| $100,000 to $149,999 | 43 | 12.0% |
| $150,000 to $199,999 | 5 | 1.4% |
| $200,000+ | 8 | 2.2% |
Household Income by Householder Age in Grundy
The median household income in Grundy is $0, with the highest median household income of $65,398 found in the 45 to 64 years age bracket for the primary householder. A total of 99 households (27.7%) fall into this category. Meanwhile, the 15 to 24 years age bracket for the primary householder has the lowest median household income of $0, with 26 households (7.3%) in this group.
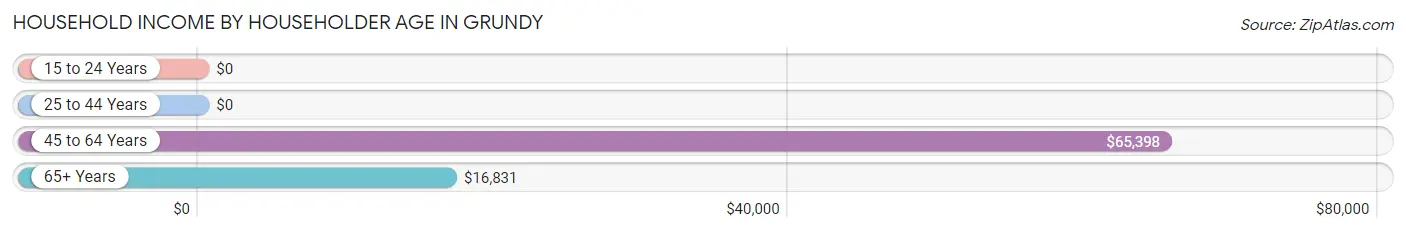
| Income Bracket | # Households | Median Income |
| 15 to 24 Years | 26 (7.3%) | $0 |
| 25 to 44 Years | 46 (12.9%) | $0 |
| 45 to 64 Years | 99 (27.7%) | $65,398 |
| 65+ Years | 187 (52.2%) | $16,831 |
| Total | 358 (100.0%) | $0 |
Poverty in Grundy
Income Below Poverty by Sex and Age in Grundy
With 32.3% poverty level for males and 21.0% for females among the residents of Grundy, 15 year old males and 6 to 11 year old females are the most vulnerable to poverty, with 1 males (100.0%) and 1 females (100.0%) in their respective age groups living below the poverty level.
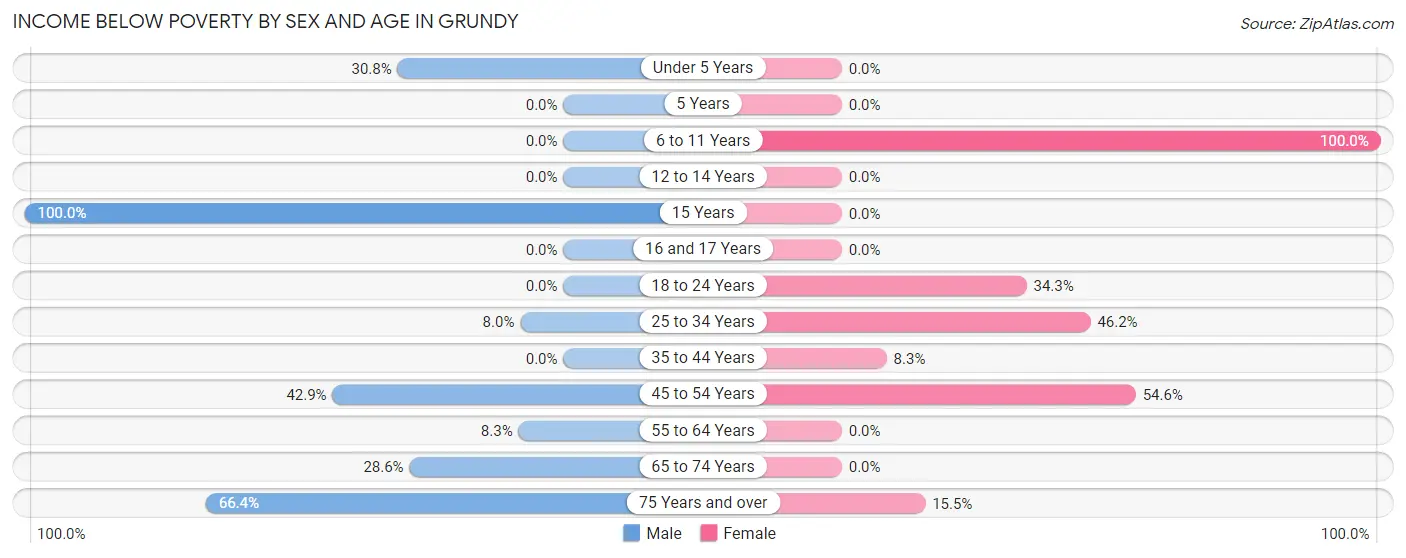
| Age Bracket | Male | Female |
| Under 5 Years | 16 (30.8%) | 0 (0.0%) |
| 5 Years | 0 (0.0%) | 0 (0.0%) |
| 6 to 11 Years | 0 (0.0%) | 1 (100.0%) |
| 12 to 14 Years | 0 (0.0%) | 0 (0.0%) |
| 15 Years | 1 (100.0%) | 0 (0.0%) |
| 16 and 17 Years | 0 (0.0%) | 0 (0.0%) |
| 18 to 24 Years | 0 (0.0%) | 12 (34.3%) |
| 25 to 34 Years | 4 (8.0%) | 6 (46.2%) |
| 35 to 44 Years | 0 (0.0%) | 1 (8.3%) |
| 45 to 54 Years | 6 (42.9%) | 36 (54.5%) |
| 55 to 64 Years | 3 (8.3%) | 0 (0.0%) |
| 65 to 74 Years | 8 (28.6%) | 0 (0.0%) |
| 75 Years and over | 71 (66.4%) | 13 (15.5%) |
| Total | 109 (32.3%) | 69 (21.0%) |
Income Above Poverty by Sex and Age in Grundy
According to the poverty statistics in Grundy, males aged 5 years and females aged under 5 years are the age groups that are most secure financially, with 100.0% of males and 100.0% of females in these age groups living above the poverty line.
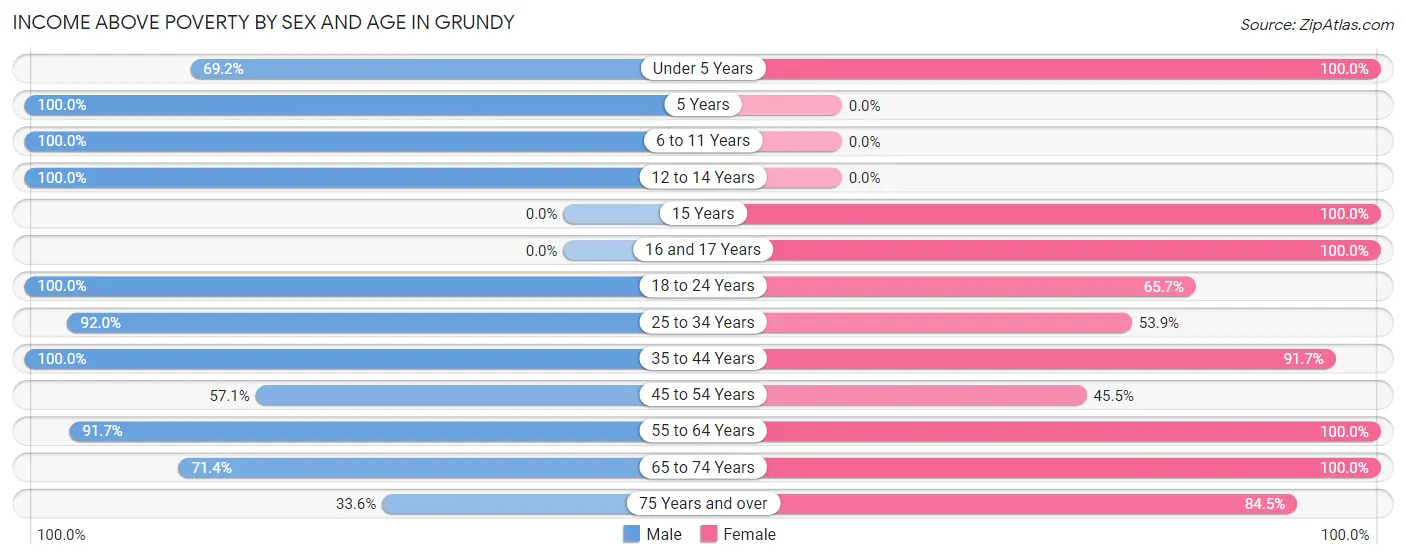
| Age Bracket | Male | Female |
| Under 5 Years | 36 (69.2%) | 2 (100.0%) |
| 5 Years | 6 (100.0%) | 0 (0.0%) |
| 6 to 11 Years | 10 (100.0%) | 0 (0.0%) |
| 12 to 14 Years | 2 (100.0%) | 0 (0.0%) |
| 15 Years | 0 (0.0%) | 3 (100.0%) |
| 16 and 17 Years | 0 (0.0%) | 6 (100.0%) |
| 18 to 24 Years | 13 (100.0%) | 23 (65.7%) |
| 25 to 34 Years | 46 (92.0%) | 7 (53.8%) |
| 35 to 44 Years | 18 (100.0%) | 11 (91.7%) |
| 45 to 54 Years | 8 (57.1%) | 30 (45.5%) |
| 55 to 64 Years | 33 (91.7%) | 77 (100.0%) |
| 65 to 74 Years | 20 (71.4%) | 29 (100.0%) |
| 75 Years and over | 36 (33.6%) | 71 (84.5%) |
| Total | 228 (67.7%) | 259 (79.0%) |
Income Below Poverty Among Married-Couple Families in Grundy
The poverty statistics for married-couple families in Grundy show that 1.8% or 2 of the total 109 families live below the poverty line. Families with no children have the highest poverty rate of 2.0%, comprising of 2 families. On the other hand, families with 3 or 4 children have the lowest poverty rate of 0.0%, which includes 0 families.
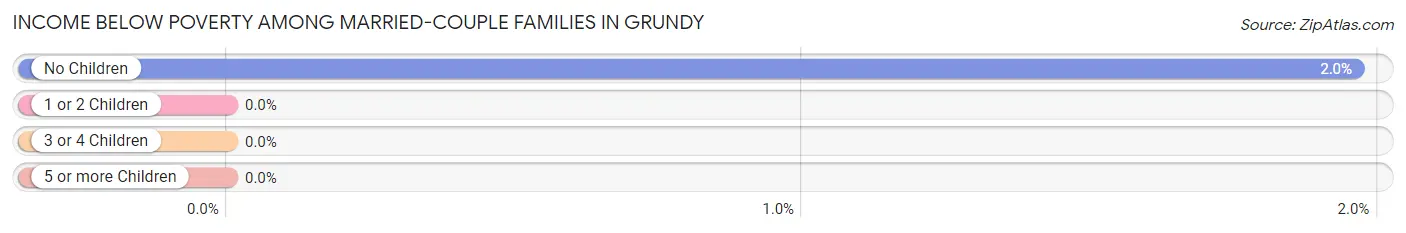
| Children | Above Poverty | Below Poverty |
| No Children | 100 (98.0%) | 2 (2.0%) |
| 1 or 2 Children | 0 (0.0%) | 0 (0.0%) |
| 3 or 4 Children | 7 (100.0%) | 0 (0.0%) |
| 5 or more Children | 0 (0.0%) | 0 (0.0%) |
| Total | 107 (98.2%) | 2 (1.8%) |
Income Below Poverty Among Single-Parent Households in Grundy
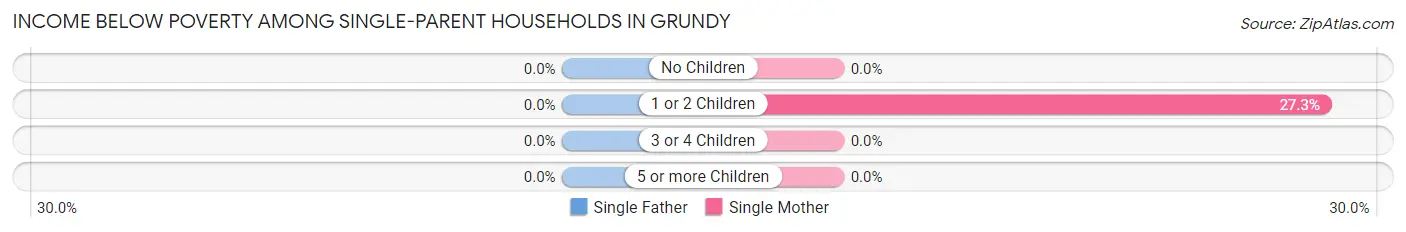
| Children | Single Father | Single Mother |
| No Children | 0 (0.0%) | 0 (0.0%) |
| 1 or 2 Children | 0 (0.0%) | 9 (27.3%) |
| 3 or 4 Children | 0 (0.0%) | 0 (0.0%) |
| 5 or more Children | 0 (0.0%) | 0 (0.0%) |
| Total | 0 (0.0%) | 9 (23.1%) |
Income Below Poverty Among Married-Couple vs Single-Parent Households in Grundy
The poverty data for Grundy shows that 2 of the married-couple family households (1.8%) and 9 of the single-parent households (22.0%) are living below the poverty level. Within the married-couple family households, those with no children have the highest poverty rate, with 2 households (2.0%) falling below the poverty line. Among the single-parent households, those with 1 or 2 children have the highest poverty rate, with 9 household (25.7%) living below poverty.
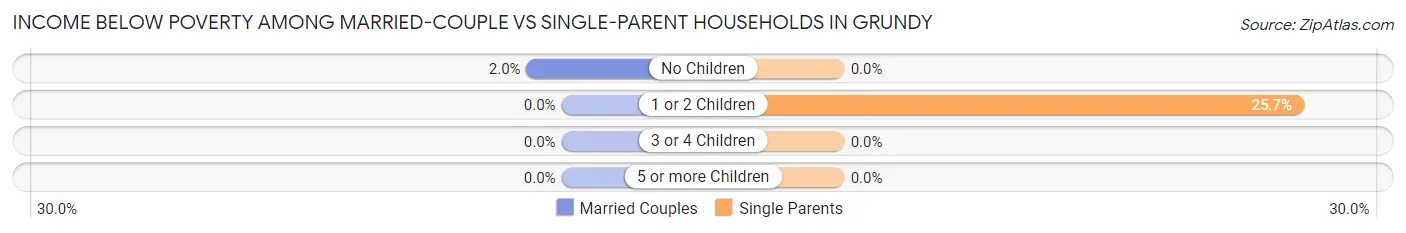
| Children | Married-Couple Families | Single-Parent Households |
| No Children | 2 (2.0%) | 0 (0.0%) |
| 1 or 2 Children | 0 (0.0%) | 9 (25.7%) |
| 3 or 4 Children | 0 (0.0%) | 0 (0.0%) |
| 5 or more Children | 0 (0.0%) | 0 (0.0%) |
| Total | 2 (1.8%) | 9 (22.0%) |
Race in Grundy
The most populous races in Grundy are White / Caucasian (629 | 80.9%), Black / African American (76 | 9.8%), and Some other Race (37 | 4.8%).
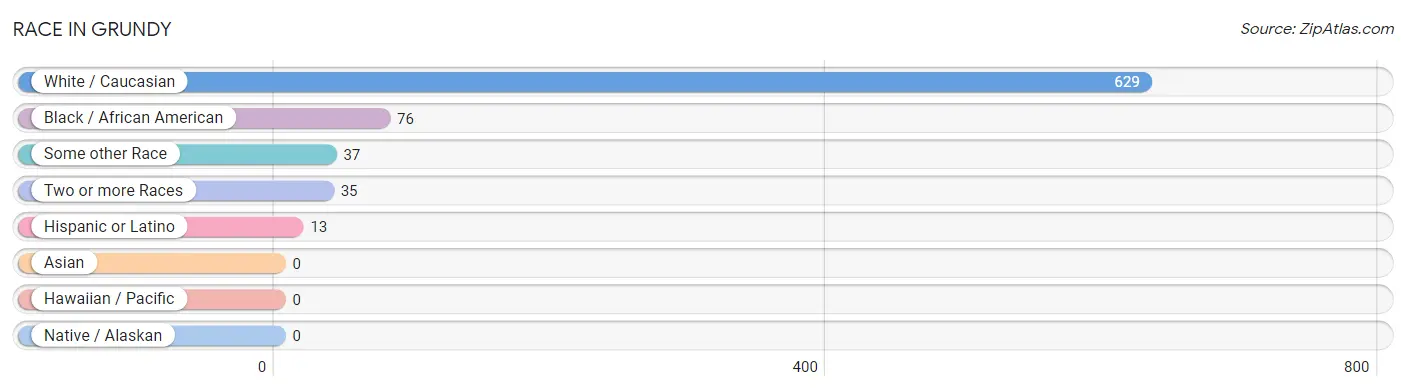
| Race | # Population | % Population |
| Asian | 0 | 0.0% |
| Black / African American | 76 | 9.8% |
| Hawaiian / Pacific | 0 | 0.0% |
| Hispanic or Latino | 13 | 1.7% |
| Native / Alaskan | 0 | 0.0% |
| White / Caucasian | 629 | 80.9% |
| Two or more Races | 35 | 4.5% |
| Some other Race | 37 | 4.8% |
| Total | 777 | 100.0% |
Ancestry in Grundy
The most populous ancestries reported in Grundy are American (493 | 63.4%), Subsaharan African (43 | 5.5%), English (35 | 4.5%), German (24 | 3.1%), and Irish (17 | 2.2%), together accounting for 78.8% of all Grundy residents.
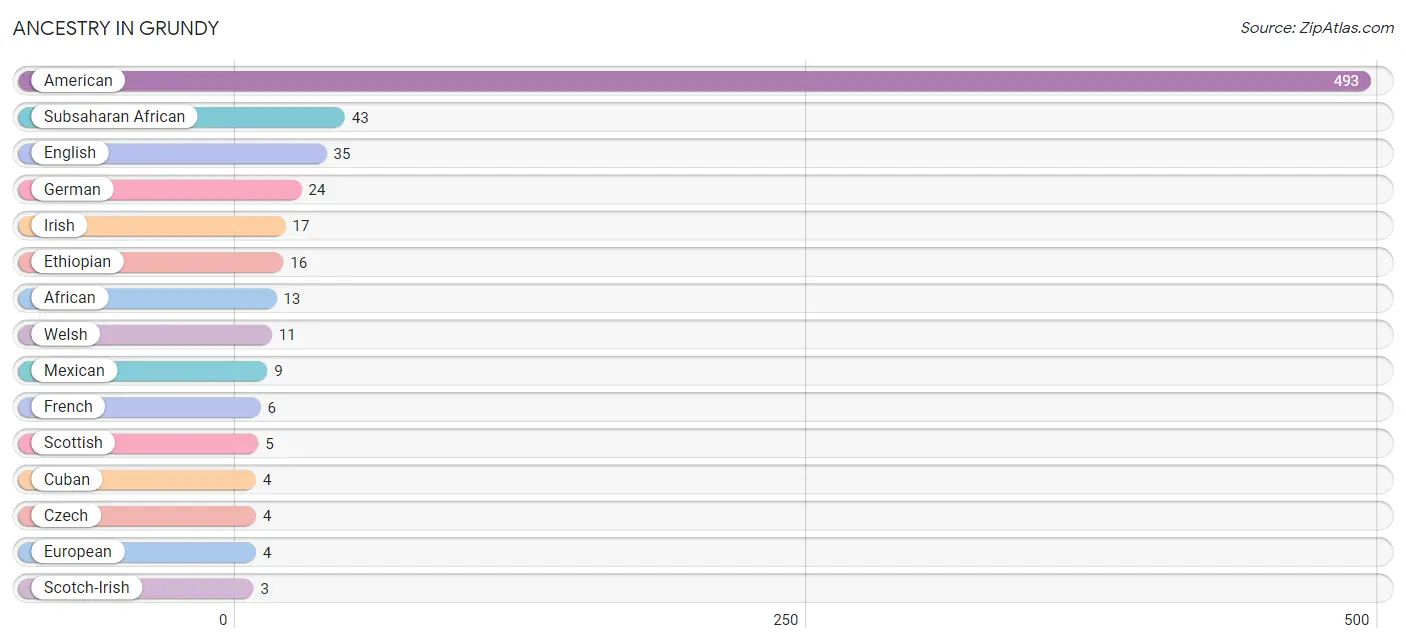
| Ancestry | # Population | % Population |
| African | 13 | 1.7% |
| American | 493 | 63.4% |
| Cuban | 4 | 0.5% |
| Czech | 4 | 0.5% |
| English | 35 | 4.5% |
| Ethiopian | 16 | 2.1% |
| European | 4 | 0.5% |
| French | 6 | 0.8% |
| German | 24 | 3.1% |
| Iranian | 1 | 0.1% |
| Irish | 17 | 2.2% |
| Italian | 1 | 0.1% |
| Mexican | 9 | 1.2% |
| Norwegian | 2 | 0.3% |
| Scotch-Irish | 3 | 0.4% |
| Scottish | 5 | 0.6% |
| Subsaharan African | 43 | 5.5% |
| Ugandan | 2 | 0.3% |
| Welsh | 11 | 1.4% | View All 19 Rows |
Immigrants in Grundy
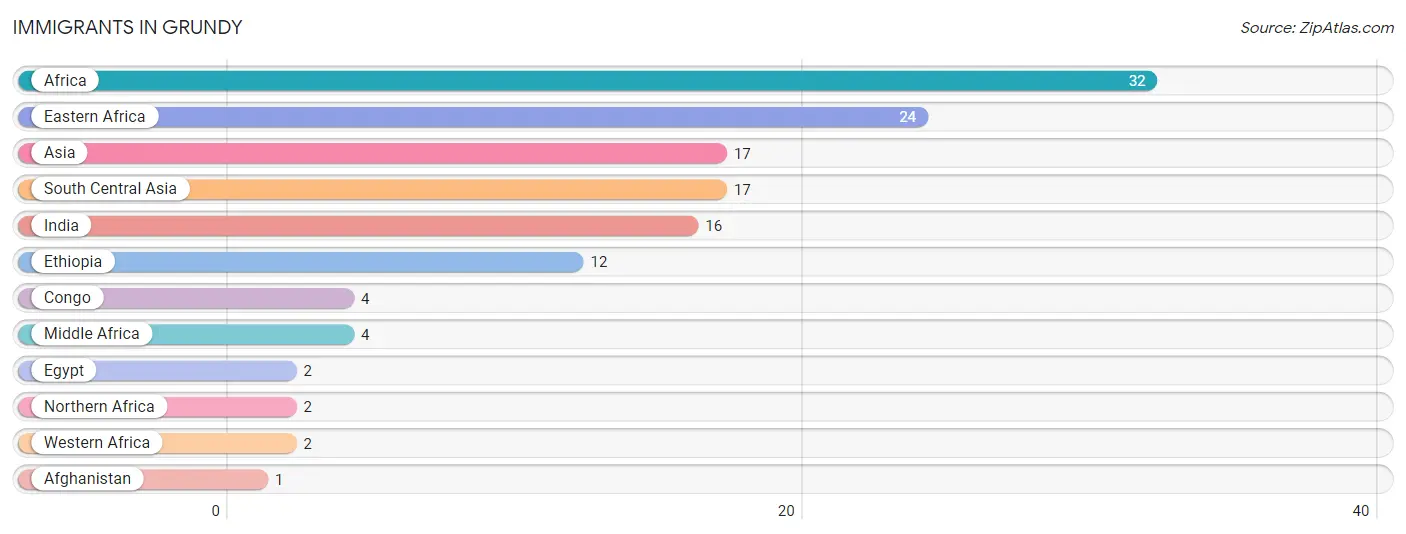
The most numerous immigrant groups reported in Grundy came from Africa (32 | 4.1%), Eastern Africa (24 | 3.1%), Asia (17 | 2.2%), South Central Asia (17 | 2.2%), and India (16 | 2.1%), together accounting for 13.7% of all Grundy residents.
| Immigration Origin | # Population | % Population |
| Afghanistan | 1 | 0.1% |
| Africa | 32 | 4.1% |
| Asia | 17 | 2.2% |
| Congo | 4 | 0.5% |
| Eastern Africa | 24 | 3.1% |
| Egypt | 2 | 0.3% |
| Ethiopia | 12 | 1.5% |
| India | 16 | 2.1% |
| Middle Africa | 4 | 0.5% |
| Northern Africa | 2 | 0.3% |
| South Central Asia | 17 | 2.2% |
| Western Africa | 2 | 0.3% | View All 12 Rows |
Sex and Age in Grundy
Sex and Age in Grundy
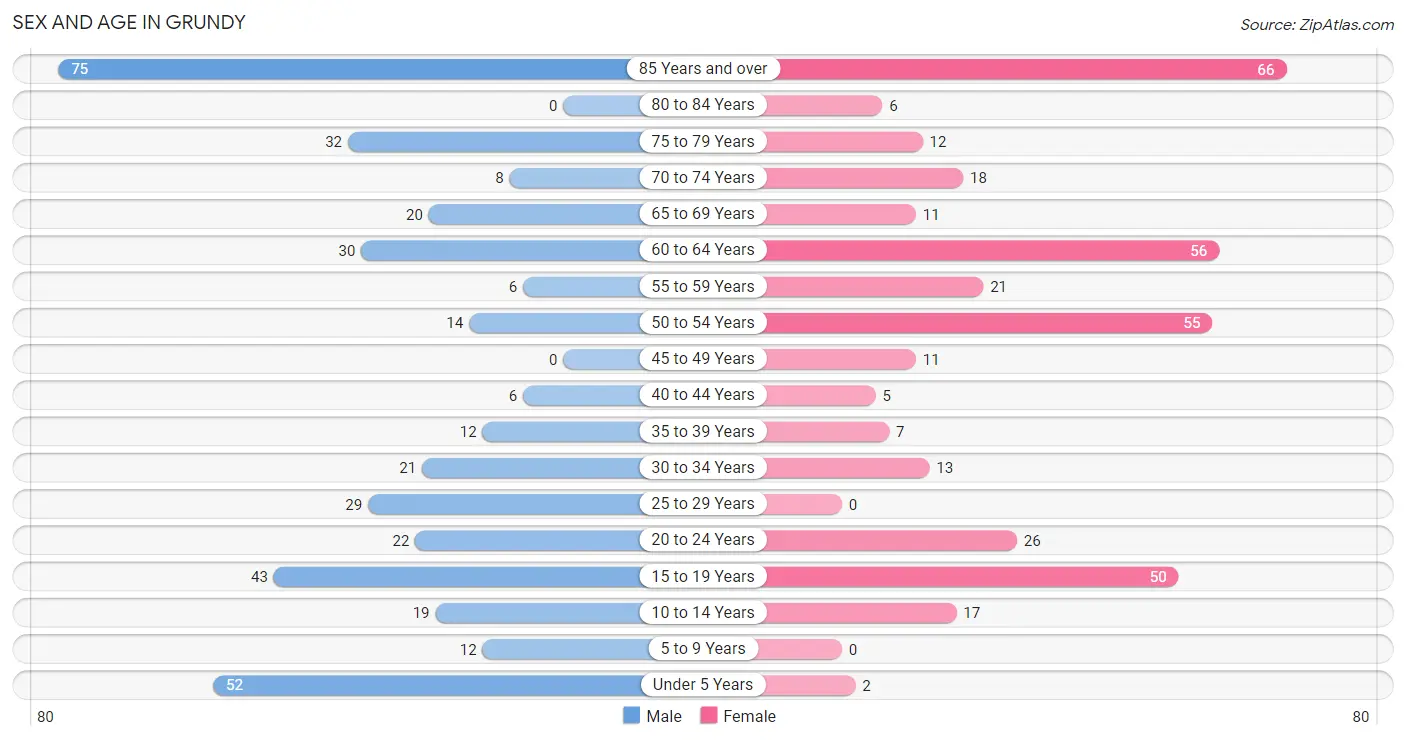
The most populous age groups in Grundy are 85 Years and over (75 | 18.7%) for men and 85 Years and over (66 | 17.5%) for women.
| Age Bracket | Male | Female |
| Under 5 Years | 52 (13.0%) | 2 (0.5%) |
| 5 to 9 Years | 12 (3.0%) | 0 (0.0%) |
| 10 to 14 Years | 19 (4.7%) | 17 (4.5%) |
| 15 to 19 Years | 43 (10.7%) | 50 (13.3%) |
| 20 to 24 Years | 22 (5.5%) | 26 (6.9%) |
| 25 to 29 Years | 29 (7.2%) | 0 (0.0%) |
| 30 to 34 Years | 21 (5.2%) | 13 (3.5%) |
| 35 to 39 Years | 12 (3.0%) | 7 (1.9%) |
| 40 to 44 Years | 6 (1.5%) | 5 (1.3%) |
| 45 to 49 Years | 0 (0.0%) | 11 (2.9%) |
| 50 to 54 Years | 14 (3.5%) | 55 (14.6%) |
| 55 to 59 Years | 6 (1.5%) | 21 (5.6%) |
| 60 to 64 Years | 30 (7.5%) | 56 (14.9%) |
| 65 to 69 Years | 20 (5.0%) | 11 (2.9%) |
| 70 to 74 Years | 8 (2.0%) | 18 (4.8%) |
| 75 to 79 Years | 32 (8.0%) | 12 (3.2%) |
| 80 to 84 Years | 0 (0.0%) | 6 (1.6%) |
| 85 Years and over | 75 (18.7%) | 66 (17.5%) |
| Total | 401 (100.0%) | 376 (100.0%) |
Families and Households in Grundy
Median Family Size in Grundy
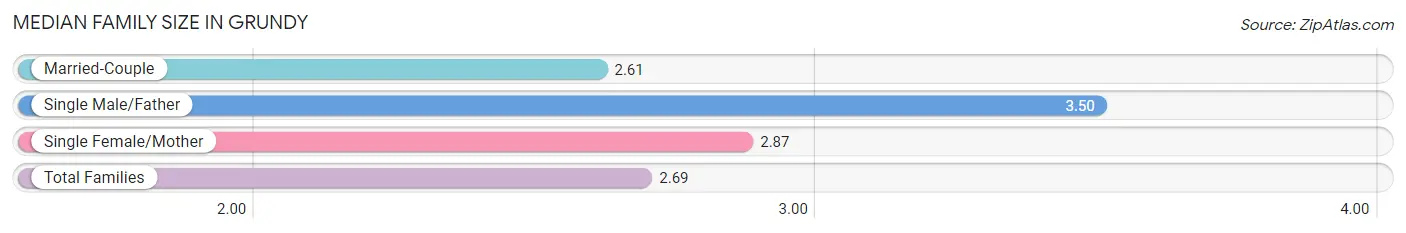
The median family size in Grundy is 2.69 persons per family, with single male/father families (2 | 1.3%) accounting for the largest median family size of 3.5 persons per family. On the other hand, married-couple families (109 | 72.7%) represent the smallest median family size with 2.61 persons per family.
| Family Type | # Families | Family Size |
| Married-Couple | 109 (72.7%) | 2.61 |
| Single Male/Father | 2 (1.3%) | 3.50 |
| Single Female/Mother | 39 (26.0%) | 2.87 |
| Total Families | 150 (100.0%) | 2.69 |
Median Household Size in Grundy
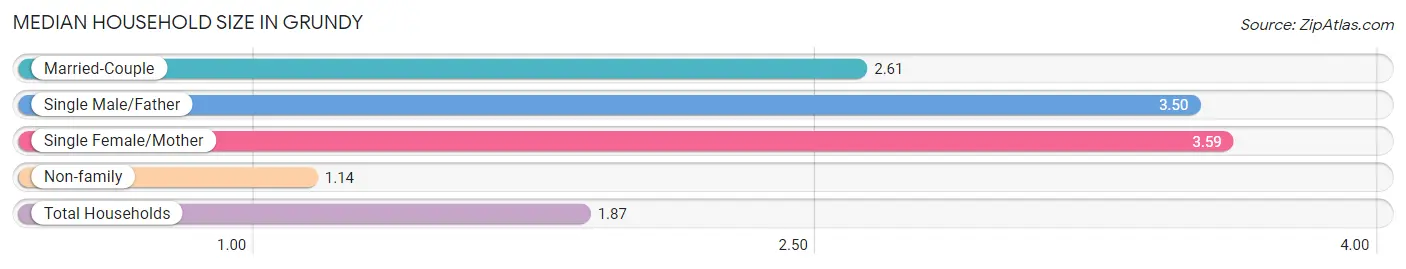
The median household size in Grundy is 1.87 persons per household, with single female/mother households (39 | 10.9%) accounting for the largest median household size of 3.59 persons per household. non-family households (208 | 58.1%) represent the smallest median household size with 1.14 persons per household.
| Household Type | # Households | Household Size |
| Married-Couple | 109 (30.4%) | 2.61 |
| Single Male/Father | 2 (0.6%) | 3.50 |
| Single Female/Mother | 39 (10.9%) | 3.59 |
| Non-family | 208 (58.1%) | 1.14 |
| Total Households | 358 (100.0%) | 1.87 |
Household Size by Marriage Status in Grundy
Out of a total of 358 households in Grundy, 150 (41.9%) are family households, while 208 (58.1%) are nonfamily households. The most numerous type of family households are 2-person households, comprising 101, and the most common type of nonfamily households are 1-person households, comprising 135.
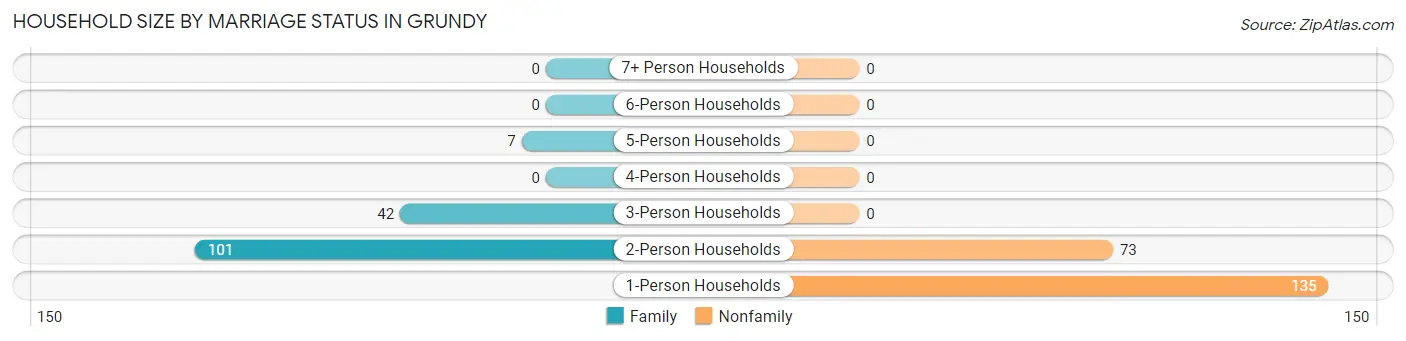
| Household Size | Family Households | Nonfamily Households |
| 1-Person Households | - | 135 (37.7%) |
| 2-Person Households | 101 (28.2%) | 73 (20.4%) |
| 3-Person Households | 42 (11.7%) | 0 (0.0%) |
| 4-Person Households | 0 (0.0%) | 0 (0.0%) |
| 5-Person Households | 7 (2.0%) | 0 (0.0%) |
| 6-Person Households | 0 (0.0%) | 0 (0.0%) |
| 7+ Person Households | 0 (0.0%) | 0 (0.0%) |
| Total | 150 (41.9%) | 208 (58.1%) |
Female Fertility in Grundy
Fertility by Age in Grundy
Average fertility rate in Grundy is 17.0 births per 1,000 women. Women in the age bracket of 20 to 34 years have the highest fertility rate with 51.0 births per 1,000 women. Women in the age bracket of 20 to 34 years acount for 100.0% of all women with births.
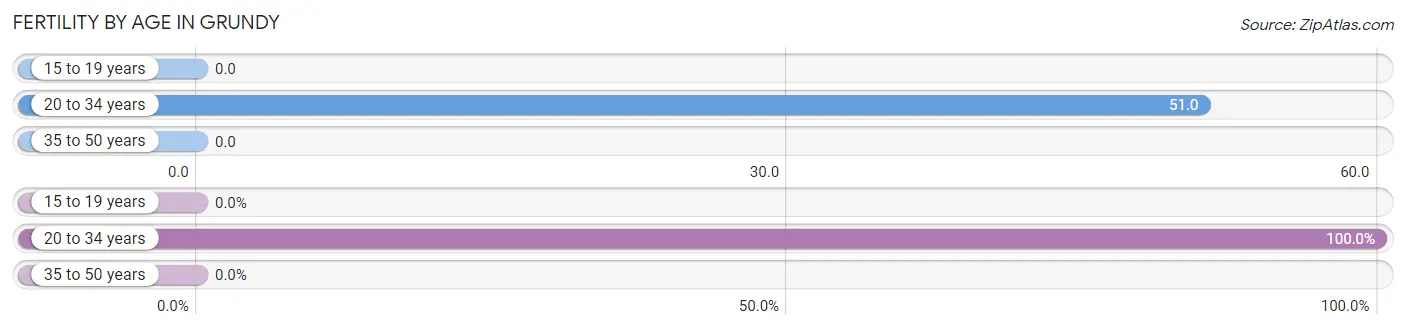
| Age Bracket | Women with Births | Births / 1,000 Women |
| 15 to 19 years | 0 (0.0%) | 0.0 |
| 20 to 34 years | 2 (100.0%) | 51.0 |
| 35 to 50 years | 0 (0.0%) | 0.0 |
| Total | 2 (100.0%) | 17.0 |
Fertility by Age by Marriage Status in Grundy
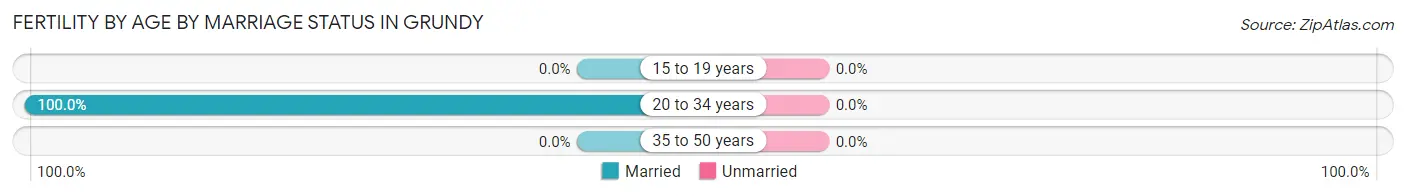
| Age Bracket | Married | Unmarried |
| 15 to 19 years | 0 (0.0%) | 0 (0.0%) |
| 20 to 34 years | 2 (100.0%) | 0 (0.0%) |
| 35 to 50 years | 0 (0.0%) | 0 (0.0%) |
| Total | 2 (100.0%) | 0 (0.0%) |
Fertility by Education in Grundy
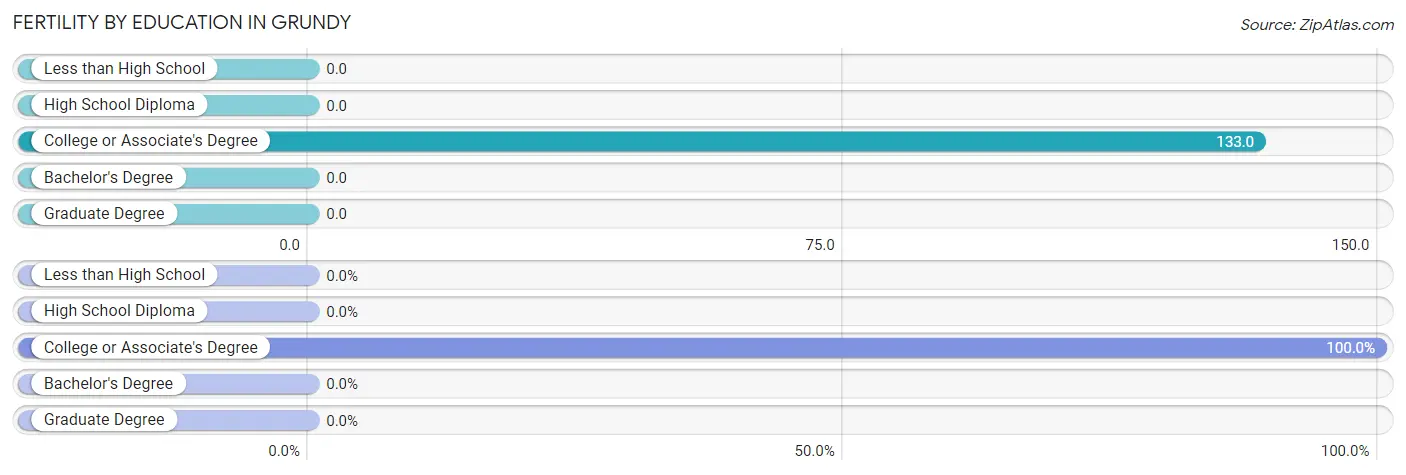
| Educational Attainment | Women with Births | Births / 1,000 Women |
| Less than High School | 0 (0.0%) | 0.0 |
| High School Diploma | 0 (0.0%) | 0.0 |
| College or Associate's Degree | 2 (100.0%) | 133.0 |
| Bachelor's Degree | 0 (0.0%) | 0.0 |
| Graduate Degree | 0 (0.0%) | 0.0 |
| Total | 2 (100.0%) | 17.0 |
Fertility by Education by Marriage Status in Grundy
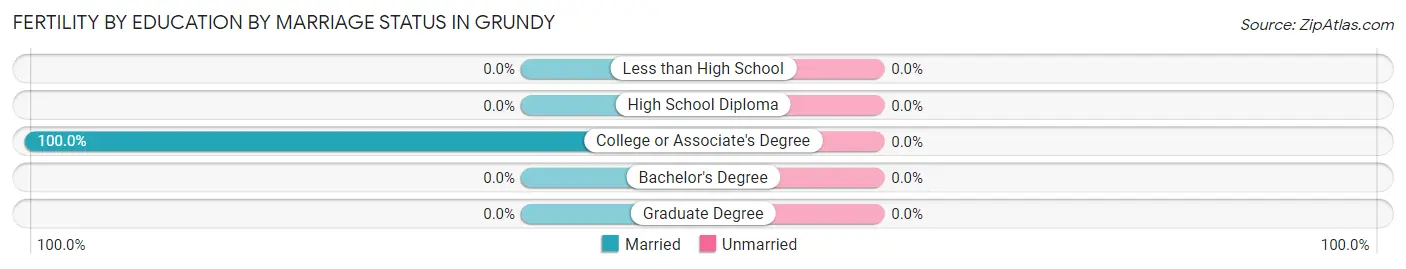
| Educational Attainment | Married | Unmarried |
| Less than High School | 0 (0.0%) | 0 (0.0%) |
| High School Diploma | 0 (0.0%) | 0 (0.0%) |
| College or Associate's Degree | 2 (100.0%) | 0 (0.0%) |
| Bachelor's Degree | 0 (0.0%) | 0 (0.0%) |
| Graduate Degree | 0 (0.0%) | 0 (0.0%) |
| Total | 2 (100.0%) | 0 (0.0%) |
Employment Characteristics in Grundy
Employment by Class of Employer in Grundy
Among the 236 employed individuals in Grundy, private company employees (128 | 54.2%), state government employees (37 | 15.7%), and local government employees (25 | 10.6%) make up the most common classes of employment.
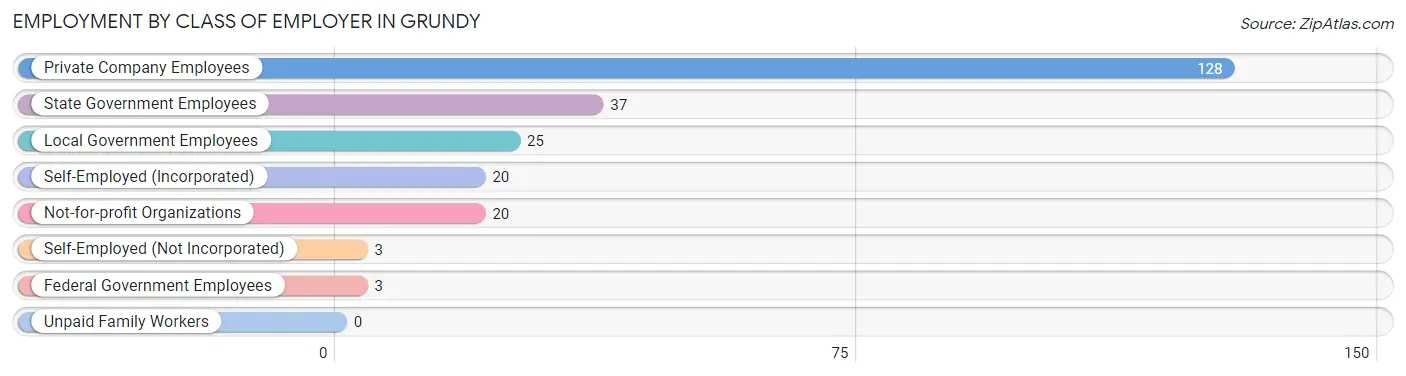
| Employer Class | # Employees | % Employees |
| Private Company Employees | 128 | 54.2% |
| Self-Employed (Incorporated) | 20 | 8.5% |
| Self-Employed (Not Incorporated) | 3 | 1.3% |
| Not-for-profit Organizations | 20 | 8.5% |
| Local Government Employees | 25 | 10.6% |
| State Government Employees | 37 | 15.7% |
| Federal Government Employees | 3 | 1.3% |
| Unpaid Family Workers | 0 | 0.0% |
| Total | 236 | 100.0% |
Employment Status by Age in Grundy
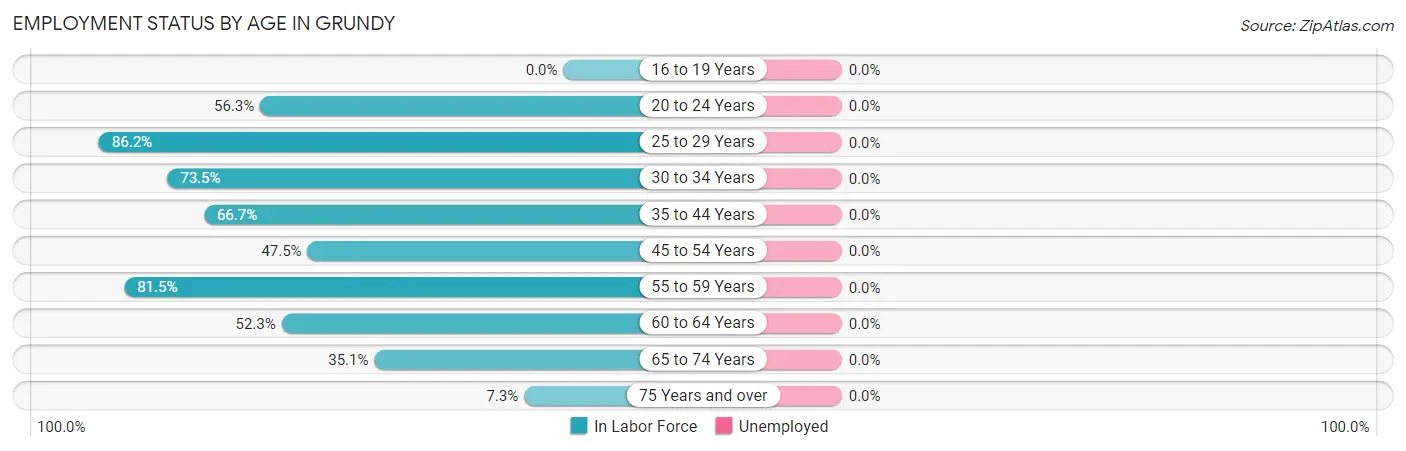
| Age Bracket | In Labor Force | Unemployed |
| 16 to 19 Years | 0 (0.0%) | 0 (0.0%) |
| 20 to 24 Years | 27 (56.3%) | 0 (0.0%) |
| 25 to 29 Years | 25 (86.2%) | 0 (0.0%) |
| 30 to 34 Years | 25 (73.5%) | 0 (0.0%) |
| 35 to 44 Years | 20 (66.7%) | 0 (0.0%) |
| 45 to 54 Years | 38 (47.5%) | 0 (0.0%) |
| 55 to 59 Years | 22 (81.5%) | 0 (0.0%) |
| 60 to 64 Years | 45 (52.3%) | 0 (0.0%) |
| 65 to 74 Years | 20 (35.1%) | 0 (0.0%) |
| 75 Years and over | 14 (7.3%) | 0 (0.0%) |
| Total | 236 (35.9%) | 0 (0.0%) |
Employment Status by Educational Attainment in Grundy
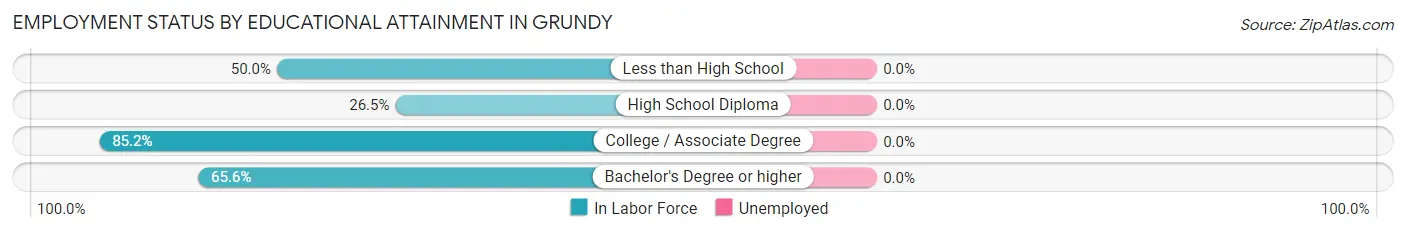
| Educational Attainment | In Labor Force | Unemployed |
| Less than High School | 6 (50.0%) | 0 (0.0%) |
| High School Diploma | 18 (26.5%) | 0 (0.0%) |
| College / Associate Degree | 69 (85.2%) | 0 (0.0%) |
| Bachelor's Degree or higher | 82 (65.6%) | 0 (0.0%) |
| Total | 175 (61.2%) | 0 (0.0%) |
Employment Occupations by Sex in Grundy
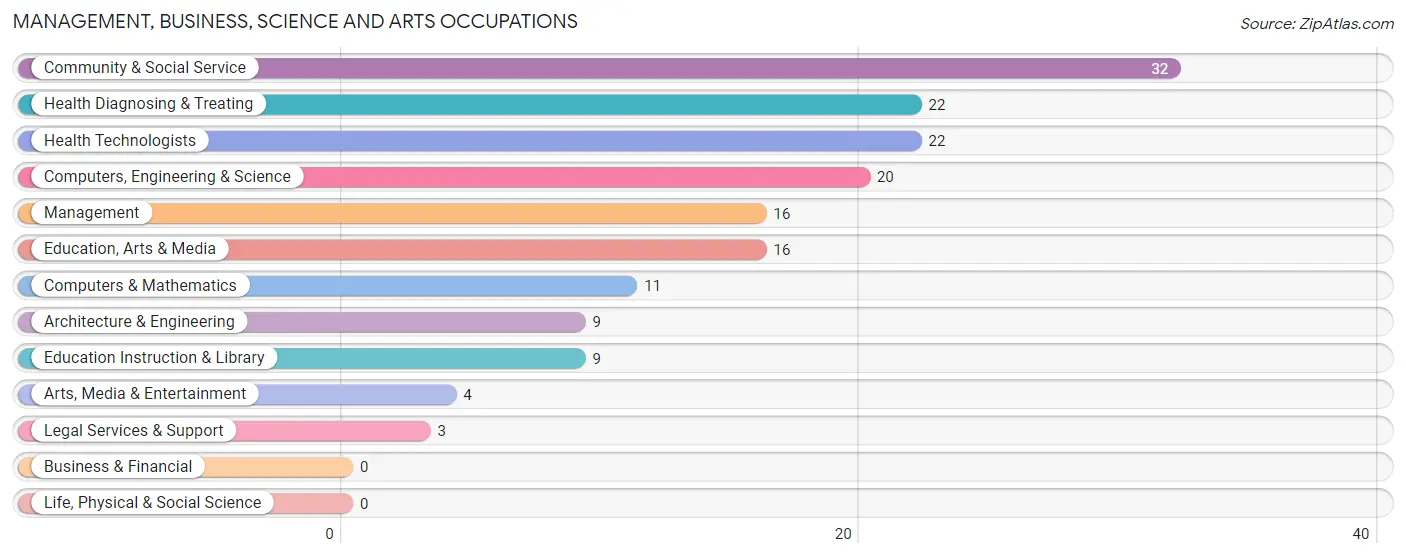
Management, Business, Science and Arts Occupations
The most common Management, Business, Science and Arts occupations in Grundy are Community & Social Service (32 | 13.6%), Health Diagnosing & Treating (22 | 9.3%), Health Technologists (22 | 9.3%), Computers, Engineering & Science (20 | 8.5%), and Management (16 | 6.8%).
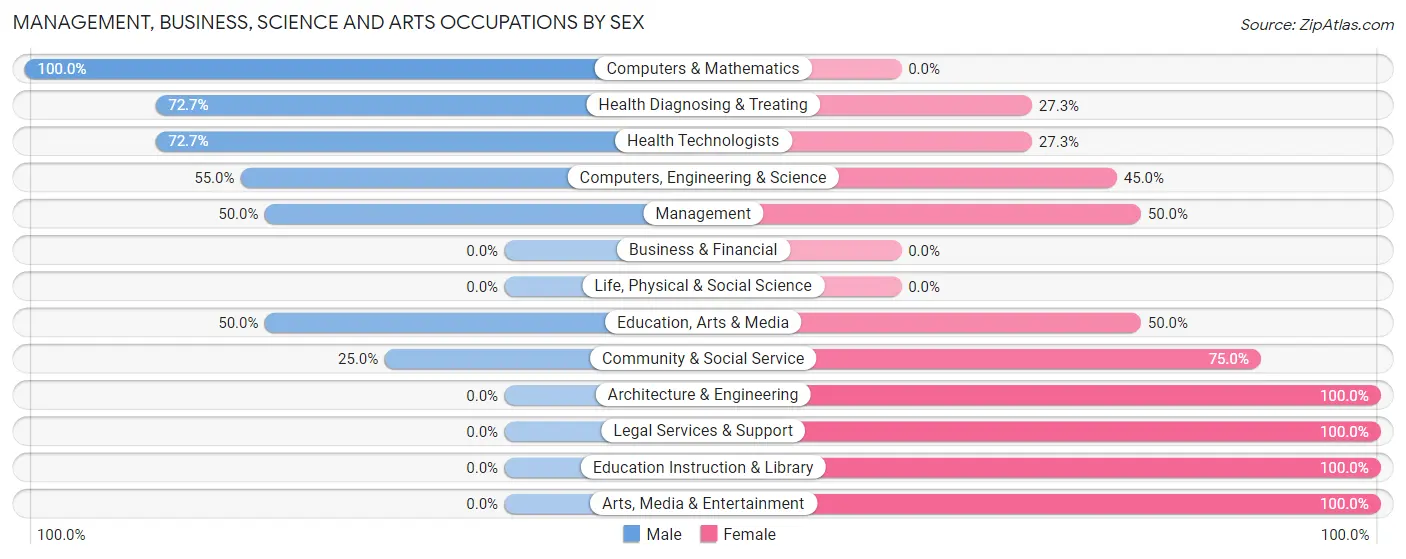
Management, Business, Science and Arts Occupations by Sex
Within the Management, Business, Science and Arts occupations in Grundy, the most male-oriented occupations are Computers & Mathematics (100.0%), Health Diagnosing & Treating (72.7%), and Health Technologists (72.7%), while the most female-oriented occupations are Architecture & Engineering (100.0%), Legal Services & Support (100.0%), and Education Instruction & Library (100.0%).
| Occupation | Male | Female |
| Management | 8 (50.0%) | 8 (50.0%) |
| Business & Financial | 0 (0.0%) | 0 (0.0%) |
| Computers, Engineering & Science | 11 (55.0%) | 9 (45.0%) |
| Computers & Mathematics | 11 (100.0%) | 0 (0.0%) |
| Architecture & Engineering | 0 (0.0%) | 9 (100.0%) |
| Life, Physical & Social Science | 0 (0.0%) | 0 (0.0%) |
| Community & Social Service | 8 (25.0%) | 24 (75.0%) |
| Education, Arts & Media | 8 (50.0%) | 8 (50.0%) |
| Legal Services & Support | 0 (0.0%) | 3 (100.0%) |
| Education Instruction & Library | 0 (0.0%) | 9 (100.0%) |
| Arts, Media & Entertainment | 0 (0.0%) | 4 (100.0%) |
| Health Diagnosing & Treating | 16 (72.7%) | 6 (27.3%) |
| Health Technologists | 16 (72.7%) | 6 (27.3%) |
| Total (Category) | 43 (47.8%) | 47 (52.2%) |
| Total (Overall) | 125 (53.0%) | 111 (47.0%) |
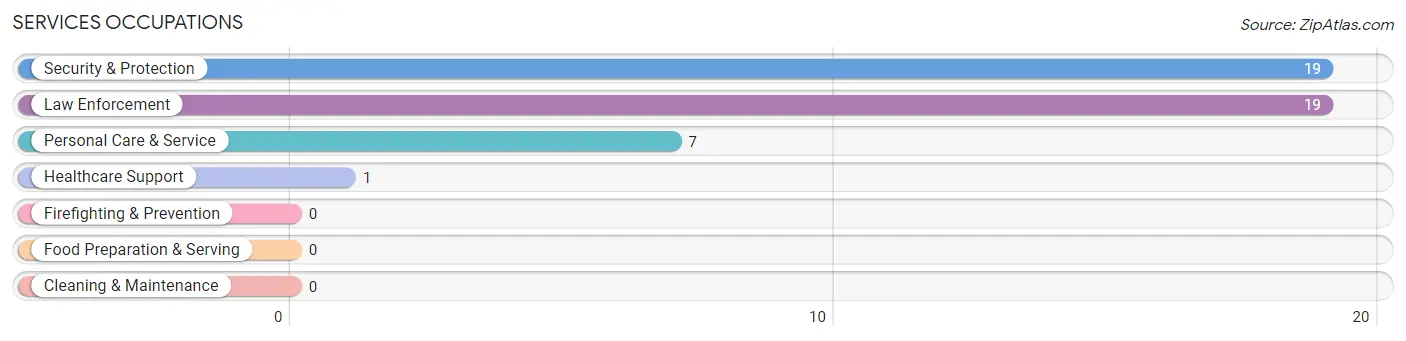
Services Occupations
The most common Services occupations in Grundy are Security & Protection (19 | 8.1%), Law Enforcement (19 | 8.1%), Personal Care & Service (7 | 3.0%), and Healthcare Support (1 | 0.4%).
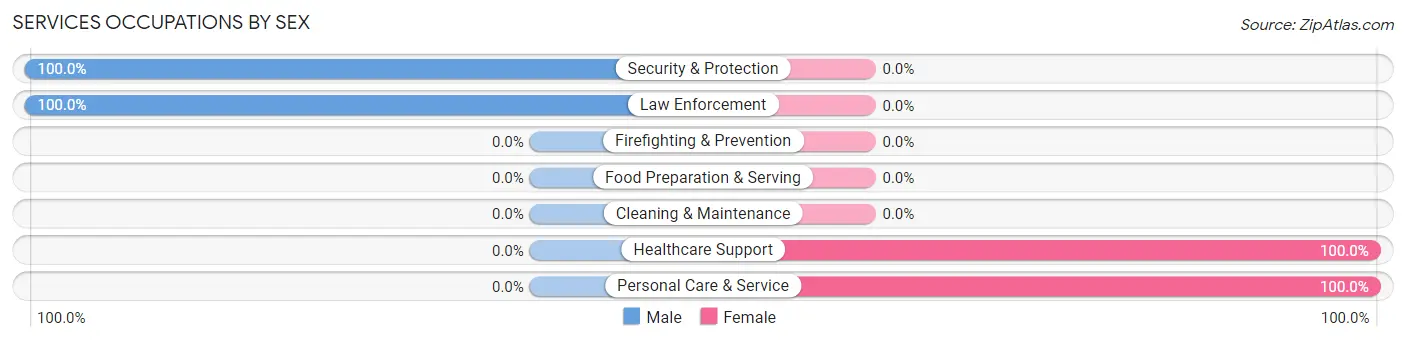
Services Occupations by Sex
Within the Services occupations in Grundy, the most male-oriented occupations are Security & Protection (100.0%), and Law Enforcement (100.0%), while the most female-oriented occupations are Healthcare Support (100.0%), and Personal Care & Service (100.0%).
| Occupation | Male | Female |
| Healthcare Support | 0 (0.0%) | 1 (100.0%) |
| Security & Protection | 19 (100.0%) | 0 (0.0%) |
| Firefighting & Prevention | 0 (0.0%) | 0 (0.0%) |
| Law Enforcement | 19 (100.0%) | 0 (0.0%) |
| Food Preparation & Serving | 0 (0.0%) | 0 (0.0%) |
| Cleaning & Maintenance | 0 (0.0%) | 0 (0.0%) |
| Personal Care & Service | 0 (0.0%) | 7 (100.0%) |
| Total (Category) | 19 (70.4%) | 8 (29.6%) |
| Total (Overall) | 125 (53.0%) | 111 (47.0%) |
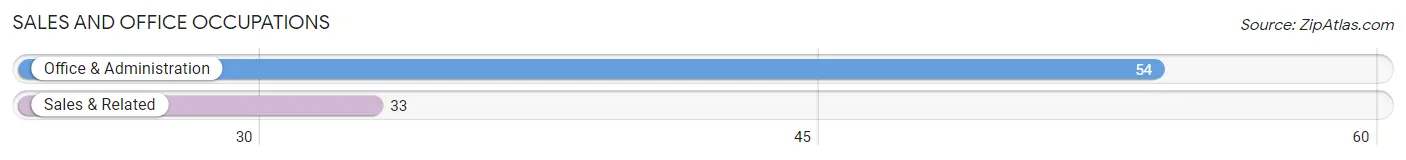
Sales and Office Occupations
The most common Sales and Office occupations in Grundy are Office & Administration (54 | 22.9%), and Sales & Related (33 | 14.0%).
Sales and Office Occupations by Sex
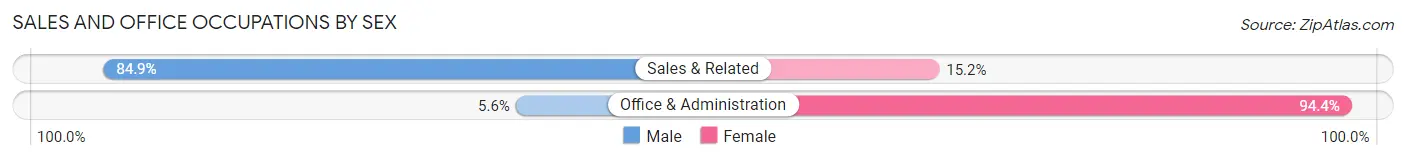
| Occupation | Male | Female |
| Sales & Related | 28 (84.9%) | 5 (15.1%) |
| Office & Administration | 3 (5.6%) | 51 (94.4%) |
| Total (Category) | 31 (35.6%) | 56 (64.4%) |
| Total (Overall) | 125 (53.0%) | 111 (47.0%) |
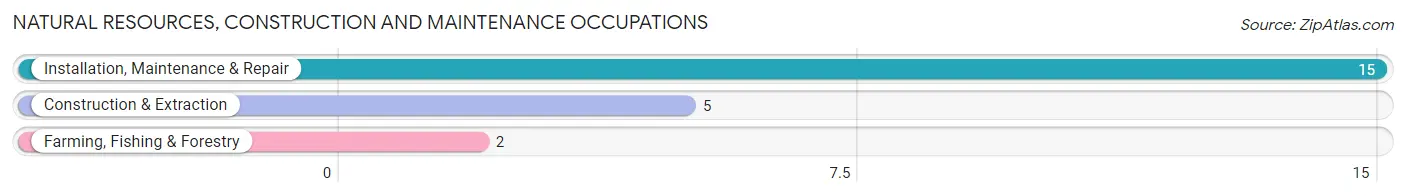
Natural Resources, Construction and Maintenance Occupations
The most common Natural Resources, Construction and Maintenance occupations in Grundy are Installation, Maintenance & Repair (15 | 6.4%), Construction & Extraction (5 | 2.1%), and Farming, Fishing & Forestry (2 | 0.9%).
Natural Resources, Construction and Maintenance Occupations by Sex
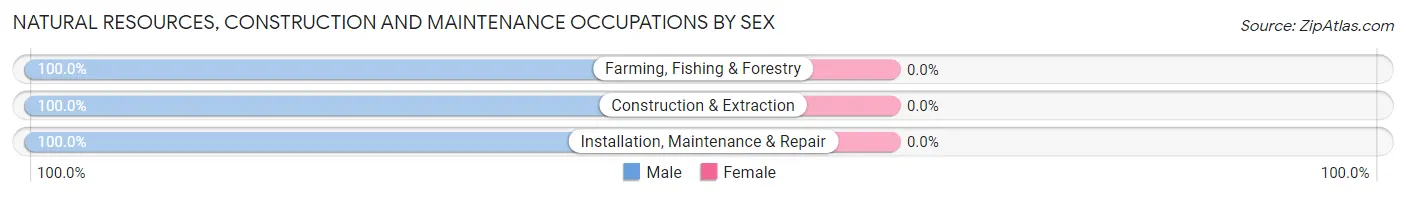
| Occupation | Male | Female |
| Farming, Fishing & Forestry | 2 (100.0%) | 0 (0.0%) |
| Construction & Extraction | 5 (100.0%) | 0 (0.0%) |
| Installation, Maintenance & Repair | 15 (100.0%) | 0 (0.0%) |
| Total (Category) | 22 (100.0%) | 0 (0.0%) |
| Total (Overall) | 125 (53.0%) | 111 (47.0%) |
Production, Transportation and Moving Occupations
The most common Production, Transportation and Moving occupations in Grundy are , and Material Moving (10 | 4.2%).
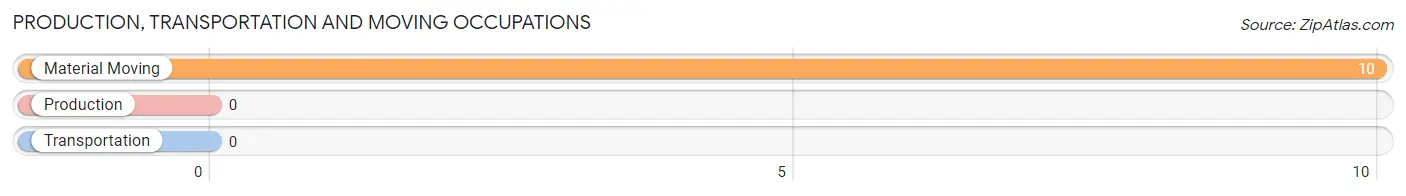
Production, Transportation and Moving Occupations by Sex
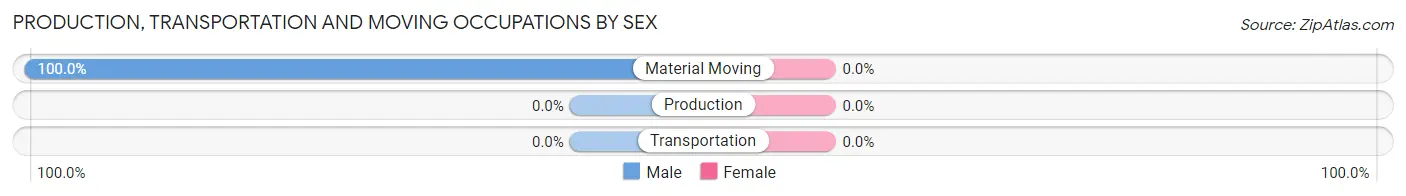
| Occupation | Male | Female |
| Production | 0 (0.0%) | 0 (0.0%) |
| Transportation | 0 (0.0%) | 0 (0.0%) |
| Material Moving | 10 (100.0%) | 0 (0.0%) |
| Total (Category) | 10 (100.0%) | 0 (0.0%) |
| Total (Overall) | 125 (53.0%) | 111 (47.0%) |
Employment Industries by Sex in Grundy
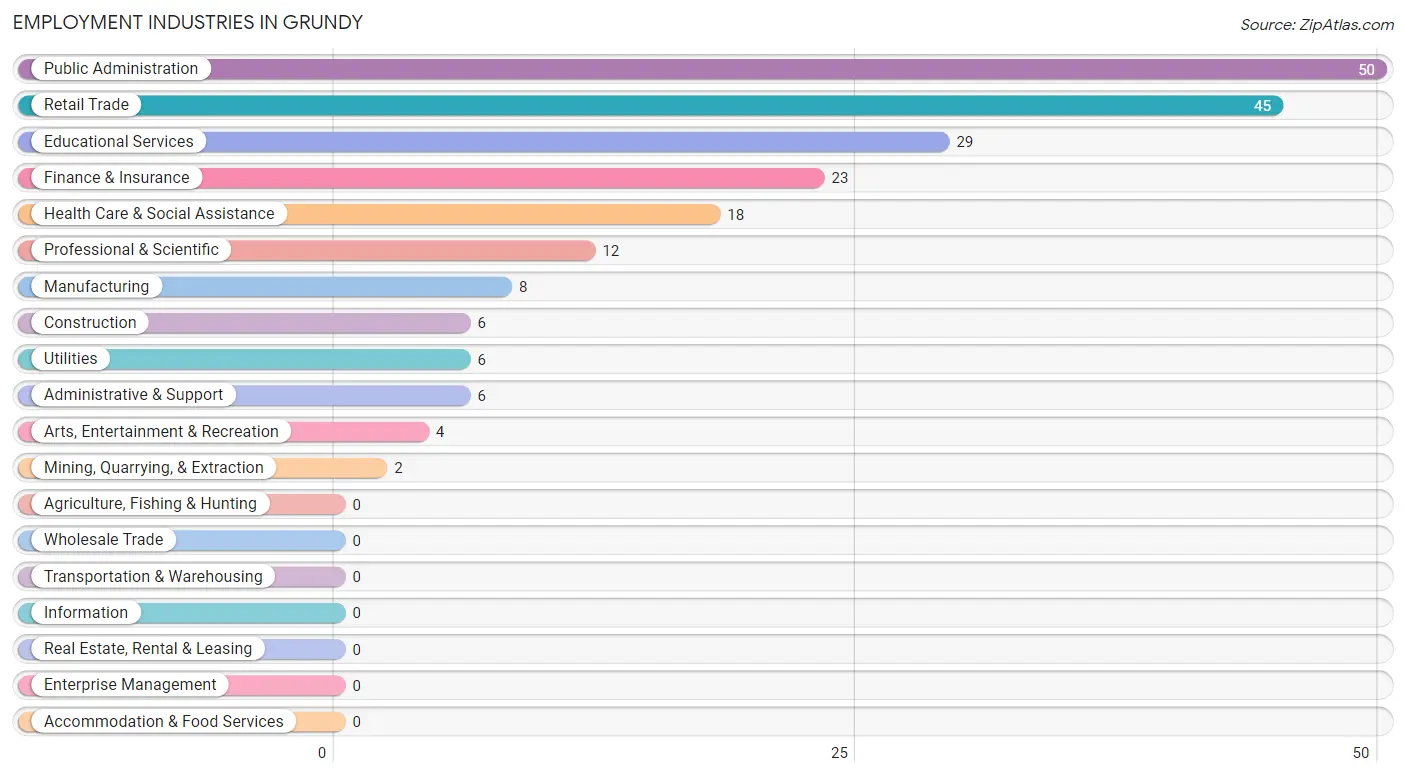
Employment Industries in Grundy
The major employment industries in Grundy include Public Administration (50 | 21.2%), Retail Trade (45 | 19.1%), Educational Services (29 | 12.3%), Finance & Insurance (23 | 9.8%), and Health Care & Social Assistance (18 | 7.6%).
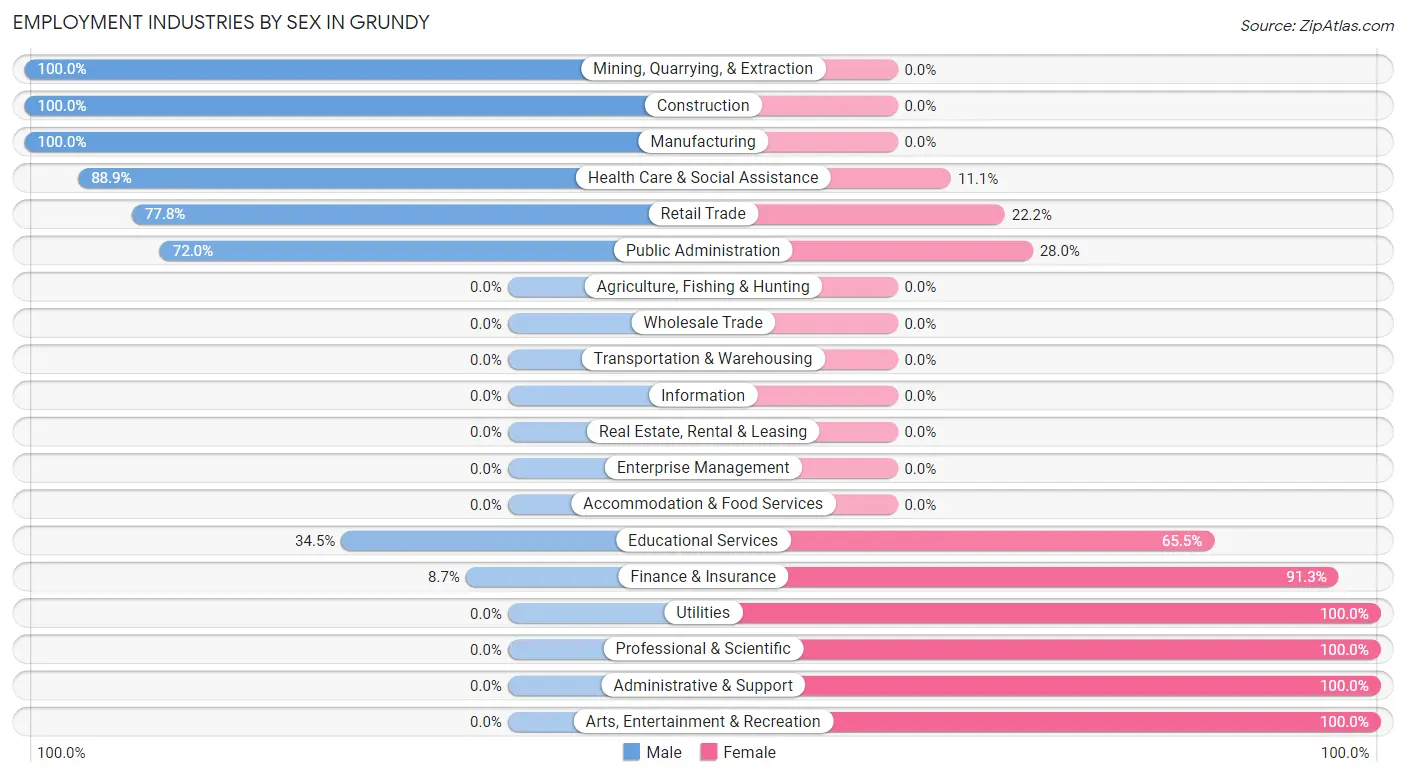
Employment Industries by Sex in Grundy
The Grundy industries that see more men than women are Mining, Quarrying, & Extraction (100.0%), Construction (100.0%), and Manufacturing (100.0%), whereas the industries that tend to have a higher number of women are Utilities (100.0%), Professional & Scientific (100.0%), and Administrative & Support (100.0%).
| Industry | Male | Female |
| Agriculture, Fishing & Hunting | 0 (0.0%) | 0 (0.0%) |
| Mining, Quarrying, & Extraction | 2 (100.0%) | 0 (0.0%) |
| Construction | 6 (100.0%) | 0 (0.0%) |
| Manufacturing | 8 (100.0%) | 0 (0.0%) |
| Wholesale Trade | 0 (0.0%) | 0 (0.0%) |
| Retail Trade | 35 (77.8%) | 10 (22.2%) |
| Transportation & Warehousing | 0 (0.0%) | 0 (0.0%) |
| Utilities | 0 (0.0%) | 6 (100.0%) |
| Information | 0 (0.0%) | 0 (0.0%) |
| Finance & Insurance | 2 (8.7%) | 21 (91.3%) |
| Real Estate, Rental & Leasing | 0 (0.0%) | 0 (0.0%) |
| Professional & Scientific | 0 (0.0%) | 12 (100.0%) |
| Enterprise Management | 0 (0.0%) | 0 (0.0%) |
| Administrative & Support | 0 (0.0%) | 6 (100.0%) |
| Educational Services | 10 (34.5%) | 19 (65.5%) |
| Health Care & Social Assistance | 16 (88.9%) | 2 (11.1%) |
| Arts, Entertainment & Recreation | 0 (0.0%) | 4 (100.0%) |
| Accommodation & Food Services | 0 (0.0%) | 0 (0.0%) |
| Public Administration | 36 (72.0%) | 14 (28.0%) |
| Total | 125 (53.0%) | 111 (47.0%) |
Education in Grundy
School Enrollment in Grundy
The most common levels of schooling among the 111 students in Grundy are high school (79 | 71.2%), middle school (18 | 16.2%), and college / undergraduate (8 | 7.2%).
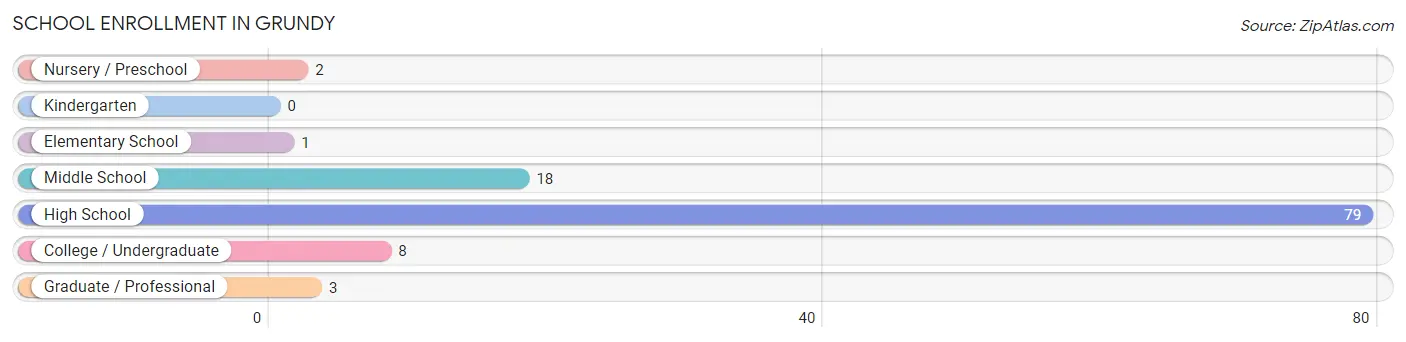
| School Level | # Students | % Students |
| Nursery / Preschool | 2 | 1.8% |
| Kindergarten | 0 | 0.0% |
| Elementary School | 1 | 0.9% |
| Middle School | 18 | 16.2% |
| High School | 79 | 71.2% |
| College / Undergraduate | 8 | 7.2% |
| Graduate / Professional | 3 | 2.7% |
| Total | 111 | 100.0% |
School Enrollment by Age by Funding Source in Grundy
Out of a total of 111 students who are enrolled in schools in Grundy, 35 (31.5%) attend a private institution, while the remaining 76 (68.5%) are enrolled in public schools. The age group of 20 to 24 year olds has the highest likelihood of being enrolled in private schools, with 9 (100.0% in the age bracket) enrolled. Conversely, the age group of 3 to 4 year olds has the lowest likelihood of being enrolled in a private school, with 2 (100.0% in the age bracket) attending a public institution.
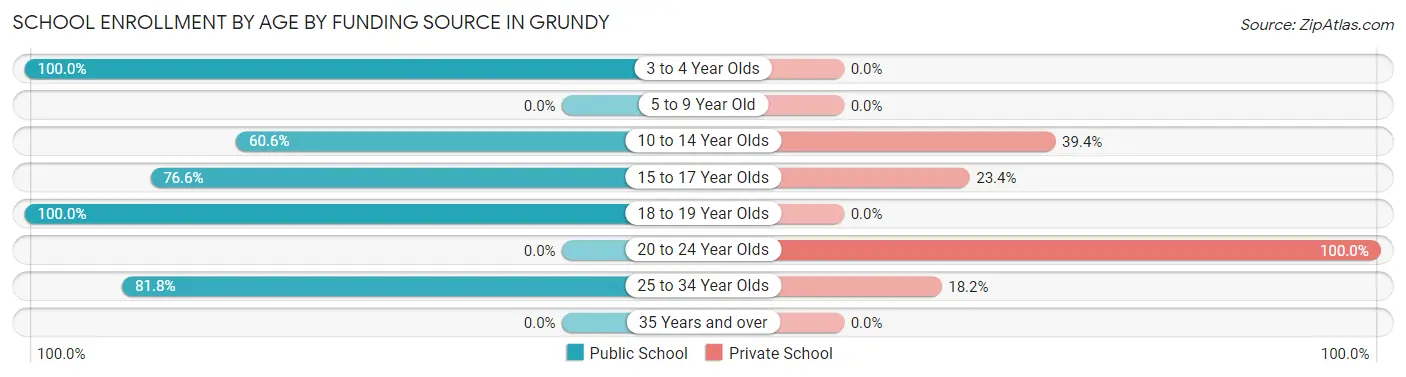
| Age Bracket | Public School | Private School |
| 3 to 4 Year Olds | 2 (100.0%) | 0 (0.0%) |
| 5 to 9 Year Old | 0 (0.0%) | 0 (0.0%) |
| 10 to 14 Year Olds | 20 (60.6%) | 13 (39.4%) |
| 15 to 17 Year Olds | 36 (76.6%) | 11 (23.4%) |
| 18 to 19 Year Olds | 9 (100.0%) | 0 (0.0%) |
| 20 to 24 Year Olds | 0 (0.0%) | 9 (100.0%) |
| 25 to 34 Year Olds | 9 (81.8%) | 2 (18.2%) |
| 35 Years and over | 0 (0.0%) | 0 (0.0%) |
| Total | 76 (68.5%) | 35 (31.5%) |
Educational Attainment by Field of Study in Grundy
Business (46 | 22.2%), education (35 | 16.9%), science & technology (27 | 13.0%), psychology (22 | 10.6%), and liberal arts & history (18 | 8.7%) are the most common fields of study among 207 individuals in Grundy who have obtained a bachelor's degree or higher.
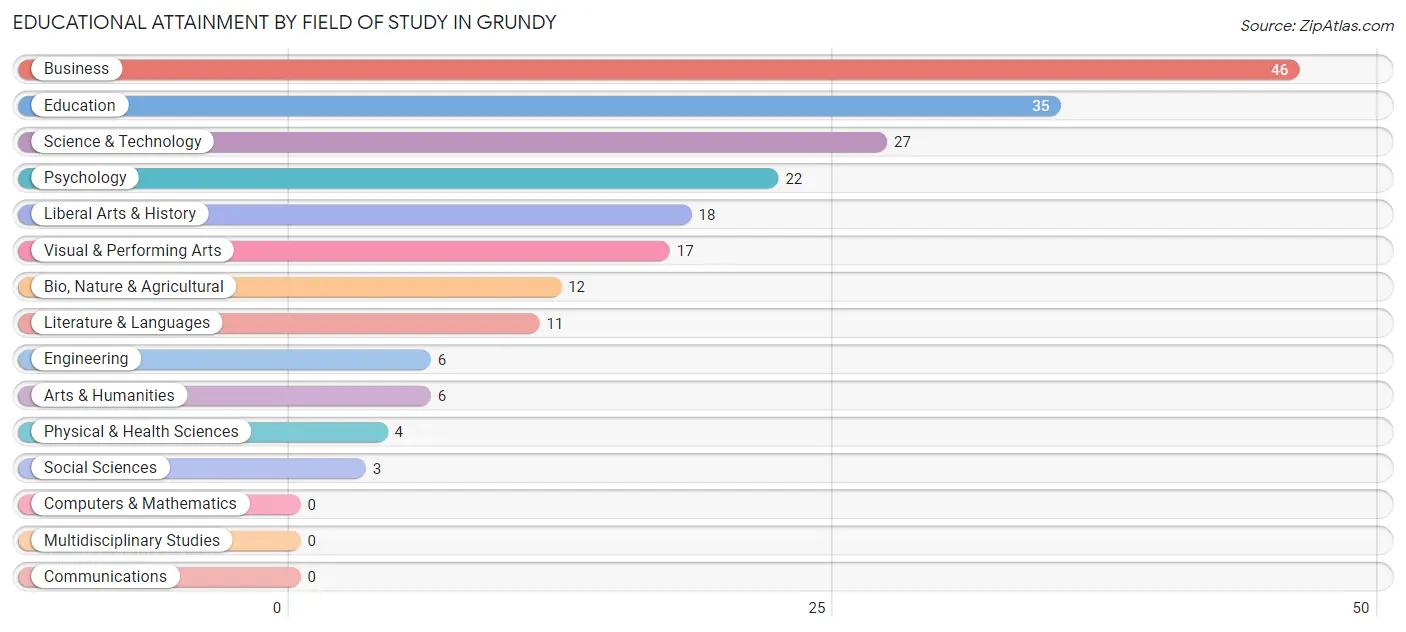
| Field of Study | # Graduates | % Graduates |
| Computers & Mathematics | 0 | 0.0% |
| Bio, Nature & Agricultural | 12 | 5.8% |
| Physical & Health Sciences | 4 | 1.9% |
| Psychology | 22 | 10.6% |
| Social Sciences | 3 | 1.5% |
| Engineering | 6 | 2.9% |
| Multidisciplinary Studies | 0 | 0.0% |
| Science & Technology | 27 | 13.0% |
| Business | 46 | 22.2% |
| Education | 35 | 16.9% |
| Literature & Languages | 11 | 5.3% |
| Liberal Arts & History | 18 | 8.7% |
| Visual & Performing Arts | 17 | 8.2% |
| Communications | 0 | 0.0% |
| Arts & Humanities | 6 | 2.9% |
| Total | 207 | 100.0% |
Transportation & Commute in Grundy
Vehicle Availability by Sex in Grundy
The most prevalent vehicle ownership categories in Grundy are males with 2 vehicles (61, accounting for 48.8%) and females with 2 vehicles (58, making up 54.9%).
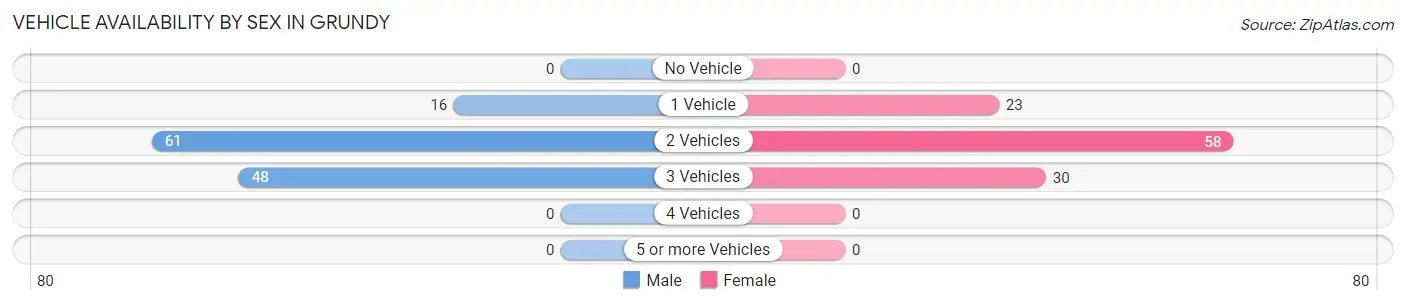
| Vehicles Available | Male | Female |
| No Vehicle | 0 (0.0%) | 0 (0.0%) |
| 1 Vehicle | 16 (12.8%) | 23 (20.7%) |
| 2 Vehicles | 61 (48.8%) | 58 (52.2%) |
| 3 Vehicles | 48 (38.4%) | 30 (27.0%) |
| 4 Vehicles | 0 (0.0%) | 0 (0.0%) |
| 5 or more Vehicles | 0 (0.0%) | 0 (0.0%) |
| Total | 125 (100.0%) | 111 (100.0%) |
Commute Time in Grundy
The most frequently occuring commute durations in Grundy are 5 to 9 minutes (55 commuters, 26.6%), 10 to 14 minutes (33 commuters, 15.9%), and 30 to 34 minutes (28 commuters, 13.5%).
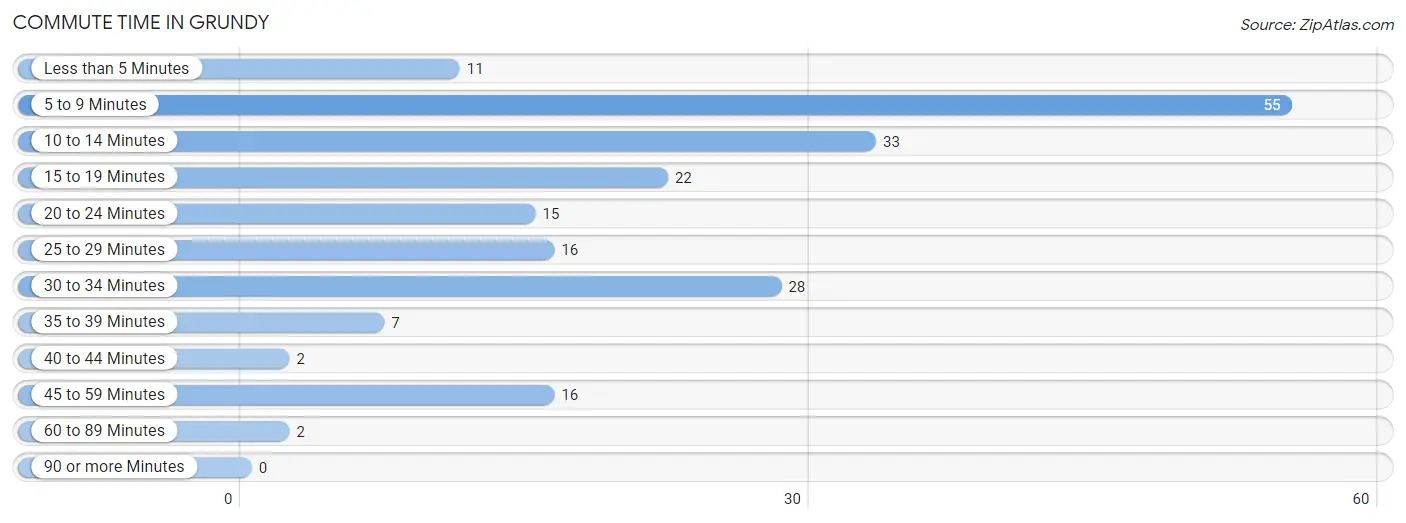
| Commute Time | # Commuters | % Commuters |
| Less than 5 Minutes | 11 | 5.3% |
| 5 to 9 Minutes | 55 | 26.6% |
| 10 to 14 Minutes | 33 | 15.9% |
| 15 to 19 Minutes | 22 | 10.6% |
| 20 to 24 Minutes | 15 | 7.2% |
| 25 to 29 Minutes | 16 | 7.7% |
| 30 to 34 Minutes | 28 | 13.5% |
| 35 to 39 Minutes | 7 | 3.4% |
| 40 to 44 Minutes | 2 | 1.0% |
| 45 to 59 Minutes | 16 | 7.7% |
| 60 to 89 Minutes | 2 | 1.0% |
| 90 or more Minutes | 0 | 0.0% |
Commute Time by Sex in Grundy
The most common commute times in Grundy are 5 to 9 minutes (26 commuters, 23.2%) for males and 10 to 14 minutes (33 commuters, 34.7%) for females.
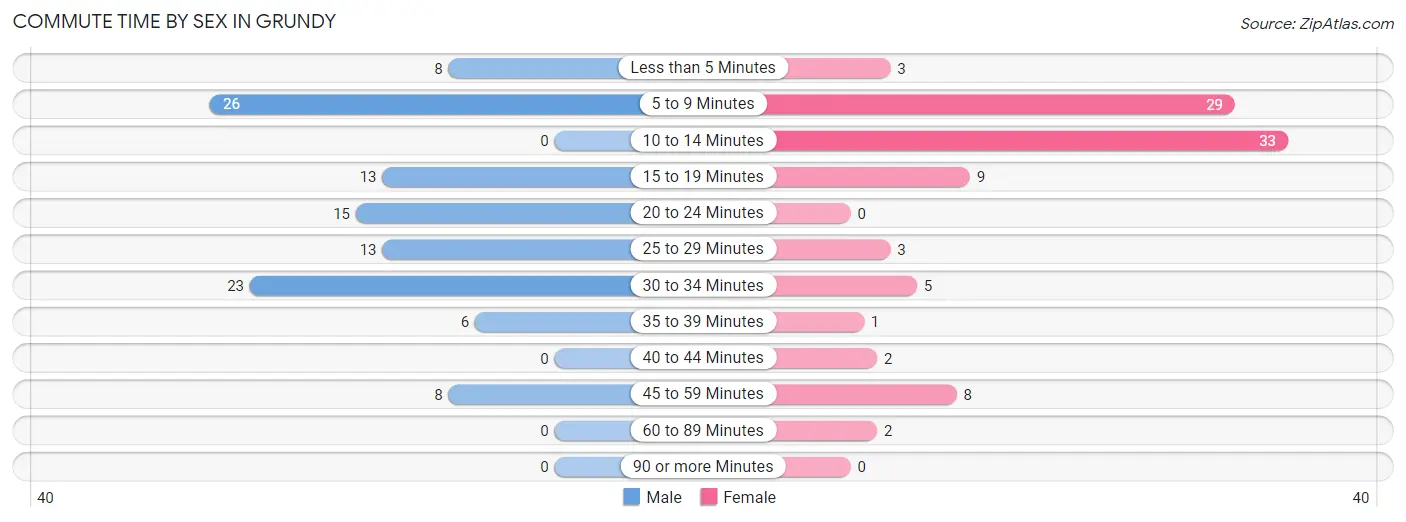
| Commute Time | Male | Female |
| Less than 5 Minutes | 8 (7.1%) | 3 (3.2%) |
| 5 to 9 Minutes | 26 (23.2%) | 29 (30.5%) |
| 10 to 14 Minutes | 0 (0.0%) | 33 (34.7%) |
| 15 to 19 Minutes | 13 (11.6%) | 9 (9.5%) |
| 20 to 24 Minutes | 15 (13.4%) | 0 (0.0%) |
| 25 to 29 Minutes | 13 (11.6%) | 3 (3.2%) |
| 30 to 34 Minutes | 23 (20.5%) | 5 (5.3%) |
| 35 to 39 Minutes | 6 (5.4%) | 1 (1.1%) |
| 40 to 44 Minutes | 0 (0.0%) | 2 (2.1%) |
| 45 to 59 Minutes | 8 (7.1%) | 8 (8.4%) |
| 60 to 89 Minutes | 0 (0.0%) | 2 (2.1%) |
| 90 or more Minutes | 0 (0.0%) | 0 (0.0%) |
Time of Departure to Work by Sex in Grundy
The most frequent times of departure to work in Grundy are 4:00 PM to 11:59 PM (33, 29.5%) for males and 8:00 AM to 8:29 AM (37, 39.0%) for females.
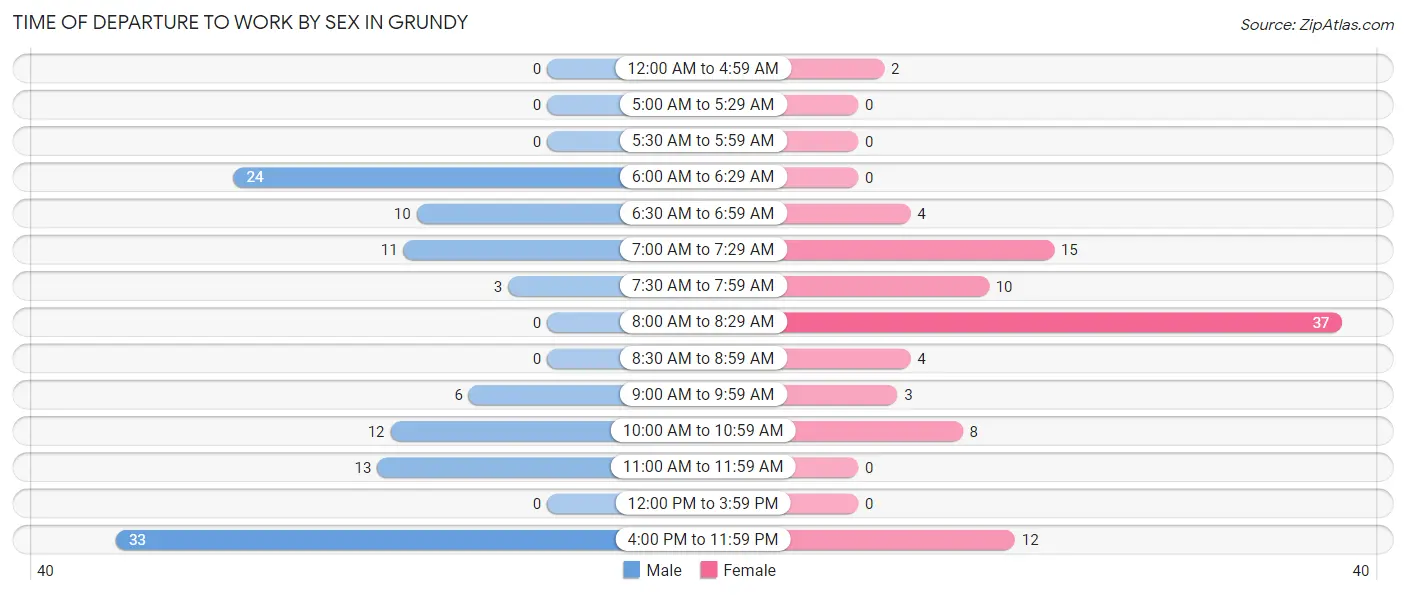
| Time of Departure | Male | Female |
| 12:00 AM to 4:59 AM | 0 (0.0%) | 2 (2.1%) |
| 5:00 AM to 5:29 AM | 0 (0.0%) | 0 (0.0%) |
| 5:30 AM to 5:59 AM | 0 (0.0%) | 0 (0.0%) |
| 6:00 AM to 6:29 AM | 24 (21.4%) | 0 (0.0%) |
| 6:30 AM to 6:59 AM | 10 (8.9%) | 4 (4.2%) |
| 7:00 AM to 7:29 AM | 11 (9.8%) | 15 (15.8%) |
| 7:30 AM to 7:59 AM | 3 (2.7%) | 10 (10.5%) |
| 8:00 AM to 8:29 AM | 0 (0.0%) | 37 (39.0%) |
| 8:30 AM to 8:59 AM | 0 (0.0%) | 4 (4.2%) |
| 9:00 AM to 9:59 AM | 6 (5.4%) | 3 (3.2%) |
| 10:00 AM to 10:59 AM | 12 (10.7%) | 8 (8.4%) |
| 11:00 AM to 11:59 AM | 13 (11.6%) | 0 (0.0%) |
| 12:00 PM to 3:59 PM | 0 (0.0%) | 0 (0.0%) |
| 4:00 PM to 11:59 PM | 33 (29.5%) | 12 (12.6%) |
| Total | 112 (100.0%) | 95 (100.0%) |
Housing Occupancy in Grundy
Occupancy by Ownership in Grundy
Of the total 358 dwellings in Grundy, owner-occupied units account for 291 (81.3%), while renter-occupied units make up 67 (18.7%).
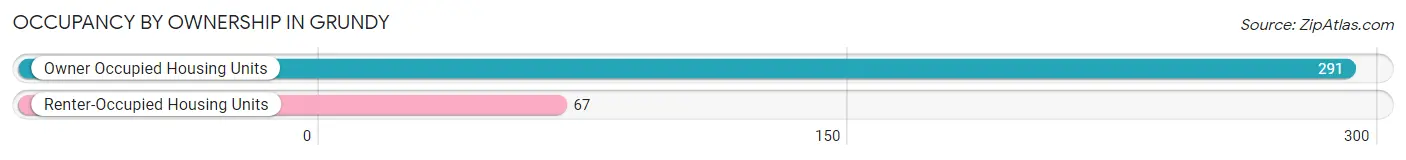
| Occupancy | # Housing Units | % Housing Units |
| Owner Occupied Housing Units | 291 | 81.3% |
| Renter-Occupied Housing Units | 67 | 18.7% |
| Total Occupied Housing Units | 358 | 100.0% |
Occupancy by Household Size in Grundy
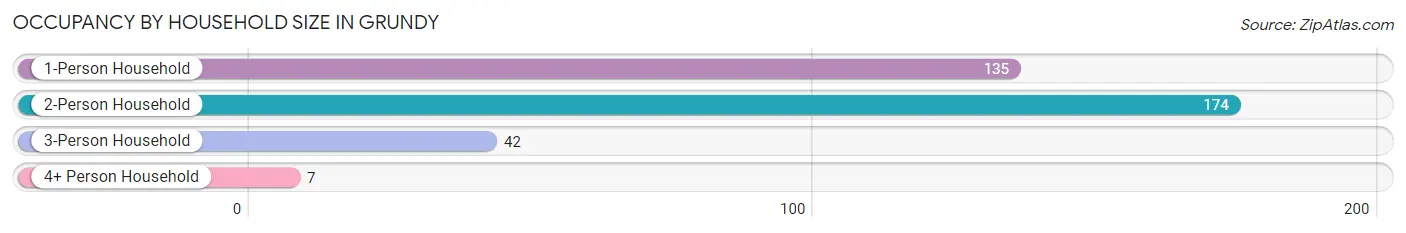
| Household Size | # Housing Units | % Housing Units |
| 1-Person Household | 135 | 37.7% |
| 2-Person Household | 174 | 48.6% |
| 3-Person Household | 42 | 11.7% |
| 4+ Person Household | 7 | 2.0% |
| Total Housing Units | 358 | 100.0% |
Occupancy by Ownership by Household Size in Grundy
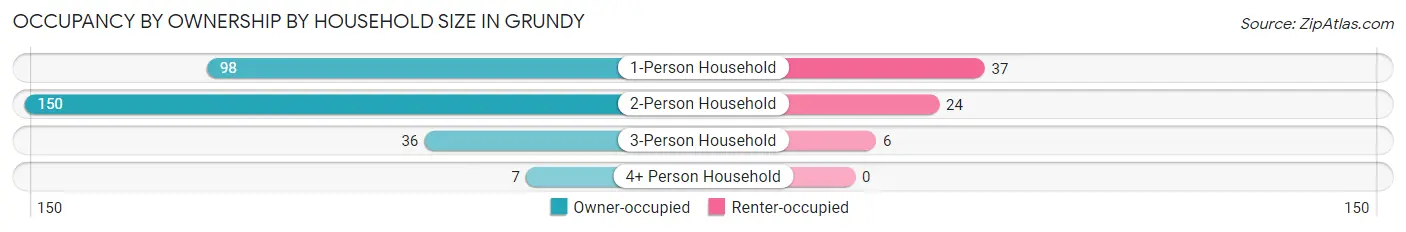
| Household Size | Owner-occupied | Renter-occupied |
| 1-Person Household | 98 (72.6%) | 37 (27.4%) |
| 2-Person Household | 150 (86.2%) | 24 (13.8%) |
| 3-Person Household | 36 (85.7%) | 6 (14.3%) |
| 4+ Person Household | 7 (100.0%) | 0 (0.0%) |
| Total Housing Units | 291 (81.3%) | 67 (18.7%) |
Occupancy by Educational Attainment in Grundy
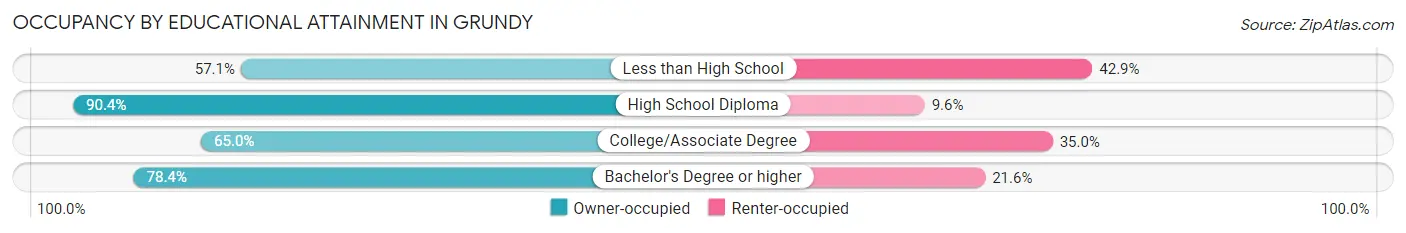
| Household Size | Owner-occupied | Renter-occupied |
| Less than High School | 8 (57.1%) | 6 (42.9%) |
| High School Diploma | 141 (90.4%) | 15 (9.6%) |
| College/Associate Degree | 26 (65.0%) | 14 (35.0%) |
| Bachelor's Degree or higher | 116 (78.4%) | 32 (21.6%) |
Occupancy by Age of Householder in Grundy
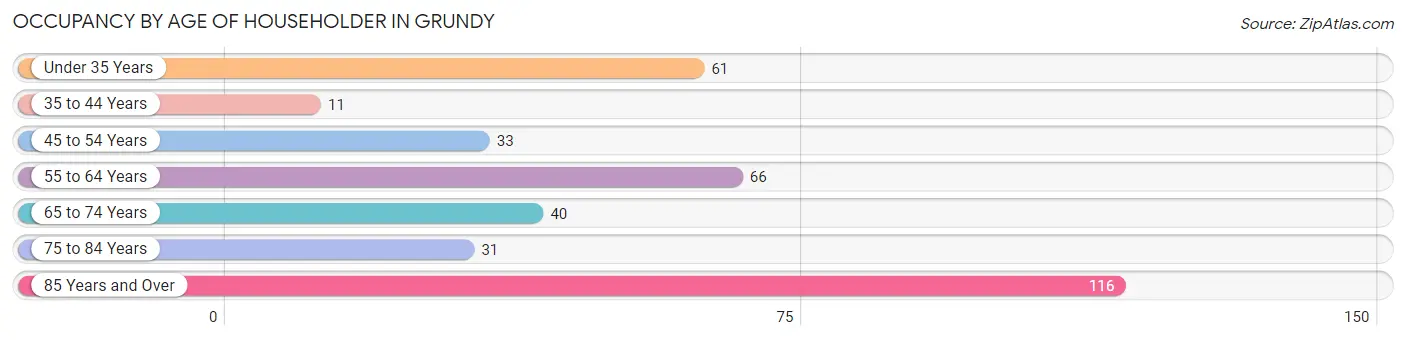
| Age Bracket | # Households | % Households |
| Under 35 Years | 61 | 17.0% |
| 35 to 44 Years | 11 | 3.1% |
| 45 to 54 Years | 33 | 9.2% |
| 55 to 64 Years | 66 | 18.4% |
| 65 to 74 Years | 40 | 11.2% |
| 75 to 84 Years | 31 | 8.7% |
| 85 Years and Over | 116 | 32.4% |
| Total | 358 | 100.0% |
Housing Finances in Grundy
Median Income by Occupancy in Grundy
| Occupancy Type | # Households | Median Income |
| Owner-Occupied | 291 (81.3%) | $0 |
| Renter-Occupied | 67 (18.7%) | $0 |
| Average | 358 (100.0%) | $0 |
Occupancy by Householder Income Bracket in Grundy
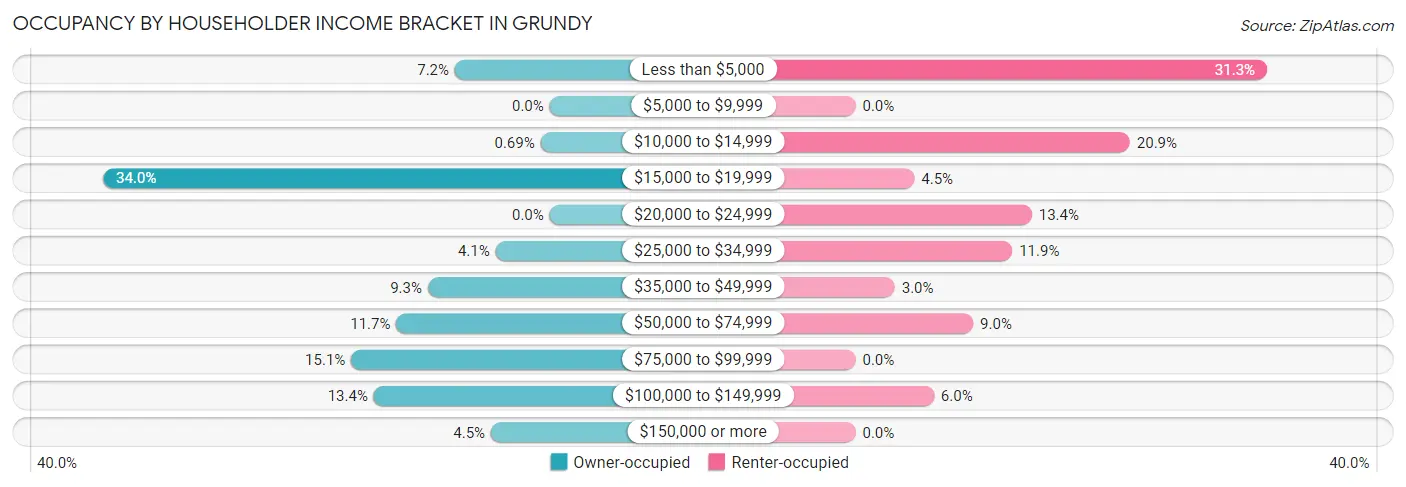
| Income Bracket | Owner-occupied | Renter-occupied |
| Less than $5,000 | 21 (7.2%) | 21 (31.3%) |
| $5,000 to $9,999 | 0 (0.0%) | 0 (0.0%) |
| $10,000 to $14,999 | 2 (0.7%) | 14 (20.9%) |
| $15,000 to $19,999 | 99 (34.0%) | 3 (4.5%) |
| $20,000 to $24,999 | 0 (0.0%) | 9 (13.4%) |
| $25,000 to $34,999 | 12 (4.1%) | 8 (11.9%) |
| $35,000 to $49,999 | 27 (9.3%) | 2 (3.0%) |
| $50,000 to $74,999 | 34 (11.7%) | 6 (9.0%) |
| $75,000 to $99,999 | 44 (15.1%) | 0 (0.0%) |
| $100,000 to $149,999 | 39 (13.4%) | 4 (6.0%) |
| $150,000 or more | 13 (4.5%) | 0 (0.0%) |
| Total | 291 (100.0%) | 67 (100.0%) |
Monthly Housing Cost Tiers in Grundy
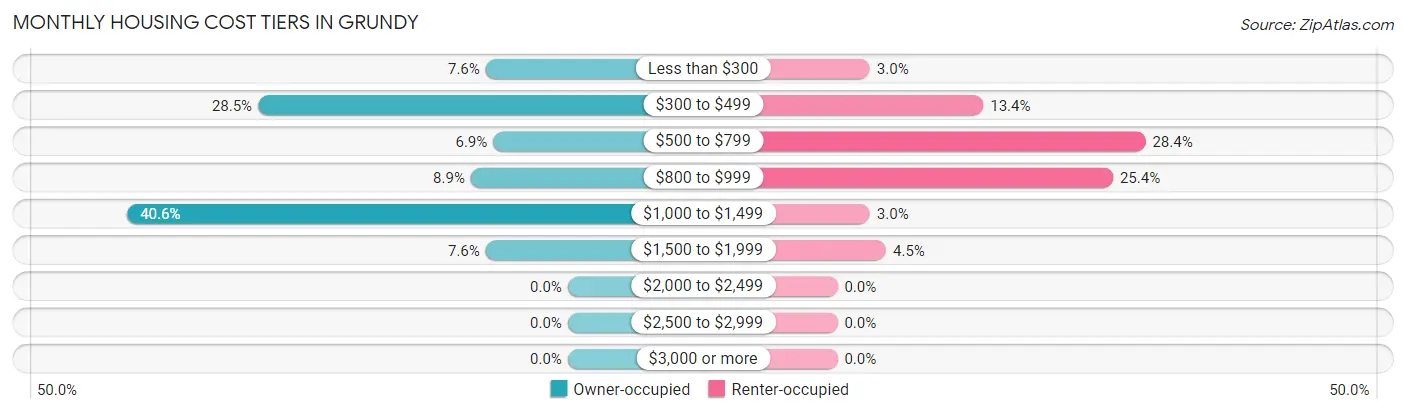
| Monthly Cost | Owner-occupied | Renter-occupied |
| Less than $300 | 22 (7.6%) | 2 (3.0%) |
| $300 to $499 | 83 (28.5%) | 9 (13.4%) |
| $500 to $799 | 20 (6.9%) | 19 (28.4%) |
| $800 to $999 | 26 (8.9%) | 17 (25.4%) |
| $1,000 to $1,499 | 118 (40.6%) | 2 (3.0%) |
| $1,500 to $1,999 | 22 (7.6%) | 3 (4.5%) |
| $2,000 to $2,499 | 0 (0.0%) | 0 (0.0%) |
| $2,500 to $2,999 | 0 (0.0%) | 0 (0.0%) |
| $3,000 or more | 0 (0.0%) | 0 (0.0%) |
| Total | 291 (100.0%) | 67 (100.0%) |
Physical Housing Characteristics in Grundy
Housing Structures in Grundy
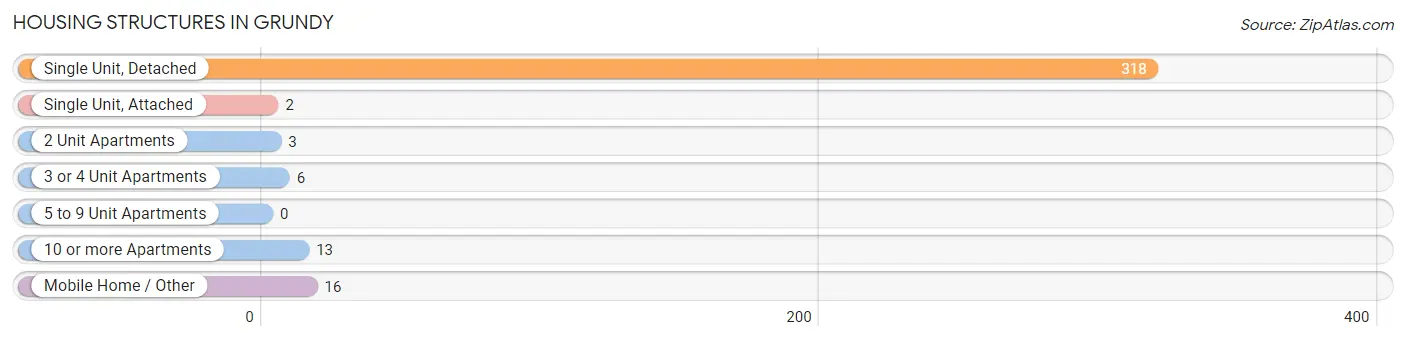
| Structure Type | # Housing Units | % Housing Units |
| Single Unit, Detached | 318 | 88.8% |
| Single Unit, Attached | 2 | 0.6% |
| 2 Unit Apartments | 3 | 0.8% |
| 3 or 4 Unit Apartments | 6 | 1.7% |
| 5 to 9 Unit Apartments | 0 | 0.0% |
| 10 or more Apartments | 13 | 3.6% |
| Mobile Home / Other | 16 | 4.5% |
| Total | 358 | 100.0% |
Housing Structures by Occupancy in Grundy
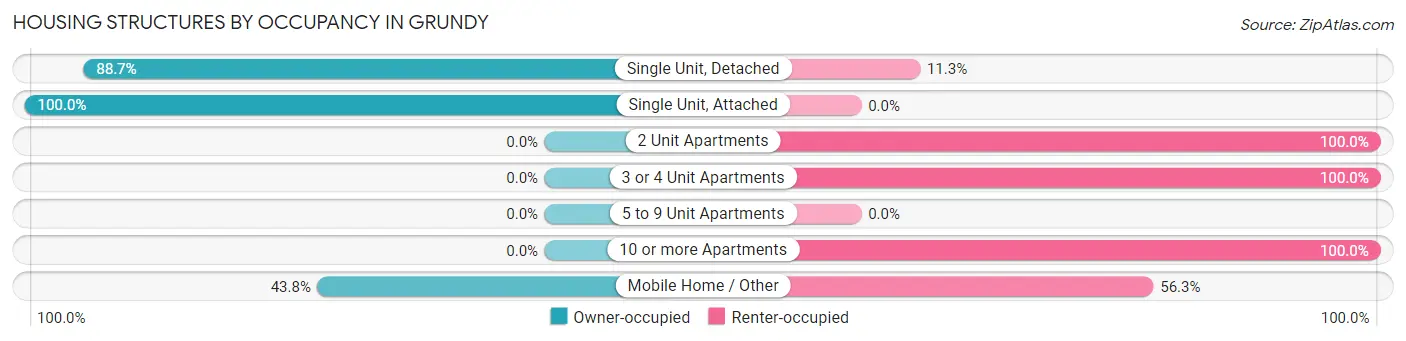
| Structure Type | Owner-occupied | Renter-occupied |
| Single Unit, Detached | 282 (88.7%) | 36 (11.3%) |
| Single Unit, Attached | 2 (100.0%) | 0 (0.0%) |
| 2 Unit Apartments | 0 (0.0%) | 3 (100.0%) |
| 3 or 4 Unit Apartments | 0 (0.0%) | 6 (100.0%) |
| 5 to 9 Unit Apartments | 0 (0.0%) | 0 (0.0%) |
| 10 or more Apartments | 0 (0.0%) | 13 (100.0%) |
| Mobile Home / Other | 7 (43.8%) | 9 (56.2%) |
| Total | 291 (81.3%) | 67 (18.7%) |
Housing Structures by Number of Rooms in Grundy
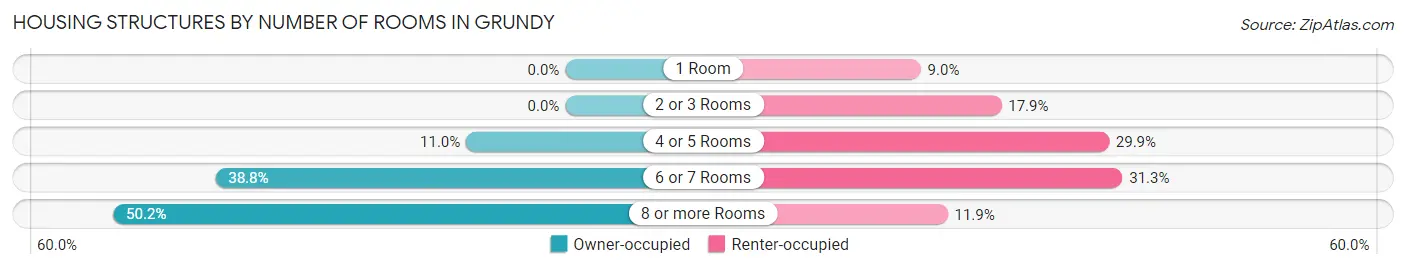
| Number of Rooms | Owner-occupied | Renter-occupied |
| 1 Room | 0 (0.0%) | 6 (9.0%) |
| 2 or 3 Rooms | 0 (0.0%) | 12 (17.9%) |
| 4 or 5 Rooms | 32 (11.0%) | 20 (29.8%) |
| 6 or 7 Rooms | 113 (38.8%) | 21 (31.3%) |
| 8 or more Rooms | 146 (50.2%) | 8 (11.9%) |
| Total | 291 (100.0%) | 67 (100.0%) |
Housing Structure by Heating Type in Grundy
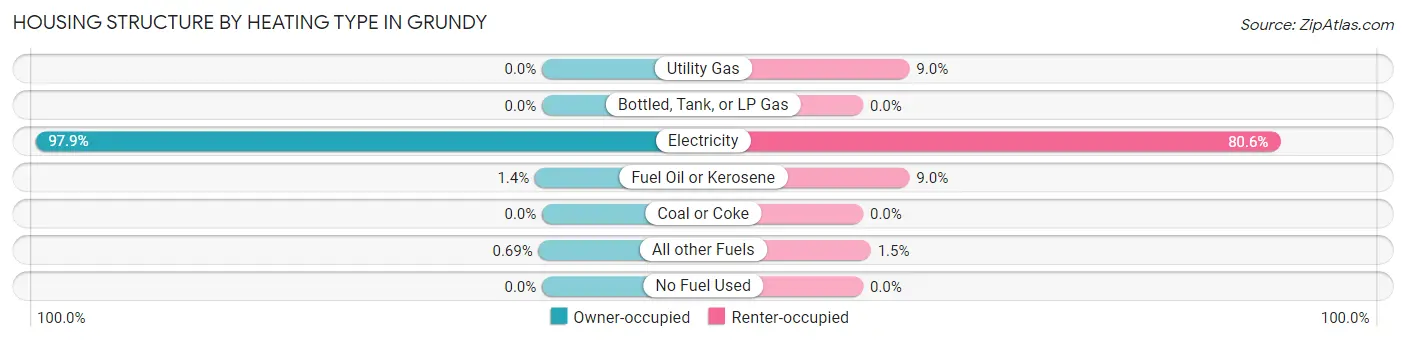
| Heating Type | Owner-occupied | Renter-occupied |
| Utility Gas | 0 (0.0%) | 6 (9.0%) |
| Bottled, Tank, or LP Gas | 0 (0.0%) | 0 (0.0%) |
| Electricity | 285 (97.9%) | 54 (80.6%) |
| Fuel Oil or Kerosene | 4 (1.4%) | 6 (9.0%) |
| Coal or Coke | 0 (0.0%) | 0 (0.0%) |
| All other Fuels | 2 (0.7%) | 1 (1.5%) |
| No Fuel Used | 0 (0.0%) | 0 (0.0%) |
| Total | 291 (100.0%) | 67 (100.0%) |
Household Vehicle Usage in Grundy
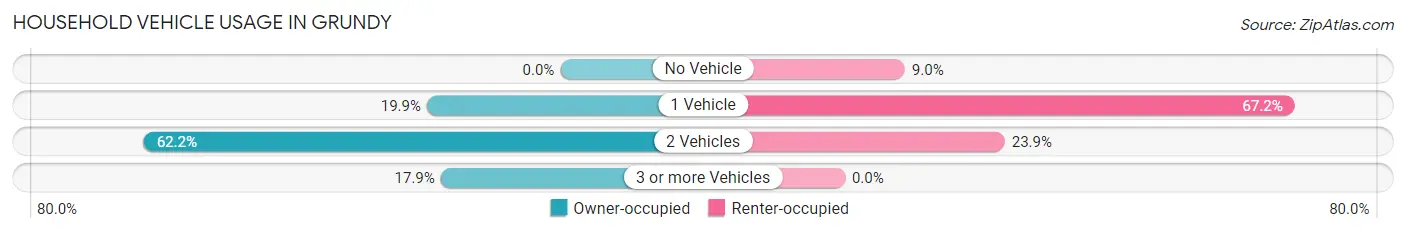
| Vehicles per Household | Owner-occupied | Renter-occupied |
| No Vehicle | 0 (0.0%) | 6 (9.0%) |
| 1 Vehicle | 58 (19.9%) | 45 (67.2%) |
| 2 Vehicles | 181 (62.2%) | 16 (23.9%) |
| 3 or more Vehicles | 52 (17.9%) | 0 (0.0%) |
| Total | 291 (100.0%) | 67 (100.0%) |
Real Estate & Mortgages in Grundy
Real Estate and Mortgage Overview in Grundy
| Characteristic | Without Mortgage | With Mortgage |
| Housing Units | 132 | 159 |
| Median Property Value | $145,300 | $186,700 |
| Median Household Income | $38,571 | $5 |
| Monthly Housing Costs | $433 | $0 |
| Real Estate Taxes | $941 | $19 |
Property Value by Mortgage Status in Grundy
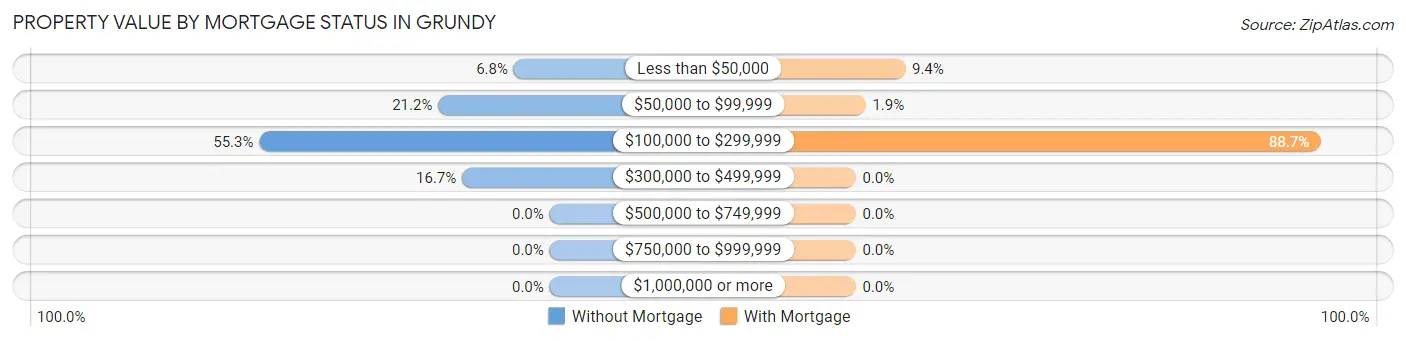
| Property Value | Without Mortgage | With Mortgage |
| Less than $50,000 | 9 (6.8%) | 15 (9.4%) |
| $50,000 to $99,999 | 28 (21.2%) | 3 (1.9%) |
| $100,000 to $299,999 | 73 (55.3%) | 141 (88.7%) |
| $300,000 to $499,999 | 22 (16.7%) | 0 (0.0%) |
| $500,000 to $749,999 | 0 (0.0%) | 0 (0.0%) |
| $750,000 to $999,999 | 0 (0.0%) | 0 (0.0%) |
| $1,000,000 or more | 0 (0.0%) | 0 (0.0%) |
| Total | 132 (100.0%) | 159 (100.0%) |
Household Income by Mortgage Status in Grundy
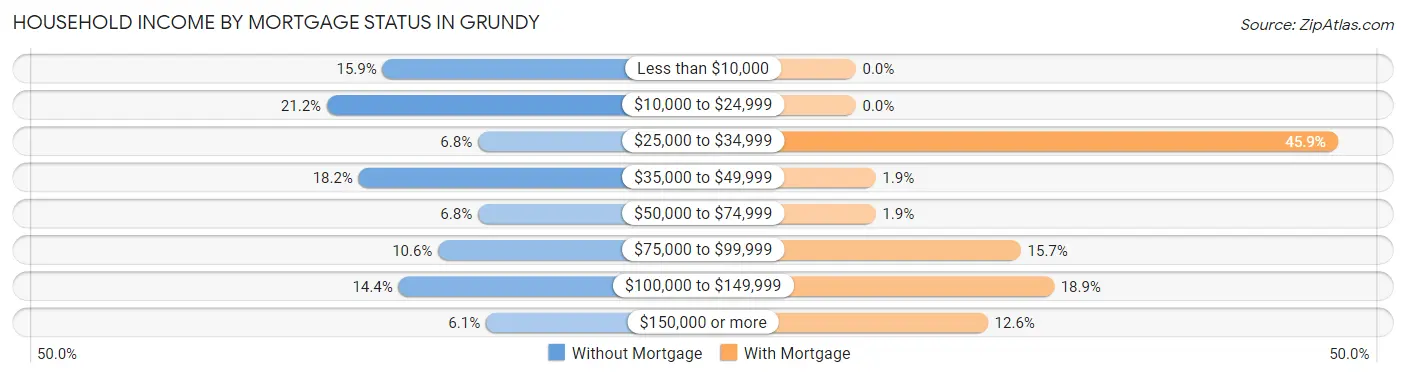
| Household Income | Without Mortgage | With Mortgage |
| Less than $10,000 | 21 (15.9%) | 0 (0.0%) |
| $10,000 to $24,999 | 28 (21.2%) | 0 (0.0%) |
| $25,000 to $34,999 | 9 (6.8%) | 73 (45.9%) |
| $35,000 to $49,999 | 24 (18.2%) | 3 (1.9%) |
| $50,000 to $74,999 | 9 (6.8%) | 3 (1.9%) |
| $75,000 to $99,999 | 14 (10.6%) | 25 (15.7%) |
| $100,000 to $149,999 | 19 (14.4%) | 30 (18.9%) |
| $150,000 or more | 8 (6.1%) | 20 (12.6%) |
| Total | 132 (100.0%) | 159 (100.0%) |
Property Value to Household Income Ratio in Grundy
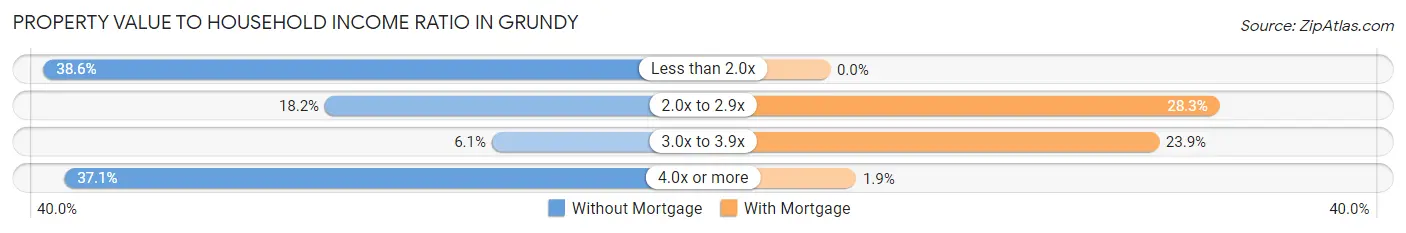
| Value-to-Income Ratio | Without Mortgage | With Mortgage |
| Less than 2.0x | 51 (38.6%) | 0 (0.0%) |
| 2.0x to 2.9x | 24 (18.2%) | 45 (28.3%) |
| 3.0x to 3.9x | 8 (6.1%) | 38 (23.9%) |
| 4.0x or more | 49 (37.1%) | 3 (1.9%) |
| Total | 132 (100.0%) | 159 (100.0%) |
Real Estate Taxes by Mortgage Status in Grundy
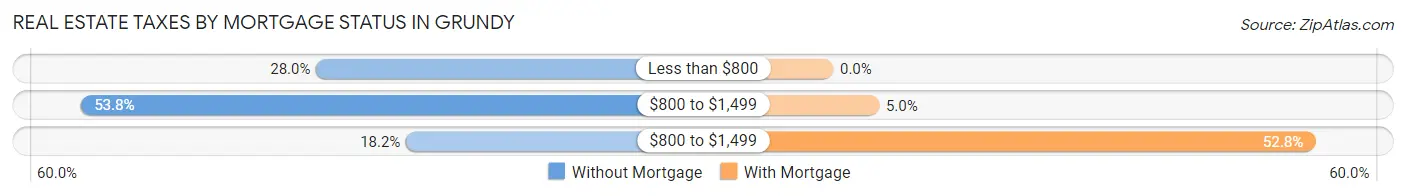
| Property Taxes | Without Mortgage | With Mortgage |
| Less than $800 | 37 (28.0%) | 0 (0.0%) |
| $800 to $1,499 | 71 (53.8%) | 8 (5.0%) |
| $800 to $1,499 | 24 (18.2%) | 84 (52.8%) |
| Total | 132 (100.0%) | 159 (100.0%) |
Health & Disability in Grundy
Health Insurance Coverage by Age in Grundy
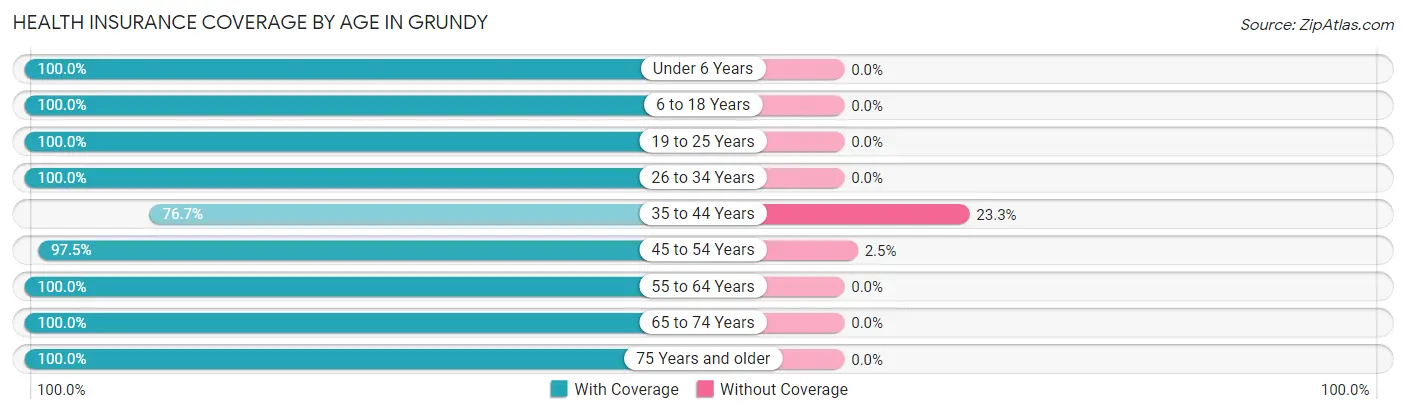
| Age Bracket | With Coverage | Without Coverage |
| Under 6 Years | 60 (100.0%) | 0 (0.0%) |
| 6 to 18 Years | 37 (100.0%) | 0 (0.0%) |
| 19 to 25 Years | 43 (100.0%) | 0 (0.0%) |
| 26 to 34 Years | 59 (100.0%) | 0 (0.0%) |
| 35 to 44 Years | 23 (76.7%) | 7 (23.3%) |
| 45 to 54 Years | 78 (97.5%) | 2 (2.5%) |
| 55 to 64 Years | 113 (100.0%) | 0 (0.0%) |
| 65 to 74 Years | 57 (100.0%) | 0 (0.0%) |
| 75 Years and older | 191 (100.0%) | 0 (0.0%) |
| Total | 661 (98.7%) | 9 (1.3%) |
Health Insurance Coverage by Citizenship Status in Grundy
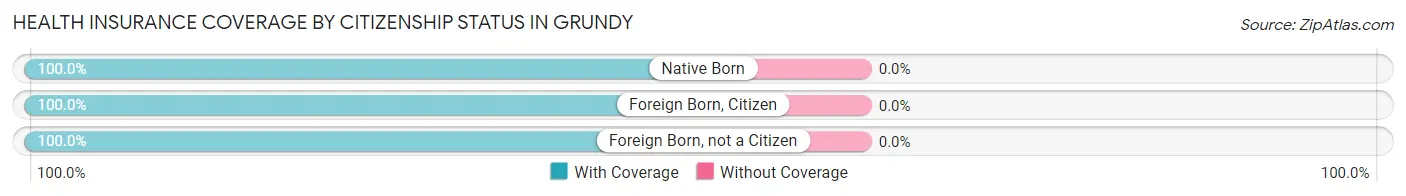
| Citizenship Status | With Coverage | Without Coverage |
| Native Born | 60 (100.0%) | 0 (0.0%) |
| Foreign Born, Citizen | 37 (100.0%) | 0 (0.0%) |
| Foreign Born, not a Citizen | 43 (100.0%) | 0 (0.0%) |
Health Insurance Coverage by Household Income in Grundy
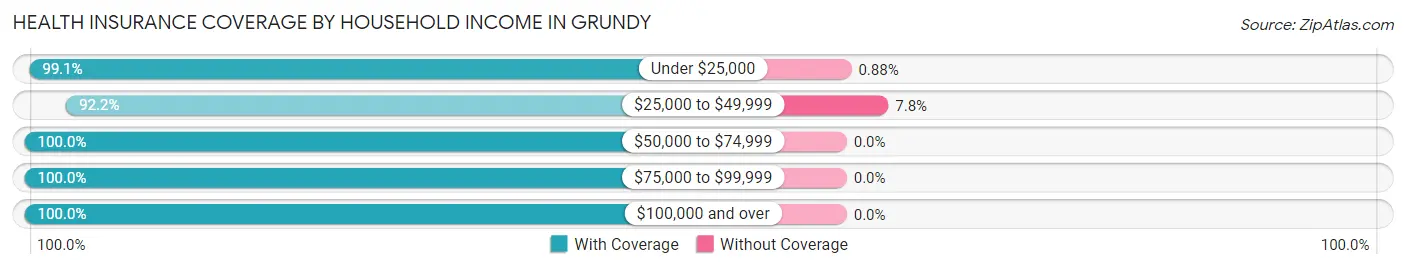
| Household Income | With Coverage | Without Coverage |
| Under $25,000 | 224 (99.1%) | 2 (0.9%) |
| $25,000 to $49,999 | 83 (92.2%) | 7 (7.8%) |
| $50,000 to $74,999 | 63 (100.0%) | 0 (0.0%) |
| $75,000 to $99,999 | 130 (100.0%) | 0 (0.0%) |
| $100,000 and over | 161 (100.0%) | 0 (0.0%) |
Public vs Private Health Insurance Coverage by Age in Grundy
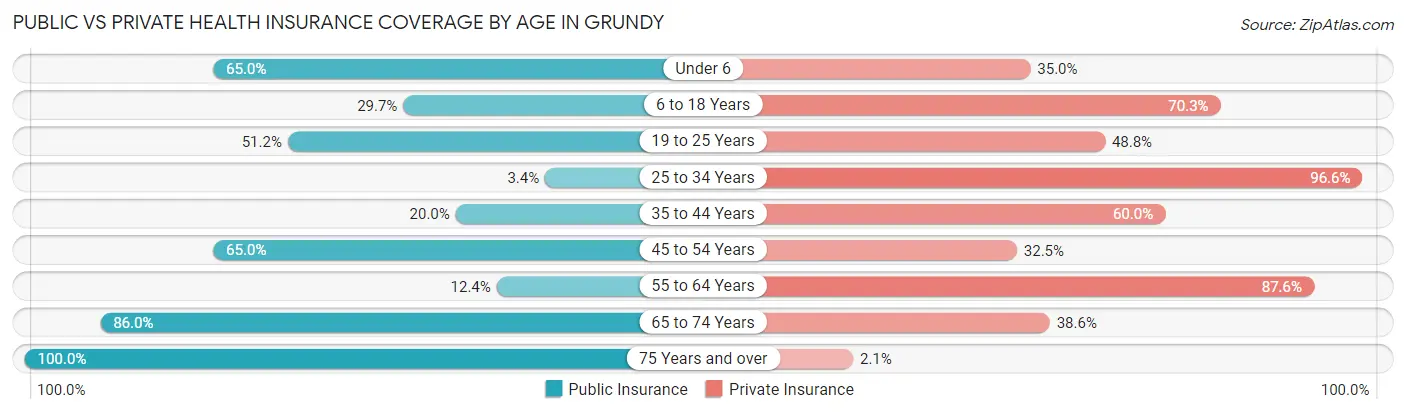
| Age Bracket | Public Insurance | Private Insurance |
| Under 6 | 39 (65.0%) | 21 (35.0%) |
| 6 to 18 Years | 11 (29.7%) | 26 (70.3%) |
| 19 to 25 Years | 22 (51.2%) | 21 (48.8%) |
| 25 to 34 Years | 2 (3.4%) | 57 (96.6%) |
| 35 to 44 Years | 6 (20.0%) | 18 (60.0%) |
| 45 to 54 Years | 52 (65.0%) | 26 (32.5%) |
| 55 to 64 Years | 14 (12.4%) | 99 (87.6%) |
| 65 to 74 Years | 49 (86.0%) | 22 (38.6%) |
| 75 Years and over | 191 (100.0%) | 4 (2.1%) |
| Total | 386 (57.6%) | 294 (43.9%) |
Disability Status by Sex by Age in Grundy
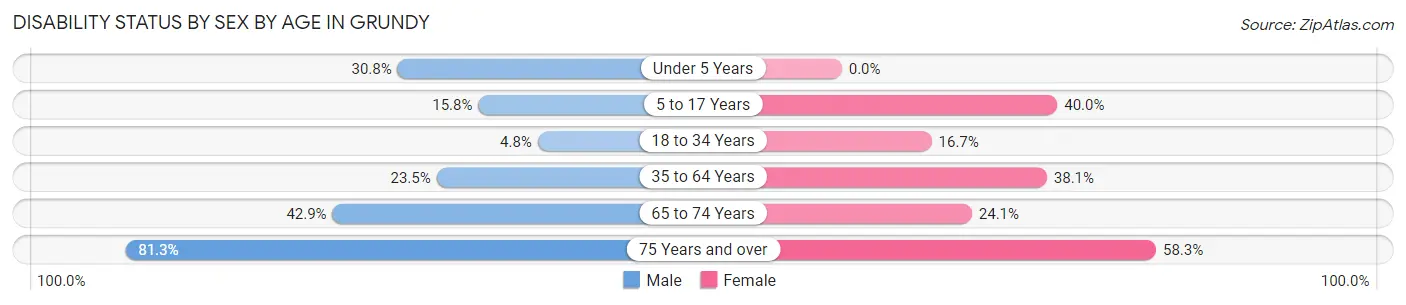
| Age Bracket | Male | Female |
| Under 5 Years | 16 (30.8%) | 0 (0.0%) |
| 5 to 17 Years | 3 (15.8%) | 6 (40.0%) |
| 18 to 34 Years | 3 (4.8%) | 8 (16.7%) |
| 35 to 64 Years | 16 (23.5%) | 59 (38.1%) |
| 65 to 74 Years | 12 (42.9%) | 7 (24.1%) |
| 75 Years and over | 87 (81.3%) | 49 (58.3%) |
Disability Class by Sex by Age in Grundy
Disability Class: Hearing Difficulty
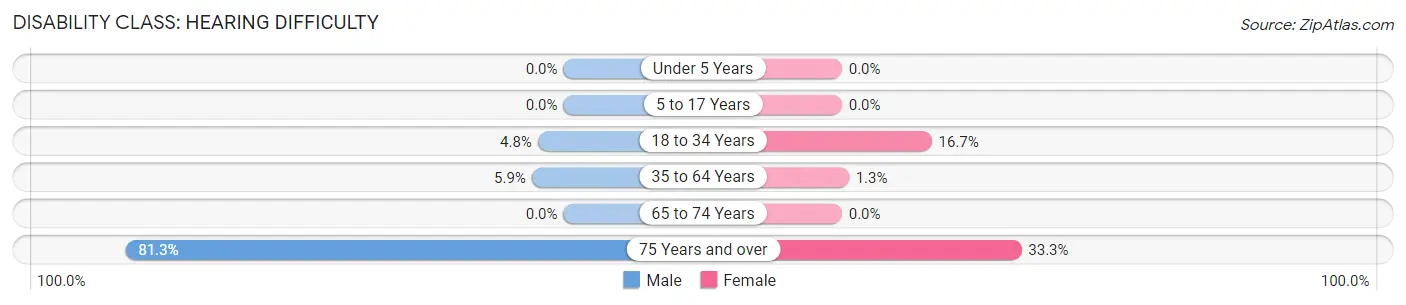
| Age Bracket | Male | Female |
| Under 5 Years | 0 (0.0%) | 0 (0.0%) |
| 5 to 17 Years | 0 (0.0%) | 0 (0.0%) |
| 18 to 34 Years | 3 (4.8%) | 8 (16.7%) |
| 35 to 64 Years | 4 (5.9%) | 2 (1.3%) |
| 65 to 74 Years | 0 (0.0%) | 0 (0.0%) |
| 75 Years and over | 87 (81.3%) | 28 (33.3%) |
Disability Class: Vision Difficulty
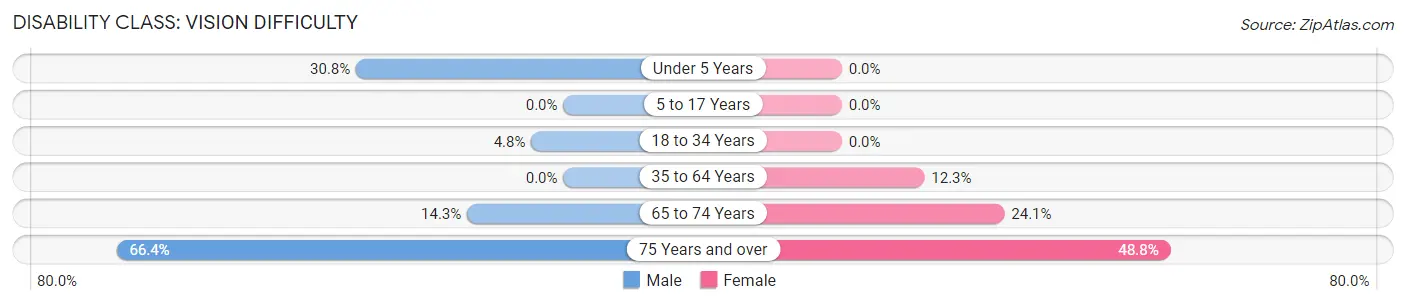
| Age Bracket | Male | Female |
| Under 5 Years | 16 (30.8%) | 0 (0.0%) |
| 5 to 17 Years | 0 (0.0%) | 0 (0.0%) |
| 18 to 34 Years | 3 (4.8%) | 0 (0.0%) |
| 35 to 64 Years | 0 (0.0%) | 19 (12.3%) |
| 65 to 74 Years | 4 (14.3%) | 7 (24.1%) |
| 75 Years and over | 71 (66.4%) | 41 (48.8%) |
Disability Class: Cognitive Difficulty
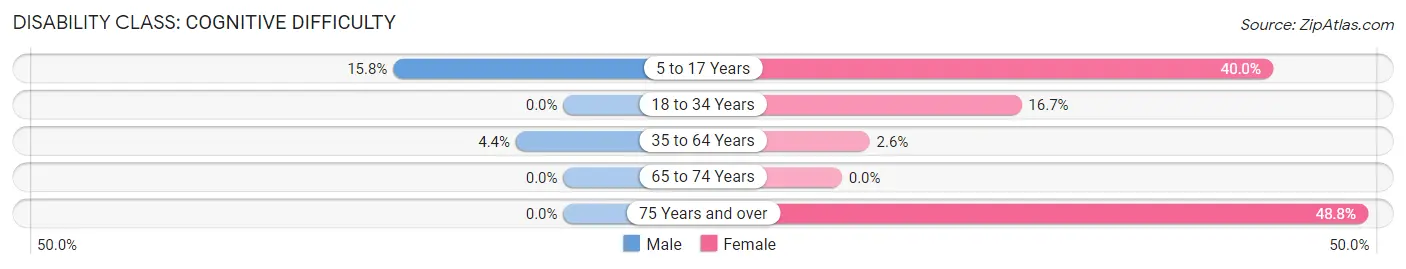
| Age Bracket | Male | Female |
| 5 to 17 Years | 3 (15.8%) | 6 (40.0%) |
| 18 to 34 Years | 0 (0.0%) | 8 (16.7%) |
| 35 to 64 Years | 3 (4.4%) | 4 (2.6%) |
| 65 to 74 Years | 0 (0.0%) | 0 (0.0%) |
| 75 Years and over | 0 (0.0%) | 41 (48.8%) |
Disability Class: Ambulatory Difficulty
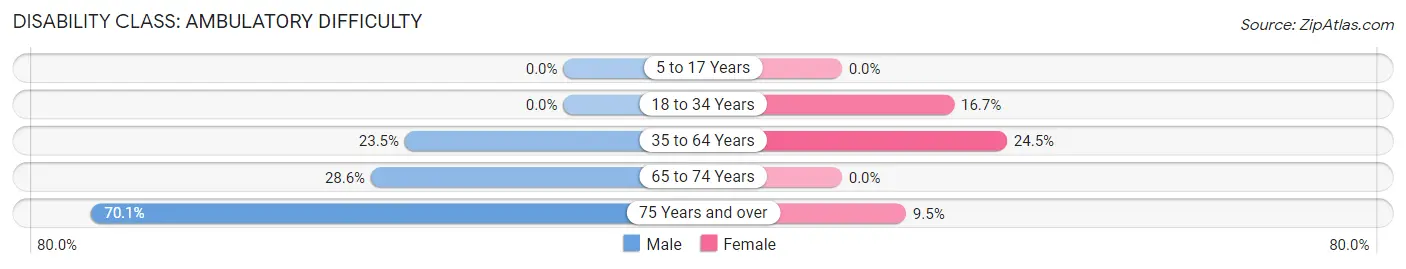
| Age Bracket | Male | Female |
| 5 to 17 Years | 0 (0.0%) | 0 (0.0%) |
| 18 to 34 Years | 0 (0.0%) | 8 (16.7%) |
| 35 to 64 Years | 16 (23.5%) | 38 (24.5%) |
| 65 to 74 Years | 8 (28.6%) | 0 (0.0%) |
| 75 Years and over | 75 (70.1%) | 8 (9.5%) |
Disability Class: Self-Care Difficulty
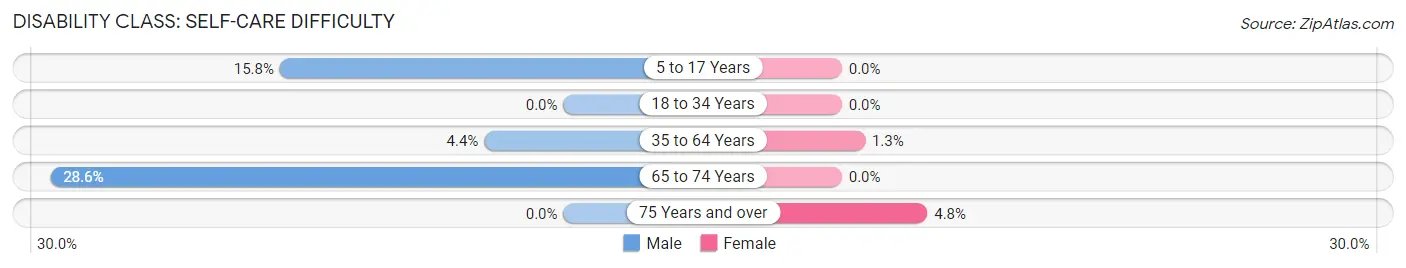
| Age Bracket | Male | Female |
| 5 to 17 Years | 3 (15.8%) | 0 (0.0%) |
| 18 to 34 Years | 0 (0.0%) | 0 (0.0%) |
| 35 to 64 Years | 3 (4.4%) | 2 (1.3%) |
| 65 to 74 Years | 8 (28.6%) | 0 (0.0%) |
| 75 Years and over | 0 (0.0%) | 4 (4.8%) |
Technology Access in Grundy
Computing Device Access in Grundy
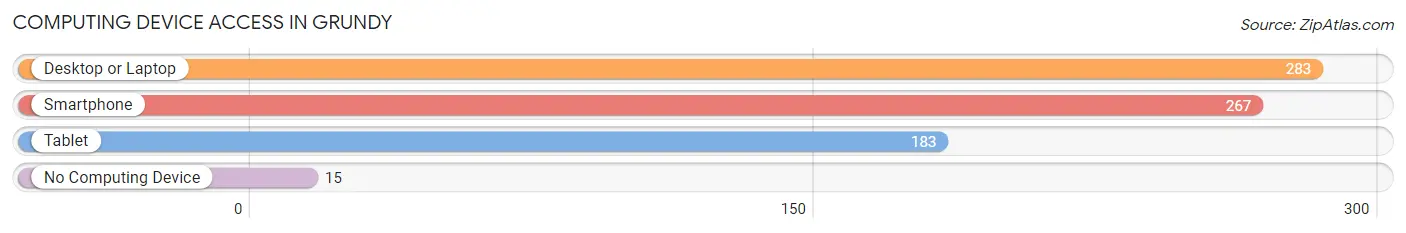
| Device Type | # Households | % Households |
| Desktop or Laptop | 283 | 79.0% |
| Smartphone | 267 | 74.6% |
| Tablet | 183 | 51.1% |
| No Computing Device | 15 | 4.2% |
| Total | 358 | 100.0% |
Internet Access in Grundy
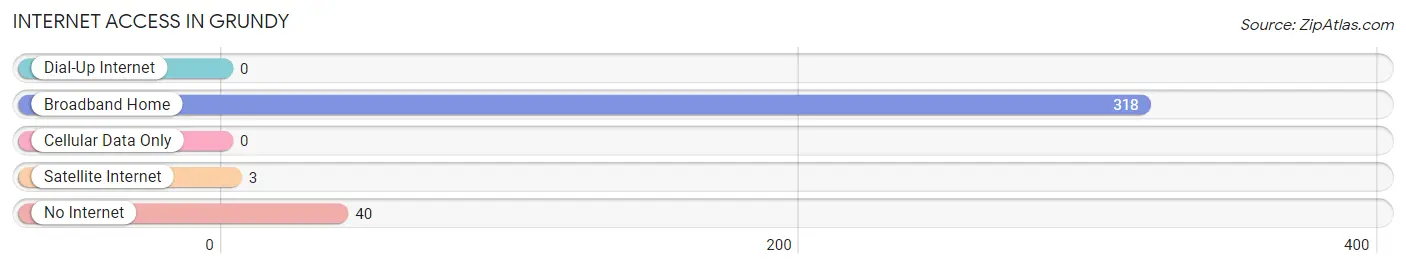
| Internet Type | # Households | % Households |
| Dial-Up Internet | 0 | 0.0% |
| Broadband Home | 318 | 88.8% |
| Cellular Data Only | 0 | 0.0% |
| Satellite Internet | 3 | 0.8% |
| No Internet | 40 | 11.2% |
| Total | 358 | 100.0% |
Grundy Summary
Grundy is a town located in Buchanan County, Virginia, United States. The population was 1,895 at the 2010 census. It is the county seat of Buchanan County. Grundy is located in the Appalachian Mountains of southwestern Virginia, near the Kentucky and West Virginia borders.
History
Grundy was founded in 1856 and named after Felix Grundy, a U.S. Senator from Tennessee. The town was incorporated in 1872. The town was originally a coal mining town, and the coal industry was the main source of employment for many years. The town was also home to a large railroad yard, which was used to transport coal and other goods.
In the early 20th century, Grundy was a major center for the timber industry. The town was home to several sawmills and lumber companies, and the timber industry provided employment for many of the town's residents.
In the late 20th century, the coal industry began to decline, and the timber industry also began to decline. The town's economy shifted to tourism and retail, and Grundy is now home to several tourist attractions, including the Appalachian Trail, the Breaks Interstate Park, and the Grundy Historic District.
Geography
Grundy is located at 37°14'17" North, 82°17'45" West (37.238, -82.296). The town is situated in the Appalachian Mountains of southwestern Virginia, near the Kentucky and West Virginia borders. The town is located in the Appalachian Plateau region of the Appalachian Mountains.
The town is located in the Appalachian Valley and Ridge region, and is surrounded by mountains and hills. The town is located in the Appalachian Plateau region of the Appalachian Mountains. The town is located in the Appalachian Valley and Ridge region, and is surrounded by mountains and hills.
The town is located in the Appalachian Valley and Ridge region, and is surrounded by mountains and hills. The town is located in the Appalachian Plateau region of the Appalachian Mountains. The town is located in the Appalachian Valley and Ridge region, and is surrounded by mountains and hills.
The town is located in the Appalachian Valley and Ridge region, and is surrounded by mountains and hills. The town is located in the Appalachian Plateau region of the Appalachian Mountains. The town is located in the Appalachian Valley and Ridge region, and is surrounded by mountains and hills.
The town is located in the Appalachian Valley and Ridge region, and is surrounded by mountains and hills. The town is located in the Appalachian Plateau region of the Appalachian Mountains. The town is located in the Appalachian Valley and Ridge region, and is surrounded by mountains and hills.
Economy
Grundy's economy is largely based on tourism and retail. The town is home to several tourist attractions, including the Appalachian Trail, the Breaks Interstate Park, and the Grundy Historic District. The town is also home to several retail stores, restaurants, and other businesses.
The town is also home to several manufacturing companies, including a furniture factory, a paper mill, and a plastics factory. The town is also home to several coal mines, which provide employment for many of the town's residents.
Demographics
As of the 2010 census, the population of Grundy was 1,895. The racial makeup of the town was 95.3% White, 2.2% African American, 0.3% Native American, 0.2% Asian, 0.1% Pacific Islander, 0.7% from other races, and 1.3% from two or more races. Hispanic or Latino of any race were 1.7% of the population.
The median household income in Grundy was $25,972, and the median family income was $31,250. The per capita income for the town was $14,945. About 22.2% of the population was below the poverty line.
Conclusion
Grundy is a small town located in Buchanan County, Virginia. The town was founded in 1856 and was originally a coal mining town. The town's economy has shifted to tourism and retail, and Grundy is now home to several tourist attractions. The population of Grundy was 1,895 at the 2010 census, and the median household income was $25,972. The town is also home to several manufacturing companies, coal mines, and other businesses.
Common Questions
What is Per Capita Income in Grundy?
Per Capita income in Grundy is $24,893.
What is the Median Family Income in Grundy?
Median Family Income in Grundy is $86,875.
What is Income or Wage Gap in Grundy?
Income or Wage Gap in Grundy is 11.0%.
Women in Grundy earn 89.0 cents for every dollar earned by a man.
What is Inequality or Gini Index in Grundy?
Inequality or Gini Index in Grundy is 0.51.
What is the Total Population of Grundy?
Total Population of Grundy is 777.
What is the Total Male Population of Grundy?
Total Male Population of Grundy is 401.
What is the Total Female Population of Grundy?
Total Female Population of Grundy is 376.
What is the Ratio of Males per 100 Females in Grundy?
There are 106.65 Males per 100 Females in Grundy.
What is the Ratio of Females per 100 Males in Grundy?
There are 93.77 Females per 100 Males in Grundy.
What is the Median Population Age in Grundy?
Median Population Age in Grundy is 52.7 Years.
What is the Average Family Size in Grundy
Average Family Size in Grundy is 2.7 People.
What is the Average Household Size in Grundy
Average Household Size in Grundy is 1.9 People.
How Large is the Labor Force in Grundy?
There are 236 People in the Labor Forcein in Grundy.
What is the Percentage of People in the Labor Force in Grundy?
35.9% of People are in the Labor Force in Grundy.