Cascades, VA Map & Demographics
Cascades Map
Cascades Overview
$66,606
PER CAPITA INCOME
$183,273
AVG FAMILY INCOME
$160,707
AVG HOUSEHOLD INCOME
36.9%
WAGE / INCOME GAP [ % ]
63.1¢/ $1
WAGE / INCOME GAP [ $ ]
0.36
INEQUALITY / GINI INDEX
12,542
TOTAL POPULATION
6,310
MALE POPULATION
6,232
FEMALE POPULATION
101.25
MALES / 100 FEMALES
98.76
FEMALES / 100 MALES
39.1
MEDIAN AGE
3.3
AVG FAMILY SIZE
2.7
AVG HOUSEHOLD SIZE
7,319
LABOR FORCE [ PEOPLE ]
74.7%
PERCENT IN LABOR FORCE
3.8%
UNEMPLOYMENT RATE
Income in Cascades
Income Overview in Cascades
Per Capita Income in Cascades is $66,606, while median incomes of families and households are $183,273 and $160,707 respectively.
| Characteristic | Number | Measure |
| Per Capita Income | 12,542 | $66,606 |
| Median Family Income | 3,209 | $183,273 |
| Mean Family Income | 3,209 | $203,096 |
| Median Household Income | 4,627 | $160,707 |
| Mean Household Income | 4,627 | $177,245 |
| Income Deficit | 3,209 | $0 |
| Wage / Income Gap (%) | 12,542 | 36.93% |
| Wage / Income Gap ($) | 12,542 | 63.07¢ per $1 |
| Gini / Inequality Index | 12,542 | 0.36 |
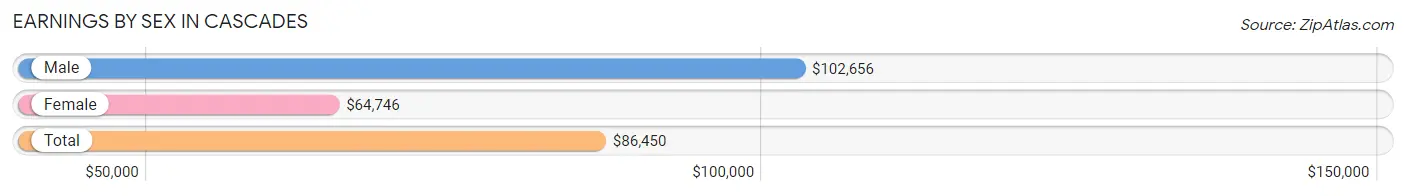
Earnings by Sex in Cascades
Average Earnings in Cascades are $86,450, $102,656 for men and $64,746 for women, a difference of 36.9%.
| Sex | Number | Average Earnings |
| Male | 3,820 (50.9%) | $102,656 |
| Female | 3,690 (49.1%) | $64,746 |
| Total | 7,510 (100.0%) | $86,450 |
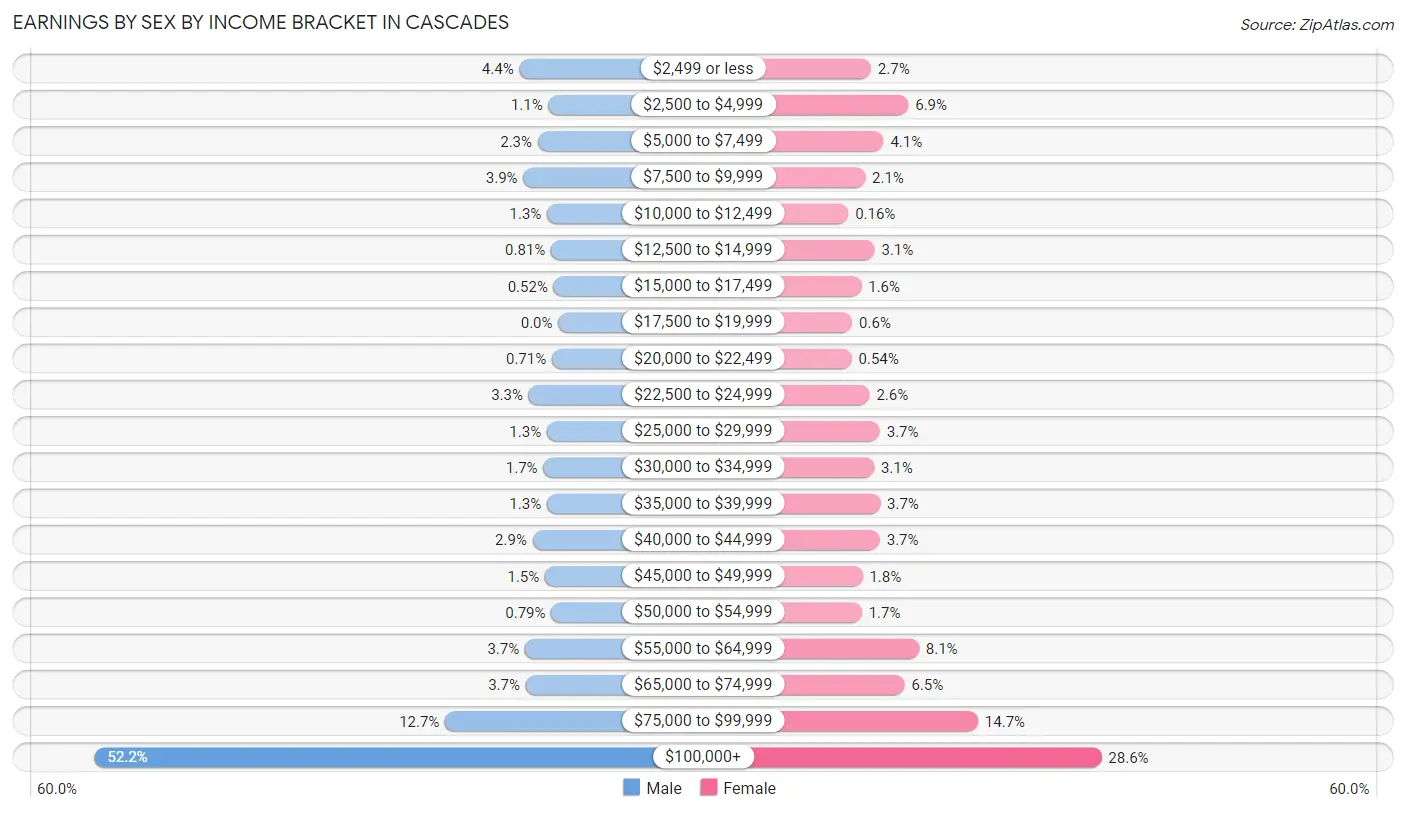
Earnings by Sex by Income Bracket in Cascades
The most common earnings brackets in Cascades are $100,000+ for men (1,992 | 52.1%) and $100,000+ for women (1,056 | 28.6%).
| Income | Male | Female |
| $2,499 or less | 167 (4.4%) | 100 (2.7%) |
| $2,500 to $4,999 | 42 (1.1%) | 255 (6.9%) |
| $5,000 to $7,499 | 88 (2.3%) | 152 (4.1%) |
| $7,500 to $9,999 | 150 (3.9%) | 76 (2.1%) |
| $10,000 to $12,499 | 48 (1.3%) | 6 (0.2%) |
| $12,500 to $14,999 | 31 (0.8%) | 115 (3.1%) |
| $15,000 to $17,499 | 20 (0.5%) | 60 (1.6%) |
| $17,500 to $19,999 | 0 (0.0%) | 22 (0.6%) |
| $20,000 to $22,499 | 27 (0.7%) | 20 (0.5%) |
| $22,500 to $24,999 | 127 (3.3%) | 94 (2.5%) |
| $25,000 to $29,999 | 49 (1.3%) | 137 (3.7%) |
| $30,000 to $34,999 | 64 (1.7%) | 113 (3.1%) |
| $35,000 to $39,999 | 49 (1.3%) | 138 (3.7%) |
| $40,000 to $44,999 | 110 (2.9%) | 137 (3.7%) |
| $45,000 to $49,999 | 57 (1.5%) | 65 (1.8%) |
| $50,000 to $54,999 | 30 (0.8%) | 62 (1.7%) |
| $55,000 to $64,999 | 143 (3.7%) | 299 (8.1%) |
| $65,000 to $74,999 | 140 (3.7%) | 239 (6.5%) |
| $75,000 to $99,999 | 486 (12.7%) | 544 (14.7%) |
| $100,000+ | 1,992 (52.1%) | 1,056 (28.6%) |
| Total | 3,820 (100.0%) | 3,690 (100.0%) |
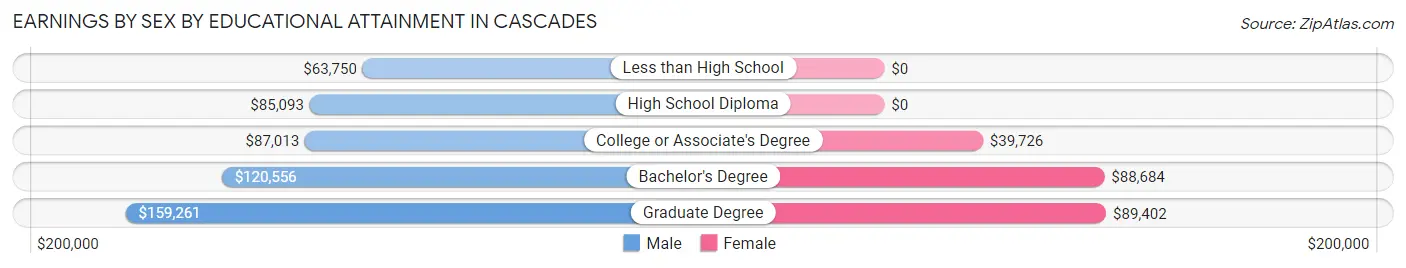
Earnings by Sex by Educational Attainment in Cascades
Average earnings in Cascades are $120,278 for men and $71,042 for women, a difference of 40.9%. Men with an educational attainment of graduate degree enjoy the highest average annual earnings of $159,261, while those with less than high school education earn the least with $63,750. Women with an educational attainment of graduate degree earn the most with the average annual earnings of $89,402, while those with college or associate's degree education have the smallest earnings of $39,726.
| Educational Attainment | Male Income | Female Income |
| Less than High School | $63,750 | $0 |
| High School Diploma | $85,093 | $0 |
| College or Associate's Degree | $87,013 | $39,726 |
| Bachelor's Degree | $120,556 | $88,684 |
| Graduate Degree | $159,261 | $89,402 |
| Total | $120,278 | $71,042 |
Family Income in Cascades
Family Income Brackets in Cascades
According to the Cascades family income data, there are 1,399 families falling into the $200,000+ income range, which is the most common income bracket and makes up 43.6% of all families. Conversely, the $25,000 to $34,999 income bracket is the least frequent group with only 6 families (0.2%) belonging to this category.
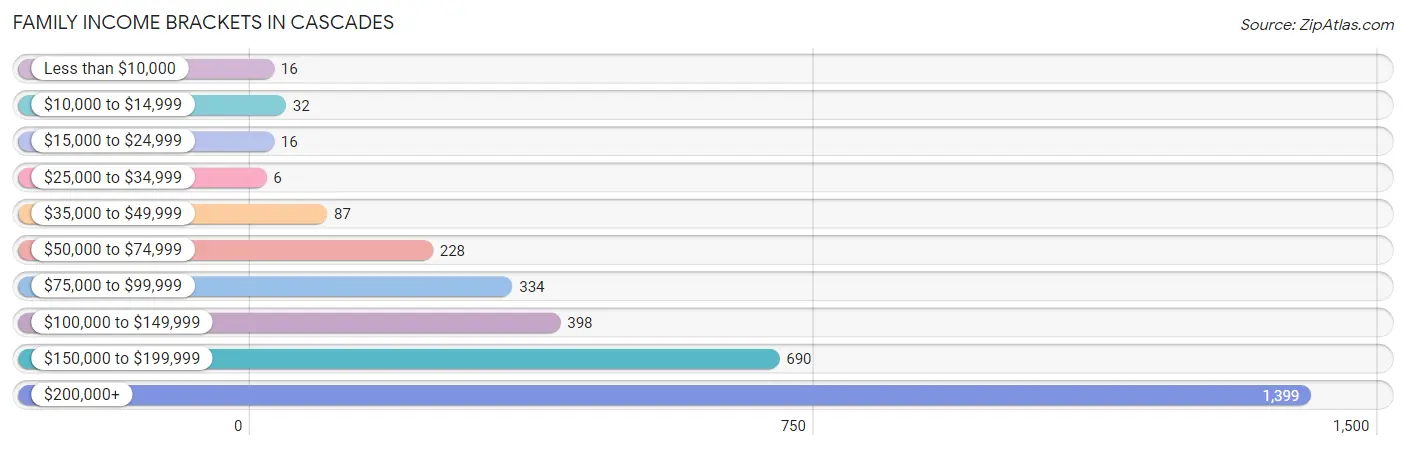
| Income Bracket | # Families | % Families |
| Less than $10,000 | 16 | 0.5% |
| $10,000 to $14,999 | 32 | 1.0% |
| $15,000 to $24,999 | 16 | 0.5% |
| $25,000 to $34,999 | 6 | 0.2% |
| $35,000 to $49,999 | 87 | 2.7% |
| $50,000 to $74,999 | 228 | 7.1% |
| $75,000 to $99,999 | 334 | 10.4% |
| $100,000 to $149,999 | 398 | 12.4% |
| $150,000 to $199,999 | 690 | 21.5% |
| $200,000+ | 1,399 | 43.6% |
Family Income by Famaliy Size in Cascades
6-person families (53 | 1.7%) account for the highest median family income in Cascades with $250,001 per family, while 2-person families (1,525 | 47.5%) have the highest median income of $86,712 per family member.
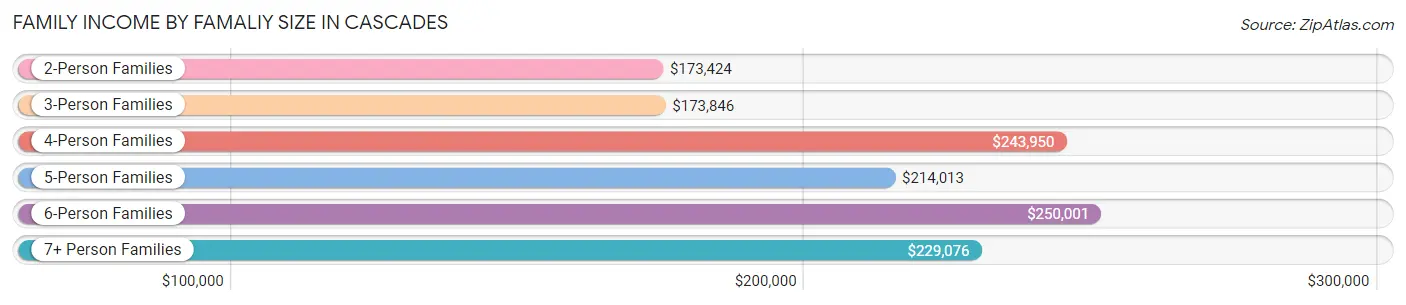
| Income Bracket | # Families | Median Income |
| 2-Person Families | 1,525 (47.5%) | $173,424 |
| 3-Person Families | 636 (19.8%) | $173,846 |
| 4-Person Families | 721 (22.5%) | $243,950 |
| 5-Person Families | 235 (7.3%) | $214,013 |
| 6-Person Families | 53 (1.7%) | $250,001 |
| 7+ Person Families | 39 (1.2%) | $229,076 |
| Total | 3,209 (100.0%) | $183,273 |
Family Income by Number of Earners in Cascades
The median family income in Cascades is $183,273, with families comprising 3+ earners (395) having the highest median family income of $229,076, while families with 1 earner (777) have the lowest median family income of $126,528, accounting for 12.3% and 24.2% of families, respectively.
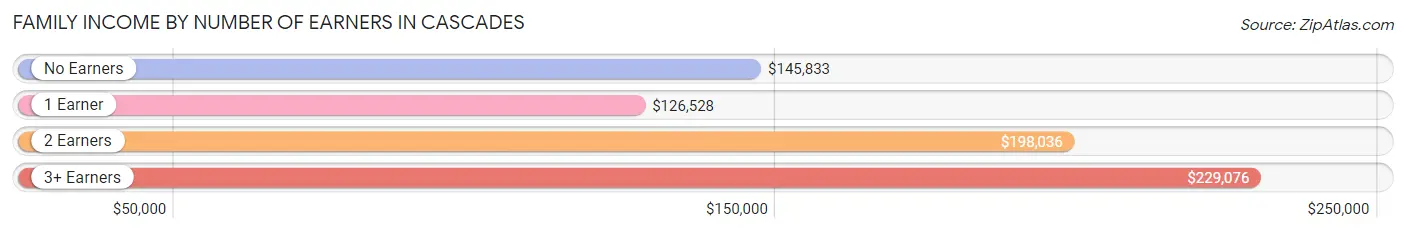
| Number of Earners | # Families | Median Income |
| No Earners | 132 (4.1%) | $145,833 |
| 1 Earner | 777 (24.2%) | $126,528 |
| 2 Earners | 1,905 (59.4%) | $198,036 |
| 3+ Earners | 395 (12.3%) | $229,076 |
| Total | 3,209 (100.0%) | $183,273 |
Household Income in Cascades
Household Income Brackets in Cascades
With 1,527 households falling in the category, the $200,000+ income range is the most frequent in Cascades, accounting for 33.0% of all households. In contrast, only 32 households (0.7%) fall into the $10,000 to $14,999 income bracket, making it the least populous group.
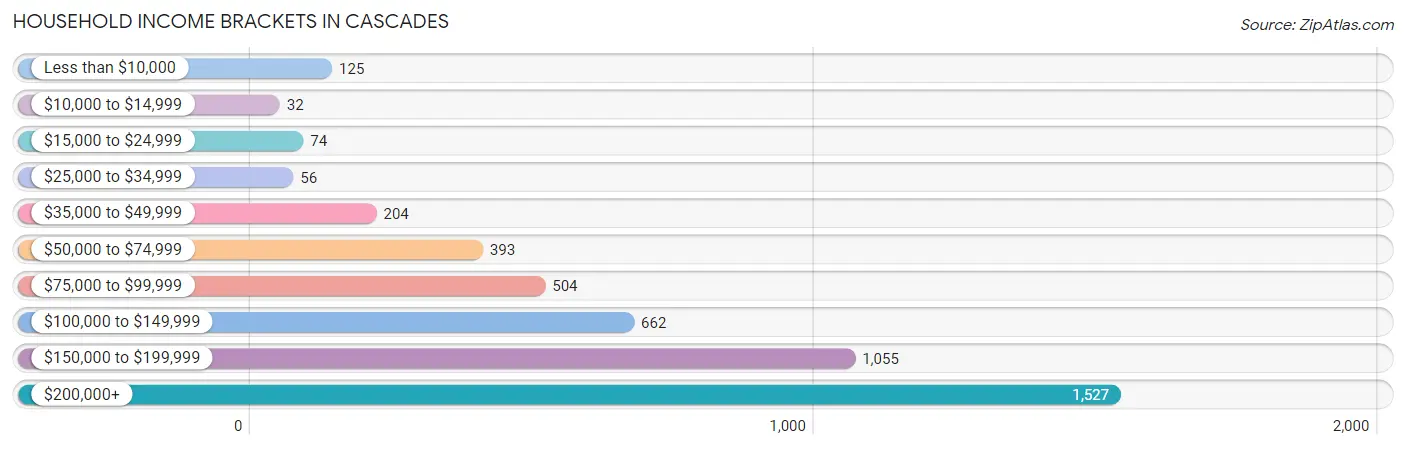
| Income Bracket | # Households | % Households |
| Less than $10,000 | 125 | 2.7% |
| $10,000 to $14,999 | 32 | 0.7% |
| $15,000 to $24,999 | 74 | 1.6% |
| $25,000 to $34,999 | 56 | 1.2% |
| $35,000 to $49,999 | 204 | 4.4% |
| $50,000 to $74,999 | 393 | 8.5% |
| $75,000 to $99,999 | 504 | 10.9% |
| $100,000 to $149,999 | 662 | 14.3% |
| $150,000 to $199,999 | 1,055 | 22.8% |
| $200,000+ | 1,527 | 33.0% |
Household Income by Householder Age in Cascades
The median household income in Cascades is $160,707, with the highest median household income of $184,300 found in the 45 to 64 years age bracket for the primary householder. A total of 2,007 households (43.4%) fall into this category. Meanwhile, the 15 to 24 years age bracket for the primary householder has the lowest median household income of $0, with 26 households (0.6%) in this group.
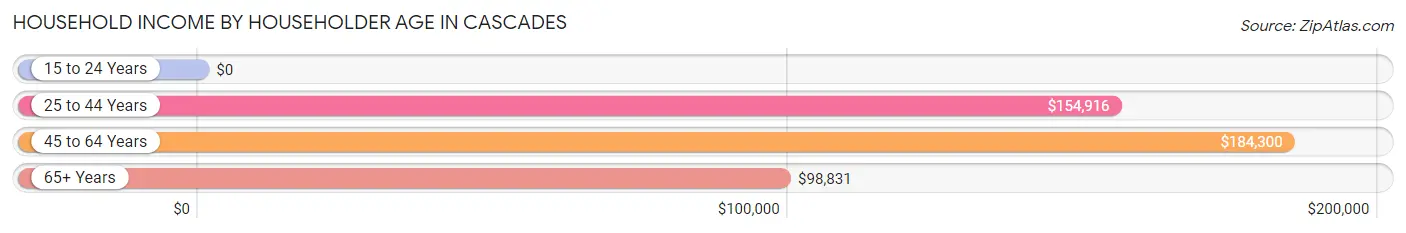
| Income Bracket | # Households | Median Income |
| 15 to 24 Years | 26 (0.6%) | $0 |
| 25 to 44 Years | 1,603 (34.6%) | $154,916 |
| 45 to 64 Years | 2,007 (43.4%) | $184,300 |
| 65+ Years | 991 (21.4%) | $98,831 |
| Total | 4,627 (100.0%) | $160,707 |
Poverty in Cascades
Income Below Poverty by Sex and Age in Cascades
With 2.1% poverty level for males and 2.7% for females among the residents of Cascades, 75 year old and over males and 75 year old and over females are the most vulnerable to poverty, with 21 males (7.8%) and 45 females (9.1%) in their respective age groups living below the poverty level.
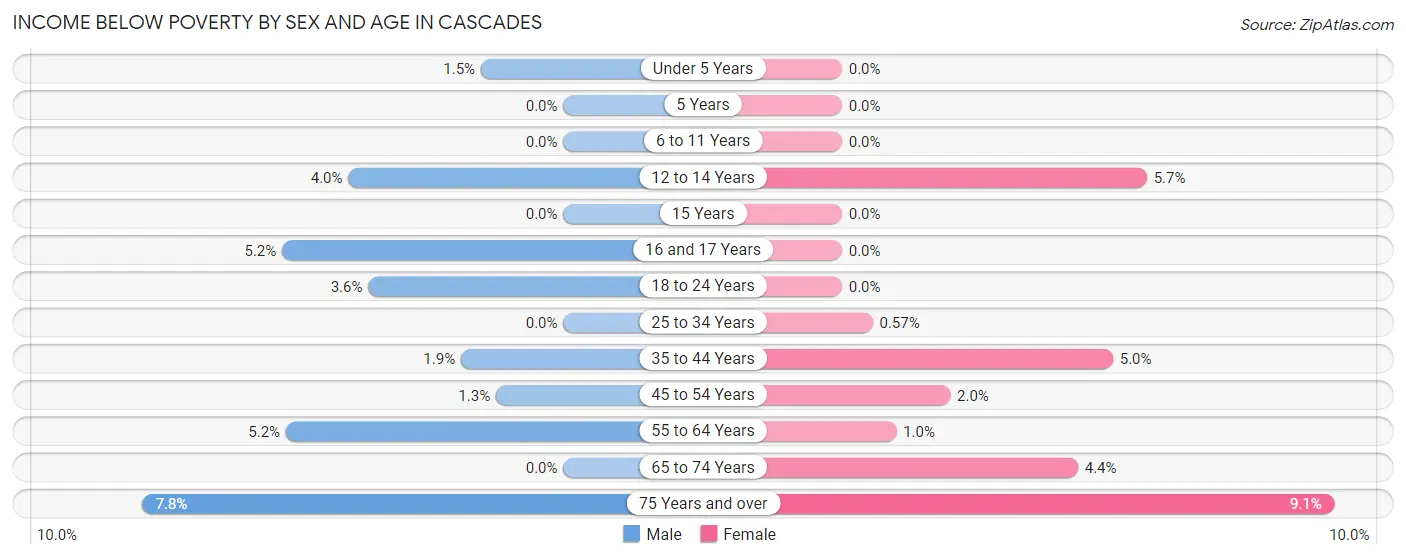
| Age Bracket | Male | Female |
| Under 5 Years | 11 (1.5%) | 0 (0.0%) |
| 5 Years | 0 (0.0%) | 0 (0.0%) |
| 6 to 11 Years | 0 (0.0%) | 0 (0.0%) |
| 12 to 14 Years | 11 (4.0%) | 12 (5.7%) |
| 15 Years | 0 (0.0%) | 0 (0.0%) |
| 16 and 17 Years | 7 (5.2%) | 0 (0.0%) |
| 18 to 24 Years | 18 (3.6%) | 0 (0.0%) |
| 25 to 34 Years | 0 (0.0%) | 4 (0.6%) |
| 35 to 44 Years | 16 (1.9%) | 51 (5.0%) |
| 45 to 54 Years | 12 (1.3%) | 20 (2.0%) |
| 55 to 64 Years | 38 (5.1%) | 9 (1.0%) |
| 65 to 74 Years | 0 (0.0%) | 21 (4.4%) |
| 75 Years and over | 21 (7.8%) | 45 (9.1%) |
| Total | 134 (2.1%) | 162 (2.7%) |
Income Above Poverty by Sex and Age in Cascades
According to the poverty statistics in Cascades, males aged 5 years and females aged under 5 years are the age groups that are most secure financially, with 100.0% of males and 100.0% of females in these age groups living above the poverty line.
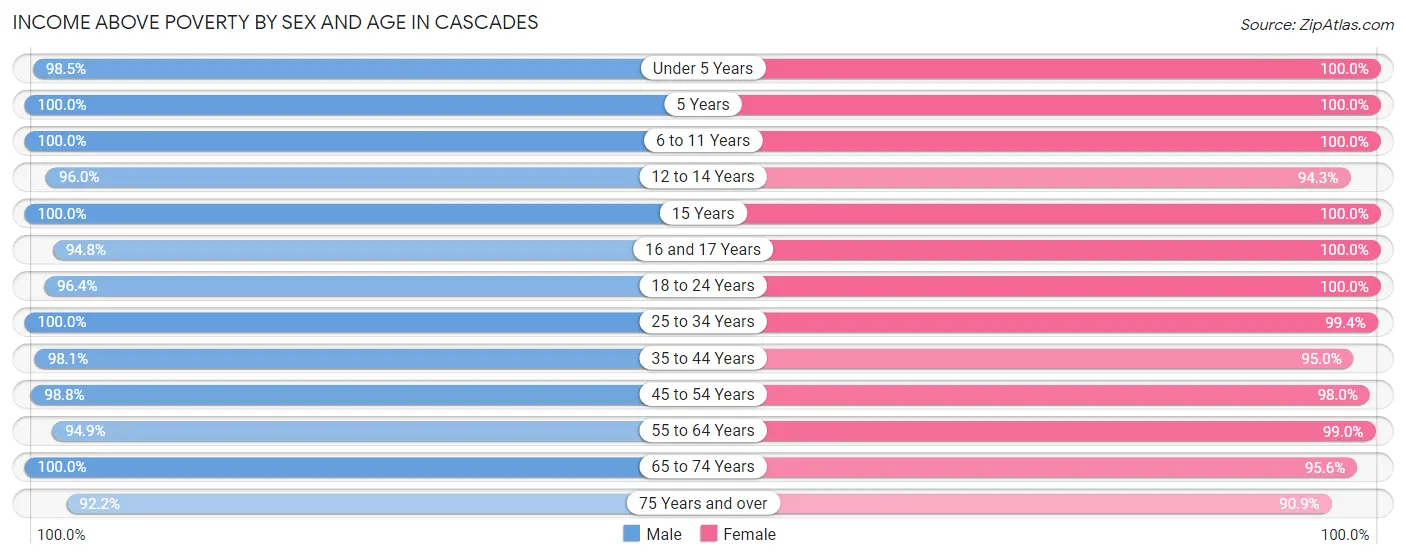
| Age Bracket | Male | Female |
| Under 5 Years | 709 (98.5%) | 331 (100.0%) |
| 5 Years | 159 (100.0%) | 61 (100.0%) |
| 6 to 11 Years | 401 (100.0%) | 269 (100.0%) |
| 12 to 14 Years | 265 (96.0%) | 200 (94.3%) |
| 15 Years | 134 (100.0%) | 58 (100.0%) |
| 16 and 17 Years | 127 (94.8%) | 90 (100.0%) |
| 18 to 24 Years | 479 (96.4%) | 493 (100.0%) |
| 25 to 34 Years | 771 (100.0%) | 703 (99.4%) |
| 35 to 44 Years | 826 (98.1%) | 962 (95.0%) |
| 45 to 54 Years | 945 (98.8%) | 973 (98.0%) |
| 55 to 64 Years | 700 (94.9%) | 886 (99.0%) |
| 65 to 74 Years | 356 (100.0%) | 459 (95.6%) |
| 75 Years and over | 248 (92.2%) | 448 (90.9%) |
| Total | 6,120 (97.9%) | 5,933 (97.3%) |
Income Below Poverty Among Married-Couple Families in Cascades
The poverty statistics for married-couple families in Cascades show that 1.5% or 36 of the total 2,486 families live below the poverty line. Families with no children have the highest poverty rate of 1.6%, comprising of 21 families. On the other hand, families with 3 or 4 children have the lowest poverty rate of 0.0%, which includes 0 families.
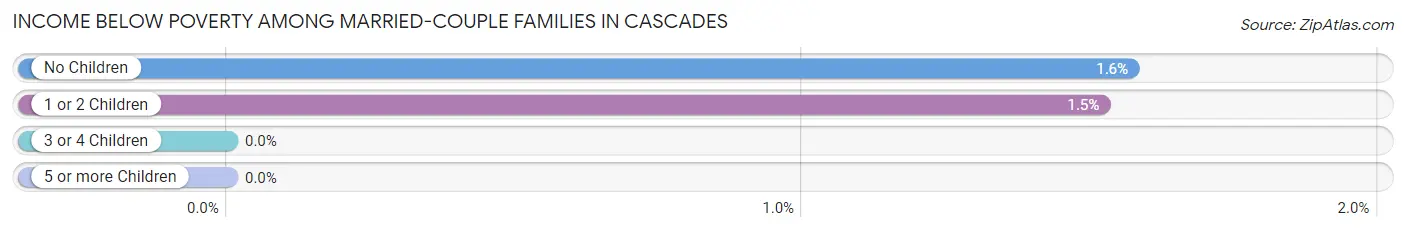
| Children | Above Poverty | Below Poverty |
| No Children | 1,318 (98.4%) | 21 (1.6%) |
| 1 or 2 Children | 969 (98.5%) | 15 (1.5%) |
| 3 or 4 Children | 163 (100.0%) | 0 (0.0%) |
| 5 or more Children | 0 (0.0%) | 0 (0.0%) |
| Total | 2,450 (98.6%) | 36 (1.5%) |
Income Below Poverty Among Single-Parent Households in Cascades
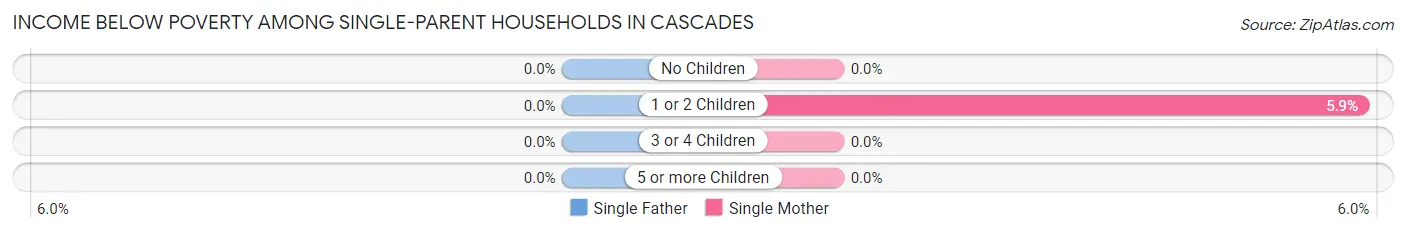
| Children | Single Father | Single Mother |
| No Children | 0 (0.0%) | 0 (0.0%) |
| 1 or 2 Children | 0 (0.0%) | 12 (5.9%) |
| 3 or 4 Children | 0 (0.0%) | 0 (0.0%) |
| 5 or more Children | 0 (0.0%) | 0 (0.0%) |
| Total | 0 (0.0%) | 12 (1.9%) |
Income Below Poverty Among Married-Couple vs Single-Parent Households in Cascades
The poverty data for Cascades shows that 36 of the married-couple family households (1.5%) and 12 of the single-parent households (1.7%) are living below the poverty level. Within the married-couple family households, those with no children have the highest poverty rate, with 21 households (1.6%) falling below the poverty line. Among the single-parent households, those with 1 or 2 children have the highest poverty rate, with 12 household (5.0%) living below poverty.
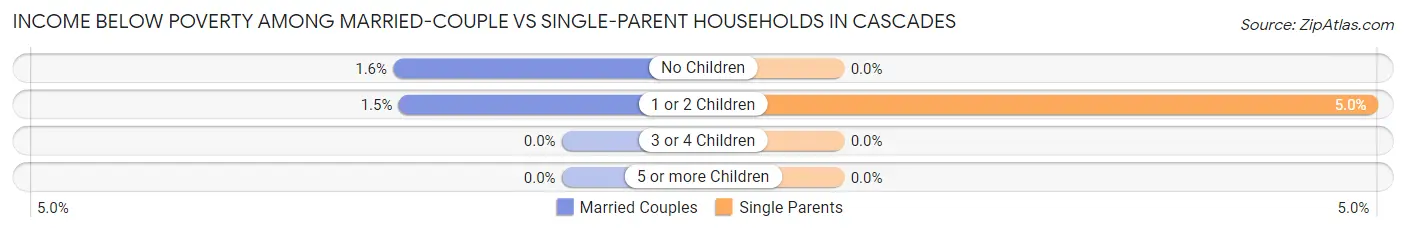
| Children | Married-Couple Families | Single-Parent Households |
| No Children | 21 (1.6%) | 0 (0.0%) |
| 1 or 2 Children | 15 (1.5%) | 12 (5.0%) |
| 3 or 4 Children | 0 (0.0%) | 0 (0.0%) |
| 5 or more Children | 0 (0.0%) | 0 (0.0%) |
| Total | 36 (1.5%) | 12 (1.7%) |
Race in Cascades
The most populous races in Cascades are White / Caucasian (7,365 | 58.7%), Asian (2,407 | 19.2%), and Hispanic or Latino (1,440 | 11.5%).
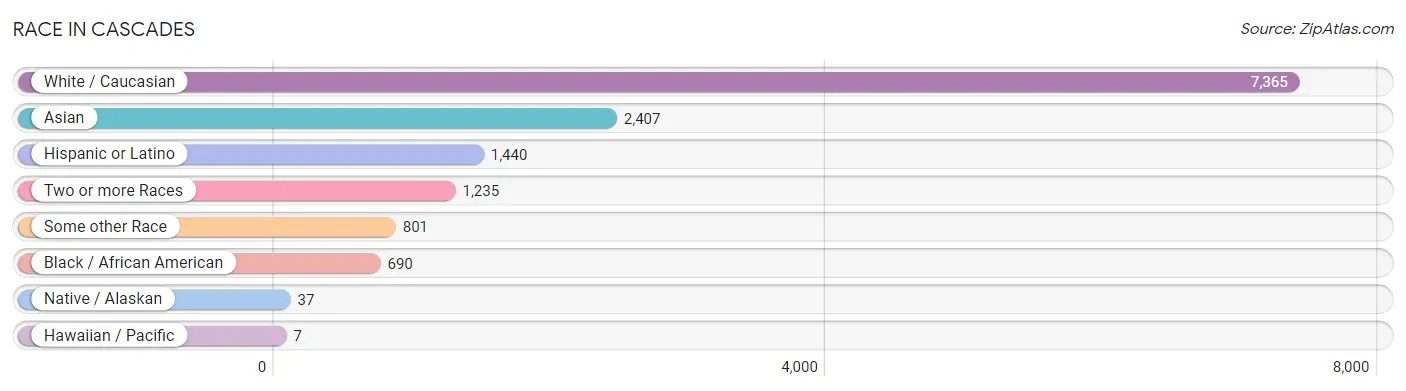
| Race | # Population | % Population |
| Asian | 2,407 | 19.2% |
| Black / African American | 690 | 5.5% |
| Hawaiian / Pacific | 7 | 0.1% |
| Hispanic or Latino | 1,440 | 11.5% |
| Native / Alaskan | 37 | 0.3% |
| White / Caucasian | 7,365 | 58.7% |
| Two or more Races | 1,235 | 9.9% |
| Some other Race | 801 | 6.4% |
| Total | 12,542 | 100.0% |
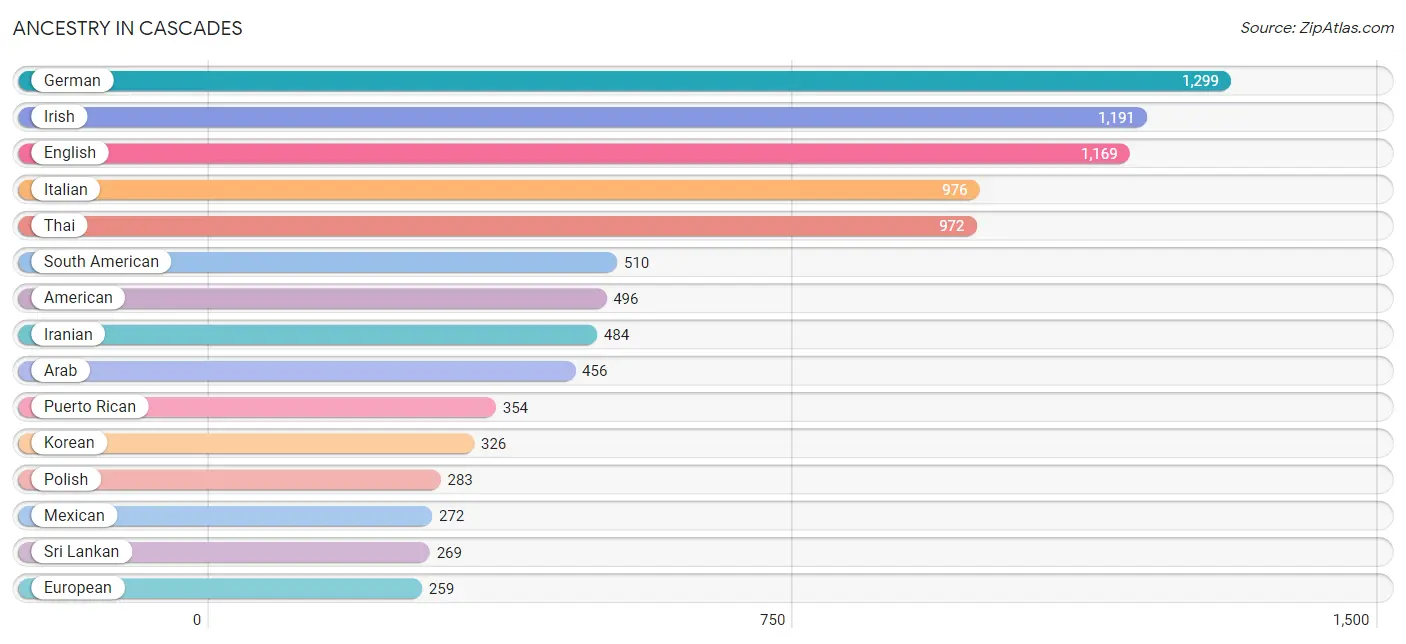
Ancestry in Cascades
The most populous ancestries reported in Cascades are German (1,299 | 10.4%), Irish (1,191 | 9.5%), English (1,169 | 9.3%), Italian (976 | 7.8%), and Thai (972 | 7.7%), together accounting for 44.7% of all Cascades residents.
| Ancestry | # Population | % Population |
| Afghan | 12 | 0.1% |
| African | 13 | 0.1% |
| American | 496 | 4.0% |
| Arab | 456 | 3.6% |
| Austrian | 67 | 0.5% |
| Bhutanese | 7 | 0.1% |
| Bolivian | 175 | 1.4% |
| British | 30 | 0.2% |
| Bulgarian | 25 | 0.2% |
| Burmese | 179 | 1.4% |
| Canadian | 17 | 0.1% |
| Central American | 122 | 1.0% |
| Central American Indian | 32 | 0.3% |
| Cherokee | 8 | 0.1% |
| Choctaw | 7 | 0.1% |
| Colombian | 71 | 0.6% |
| Cuban | 67 | 0.5% |
| Czech | 23 | 0.2% |
| Danish | 30 | 0.2% |
| Dominican | 85 | 0.7% |
| Dutch | 109 | 0.9% |
| Eastern European | 24 | 0.2% |
| Ecuadorian | 196 | 1.6% |
| Egyptian | 95 | 0.8% |
| English | 1,169 | 9.3% |
| Ethiopian | 60 | 0.5% |
| European | 259 | 2.1% |
| Fijian | 7 | 0.1% |
| Filipino | 67 | 0.5% |
| Finnish | 21 | 0.2% |
| French | 240 | 1.9% |
| French Canadian | 38 | 0.3% |
| German | 1,299 | 10.4% |
| Ghanaian | 76 | 0.6% |
| Greek | 153 | 1.2% |
| Guamanian / Chamorro | 93 | 0.7% |
| Guatemalan | 33 | 0.3% |
| Honduran | 21 | 0.2% |
| Hungarian | 58 | 0.5% |
| Indian (Asian) | 232 | 1.8% |
| Iranian | 484 | 3.9% |
| Iraqi | 77 | 0.6% |
| Irish | 1,191 | 9.5% |
| Italian | 976 | 7.8% |
| Jamaican | 23 | 0.2% |
| Jordanian | 36 | 0.3% |
| Korean | 326 | 2.6% |
| Lebanese | 13 | 0.1% |
| Lithuanian | 9 | 0.1% |
| Malaysian | 69 | 0.5% |
| Mexican | 272 | 2.2% |
| Mexican American Indian | 13 | 0.1% |
| Moroccan | 181 | 1.4% |
| Native Hawaiian | 66 | 0.5% |
| Nicaraguan | 9 | 0.1% |
| Northern European | 36 | 0.3% |
| Norwegian | 109 | 0.9% |
| Pakistani | 51 | 0.4% |
| Peruvian | 68 | 0.5% |
| Polish | 283 | 2.3% |
| Portuguese | 3 | 0.0% |
| Puerto Rican | 354 | 2.8% |
| Romanian | 79 | 0.6% |
| Russian | 29 | 0.2% |
| Salvadoran | 59 | 0.5% |
| Scotch-Irish | 159 | 1.3% |
| Scottish | 153 | 1.2% |
| Sioux | 10 | 0.1% |
| Slovak | 11 | 0.1% |
| South American | 510 | 4.1% |
| South American Indian | 12 | 0.1% |
| Spanish | 8 | 0.1% |
| Sri Lankan | 269 | 2.1% |
| Subsaharan African | 167 | 1.3% |
| Swedish | 75 | 0.6% |
| Swiss | 21 | 0.2% |
| Thai | 972 | 7.7% |
| Turkish | 53 | 0.4% |
| Ukrainian | 41 | 0.3% |
| Welsh | 91 | 0.7% | View All 80 Rows |
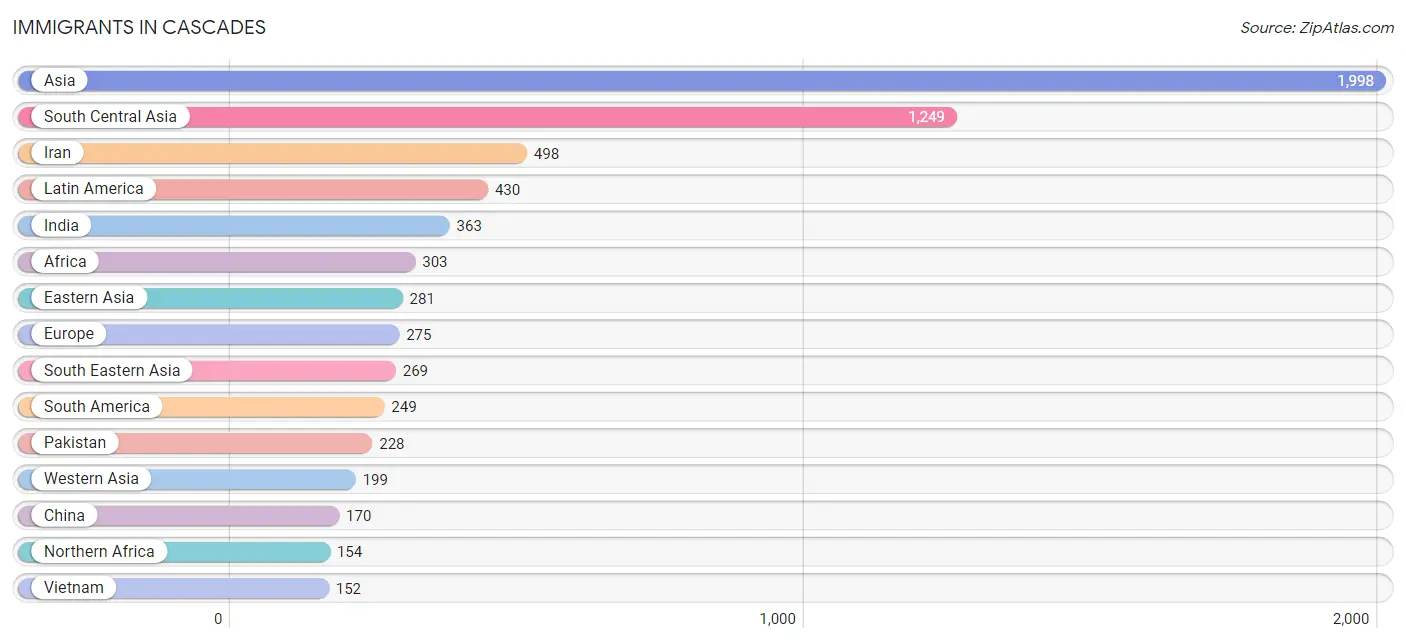
Immigrants in Cascades
The most numerous immigrant groups reported in Cascades came from Asia (1,998 | 15.9%), South Central Asia (1,249 | 10.0%), Iran (498 | 4.0%), Latin America (430 | 3.4%), and India (363 | 2.9%), together accounting for 36.2% of all Cascades residents.
| Immigration Origin | # Population | % Population |
| Afghanistan | 9 | 0.1% |
| Africa | 303 | 2.4% |
| Argentina | 29 | 0.2% |
| Asia | 1,998 | 15.9% |
| Austria | 40 | 0.3% |
| Bangladesh | 111 | 0.9% |
| Bolivia | 138 | 1.1% |
| Bulgaria | 25 | 0.2% |
| Canada | 7 | 0.1% |
| Caribbean | 77 | 0.6% |
| Central America | 104 | 0.8% |
| China | 170 | 1.4% |
| Colombia | 45 | 0.4% |
| Cuba | 25 | 0.2% |
| Dominican Republic | 52 | 0.4% |
| Eastern Africa | 66 | 0.5% |
| Eastern Asia | 281 | 2.2% |
| Eastern Europe | 69 | 0.5% |
| Egypt | 57 | 0.4% |
| El Salvador | 14 | 0.1% |
| Ethiopia | 36 | 0.3% |
| Europe | 275 | 2.2% |
| France | 15 | 0.1% |
| Germany | 55 | 0.4% |
| Ghana | 13 | 0.1% |
| Greece | 56 | 0.4% |
| Guatemala | 33 | 0.3% |
| Honduras | 34 | 0.3% |
| India | 363 | 2.9% |
| Iran | 498 | 4.0% |
| Iraq | 55 | 0.4% |
| Israel | 20 | 0.2% |
| Japan | 7 | 0.1% |
| Jordan | 10 | 0.1% |
| Korea | 104 | 0.8% |
| Kuwait | 5 | 0.0% |
| Laos | 18 | 0.1% |
| Latin America | 430 | 3.4% |
| Lebanon | 5 | 0.0% |
| Liberia | 14 | 0.1% |
| Mexico | 14 | 0.1% |
| Morocco | 85 | 0.7% |
| Nepal | 40 | 0.3% |
| Nicaragua | 9 | 0.1% |
| Northern Africa | 154 | 1.2% |
| Northern Europe | 40 | 0.3% |
| Pakistan | 228 | 1.8% |
| Peru | 37 | 0.3% |
| Philippines | 99 | 0.8% |
| Poland | 6 | 0.1% |
| Romania | 7 | 0.1% |
| Russia | 20 | 0.2% |
| Saudi Arabia | 41 | 0.3% |
| Scotland | 22 | 0.2% |
| Senegal | 56 | 0.4% |
| Somalia | 30 | 0.2% |
| South America | 249 | 2.0% |
| South Central Asia | 1,249 | 10.0% |
| South Eastern Asia | 269 | 2.1% |
| Southern Europe | 56 | 0.4% |
| Syria | 23 | 0.2% |
| Taiwan | 28 | 0.2% |
| Turkey | 40 | 0.3% |
| Vietnam | 152 | 1.2% |
| Western Africa | 83 | 0.7% |
| Western Asia | 199 | 1.6% |
| Western Europe | 110 | 0.9% | View All 67 Rows |
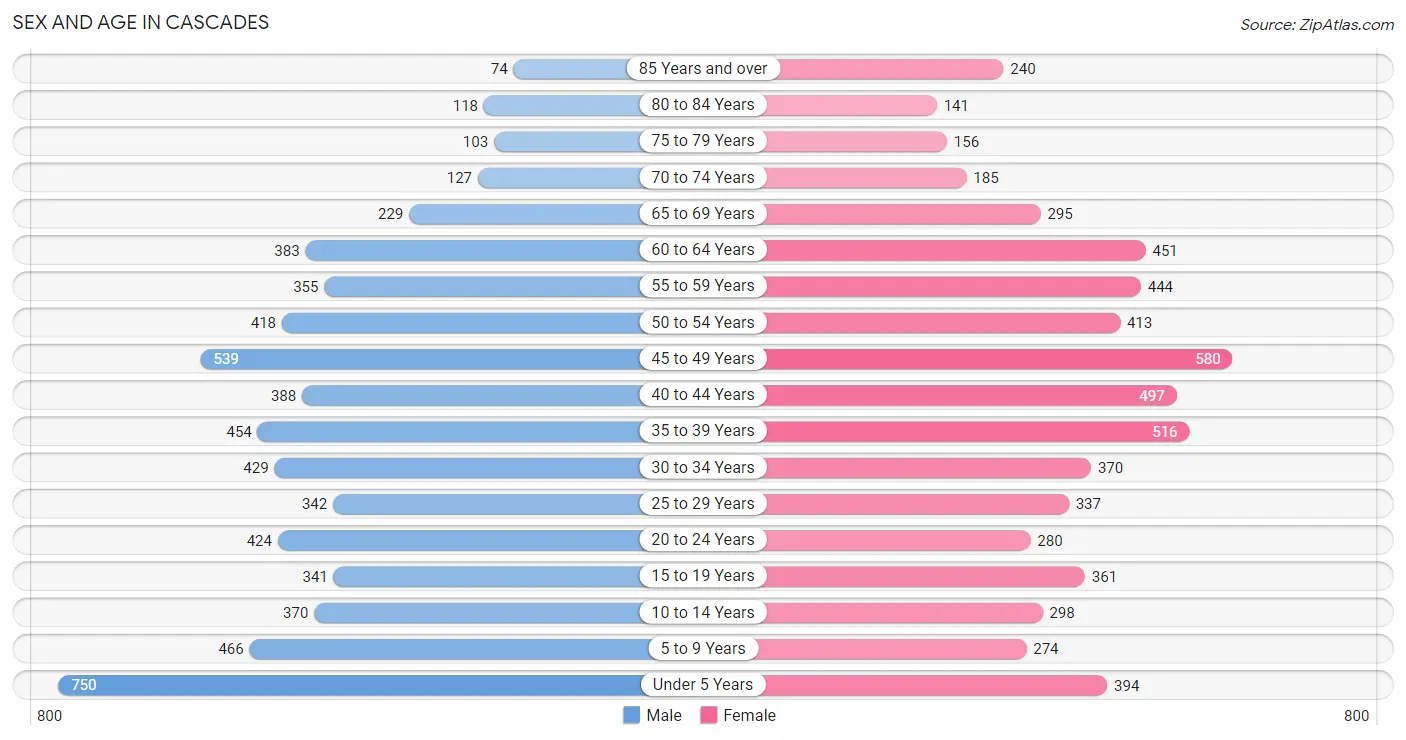
Sex and Age in Cascades
Sex and Age in Cascades
The most populous age groups in Cascades are Under 5 Years (750 | 11.9%) for men and 45 to 49 Years (580 | 9.3%) for women.
| Age Bracket | Male | Female |
| Under 5 Years | 750 (11.9%) | 394 (6.3%) |
| 5 to 9 Years | 466 (7.4%) | 274 (4.4%) |
| 10 to 14 Years | 370 (5.9%) | 298 (4.8%) |
| 15 to 19 Years | 341 (5.4%) | 361 (5.8%) |
| 20 to 24 Years | 424 (6.7%) | 280 (4.5%) |
| 25 to 29 Years | 342 (5.4%) | 337 (5.4%) |
| 30 to 34 Years | 429 (6.8%) | 370 (5.9%) |
| 35 to 39 Years | 454 (7.2%) | 516 (8.3%) |
| 40 to 44 Years | 388 (6.1%) | 497 (8.0%) |
| 45 to 49 Years | 539 (8.5%) | 580 (9.3%) |
| 50 to 54 Years | 418 (6.6%) | 413 (6.6%) |
| 55 to 59 Years | 355 (5.6%) | 444 (7.1%) |
| 60 to 64 Years | 383 (6.1%) | 451 (7.2%) |
| 65 to 69 Years | 229 (3.6%) | 295 (4.7%) |
| 70 to 74 Years | 127 (2.0%) | 185 (3.0%) |
| 75 to 79 Years | 103 (1.6%) | 156 (2.5%) |
| 80 to 84 Years | 118 (1.9%) | 141 (2.3%) |
| 85 Years and over | 74 (1.2%) | 240 (3.8%) |
| Total | 6,310 (100.0%) | 6,232 (100.0%) |
Families and Households in Cascades
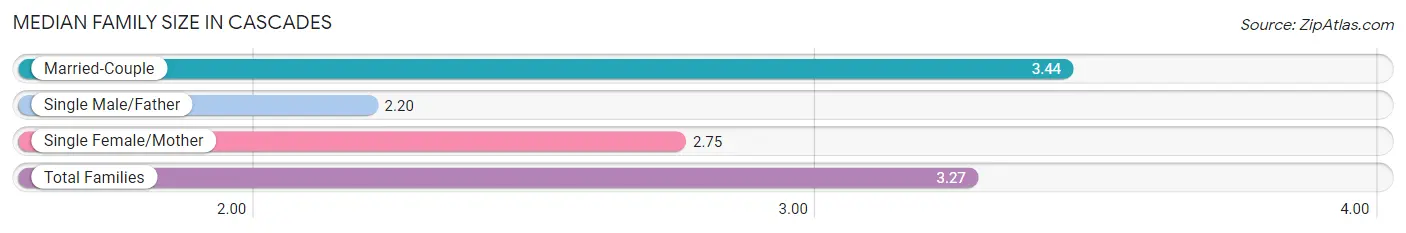
Median Family Size in Cascades
The median family size in Cascades is 3.27 persons per family, with married-couple families (2,486 | 77.5%) accounting for the largest median family size of 3.44 persons per family. On the other hand, single male/father families (82 | 2.6%) represent the smallest median family size with 2.20 persons per family.
| Family Type | # Families | Family Size |
| Married-Couple | 2,486 (77.5%) | 3.44 |
| Single Male/Father | 82 (2.6%) | 2.20 |
| Single Female/Mother | 641 (20.0%) | 2.75 |
| Total Families | 3,209 (100.0%) | 3.27 |
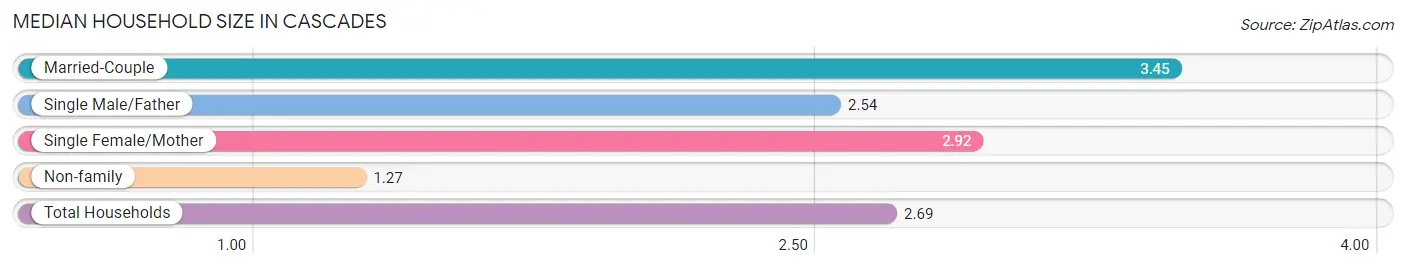
Median Household Size in Cascades
The median household size in Cascades is 2.69 persons per household, with married-couple households (2,486 | 53.7%) accounting for the largest median household size of 3.45 persons per household. non-family households (1,418 | 30.6%) represent the smallest median household size with 1.27 persons per household.
| Household Type | # Households | Household Size |
| Married-Couple | 2,486 (53.7%) | 3.45 |
| Single Male/Father | 82 (1.8%) | 2.54 |
| Single Female/Mother | 641 (13.9%) | 2.92 |
| Non-family | 1,418 (30.6%) | 1.27 |
| Total Households | 4,627 (100.0%) | 2.69 |
Household Size by Marriage Status in Cascades
Out of a total of 4,627 households in Cascades, 3,209 (69.4%) are family households, while 1,418 (30.6%) are nonfamily households. The most numerous type of family households are 2-person households, comprising 1,464, and the most common type of nonfamily households are 1-person households, comprising 1,140.
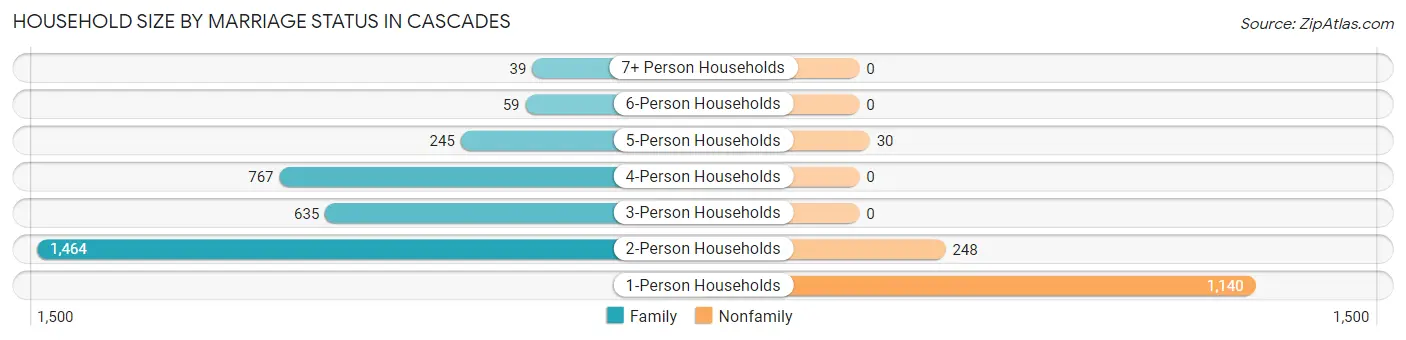
| Household Size | Family Households | Nonfamily Households |
| 1-Person Households | - | 1,140 (24.6%) |
| 2-Person Households | 1,464 (31.6%) | 248 (5.4%) |
| 3-Person Households | 635 (13.7%) | 0 (0.0%) |
| 4-Person Households | 767 (16.6%) | 0 (0.0%) |
| 5-Person Households | 245 (5.3%) | 30 (0.6%) |
| 6-Person Households | 59 (1.3%) | 0 (0.0%) |
| 7+ Person Households | 39 (0.8%) | 0 (0.0%) |
| Total | 3,209 (69.4%) | 1,418 (30.6%) |
Female Fertility in Cascades
Fertility by Age in Cascades
Average fertility rate in Cascades is 33.0 births per 1,000 women. Women in the age bracket of 35 to 50 years have the highest fertility rate with 40.0 births per 1,000 women. Women in the age bracket of 35 to 50 years acount for 67.0% of all women with births.
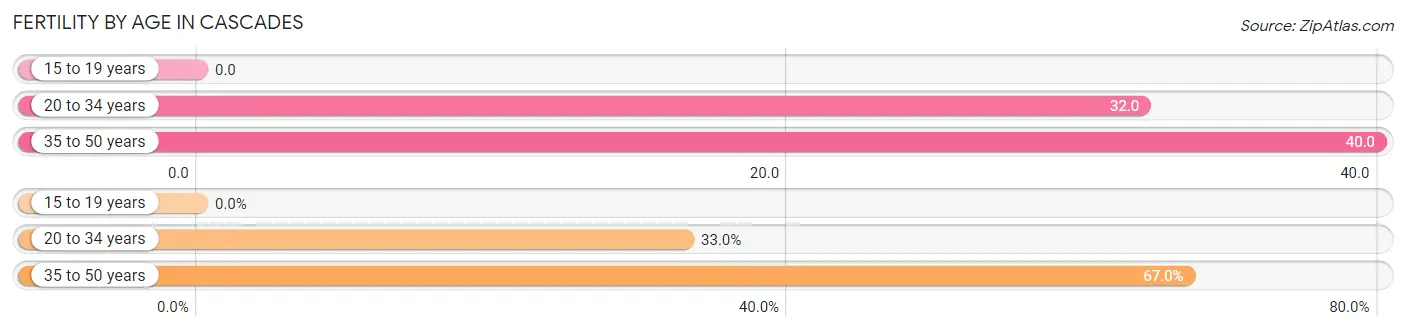
| Age Bracket | Women with Births | Births / 1,000 Women |
| 15 to 19 years | 0 (0.0%) | 0.0 |
| 20 to 34 years | 32 (33.0%) | 32.0 |
| 35 to 50 years | 65 (67.0%) | 40.0 |
| Total | 97 (100.0%) | 33.0 |
Fertility by Age by Marriage Status in Cascades
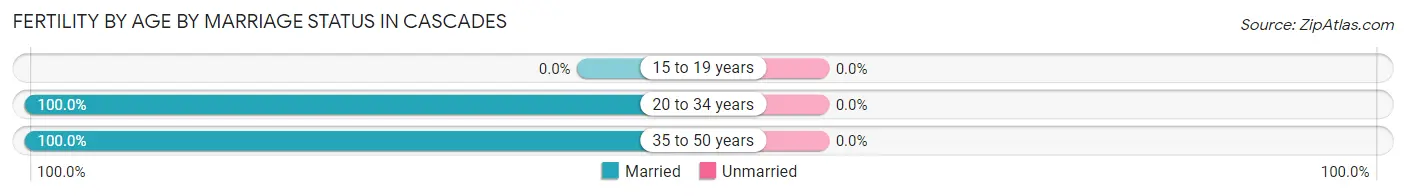
| Age Bracket | Married | Unmarried |
| 15 to 19 years | 0 (0.0%) | 0 (0.0%) |
| 20 to 34 years | 32 (100.0%) | 0 (0.0%) |
| 35 to 50 years | 65 (100.0%) | 0 (0.0%) |
| Total | 97 (100.0%) | 0 (0.0%) |
Fertility by Education in Cascades
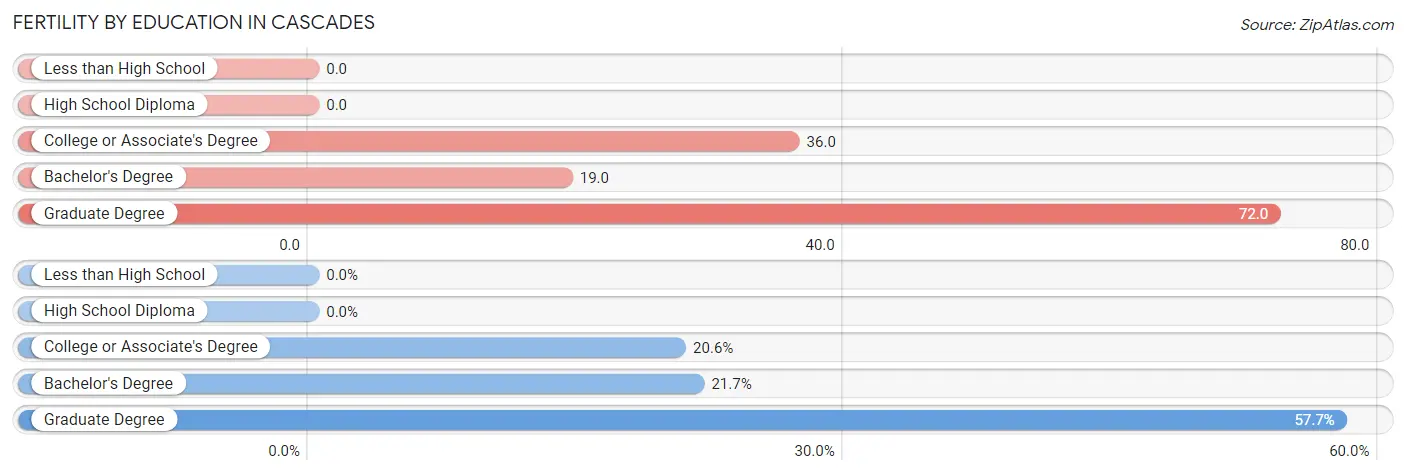
| Educational Attainment | Women with Births | Births / 1,000 Women |
| Less than High School | 0 (0.0%) | 0.0 |
| High School Diploma | 0 (0.0%) | 0.0 |
| College or Associate's Degree | 20 (20.6%) | 36.0 |
| Bachelor's Degree | 21 (21.6%) | 19.0 |
| Graduate Degree | 56 (57.7%) | 72.0 |
| Total | 97 (100.0%) | 33.0 |
Fertility by Education by Marriage Status in Cascades
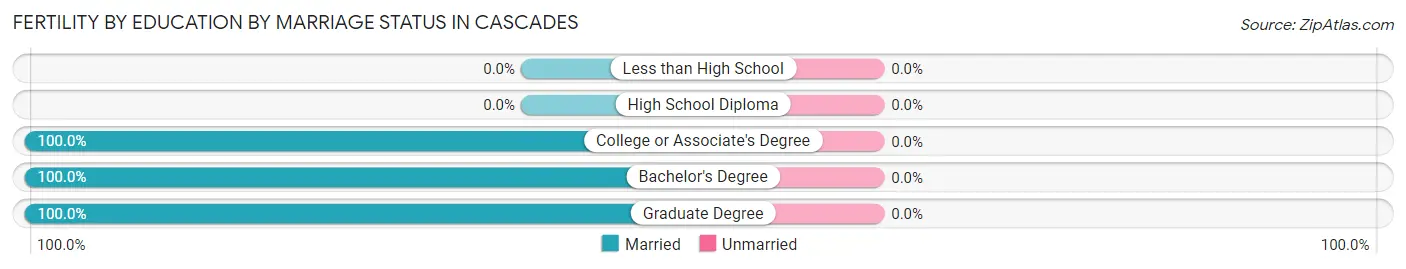
| Educational Attainment | Married | Unmarried |
| Less than High School | 0 (0.0%) | 0 (0.0%) |
| High School Diploma | 0 (0.0%) | 0 (0.0%) |
| College or Associate's Degree | 20 (100.0%) | 0 (0.0%) |
| Bachelor's Degree | 21 (100.0%) | 0 (0.0%) |
| Graduate Degree | 56 (100.0%) | 0 (0.0%) |
| Total | 97 (100.0%) | 0 (0.0%) |
Employment Characteristics in Cascades
Employment by Class of Employer in Cascades
Among the 6,956 employed individuals in Cascades, private company employees (4,410 | 63.4%), federal government employees (796 | 11.4%), and not-for-profit organizations (765 | 11.0%) make up the most common classes of employment.
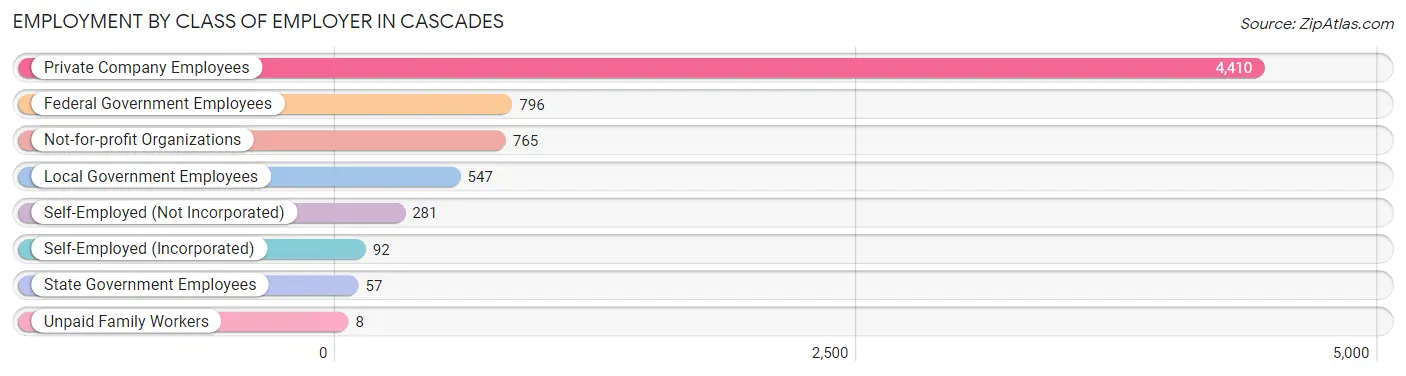
| Employer Class | # Employees | % Employees |
| Private Company Employees | 4,410 | 63.4% |
| Self-Employed (Incorporated) | 92 | 1.3% |
| Self-Employed (Not Incorporated) | 281 | 4.0% |
| Not-for-profit Organizations | 765 | 11.0% |
| Local Government Employees | 547 | 7.9% |
| State Government Employees | 57 | 0.8% |
| Federal Government Employees | 796 | 11.4% |
| Unpaid Family Workers | 8 | 0.1% |
| Total | 6,956 | 100.0% |
Employment Status by Age in Cascades
According to the labor force statistics for Cascades, out of the total population over 16 years of age (9,798), 74.7% or 7,319 individuals are in the labor force, with 3.8% or 278 of them unemployed. The age group with the highest labor force participation rate is 25 to 29 years, with 94.1% or 639 individuals in the labor force. Within the labor force, the 20 to 24 years age range has the highest percentage of unemployed individuals, with 16.9% or 107 of them being unemployed.
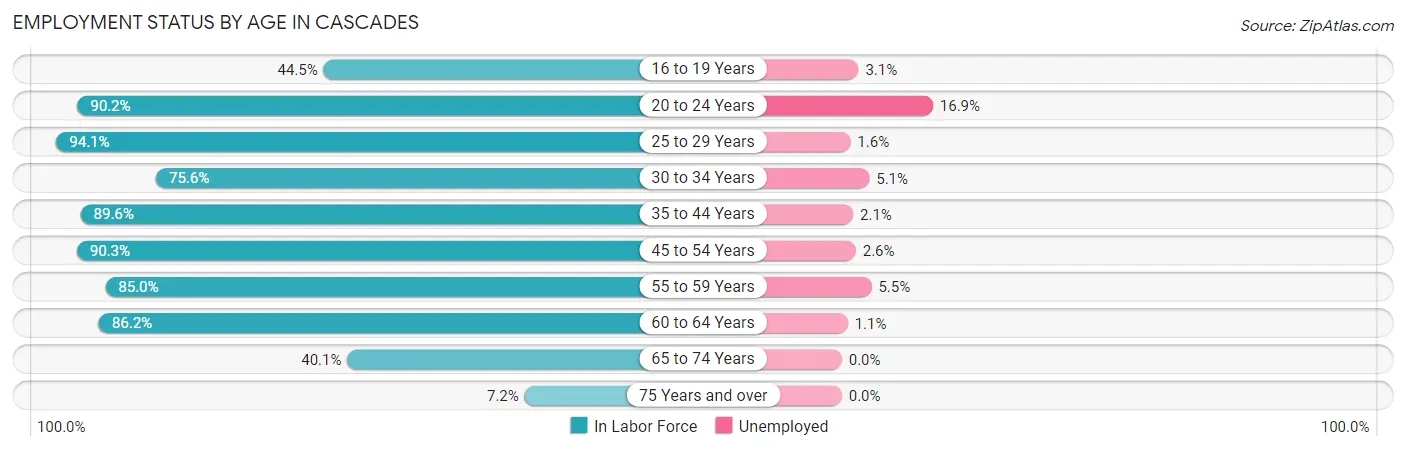
| Age Bracket | In Labor Force | Unemployed |
| 16 to 19 Years | 227 (44.5%) | 7 (3.1%) |
| 20 to 24 Years | 635 (90.2%) | 107 (16.9%) |
| 25 to 29 Years | 639 (94.1%) | 10 (1.6%) |
| 30 to 34 Years | 604 (75.6%) | 31 (5.1%) |
| 35 to 44 Years | 1,662 (89.6%) | 35 (2.1%) |
| 45 to 54 Years | 1,761 (90.3%) | 46 (2.6%) |
| 55 to 59 Years | 679 (85.0%) | 37 (5.5%) |
| 60 to 64 Years | 719 (86.2%) | 8 (1.1%) |
| 65 to 74 Years | 335 (40.1%) | 0 (0.0%) |
| 75 Years and over | 60 (7.2%) | 0 (0.0%) |
| Total | 7,319 (74.7%) | 278 (3.8%) |
Employment Status by Educational Attainment in Cascades
According to labor force statistics for Cascades, 87.7% of individuals (6,065) out of the total population between 25 and 64 years of age (6,916) are in the labor force, with 2.8% or 170 of them being unemployed. The group with the highest labor force participation rate are those with the educational attainment of bachelor's degree or higher, with 91.8% or 4,473 individuals in the labor force. Within the labor force, individuals with college / associate degree education have the highest percentage of unemployment, with 5.9% or 66 of them being unemployed.
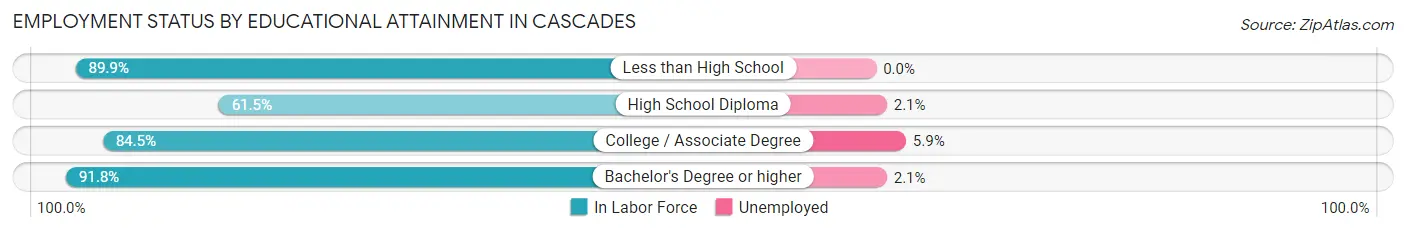
| Educational Attainment | In Labor Force | Unemployed |
| Less than High School | 98 (89.9%) | 0 (0.0%) |
| High School Diploma | 377 (61.5%) | 13 (2.1%) |
| College / Associate Degree | 1,116 (84.5%) | 78 (5.9%) |
| Bachelor's Degree or higher | 4,473 (91.8%) | 102 (2.1%) |
| Total | 6,065 (87.7%) | 194 (2.8%) |
Employment Occupations by Sex in Cascades
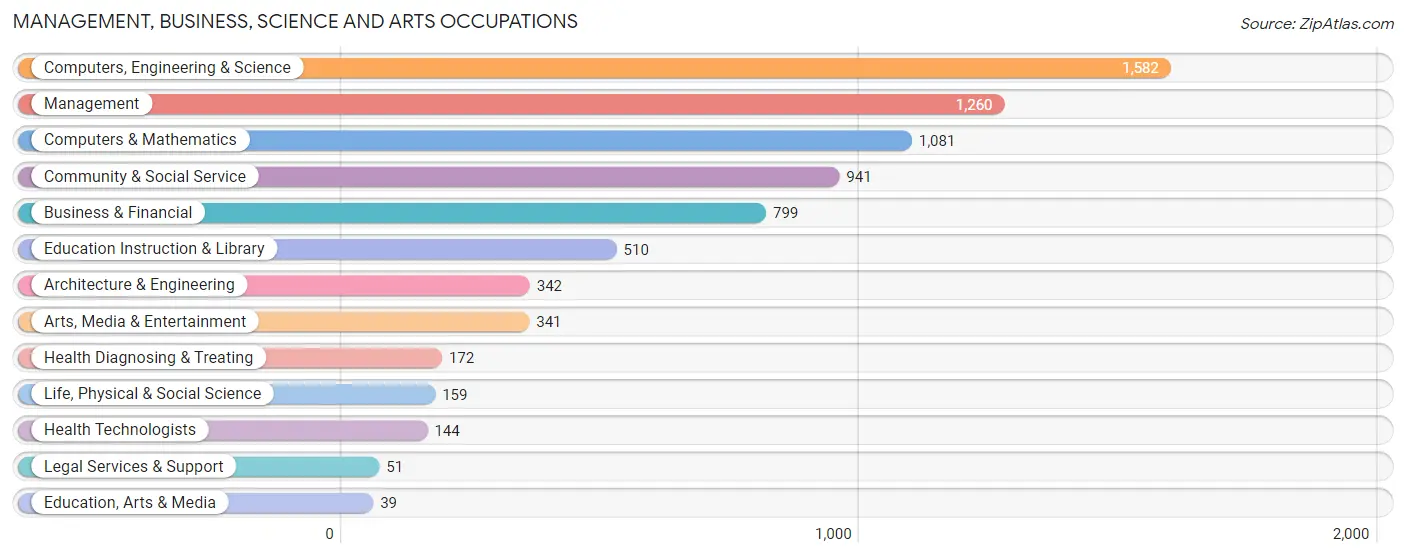
Management, Business, Science and Arts Occupations
The most common Management, Business, Science and Arts occupations in Cascades are Computers, Engineering & Science (1,582 | 22.5%), Management (1,260 | 17.9%), Computers & Mathematics (1,081 | 15.4%), Community & Social Service (941 | 13.4%), and Business & Financial (799 | 11.4%).
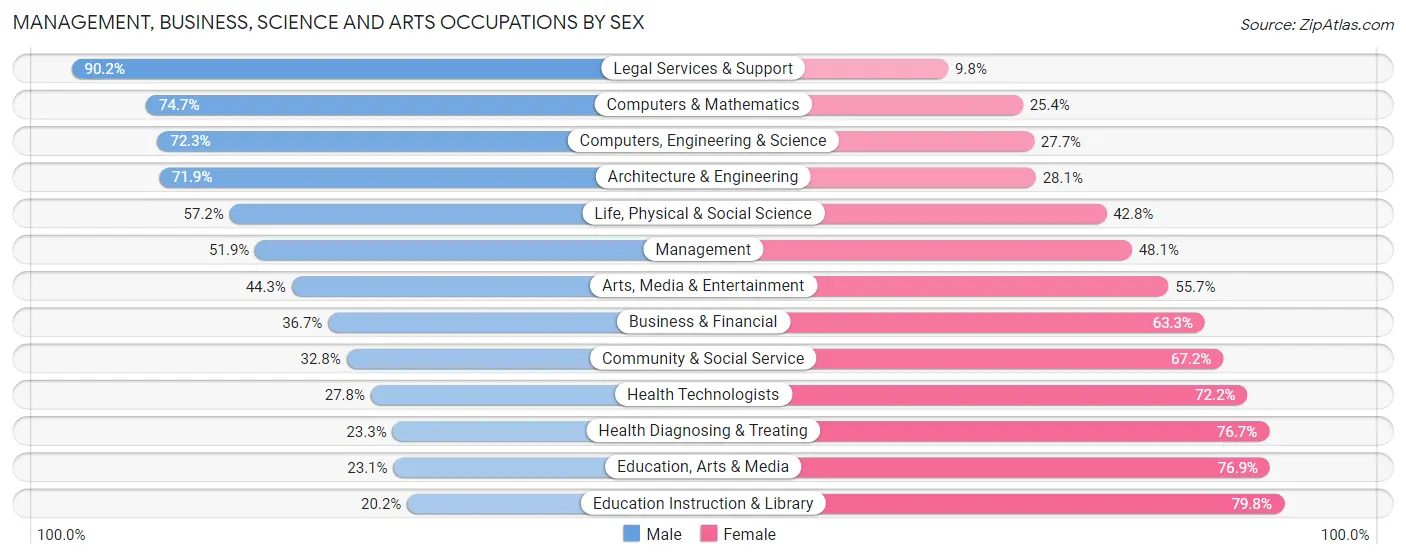
Management, Business, Science and Arts Occupations by Sex
Within the Management, Business, Science and Arts occupations in Cascades, the most male-oriented occupations are Legal Services & Support (90.2%), Computers & Mathematics (74.7%), and Computers, Engineering & Science (72.3%), while the most female-oriented occupations are Education Instruction & Library (79.8%), Education, Arts & Media (76.9%), and Health Diagnosing & Treating (76.7%).
| Occupation | Male | Female |
| Management | 654 (51.9%) | 606 (48.1%) |
| Business & Financial | 293 (36.7%) | 506 (63.3%) |
| Computers, Engineering & Science | 1,144 (72.3%) | 438 (27.7%) |
| Computers & Mathematics | 807 (74.7%) | 274 (25.4%) |
| Architecture & Engineering | 246 (71.9%) | 96 (28.1%) |
| Life, Physical & Social Science | 91 (57.2%) | 68 (42.8%) |
| Community & Social Service | 309 (32.8%) | 632 (67.2%) |
| Education, Arts & Media | 9 (23.1%) | 30 (76.9%) |
| Legal Services & Support | 46 (90.2%) | 5 (9.8%) |
| Education Instruction & Library | 103 (20.2%) | 407 (79.8%) |
| Arts, Media & Entertainment | 151 (44.3%) | 190 (55.7%) |
| Health Diagnosing & Treating | 40 (23.3%) | 132 (76.7%) |
| Health Technologists | 40 (27.8%) | 104 (72.2%) |
| Total (Category) | 2,440 (51.3%) | 2,314 (48.7%) |
| Total (Overall) | 3,649 (51.9%) | 3,384 (48.1%) |
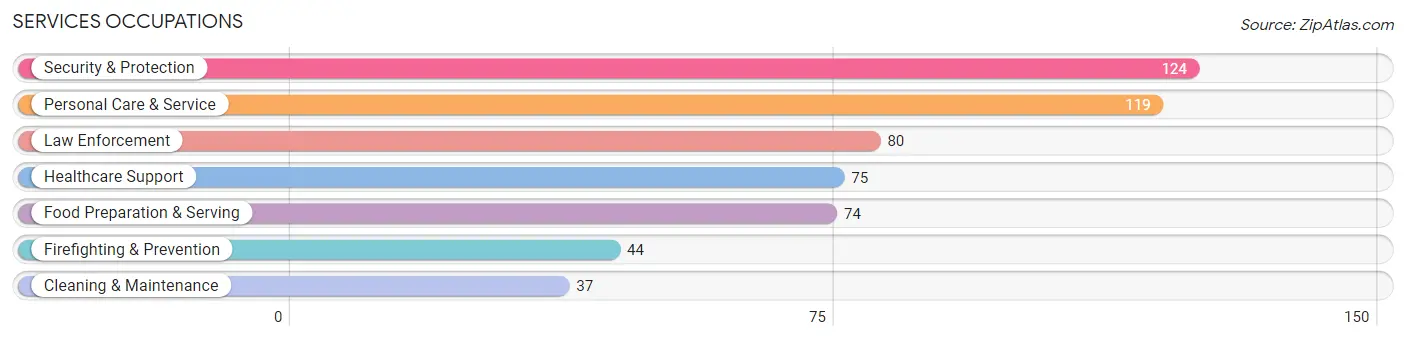
Services Occupations
The most common Services occupations in Cascades are Security & Protection (124 | 1.8%), Personal Care & Service (119 | 1.7%), Law Enforcement (80 | 1.1%), Healthcare Support (75 | 1.1%), and Food Preparation & Serving (74 | 1.1%).
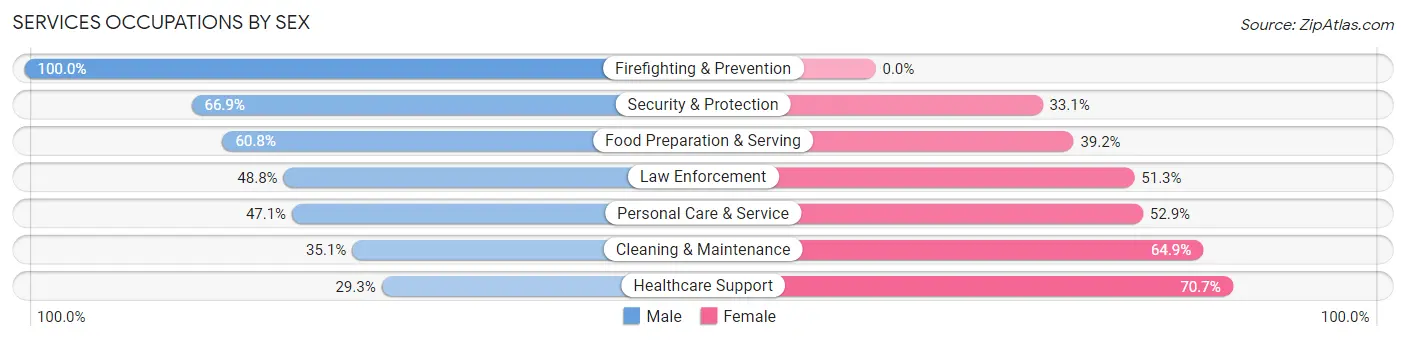
Services Occupations by Sex
Within the Services occupations in Cascades, the most male-oriented occupations are Firefighting & Prevention (100.0%), Security & Protection (66.9%), and Food Preparation & Serving (60.8%), while the most female-oriented occupations are Healthcare Support (70.7%), Cleaning & Maintenance (64.9%), and Personal Care & Service (52.9%).
| Occupation | Male | Female |
| Healthcare Support | 22 (29.3%) | 53 (70.7%) |
| Security & Protection | 83 (66.9%) | 41 (33.1%) |
| Firefighting & Prevention | 44 (100.0%) | 0 (0.0%) |
| Law Enforcement | 39 (48.7%) | 41 (51.2%) |
| Food Preparation & Serving | 45 (60.8%) | 29 (39.2%) |
| Cleaning & Maintenance | 13 (35.1%) | 24 (64.9%) |
| Personal Care & Service | 56 (47.1%) | 63 (52.9%) |
| Total (Category) | 219 (51.0%) | 210 (48.9%) |
| Total (Overall) | 3,649 (51.9%) | 3,384 (48.1%) |
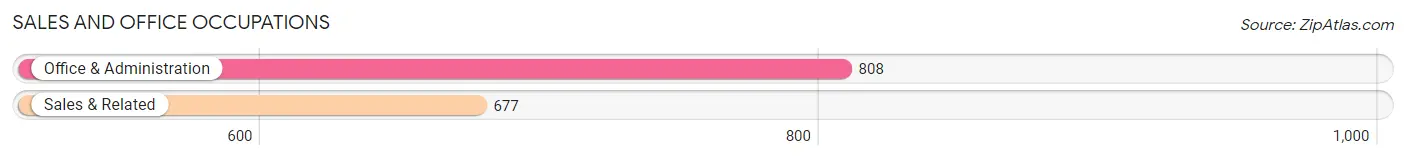
Sales and Office Occupations
The most common Sales and Office occupations in Cascades are Office & Administration (808 | 11.5%), and Sales & Related (677 | 9.6%).
Sales and Office Occupations by Sex
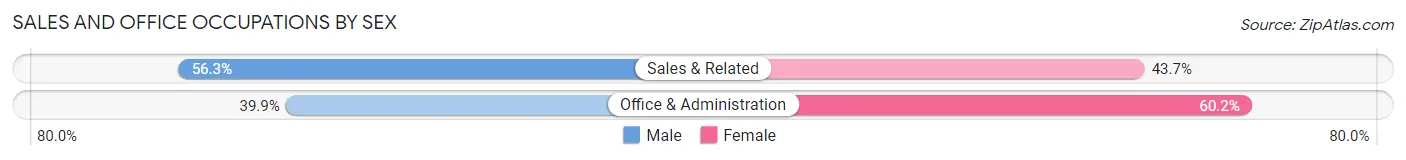
| Occupation | Male | Female |
| Sales & Related | 381 (56.3%) | 296 (43.7%) |
| Office & Administration | 322 (39.9%) | 486 (60.2%) |
| Total (Category) | 703 (47.3%) | 782 (52.7%) |
| Total (Overall) | 3,649 (51.9%) | 3,384 (48.1%) |
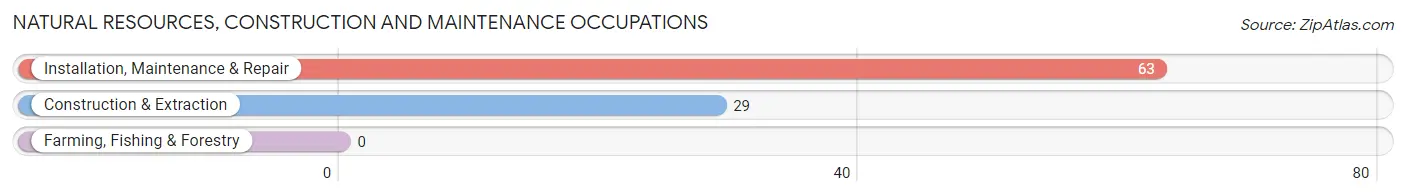
Natural Resources, Construction and Maintenance Occupations
The most common Natural Resources, Construction and Maintenance occupations in Cascades are Installation, Maintenance & Repair (63 | 0.9%), and Construction & Extraction (29 | 0.4%).
Natural Resources, Construction and Maintenance Occupations by Sex
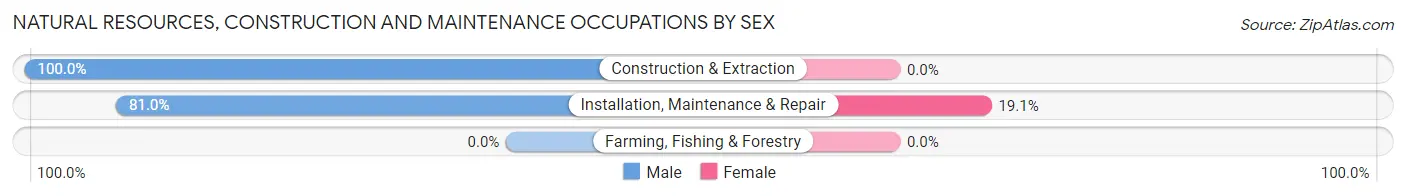
| Occupation | Male | Female |
| Farming, Fishing & Forestry | 0 (0.0%) | 0 (0.0%) |
| Construction & Extraction | 29 (100.0%) | 0 (0.0%) |
| Installation, Maintenance & Repair | 51 (80.9%) | 12 (19.1%) |
| Total (Category) | 80 (87.0%) | 12 (13.0%) |
| Total (Overall) | 3,649 (51.9%) | 3,384 (48.1%) |
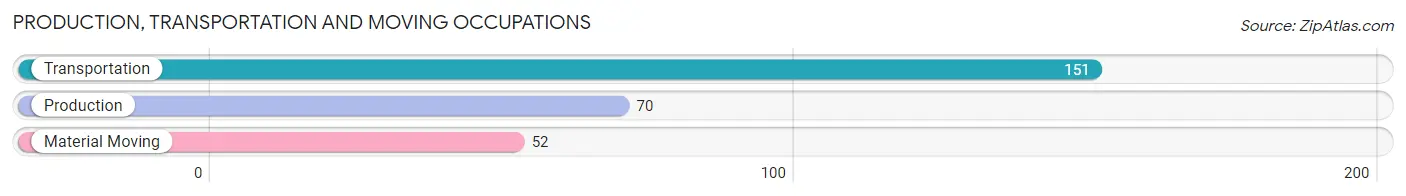
Production, Transportation and Moving Occupations
The most common Production, Transportation and Moving occupations in Cascades are Transportation (151 | 2.1%), Production (70 | 1.0%), and Material Moving (52 | 0.7%).
Production, Transportation and Moving Occupations by Sex
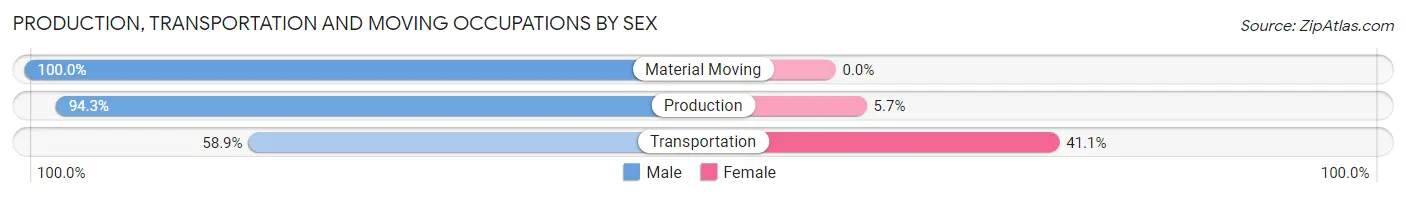
| Occupation | Male | Female |
| Production | 66 (94.3%) | 4 (5.7%) |
| Transportation | 89 (58.9%) | 62 (41.1%) |
| Material Moving | 52 (100.0%) | 0 (0.0%) |
| Total (Category) | 207 (75.8%) | 66 (24.2%) |
| Total (Overall) | 3,649 (51.9%) | 3,384 (48.1%) |
Employment Industries by Sex in Cascades
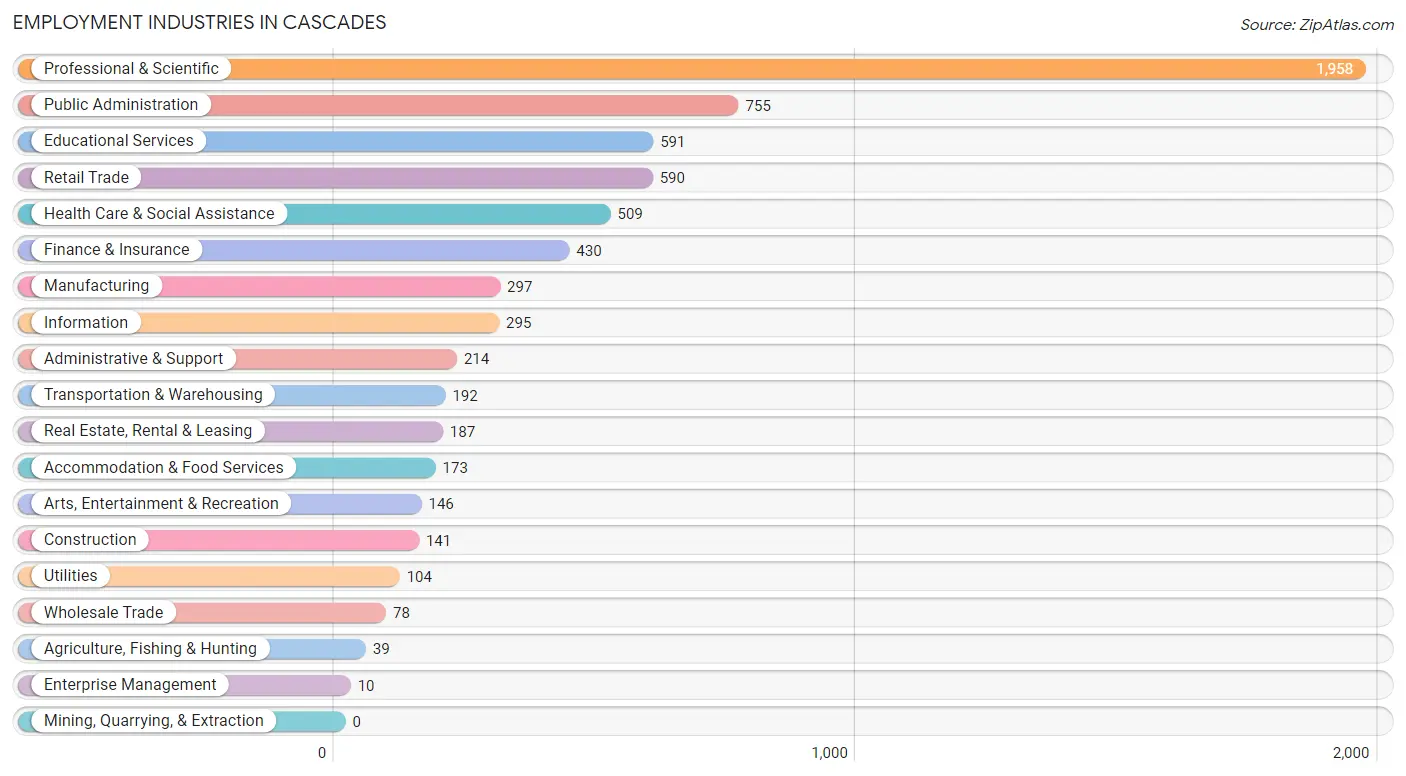
Employment Industries in Cascades
The major employment industries in Cascades include Professional & Scientific (1,958 | 27.8%), Public Administration (755 | 10.7%), Educational Services (591 | 8.4%), Retail Trade (590 | 8.4%), and Health Care & Social Assistance (509 | 7.2%).
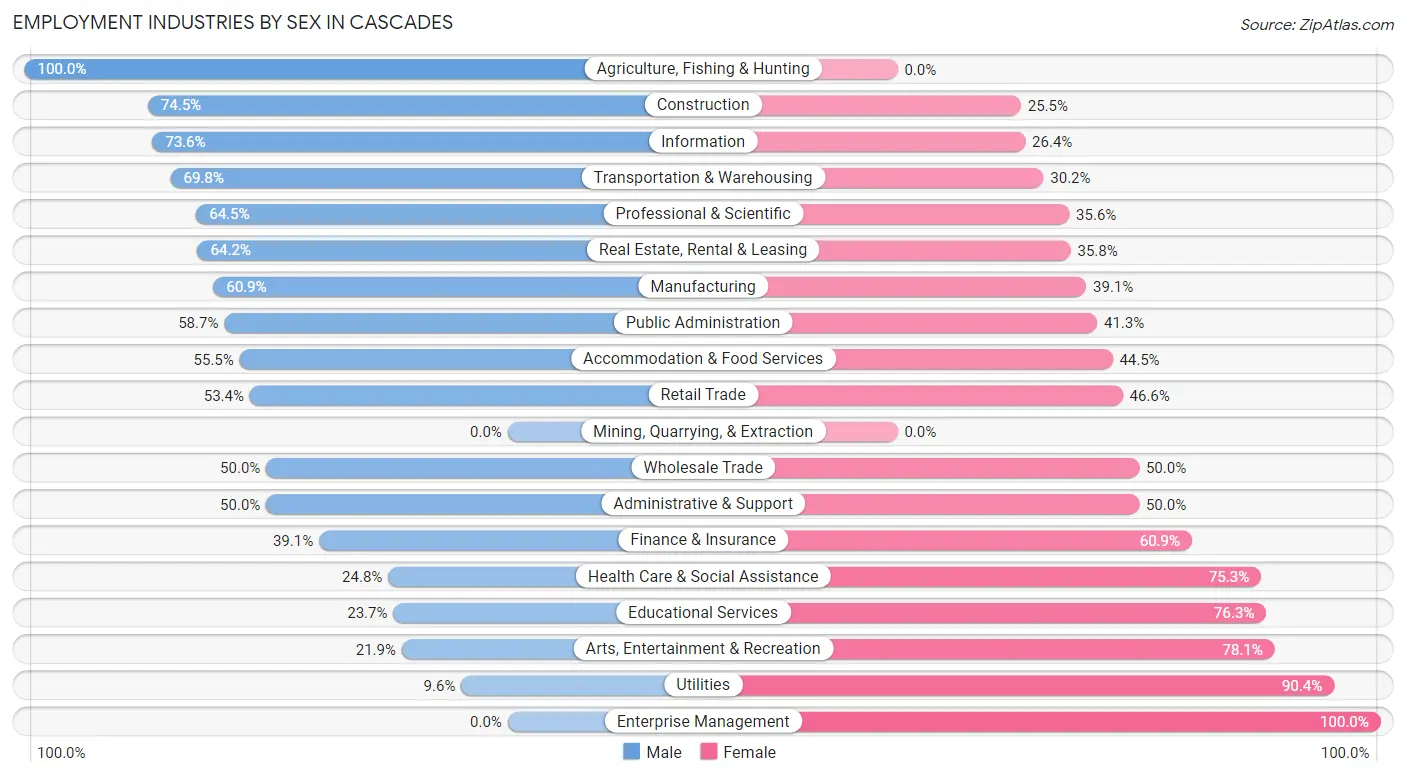
Employment Industries by Sex in Cascades
The Cascades industries that see more men than women are Agriculture, Fishing & Hunting (100.0%), Construction (74.5%), and Information (73.6%), whereas the industries that tend to have a higher number of women are Enterprise Management (100.0%), Utilities (90.4%), and Arts, Entertainment & Recreation (78.1%).
| Industry | Male | Female |
| Agriculture, Fishing & Hunting | 39 (100.0%) | 0 (0.0%) |
| Mining, Quarrying, & Extraction | 0 (0.0%) | 0 (0.0%) |
| Construction | 105 (74.5%) | 36 (25.5%) |
| Manufacturing | 181 (60.9%) | 116 (39.1%) |
| Wholesale Trade | 39 (50.0%) | 39 (50.0%) |
| Retail Trade | 315 (53.4%) | 275 (46.6%) |
| Transportation & Warehousing | 134 (69.8%) | 58 (30.2%) |
| Utilities | 10 (9.6%) | 94 (90.4%) |
| Information | 217 (73.6%) | 78 (26.4%) |
| Finance & Insurance | 168 (39.1%) | 262 (60.9%) |
| Real Estate, Rental & Leasing | 120 (64.2%) | 67 (35.8%) |
| Professional & Scientific | 1,262 (64.4%) | 696 (35.5%) |
| Enterprise Management | 0 (0.0%) | 10 (100.0%) |
| Administrative & Support | 107 (50.0%) | 107 (50.0%) |
| Educational Services | 140 (23.7%) | 451 (76.3%) |
| Health Care & Social Assistance | 126 (24.7%) | 383 (75.2%) |
| Arts, Entertainment & Recreation | 32 (21.9%) | 114 (78.1%) |
| Accommodation & Food Services | 96 (55.5%) | 77 (44.5%) |
| Public Administration | 443 (58.7%) | 312 (41.3%) |
| Total | 3,649 (51.9%) | 3,384 (48.1%) |
Education in Cascades
School Enrollment in Cascades
The most common levels of schooling among the 2,928 students in Cascades are high school (645 | 22.0%), college / undergraduate (618 | 21.1%), and middle school (558 | 19.1%).
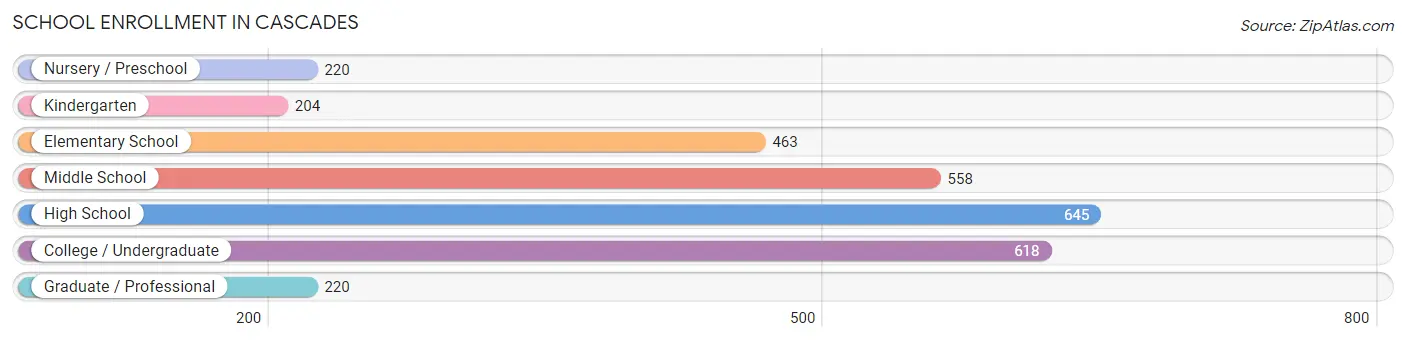
| School Level | # Students | % Students |
| Nursery / Preschool | 220 | 7.5% |
| Kindergarten | 204 | 7.0% |
| Elementary School | 463 | 15.8% |
| Middle School | 558 | 19.1% |
| High School | 645 | 22.0% |
| College / Undergraduate | 618 | 21.1% |
| Graduate / Professional | 220 | 7.5% |
| Total | 2,928 | 100.0% |
School Enrollment by Age by Funding Source in Cascades
Out of a total of 2,928 students who are enrolled in schools in Cascades, 530 (18.1%) attend a private institution, while the remaining 2,398 (81.9%) are enrolled in public schools. The age group of 3 to 4 year olds has the highest likelihood of being enrolled in private schools, with 65 (43.3% in the age bracket) enrolled. Conversely, the age group of 15 to 17 year olds has the lowest likelihood of being enrolled in a private school, with 404 (97.1% in the age bracket) attending a public institution.
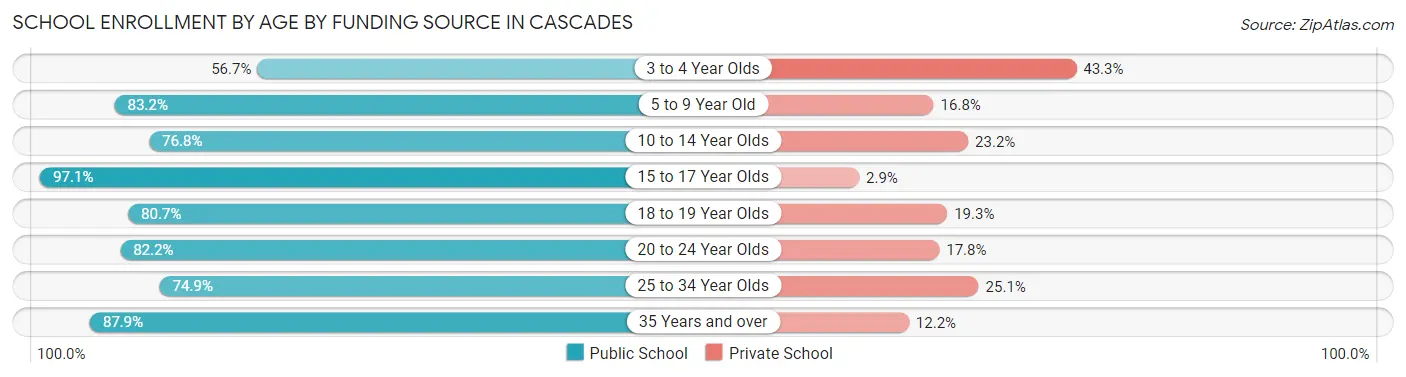
| Age Bracket | Public School | Private School |
| 3 to 4 Year Olds | 85 (56.7%) | 65 (43.3%) |
| 5 to 9 Year Old | 586 (83.2%) | 118 (16.8%) |
| 10 to 14 Year Olds | 510 (76.8%) | 154 (23.2%) |
| 15 to 17 Year Olds | 404 (97.1%) | 12 (2.9%) |
| 18 to 19 Year Olds | 226 (80.7%) | 54 (19.3%) |
| 20 to 24 Year Olds | 240 (82.2%) | 52 (17.8%) |
| 25 to 34 Year Olds | 131 (74.9%) | 44 (25.1%) |
| 35 Years and over | 217 (87.8%) | 30 (12.1%) |
| Total | 2,398 (81.9%) | 530 (18.1%) |
Educational Attainment by Field of Study in Cascades
Business (1,485 | 24.6%), computers & mathematics (848 | 14.0%), engineering (645 | 10.7%), social sciences (487 | 8.1%), and science & technology (394 | 6.5%) are the most common fields of study among 6,041 individuals in Cascades who have obtained a bachelor's degree or higher.
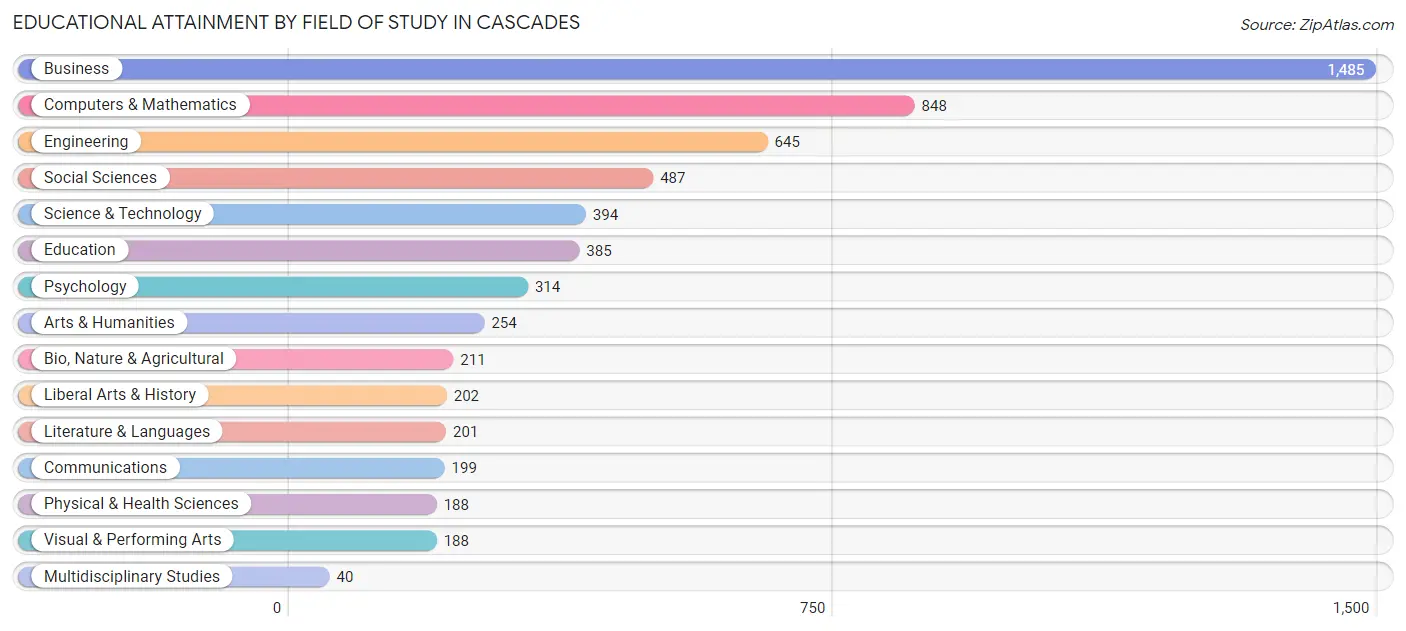
| Field of Study | # Graduates | % Graduates |
| Computers & Mathematics | 848 | 14.0% |
| Bio, Nature & Agricultural | 211 | 3.5% |
| Physical & Health Sciences | 188 | 3.1% |
| Psychology | 314 | 5.2% |
| Social Sciences | 487 | 8.1% |
| Engineering | 645 | 10.7% |
| Multidisciplinary Studies | 40 | 0.7% |
| Science & Technology | 394 | 6.5% |
| Business | 1,485 | 24.6% |
| Education | 385 | 6.4% |
| Literature & Languages | 201 | 3.3% |
| Liberal Arts & History | 202 | 3.3% |
| Visual & Performing Arts | 188 | 3.1% |
| Communications | 199 | 3.3% |
| Arts & Humanities | 254 | 4.2% |
| Total | 6,041 | 100.0% |
Transportation & Commute in Cascades
Vehicle Availability by Sex in Cascades
The most prevalent vehicle ownership categories in Cascades are males with 2 vehicles (1,869, accounting for 51.9%) and females with 2 vehicles (1,561, making up 55.8%).
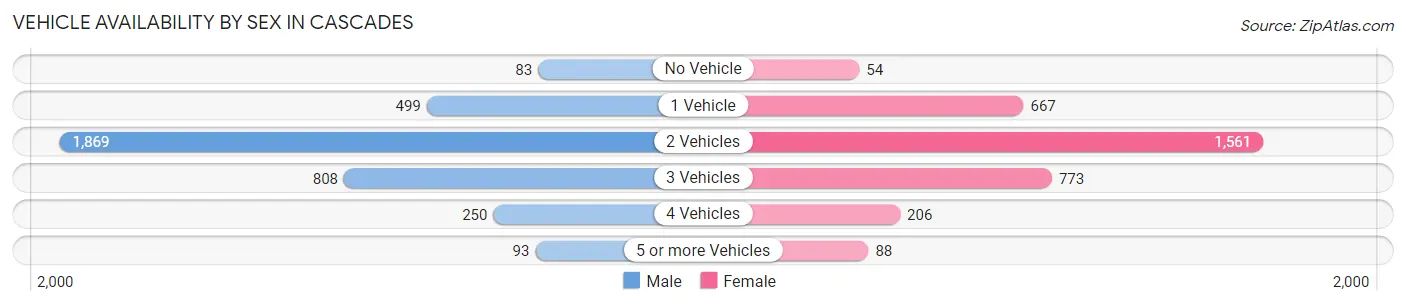
| Vehicles Available | Male | Female |
| No Vehicle | 83 (2.3%) | 54 (1.6%) |
| 1 Vehicle | 499 (13.9%) | 667 (19.9%) |
| 2 Vehicles | 1,869 (51.9%) | 1,561 (46.6%) |
| 3 Vehicles | 808 (22.4%) | 773 (23.1%) |
| 4 Vehicles | 250 (6.9%) | 206 (6.1%) |
| 5 or more Vehicles | 93 (2.6%) | 88 (2.6%) |
| Total | 3,602 (100.0%) | 3,349 (100.0%) |
Commute Time in Cascades
The most frequently occuring commute durations in Cascades are 15 to 19 minutes (955 commuters, 17.9%), 20 to 24 minutes (895 commuters, 16.7%), and 10 to 14 minutes (664 commuters, 12.4%).
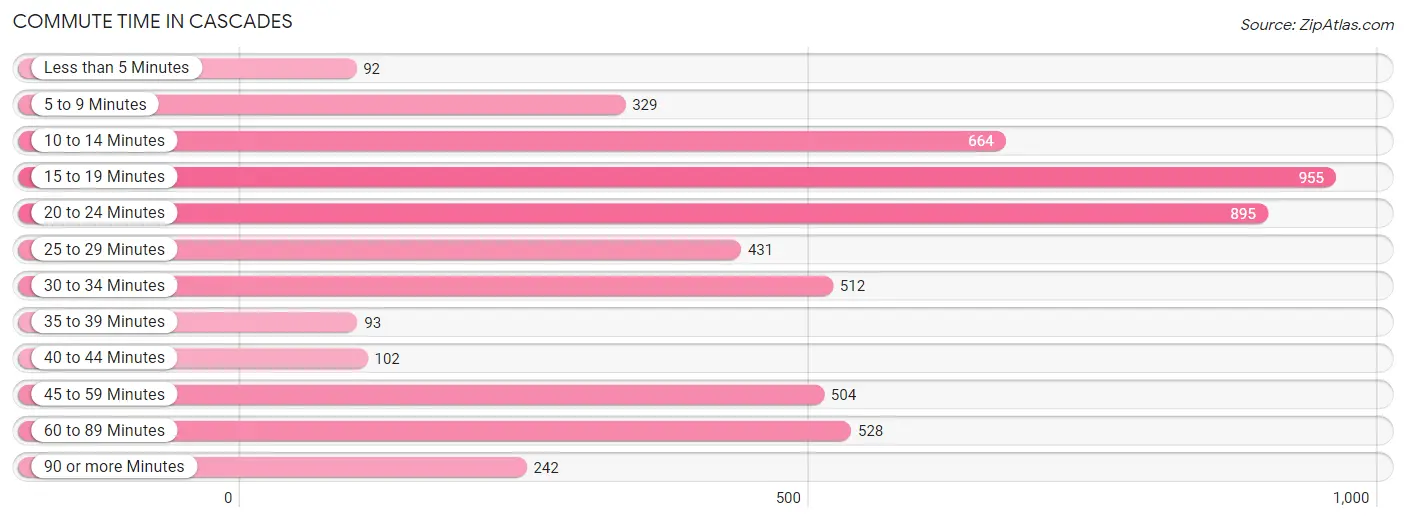
| Commute Time | # Commuters | % Commuters |
| Less than 5 Minutes | 92 | 1.7% |
| 5 to 9 Minutes | 329 | 6.1% |
| 10 to 14 Minutes | 664 | 12.4% |
| 15 to 19 Minutes | 955 | 17.9% |
| 20 to 24 Minutes | 895 | 16.7% |
| 25 to 29 Minutes | 431 | 8.1% |
| 30 to 34 Minutes | 512 | 9.6% |
| 35 to 39 Minutes | 93 | 1.7% |
| 40 to 44 Minutes | 102 | 1.9% |
| 45 to 59 Minutes | 504 | 9.4% |
| 60 to 89 Minutes | 528 | 9.9% |
| 90 or more Minutes | 242 | 4.5% |
Commute Time by Sex in Cascades
The most common commute times in Cascades are 15 to 19 minutes (427 commuters, 15.7%) for males and 15 to 19 minutes (528 commuters, 20.2%) for females.
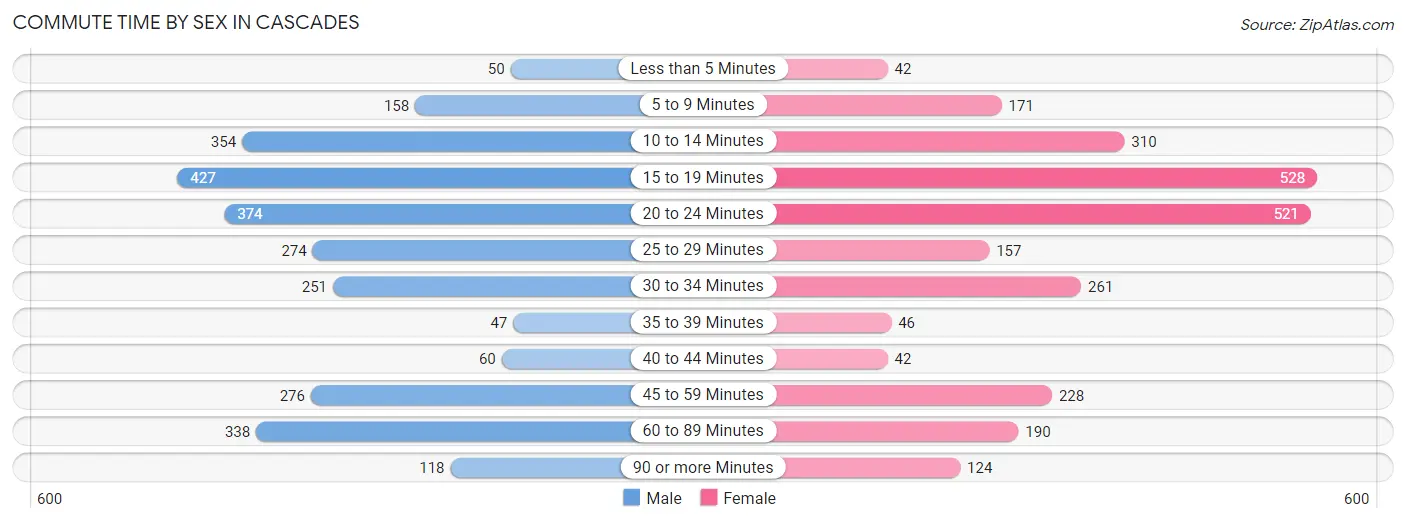
| Commute Time | Male | Female |
| Less than 5 Minutes | 50 (1.8%) | 42 (1.6%) |
| 5 to 9 Minutes | 158 (5.8%) | 171 (6.5%) |
| 10 to 14 Minutes | 354 (13.0%) | 310 (11.8%) |
| 15 to 19 Minutes | 427 (15.7%) | 528 (20.2%) |
| 20 to 24 Minutes | 374 (13.7%) | 521 (19.9%) |
| 25 to 29 Minutes | 274 (10.1%) | 157 (6.0%) |
| 30 to 34 Minutes | 251 (9.2%) | 261 (10.0%) |
| 35 to 39 Minutes | 47 (1.7%) | 46 (1.8%) |
| 40 to 44 Minutes | 60 (2.2%) | 42 (1.6%) |
| 45 to 59 Minutes | 276 (10.1%) | 228 (8.7%) |
| 60 to 89 Minutes | 338 (12.4%) | 190 (7.2%) |
| 90 or more Minutes | 118 (4.3%) | 124 (4.7%) |
Time of Departure to Work by Sex in Cascades
The most frequent times of departure to work in Cascades are 8:00 AM to 8:29 AM (465, 17.1%) for males and 8:00 AM to 8:29 AM (467, 17.8%) for females.
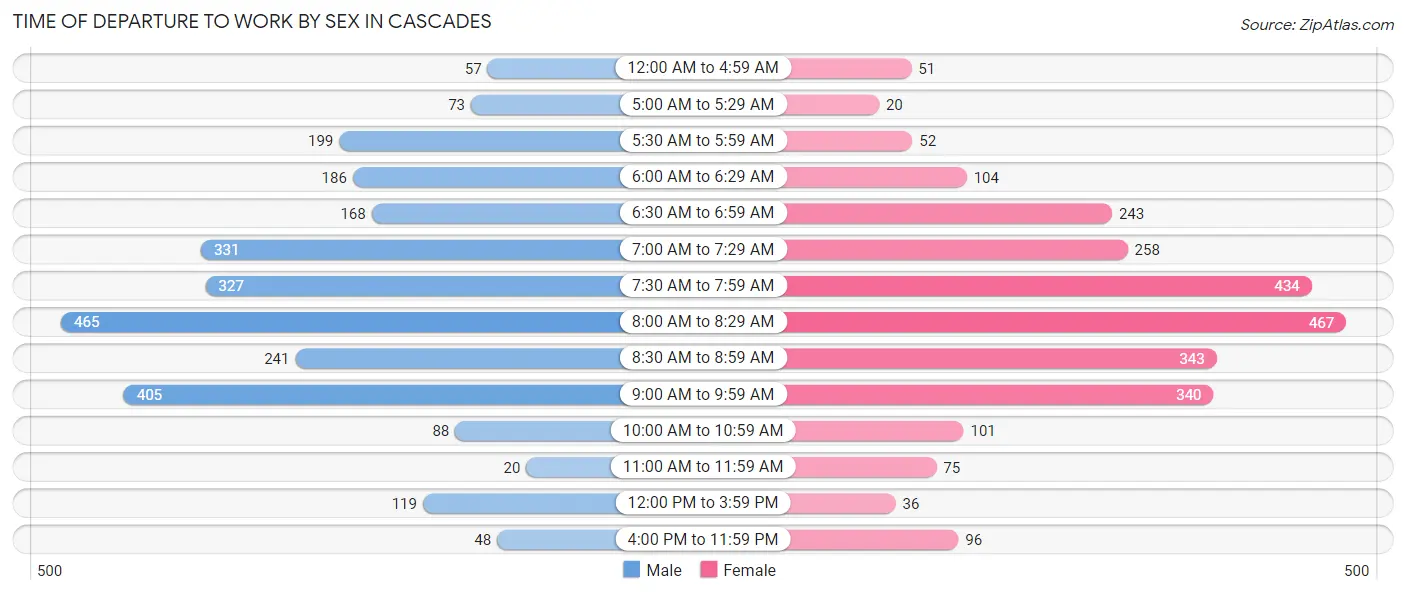
| Time of Departure | Male | Female |
| 12:00 AM to 4:59 AM | 57 (2.1%) | 51 (1.9%) |
| 5:00 AM to 5:29 AM | 73 (2.7%) | 20 (0.8%) |
| 5:30 AM to 5:59 AM | 199 (7.3%) | 52 (2.0%) |
| 6:00 AM to 6:29 AM | 186 (6.8%) | 104 (4.0%) |
| 6:30 AM to 6:59 AM | 168 (6.2%) | 243 (9.3%) |
| 7:00 AM to 7:29 AM | 331 (12.1%) | 258 (9.9%) |
| 7:30 AM to 7:59 AM | 327 (12.0%) | 434 (16.6%) |
| 8:00 AM to 8:29 AM | 465 (17.1%) | 467 (17.8%) |
| 8:30 AM to 8:59 AM | 241 (8.8%) | 343 (13.1%) |
| 9:00 AM to 9:59 AM | 405 (14.8%) | 340 (13.0%) |
| 10:00 AM to 10:59 AM | 88 (3.2%) | 101 (3.8%) |
| 11:00 AM to 11:59 AM | 20 (0.7%) | 75 (2.9%) |
| 12:00 PM to 3:59 PM | 119 (4.4%) | 36 (1.4%) |
| 4:00 PM to 11:59 PM | 48 (1.8%) | 96 (3.7%) |
| Total | 2,727 (100.0%) | 2,620 (100.0%) |
Housing Occupancy in Cascades
Occupancy by Ownership in Cascades
Of the total 4,627 dwellings in Cascades, owner-occupied units account for 3,232 (69.9%), while renter-occupied units make up 1,395 (30.1%).
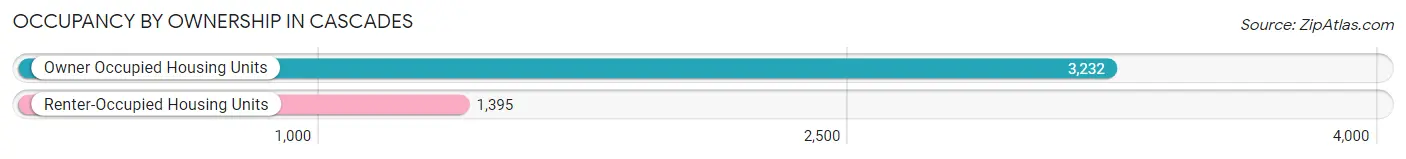
| Occupancy | # Housing Units | % Housing Units |
| Owner Occupied Housing Units | 3,232 | 69.9% |
| Renter-Occupied Housing Units | 1,395 | 30.1% |
| Total Occupied Housing Units | 4,627 | 100.0% |
Occupancy by Household Size in Cascades
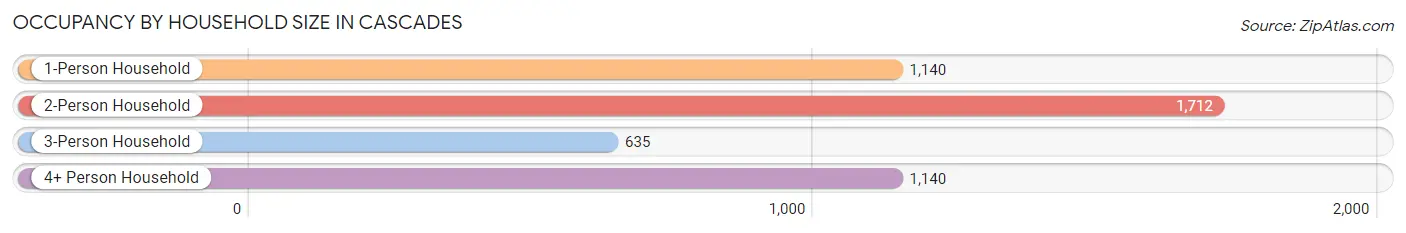
| Household Size | # Housing Units | % Housing Units |
| 1-Person Household | 1,140 | 24.6% |
| 2-Person Household | 1,712 | 37.0% |
| 3-Person Household | 635 | 13.7% |
| 4+ Person Household | 1,140 | 24.6% |
| Total Housing Units | 4,627 | 100.0% |
Occupancy by Ownership by Household Size in Cascades
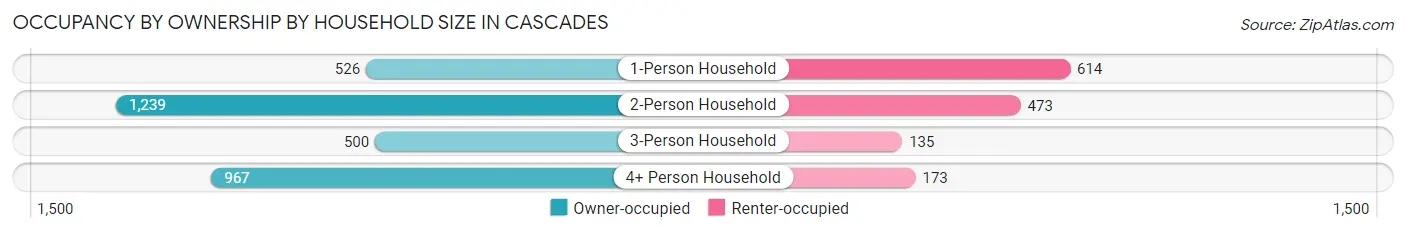
| Household Size | Owner-occupied | Renter-occupied |
| 1-Person Household | 526 (46.1%) | 614 (53.9%) |
| 2-Person Household | 1,239 (72.4%) | 473 (27.6%) |
| 3-Person Household | 500 (78.7%) | 135 (21.3%) |
| 4+ Person Household | 967 (84.8%) | 173 (15.2%) |
| Total Housing Units | 3,232 (69.9%) | 1,395 (30.1%) |
Occupancy by Educational Attainment in Cascades
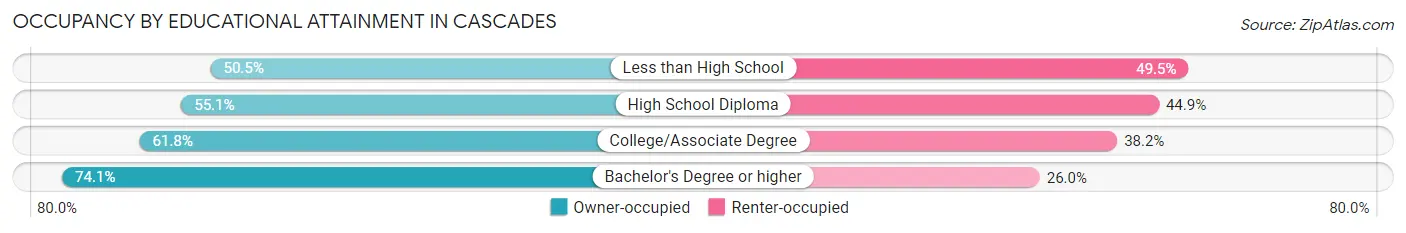
| Household Size | Owner-occupied | Renter-occupied |
| Less than High School | 51 (50.5%) | 50 (49.5%) |
| High School Diploma | 134 (55.1%) | 109 (44.9%) |
| College/Associate Degree | 627 (61.8%) | 388 (38.2%) |
| Bachelor's Degree or higher | 2,420 (74.1%) | 848 (26.0%) |
Occupancy by Age of Householder in Cascades
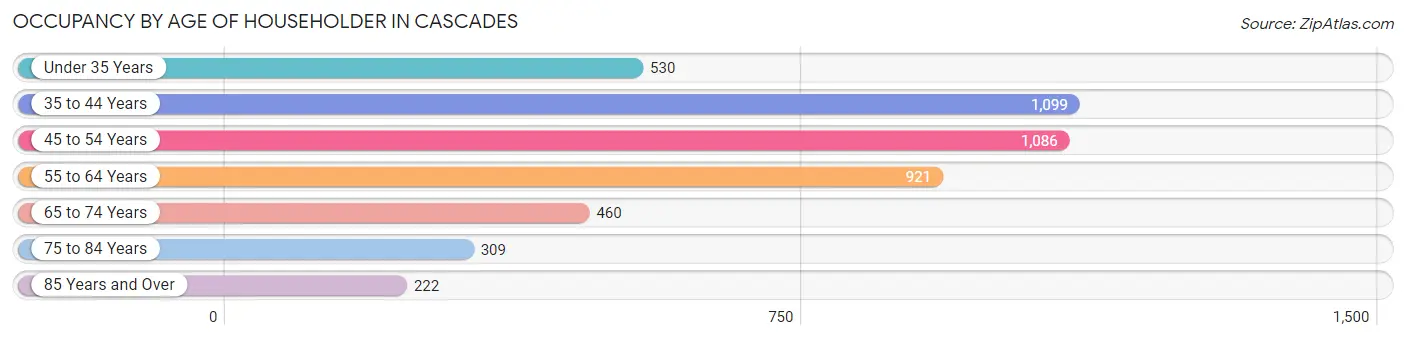
| Age Bracket | # Households | % Households |
| Under 35 Years | 530 | 11.5% |
| 35 to 44 Years | 1,099 | 23.7% |
| 45 to 54 Years | 1,086 | 23.5% |
| 55 to 64 Years | 921 | 19.9% |
| 65 to 74 Years | 460 | 9.9% |
| 75 to 84 Years | 309 | 6.7% |
| 85 Years and Over | 222 | 4.8% |
| Total | 4,627 | 100.0% |
Housing Finances in Cascades
Median Income by Occupancy in Cascades
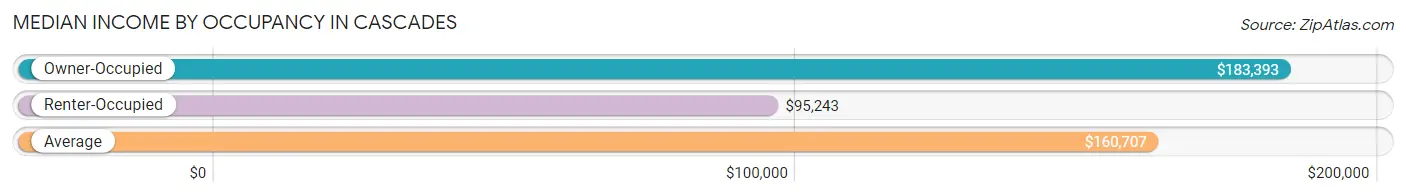
| Occupancy Type | # Households | Median Income |
| Owner-Occupied | 3,232 (69.9%) | $183,393 |
| Renter-Occupied | 1,395 (30.1%) | $95,243 |
| Average | 4,627 (100.0%) | $160,707 |
Occupancy by Householder Income Bracket in Cascades
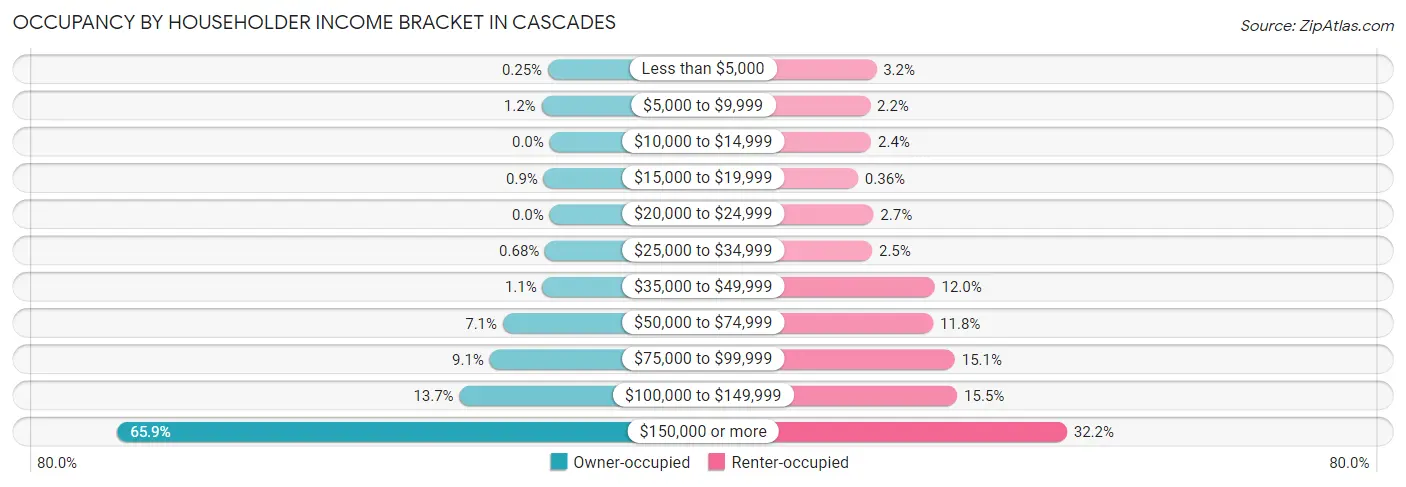
| Income Bracket | Owner-occupied | Renter-occupied |
| Less than $5,000 | 8 (0.3%) | 44 (3.2%) |
| $5,000 to $9,999 | 40 (1.2%) | 31 (2.2%) |
| $10,000 to $14,999 | 0 (0.0%) | 33 (2.4%) |
| $15,000 to $19,999 | 29 (0.9%) | 5 (0.4%) |
| $20,000 to $24,999 | 0 (0.0%) | 38 (2.7%) |
| $25,000 to $34,999 | 22 (0.7%) | 35 (2.5%) |
| $35,000 to $49,999 | 35 (1.1%) | 168 (12.0%) |
| $50,000 to $74,999 | 230 (7.1%) | 165 (11.8%) |
| $75,000 to $99,999 | 295 (9.1%) | 211 (15.1%) |
| $100,000 to $149,999 | 444 (13.7%) | 216 (15.5%) |
| $150,000 or more | 2,129 (65.9%) | 449 (32.2%) |
| Total | 3,232 (100.0%) | 1,395 (100.0%) |
Monthly Housing Cost Tiers in Cascades
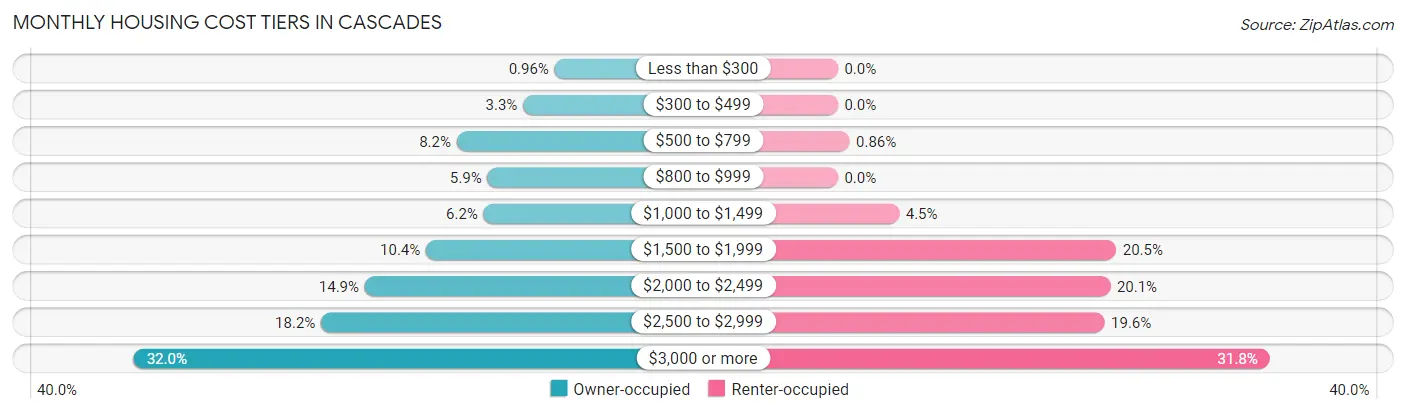
| Monthly Cost | Owner-occupied | Renter-occupied |
| Less than $300 | 31 (1.0%) | 0 (0.0%) |
| $300 to $499 | 106 (3.3%) | 0 (0.0%) |
| $500 to $799 | 264 (8.2%) | 12 (0.9%) |
| $800 to $999 | 191 (5.9%) | 0 (0.0%) |
| $1,000 to $1,499 | 200 (6.2%) | 63 (4.5%) |
| $1,500 to $1,999 | 337 (10.4%) | 286 (20.5%) |
| $2,000 to $2,499 | 483 (14.9%) | 280 (20.1%) |
| $2,500 to $2,999 | 587 (18.2%) | 274 (19.6%) |
| $3,000 or more | 1,033 (32.0%) | 444 (31.8%) |
| Total | 3,232 (100.0%) | 1,395 (100.0%) |
Physical Housing Characteristics in Cascades
Housing Structures in Cascades
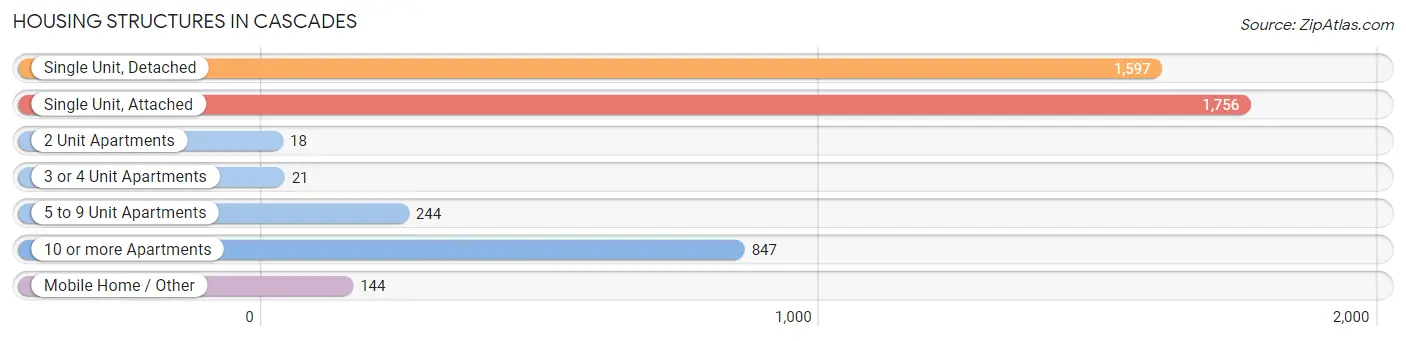
| Structure Type | # Housing Units | % Housing Units |
| Single Unit, Detached | 1,597 | 34.5% |
| Single Unit, Attached | 1,756 | 38.0% |
| 2 Unit Apartments | 18 | 0.4% |
| 3 or 4 Unit Apartments | 21 | 0.4% |
| 5 to 9 Unit Apartments | 244 | 5.3% |
| 10 or more Apartments | 847 | 18.3% |
| Mobile Home / Other | 144 | 3.1% |
| Total | 4,627 | 100.0% |
Housing Structures by Occupancy in Cascades
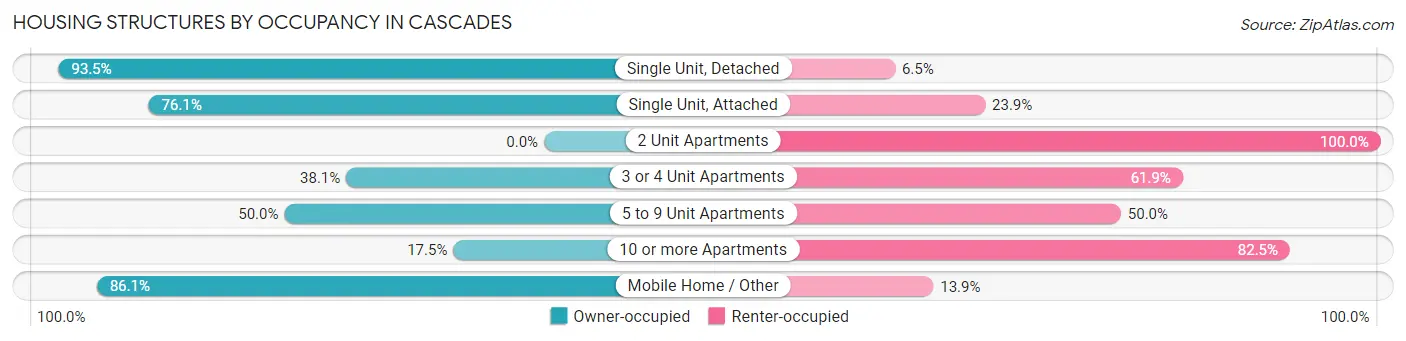
| Structure Type | Owner-occupied | Renter-occupied |
| Single Unit, Detached | 1,493 (93.5%) | 104 (6.5%) |
| Single Unit, Attached | 1,337 (76.1%) | 419 (23.9%) |
| 2 Unit Apartments | 0 (0.0%) | 18 (100.0%) |
| 3 or 4 Unit Apartments | 8 (38.1%) | 13 (61.9%) |
| 5 to 9 Unit Apartments | 122 (50.0%) | 122 (50.0%) |
| 10 or more Apartments | 148 (17.5%) | 699 (82.5%) |
| Mobile Home / Other | 124 (86.1%) | 20 (13.9%) |
| Total | 3,232 (69.9%) | 1,395 (30.1%) |
Housing Structures by Number of Rooms in Cascades
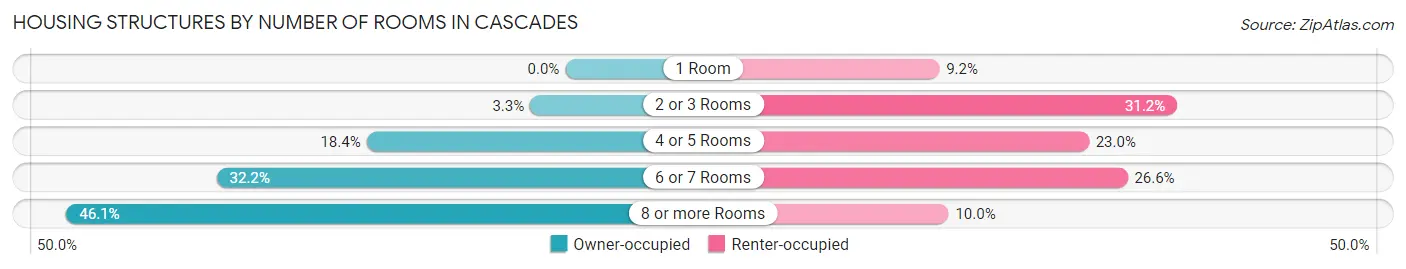
| Number of Rooms | Owner-occupied | Renter-occupied |
| 1 Room | 0 (0.0%) | 128 (9.2%) |
| 2 or 3 Rooms | 105 (3.3%) | 435 (31.2%) |
| 4 or 5 Rooms | 594 (18.4%) | 321 (23.0%) |
| 6 or 7 Rooms | 1,042 (32.2%) | 371 (26.6%) |
| 8 or more Rooms | 1,491 (46.1%) | 140 (10.0%) |
| Total | 3,232 (100.0%) | 1,395 (100.0%) |
Housing Structure by Heating Type in Cascades
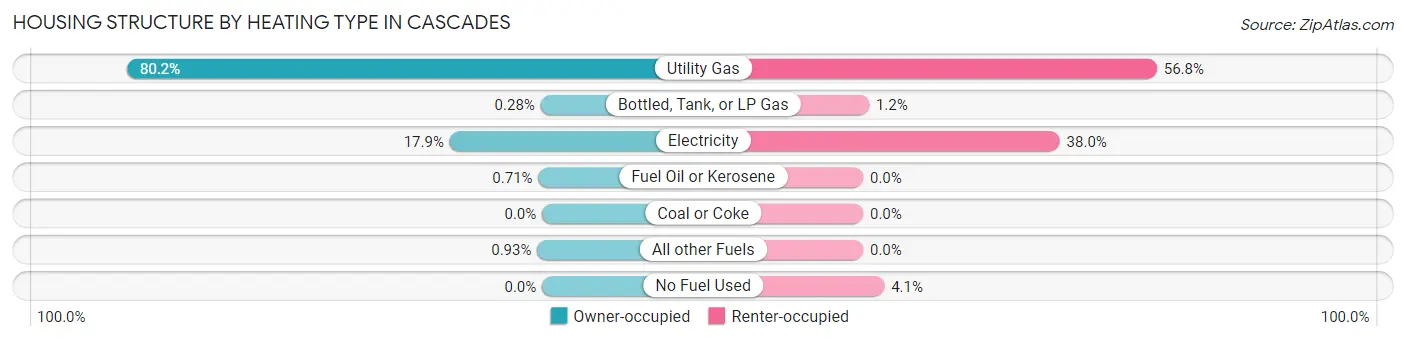
| Heating Type | Owner-occupied | Renter-occupied |
| Utility Gas | 2,593 (80.2%) | 792 (56.8%) |
| Bottled, Tank, or LP Gas | 9 (0.3%) | 16 (1.1%) |
| Electricity | 577 (17.8%) | 530 (38.0%) |
| Fuel Oil or Kerosene | 23 (0.7%) | 0 (0.0%) |
| Coal or Coke | 0 (0.0%) | 0 (0.0%) |
| All other Fuels | 30 (0.9%) | 0 (0.0%) |
| No Fuel Used | 0 (0.0%) | 57 (4.1%) |
| Total | 3,232 (100.0%) | 1,395 (100.0%) |
Household Vehicle Usage in Cascades
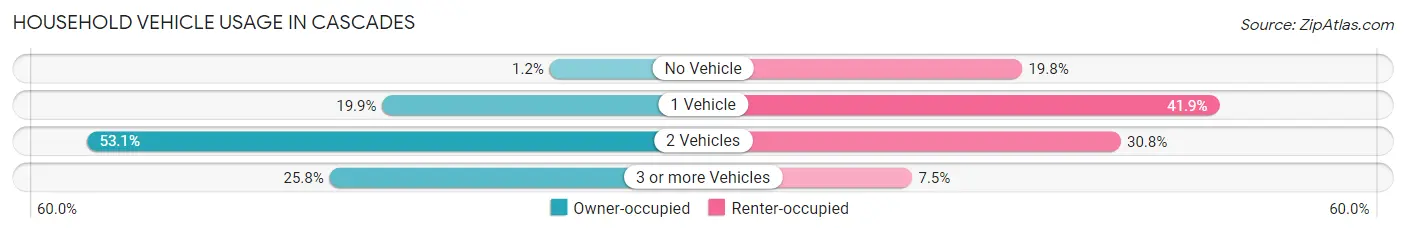
| Vehicles per Household | Owner-occupied | Renter-occupied |
| No Vehicle | 38 (1.2%) | 276 (19.8%) |
| 1 Vehicle | 644 (19.9%) | 585 (41.9%) |
| 2 Vehicles | 1,715 (53.1%) | 430 (30.8%) |
| 3 or more Vehicles | 835 (25.8%) | 104 (7.5%) |
| Total | 3,232 (100.0%) | 1,395 (100.0%) |
Real Estate & Mortgages in Cascades
Real Estate and Mortgage Overview in Cascades
| Characteristic | Without Mortgage | With Mortgage |
| Housing Units | 603 | 2,629 |
| Median Property Value | $608,300 | $574,200 |
| Median Household Income | $176,607 | $1,757 |
| Monthly Housing Costs | $871 | $1,033 |
| Real Estate Taxes | $5,606 | $18 |
Property Value by Mortgage Status in Cascades
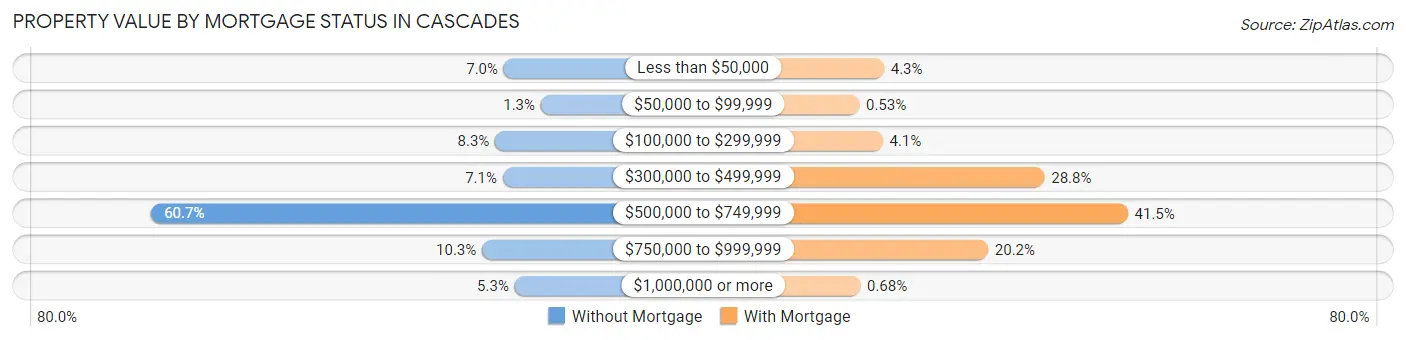
| Property Value | Without Mortgage | With Mortgage |
| Less than $50,000 | 42 (7.0%) | 113 (4.3%) |
| $50,000 to $99,999 | 8 (1.3%) | 14 (0.5%) |
| $100,000 to $299,999 | 50 (8.3%) | 108 (4.1%) |
| $300,000 to $499,999 | 43 (7.1%) | 756 (28.8%) |
| $500,000 to $749,999 | 366 (60.7%) | 1,090 (41.5%) |
| $750,000 to $999,999 | 62 (10.3%) | 530 (20.2%) |
| $1,000,000 or more | 32 (5.3%) | 18 (0.7%) |
| Total | 603 (100.0%) | 2,629 (100.0%) |
Household Income by Mortgage Status in Cascades
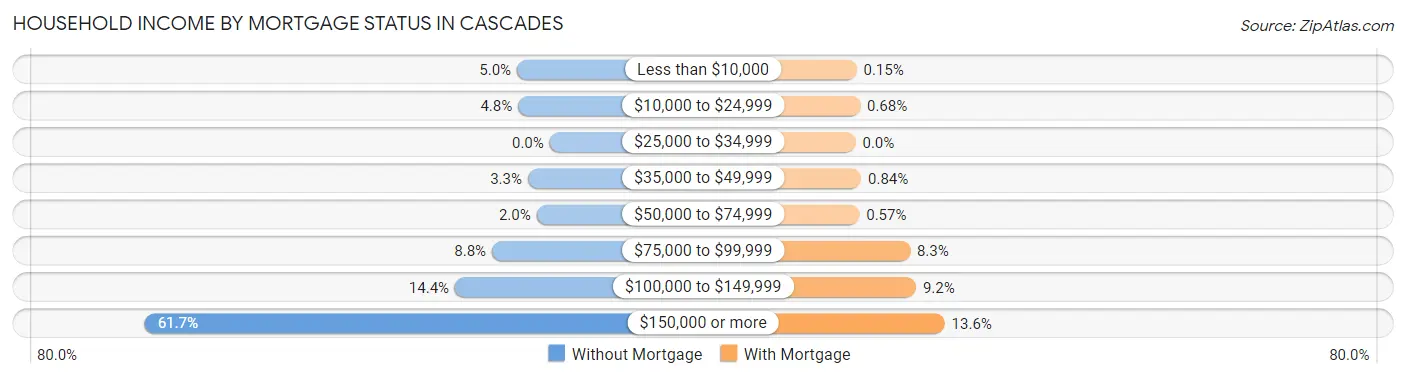
| Household Income | Without Mortgage | With Mortgage |
| Less than $10,000 | 30 (5.0%) | 4 (0.2%) |
| $10,000 to $24,999 | 29 (4.8%) | 18 (0.7%) |
| $25,000 to $34,999 | 0 (0.0%) | 0 (0.0%) |
| $35,000 to $49,999 | 20 (3.3%) | 22 (0.8%) |
| $50,000 to $74,999 | 12 (2.0%) | 15 (0.6%) |
| $75,000 to $99,999 | 53 (8.8%) | 218 (8.3%) |
| $100,000 to $149,999 | 87 (14.4%) | 242 (9.2%) |
| $150,000 or more | 372 (61.7%) | 357 (13.6%) |
| Total | 603 (100.0%) | 2,629 (100.0%) |
Property Value to Household Income Ratio in Cascades
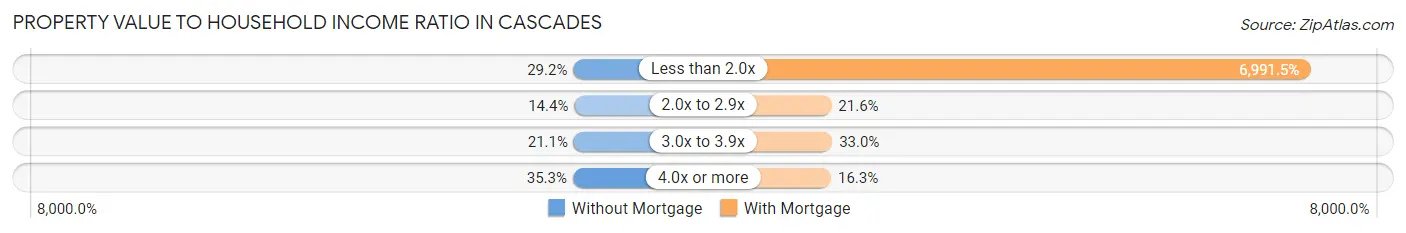
| Value-to-Income Ratio | Without Mortgage | With Mortgage |
| Less than 2.0x | 176 (29.2%) | 183,807 (6,991.5%) |
| 2.0x to 2.9x | 87 (14.4%) | 567 (21.6%) |
| 3.0x to 3.9x | 127 (21.1%) | 867 (33.0%) |
| 4.0x or more | 213 (35.3%) | 428 (16.3%) |
| Total | 603 (100.0%) | 2,629 (100.0%) |
Real Estate Taxes by Mortgage Status in Cascades
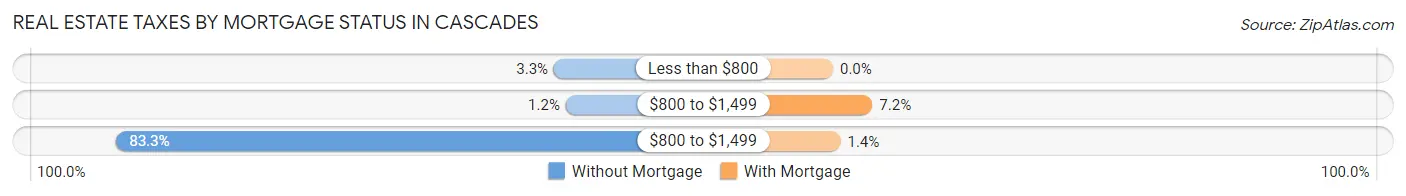
| Property Taxes | Without Mortgage | With Mortgage |
| Less than $800 | 20 (3.3%) | 0 (0.0%) |
| $800 to $1,499 | 7 (1.2%) | 189 (7.2%) |
| $800 to $1,499 | 502 (83.3%) | 36 (1.4%) |
| Total | 603 (100.0%) | 2,629 (100.0%) |
Health & Disability in Cascades
Health Insurance Coverage by Age in Cascades
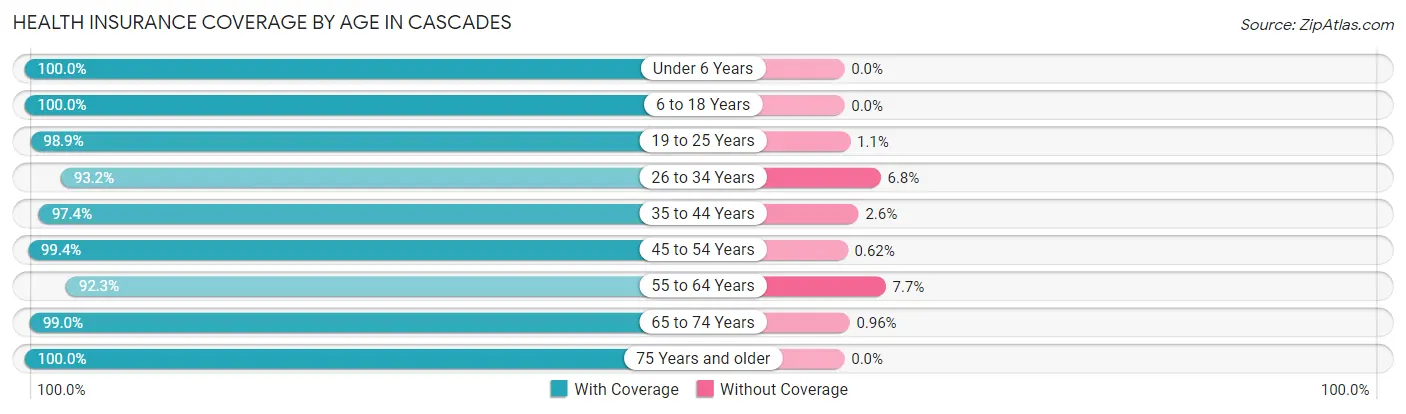
| Age Bracket | With Coverage | Without Coverage |
| Under 6 Years | 1,364 (100.0%) | 0 (0.0%) |
| 6 to 18 Years | 1,794 (100.0%) | 0 (0.0%) |
| 19 to 25 Years | 921 (98.9%) | 10 (1.1%) |
| 26 to 34 Years | 1,256 (93.2%) | 91 (6.8%) |
| 35 to 44 Years | 1,806 (97.4%) | 49 (2.6%) |
| 45 to 54 Years | 1,938 (99.4%) | 12 (0.6%) |
| 55 to 64 Years | 1,501 (92.3%) | 125 (7.7%) |
| 65 to 74 Years | 828 (99.0%) | 8 (1.0%) |
| 75 Years and older | 762 (100.0%) | 0 (0.0%) |
| Total | 12,170 (97.6%) | 295 (2.4%) |
Health Insurance Coverage by Citizenship Status in Cascades
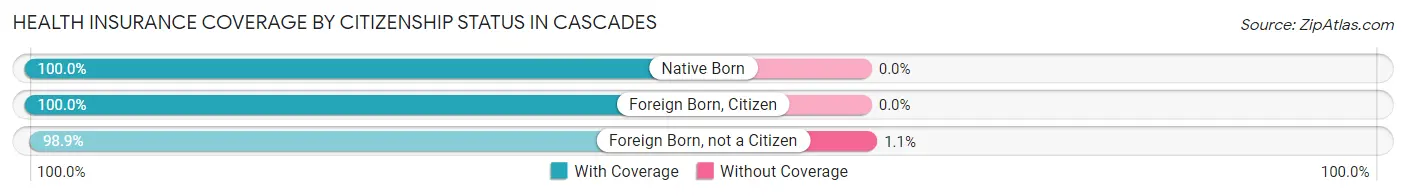
| Citizenship Status | With Coverage | Without Coverage |
| Native Born | 1,364 (100.0%) | 0 (0.0%) |
| Foreign Born, Citizen | 1,794 (100.0%) | 0 (0.0%) |
| Foreign Born, not a Citizen | 921 (98.9%) | 10 (1.1%) |
Health Insurance Coverage by Household Income in Cascades
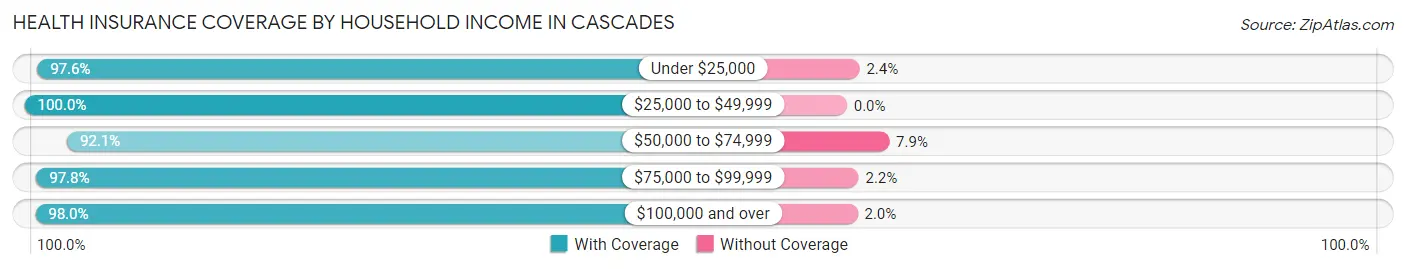
| Household Income | With Coverage | Without Coverage |
| Under $25,000 | 454 (97.6%) | 11 (2.4%) |
| $25,000 to $49,999 | 457 (100.0%) | 0 (0.0%) |
| $50,000 to $74,999 | 777 (92.1%) | 67 (7.9%) |
| $75,000 to $99,999 | 977 (97.8%) | 22 (2.2%) |
| $100,000 and over | 9,489 (98.0%) | 195 (2.0%) |
Public vs Private Health Insurance Coverage by Age in Cascades
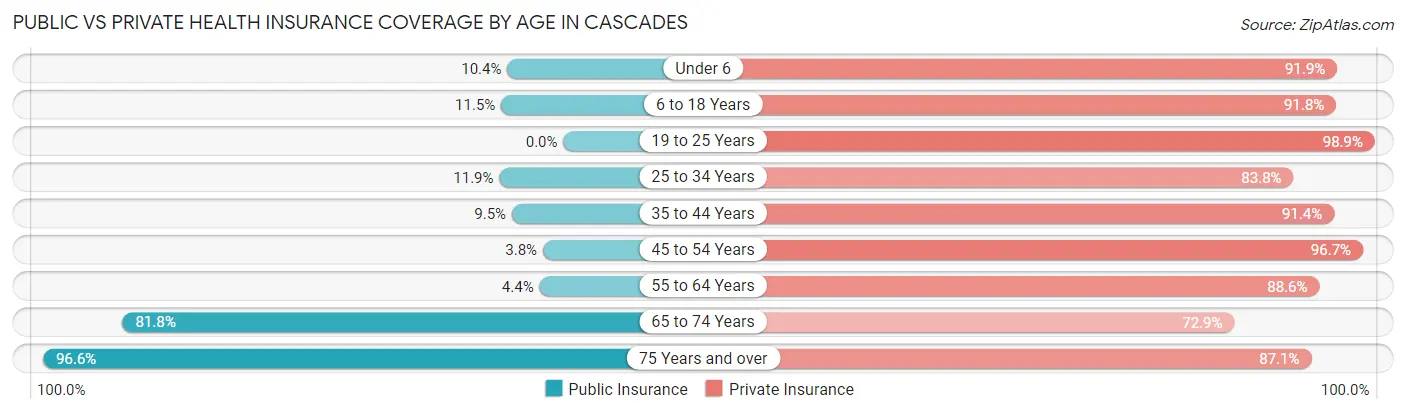
| Age Bracket | Public Insurance | Private Insurance |
| Under 6 | 142 (10.4%) | 1,254 (91.9%) |
| 6 to 18 Years | 207 (11.5%) | 1,646 (91.7%) |
| 19 to 25 Years | 0 (0.0%) | 921 (98.9%) |
| 25 to 34 Years | 160 (11.9%) | 1,129 (83.8%) |
| 35 to 44 Years | 177 (9.5%) | 1,695 (91.4%) |
| 45 to 54 Years | 74 (3.8%) | 1,886 (96.7%) |
| 55 to 64 Years | 72 (4.4%) | 1,441 (88.6%) |
| 65 to 74 Years | 684 (81.8%) | 609 (72.9%) |
| 75 Years and over | 736 (96.6%) | 664 (87.1%) |
| Total | 2,252 (18.1%) | 11,245 (90.2%) |
Disability Status by Sex by Age in Cascades
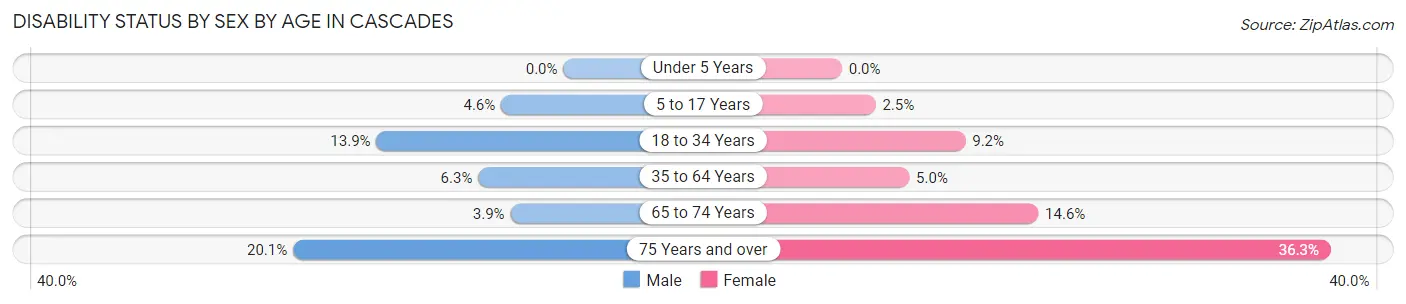
| Age Bracket | Male | Female |
| Under 5 Years | 0 (0.0%) | 0 (0.0%) |
| 5 to 17 Years | 51 (4.6%) | 18 (2.5%) |
| 18 to 34 Years | 176 (13.9%) | 110 (9.2%) |
| 35 to 64 Years | 160 (6.3%) | 145 (5.0%) |
| 65 to 74 Years | 14 (3.9%) | 70 (14.6%) |
| 75 Years and over | 54 (20.1%) | 179 (36.3%) |
Disability Class by Sex by Age in Cascades
Disability Class: Hearing Difficulty
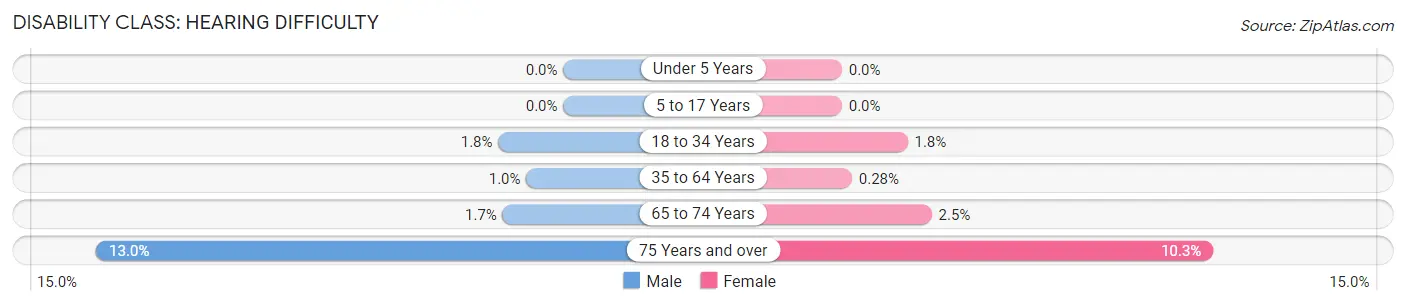
| Age Bracket | Male | Female |
| Under 5 Years | 0 (0.0%) | 0 (0.0%) |
| 5 to 17 Years | 0 (0.0%) | 0 (0.0%) |
| 18 to 34 Years | 23 (1.8%) | 22 (1.8%) |
| 35 to 64 Years | 26 (1.0%) | 8 (0.3%) |
| 65 to 74 Years | 6 (1.7%) | 12 (2.5%) |
| 75 Years and over | 35 (13.0%) | 51 (10.3%) |
Disability Class: Vision Difficulty
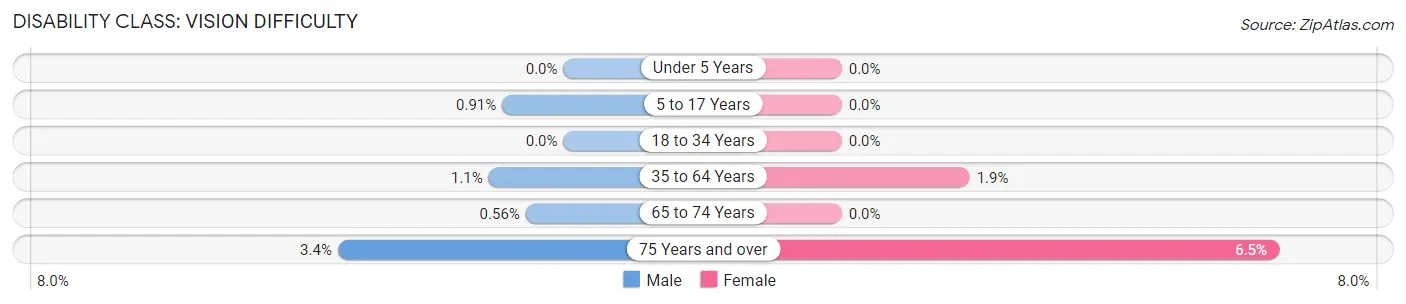
| Age Bracket | Male | Female |
| Under 5 Years | 0 (0.0%) | 0 (0.0%) |
| 5 to 17 Years | 10 (0.9%) | 0 (0.0%) |
| 18 to 34 Years | 0 (0.0%) | 0 (0.0%) |
| 35 to 64 Years | 28 (1.1%) | 55 (1.9%) |
| 65 to 74 Years | 2 (0.6%) | 0 (0.0%) |
| 75 Years and over | 9 (3.4%) | 32 (6.5%) |
Disability Class: Cognitive Difficulty
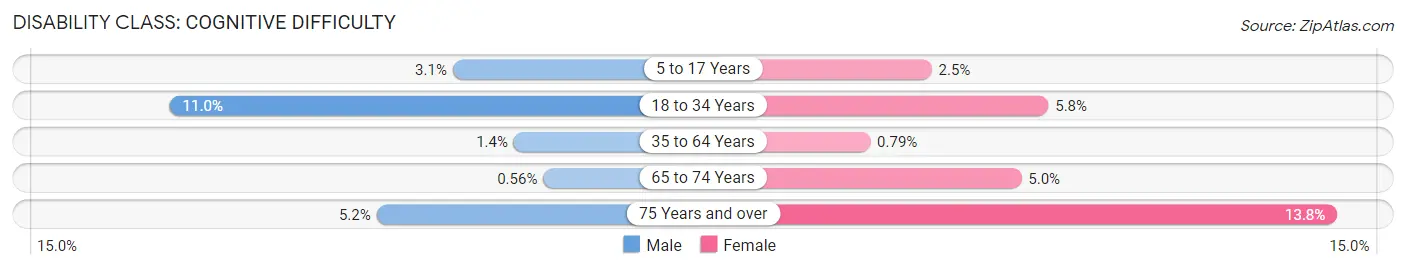
| Age Bracket | Male | Female |
| 5 to 17 Years | 34 (3.1%) | 18 (2.5%) |
| 18 to 34 Years | 139 (11.0%) | 69 (5.8%) |
| 35 to 64 Years | 35 (1.4%) | 23 (0.8%) |
| 65 to 74 Years | 2 (0.6%) | 24 (5.0%) |
| 75 Years and over | 14 (5.2%) | 68 (13.8%) |
Disability Class: Ambulatory Difficulty
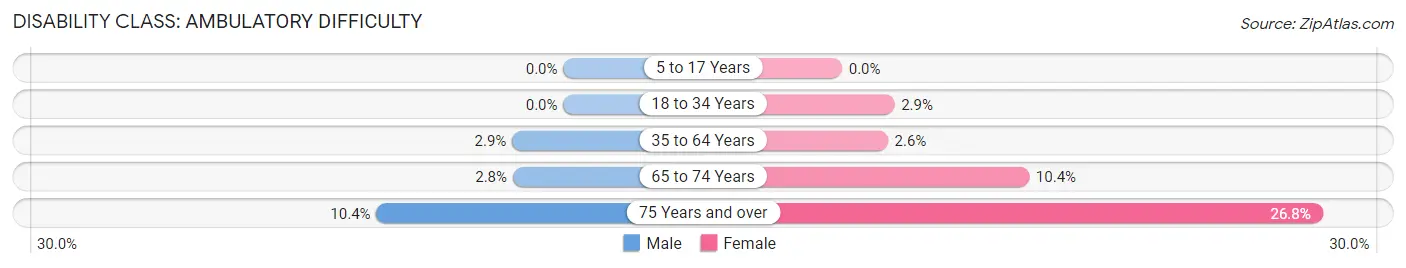
| Age Bracket | Male | Female |
| 5 to 17 Years | 0 (0.0%) | 0 (0.0%) |
| 18 to 34 Years | 0 (0.0%) | 35 (2.9%) |
| 35 to 64 Years | 72 (2.9%) | 74 (2.5%) |
| 65 to 74 Years | 10 (2.8%) | 50 (10.4%) |
| 75 Years and over | 28 (10.4%) | 132 (26.8%) |
Disability Class: Self-Care Difficulty
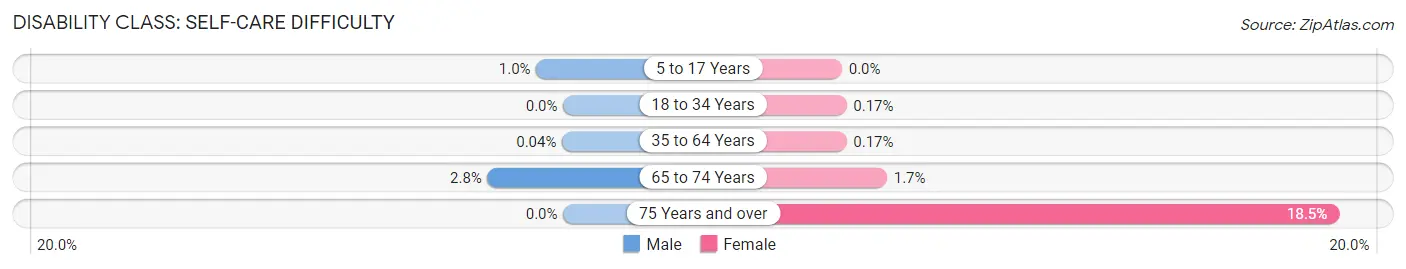
| Age Bracket | Male | Female |
| 5 to 17 Years | 11 (1.0%) | 0 (0.0%) |
| 18 to 34 Years | 0 (0.0%) | 2 (0.2%) |
| 35 to 64 Years | 1 (0.0%) | 5 (0.2%) |
| 65 to 74 Years | 10 (2.8%) | 8 (1.7%) |
| 75 Years and over | 0 (0.0%) | 91 (18.5%) |
Technology Access in Cascades
Computing Device Access in Cascades
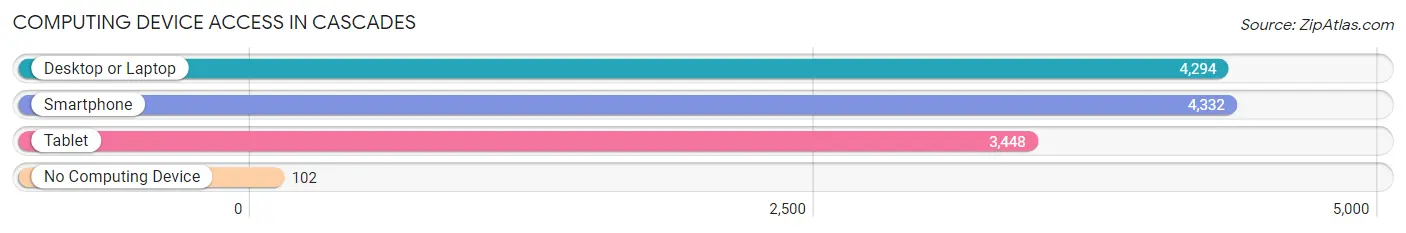
| Device Type | # Households | % Households |
| Desktop or Laptop | 4,294 | 92.8% |
| Smartphone | 4,332 | 93.6% |
| Tablet | 3,448 | 74.5% |
| No Computing Device | 102 | 2.2% |
| Total | 4,627 | 100.0% |
Internet Access in Cascades

| Internet Type | # Households | % Households |
| Dial-Up Internet | 0 | 0.0% |
| Broadband Home | 4,021 | 86.9% |
| Cellular Data Only | 360 | 7.8% |
| Satellite Internet | 130 | 2.8% |
| No Internet | 224 | 4.8% |
| Total | 4,627 | 100.0% |
Cascades Summary
Cascades, Virginia is a census-designated place located in Loudoun County, Virginia. It is situated in the foothills of the Blue Ridge Mountains, approximately 30 miles northwest of Washington, D.C. The population of Cascades was 8,945 at the 2010 census.
History
The area that is now Cascades was first settled in the late 1700s by German and English immigrants. The area was originally known as “The Cascades” due to the numerous waterfalls in the area. The area was primarily used for farming and timber production until the late 1800s when the railroad was built through the area. This allowed for the development of the area as a resort destination.
The area was officially incorporated as a town in 1891 and was named Cascades. The town was known for its mineral springs and was a popular destination for visitors from Washington, D.C. and other nearby cities. The town was also home to a number of resorts, including the Cascades Hotel, which was built in 1892.
In the early 1900s, the town began to decline as a resort destination and the population began to decline. The town was officially unincorporated in the 1950s and the population continued to decline until the late 1990s when the population began to increase again.
Geography
Cascades is located in the foothills of the Blue Ridge Mountains in Loudoun County, Virginia. The town is situated along the Potomac River and is approximately 30 miles northwest of Washington, D.C. The town is bordered by the towns of Purcellville, Hamilton, and Round Hill.
The terrain of Cascades is mostly hilly and is covered with forests and fields. The town is home to several creeks and streams, including the Catoctin Creek, which runs through the town.
Economy
The economy of Cascades is primarily based on tourism and agriculture. The town is home to several wineries and vineyards, as well as a number of small businesses. The town is also home to a number of historic sites, including the Cascades Hotel, which is listed on the National Register of Historic Places.
The town is also home to a number of technology companies, including the headquarters of the software company, Cascades Technologies.
Demographics
As of the 2010 census, the population of Cascades was 8,945. The racial makeup of the town was 87.3% White, 5.2% African American, 0.3% Native American, 2.2% Asian, 0.1% Pacific Islander, 2.2% from other races, and 2.9% from two or more races. Hispanic or Latino of any race were 5.2% of the population.
The median income for a household in Cascades was $90,945, and the median income for a family was $103,945. The per capita income for the town was $41,945. About 4.2% of families and 5.2% of the population were below the poverty line, including 6.2% of those under age 18 and 4.2% of those age 65 or over.
Common Questions
What is Per Capita Income in Cascades?
Per Capita income in Cascades is $66,606.
What is the Median Family Income in Cascades?
Median Family Income in Cascades is $183,273.
What is the Median Household income in Cascades?
Median Household Income in Cascades is $160,707.
What is Income or Wage Gap in Cascades?
Income or Wage Gap in Cascades is 36.9%.
Women in Cascades earn 63.1 cents for every dollar earned by a man.
What is Inequality or Gini Index in Cascades?
Inequality or Gini Index in Cascades is 0.36.
What is the Total Population of Cascades?
Total Population of Cascades is 12,542.
What is the Total Male Population of Cascades?
Total Male Population of Cascades is 6,310.
What is the Total Female Population of Cascades?
Total Female Population of Cascades is 6,232.
What is the Ratio of Males per 100 Females in Cascades?
There are 101.25 Males per 100 Females in Cascades.
What is the Ratio of Females per 100 Males in Cascades?
There are 98.76 Females per 100 Males in Cascades.
What is the Median Population Age in Cascades?
Median Population Age in Cascades is 39.1 Years.
What is the Average Family Size in Cascades
Average Family Size in Cascades is 3.3 People.
What is the Average Household Size in Cascades
Average Household Size in Cascades is 2.7 People.
How Large is the Labor Force in Cascades?
There are 7,319 People in the Labor Forcein in Cascades.
What is the Percentage of People in the Labor Force in Cascades?
74.7% of People are in the Labor Force in Cascades.
What is the Unemployment Rate in Cascades?
Unemployment Rate in Cascades is 3.8%.