Countryside, VA Map & Demographics
Countryside Map
Countryside Overview
$57,786
PER CAPITA INCOME
$172,250
AVG FAMILY INCOME
$132,295
AVG HOUSEHOLD INCOME
29.1%
WAGE / INCOME GAP [ % ]
70.9¢/ $1
WAGE / INCOME GAP [ $ ]
0.32
INEQUALITY / GINI INDEX
9,646
TOTAL POPULATION
4,745
MALE POPULATION
4,901
FEMALE POPULATION
96.82
MALES / 100 FEMALES
103.29
FEMALES / 100 MALES
35.7
MEDIAN AGE
3.3
AVG FAMILY SIZE
2.8
AVG HOUSEHOLD SIZE
5,824
LABOR FORCE [ PEOPLE ]
76.2%
PERCENT IN LABOR FORCE
3.1%
UNEMPLOYMENT RATE
Income in Countryside
Income Overview in Countryside
Per Capita Income in Countryside is $57,786, while median incomes of families and households are $172,250 and $132,295 respectively.
| Characteristic | Number | Measure |
| Per Capita Income | 9,646 | $57,786 |
| Median Family Income | 2,525 | $172,250 |
| Mean Family Income | 2,525 | $178,503 |
| Median Household Income | 3,454 | $132,295 |
| Mean Household Income | 3,454 | $156,377 |
| Income Deficit | 2,525 | $0 |
| Wage / Income Gap (%) | 9,646 | 29.05% |
| Wage / Income Gap ($) | 9,646 | 70.95¢ per $1 |
| Gini / Inequality Index | 9,646 | 0.32 |
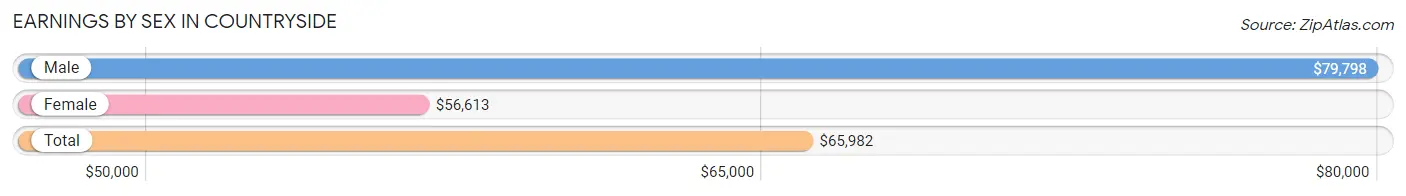
Earnings by Sex in Countryside
Average Earnings in Countryside are $65,982, $79,798 for men and $56,613 for women, a difference of 29.0%.
| Sex | Number | Average Earnings |
| Male | 3,290 (54.1%) | $79,798 |
| Female | 2,786 (45.9%) | $56,613 |
| Total | 6,076 (100.0%) | $65,982 |
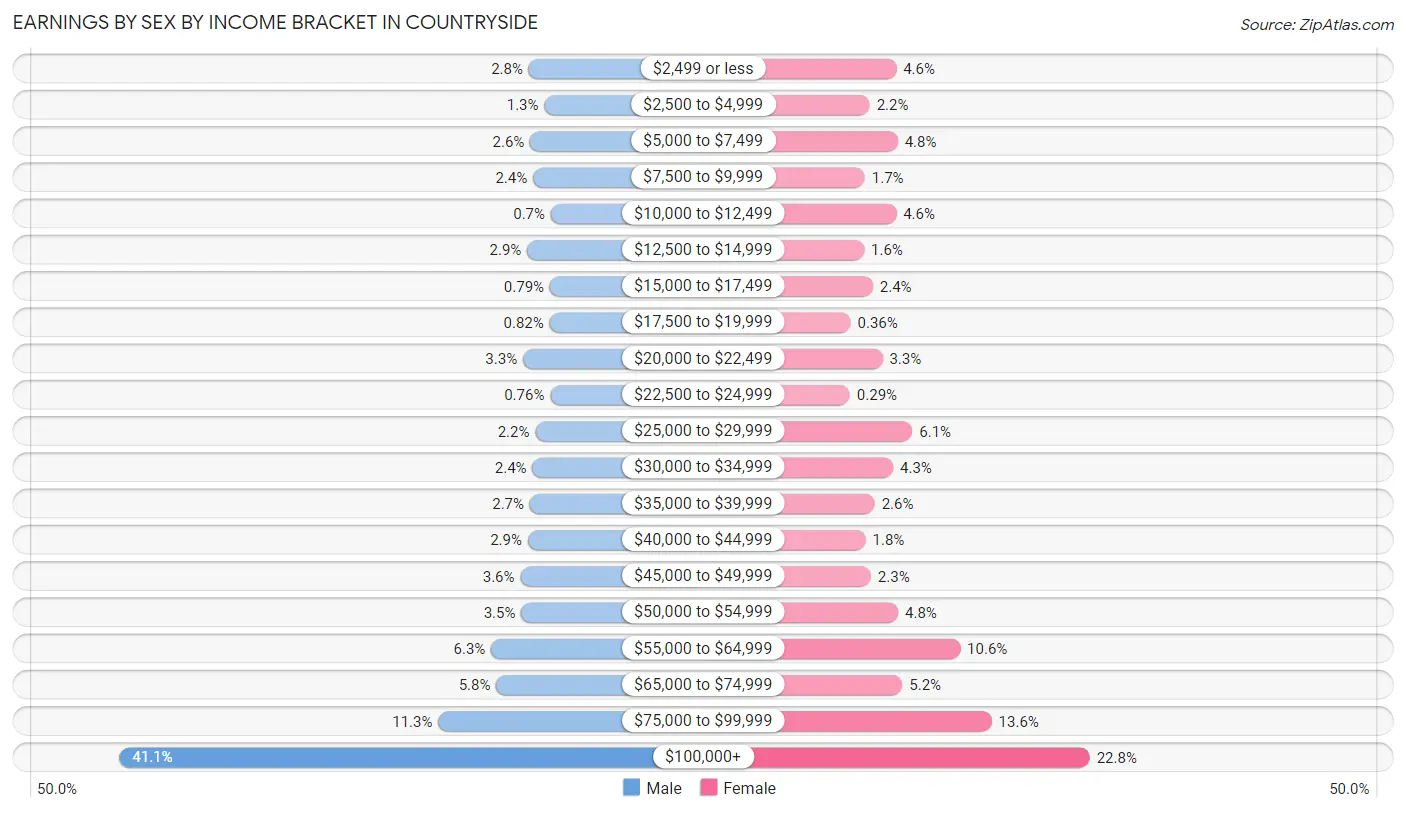
Earnings by Sex by Income Bracket in Countryside
The most common earnings brackets in Countryside are $100,000+ for men (1,353 | 41.1%) and $100,000+ for women (634 | 22.8%).
| Income | Male | Female |
| $2,499 or less | 91 (2.8%) | 129 (4.6%) |
| $2,500 to $4,999 | 43 (1.3%) | 60 (2.1%) |
| $5,000 to $7,499 | 87 (2.6%) | 133 (4.8%) |
| $7,500 to $9,999 | 78 (2.4%) | 47 (1.7%) |
| $10,000 to $12,499 | 23 (0.7%) | 129 (4.6%) |
| $12,500 to $14,999 | 96 (2.9%) | 45 (1.6%) |
| $15,000 to $17,499 | 26 (0.8%) | 68 (2.4%) |
| $17,500 to $19,999 | 27 (0.8%) | 10 (0.4%) |
| $20,000 to $22,499 | 109 (3.3%) | 93 (3.3%) |
| $22,500 to $24,999 | 25 (0.8%) | 8 (0.3%) |
| $25,000 to $29,999 | 71 (2.2%) | 171 (6.1%) |
| $30,000 to $34,999 | 80 (2.4%) | 121 (4.3%) |
| $35,000 to $39,999 | 88 (2.7%) | 73 (2.6%) |
| $40,000 to $44,999 | 94 (2.9%) | 49 (1.8%) |
| $45,000 to $49,999 | 117 (3.6%) | 63 (2.3%) |
| $50,000 to $54,999 | 114 (3.5%) | 134 (4.8%) |
| $55,000 to $64,999 | 207 (6.3%) | 296 (10.6%) |
| $65,000 to $74,999 | 191 (5.8%) | 145 (5.2%) |
| $75,000 to $99,999 | 370 (11.3%) | 378 (13.6%) |
| $100,000+ | 1,353 (41.1%) | 634 (22.8%) |
| Total | 3,290 (100.0%) | 2,786 (100.0%) |
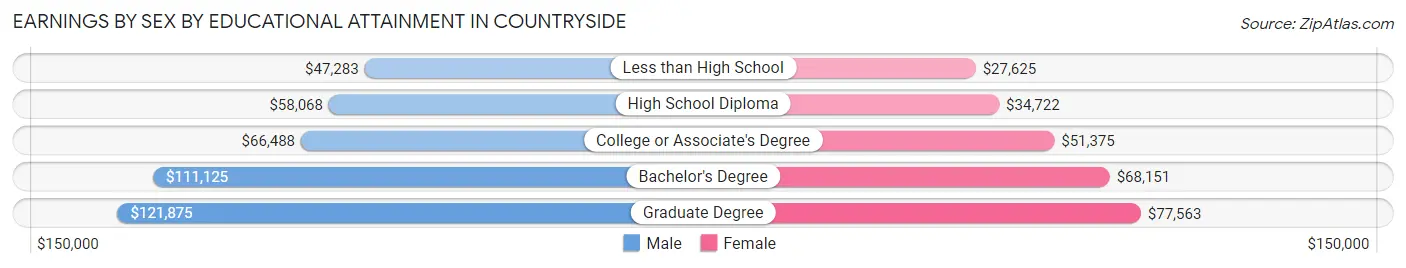
Earnings by Sex by Educational Attainment in Countryside
Average earnings in Countryside are $94,484 for men and $64,205 for women, a difference of 32.1%. Men with an educational attainment of graduate degree enjoy the highest average annual earnings of $121,875, while those with less than high school education earn the least with $47,283. Women with an educational attainment of graduate degree earn the most with the average annual earnings of $77,563, while those with less than high school education have the smallest earnings of $27,625.
| Educational Attainment | Male Income | Female Income |
| Less than High School | $47,283 | $27,625 |
| High School Diploma | $58,068 | $34,722 |
| College or Associate's Degree | $66,488 | $51,375 |
| Bachelor's Degree | $111,125 | $68,151 |
| Graduate Degree | $121,875 | $77,563 |
| Total | $94,484 | $64,205 |
Family Income in Countryside
Family Income Brackets in Countryside
According to the Countryside family income data, there are 949 families falling into the $200,000+ income range, which is the most common income bracket and makes up 37.6% of all families.
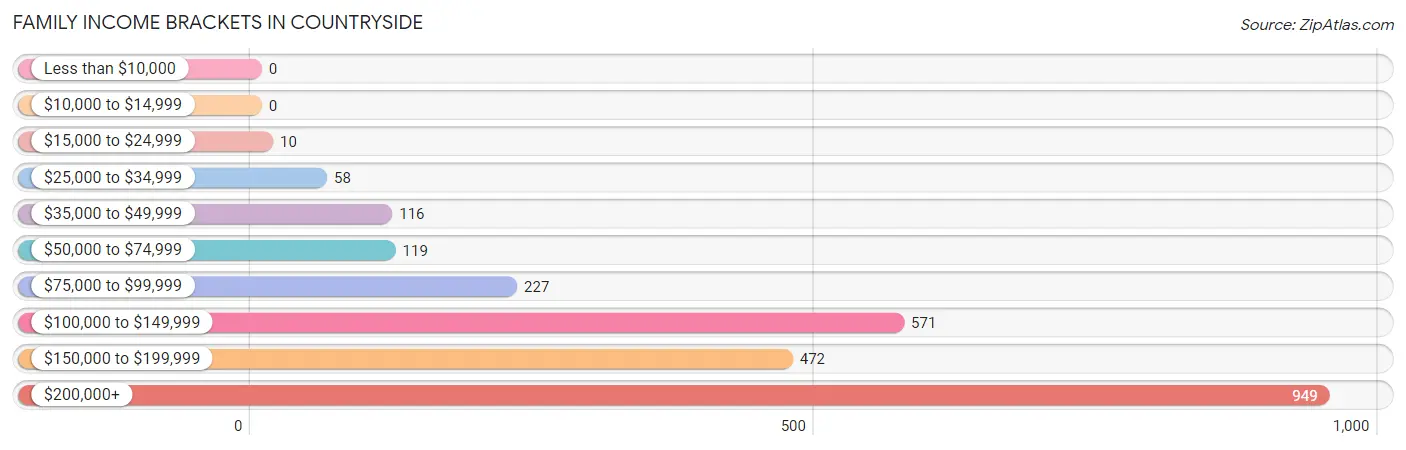
| Income Bracket | # Families | % Families |
| Less than $10,000 | 0 | 0.0% |
| $10,000 to $14,999 | 0 | 0.0% |
| $15,000 to $24,999 | 10 | 0.4% |
| $25,000 to $34,999 | 58 | 2.3% |
| $35,000 to $49,999 | 116 | 4.6% |
| $50,000 to $74,999 | 119 | 4.7% |
| $75,000 to $99,999 | 227 | 9.0% |
| $100,000 to $149,999 | 571 | 22.6% |
| $150,000 to $199,999 | 472 | 18.7% |
| $200,000+ | 949 | 37.6% |
Family Income by Famaliy Size in Countryside
4-person families (646 | 25.6%) account for the highest median family income in Countryside with $192,254 per family, while 2-person families (845 | 33.5%) have the highest median income of $63,724 per family member.
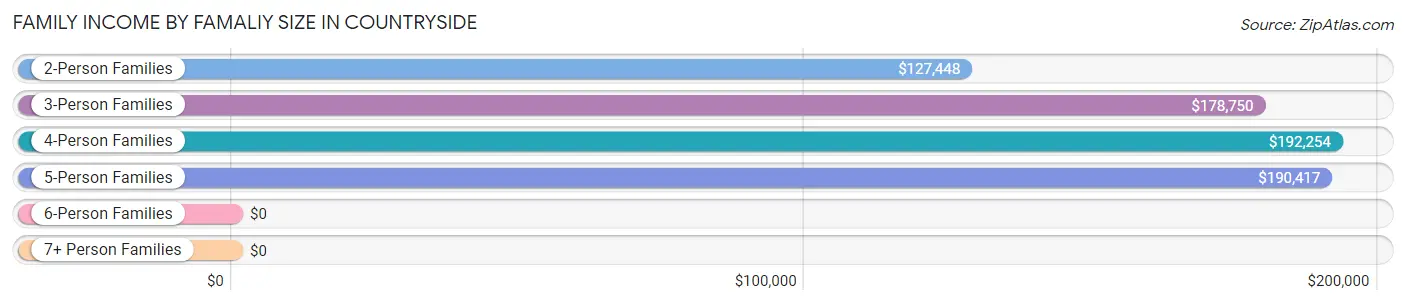
| Income Bracket | # Families | Median Income |
| 2-Person Families | 845 (33.5%) | $127,448 |
| 3-Person Families | 722 (28.6%) | $178,750 |
| 4-Person Families | 646 (25.6%) | $192,254 |
| 5-Person Families | 287 (11.4%) | $190,417 |
| 6-Person Families | 14 (0.5%) | $0 |
| 7+ Person Families | 11 (0.4%) | $0 |
| Total | 2,525 (100.0%) | $172,250 |
Family Income by Number of Earners in Countryside
The median family income in Countryside is $172,250, with families comprising 3+ earners (469) having the highest median family income of $197,592, while families with no earners (63) have the lowest median family income of $73,897, accounting for 18.6% and 2.5% of families, respectively.
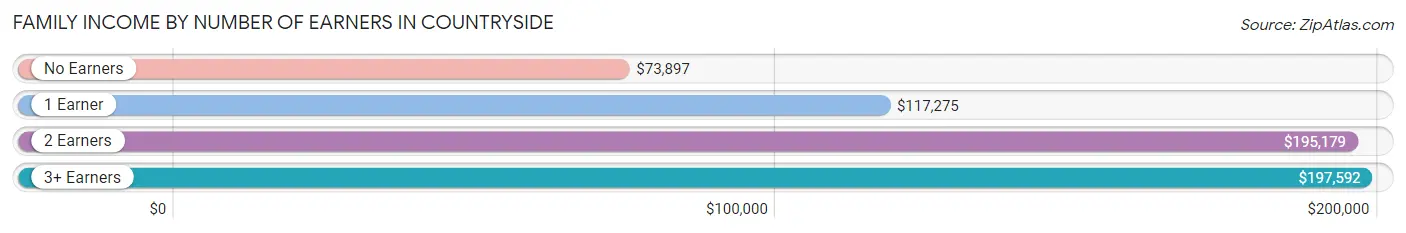
| Number of Earners | # Families | Median Income |
| No Earners | 63 (2.5%) | $73,897 |
| 1 Earner | 797 (31.6%) | $117,275 |
| 2 Earners | 1,196 (47.4%) | $195,179 |
| 3+ Earners | 469 (18.6%) | $197,592 |
| Total | 2,525 (100.0%) | $172,250 |
Household Income in Countryside
Household Income Brackets in Countryside
With 960 households falling in the category, the $200,000+ income range is the most frequent in Countryside, accounting for 27.8% of all households.
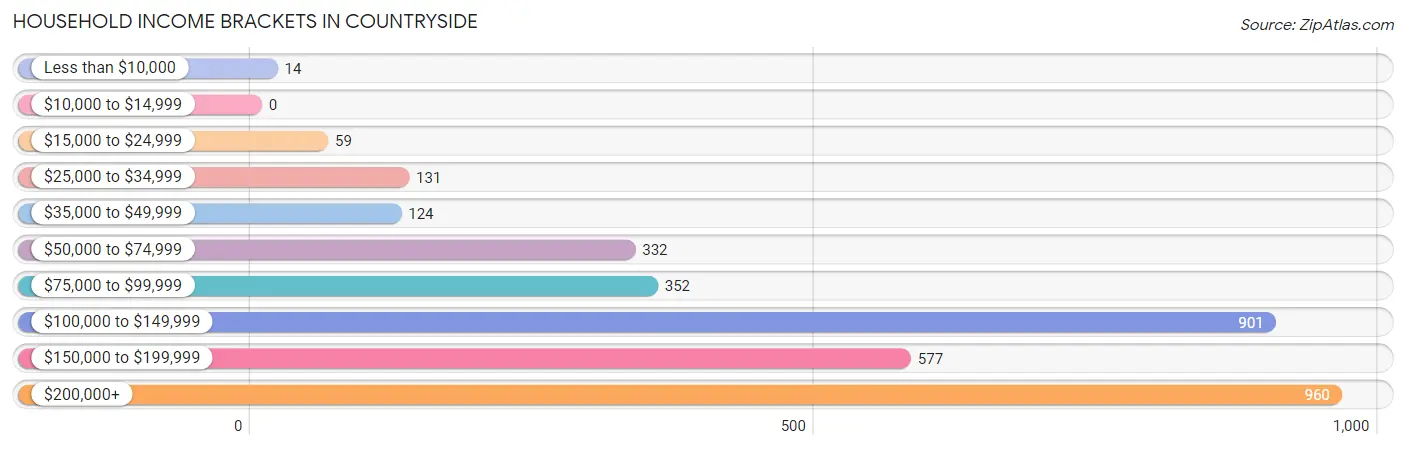
| Income Bracket | # Households | % Households |
| Less than $10,000 | 14 | 0.4% |
| $10,000 to $14,999 | 0 | 0.0% |
| $15,000 to $24,999 | 59 | 1.7% |
| $25,000 to $34,999 | 131 | 3.8% |
| $35,000 to $49,999 | 124 | 3.6% |
| $50,000 to $74,999 | 332 | 9.6% |
| $75,000 to $99,999 | 352 | 10.2% |
| $100,000 to $149,999 | 901 | 26.1% |
| $150,000 to $199,999 | 577 | 16.7% |
| $200,000+ | 960 | 27.8% |
Household Income by Householder Age in Countryside
The median household income in Countryside is $132,295, with the highest median household income of $149,474 found in the 25 to 44 years age bracket for the primary householder. A total of 1,346 households (39.0%) fall into this category. Meanwhile, the 15 to 24 years age bracket for the primary householder has the lowest median household income of $99,167, with 50 households (1.5%) in this group.
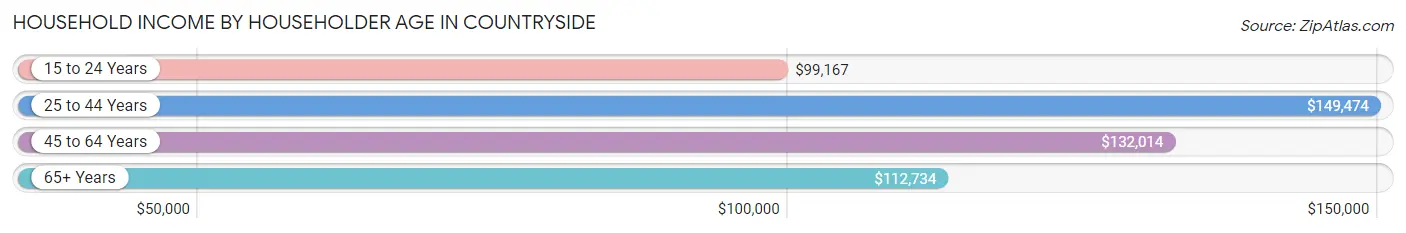
| Income Bracket | # Households | Median Income |
| 15 to 24 Years | 50 (1.5%) | $99,167 |
| 25 to 44 Years | 1,346 (39.0%) | $149,474 |
| 45 to 64 Years | 1,507 (43.6%) | $132,014 |
| 65+ Years | 551 (16.0%) | $112,734 |
| Total | 3,454 (100.0%) | $132,295 |
Poverty in Countryside
Income Below Poverty by Sex and Age in Countryside
With 2.3% poverty level for males and 2.7% for females among the residents of Countryside, 18 to 24 year old males and 45 to 54 year old females are the most vulnerable to poverty, with 66 males (16.8%) and 62 females (8.1%) in their respective age groups living below the poverty level.
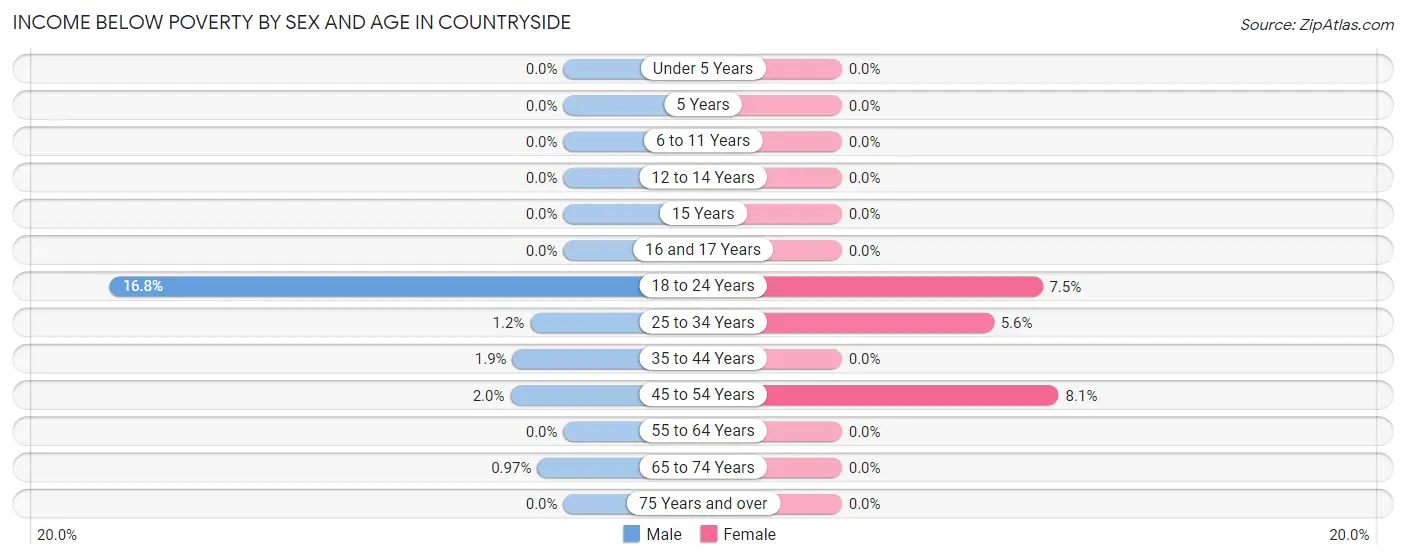
| Age Bracket | Male | Female |
| Under 5 Years | 0 (0.0%) | 0 (0.0%) |
| 5 Years | 0 (0.0%) | 0 (0.0%) |
| 6 to 11 Years | 0 (0.0%) | 0 (0.0%) |
| 12 to 14 Years | 0 (0.0%) | 0 (0.0%) |
| 15 Years | 0 (0.0%) | 0 (0.0%) |
| 16 and 17 Years | 0 (0.0%) | 0 (0.0%) |
| 18 to 24 Years | 66 (16.8%) | 28 (7.4%) |
| 25 to 34 Years | 10 (1.2%) | 42 (5.6%) |
| 35 to 44 Years | 14 (1.9%) | 0 (0.0%) |
| 45 to 54 Years | 15 (2.0%) | 62 (8.1%) |
| 55 to 64 Years | 0 (0.0%) | 0 (0.0%) |
| 65 to 74 Years | 3 (1.0%) | 0 (0.0%) |
| 75 Years and over | 0 (0.0%) | 0 (0.0%) |
| Total | 108 (2.3%) | 132 (2.7%) |
Income Above Poverty by Sex and Age in Countryside
According to the poverty statistics in Countryside, males aged under 5 years and females aged under 5 years are the age groups that are most secure financially, with 100.0% of males and 100.0% of females in these age groups living above the poverty line.
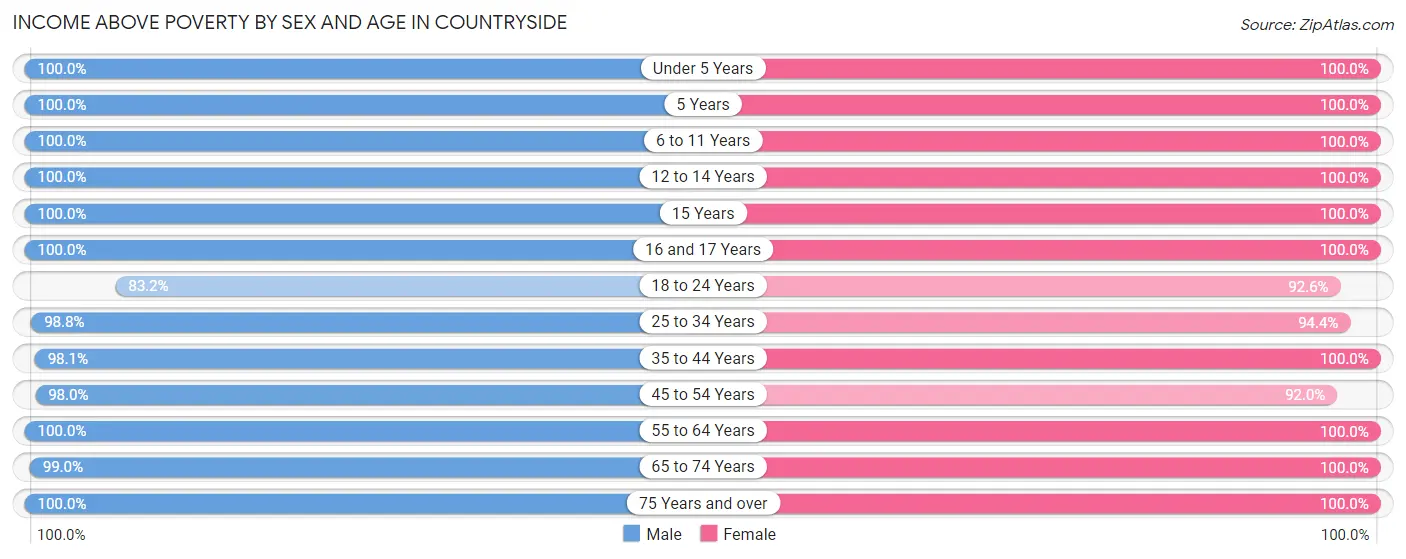
| Age Bracket | Male | Female |
| Under 5 Years | 326 (100.0%) | 485 (100.0%) |
| 5 Years | 53 (100.0%) | 33 (100.0%) |
| 6 to 11 Years | 389 (100.0%) | 278 (100.0%) |
| 12 to 14 Years | 103 (100.0%) | 192 (100.0%) |
| 15 Years | 72 (100.0%) | 23 (100.0%) |
| 16 and 17 Years | 200 (100.0%) | 147 (100.0%) |
| 18 to 24 Years | 326 (83.2%) | 348 (92.5%) |
| 25 to 34 Years | 800 (98.8%) | 703 (94.4%) |
| 35 to 44 Years | 728 (98.1%) | 700 (100.0%) |
| 45 to 54 Years | 748 (98.0%) | 708 (91.9%) |
| 55 to 64 Years | 459 (100.0%) | 502 (100.0%) |
| 65 to 74 Years | 306 (99.0%) | 512 (100.0%) |
| 75 Years and over | 111 (100.0%) | 105 (100.0%) |
| Total | 4,621 (97.7%) | 4,736 (97.3%) |
Income Below Poverty Among Married-Couple Families in Countryside
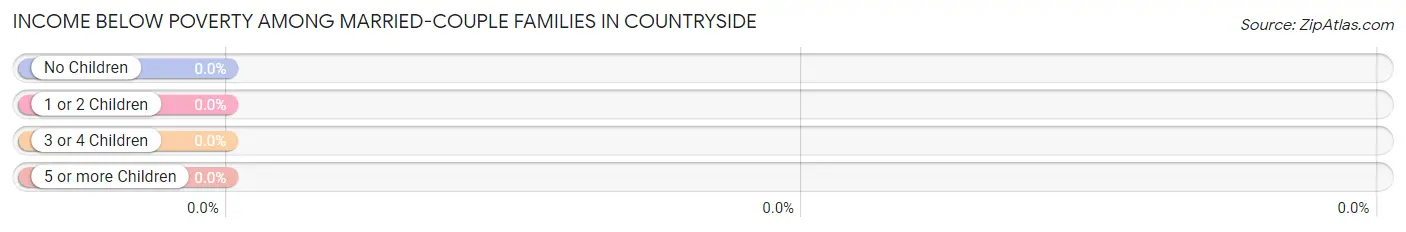
| Children | Above Poverty | Below Poverty |
| No Children | 890 (100.0%) | 0 (0.0%) |
| 1 or 2 Children | 971 (100.0%) | 0 (0.0%) |
| 3 or 4 Children | 97 (100.0%) | 0 (0.0%) |
| 5 or more Children | 0 (0.0%) | 0 (0.0%) |
| Total | 1,958 (100.0%) | 0 (0.0%) |
Income Below Poverty Among Single-Parent Households in Countryside
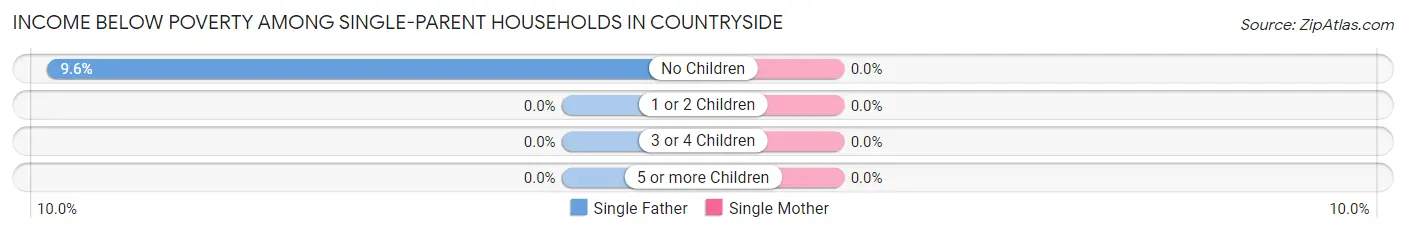
| Children | Single Father | Single Mother |
| No Children | 11 (9.6%) | 0 (0.0%) |
| 1 or 2 Children | 0 (0.0%) | 0 (0.0%) |
| 3 or 4 Children | 0 (0.0%) | 0 (0.0%) |
| 5 or more Children | 0 (0.0%) | 0 (0.0%) |
| Total | 11 (4.1%) | 0 (0.0%) |
Income Below Poverty Among Married-Couple vs Single-Parent Households in Countryside
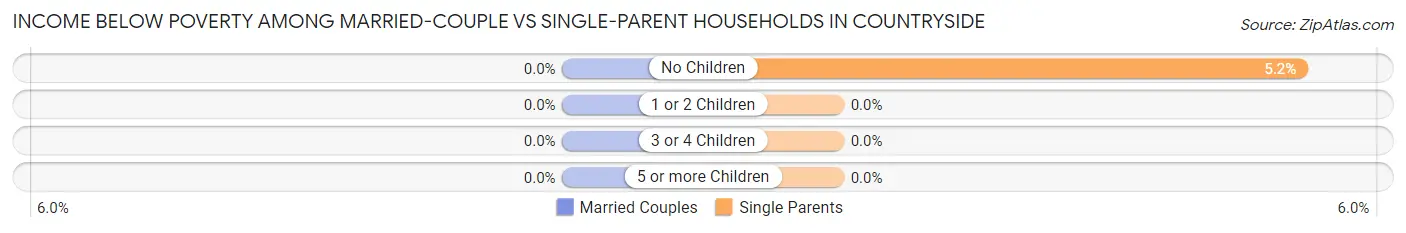
| Children | Married-Couple Families | Single-Parent Households |
| No Children | 0 (0.0%) | 11 (5.2%) |
| 1 or 2 Children | 0 (0.0%) | 0 (0.0%) |
| 3 or 4 Children | 0 (0.0%) | 0 (0.0%) |
| 5 or more Children | 0 (0.0%) | 0 (0.0%) |
| Total | 0 (0.0%) | 11 (1.9%) |
Race in Countryside
The most populous races in Countryside are White / Caucasian (6,080 | 63.0%), Hispanic or Latino (1,733 | 18.0%), and Black / African American (1,189 | 12.3%).
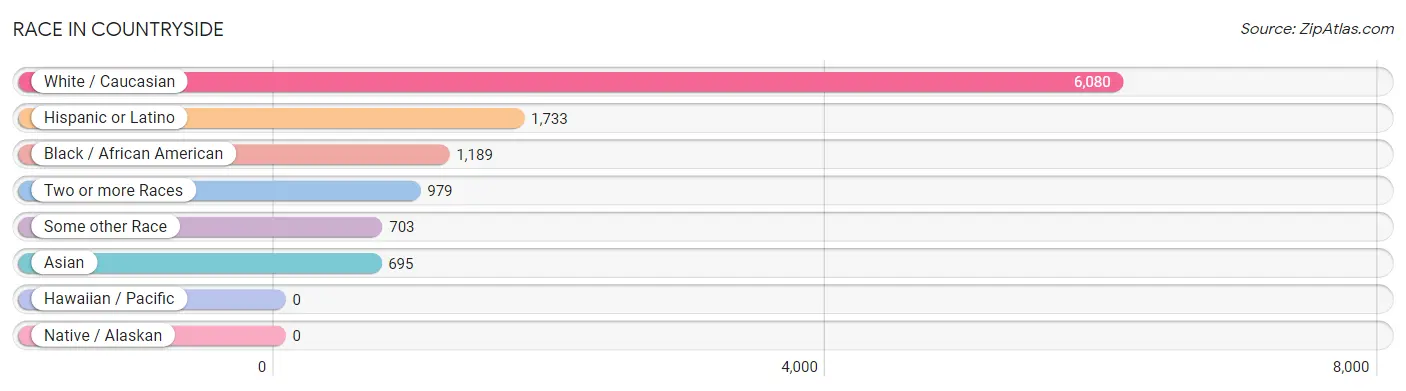
| Race | # Population | % Population |
| Asian | 695 | 7.2% |
| Black / African American | 1,189 | 12.3% |
| Hawaiian / Pacific | 0 | 0.0% |
| Hispanic or Latino | 1,733 | 18.0% |
| Native / Alaskan | 0 | 0.0% |
| White / Caucasian | 6,080 | 63.0% |
| Two or more Races | 979 | 10.2% |
| Some other Race | 703 | 7.3% |
| Total | 9,646 | 100.0% |
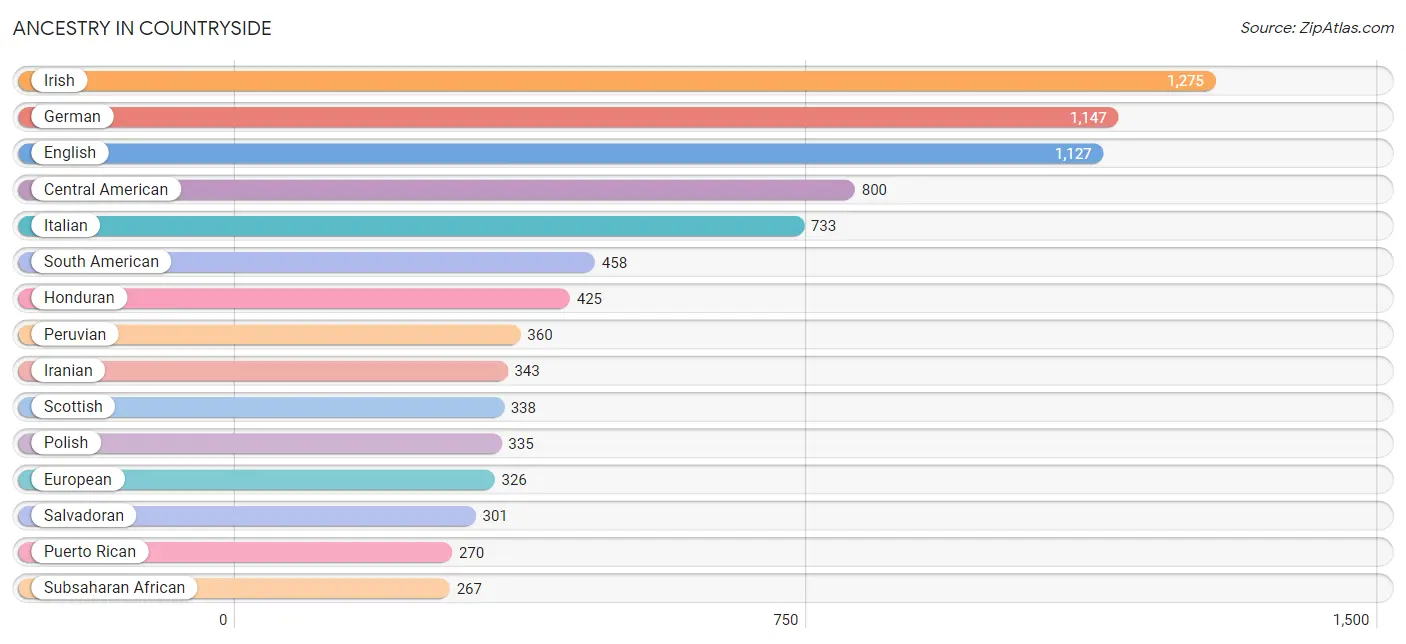
Ancestry in Countryside
The most populous ancestries reported in Countryside are Irish (1,275 | 13.2%), German (1,147 | 11.9%), English (1,127 | 11.7%), Central American (800 | 8.3%), and Italian (733 | 7.6%), together accounting for 52.7% of all Countryside residents.
| Ancestry | # Population | % Population |
| Afghan | 55 | 0.6% |
| African | 211 | 2.2% |
| Albanian | 26 | 0.3% |
| American | 235 | 2.4% |
| Arab | 54 | 0.6% |
| Armenian | 26 | 0.3% |
| Austrian | 45 | 0.5% |
| Bhutanese | 47 | 0.5% |
| Bolivian | 44 | 0.5% |
| Brazilian | 8 | 0.1% |
| British | 84 | 0.9% |
| Burmese | 24 | 0.3% |
| Cajun | 50 | 0.5% |
| Central American | 800 | 8.3% |
| Central American Indian | 7 | 0.1% |
| Cherokee | 54 | 0.6% |
| Colombian | 42 | 0.4% |
| Czech | 28 | 0.3% |
| Danish | 36 | 0.4% |
| Dominican | 16 | 0.2% |
| Dutch | 203 | 2.1% |
| English | 1,127 | 11.7% |
| European | 326 | 3.4% |
| French | 186 | 1.9% |
| French Canadian | 17 | 0.2% |
| German | 1,147 | 11.9% |
| Guatemalan | 13 | 0.1% |
| Honduran | 425 | 4.4% |
| Hungarian | 18 | 0.2% |
| Indian (Asian) | 81 | 0.8% |
| Indonesian | 34 | 0.4% |
| Iranian | 343 | 3.6% |
| Irish | 1,275 | 13.2% |
| Italian | 733 | 7.6% |
| Jamaican | 14 | 0.2% |
| Korean | 237 | 2.5% |
| Liberian | 7 | 0.1% |
| Macedonian | 5 | 0.1% |
| Malaysian | 108 | 1.1% |
| Mexican | 116 | 1.2% |
| Native Hawaiian | 47 | 0.5% |
| Nicaraguan | 53 | 0.5% |
| Nigerian | 49 | 0.5% |
| Norwegian | 59 | 0.6% |
| Pakistani | 67 | 0.7% |
| Panamanian | 8 | 0.1% |
| Peruvian | 360 | 3.7% |
| Polish | 335 | 3.5% |
| Portuguese | 34 | 0.4% |
| Puerto Rican | 270 | 2.8% |
| Russian | 113 | 1.2% |
| Salvadoran | 301 | 3.1% |
| Samoan | 10 | 0.1% |
| Scandinavian | 73 | 0.8% |
| Scotch-Irish | 63 | 0.6% |
| Scottish | 338 | 3.5% |
| Slovak | 21 | 0.2% |
| South American | 458 | 4.8% |
| Spaniard | 11 | 0.1% |
| Sri Lankan | 129 | 1.3% |
| Subsaharan African | 267 | 2.8% |
| Swedish | 134 | 1.4% |
| Thai | 155 | 1.6% |
| Ukrainian | 25 | 0.3% |
| Venezuelan | 12 | 0.1% |
| Vietnamese | 38 | 0.4% |
| Welsh | 138 | 1.4% | View All 67 Rows |
Immigrants in Countryside
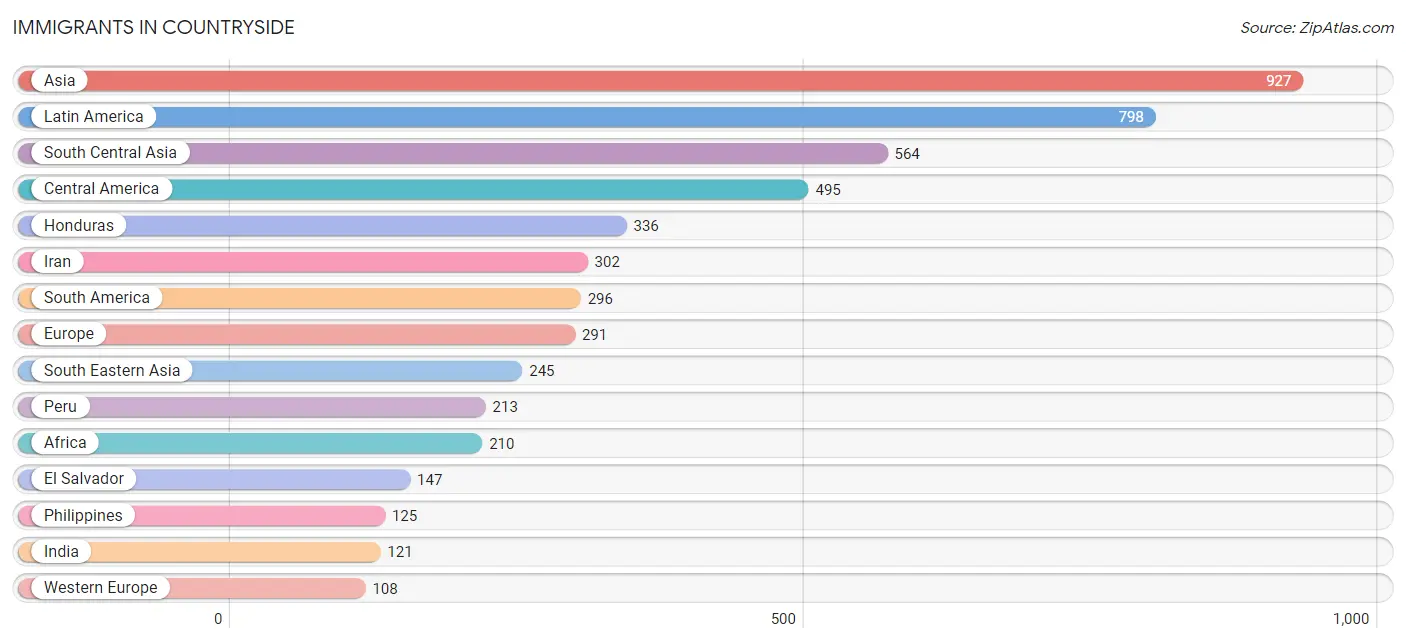
The most numerous immigrant groups reported in Countryside came from Asia (927 | 9.6%), Latin America (798 | 8.3%), South Central Asia (564 | 5.9%), Central America (495 | 5.1%), and Honduras (336 | 3.5%), together accounting for 32.3% of all Countryside residents.
| Immigration Origin | # Population | % Population |
| Afghanistan | 55 | 0.6% |
| Africa | 210 | 2.2% |
| Albania | 26 | 0.3% |
| Asia | 927 | 9.6% |
| Bangladesh | 51 | 0.5% |
| Belarus | 18 | 0.2% |
| Bolivia | 3 | 0.0% |
| Brazil | 23 | 0.2% |
| Caribbean | 7 | 0.1% |
| Central America | 495 | 5.1% |
| China | 64 | 0.7% |
| Colombia | 35 | 0.4% |
| Dominican Republic | 7 | 0.1% |
| Eastern Africa | 21 | 0.2% |
| Eastern Asia | 64 | 0.7% |
| Eastern Europe | 57 | 0.6% |
| El Salvador | 147 | 1.5% |
| England | 65 | 0.7% |
| Ethiopia | 21 | 0.2% |
| Europe | 291 | 3.0% |
| Germany | 59 | 0.6% |
| Greece | 15 | 0.2% |
| Guyana | 10 | 0.1% |
| Honduras | 336 | 3.5% |
| Hong Kong | 11 | 0.1% |
| India | 121 | 1.3% |
| Iran | 302 | 3.1% |
| Iraq | 54 | 0.6% |
| Italy | 33 | 0.3% |
| Kazakhstan | 27 | 0.3% |
| Latin America | 798 | 8.3% |
| Middle Africa | 66 | 0.7% |
| Netherlands | 49 | 0.5% |
| Nicaragua | 4 | 0.0% |
| Nigeria | 27 | 0.3% |
| Northern Africa | 44 | 0.5% |
| Northern Europe | 65 | 0.7% |
| Panama | 8 | 0.1% |
| Peru | 213 | 2.2% |
| Philippines | 125 | 1.3% |
| Portugal | 13 | 0.1% |
| Russia | 13 | 0.1% |
| Senegal | 52 | 0.5% |
| South America | 296 | 3.1% |
| South Central Asia | 564 | 5.9% |
| South Eastern Asia | 245 | 2.5% |
| Southern Europe | 61 | 0.6% |
| Sudan | 44 | 0.5% |
| Taiwan | 53 | 0.5% |
| Thailand | 39 | 0.4% |
| Uzbekistan | 8 | 0.1% |
| Venezuela | 12 | 0.1% |
| Vietnam | 47 | 0.5% |
| Western Africa | 79 | 0.8% |
| Western Asia | 54 | 0.6% |
| Western Europe | 108 | 1.1% |
| Zaire | 66 | 0.7% | View All 57 Rows |
Sex and Age in Countryside
Sex and Age in Countryside
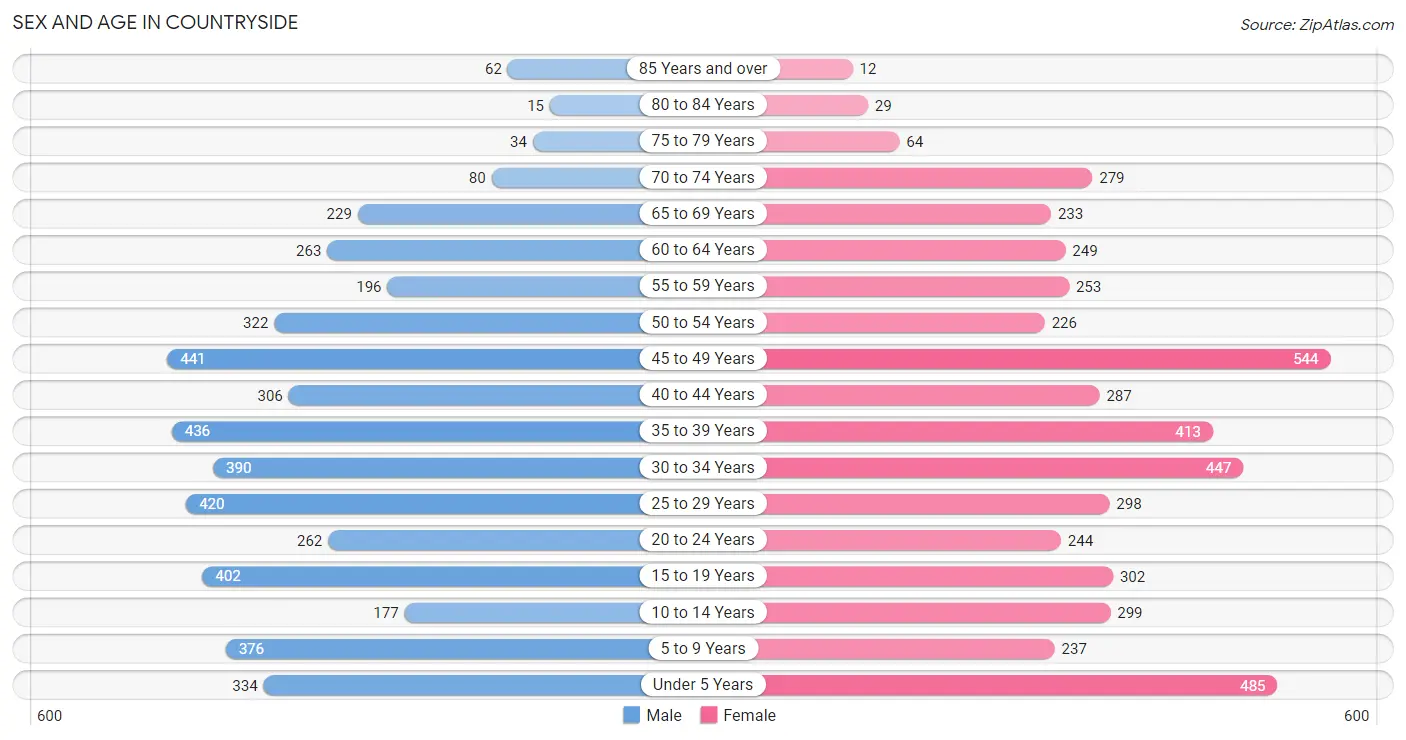
The most populous age groups in Countryside are 45 to 49 Years (441 | 9.3%) for men and 45 to 49 Years (544 | 11.1%) for women.
| Age Bracket | Male | Female |
| Under 5 Years | 334 (7.0%) | 485 (9.9%) |
| 5 to 9 Years | 376 (7.9%) | 237 (4.8%) |
| 10 to 14 Years | 177 (3.7%) | 299 (6.1%) |
| 15 to 19 Years | 402 (8.5%) | 302 (6.2%) |
| 20 to 24 Years | 262 (5.5%) | 244 (5.0%) |
| 25 to 29 Years | 420 (8.8%) | 298 (6.1%) |
| 30 to 34 Years | 390 (8.2%) | 447 (9.1%) |
| 35 to 39 Years | 436 (9.2%) | 413 (8.4%) |
| 40 to 44 Years | 306 (6.5%) | 287 (5.9%) |
| 45 to 49 Years | 441 (9.3%) | 544 (11.1%) |
| 50 to 54 Years | 322 (6.8%) | 226 (4.6%) |
| 55 to 59 Years | 196 (4.1%) | 253 (5.2%) |
| 60 to 64 Years | 263 (5.5%) | 249 (5.1%) |
| 65 to 69 Years | 229 (4.8%) | 233 (4.8%) |
| 70 to 74 Years | 80 (1.7%) | 279 (5.7%) |
| 75 to 79 Years | 34 (0.7%) | 64 (1.3%) |
| 80 to 84 Years | 15 (0.3%) | 29 (0.6%) |
| 85 Years and over | 62 (1.3%) | 12 (0.2%) |
| Total | 4,745 (100.0%) | 4,901 (100.0%) |
Families and Households in Countryside
Median Family Size in Countryside
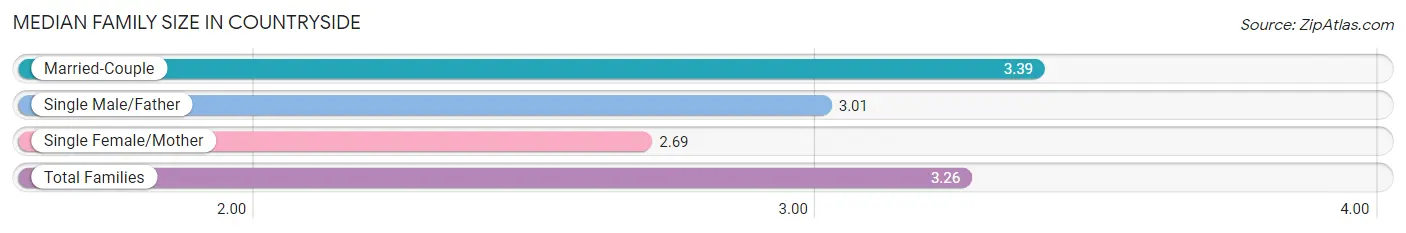
The median family size in Countryside is 3.26 persons per family, with married-couple families (1,958 | 77.5%) accounting for the largest median family size of 3.39 persons per family. On the other hand, single female/mother families (297 | 11.8%) represent the smallest median family size with 2.69 persons per family.
| Family Type | # Families | Family Size |
| Married-Couple | 1,958 (77.5%) | 3.39 |
| Single Male/Father | 270 (10.7%) | 3.01 |
| Single Female/Mother | 297 (11.8%) | 2.69 |
| Total Families | 2,525 (100.0%) | 3.26 |
Median Household Size in Countryside
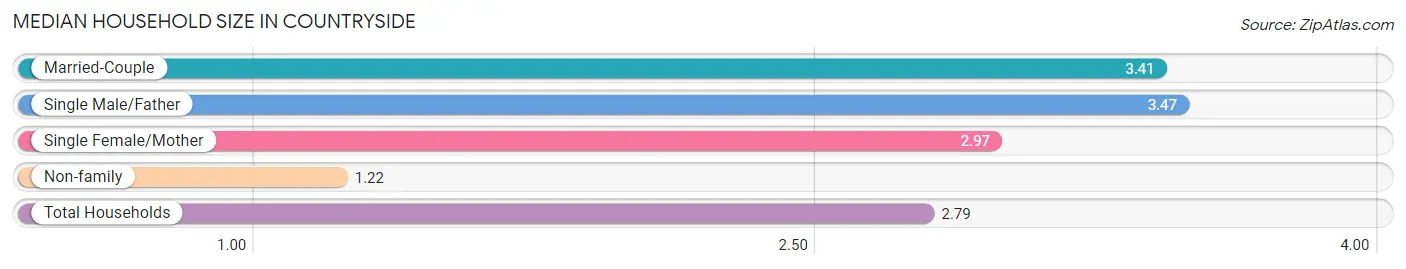
The median household size in Countryside is 2.79 persons per household, with single male/father households (270 | 7.8%) accounting for the largest median household size of 3.47 persons per household. non-family households (929 | 26.9%) represent the smallest median household size with 1.22 persons per household.
| Household Type | # Households | Household Size |
| Married-Couple | 1,958 (56.7%) | 3.41 |
| Single Male/Father | 270 (7.8%) | 3.47 |
| Single Female/Mother | 297 (8.6%) | 2.97 |
| Non-family | 929 (26.9%) | 1.22 |
| Total Households | 3,454 (100.0%) | 2.79 |
Household Size by Marriage Status in Countryside
Out of a total of 3,454 households in Countryside, 2,525 (73.1%) are family households, while 929 (26.9%) are nonfamily households. The most numerous type of family households are 2-person households, comprising 796, and the most common type of nonfamily households are 1-person households, comprising 784.
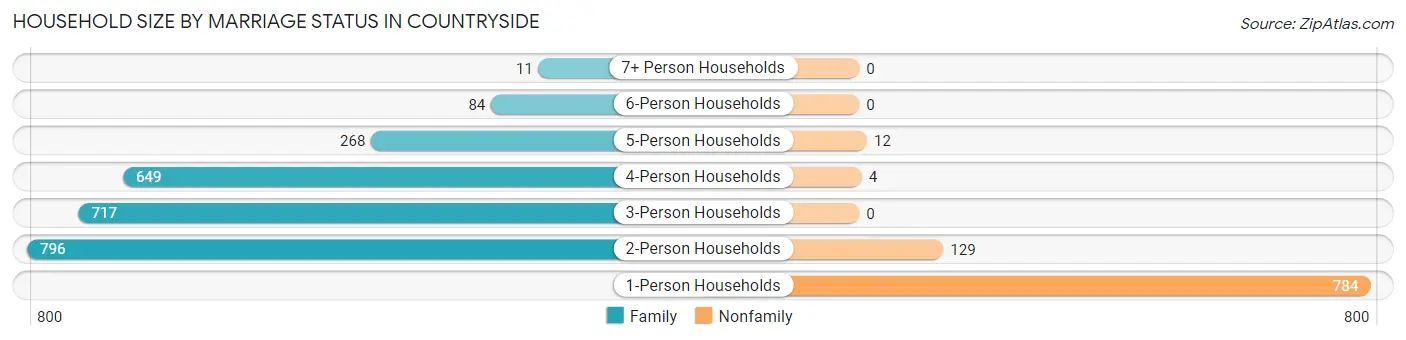
| Household Size | Family Households | Nonfamily Households |
| 1-Person Households | - | 784 (22.7%) |
| 2-Person Households | 796 (23.1%) | 129 (3.7%) |
| 3-Person Households | 717 (20.8%) | 0 (0.0%) |
| 4-Person Households | 649 (18.8%) | 4 (0.1%) |
| 5-Person Households | 268 (7.8%) | 12 (0.4%) |
| 6-Person Households | 84 (2.4%) | 0 (0.0%) |
| 7+ Person Households | 11 (0.3%) | 0 (0.0%) |
| Total | 2,525 (73.1%) | 929 (26.9%) |
Female Fertility in Countryside
Fertility by Age in Countryside
Average fertility rate in Countryside is 76.0 births per 1,000 women. Women in the age bracket of 20 to 34 years have the highest fertility rate with 160.0 births per 1,000 women. Women in the age bracket of 20 to 34 years acount for 81.0% of all women with births.
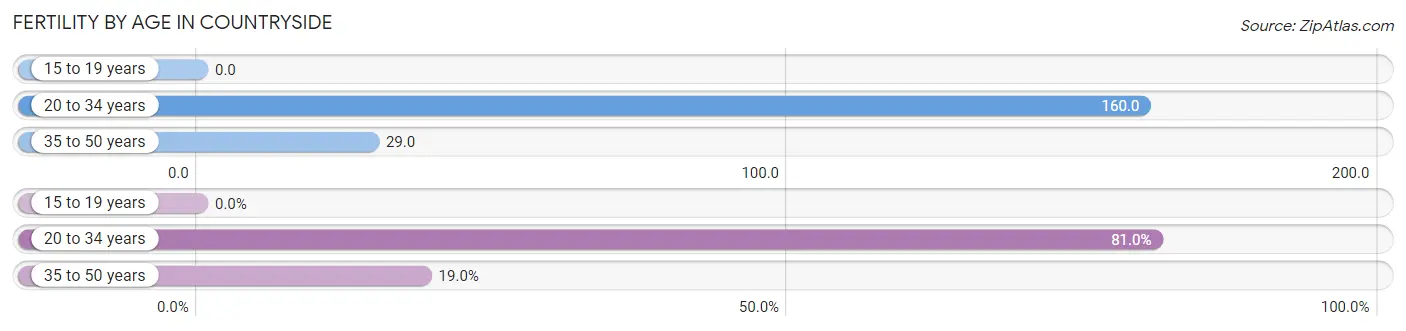
| Age Bracket | Women with Births | Births / 1,000 Women |
| 15 to 19 years | 0 (0.0%) | 0.0 |
| 20 to 34 years | 158 (81.0%) | 160.0 |
| 35 to 50 years | 37 (19.0%) | 29.0 |
| Total | 195 (100.0%) | 76.0 |
Fertility by Age by Marriage Status in Countryside
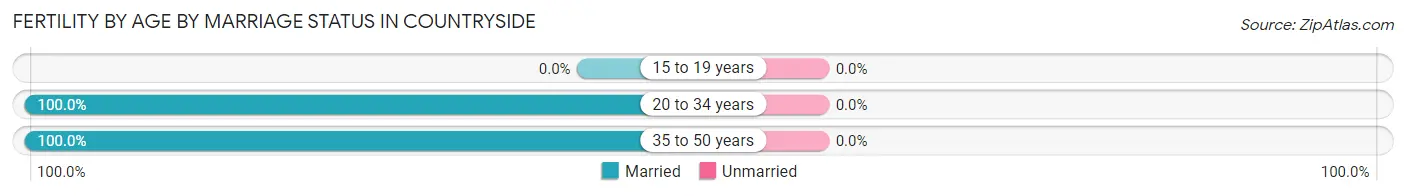
| Age Bracket | Married | Unmarried |
| 15 to 19 years | 0 (0.0%) | 0 (0.0%) |
| 20 to 34 years | 158 (100.0%) | 0 (0.0%) |
| 35 to 50 years | 37 (100.0%) | 0 (0.0%) |
| Total | 195 (100.0%) | 0 (0.0%) |
Fertility by Education in Countryside
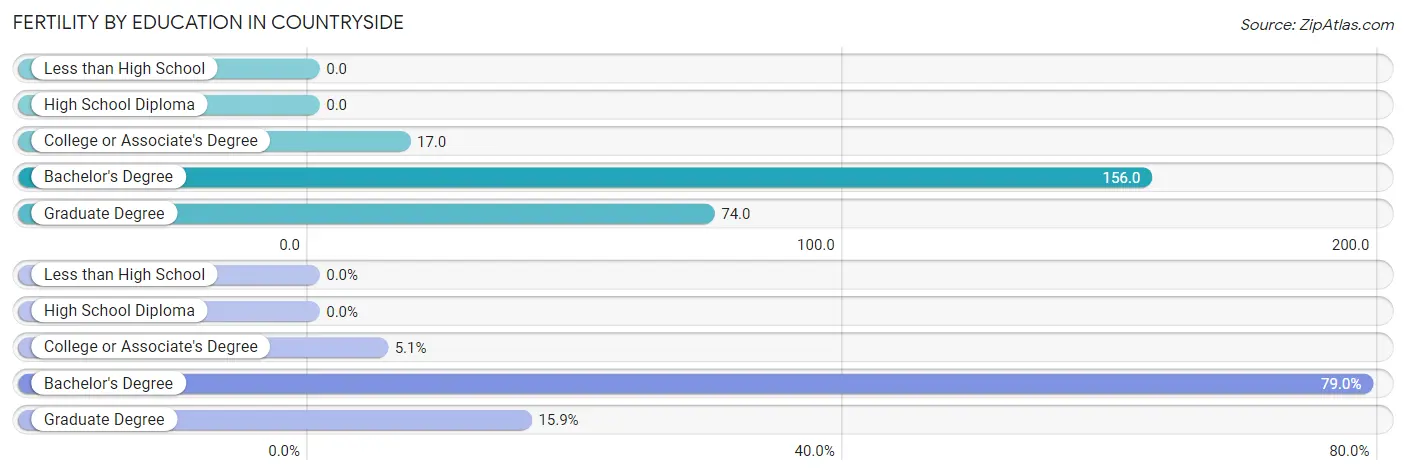
| Educational Attainment | Women with Births | Births / 1,000 Women |
| Less than High School | 0 (0.0%) | 0.0 |
| High School Diploma | 0 (0.0%) | 0.0 |
| College or Associate's Degree | 10 (5.1%) | 17.0 |
| Bachelor's Degree | 154 (79.0%) | 156.0 |
| Graduate Degree | 31 (15.9%) | 74.0 |
| Total | 195 (100.0%) | 76.0 |
Fertility by Education by Marriage Status in Countryside
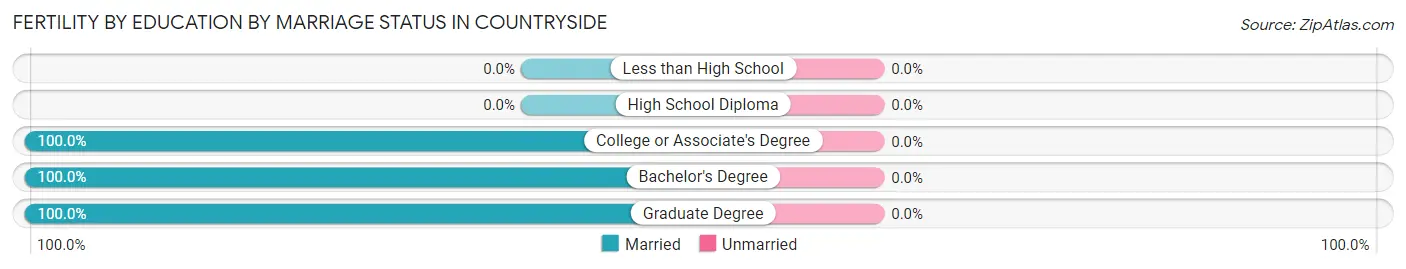
| Educational Attainment | Married | Unmarried |
| Less than High School | 0 (0.0%) | 0 (0.0%) |
| High School Diploma | 0 (0.0%) | 0 (0.0%) |
| College or Associate's Degree | 10 (100.0%) | 0 (0.0%) |
| Bachelor's Degree | 154 (100.0%) | 0 (0.0%) |
| Graduate Degree | 31 (100.0%) | 0 (0.0%) |
| Total | 195 (100.0%) | 0 (0.0%) |
Employment Characteristics in Countryside
Employment by Class of Employer in Countryside
Among the 5,484 employed individuals in Countryside, private company employees (3,332 | 60.8%), not-for-profit organizations (627 | 11.4%), and federal government employees (568 | 10.4%) make up the most common classes of employment.
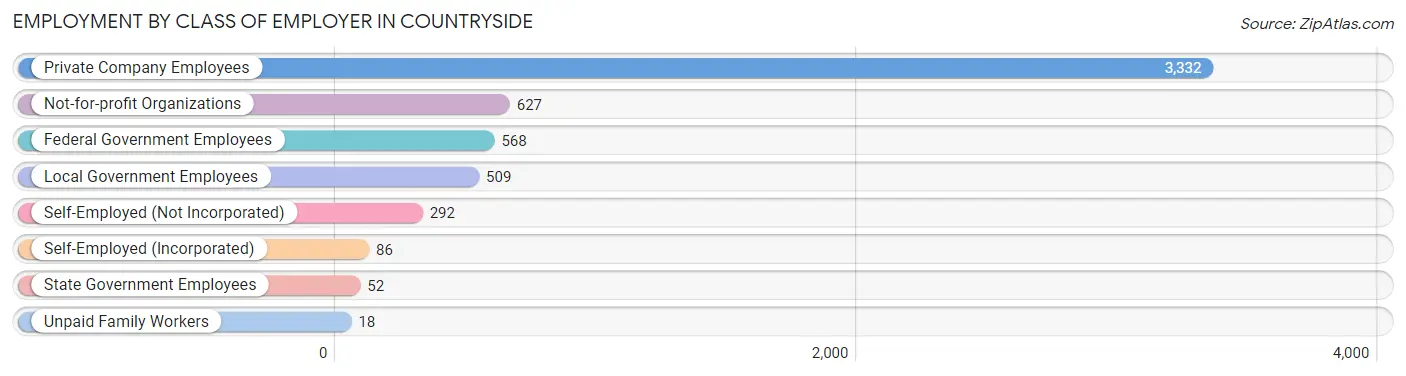
| Employer Class | # Employees | % Employees |
| Private Company Employees | 3,332 | 60.8% |
| Self-Employed (Incorporated) | 86 | 1.6% |
| Self-Employed (Not Incorporated) | 292 | 5.3% |
| Not-for-profit Organizations | 627 | 11.4% |
| Local Government Employees | 509 | 9.3% |
| State Government Employees | 52 | 0.9% |
| Federal Government Employees | 568 | 10.4% |
| Unpaid Family Workers | 18 | 0.3% |
| Total | 5,484 | 100.0% |
Employment Status by Age in Countryside
According to the labor force statistics for Countryside, out of the total population over 16 years of age (7,643), 76.2% or 5,824 individuals are in the labor force, with 3.1% or 181 of them unemployed. The age group with the highest labor force participation rate is 35 to 44 years, with 94.6% or 1,364 individuals in the labor force. Within the labor force, the 16 to 19 years age range has the highest percentage of unemployed individuals, with 15.3% or 40 of them being unemployed.
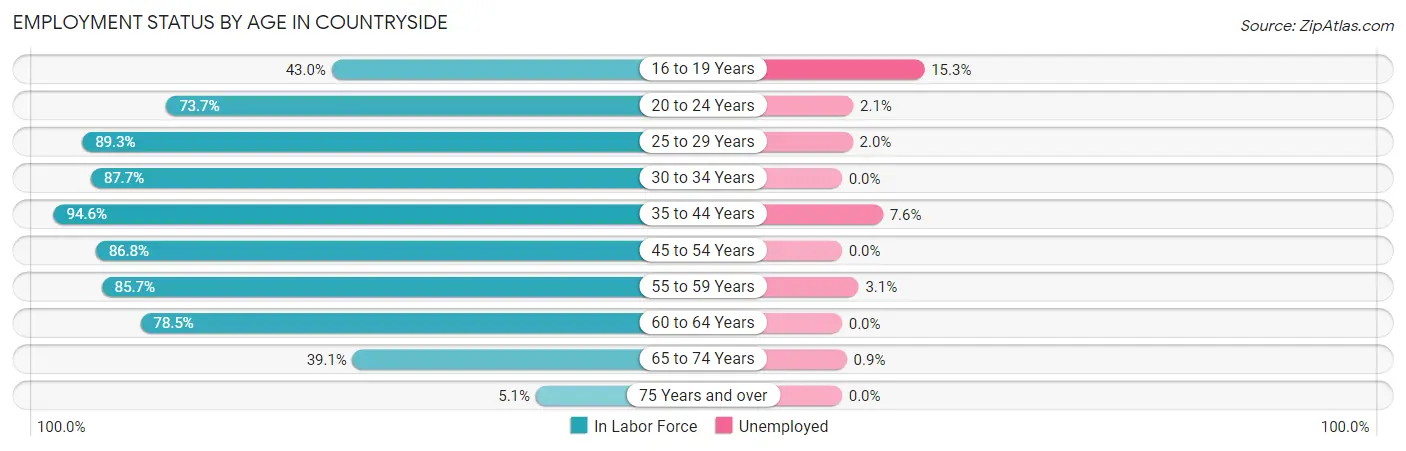
| Age Bracket | In Labor Force | Unemployed |
| 16 to 19 Years | 262 (43.0%) | 40 (15.3%) |
| 20 to 24 Years | 373 (73.7%) | 8 (2.1%) |
| 25 to 29 Years | 641 (89.3%) | 13 (2.0%) |
| 30 to 34 Years | 734 (87.7%) | 0 (0.0%) |
| 35 to 44 Years | 1,364 (94.6%) | 104 (7.6%) |
| 45 to 54 Years | 1,331 (86.8%) | 0 (0.0%) |
| 55 to 59 Years | 385 (85.7%) | 12 (3.1%) |
| 60 to 64 Years | 402 (78.5%) | 0 (0.0%) |
| 65 to 74 Years | 321 (39.1%) | 3 (0.9%) |
| 75 Years and over | 11 (5.1%) | 0 (0.0%) |
| Total | 5,824 (76.2%) | 181 (3.1%) |
Employment Status by Educational Attainment in Countryside
According to labor force statistics for Countryside, 88.4% of individuals (4,854) out of the total population between 25 and 64 years of age (5,491) are in the labor force, with 2.6% or 126 of them being unemployed. The group with the highest labor force participation rate are those with the educational attainment of less than high school, with 95.3% or 222 individuals in the labor force. Within the labor force, individuals with less than high school education have the highest percentage of unemployment, with 5.4% or 12 of them being unemployed.
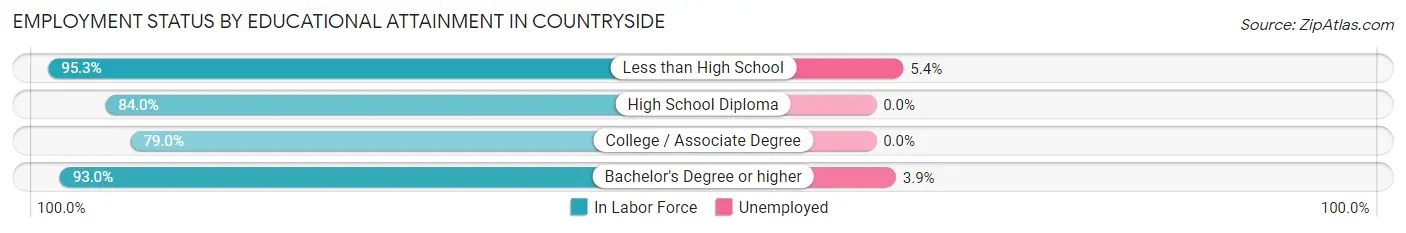
| Educational Attainment | In Labor Force | Unemployed |
| Less than High School | 222 (95.3%) | 13 (5.4%) |
| High School Diploma | 429 (84.0%) | 0 (0.0%) |
| College / Associate Degree | 1,194 (79.0%) | 0 (0.0%) |
| Bachelor's Degree or higher | 3,009 (93.0%) | 126 (3.9%) |
| Total | 4,854 (88.4%) | 143 (2.6%) |
Employment Occupations by Sex in Countryside
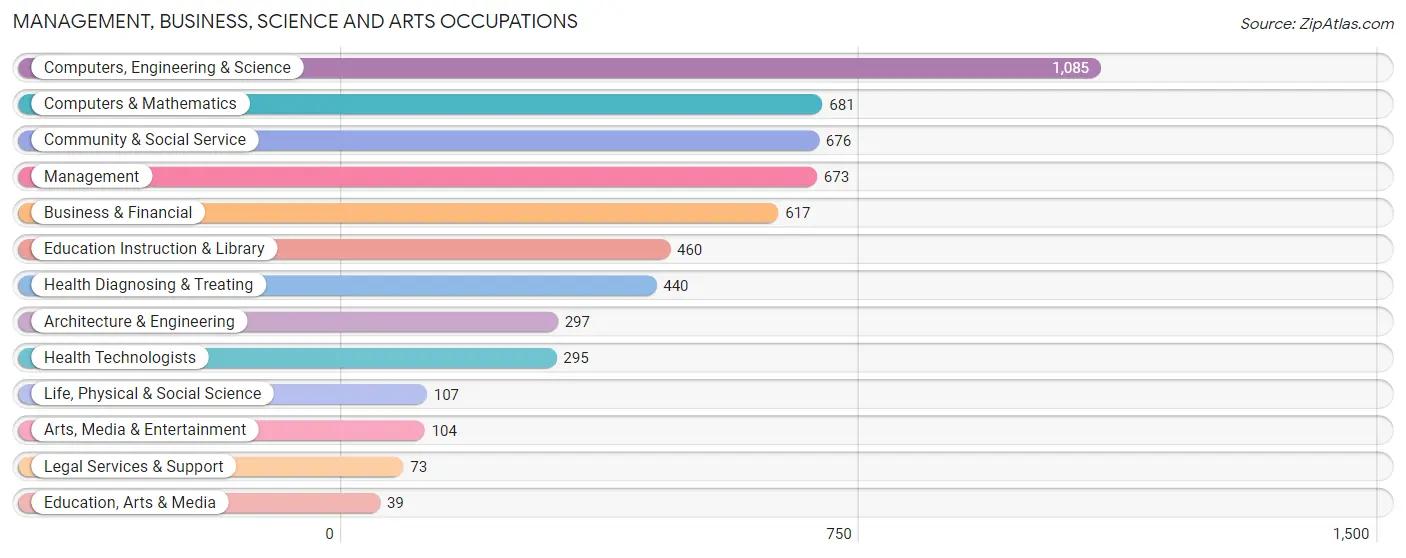
Management, Business, Science and Arts Occupations
The most common Management, Business, Science and Arts occupations in Countryside are Computers, Engineering & Science (1,085 | 19.2%), Computers & Mathematics (681 | 12.1%), Community & Social Service (676 | 12.0%), Management (673 | 11.9%), and Business & Financial (617 | 10.9%).
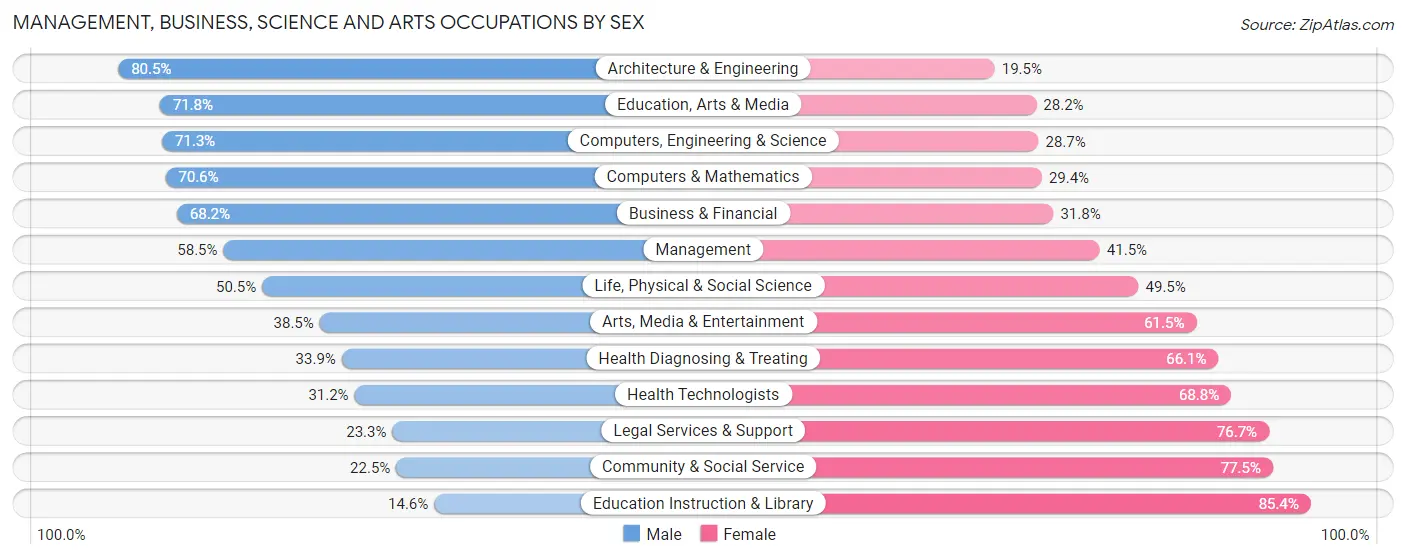
Management, Business, Science and Arts Occupations by Sex
Within the Management, Business, Science and Arts occupations in Countryside, the most male-oriented occupations are Architecture & Engineering (80.5%), Education, Arts & Media (71.8%), and Computers, Engineering & Science (71.3%), while the most female-oriented occupations are Education Instruction & Library (85.4%), Community & Social Service (77.5%), and Legal Services & Support (76.7%).
| Occupation | Male | Female |
| Management | 394 (58.5%) | 279 (41.5%) |
| Business & Financial | 421 (68.2%) | 196 (31.8%) |
| Computers, Engineering & Science | 774 (71.3%) | 311 (28.7%) |
| Computers & Mathematics | 481 (70.6%) | 200 (29.4%) |
| Architecture & Engineering | 239 (80.5%) | 58 (19.5%) |
| Life, Physical & Social Science | 54 (50.5%) | 53 (49.5%) |
| Community & Social Service | 152 (22.5%) | 524 (77.5%) |
| Education, Arts & Media | 28 (71.8%) | 11 (28.2%) |
| Legal Services & Support | 17 (23.3%) | 56 (76.7%) |
| Education Instruction & Library | 67 (14.6%) | 393 (85.4%) |
| Arts, Media & Entertainment | 40 (38.5%) | 64 (61.5%) |
| Health Diagnosing & Treating | 149 (33.9%) | 291 (66.1%) |
| Health Technologists | 92 (31.2%) | 203 (68.8%) |
| Total (Category) | 1,890 (54.1%) | 1,601 (45.9%) |
| Total (Overall) | 3,090 (54.7%) | 2,554 (45.3%) |
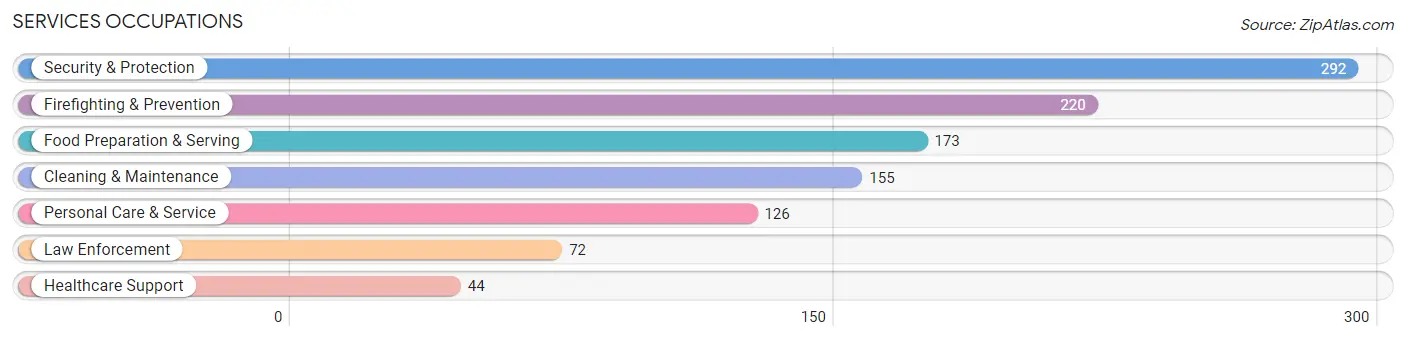
Services Occupations
The most common Services occupations in Countryside are Security & Protection (292 | 5.2%), Firefighting & Prevention (220 | 3.9%), Food Preparation & Serving (173 | 3.1%), Cleaning & Maintenance (155 | 2.8%), and Personal Care & Service (126 | 2.2%).
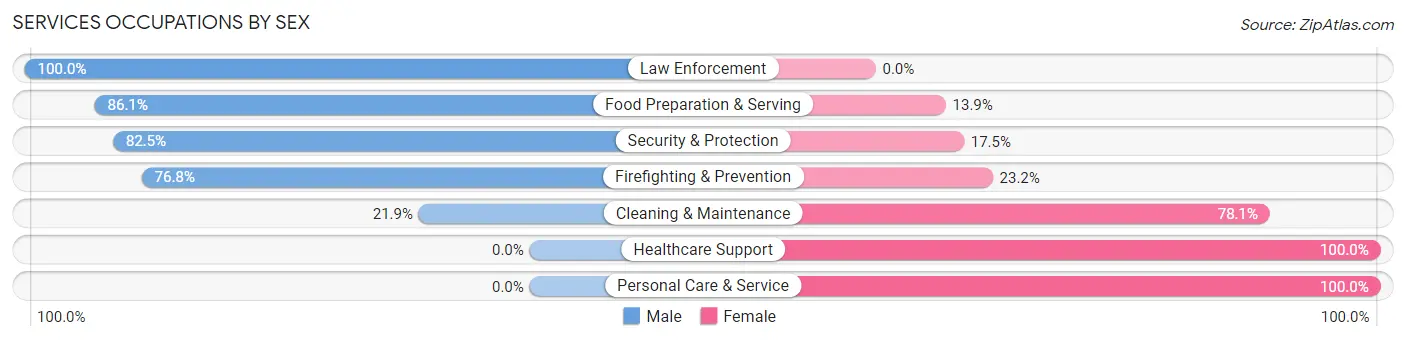
Services Occupations by Sex
Within the Services occupations in Countryside, the most male-oriented occupations are Law Enforcement (100.0%), Food Preparation & Serving (86.1%), and Security & Protection (82.5%), while the most female-oriented occupations are Healthcare Support (100.0%), Personal Care & Service (100.0%), and Cleaning & Maintenance (78.1%).
| Occupation | Male | Female |
| Healthcare Support | 0 (0.0%) | 44 (100.0%) |
| Security & Protection | 241 (82.5%) | 51 (17.5%) |
| Firefighting & Prevention | 169 (76.8%) | 51 (23.2%) |
| Law Enforcement | 72 (100.0%) | 0 (0.0%) |
| Food Preparation & Serving | 149 (86.1%) | 24 (13.9%) |
| Cleaning & Maintenance | 34 (21.9%) | 121 (78.1%) |
| Personal Care & Service | 0 (0.0%) | 126 (100.0%) |
| Total (Category) | 424 (53.7%) | 366 (46.3%) |
| Total (Overall) | 3,090 (54.7%) | 2,554 (45.3%) |
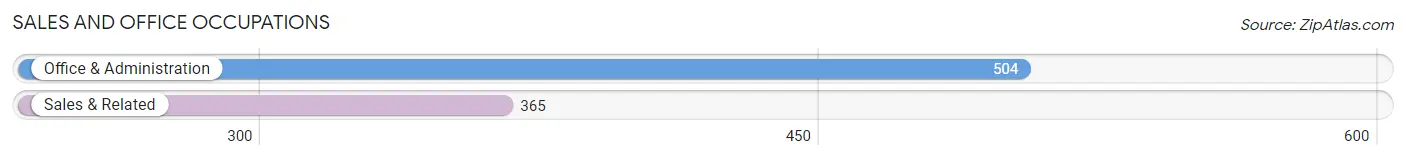
Sales and Office Occupations
The most common Sales and Office occupations in Countryside are Office & Administration (504 | 8.9%), and Sales & Related (365 | 6.5%).
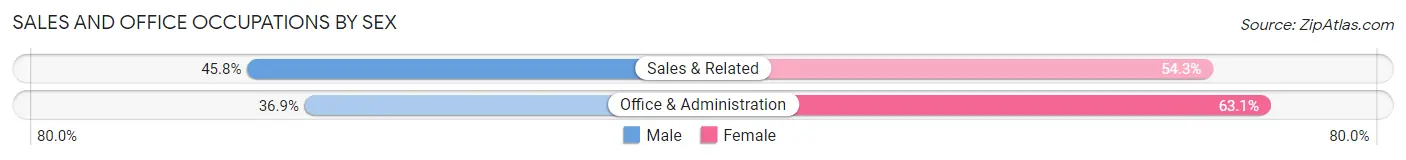
Sales and Office Occupations by Sex
| Occupation | Male | Female |
| Sales & Related | 167 (45.8%) | 198 (54.2%) |
| Office & Administration | 186 (36.9%) | 318 (63.1%) |
| Total (Category) | 353 (40.6%) | 516 (59.4%) |
| Total (Overall) | 3,090 (54.7%) | 2,554 (45.3%) |
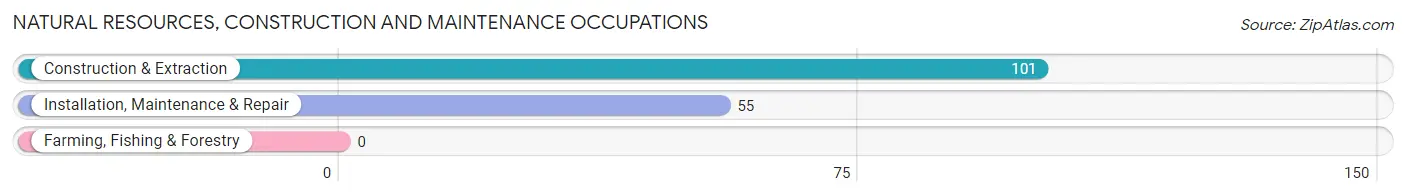
Natural Resources, Construction and Maintenance Occupations
The most common Natural Resources, Construction and Maintenance occupations in Countryside are Construction & Extraction (101 | 1.8%), and Installation, Maintenance & Repair (55 | 1.0%).
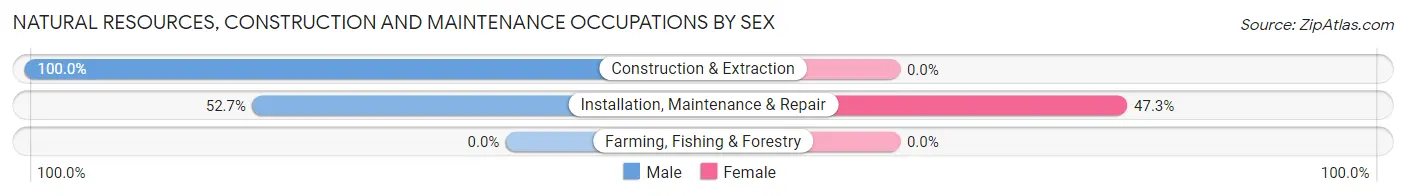
Natural Resources, Construction and Maintenance Occupations by Sex
| Occupation | Male | Female |
| Farming, Fishing & Forestry | 0 (0.0%) | 0 (0.0%) |
| Construction & Extraction | 101 (100.0%) | 0 (0.0%) |
| Installation, Maintenance & Repair | 29 (52.7%) | 26 (47.3%) |
| Total (Category) | 130 (83.3%) | 26 (16.7%) |
| Total (Overall) | 3,090 (54.7%) | 2,554 (45.3%) |
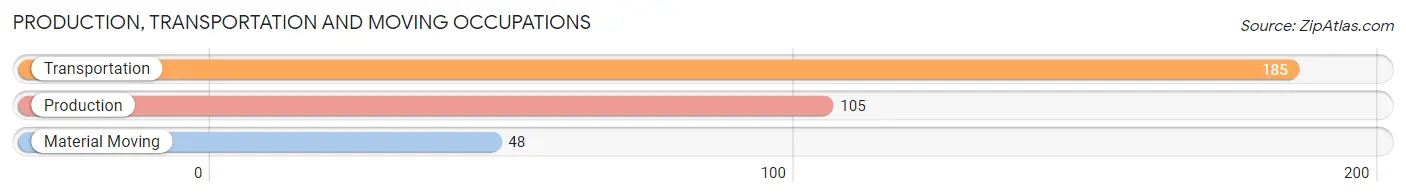
Production, Transportation and Moving Occupations
The most common Production, Transportation and Moving occupations in Countryside are Transportation (185 | 3.3%), Production (105 | 1.9%), and Material Moving (48 | 0.9%).
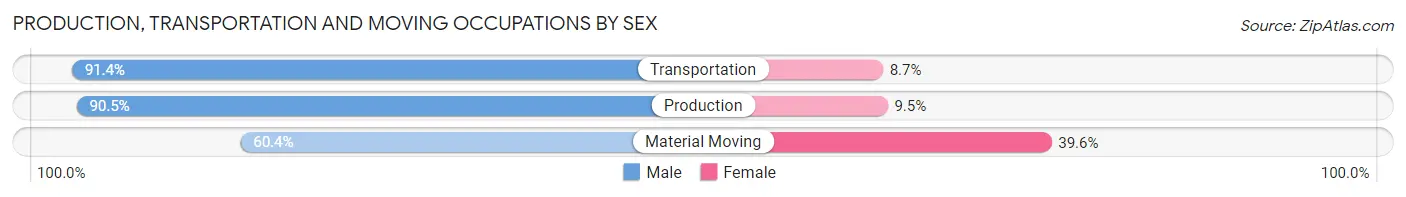
Production, Transportation and Moving Occupations by Sex
| Occupation | Male | Female |
| Production | 95 (90.5%) | 10 (9.5%) |
| Transportation | 169 (91.3%) | 16 (8.6%) |
| Material Moving | 29 (60.4%) | 19 (39.6%) |
| Total (Category) | 293 (86.7%) | 45 (13.3%) |
| Total (Overall) | 3,090 (54.7%) | 2,554 (45.3%) |
Employment Industries by Sex in Countryside
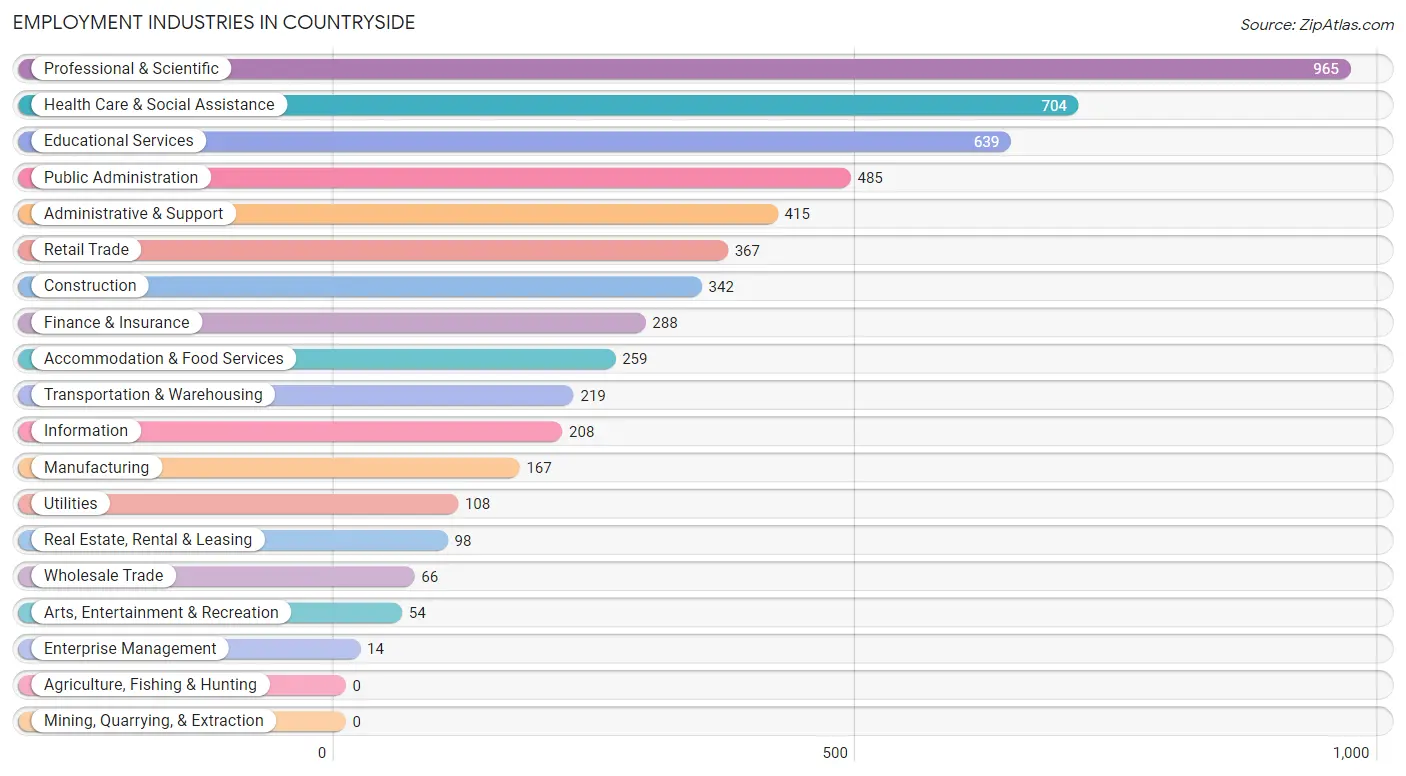
Employment Industries in Countryside
The major employment industries in Countryside include Professional & Scientific (965 | 17.1%), Health Care & Social Assistance (704 | 12.5%), Educational Services (639 | 11.3%), Public Administration (485 | 8.6%), and Administrative & Support (415 | 7.3%).
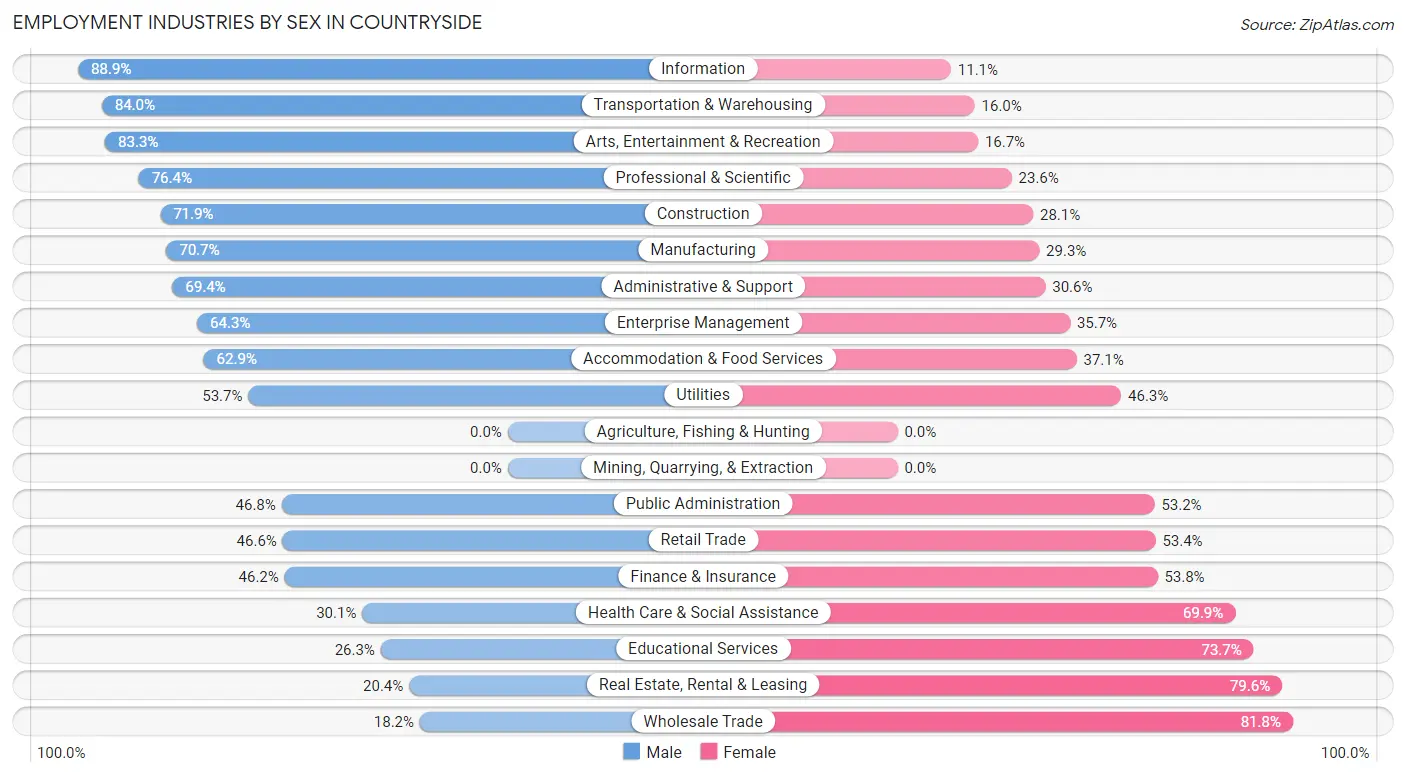
Employment Industries by Sex in Countryside
The Countryside industries that see more men than women are Information (88.9%), Transportation & Warehousing (84.0%), and Arts, Entertainment & Recreation (83.3%), whereas the industries that tend to have a higher number of women are Wholesale Trade (81.8%), Real Estate, Rental & Leasing (79.6%), and Educational Services (73.7%).
| Industry | Male | Female |
| Agriculture, Fishing & Hunting | 0 (0.0%) | 0 (0.0%) |
| Mining, Quarrying, & Extraction | 0 (0.0%) | 0 (0.0%) |
| Construction | 246 (71.9%) | 96 (28.1%) |
| Manufacturing | 118 (70.7%) | 49 (29.3%) |
| Wholesale Trade | 12 (18.2%) | 54 (81.8%) |
| Retail Trade | 171 (46.6%) | 196 (53.4%) |
| Transportation & Warehousing | 184 (84.0%) | 35 (16.0%) |
| Utilities | 58 (53.7%) | 50 (46.3%) |
| Information | 185 (88.9%) | 23 (11.1%) |
| Finance & Insurance | 133 (46.2%) | 155 (53.8%) |
| Real Estate, Rental & Leasing | 20 (20.4%) | 78 (79.6%) |
| Professional & Scientific | 737 (76.4%) | 228 (23.6%) |
| Enterprise Management | 9 (64.3%) | 5 (35.7%) |
| Administrative & Support | 288 (69.4%) | 127 (30.6%) |
| Educational Services | 168 (26.3%) | 471 (73.7%) |
| Health Care & Social Assistance | 212 (30.1%) | 492 (69.9%) |
| Arts, Entertainment & Recreation | 45 (83.3%) | 9 (16.7%) |
| Accommodation & Food Services | 163 (62.9%) | 96 (37.1%) |
| Public Administration | 227 (46.8%) | 258 (53.2%) |
| Total | 3,090 (54.7%) | 2,554 (45.3%) |
Education in Countryside
School Enrollment in Countryside
The most common levels of schooling among the 2,416 students in Countryside are high school (522 | 21.6%), college / undergraduate (489 | 20.2%), and elementary school (473 | 19.6%).
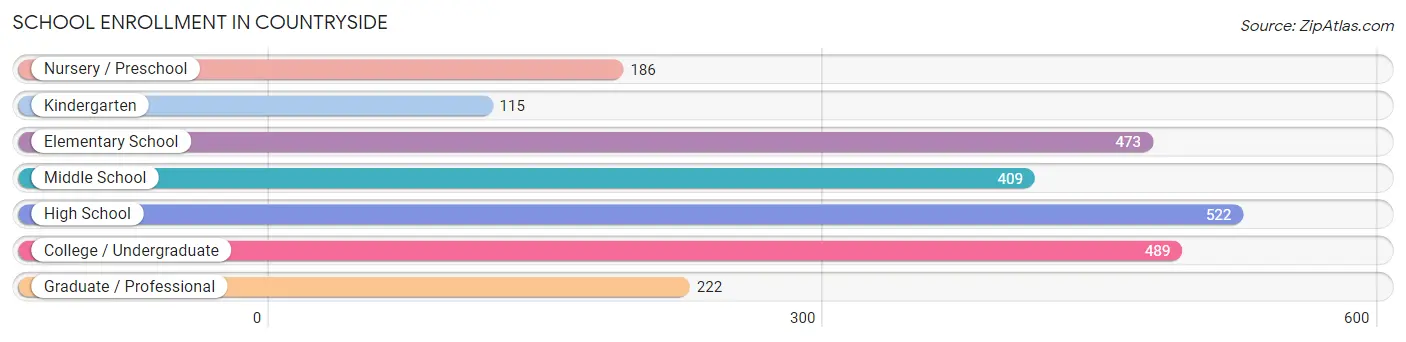
| School Level | # Students | % Students |
| Nursery / Preschool | 186 | 7.7% |
| Kindergarten | 115 | 4.8% |
| Elementary School | 473 | 19.6% |
| Middle School | 409 | 16.9% |
| High School | 522 | 21.6% |
| College / Undergraduate | 489 | 20.2% |
| Graduate / Professional | 222 | 9.2% |
| Total | 2,416 | 100.0% |
School Enrollment by Age by Funding Source in Countryside
Out of a total of 2,416 students who are enrolled in schools in Countryside, 454 (18.8%) attend a private institution, while the remaining 1,962 (81.2%) are enrolled in public schools. The age group of 3 to 4 year olds has the highest likelihood of being enrolled in private schools, with 108 (83.7% in the age bracket) enrolled. Conversely, the age group of 18 to 19 year olds has the lowest likelihood of being enrolled in a private school, with 182 (100.0% in the age bracket) attending a public institution.
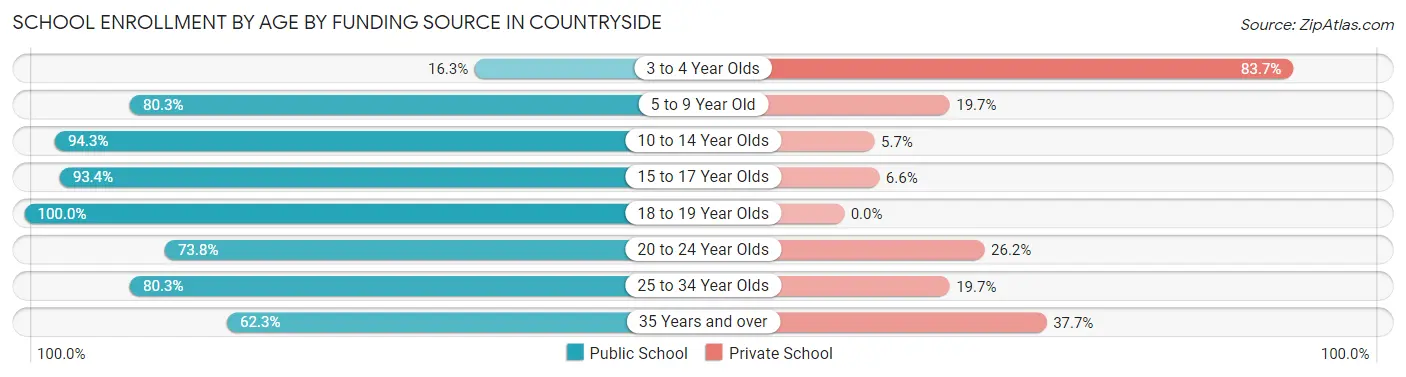
| Age Bracket | Public School | Private School |
| 3 to 4 Year Olds | 21 (16.3%) | 108 (83.7%) |
| 5 to 9 Year Old | 486 (80.3%) | 119 (19.7%) |
| 10 to 14 Year Olds | 449 (94.3%) | 27 (5.7%) |
| 15 to 17 Year Olds | 413 (93.4%) | 29 (6.6%) |
| 18 to 19 Year Olds | 182 (100.0%) | 0 (0.0%) |
| 20 to 24 Year Olds | 175 (73.8%) | 62 (26.2%) |
| 25 to 34 Year Olds | 94 (80.3%) | 23 (19.7%) |
| 35 Years and over | 142 (62.3%) | 86 (37.7%) |
| Total | 1,962 (81.2%) | 454 (18.8%) |
Educational Attainment by Field of Study in Countryside
Business (870 | 21.6%), computers & mathematics (716 | 17.7%), engineering (404 | 10.0%), social sciences (356 | 8.8%), and science & technology (320 | 7.9%) are the most common fields of study among 4,036 individuals in Countryside who have obtained a bachelor's degree or higher.
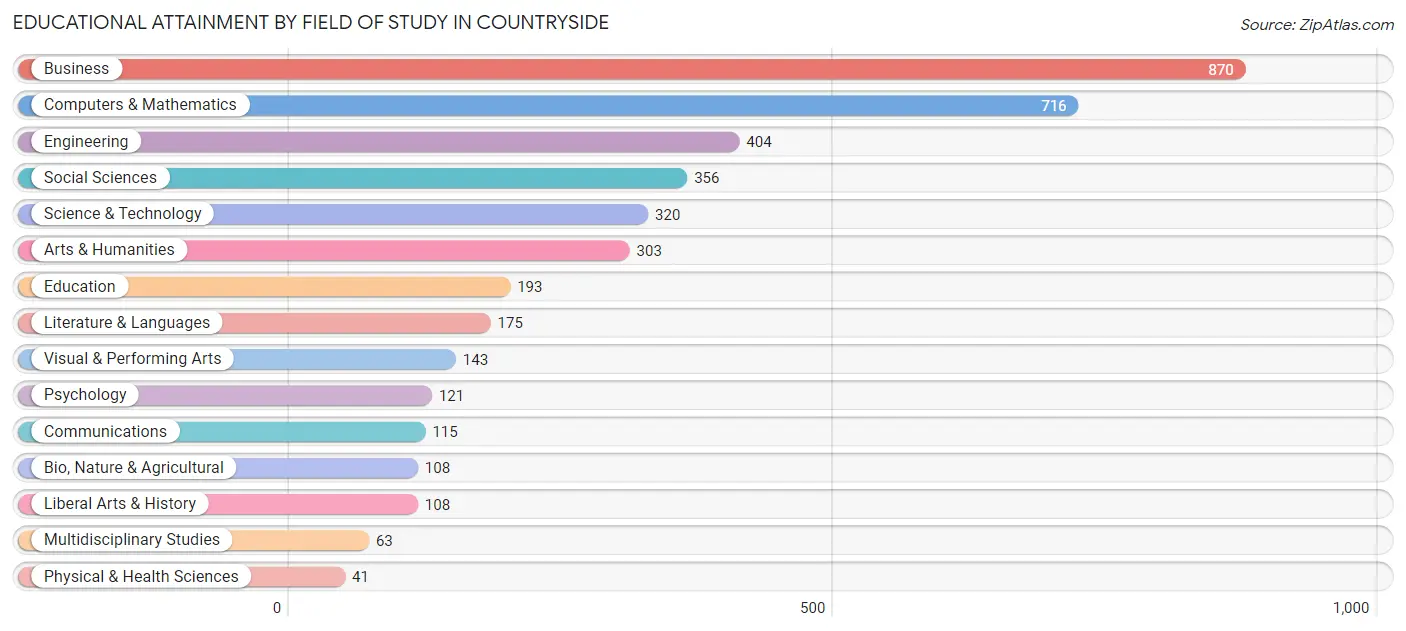
| Field of Study | # Graduates | % Graduates |
| Computers & Mathematics | 716 | 17.7% |
| Bio, Nature & Agricultural | 108 | 2.7% |
| Physical & Health Sciences | 41 | 1.0% |
| Psychology | 121 | 3.0% |
| Social Sciences | 356 | 8.8% |
| Engineering | 404 | 10.0% |
| Multidisciplinary Studies | 63 | 1.6% |
| Science & Technology | 320 | 7.9% |
| Business | 870 | 21.6% |
| Education | 193 | 4.8% |
| Literature & Languages | 175 | 4.3% |
| Liberal Arts & History | 108 | 2.7% |
| Visual & Performing Arts | 143 | 3.5% |
| Communications | 115 | 2.9% |
| Arts & Humanities | 303 | 7.5% |
| Total | 4,036 | 100.0% |
Transportation & Commute in Countryside
Vehicle Availability by Sex in Countryside
The most prevalent vehicle ownership categories in Countryside are males with 2 vehicles (1,332, accounting for 44.8%) and females with 2 vehicles (1,102, making up 53.0%).
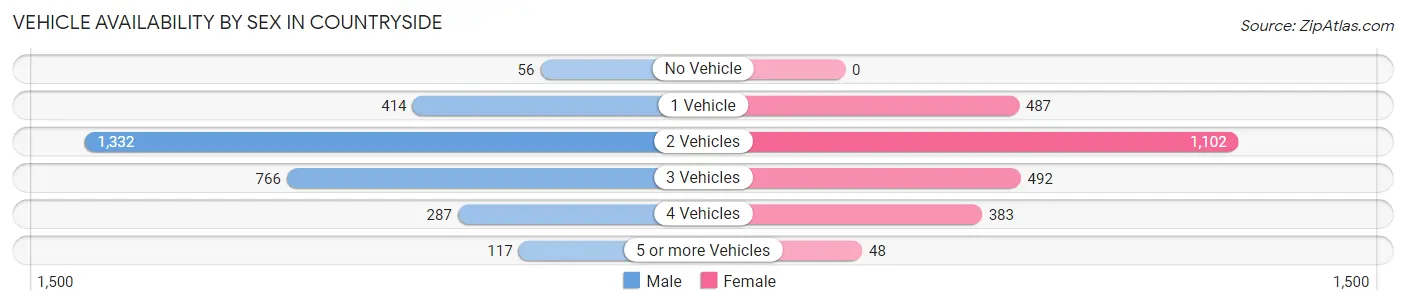
| Vehicles Available | Male | Female |
| No Vehicle | 56 (1.9%) | 0 (0.0%) |
| 1 Vehicle | 414 (13.9%) | 487 (19.4%) |
| 2 Vehicles | 1,332 (44.8%) | 1,102 (43.9%) |
| 3 Vehicles | 766 (25.8%) | 492 (19.6%) |
| 4 Vehicles | 287 (9.7%) | 383 (15.2%) |
| 5 or more Vehicles | 117 (3.9%) | 48 (1.9%) |
| Total | 2,972 (100.0%) | 2,512 (100.0%) |
Commute Time in Countryside
The most frequently occuring commute durations in Countryside are 10 to 14 minutes (848 commuters, 19.4%), 30 to 34 minutes (514 commuters, 11.8%), and 20 to 24 minutes (491 commuters, 11.3%).
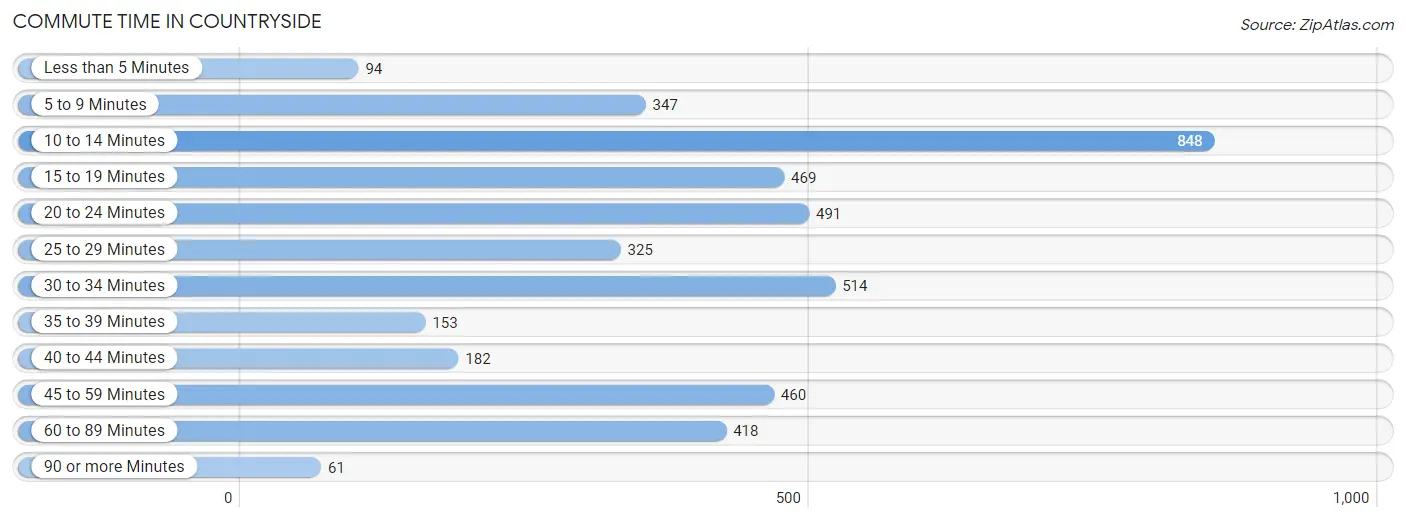
| Commute Time | # Commuters | % Commuters |
| Less than 5 Minutes | 94 | 2.1% |
| 5 to 9 Minutes | 347 | 8.0% |
| 10 to 14 Minutes | 848 | 19.4% |
| 15 to 19 Minutes | 469 | 10.7% |
| 20 to 24 Minutes | 491 | 11.3% |
| 25 to 29 Minutes | 325 | 7.4% |
| 30 to 34 Minutes | 514 | 11.8% |
| 35 to 39 Minutes | 153 | 3.5% |
| 40 to 44 Minutes | 182 | 4.2% |
| 45 to 59 Minutes | 460 | 10.5% |
| 60 to 89 Minutes | 418 | 9.6% |
| 90 or more Minutes | 61 | 1.4% |
Commute Time by Sex in Countryside
The most common commute times in Countryside are 10 to 14 minutes (343 commuters, 14.4%) for males and 10 to 14 minutes (505 commuters, 25.5%) for females.
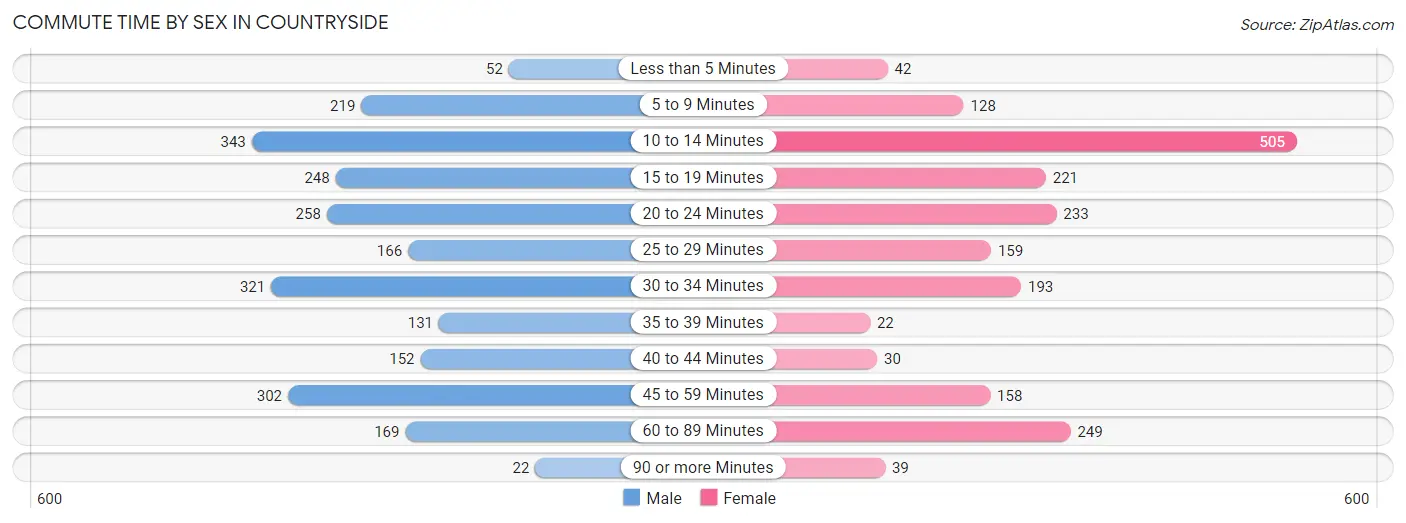
| Commute Time | Male | Female |
| Less than 5 Minutes | 52 (2.2%) | 42 (2.1%) |
| 5 to 9 Minutes | 219 (9.2%) | 128 (6.5%) |
| 10 to 14 Minutes | 343 (14.4%) | 505 (25.5%) |
| 15 to 19 Minutes | 248 (10.4%) | 221 (11.2%) |
| 20 to 24 Minutes | 258 (10.8%) | 233 (11.8%) |
| 25 to 29 Minutes | 166 (7.0%) | 159 (8.0%) |
| 30 to 34 Minutes | 321 (13.5%) | 193 (9.8%) |
| 35 to 39 Minutes | 131 (5.5%) | 22 (1.1%) |
| 40 to 44 Minutes | 152 (6.4%) | 30 (1.5%) |
| 45 to 59 Minutes | 302 (12.7%) | 158 (8.0%) |
| 60 to 89 Minutes | 169 (7.1%) | 249 (12.6%) |
| 90 or more Minutes | 22 (0.9%) | 39 (2.0%) |
Time of Departure to Work by Sex in Countryside
The most frequent times of departure to work in Countryside are 8:00 AM to 8:29 AM (509, 21.4%) for males and 8:00 AM to 8:29 AM (342, 17.3%) for females.
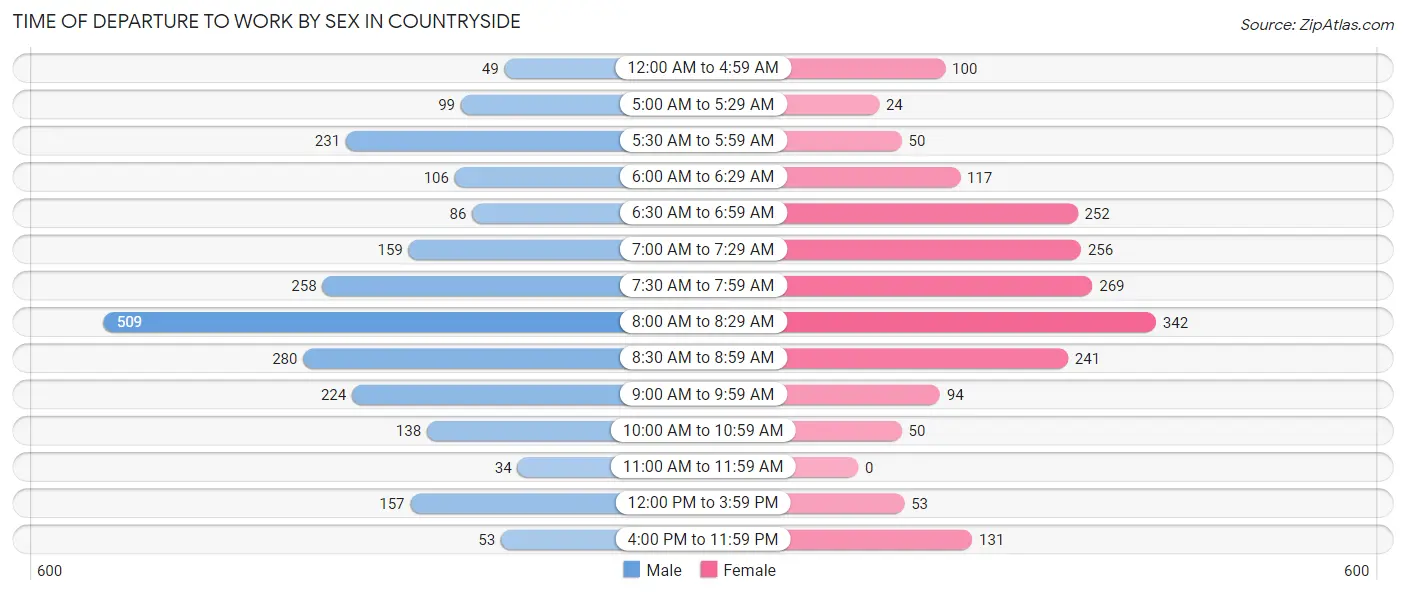
| Time of Departure | Male | Female |
| 12:00 AM to 4:59 AM | 49 (2.1%) | 100 (5.1%) |
| 5:00 AM to 5:29 AM | 99 (4.2%) | 24 (1.2%) |
| 5:30 AM to 5:59 AM | 231 (9.7%) | 50 (2.5%) |
| 6:00 AM to 6:29 AM | 106 (4.4%) | 117 (5.9%) |
| 6:30 AM to 6:59 AM | 86 (3.6%) | 252 (12.7%) |
| 7:00 AM to 7:29 AM | 159 (6.7%) | 256 (12.9%) |
| 7:30 AM to 7:59 AM | 258 (10.8%) | 269 (13.6%) |
| 8:00 AM to 8:29 AM | 509 (21.4%) | 342 (17.3%) |
| 8:30 AM to 8:59 AM | 280 (11.7%) | 241 (12.2%) |
| 9:00 AM to 9:59 AM | 224 (9.4%) | 94 (4.8%) |
| 10:00 AM to 10:59 AM | 138 (5.8%) | 50 (2.5%) |
| 11:00 AM to 11:59 AM | 34 (1.4%) | 0 (0.0%) |
| 12:00 PM to 3:59 PM | 157 (6.6%) | 53 (2.7%) |
| 4:00 PM to 11:59 PM | 53 (2.2%) | 131 (6.6%) |
| Total | 2,383 (100.0%) | 1,979 (100.0%) |
Housing Occupancy in Countryside
Occupancy by Ownership in Countryside
Of the total 3,454 dwellings in Countryside, owner-occupied units account for 2,490 (72.1%), while renter-occupied units make up 964 (27.9%).
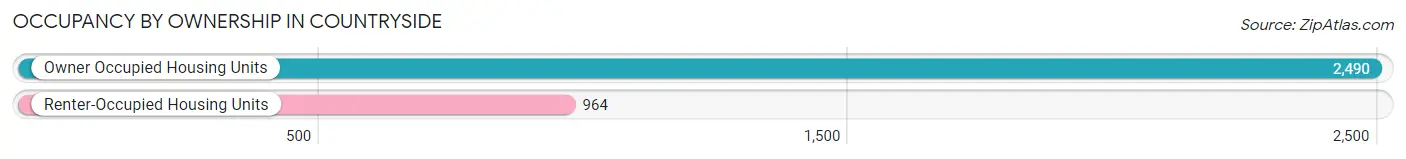
| Occupancy | # Housing Units | % Housing Units |
| Owner Occupied Housing Units | 2,490 | 72.1% |
| Renter-Occupied Housing Units | 964 | 27.9% |
| Total Occupied Housing Units | 3,454 | 100.0% |
Occupancy by Household Size in Countryside
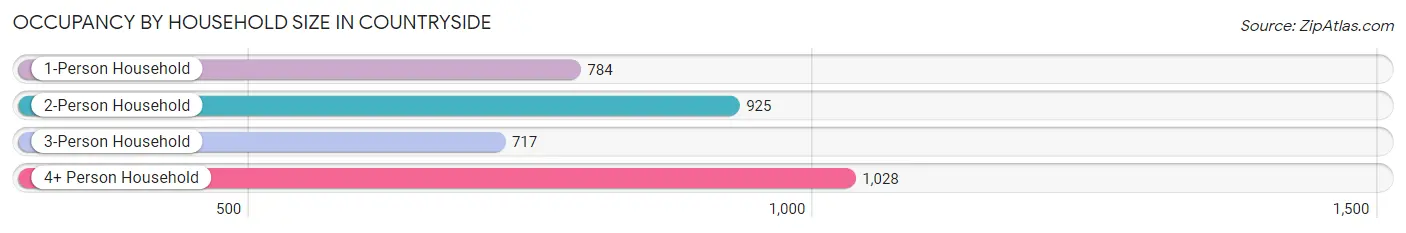
| Household Size | # Housing Units | % Housing Units |
| 1-Person Household | 784 | 22.7% |
| 2-Person Household | 925 | 26.8% |
| 3-Person Household | 717 | 20.8% |
| 4+ Person Household | 1,028 | 29.8% |
| Total Housing Units | 3,454 | 100.0% |
Occupancy by Ownership by Household Size in Countryside
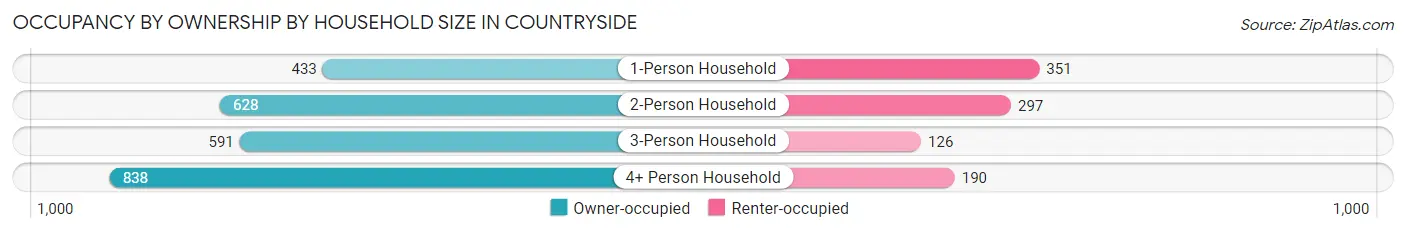
| Household Size | Owner-occupied | Renter-occupied |
| 1-Person Household | 433 (55.2%) | 351 (44.8%) |
| 2-Person Household | 628 (67.9%) | 297 (32.1%) |
| 3-Person Household | 591 (82.4%) | 126 (17.6%) |
| 4+ Person Household | 838 (81.5%) | 190 (18.5%) |
| Total Housing Units | 2,490 (72.1%) | 964 (27.9%) |
Occupancy by Educational Attainment in Countryside
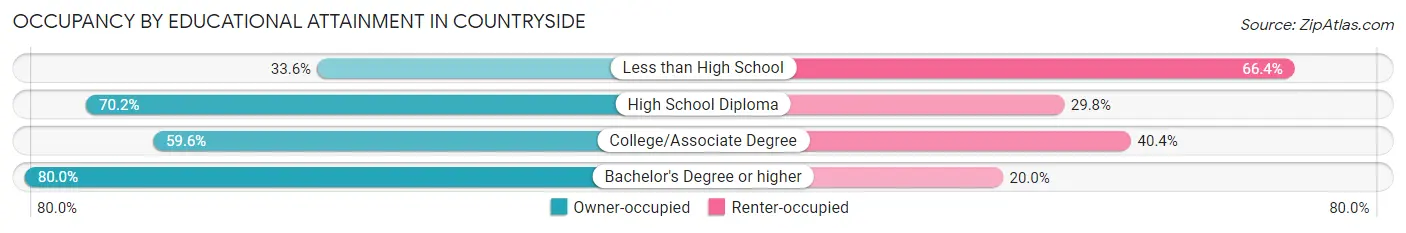
| Household Size | Owner-occupied | Renter-occupied |
| Less than High School | 37 (33.6%) | 73 (66.4%) |
| High School Diploma | 210 (70.2%) | 89 (29.8%) |
| College/Associate Degree | 563 (59.6%) | 381 (40.4%) |
| Bachelor's Degree or higher | 1,680 (80.0%) | 421 (20.0%) |
Occupancy by Age of Householder in Countryside
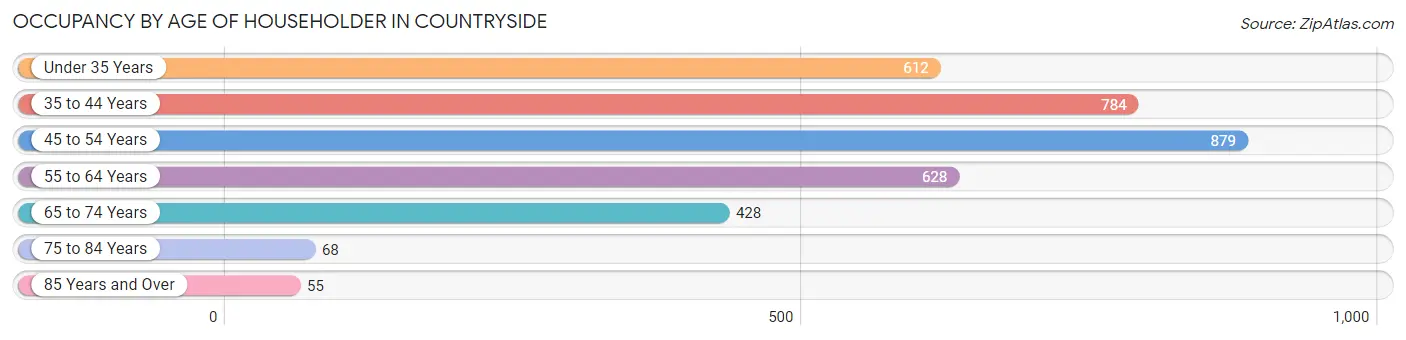
| Age Bracket | # Households | % Households |
| Under 35 Years | 612 | 17.7% |
| 35 to 44 Years | 784 | 22.7% |
| 45 to 54 Years | 879 | 25.5% |
| 55 to 64 Years | 628 | 18.2% |
| 65 to 74 Years | 428 | 12.4% |
| 75 to 84 Years | 68 | 2.0% |
| 85 Years and Over | 55 | 1.6% |
| Total | 3,454 | 100.0% |
Housing Finances in Countryside
Median Income by Occupancy in Countryside
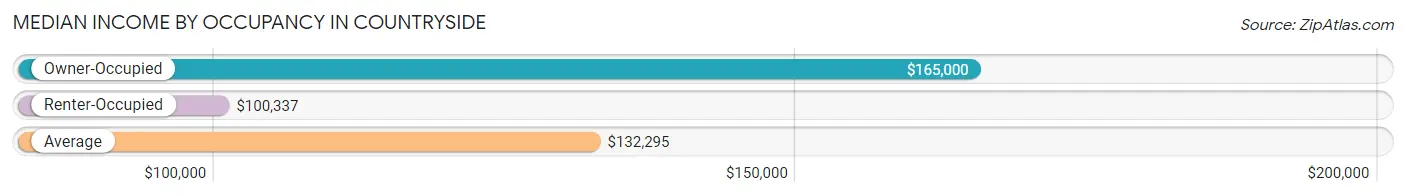
| Occupancy Type | # Households | Median Income |
| Owner-Occupied | 2,490 (72.1%) | $165,000 |
| Renter-Occupied | 964 (27.9%) | $100,337 |
| Average | 3,454 (100.0%) | $132,295 |
Occupancy by Householder Income Bracket in Countryside
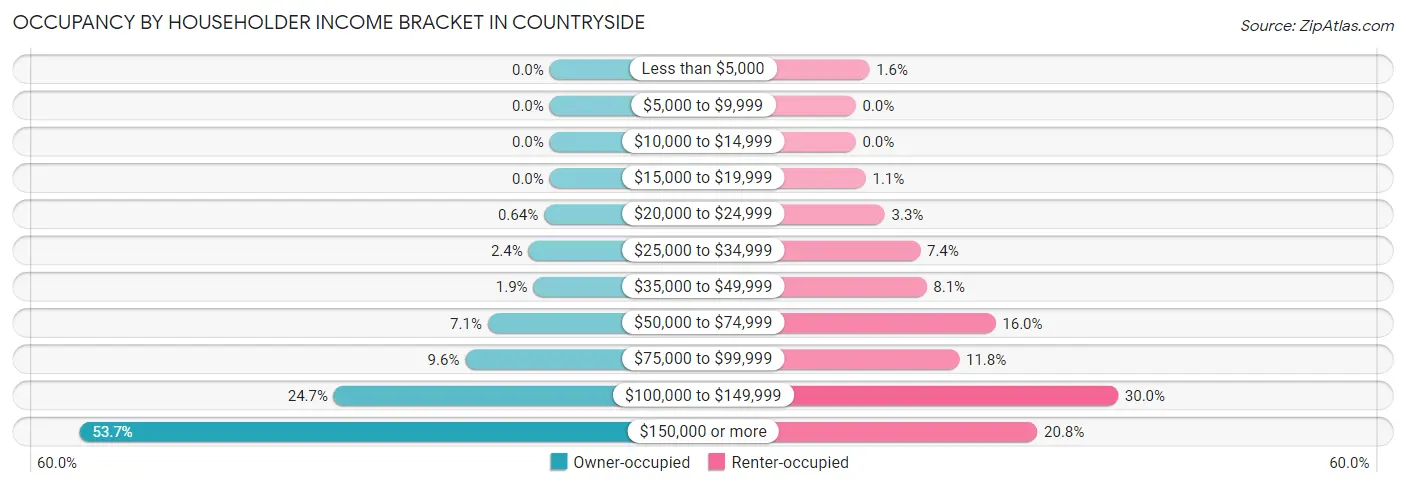
| Income Bracket | Owner-occupied | Renter-occupied |
| Less than $5,000 | 0 (0.0%) | 15 (1.6%) |
| $5,000 to $9,999 | 0 (0.0%) | 0 (0.0%) |
| $10,000 to $14,999 | 0 (0.0%) | 0 (0.0%) |
| $15,000 to $19,999 | 0 (0.0%) | 11 (1.1%) |
| $20,000 to $24,999 | 16 (0.6%) | 32 (3.3%) |
| $25,000 to $34,999 | 60 (2.4%) | 71 (7.4%) |
| $35,000 to $49,999 | 46 (1.8%) | 78 (8.1%) |
| $50,000 to $74,999 | 176 (7.1%) | 154 (16.0%) |
| $75,000 to $99,999 | 240 (9.6%) | 114 (11.8%) |
| $100,000 to $149,999 | 614 (24.7%) | 289 (30.0%) |
| $150,000 or more | 1,338 (53.7%) | 200 (20.7%) |
| Total | 2,490 (100.0%) | 964 (100.0%) |
Monthly Housing Cost Tiers in Countryside
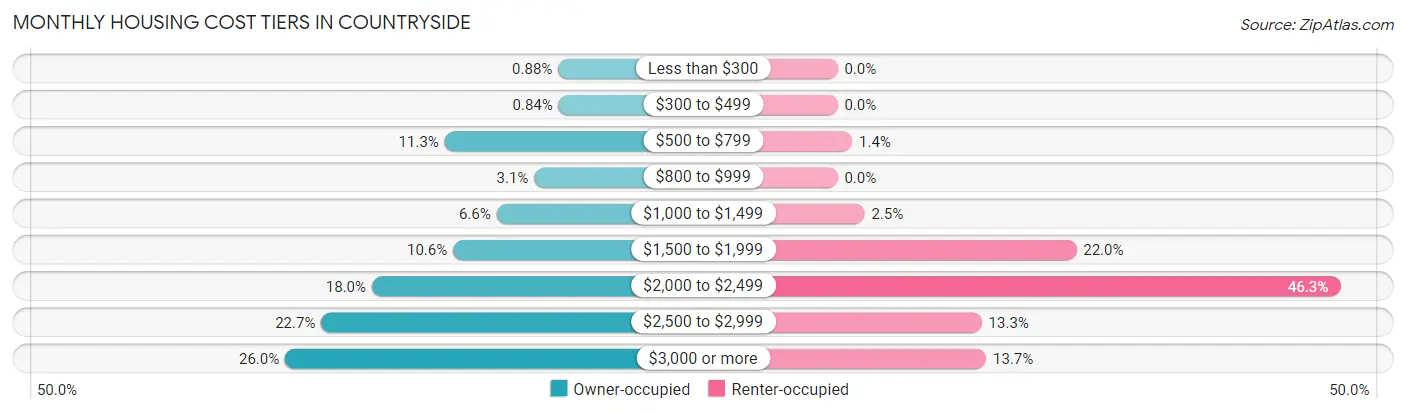
| Monthly Cost | Owner-occupied | Renter-occupied |
| Less than $300 | 22 (0.9%) | 0 (0.0%) |
| $300 to $499 | 21 (0.8%) | 0 (0.0%) |
| $500 to $799 | 282 (11.3%) | 13 (1.3%) |
| $800 to $999 | 77 (3.1%) | 0 (0.0%) |
| $1,000 to $1,499 | 163 (6.6%) | 24 (2.5%) |
| $1,500 to $1,999 | 263 (10.6%) | 212 (22.0%) |
| $2,000 to $2,499 | 449 (18.0%) | 446 (46.3%) |
| $2,500 to $2,999 | 565 (22.7%) | 128 (13.3%) |
| $3,000 or more | 648 (26.0%) | 132 (13.7%) |
| Total | 2,490 (100.0%) | 964 (100.0%) |
Physical Housing Characteristics in Countryside
Housing Structures in Countryside
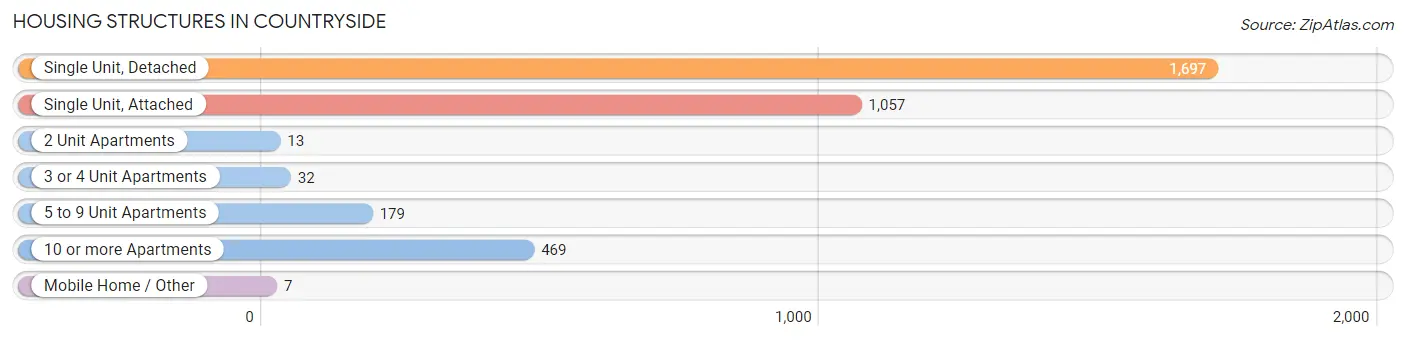
| Structure Type | # Housing Units | % Housing Units |
| Single Unit, Detached | 1,697 | 49.1% |
| Single Unit, Attached | 1,057 | 30.6% |
| 2 Unit Apartments | 13 | 0.4% |
| 3 or 4 Unit Apartments | 32 | 0.9% |
| 5 to 9 Unit Apartments | 179 | 5.2% |
| 10 or more Apartments | 469 | 13.6% |
| Mobile Home / Other | 7 | 0.2% |
| Total | 3,454 | 100.0% |
Housing Structures by Occupancy in Countryside
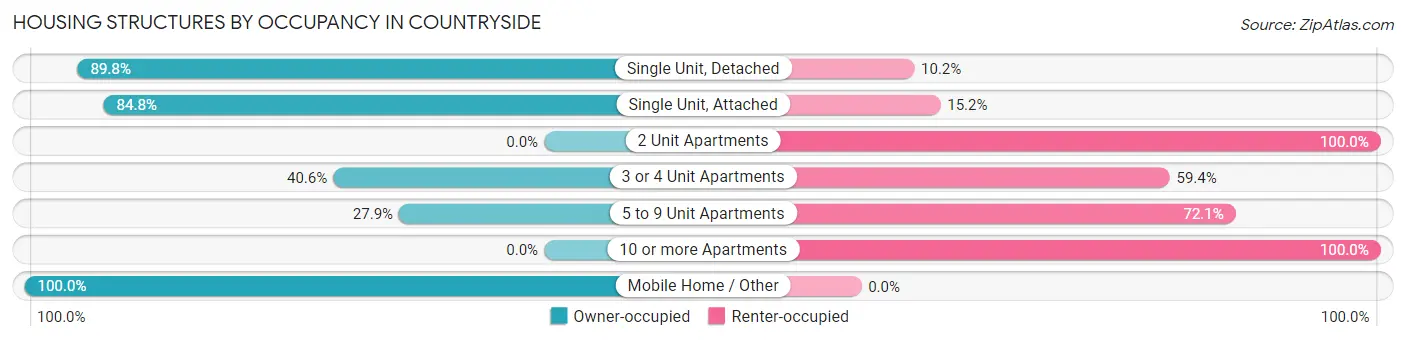
| Structure Type | Owner-occupied | Renter-occupied |
| Single Unit, Detached | 1,524 (89.8%) | 173 (10.2%) |
| Single Unit, Attached | 896 (84.8%) | 161 (15.2%) |
| 2 Unit Apartments | 0 (0.0%) | 13 (100.0%) |
| 3 or 4 Unit Apartments | 13 (40.6%) | 19 (59.4%) |
| 5 to 9 Unit Apartments | 50 (27.9%) | 129 (72.1%) |
| 10 or more Apartments | 0 (0.0%) | 469 (100.0%) |
| Mobile Home / Other | 7 (100.0%) | 0 (0.0%) |
| Total | 2,490 (72.1%) | 964 (27.9%) |
Housing Structures by Number of Rooms in Countryside
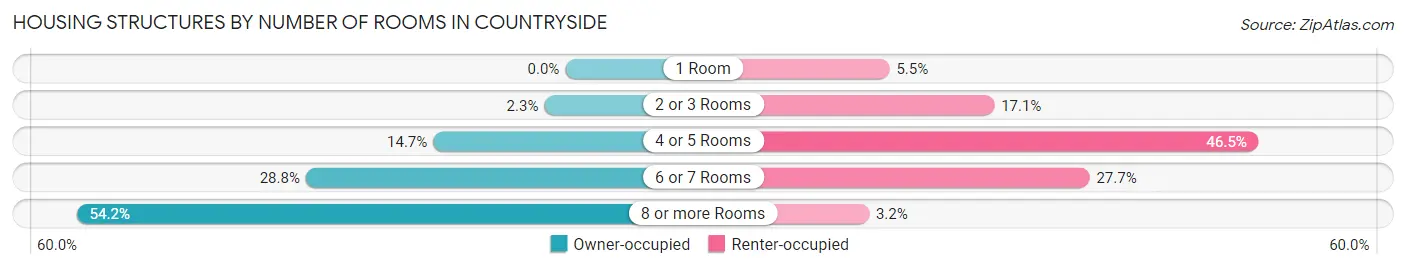
| Number of Rooms | Owner-occupied | Renter-occupied |
| 1 Room | 0 (0.0%) | 53 (5.5%) |
| 2 or 3 Rooms | 58 (2.3%) | 165 (17.1%) |
| 4 or 5 Rooms | 365 (14.7%) | 448 (46.5%) |
| 6 or 7 Rooms | 717 (28.8%) | 267 (27.7%) |
| 8 or more Rooms | 1,350 (54.2%) | 31 (3.2%) |
| Total | 2,490 (100.0%) | 964 (100.0%) |
Housing Structure by Heating Type in Countryside
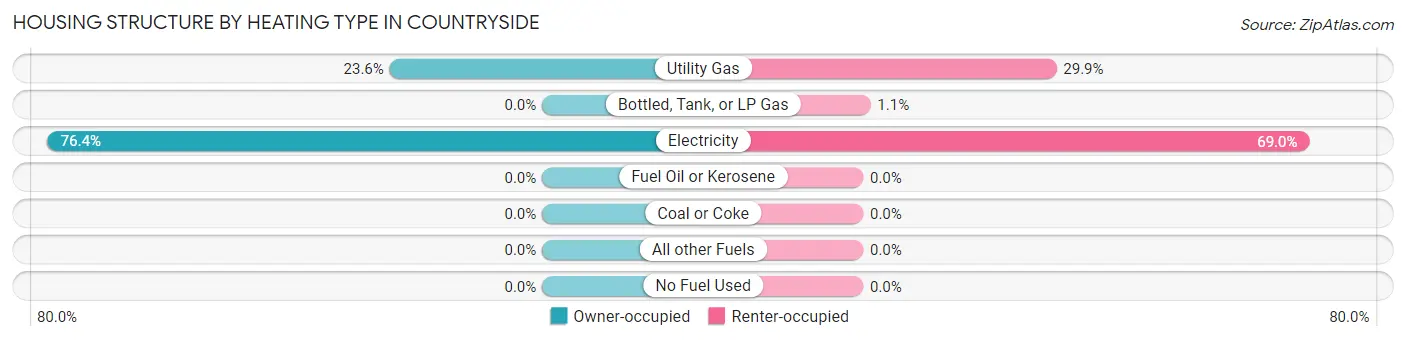
| Heating Type | Owner-occupied | Renter-occupied |
| Utility Gas | 587 (23.6%) | 288 (29.9%) |
| Bottled, Tank, or LP Gas | 0 (0.0%) | 11 (1.1%) |
| Electricity | 1,903 (76.4%) | 665 (69.0%) |
| Fuel Oil or Kerosene | 0 (0.0%) | 0 (0.0%) |
| Coal or Coke | 0 (0.0%) | 0 (0.0%) |
| All other Fuels | 0 (0.0%) | 0 (0.0%) |
| No Fuel Used | 0 (0.0%) | 0 (0.0%) |
| Total | 2,490 (100.0%) | 964 (100.0%) |
Household Vehicle Usage in Countryside
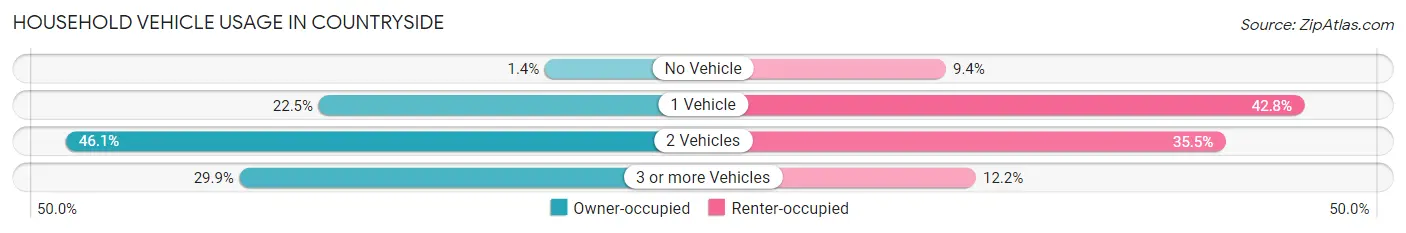
| Vehicles per Household | Owner-occupied | Renter-occupied |
| No Vehicle | 35 (1.4%) | 91 (9.4%) |
| 1 Vehicle | 561 (22.5%) | 413 (42.8%) |
| 2 Vehicles | 1,149 (46.1%) | 342 (35.5%) |
| 3 or more Vehicles | 745 (29.9%) | 118 (12.2%) |
| Total | 2,490 (100.0%) | 964 (100.0%) |
Real Estate & Mortgages in Countryside
Real Estate and Mortgage Overview in Countryside
| Characteristic | Without Mortgage | With Mortgage |
| Housing Units | 453 | 2,037 |
| Median Property Value | $467,400 | $537,500 |
| Median Household Income | $117,070 | $1,182 |
| Monthly Housing Costs | $598 | $648 |
| Real Estate Taxes | $4,409 | $87 |
Property Value by Mortgage Status in Countryside
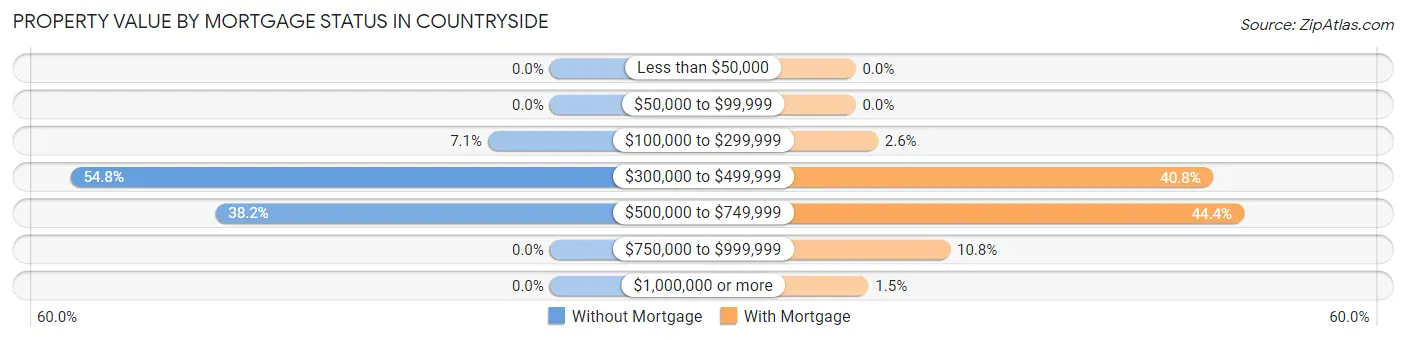
| Property Value | Without Mortgage | With Mortgage |
| Less than $50,000 | 0 (0.0%) | 0 (0.0%) |
| $50,000 to $99,999 | 0 (0.0%) | 0 (0.0%) |
| $100,000 to $299,999 | 32 (7.1%) | 52 (2.5%) |
| $300,000 to $499,999 | 248 (54.7%) | 831 (40.8%) |
| $500,000 to $749,999 | 173 (38.2%) | 904 (44.4%) |
| $750,000 to $999,999 | 0 (0.0%) | 220 (10.8%) |
| $1,000,000 or more | 0 (0.0%) | 30 (1.5%) |
| Total | 453 (100.0%) | 2,037 (100.0%) |
Household Income by Mortgage Status in Countryside
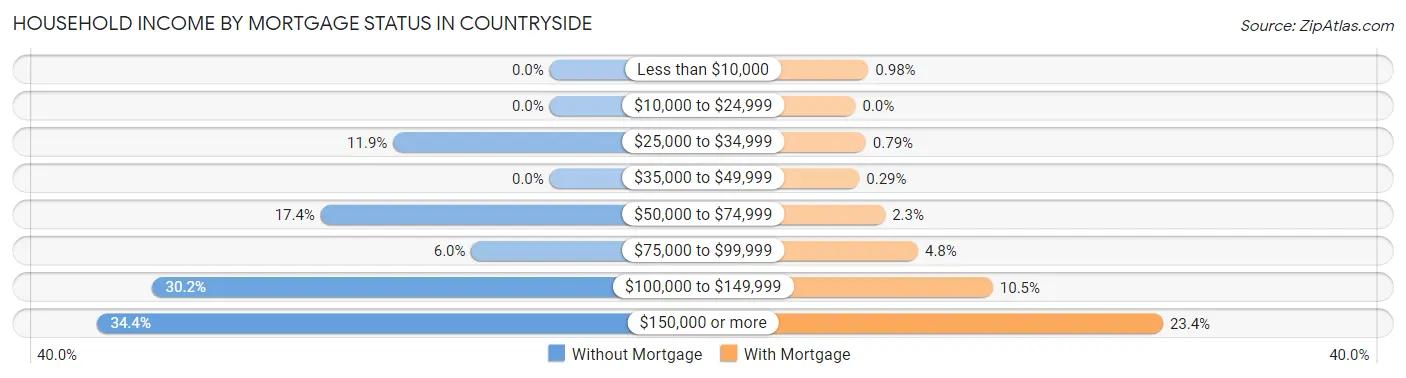
| Household Income | Without Mortgage | With Mortgage |
| Less than $10,000 | 0 (0.0%) | 20 (1.0%) |
| $10,000 to $24,999 | 0 (0.0%) | 0 (0.0%) |
| $25,000 to $34,999 | 54 (11.9%) | 16 (0.8%) |
| $35,000 to $49,999 | 0 (0.0%) | 6 (0.3%) |
| $50,000 to $74,999 | 79 (17.4%) | 46 (2.3%) |
| $75,000 to $99,999 | 27 (6.0%) | 97 (4.8%) |
| $100,000 to $149,999 | 137 (30.2%) | 213 (10.5%) |
| $150,000 or more | 156 (34.4%) | 477 (23.4%) |
| Total | 453 (100.0%) | 2,037 (100.0%) |
Property Value to Household Income Ratio in Countryside
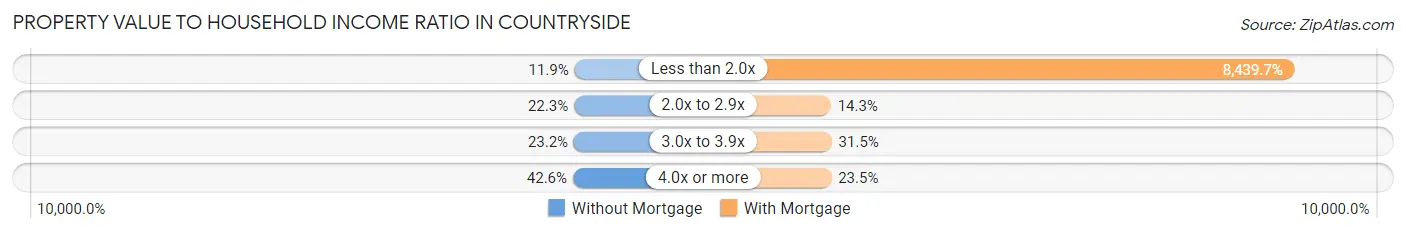
| Value-to-Income Ratio | Without Mortgage | With Mortgage |
| Less than 2.0x | 54 (11.9%) | 171,917 (8,439.7%) |
| 2.0x to 2.9x | 101 (22.3%) | 291 (14.3%) |
| 3.0x to 3.9x | 105 (23.2%) | 641 (31.5%) |
| 4.0x or more | 193 (42.6%) | 479 (23.5%) |
| Total | 453 (100.0%) | 2,037 (100.0%) |
Real Estate Taxes by Mortgage Status in Countryside
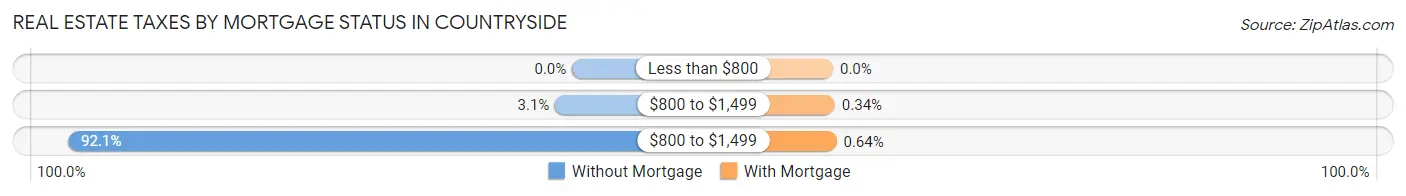
| Property Taxes | Without Mortgage | With Mortgage |
| Less than $800 | 0 (0.0%) | 0 (0.0%) |
| $800 to $1,499 | 14 (3.1%) | 7 (0.3%) |
| $800 to $1,499 | 417 (92.0%) | 13 (0.6%) |
| Total | 453 (100.0%) | 2,037 (100.0%) |
Health & Disability in Countryside
Health Insurance Coverage by Age in Countryside
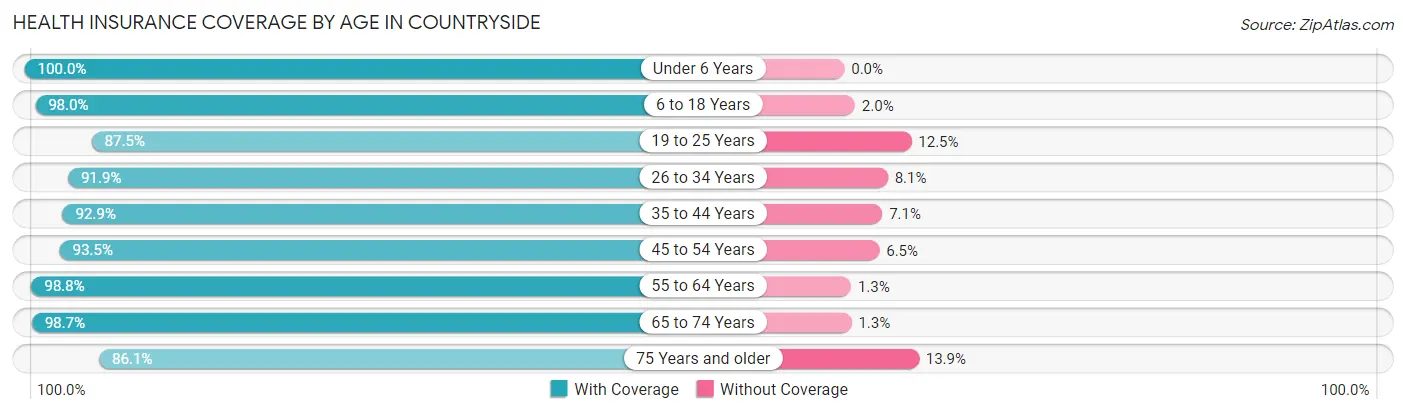
| Age Bracket | With Coverage | Without Coverage |
| Under 6 Years | 913 (100.0%) | 0 (0.0%) |
| 6 to 18 Years | 1,485 (98.0%) | 30 (2.0%) |
| 19 to 25 Years | 679 (87.5%) | 97 (12.5%) |
| 26 to 34 Years | 1,350 (91.9%) | 119 (8.1%) |
| 35 to 44 Years | 1,340 (92.9%) | 102 (7.1%) |
| 45 to 54 Years | 1,433 (93.5%) | 100 (6.5%) |
| 55 to 64 Years | 949 (98.8%) | 12 (1.3%) |
| 65 to 74 Years | 810 (98.7%) | 11 (1.3%) |
| 75 Years and older | 186 (86.1%) | 30 (13.9%) |
| Total | 9,145 (94.8%) | 501 (5.2%) |
Health Insurance Coverage by Citizenship Status in Countryside
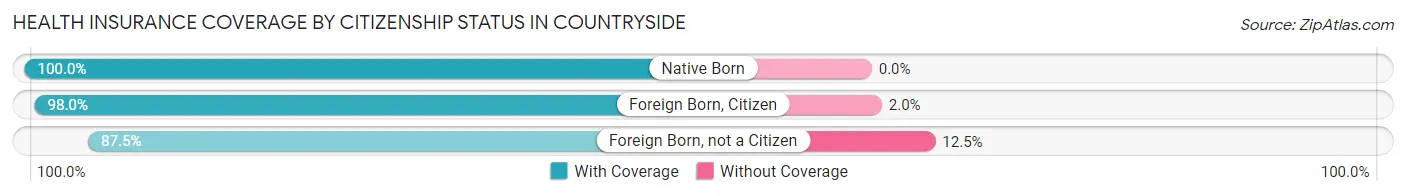
| Citizenship Status | With Coverage | Without Coverage |
| Native Born | 913 (100.0%) | 0 (0.0%) |
| Foreign Born, Citizen | 1,485 (98.0%) | 30 (2.0%) |
| Foreign Born, not a Citizen | 679 (87.5%) | 97 (12.5%) |
Health Insurance Coverage by Household Income in Countryside
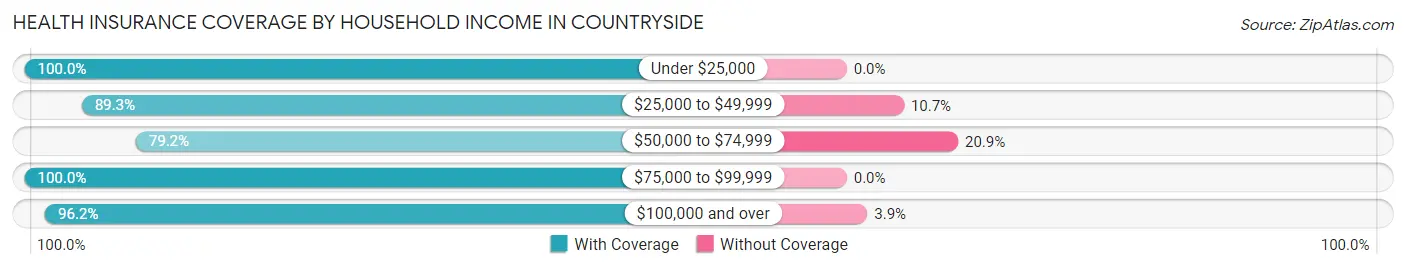
| Household Income | With Coverage | Without Coverage |
| Under $25,000 | 118 (100.0%) | 0 (0.0%) |
| $25,000 to $49,999 | 450 (89.3%) | 54 (10.7%) |
| $50,000 to $74,999 | 596 (79.1%) | 157 (20.8%) |
| $75,000 to $99,999 | 814 (100.0%) | 0 (0.0%) |
| $100,000 and over | 7,161 (96.2%) | 287 (3.8%) |
Public vs Private Health Insurance Coverage by Age in Countryside
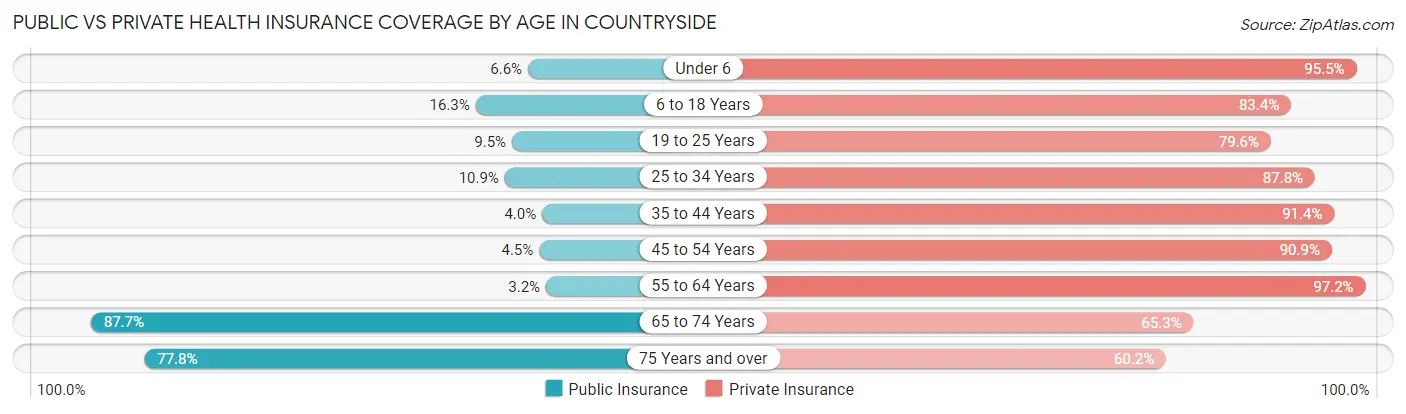
| Age Bracket | Public Insurance | Private Insurance |
| Under 6 | 60 (6.6%) | 872 (95.5%) |
| 6 to 18 Years | 247 (16.3%) | 1,263 (83.4%) |
| 19 to 25 Years | 74 (9.5%) | 618 (79.6%) |
| 25 to 34 Years | 160 (10.9%) | 1,290 (87.8%) |
| 35 to 44 Years | 57 (4.0%) | 1,318 (91.4%) |
| 45 to 54 Years | 69 (4.5%) | 1,394 (90.9%) |
| 55 to 64 Years | 31 (3.2%) | 934 (97.2%) |
| 65 to 74 Years | 720 (87.7%) | 536 (65.3%) |
| 75 Years and over | 168 (77.8%) | 130 (60.2%) |
| Total | 1,586 (16.4%) | 8,355 (86.6%) |
Disability Status by Sex by Age in Countryside
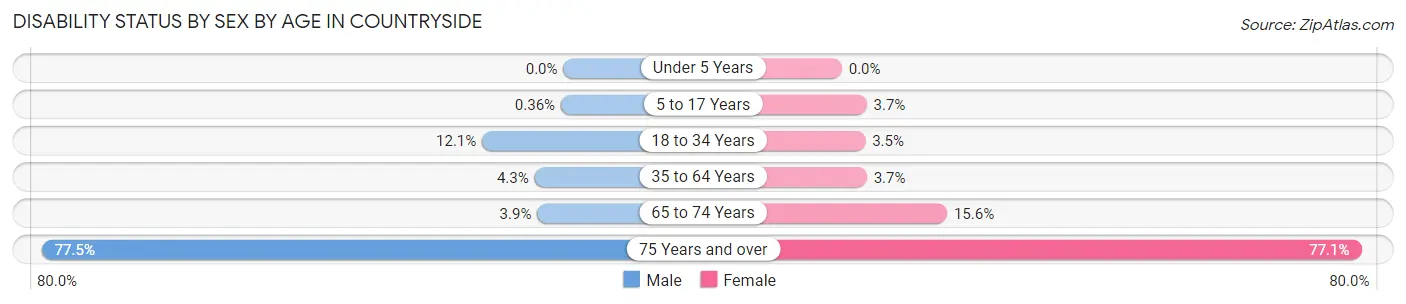
| Age Bracket | Male | Female |
| Under 5 Years | 0 (0.0%) | 0 (0.0%) |
| 5 to 17 Years | 3 (0.4%) | 26 (3.7%) |
| 18 to 34 Years | 145 (12.1%) | 39 (3.5%) |
| 35 to 64 Years | 84 (4.3%) | 73 (3.7%) |
| 65 to 74 Years | 12 (3.9%) | 80 (15.6%) |
| 75 Years and over | 86 (77.5%) | 81 (77.1%) |
Disability Class by Sex by Age in Countryside
Disability Class: Hearing Difficulty
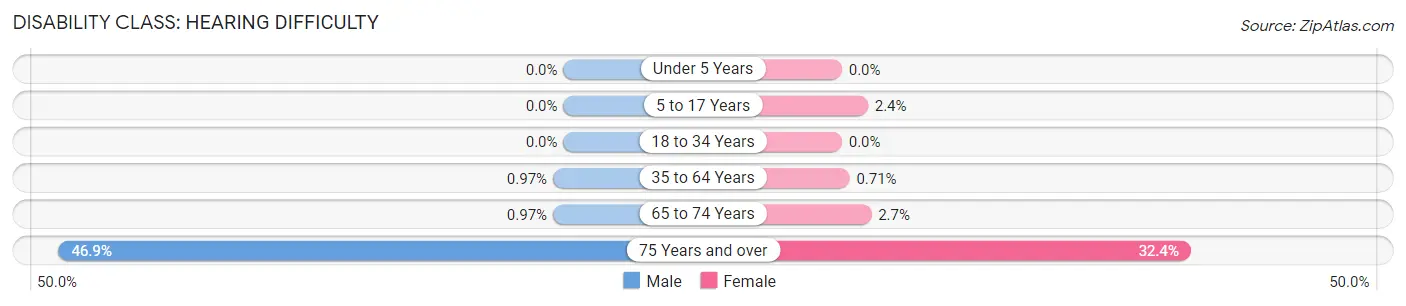
| Age Bracket | Male | Female |
| Under 5 Years | 0 (0.0%) | 0 (0.0%) |
| 5 to 17 Years | 0 (0.0%) | 17 (2.4%) |
| 18 to 34 Years | 0 (0.0%) | 0 (0.0%) |
| 35 to 64 Years | 19 (1.0%) | 14 (0.7%) |
| 65 to 74 Years | 3 (1.0%) | 14 (2.7%) |
| 75 Years and over | 52 (46.9%) | 34 (32.4%) |
Disability Class: Vision Difficulty
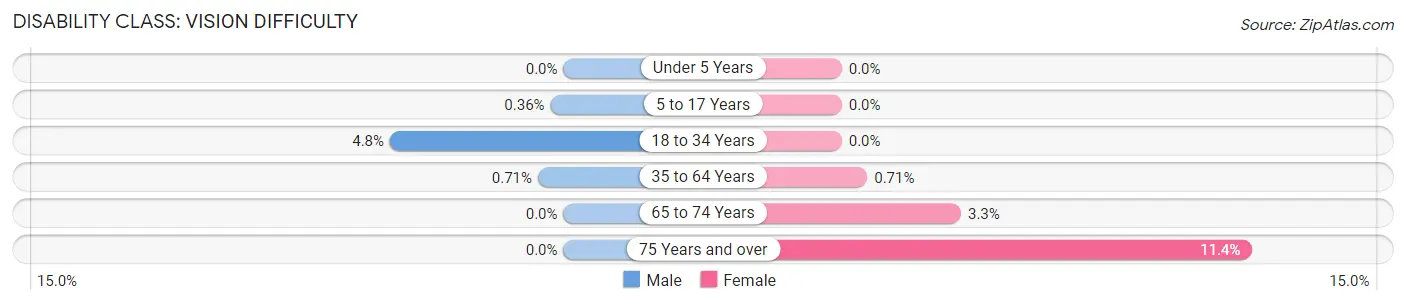
| Age Bracket | Male | Female |
| Under 5 Years | 0 (0.0%) | 0 (0.0%) |
| 5 to 17 Years | 3 (0.4%) | 0 (0.0%) |
| 18 to 34 Years | 58 (4.8%) | 0 (0.0%) |
| 35 to 64 Years | 14 (0.7%) | 14 (0.7%) |
| 65 to 74 Years | 0 (0.0%) | 17 (3.3%) |
| 75 Years and over | 0 (0.0%) | 12 (11.4%) |
Disability Class: Cognitive Difficulty
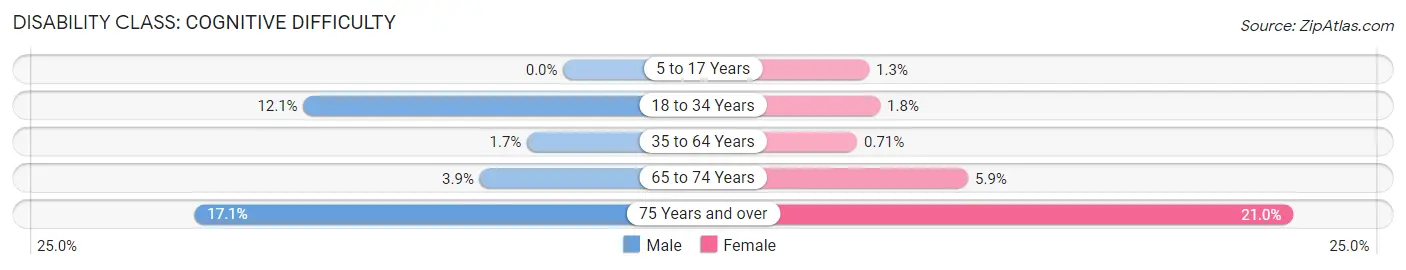
| Age Bracket | Male | Female |
| 5 to 17 Years | 0 (0.0%) | 9 (1.3%) |
| 18 to 34 Years | 145 (12.1%) | 20 (1.8%) |
| 35 to 64 Years | 33 (1.7%) | 14 (0.7%) |
| 65 to 74 Years | 12 (3.9%) | 30 (5.9%) |
| 75 Years and over | 19 (17.1%) | 22 (20.9%) |
Disability Class: Ambulatory Difficulty
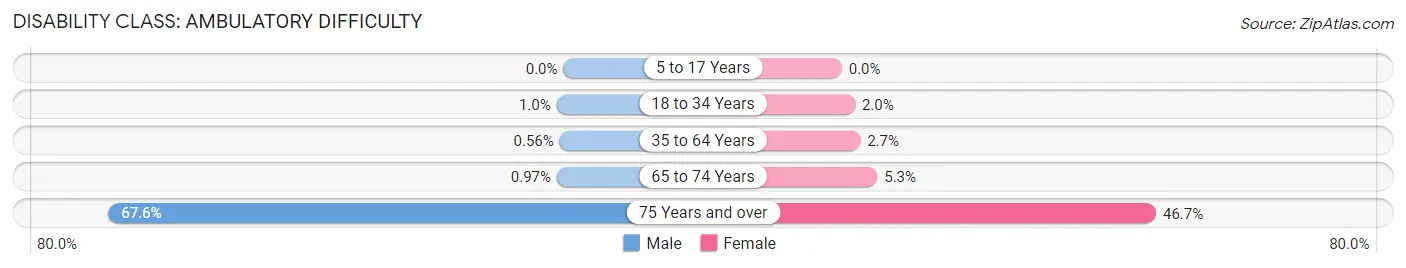
| Age Bracket | Male | Female |
| 5 to 17 Years | 0 (0.0%) | 0 (0.0%) |
| 18 to 34 Years | 12 (1.0%) | 22 (2.0%) |
| 35 to 64 Years | 11 (0.6%) | 54 (2.7%) |
| 65 to 74 Years | 3 (1.0%) | 27 (5.3%) |
| 75 Years and over | 75 (67.6%) | 49 (46.7%) |
Disability Class: Self-Care Difficulty
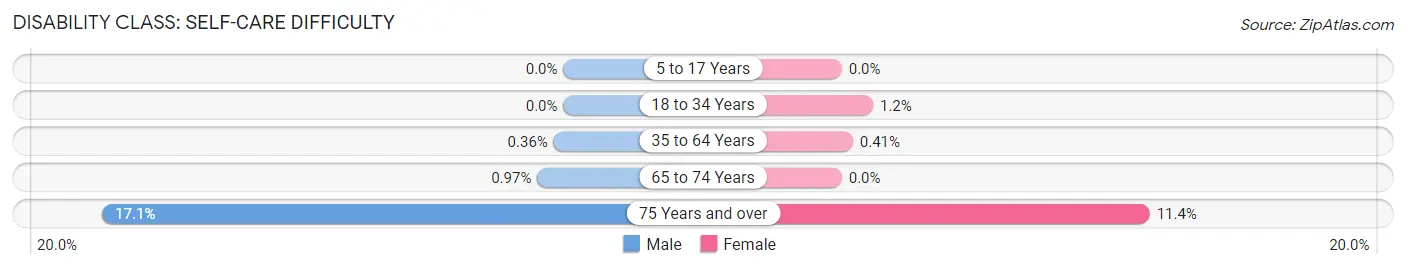
| Age Bracket | Male | Female |
| 5 to 17 Years | 0 (0.0%) | 0 (0.0%) |
| 18 to 34 Years | 0 (0.0%) | 13 (1.2%) |
| 35 to 64 Years | 7 (0.4%) | 8 (0.4%) |
| 65 to 74 Years | 3 (1.0%) | 0 (0.0%) |
| 75 Years and over | 19 (17.1%) | 12 (11.4%) |
Technology Access in Countryside
Computing Device Access in Countryside
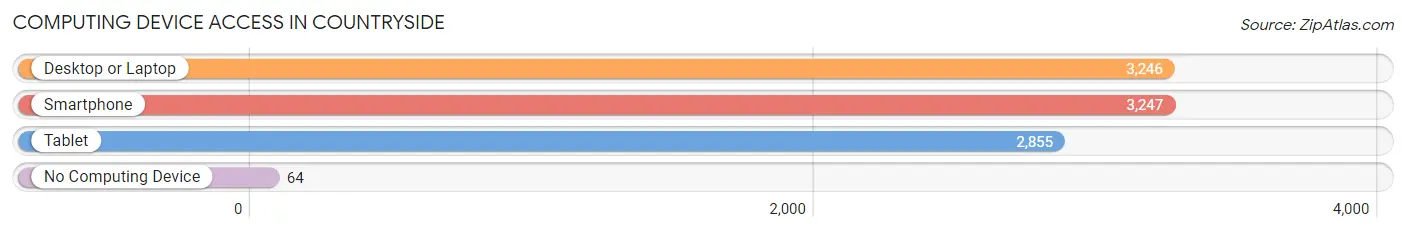
| Device Type | # Households | % Households |
| Desktop or Laptop | 3,246 | 94.0% |
| Smartphone | 3,247 | 94.0% |
| Tablet | 2,855 | 82.7% |
| No Computing Device | 64 | 1.8% |
| Total | 3,454 | 100.0% |
Internet Access in Countryside
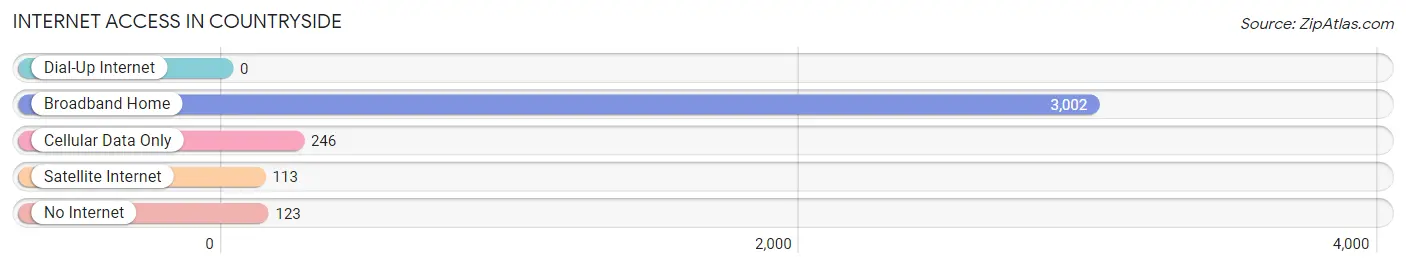
| Internet Type | # Households | % Households |
| Dial-Up Internet | 0 | 0.0% |
| Broadband Home | 3,002 | 86.9% |
| Cellular Data Only | 246 | 7.1% |
| Satellite Internet | 113 | 3.3% |
| No Internet | 123 | 3.6% |
| Total | 3,454 | 100.0% |
Countryside Summary
Countryside, Virginia is a small town located in the northern part of the state, in Fairfax County. It is a part of the Washington Metropolitan Area, and is located just outside of the city of Washington, D.C. The town has a population of approximately 8,000 people, and is a popular destination for those looking to escape the hustle and bustle of the city.
History
Countryside was first settled in the late 1700s by a group of Quakers from Pennsylvania. The town was originally known as “Quaker Town”, and was a small farming community. In the early 1800s, the town was renamed “Countryside”, and the population began to grow. The town was officially incorporated in 1874, and the population continued to grow throughout the 19th century.
In the early 20th century, Countryside began to experience a period of rapid growth. The town was connected to the Washington, D.C. metro area by the Washington and Old Dominion Railroad in the 1920s, and the population began to increase. The town was also home to a number of large estates, and was a popular destination for wealthy Washingtonians.
Geography
Countryside is located in the northern part of Fairfax County, Virginia. It is situated on the banks of the Potomac River, and is bordered by the towns of Great Falls and McLean. The town is located just outside of the city of Washington, D.C., and is part of the Washington Metropolitan Area.
The town is situated on a rolling landscape, and is surrounded by forests and parks. The town is home to a number of small lakes and streams, and is a popular destination for outdoor activities such as fishing, hiking, and camping.
Economy
Countryside is a primarily residential community, and the majority of the town’s economy is based on the service industry. The town is home to a number of small businesses, including restaurants, retail stores, and professional services. The town is also home to a number of large estates, and is a popular destination for wealthy Washingtonians.
Demographics
As of the 2010 census, Countryside had a population of 8,000 people. The town is predominantly white, with a small African American population. The median household income is $100,000, and the median home value is $500,000. The town is home to a number of large estates, and is a popular destination for wealthy Washingtonians.
Conclusion
Countryside, Virginia is a small town located in the northern part of the state, in Fairfax County. It is a part of the Washington Metropolitan Area, and is located just outside of the city of Washington, D.C. The town has a population of approximately 8,000 people, and is a popular destination for those looking to escape the hustle and bustle of the city. The town is predominantly white, with a small African American population, and the median household income is $100,000. The town is home to a number of small businesses, and is a popular destination for outdoor activities such as fishing, hiking, and camping. Countryside is a popular destination for those looking to escape the hustle and bustle of the city, and is a great place to call home.
Common Questions
What is Per Capita Income in Countryside?
Per Capita income in Countryside is $57,786.
What is the Median Family Income in Countryside?
Median Family Income in Countryside is $172,250.
What is the Median Household income in Countryside?
Median Household Income in Countryside is $132,295.
What is Income or Wage Gap in Countryside?
Income or Wage Gap in Countryside is 29.1%.
Women in Countryside earn 70.9 cents for every dollar earned by a man.
What is Inequality or Gini Index in Countryside?
Inequality or Gini Index in Countryside is 0.32.
What is the Total Population of Countryside?
Total Population of Countryside is 9,646.
What is the Total Male Population of Countryside?
Total Male Population of Countryside is 4,745.
What is the Total Female Population of Countryside?
Total Female Population of Countryside is 4,901.
What is the Ratio of Males per 100 Females in Countryside?
There are 96.82 Males per 100 Females in Countryside.
What is the Ratio of Females per 100 Males in Countryside?
There are 103.29 Females per 100 Males in Countryside.
What is the Median Population Age in Countryside?
Median Population Age in Countryside is 35.7 Years.
What is the Average Family Size in Countryside
Average Family Size in Countryside is 3.3 People.
What is the Average Household Size in Countryside
Average Household Size in Countryside is 2.8 People.
How Large is the Labor Force in Countryside?
There are 5,824 People in the Labor Forcein in Countryside.
What is the Percentage of People in the Labor Force in Countryside?
76.2% of People are in the Labor Force in Countryside.
What is the Unemployment Rate in Countryside?
Unemployment Rate in Countryside is 3.1%.