Cities with the Highest Percentage of Population with a Degree in Multidisciplinary Studies in Virginia
RELATED REPORTS & OPTIONS
Multidisciplinary Studies
Virginia
Compare Cities
Map of Cities with the Highest Percentage of Population with a Degree in Multidisciplinary Studies in Virginia
0.0%
50.0%
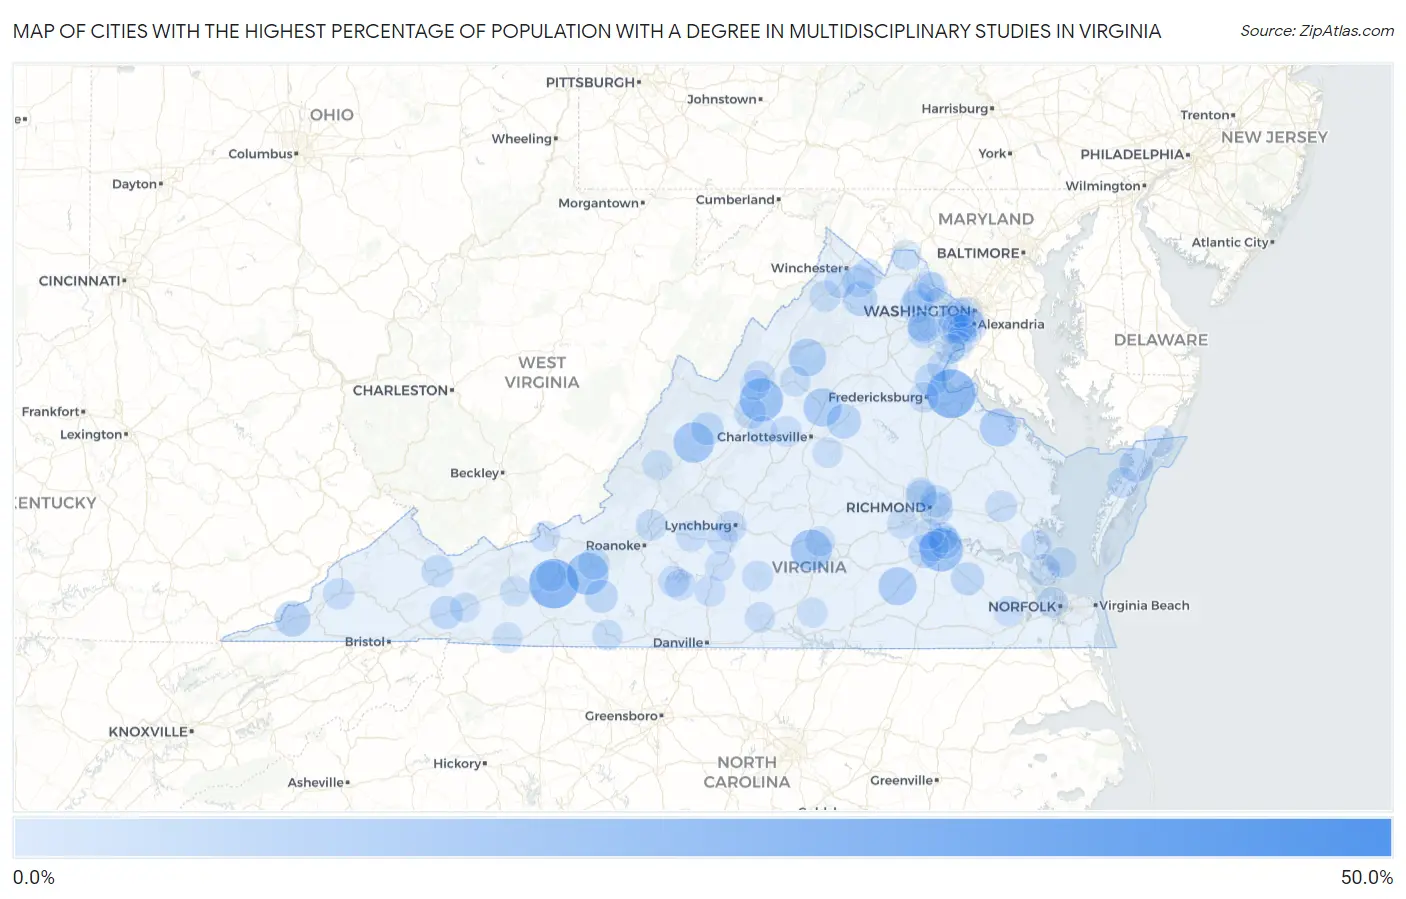
Cities with the Highest Percentage of Population with a Degree in Multidisciplinary Studies in Virginia
| City | % Graduates | vs State | vs National | |
| 1. | Port Republic | 47.2% | 1.1%(+46.0)#1 | 0.88%(+46.3)#27 |
| 2. | Draper | 23.8% | 1.1%(+22.7)#2 | 0.88%(+22.9)#87 |
| 3. | Fairview Beach | 23.0% | 1.1%(+21.9)#3 | 0.88%(+22.1)#93 |
| 4. | Weyers Cave | 16.7% | 1.1%(+15.6)#4 | 0.88%(+15.8)#147 |
| 5. | Afton | 16.7% | 1.1%(+15.5)#5 | 0.88%(+15.8)#151 |
| 6. | Fort Lee | 16.6% | 1.1%(+15.4)#6 | 0.88%(+15.7)#155 |
| 7. | Riner | 15.2% | 1.1%(+14.1)#7 | 0.88%(+14.3)#177 |
| 8. | Hampden Sydney | 13.8% | 1.1%(+12.7)#8 | 0.88%(+12.9)#211 |
| 9. | Goshen | 13.3% | 1.1%(+12.2)#9 | 0.88%(+12.5)#226 |
| 10. | Ruckersville | 10.8% | 1.1%(+9.68)#10 | 0.88%(+9.95)#306 |
| 11. | Mckenney | 10.5% | 1.1%(+9.38)#11 | 0.88%(+9.65)#319 |
| 12. | Montross | 10.4% | 1.1%(+9.25)#12 | 0.88%(+9.52)#323 |
| 13. | Stanley | 9.7% | 1.1%(+8.57)#13 | 0.88%(+8.84)#359 |
| 14. | Dinwiddie | 9.6% | 1.1%(+8.43)#14 | 0.88%(+8.70)#368 |
| 15. | Pennington Gap | 7.9% | 1.1%(+6.77)#15 | 0.88%(+7.04)#477 |
| 16. | Hutchison | 7.6% | 1.1%(+6.47)#16 | 0.88%(+6.74)#499 |
| 17. | Gordonsville | 6.7% | 1.1%(+5.57)#17 | 0.88%(+5.84)#590 |
| 18. | Shenandoah Farms | 6.1% | 1.1%(+4.91)#18 | 0.88%(+5.18)#685 |
| 19. | Bloxom | 5.9% | 1.1%(+4.73)#19 | 0.88%(+5.00)#718 |
| 20. | Matoaca | 5.3% | 1.1%(+4.20)#20 | 0.88%(+4.47)#815 |
| 21. | Montrose | 5.2% | 1.1%(+4.10)#21 | 0.88%(+4.37)#840 |
| 22. | Waverly | 5.1% | 1.1%(+3.94)#22 | 0.88%(+4.21)#879 |
| 23. | Chilhowie | 4.9% | 1.1%(+3.74)#23 | 0.88%(+4.01)#920 |
| 24. | Stone Ridge | 4.9% | 1.1%(+3.71)#24 | 0.88%(+3.98)#932 |
| 25. | Floyd | 4.8% | 1.1%(+3.70)#25 | 0.88%(+3.97)#934 |
| 26. | Stafford Courthouse | 4.7% | 1.1%(+3.54)#26 | 0.88%(+3.81)#966 |
| 27. | Hopewell | 4.7% | 1.1%(+3.53)#27 | 0.88%(+3.80)#971 |
| 28. | Craigsville | 4.5% | 1.1%(+3.40)#28 | 0.88%(+3.67)#1,006 |
| 29. | East Highland Park | 3.8% | 1.1%(+2.69)#29 | 0.88%(+2.96)#1,198 |
| 30. | Boyce | 3.8% | 1.1%(+2.68)#30 | 0.88%(+2.95)#1,203 |
| 31. | Verona | 3.8% | 1.1%(+2.68)#31 | 0.88%(+2.95)#1,206 |
| 32. | Brambleton | 3.8% | 1.1%(+2.66)#32 | 0.88%(+2.93)#1,211 |
| 33. | Cedar Bluff | 3.6% | 1.1%(+2.50)#33 | 0.88%(+2.77)#1,277 |
| 34. | Manassas | 3.6% | 1.1%(+2.42)#34 | 0.88%(+2.69)#1,318 |
| 35. | Dumbarton | 3.6% | 1.1%(+2.41)#35 | 0.88%(+2.68)#1,322 |
| 36. | Loch Lomond | 3.4% | 1.1%(+2.26)#36 | 0.88%(+2.53)#1,384 |
| 37. | Christiansburg | 3.4% | 1.1%(+2.22)#37 | 0.88%(+2.49)#1,399 |
| 38. | West Point | 3.3% | 1.1%(+2.11)#38 | 0.88%(+2.38)#1,455 |
| 39. | Strasburg | 3.0% | 1.1%(+1.81)#39 | 0.88%(+2.08)#1,622 |
| 40. | Norton | 3.0% | 1.1%(+1.81)#40 | 0.88%(+2.08)#1,624 |
| 41. | Troutville | 2.9% | 1.1%(+1.79)#41 | 0.88%(+2.06)#1,637 |
| 42. | Bethel Manor | 2.8% | 1.1%(+1.68)#42 | 0.88%(+1.95)#1,704 |
| 43. | Captains Cove | 2.8% | 1.1%(+1.65)#43 | 0.88%(+1.92)#1,719 |
| 44. | Belmont Estates | 2.8% | 1.1%(+1.62)#44 | 0.88%(+1.89)#1,733 |
| 45. | Huntington | 2.7% | 1.1%(+1.55)#45 | 0.88%(+1.82)#1,771 |
| 46. | Kings Park | 2.7% | 1.1%(+1.54)#46 | 0.88%(+1.81)#1,788 |
| 47. | Stephens City | 2.6% | 1.1%(+1.50)#47 | 0.88%(+1.77)#1,815 |
| 48. | Union Hall | 2.6% | 1.1%(+1.43)#48 | 0.88%(+1.70)#1,872 |
| 49. | Brookneal | 2.6% | 1.1%(+1.41)#49 | 0.88%(+1.68)#1,885 |
| 50. | Penhook | 2.5% | 1.1%(+1.39)#50 | 0.88%(+1.66)#1,911 |
| 51. | Bedford | 2.5% | 1.1%(+1.33)#51 | 0.88%(+1.60)#1,957 |
| 52. | Lynchburg | 2.4% | 1.1%(+1.28)#52 | 0.88%(+1.55)#1,981 |
| 53. | Timberlake | 2.4% | 1.1%(+1.27)#53 | 0.88%(+1.54)#1,994 |
| 54. | Woodlake | 2.4% | 1.1%(+1.23)#54 | 0.88%(+1.50)#2,019 |
| 55. | Portsmouth | 2.3% | 1.1%(+1.19)#55 | 0.88%(+1.46)#2,061 |
| 56. | West Springfield | 2.3% | 1.1%(+1.14)#56 | 0.88%(+1.41)#2,116 |
| 57. | Gretna | 2.3% | 1.1%(+1.12)#57 | 0.88%(+1.39)#2,135 |
| 58. | Enon | 2.3% | 1.1%(+1.12)#58 | 0.88%(+1.39)#2,142 |
| 59. | Crozet | 2.3% | 1.1%(+1.12)#59 | 0.88%(+1.39)#2,146 |
| 60. | Woodburn | 2.2% | 1.1%(+1.04)#60 | 0.88%(+1.31)#2,233 |
| 61. | Onancock | 2.1% | 1.1%(+0.995)#61 | 0.88%(+1.27)#2,281 |
| 62. | Springfield | 2.1% | 1.1%(+0.994)#62 | 0.88%(+1.26)#2,282 |
| 63. | Halifax | 2.1% | 1.1%(+0.953)#63 | 0.88%(+1.22)#2,337 |
| 64. | Gloucester Point | 2.1% | 1.1%(+0.930)#64 | 0.88%(+1.20)#2,363 |
| 65. | Chester | 2.1% | 1.1%(+0.929)#65 | 0.88%(+1.20)#2,364 |
| 66. | Poquoson | 2.0% | 1.1%(+0.864)#66 | 0.88%(+1.13)#2,442 |
| 67. | Leesylvania | 2.0% | 1.1%(+0.859)#67 | 0.88%(+1.13)#2,448 |
| 68. | Narrows | 2.0% | 1.1%(+0.859)#68 | 0.88%(+1.13)#2,450 |
| 69. | Stuart | 2.0% | 1.1%(+0.841)#69 | 0.88%(+1.11)#2,472 |
| 70. | Arlington | 1.9% | 1.1%(+0.800)#70 | 0.88%(+1.07)#2,528 |
| 71. | Pulaski | 1.9% | 1.1%(+0.780)#71 | 0.88%(+1.05)#2,556 |
| 72. | Quantico Base | 1.9% | 1.1%(+0.774)#72 | 0.88%(+1.04)#2,563 |
| 73. | Alexandria | 1.9% | 1.1%(+0.769)#73 | 0.88%(+1.04)#2,572 |
| 74. | University Center | 1.9% | 1.1%(+0.765)#74 | 0.88%(+1.04)#2,578 |
| 75. | Fredericksburg | 1.9% | 1.1%(+0.718)#75 | 0.88%(+0.988)#2,632 |
| 76. | Elkton | 1.8% | 1.1%(+0.690)#76 | 0.88%(+0.960)#2,671 |
| 77. | Bridgewater | 1.8% | 1.1%(+0.677)#77 | 0.88%(+0.947)#2,684 |
| 78. | Kingstowne | 1.8% | 1.1%(+0.653)#78 | 0.88%(+0.923)#2,717 |
| 79. | Berryville | 1.8% | 1.1%(+0.650)#79 | 0.88%(+0.920)#2,727 |
| 80. | Independence | 1.8% | 1.1%(+0.626)#80 | 0.88%(+0.896)#2,773 |
| 81. | Wytheville | 1.8% | 1.1%(+0.606)#81 | 0.88%(+0.876)#2,796 |
| 82. | Lake Monticello | 1.7% | 1.1%(+0.597)#82 | 0.88%(+0.867)#2,811 |
| 83. | Lovettsville | 1.7% | 1.1%(+0.583)#83 | 0.88%(+0.853)#2,842 |
| 84. | Fort Belvoir | 1.7% | 1.1%(+0.563)#84 | 0.88%(+0.833)#2,872 |
| 85. | Clifton Forge | 1.7% | 1.1%(+0.555)#85 | 0.88%(+0.825)#2,883 |
| 86. | Earlysville | 1.7% | 1.1%(+0.543)#86 | 0.88%(+0.813)#2,901 |
| 87. | Mason Neck | 1.7% | 1.1%(+0.531)#87 | 0.88%(+0.801)#2,915 |
| 88. | Waynesboro | 1.7% | 1.1%(+0.525)#88 | 0.88%(+0.795)#2,927 |
| 89. | Chase City | 1.7% | 1.1%(+0.504)#89 | 0.88%(+0.774)#2,977 |
| 90. | Farmville | 1.6% | 1.1%(+0.490)#90 | 0.88%(+0.760)#3,000 |
| 91. | Windsor | 1.6% | 1.1%(+0.458)#91 | 0.88%(+0.728)#3,068 |
| 92. | Reston | 1.6% | 1.1%(+0.431)#92 | 0.88%(+0.701)#3,124 |
| 93. | Colonial Heights | 1.6% | 1.1%(+0.420)#93 | 0.88%(+0.690)#3,151 |
| 94. | Countryside | 1.6% | 1.1%(+0.412)#94 | 0.88%(+0.682)#3,168 |
| 95. | Falls Church | 1.5% | 1.1%(+0.395)#95 | 0.88%(+0.665)#3,203 |
| 96. | Laurel | 1.5% | 1.1%(+0.341)#96 | 0.88%(+0.611)#3,335 |
| 97. | Sudley | 1.5% | 1.1%(+0.339)#97 | 0.88%(+0.609)#3,340 |
| 98. | Woodbridge | 1.5% | 1.1%(+0.321)#98 | 0.88%(+0.591)#3,382 |
| 99. | Altavista | 1.4% | 1.1%(+0.263)#99 | 0.88%(+0.533)#3,497 |
| 100. | Marion | 1.4% | 1.1%(+0.262)#100 | 0.88%(+0.532)#3,501 |
Common Questions
What are the Top 10 Cities with the Highest Percentage of Population with a Degree in Multidisciplinary Studies in Virginia?
Top 10 Cities with the Highest Percentage of Population with a Degree in Multidisciplinary Studies in Virginia are:
#1
23.8%
#2
23.0%
#3
16.7%
#4
16.6%
#5
15.2%
#6
13.8%
#7
13.3%
#8
10.8%
#9
10.5%
#10
10.4%
What city has the Highest Percentage of Population with a Degree in Multidisciplinary Studies in Virginia?
Draper has the Highest Percentage of Population with a Degree in Multidisciplinary Studies in Virginia with 23.8%.
What is the Percentage of Population with a Degree in Multidisciplinary Studies in the State of Virginia?
Percentage of Population with a Degree in Multidisciplinary Studies in Virginia is 1.1%.
What is the Percentage of Population with a Degree in Multidisciplinary Studies in the United States?
Percentage of Population with a Degree in Multidisciplinary Studies in the United States is 0.88%.