North Shore, VA Map & Demographics
North Shore Map
North Shore Overview
$68,107
PER CAPITA INCOME
$129,490
AVG FAMILY INCOME
$109,688
AVG HOUSEHOLD INCOME
43.1%
WAGE / INCOME GAP [ % ]
56.9¢/ $1
WAGE / INCOME GAP [ $ ]
$7,110
FAMILY INCOME DEFICIT
0.44
INEQUALITY / GINI INDEX
3,588
TOTAL POPULATION
1,855
MALE POPULATION
1,733
FEMALE POPULATION
107.04
MALES / 100 FEMALES
93.42
FEMALES / 100 MALES
61.7
MEDIAN AGE
2.4
AVG FAMILY SIZE
2.2
AVG HOUSEHOLD SIZE
1,345
LABOR FORCE [ PEOPLE ]
40.7%
PERCENT IN LABOR FORCE
3.9%
UNEMPLOYMENT RATE
Income in North Shore
Income Overview in North Shore
Per Capita Income in North Shore is $68,107, while median incomes of families and households are $129,490 and $109,688 respectively.
| Characteristic | Number | Measure |
| Per Capita Income | 3,588 | $68,107 |
| Median Family Income | 1,406 | $129,490 |
| Mean Family Income | 1,406 | $167,833 |
| Median Household Income | 1,646 | $109,688 |
| Mean Household Income | 1,646 | $151,454 |
| Income Deficit | 1,406 | $7,110 |
| Wage / Income Gap (%) | 3,588 | 43.07% |
| Wage / Income Gap ($) | 3,588 | 56.93¢ per $1 |
| Gini / Inequality Index | 3,588 | 0.44 |
Earnings by Sex in North Shore
Average Earnings in North Shore are $61,012, $80,966 for men and $46,094 for women, a difference of 43.1%.
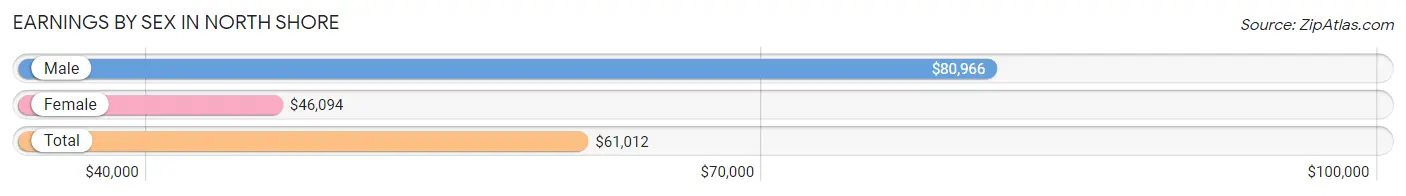
| Sex | Number | Average Earnings |
| Male | 829 (55.0%) | $80,966 |
| Female | 677 (45.0%) | $46,094 |
| Total | 1,506 (100.0%) | $61,012 |
Earnings by Sex by Income Bracket in North Shore
The most common earnings brackets in North Shore are $100,000+ for men (374 | 45.1%) and $100,000+ for women (112 | 16.5%).
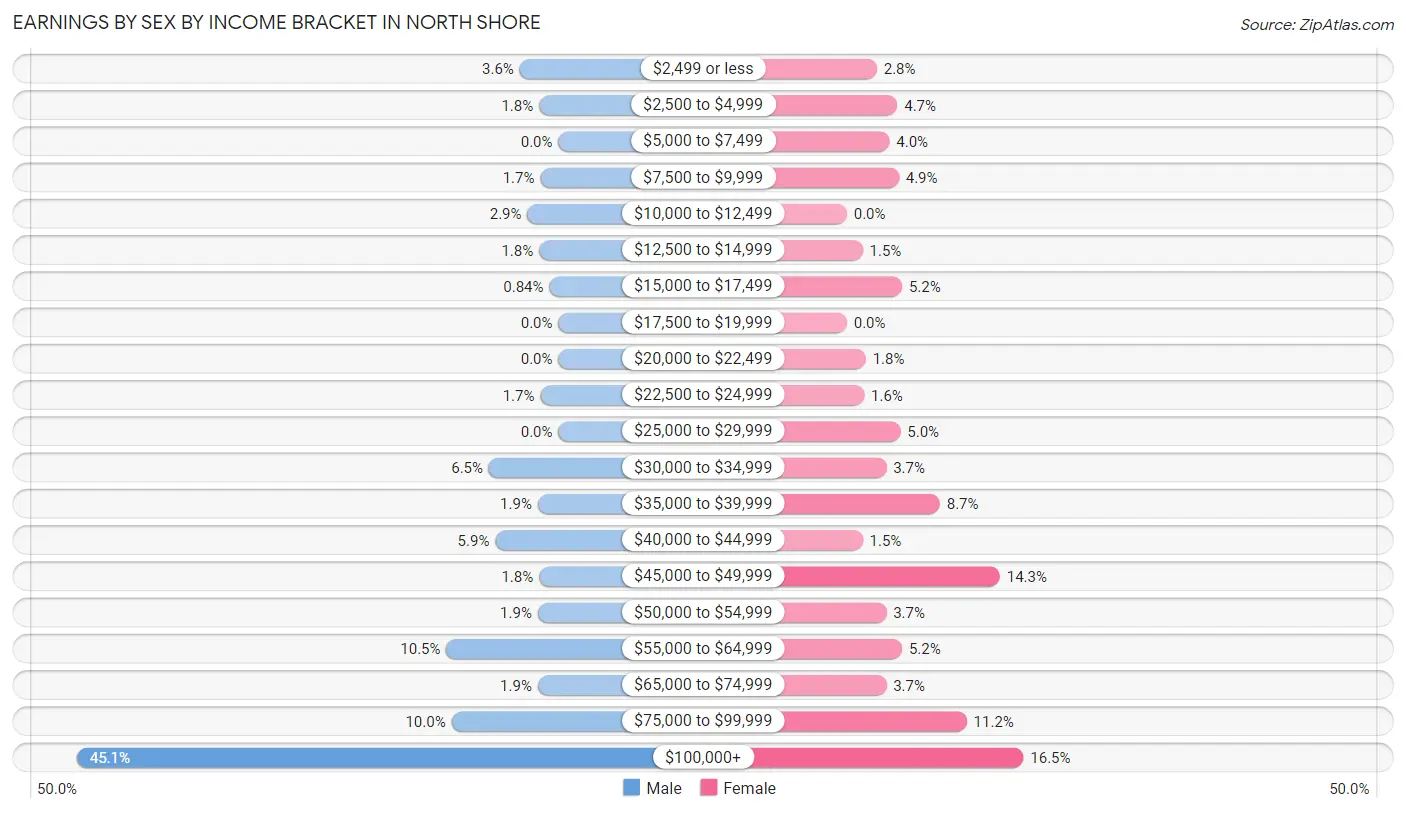
| Income | Male | Female |
| $2,499 or less | 30 (3.6%) | 19 (2.8%) |
| $2,500 to $4,999 | 15 (1.8%) | 32 (4.7%) |
| $5,000 to $7,499 | 0 (0.0%) | 27 (4.0%) |
| $7,500 to $9,999 | 14 (1.7%) | 33 (4.9%) |
| $10,000 to $12,499 | 24 (2.9%) | 0 (0.0%) |
| $12,500 to $14,999 | 15 (1.8%) | 10 (1.5%) |
| $15,000 to $17,499 | 7 (0.8%) | 35 (5.2%) |
| $17,500 to $19,999 | 0 (0.0%) | 0 (0.0%) |
| $20,000 to $22,499 | 0 (0.0%) | 12 (1.8%) |
| $22,500 to $24,999 | 14 (1.7%) | 11 (1.6%) |
| $25,000 to $29,999 | 0 (0.0%) | 34 (5.0%) |
| $30,000 to $34,999 | 54 (6.5%) | 25 (3.7%) |
| $35,000 to $39,999 | 16 (1.9%) | 59 (8.7%) |
| $40,000 to $44,999 | 49 (5.9%) | 10 (1.5%) |
| $45,000 to $49,999 | 15 (1.8%) | 97 (14.3%) |
| $50,000 to $54,999 | 16 (1.9%) | 25 (3.7%) |
| $55,000 to $64,999 | 87 (10.5%) | 35 (5.2%) |
| $65,000 to $74,999 | 16 (1.9%) | 25 (3.7%) |
| $75,000 to $99,999 | 83 (10.0%) | 76 (11.2%) |
| $100,000+ | 374 (45.1%) | 112 (16.5%) |
| Total | 829 (100.0%) | 677 (100.0%) |
Earnings by Sex by Educational Attainment in North Shore
Average earnings in North Shore are $87,824 for men and $46,701 for women, a difference of 46.8%. Men with an educational attainment of bachelor's degree enjoy the highest average annual earnings of $101,341, while those with college or associate's degree education earn the least with $56,310. Women with an educational attainment of graduate degree earn the most with the average annual earnings of $89,028, while those with bachelor's degree education have the smallest earnings of $45,481.
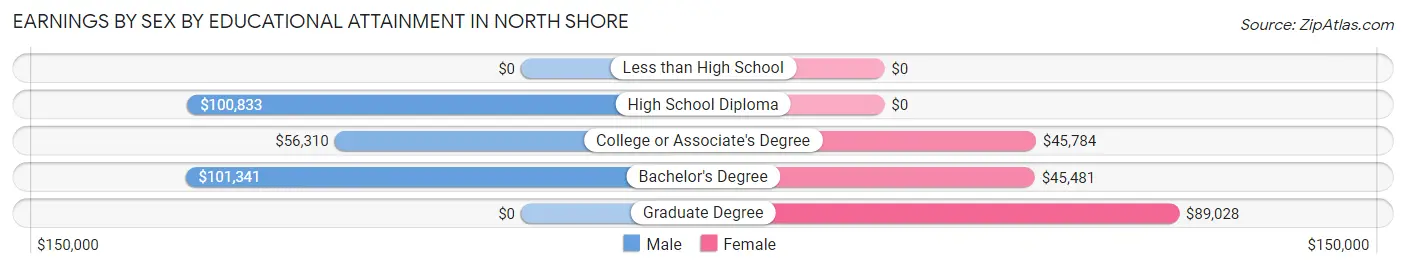
| Educational Attainment | Male Income | Female Income |
| Less than High School | - | - |
| High School Diploma | $100,833 | $0 |
| College or Associate's Degree | $56,310 | $45,784 |
| Bachelor's Degree | $101,341 | $45,481 |
| Graduate Degree | - | - |
| Total | $87,824 | $46,701 |
Family Income in North Shore
Family Income Brackets in North Shore
According to the North Shore family income data, there are 344 families falling into the $200,000+ income range, which is the most common income bracket and makes up 24.5% of all families.
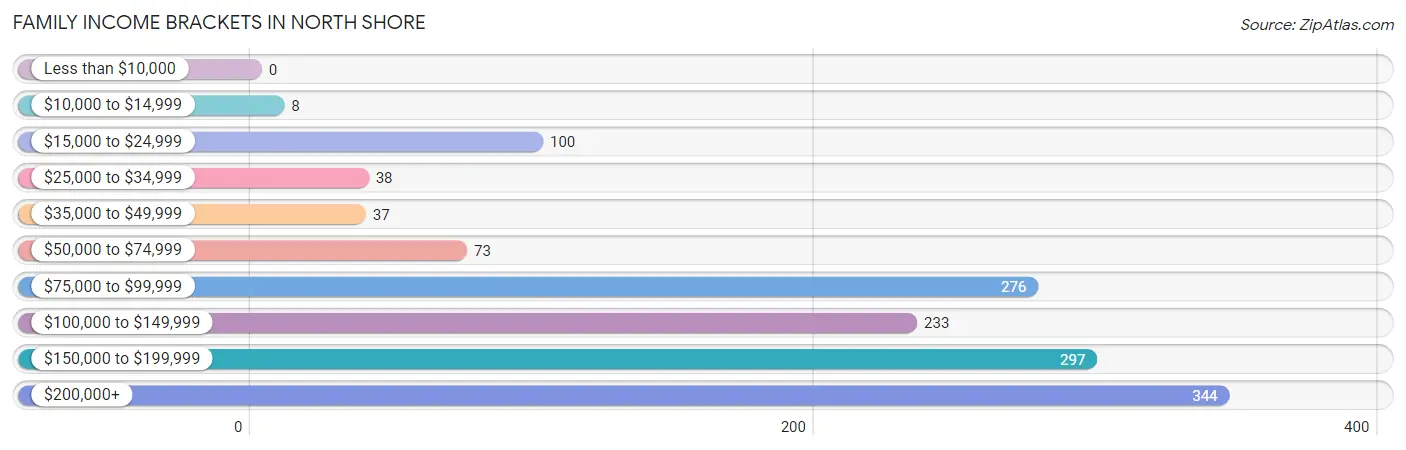
| Income Bracket | # Families | % Families |
| Less than $10,000 | 0 | 0.0% |
| $10,000 to $14,999 | 8 | 0.6% |
| $15,000 to $24,999 | 100 | 7.1% |
| $25,000 to $34,999 | 38 | 2.7% |
| $35,000 to $49,999 | 37 | 2.6% |
| $50,000 to $74,999 | 73 | 5.2% |
| $75,000 to $99,999 | 276 | 19.6% |
| $100,000 to $149,999 | 233 | 16.6% |
| $150,000 to $199,999 | 297 | 21.1% |
| $200,000+ | 344 | 24.5% |
Family Income by Famaliy Size in North Shore
4-person families (158 | 11.2%) account for the highest median family income in North Shore with $172,917 per family, while 2-person families (1,028 | 73.1%) have the highest median income of $63,980 per family member.
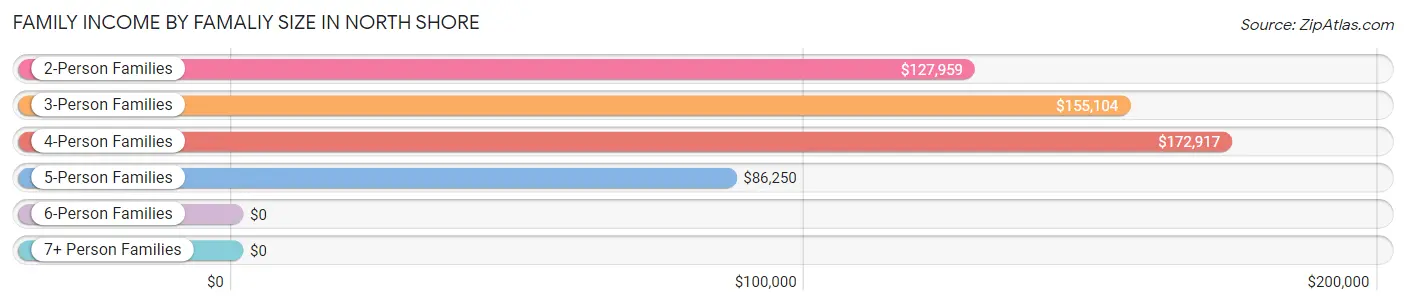
| Income Bracket | # Families | Median Income |
| 2-Person Families | 1,028 (73.1%) | $127,959 |
| 3-Person Families | 187 (13.3%) | $155,104 |
| 4-Person Families | 158 (11.2%) | $172,917 |
| 5-Person Families | 33 (2.4%) | $86,250 |
| 6-Person Families | 0 (0.0%) | $0 |
| 7+ Person Families | 0 (0.0%) | $0 |
| Total | 1,406 (100.0%) | $129,490 |
Family Income by Number of Earners in North Shore
The median family income in North Shore is $129,490, with families comprising 2 earners (427) having the highest median family income of $178,194, while families with no earners (516) have the lowest median family income of $85,921, accounting for 30.4% and 36.7% of families, respectively.
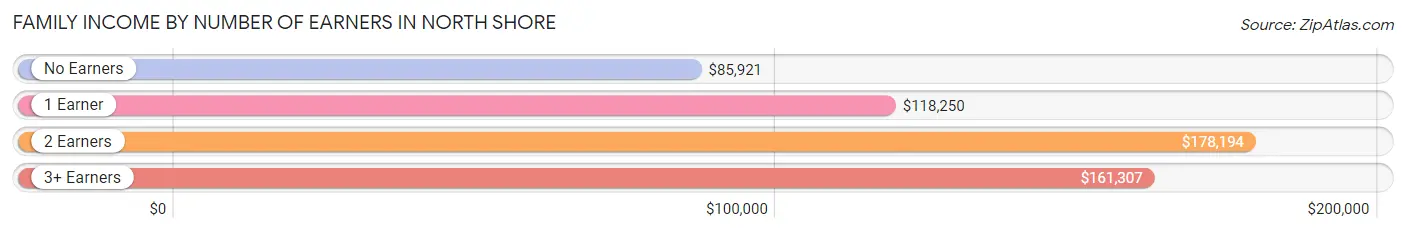
| Number of Earners | # Families | Median Income |
| No Earners | 516 (36.7%) | $85,921 |
| 1 Earner | 408 (29.0%) | $118,250 |
| 2 Earners | 427 (30.4%) | $178,194 |
| 3+ Earners | 55 (3.9%) | $161,307 |
| Total | 1,406 (100.0%) | $129,490 |
Household Income in North Shore
Household Income Brackets in North Shore
With 352 households falling in the category, the $200,000+ income range is the most frequent in North Shore, accounting for 21.4% of all households. In contrast, only 10 households (0.6%) fall into the less than $10,000 income bracket, making it the least populous group.
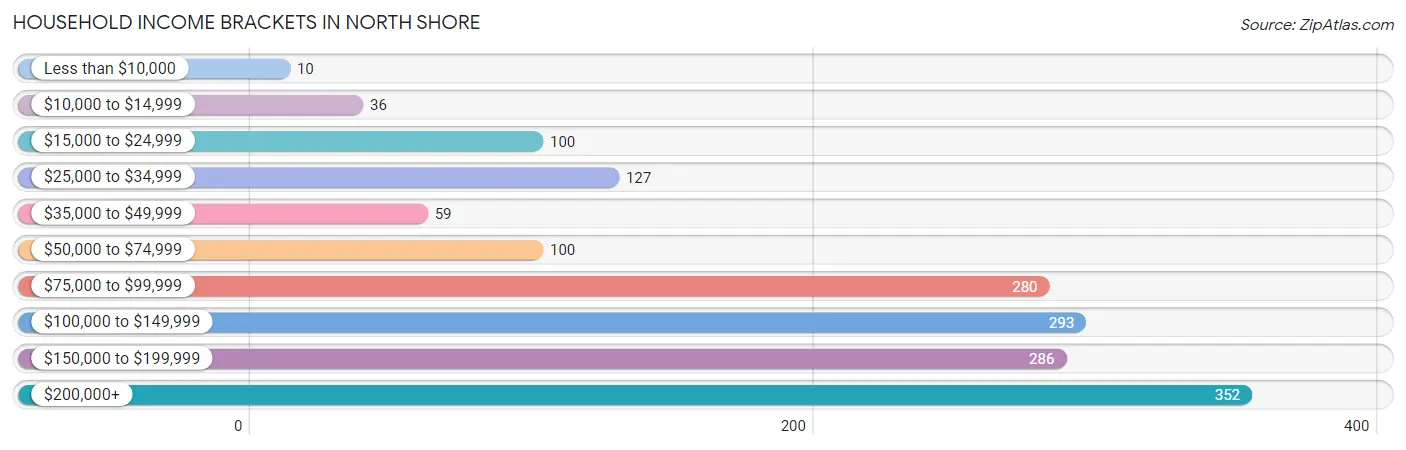
| Income Bracket | # Households | % Households |
| Less than $10,000 | 10 | 0.6% |
| $10,000 to $14,999 | 36 | 2.2% |
| $15,000 to $24,999 | 100 | 6.1% |
| $25,000 to $34,999 | 127 | 7.7% |
| $35,000 to $49,999 | 59 | 3.6% |
| $50,000 to $74,999 | 100 | 6.1% |
| $75,000 to $99,999 | 280 | 17.0% |
| $100,000 to $149,999 | 293 | 17.8% |
| $150,000 to $199,999 | 286 | 17.4% |
| $200,000+ | 352 | 21.4% |
Household Income by Householder Age in North Shore
The median household income in North Shore is $109,688, with the highest median household income of $152,222 found in the 45 to 64 years age bracket for the primary householder. A total of 634 households (38.5%) fall into this category.
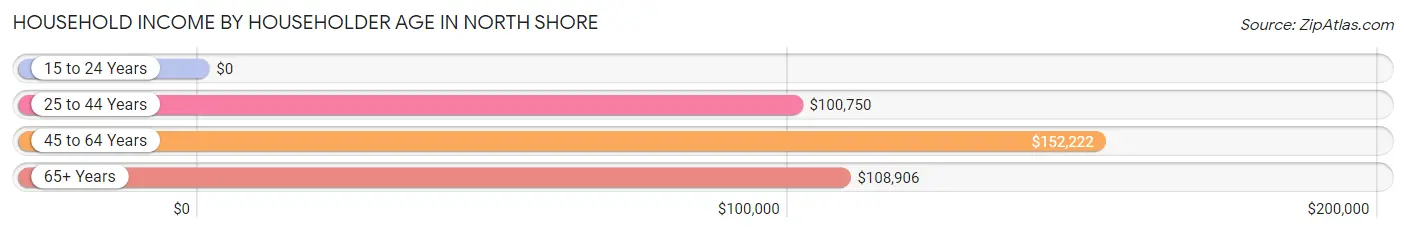
| Income Bracket | # Households | Median Income |
| 15 to 24 Years | 0 (0.0%) | $0 |
| 25 to 44 Years | 173 (10.5%) | $100,750 |
| 45 to 64 Years | 634 (38.5%) | $152,222 |
| 65+ Years | 839 (51.0%) | $108,906 |
| Total | 1,646 (100.0%) | $109,688 |
Poverty in North Shore
Income Below Poverty by Sex and Age in North Shore
With 8.9% poverty level for males and 3.6% for females among the residents of North Shore, 12 to 14 year old males and 65 to 74 year old females are the most vulnerable to poverty, with 34 males (68.0%) and 34 females (7.7%) in their respective age groups living below the poverty level.
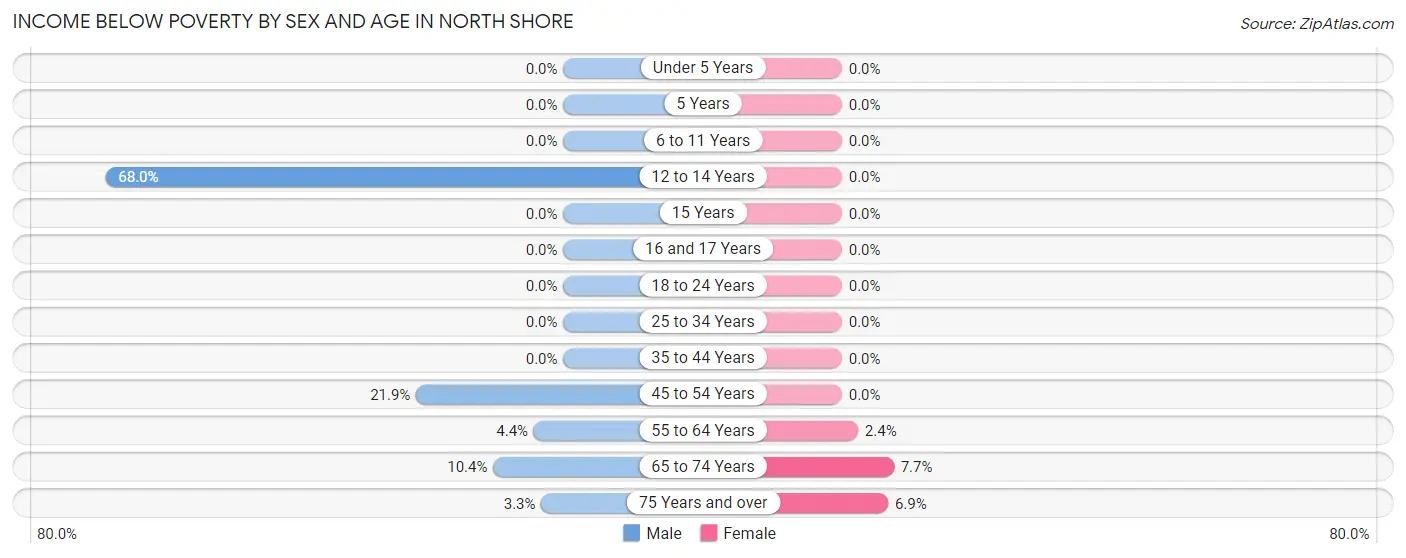
| Age Bracket | Male | Female |
| Under 5 Years | 0 (0.0%) | 0 (0.0%) |
| 5 Years | 0 (0.0%) | 0 (0.0%) |
| 6 to 11 Years | 0 (0.0%) | 0 (0.0%) |
| 12 to 14 Years | 34 (68.0%) | 0 (0.0%) |
| 15 Years | 0 (0.0%) | 0 (0.0%) |
| 16 and 17 Years | 0 (0.0%) | 0 (0.0%) |
| 18 to 24 Years | 0 (0.0%) | 0 (0.0%) |
| 25 to 34 Years | 0 (0.0%) | 0 (0.0%) |
| 35 to 44 Years | 0 (0.0%) | 0 (0.0%) |
| 45 to 54 Years | 52 (21.8%) | 0 (0.0%) |
| 55 to 64 Years | 15 (4.4%) | 10 (2.4%) |
| 65 to 74 Years | 55 (10.4%) | 34 (7.7%) |
| 75 Years and over | 9 (3.3%) | 19 (6.9%) |
| Total | 165 (8.9%) | 63 (3.6%) |
Income Above Poverty by Sex and Age in North Shore
According to the poverty statistics in North Shore, males aged under 5 years and females aged under 5 years are the age groups that are most secure financially, with 100.0% of males and 100.0% of females in these age groups living above the poverty line.
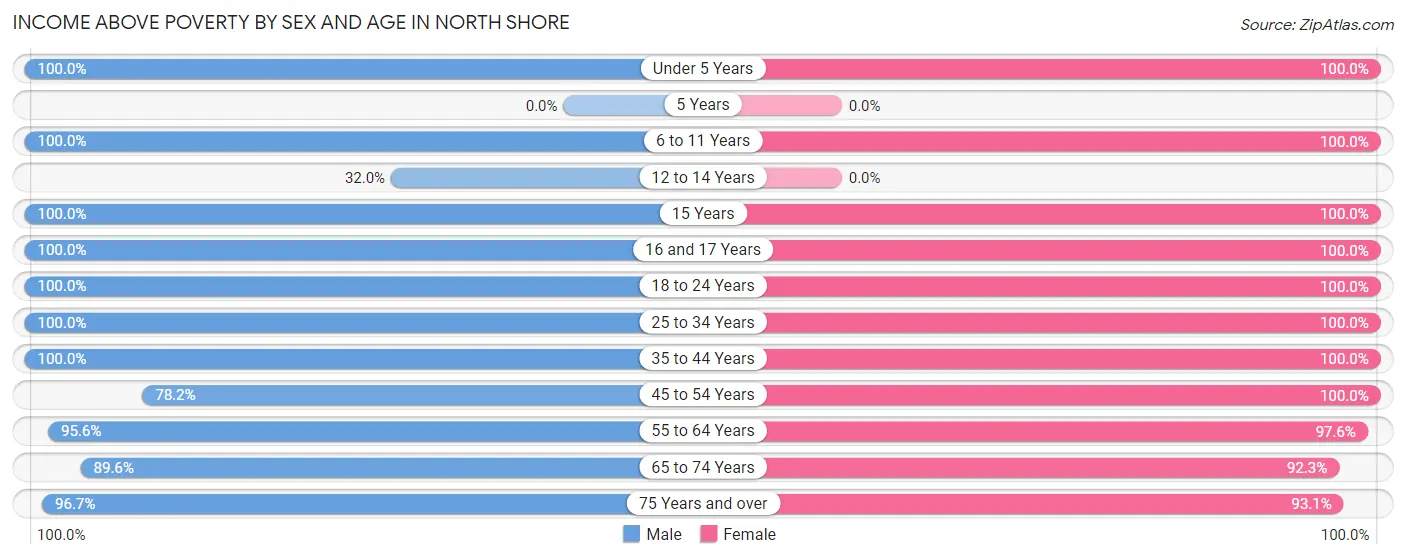
| Age Bracket | Male | Female |
| Under 5 Years | 36 (100.0%) | 15 (100.0%) |
| 5 Years | 0 (0.0%) | 0 (0.0%) |
| 6 to 11 Years | 39 (100.0%) | 59 (100.0%) |
| 12 to 14 Years | 16 (32.0%) | 0 (0.0%) |
| 15 Years | 35 (100.0%) | 50 (100.0%) |
| 16 and 17 Years | 29 (100.0%) | 62 (100.0%) |
| 18 to 24 Years | 34 (100.0%) | 25 (100.0%) |
| 25 to 34 Years | 128 (100.0%) | 47 (100.0%) |
| 35 to 44 Years | 118 (100.0%) | 115 (100.0%) |
| 45 to 54 Years | 186 (78.1%) | 223 (100.0%) |
| 55 to 64 Years | 328 (95.6%) | 409 (97.6%) |
| 65 to 74 Years | 474 (89.6%) | 407 (92.3%) |
| 75 Years and over | 267 (96.7%) | 258 (93.1%) |
| Total | 1,690 (91.1%) | 1,670 (96.4%) |
Income Below Poverty Among Married-Couple Families in North Shore
The poverty statistics for married-couple families in North Shore show that 4.0% or 52 of the total 1,316 families live below the poverty line. Families with 1 or 2 children have the highest poverty rate of 17.4%, comprising of 37 families. On the other hand, families with 3 or 4 children have the lowest poverty rate of 0.0%, which includes 0 families.
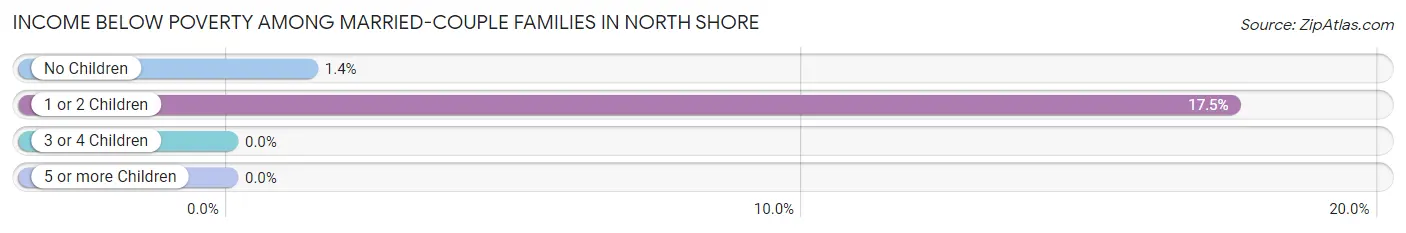
| Children | Above Poverty | Below Poverty |
| No Children | 1,063 (98.6%) | 15 (1.4%) |
| 1 or 2 Children | 175 (82.6%) | 37 (17.4%) |
| 3 or 4 Children | 26 (100.0%) | 0 (0.0%) |
| 5 or more Children | 0 (0.0%) | 0 (0.0%) |
| Total | 1,264 (96.1%) | 52 (4.0%) |
Income Below Poverty Among Single-Parent Households in North Shore
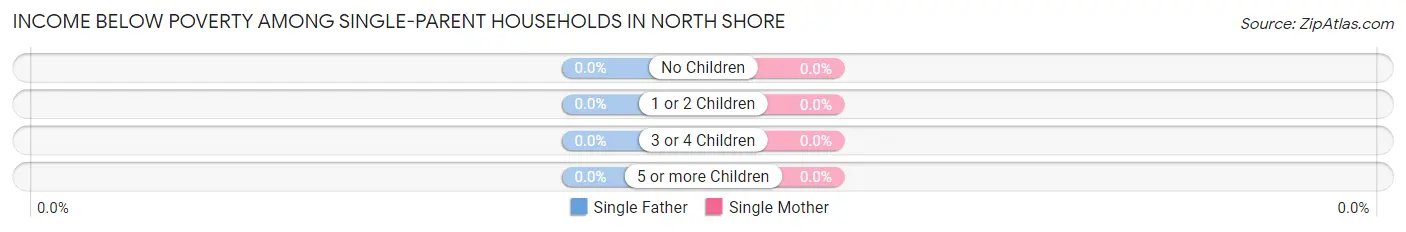
| Children | Single Father | Single Mother |
| No Children | 0 (0.0%) | 0 (0.0%) |
| 1 or 2 Children | 0 (0.0%) | 0 (0.0%) |
| 3 or 4 Children | 0 (0.0%) | 0 (0.0%) |
| 5 or more Children | 0 (0.0%) | 0 (0.0%) |
| Total | 0 (0.0%) | 0 (0.0%) |
Income Below Poverty Among Married-Couple vs Single-Parent Households in North Shore
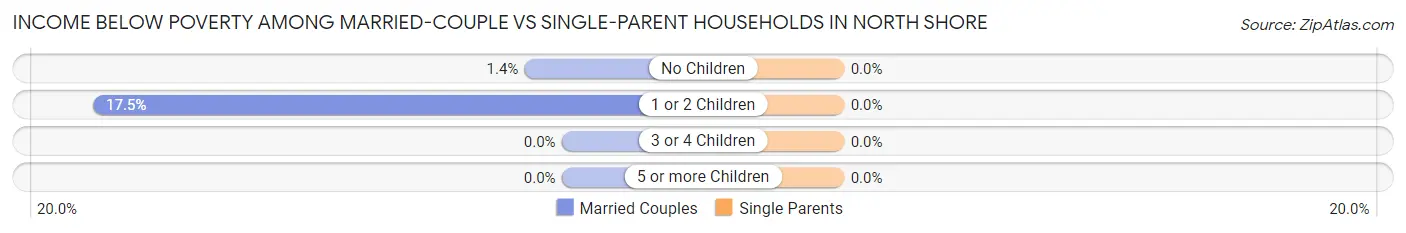
| Children | Married-Couple Families | Single-Parent Households |
| No Children | 15 (1.4%) | 0 (0.0%) |
| 1 or 2 Children | 37 (17.4%) | 0 (0.0%) |
| 3 or 4 Children | 0 (0.0%) | 0 (0.0%) |
| 5 or more Children | 0 (0.0%) | 0 (0.0%) |
| Total | 52 (4.0%) | 0 (0.0%) |
Race in North Shore
The most populous races in North Shore are White / Caucasian (3,401 | 94.8%), Two or more Races (143 | 4.0%), and Hispanic or Latino (96 | 2.7%).
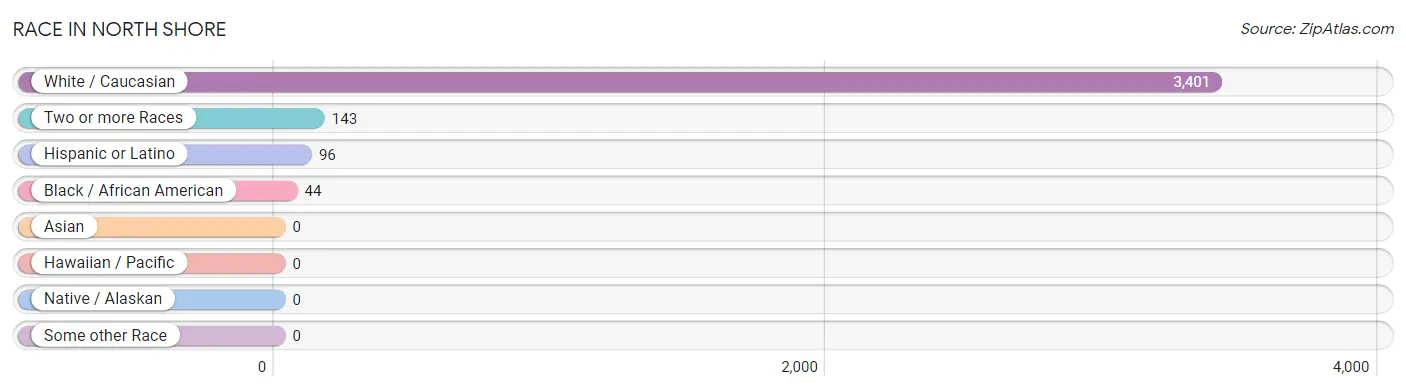
| Race | # Population | % Population |
| Asian | 0 | 0.0% |
| Black / African American | 44 | 1.2% |
| Hawaiian / Pacific | 0 | 0.0% |
| Hispanic or Latino | 96 | 2.7% |
| Native / Alaskan | 0 | 0.0% |
| White / Caucasian | 3,401 | 94.8% |
| Two or more Races | 143 | 4.0% |
| Some other Race | 0 | 0.0% |
| Total | 3,588 | 100.0% |
Ancestry in North Shore
The most populous ancestries reported in North Shore are German (819 | 22.8%), English (776 | 21.6%), Irish (640 | 17.8%), American (344 | 9.6%), and Italian (214 | 6.0%), together accounting for 77.8% of all North Shore residents.
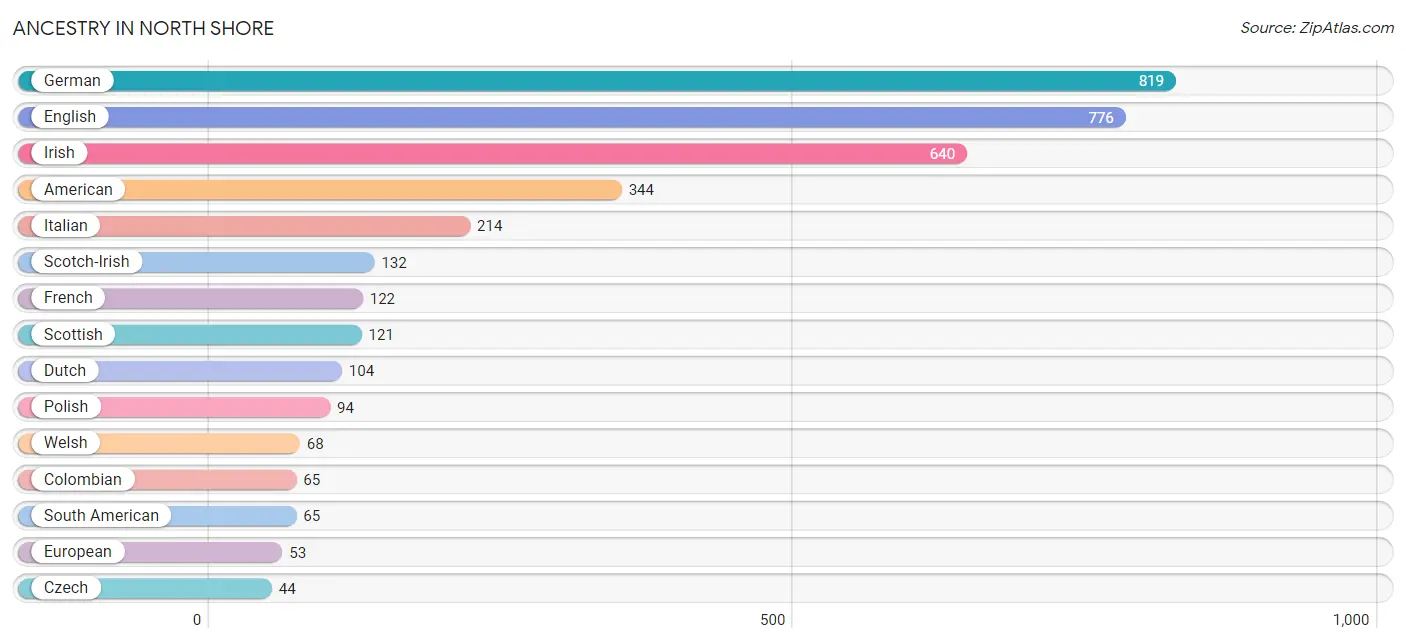
| Ancestry | # Population | % Population |
| American | 344 | 9.6% |
| Arab | 10 | 0.3% |
| Austrian | 14 | 0.4% |
| British | 21 | 0.6% |
| Canadian | 12 | 0.3% |
| Colombian | 65 | 1.8% |
| Cuban | 19 | 0.5% |
| Czech | 44 | 1.2% |
| Danish | 16 | 0.4% |
| Dutch | 104 | 2.9% |
| English | 776 | 21.6% |
| European | 53 | 1.5% |
| French | 122 | 3.4% |
| German | 819 | 22.8% |
| Greek | 13 | 0.4% |
| Hungarian | 15 | 0.4% |
| Irish | 640 | 17.8% |
| Italian | 214 | 6.0% |
| Lithuanian | 41 | 1.1% |
| Norwegian | 30 | 0.8% |
| Polish | 94 | 2.6% |
| Puerto Rican | 12 | 0.3% |
| Russian | 38 | 1.1% |
| Scotch-Irish | 132 | 3.7% |
| Scottish | 121 | 3.4% |
| Slovak | 13 | 0.4% |
| South American | 65 | 1.8% |
| Swedish | 22 | 0.6% |
| Ukrainian | 38 | 1.1% |
| Welsh | 68 | 1.9% | View All 30 Rows |
Immigrants in North Shore
The most numerous immigrant groups reported in North Shore came from Europe (102 | 2.8%), Netherlands (62 | 1.7%), Western Europe (62 | 1.7%), Eastern Europe (29 | 0.8%), and Lithuania (29 | 0.8%), together accounting for 7.9% of all North Shore residents.
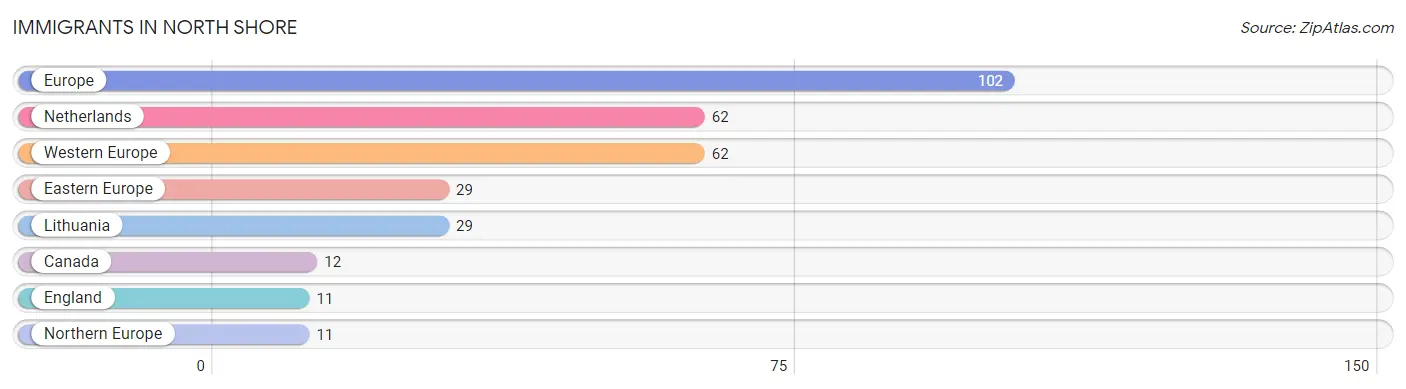
| Immigration Origin | # Population | % Population |
| Canada | 12 | 0.3% |
| Eastern Europe | 29 | 0.8% |
| England | 11 | 0.3% |
| Europe | 102 | 2.8% |
| Lithuania | 29 | 0.8% |
| Netherlands | 62 | 1.7% |
| Northern Europe | 11 | 0.3% |
| Western Europe | 62 | 1.7% | View All 8 Rows |
Sex and Age in North Shore
Sex and Age in North Shore
The most populous age groups in North Shore are 65 to 69 Years (318 | 17.1%) for men and 65 to 69 Years (306 | 17.7%) for women.
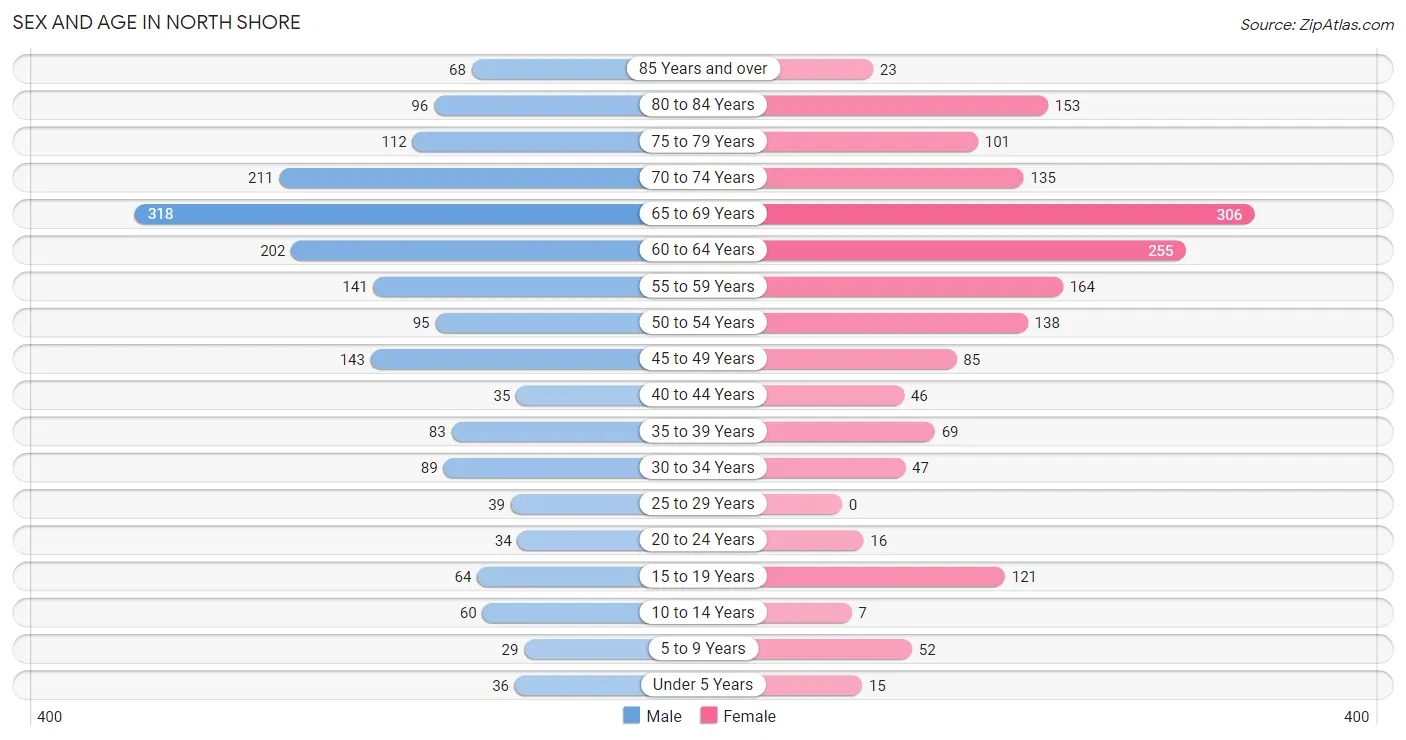
| Age Bracket | Male | Female |
| Under 5 Years | 36 (1.9%) | 15 (0.9%) |
| 5 to 9 Years | 29 (1.6%) | 52 (3.0%) |
| 10 to 14 Years | 60 (3.2%) | 7 (0.4%) |
| 15 to 19 Years | 64 (3.5%) | 121 (7.0%) |
| 20 to 24 Years | 34 (1.8%) | 16 (0.9%) |
| 25 to 29 Years | 39 (2.1%) | 0 (0.0%) |
| 30 to 34 Years | 89 (4.8%) | 47 (2.7%) |
| 35 to 39 Years | 83 (4.5%) | 69 (4.0%) |
| 40 to 44 Years | 35 (1.9%) | 46 (2.6%) |
| 45 to 49 Years | 143 (7.7%) | 85 (4.9%) |
| 50 to 54 Years | 95 (5.1%) | 138 (8.0%) |
| 55 to 59 Years | 141 (7.6%) | 164 (9.5%) |
| 60 to 64 Years | 202 (10.9%) | 255 (14.7%) |
| 65 to 69 Years | 318 (17.1%) | 306 (17.7%) |
| 70 to 74 Years | 211 (11.4%) | 135 (7.8%) |
| 75 to 79 Years | 112 (6.0%) | 101 (5.8%) |
| 80 to 84 Years | 96 (5.2%) | 153 (8.8%) |
| 85 Years and over | 68 (3.7%) | 23 (1.3%) |
| Total | 1,855 (100.0%) | 1,733 (100.0%) |
Families and Households in North Shore
Median Family Size in North Shore
The median family size in North Shore is 2.36 persons per family, with single male/father families (52 | 3.7%) accounting for the largest median family size of 2.73 persons per family. On the other hand, single female/mother families (38 | 2.7%) represent the smallest median family size with 1.89 persons per family.
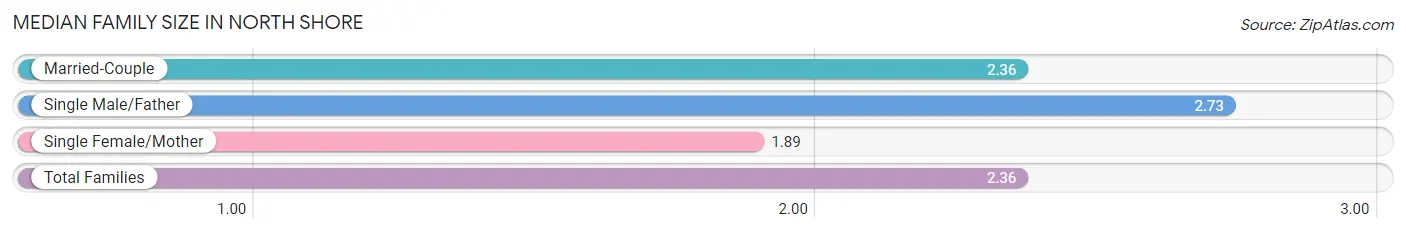
| Family Type | # Families | Family Size |
| Married-Couple | 1,316 (93.6%) | 2.36 |
| Single Male/Father | 52 (3.7%) | 2.73 |
| Single Female/Mother | 38 (2.7%) | 1.89 |
| Total Families | 1,406 (100.0%) | 2.36 |
Median Household Size in North Shore
The median household size in North Shore is 2.18 persons per household, with single male/father households (52 | 3.2%) accounting for the largest median household size of 2.73 persons per household. non-family households (240 | 14.6%) represent the smallest median household size with 1.04 persons per household.
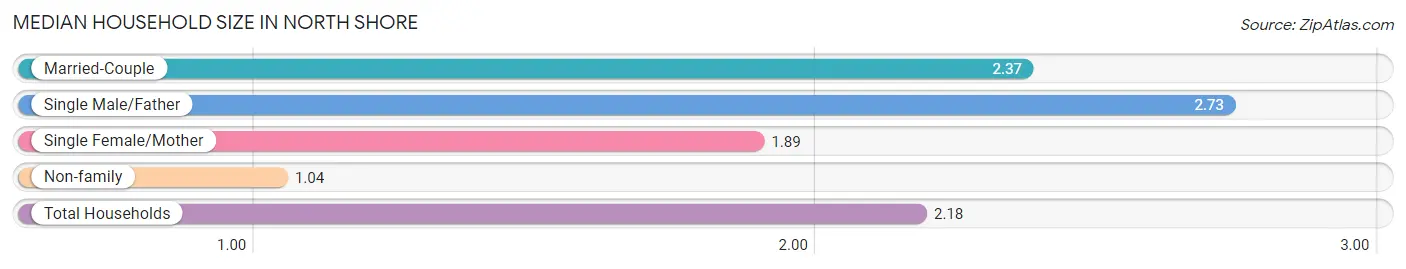
| Household Type | # Households | Household Size |
| Married-Couple | 1,316 (79.9%) | 2.37 |
| Single Male/Father | 52 (3.2%) | 2.73 |
| Single Female/Mother | 38 (2.3%) | 1.89 |
| Non-family | 240 (14.6%) | 1.04 |
| Total Households | 1,646 (100.0%) | 2.18 |
Household Size by Marriage Status in North Shore
Out of a total of 1,646 households in North Shore, 1,406 (85.4%) are family households, while 240 (14.6%) are nonfamily households. The most numerous type of family households are 2-person households, comprising 1,019, and the most common type of nonfamily households are 1-person households, comprising 231.
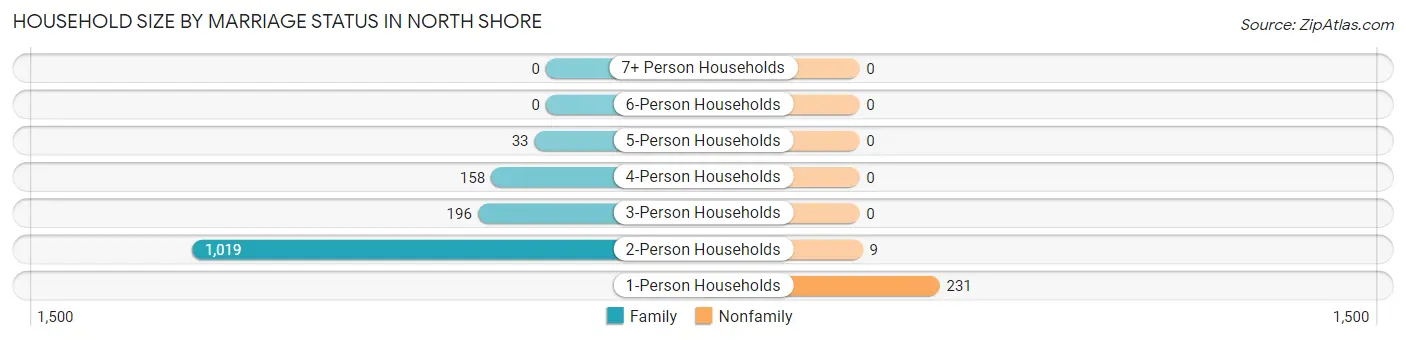
| Household Size | Family Households | Nonfamily Households |
| 1-Person Households | - | 231 (14.0%) |
| 2-Person Households | 1,019 (61.9%) | 9 (0.5%) |
| 3-Person Households | 196 (11.9%) | 0 (0.0%) |
| 4-Person Households | 158 (9.6%) | 0 (0.0%) |
| 5-Person Households | 33 (2.0%) | 0 (0.0%) |
| 6-Person Households | 0 (0.0%) | 0 (0.0%) |
| 7+ Person Households | 0 (0.0%) | 0 (0.0%) |
| Total | 1,406 (85.4%) | 240 (14.6%) |
Female Fertility in North Shore
Fertility by Age in North Shore
Average fertility rate in North Shore is 117.0 births per 1,000 women. Women in the age bracket of 20 to 34 years have the highest fertility rate with 635.0 births per 1,000 women. Women in the age bracket of 20 to 34 years acount for 80.0% of all women with births.
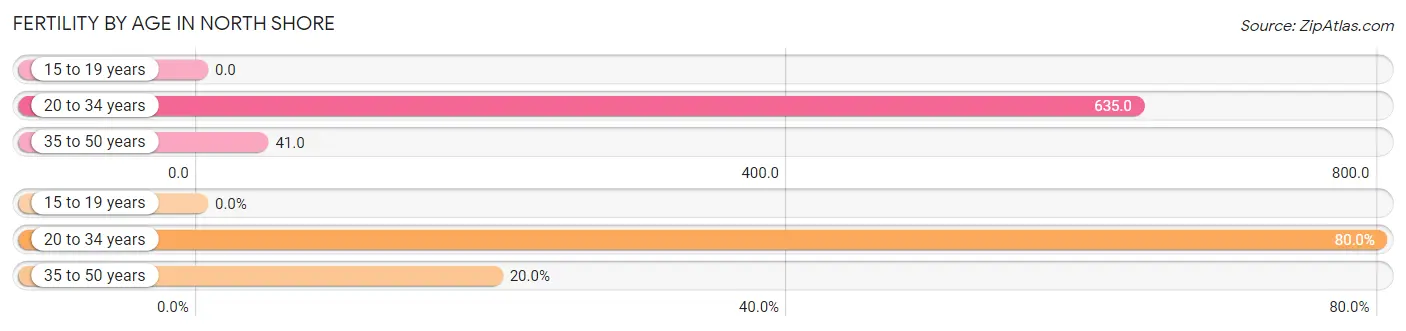
| Age Bracket | Women with Births | Births / 1,000 Women |
| 15 to 19 years | 0 (0.0%) | 0.0 |
| 20 to 34 years | 40 (80.0%) | 635.0 |
| 35 to 50 years | 10 (20.0%) | 41.0 |
| Total | 50 (100.0%) | 117.0 |
Fertility by Age by Marriage Status in North Shore
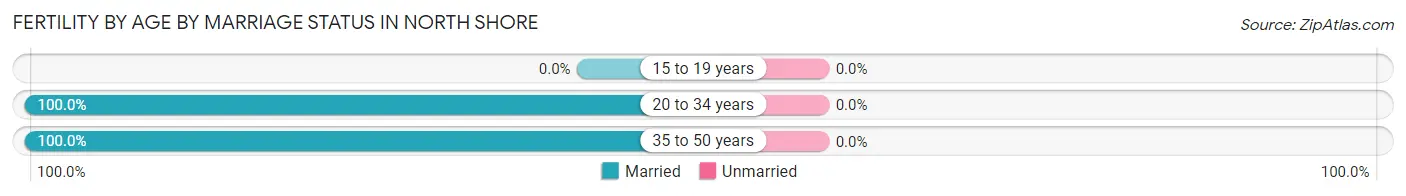
| Age Bracket | Married | Unmarried |
| 15 to 19 years | 0 (0.0%) | 0 (0.0%) |
| 20 to 34 years | 40 (100.0%) | 0 (0.0%) |
| 35 to 50 years | 10 (100.0%) | 0 (0.0%) |
| Total | 50 (100.0%) | 0 (0.0%) |
Fertility by Education in North Shore
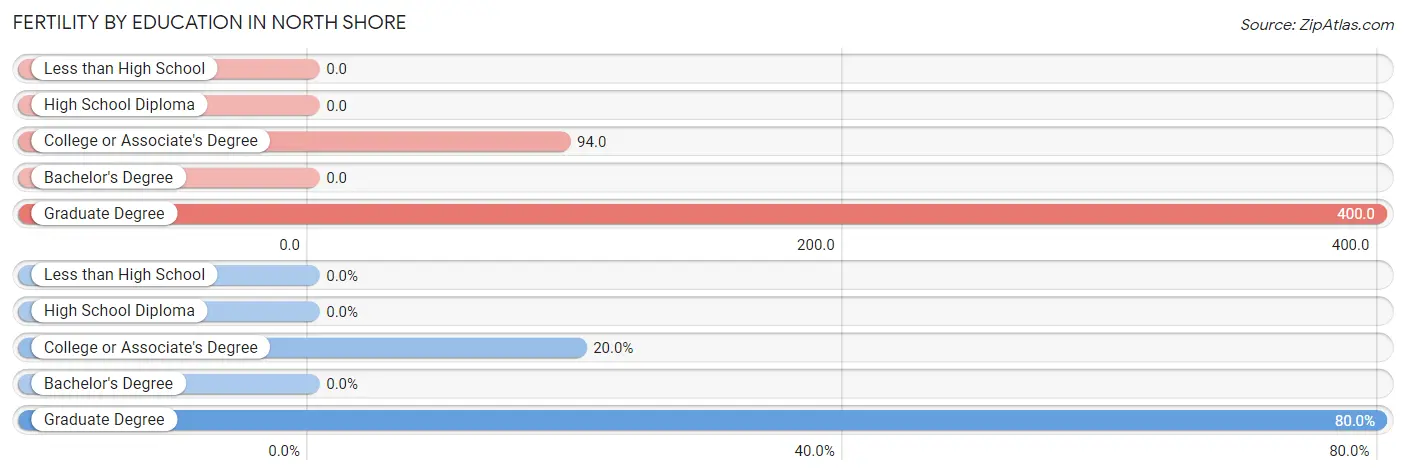
| Educational Attainment | Women with Births | Births / 1,000 Women |
| Less than High School | 0 (0.0%) | 0.0 |
| High School Diploma | 0 (0.0%) | 0.0 |
| College or Associate's Degree | 10 (20.0%) | 94.0 |
| Bachelor's Degree | 0 (0.0%) | 0.0 |
| Graduate Degree | 40 (80.0%) | 400.0 |
| Total | 50 (100.0%) | 117.0 |
Fertility by Education by Marriage Status in North Shore
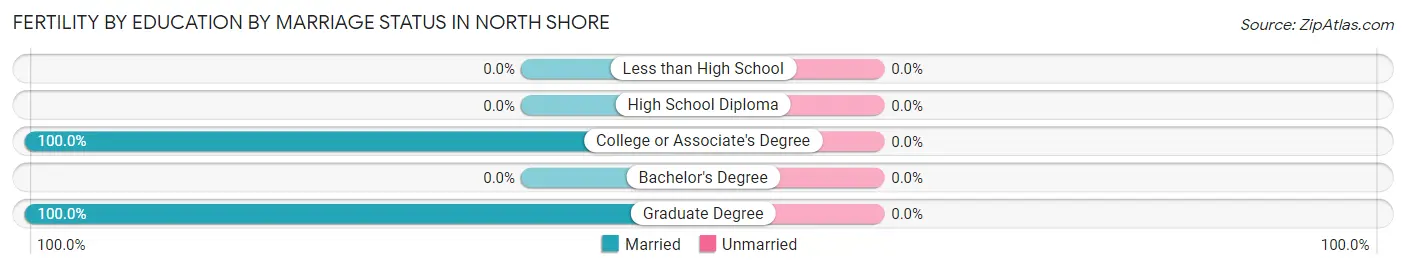
| Educational Attainment | Married | Unmarried |
| Less than High School | 0 (0.0%) | 0 (0.0%) |
| High School Diploma | 0 (0.0%) | 0 (0.0%) |
| College or Associate's Degree | 10 (100.0%) | 0 (0.0%) |
| Bachelor's Degree | 0 (0.0%) | 0 (0.0%) |
| Graduate Degree | 40 (100.0%) | 0 (0.0%) |
| Total | 50 (100.0%) | 0 (0.0%) |
Employment Characteristics in North Shore
Employment by Class of Employer in North Shore
Among the 1,283 employed individuals in North Shore, private company employees (725 | 56.5%), self-employed (not incorporated) (182 | 14.2%), and not-for-profit organizations (120 | 9.3%) make up the most common classes of employment.
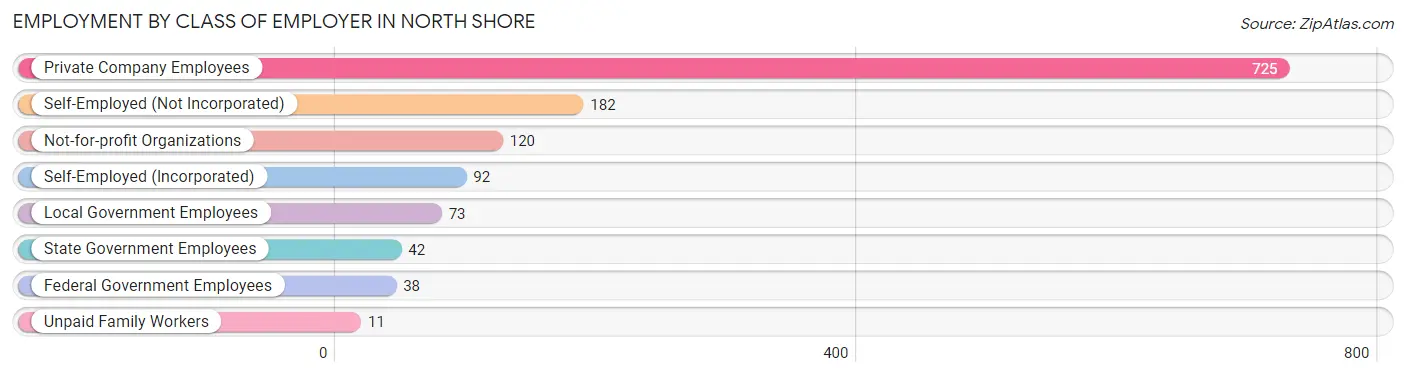
| Employer Class | # Employees | % Employees |
| Private Company Employees | 725 | 56.5% |
| Self-Employed (Incorporated) | 92 | 7.2% |
| Self-Employed (Not Incorporated) | 182 | 14.2% |
| Not-for-profit Organizations | 120 | 9.3% |
| Local Government Employees | 73 | 5.7% |
| State Government Employees | 42 | 3.3% |
| Federal Government Employees | 38 | 3.0% |
| Unpaid Family Workers | 11 | 0.9% |
| Total | 1,283 | 100.0% |
Employment Status by Age in North Shore
According to the labor force statistics for North Shore, out of the total population over 16 years of age (3,304), 40.7% or 1,345 individuals are in the labor force, with 3.9% or 52 of them unemployed. The age group with the highest labor force participation rate is 35 to 44 years, with 87.6% or 204 individuals in the labor force. Within the labor force, the 35 to 44 years age range has the highest percentage of unemployed individuals, with 9.3% or 19 of them being unemployed.
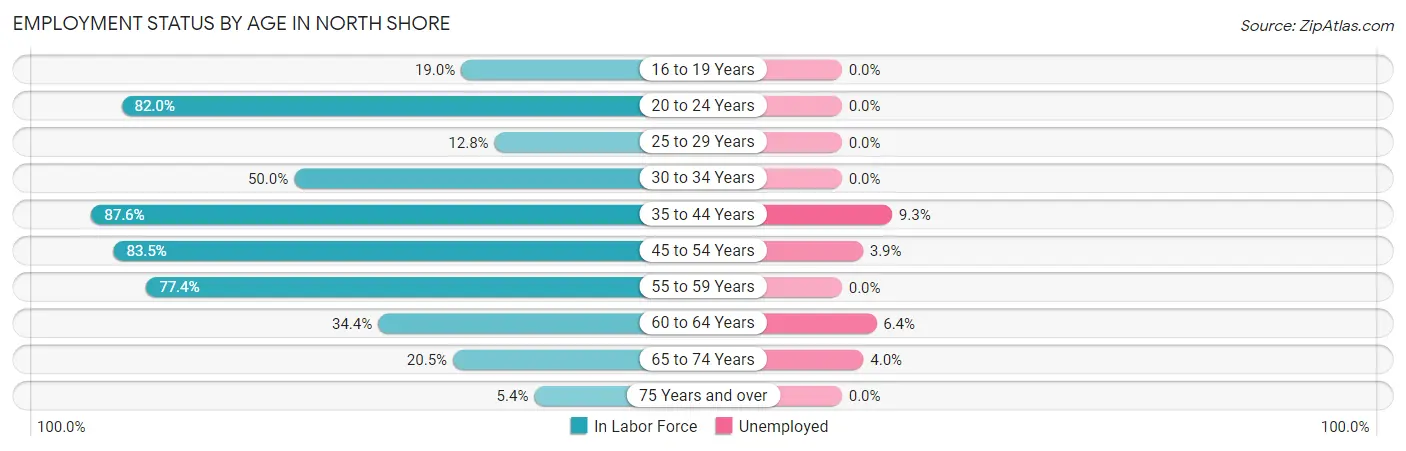
| Age Bracket | In Labor Force | Unemployed |
| 16 to 19 Years | 19 (19.0%) | 0 (0.0%) |
| 20 to 24 Years | 41 (82.0%) | 0 (0.0%) |
| 25 to 29 Years | 5 (12.8%) | 0 (0.0%) |
| 30 to 34 Years | 68 (50.0%) | 0 (0.0%) |
| 35 to 44 Years | 204 (87.6%) | 19 (9.3%) |
| 45 to 54 Years | 385 (83.5%) | 15 (3.9%) |
| 55 to 59 Years | 236 (77.4%) | 0 (0.0%) |
| 60 to 64 Years | 157 (34.4%) | 10 (6.4%) |
| 65 to 74 Years | 199 (20.5%) | 8 (4.0%) |
| 75 Years and over | 30 (5.4%) | 0 (0.0%) |
| Total | 1,345 (40.7%) | 52 (3.9%) |
Employment Status by Educational Attainment in North Shore
According to labor force statistics for North Shore, 64.7% of individuals (1,055) out of the total population between 25 and 64 years of age (1,631) are in the labor force, with 4.2% or 44 of them being unemployed. The group with the highest labor force participation rate are those with the educational attainment of bachelor's degree or higher, with 70.0% or 517 individuals in the labor force. Within the labor force, individuals with college / associate degree education have the highest percentage of unemployment, with 11.5% or 34 of them being unemployed.
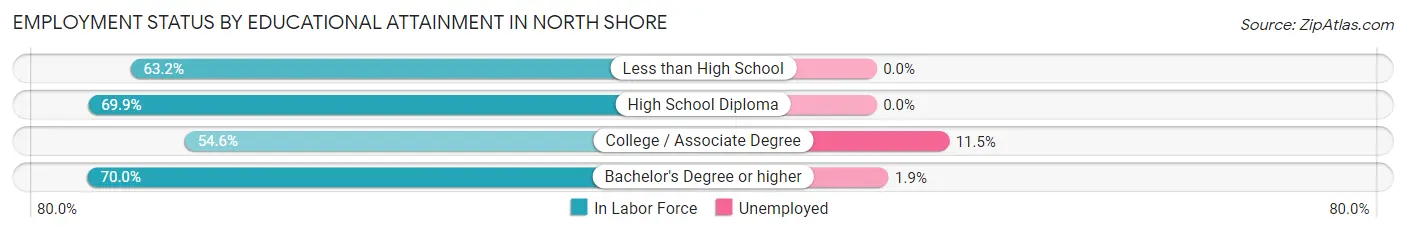
| Educational Attainment | In Labor Force | Unemployed |
| Less than High School | 24 (63.2%) | 0 (0.0%) |
| High School Diploma | 218 (69.9%) | 0 (0.0%) |
| College / Associate Degree | 296 (54.6%) | 62 (11.5%) |
| Bachelor's Degree or higher | 517 (70.0%) | 14 (1.9%) |
| Total | 1,055 (64.7%) | 69 (4.2%) |
Employment Occupations by Sex in North Shore
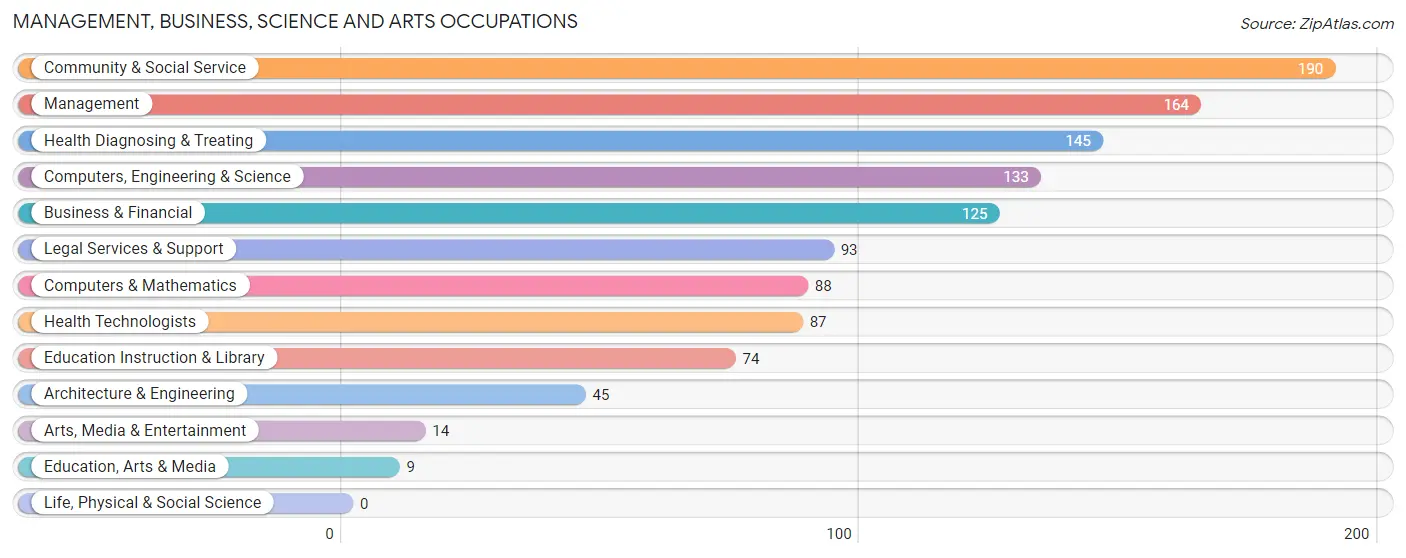
Management, Business, Science and Arts Occupations
The most common Management, Business, Science and Arts occupations in North Shore are Community & Social Service (190 | 14.7%), Management (164 | 12.7%), Health Diagnosing & Treating (145 | 11.2%), Computers, Engineering & Science (133 | 10.3%), and Business & Financial (125 | 9.7%).
Management, Business, Science and Arts Occupations by Sex
Within the Management, Business, Science and Arts occupations in North Shore, the most male-oriented occupations are Computers, Engineering & Science (100.0%), Computers & Mathematics (100.0%), and Architecture & Engineering (100.0%), while the most female-oriented occupations are Education, Arts & Media (100.0%), Education Instruction & Library (100.0%), and Arts, Media & Entertainment (100.0%).
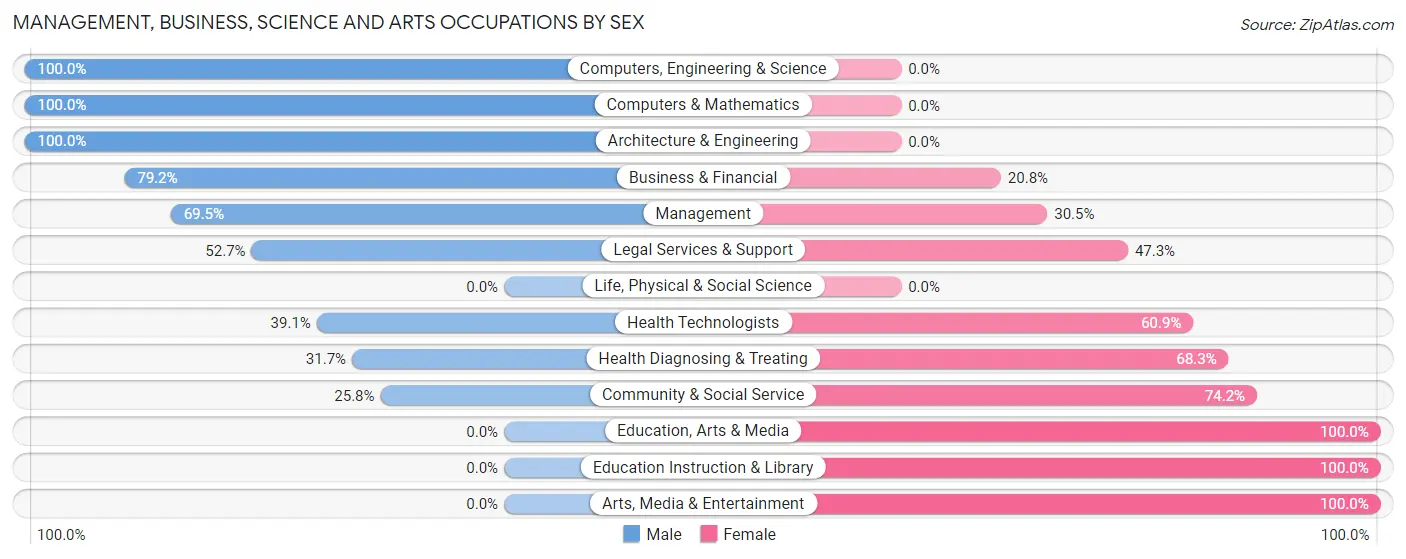
| Occupation | Male | Female |
| Management | 114 (69.5%) | 50 (30.5%) |
| Business & Financial | 99 (79.2%) | 26 (20.8%) |
| Computers, Engineering & Science | 133 (100.0%) | 0 (0.0%) |
| Computers & Mathematics | 88 (100.0%) | 0 (0.0%) |
| Architecture & Engineering | 45 (100.0%) | 0 (0.0%) |
| Life, Physical & Social Science | 0 (0.0%) | 0 (0.0%) |
| Community & Social Service | 49 (25.8%) | 141 (74.2%) |
| Education, Arts & Media | 0 (0.0%) | 9 (100.0%) |
| Legal Services & Support | 49 (52.7%) | 44 (47.3%) |
| Education Instruction & Library | 0 (0.0%) | 74 (100.0%) |
| Arts, Media & Entertainment | 0 (0.0%) | 14 (100.0%) |
| Health Diagnosing & Treating | 46 (31.7%) | 99 (68.3%) |
| Health Technologists | 34 (39.1%) | 53 (60.9%) |
| Total (Category) | 441 (58.3%) | 316 (41.7%) |
| Total (Overall) | 670 (51.9%) | 622 (48.1%) |
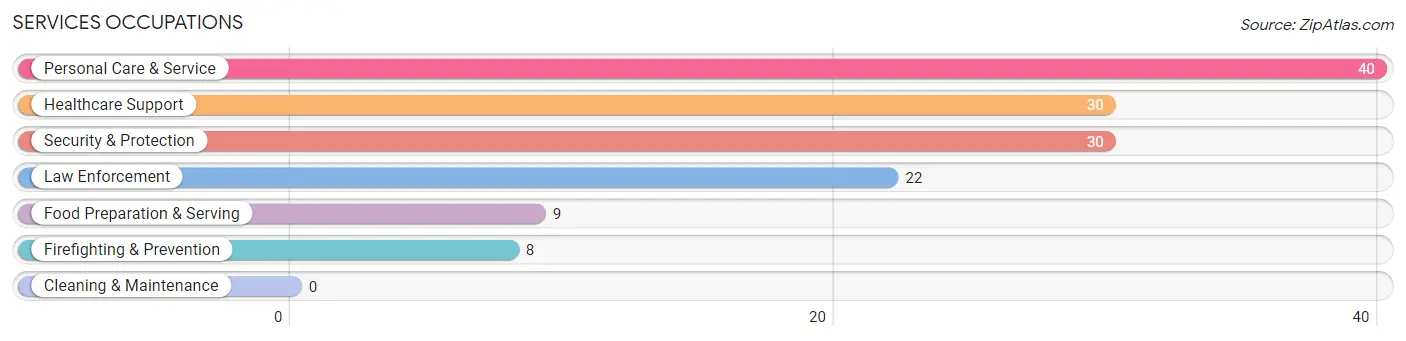
Services Occupations
The most common Services occupations in North Shore are Personal Care & Service (40 | 3.1%), Healthcare Support (30 | 2.3%), Security & Protection (30 | 2.3%), Law Enforcement (22 | 1.7%), and Food Preparation & Serving (9 | 0.7%).
Services Occupations by Sex
Within the Services occupations in North Shore, the most male-oriented occupations are Security & Protection (100.0%), Firefighting & Prevention (100.0%), and Law Enforcement (100.0%), while the most female-oriented occupations are Healthcare Support (100.0%), Food Preparation & Serving (100.0%), and Personal Care & Service (100.0%).
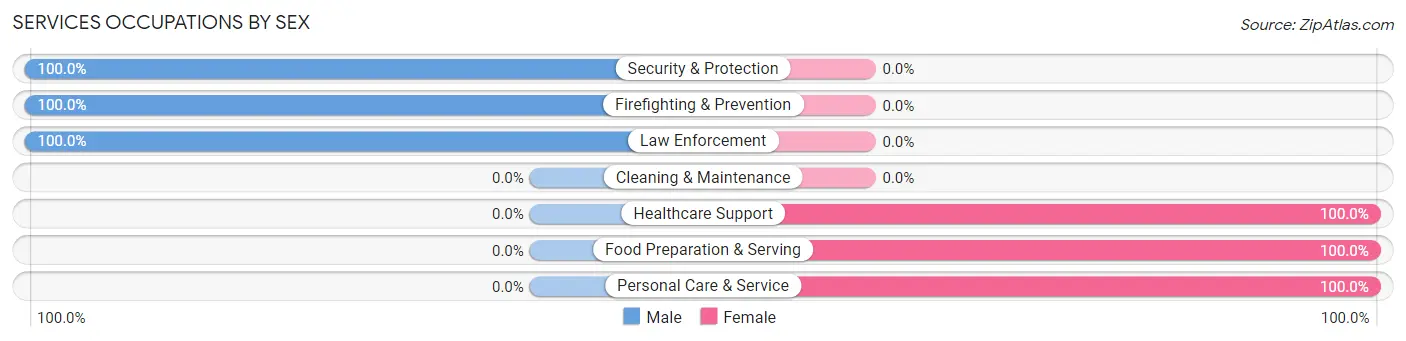
| Occupation | Male | Female |
| Healthcare Support | 0 (0.0%) | 30 (100.0%) |
| Security & Protection | 30 (100.0%) | 0 (0.0%) |
| Firefighting & Prevention | 8 (100.0%) | 0 (0.0%) |
| Law Enforcement | 22 (100.0%) | 0 (0.0%) |
| Food Preparation & Serving | 0 (0.0%) | 9 (100.0%) |
| Cleaning & Maintenance | 0 (0.0%) | 0 (0.0%) |
| Personal Care & Service | 0 (0.0%) | 40 (100.0%) |
| Total (Category) | 30 (27.5%) | 79 (72.5%) |
| Total (Overall) | 670 (51.9%) | 622 (48.1%) |
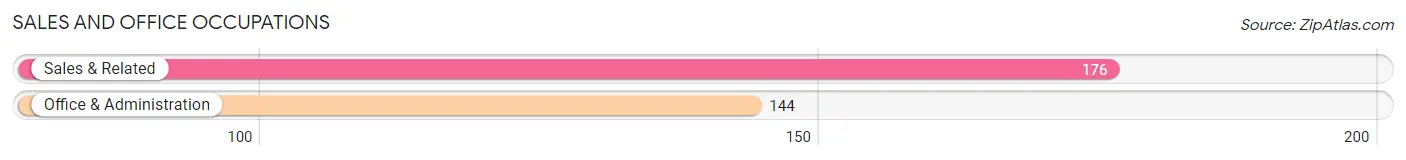
Sales and Office Occupations
The most common Sales and Office occupations in North Shore are Sales & Related (176 | 13.6%), and Office & Administration (144 | 11.2%).
Sales and Office Occupations by Sex
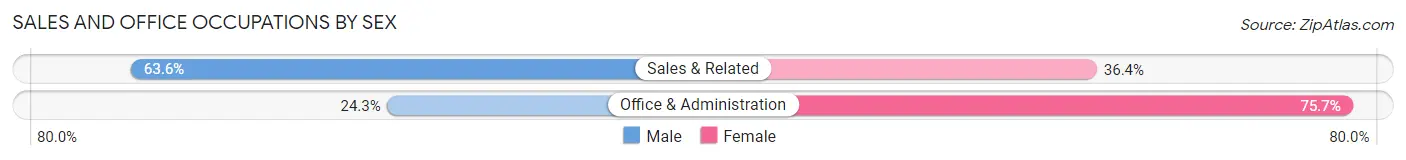
| Occupation | Male | Female |
| Sales & Related | 112 (63.6%) | 64 (36.4%) |
| Office & Administration | 35 (24.3%) | 109 (75.7%) |
| Total (Category) | 147 (45.9%) | 173 (54.1%) |
| Total (Overall) | 670 (51.9%) | 622 (48.1%) |
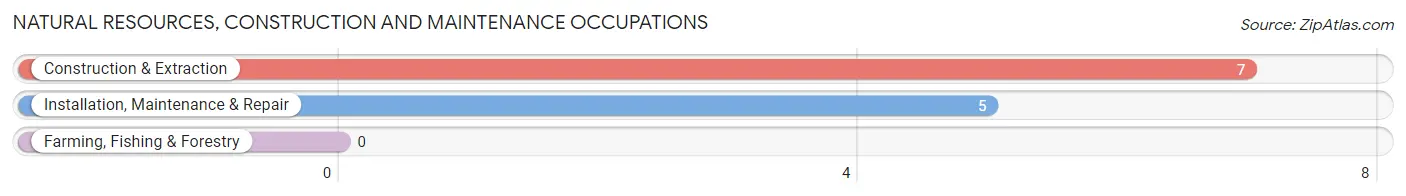
Natural Resources, Construction and Maintenance Occupations
The most common Natural Resources, Construction and Maintenance occupations in North Shore are Construction & Extraction (7 | 0.5%), and Installation, Maintenance & Repair (5 | 0.4%).
Natural Resources, Construction and Maintenance Occupations by Sex
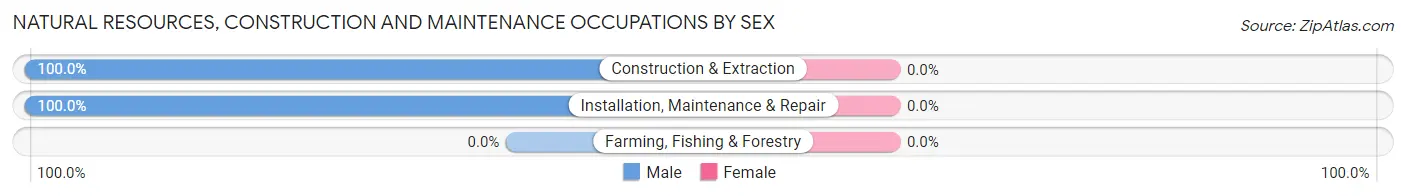
| Occupation | Male | Female |
| Farming, Fishing & Forestry | 0 (0.0%) | 0 (0.0%) |
| Construction & Extraction | 7 (100.0%) | 0 (0.0%) |
| Installation, Maintenance & Repair | 5 (100.0%) | 0 (0.0%) |
| Total (Category) | 12 (100.0%) | 0 (0.0%) |
| Total (Overall) | 670 (51.9%) | 622 (48.1%) |
Production, Transportation and Moving Occupations
The most common Production, Transportation and Moving occupations in North Shore are Transportation (62 | 4.8%), and Production (32 | 2.5%).
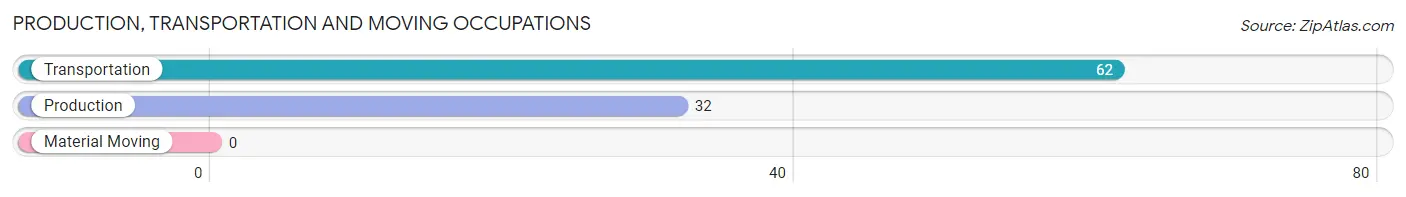
Production, Transportation and Moving Occupations by Sex
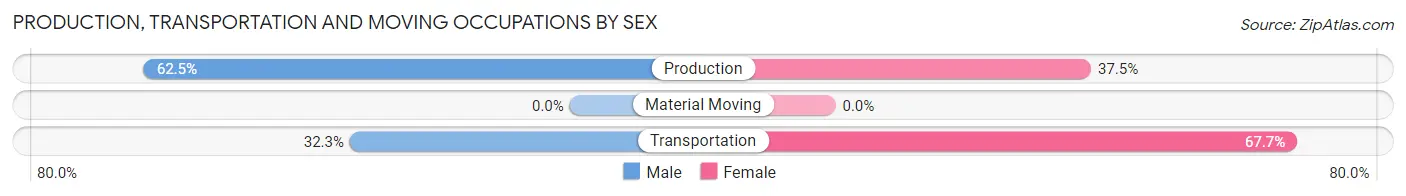
| Occupation | Male | Female |
| Production | 20 (62.5%) | 12 (37.5%) |
| Transportation | 20 (32.3%) | 42 (67.7%) |
| Material Moving | 0 (0.0%) | 0 (0.0%) |
| Total (Category) | 40 (42.5%) | 54 (57.5%) |
| Total (Overall) | 670 (51.9%) | 622 (48.1%) |
Employment Industries by Sex in North Shore
Employment Industries in North Shore
The major employment industries in North Shore include Professional & Scientific (250 | 19.4%), Health Care & Social Assistance (199 | 15.4%), Transportation & Warehousing (138 | 10.7%), Retail Trade (107 | 8.3%), and Finance & Insurance (98 | 7.6%).
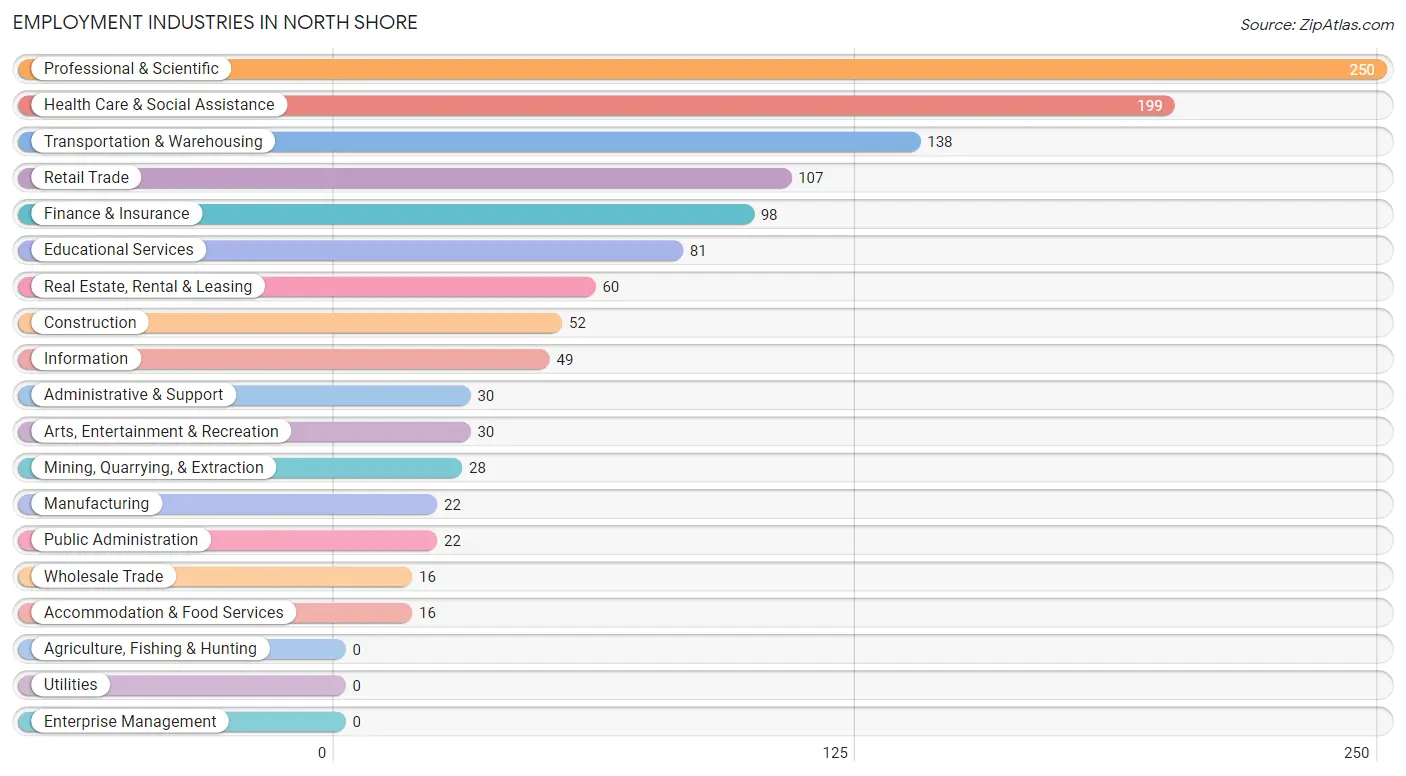
Employment Industries by Sex in North Shore
The North Shore industries that see more men than women are Mining, Quarrying, & Extraction (100.0%), Administrative & Support (100.0%), and Public Administration (100.0%), whereas the industries that tend to have a higher number of women are Educational Services (100.0%), Arts, Entertainment & Recreation (100.0%), and Health Care & Social Assistance (72.9%).
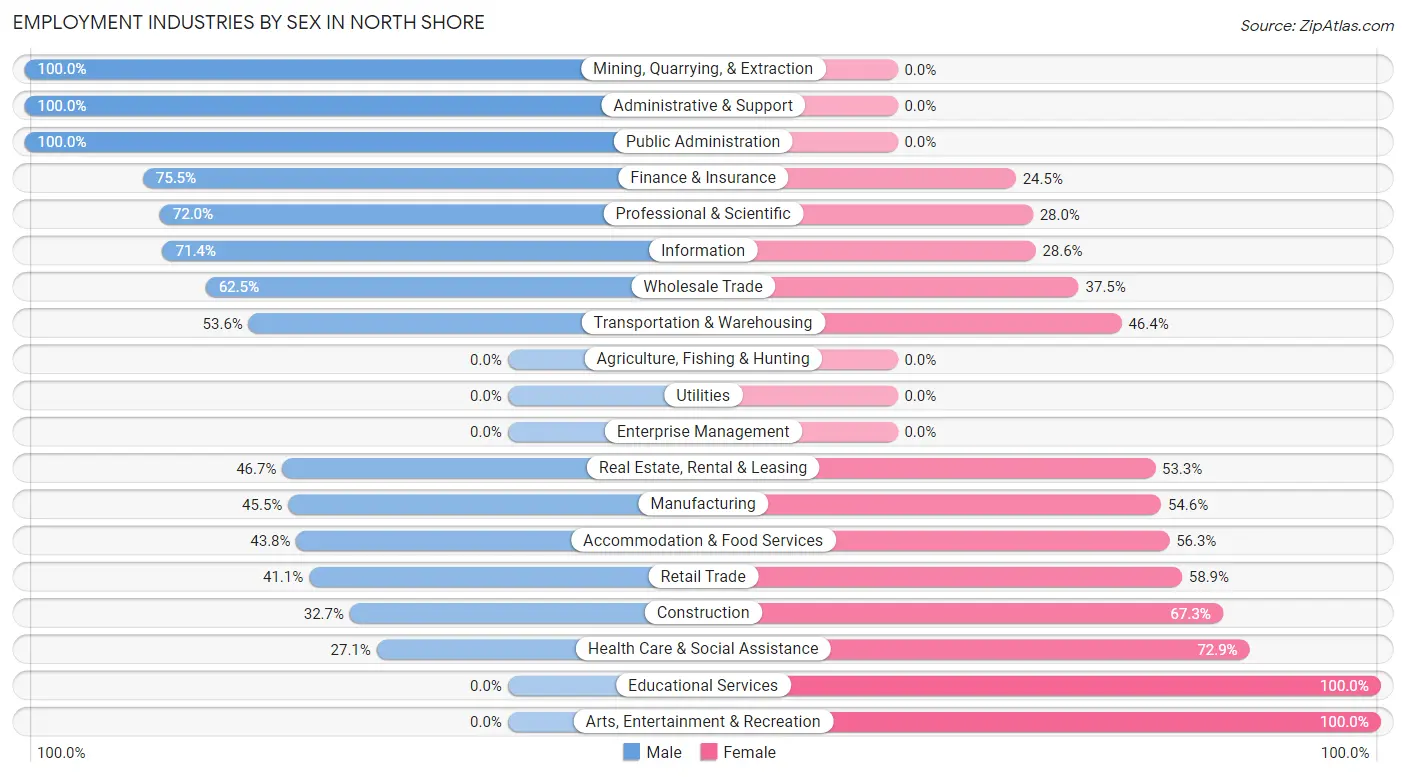
| Industry | Male | Female |
| Agriculture, Fishing & Hunting | 0 (0.0%) | 0 (0.0%) |
| Mining, Quarrying, & Extraction | 28 (100.0%) | 0 (0.0%) |
| Construction | 17 (32.7%) | 35 (67.3%) |
| Manufacturing | 10 (45.5%) | 12 (54.5%) |
| Wholesale Trade | 10 (62.5%) | 6 (37.5%) |
| Retail Trade | 44 (41.1%) | 63 (58.9%) |
| Transportation & Warehousing | 74 (53.6%) | 64 (46.4%) |
| Utilities | 0 (0.0%) | 0 (0.0%) |
| Information | 35 (71.4%) | 14 (28.6%) |
| Finance & Insurance | 74 (75.5%) | 24 (24.5%) |
| Real Estate, Rental & Leasing | 28 (46.7%) | 32 (53.3%) |
| Professional & Scientific | 180 (72.0%) | 70 (28.0%) |
| Enterprise Management | 0 (0.0%) | 0 (0.0%) |
| Administrative & Support | 30 (100.0%) | 0 (0.0%) |
| Educational Services | 0 (0.0%) | 81 (100.0%) |
| Health Care & Social Assistance | 54 (27.1%) | 145 (72.9%) |
| Arts, Entertainment & Recreation | 0 (0.0%) | 30 (100.0%) |
| Accommodation & Food Services | 7 (43.8%) | 9 (56.2%) |
| Public Administration | 22 (100.0%) | 0 (0.0%) |
| Total | 670 (51.9%) | 622 (48.1%) |
Education in North Shore
School Enrollment in North Shore
The most common levels of schooling among the 438 students in North Shore are high school (213 | 48.6%), elementary school (81 | 18.5%), and middle school (60 | 13.7%).
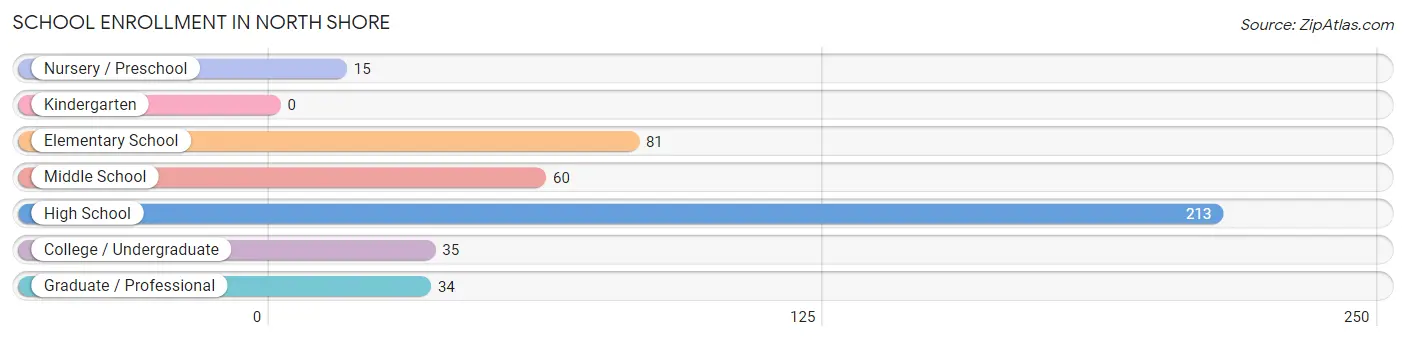
| School Level | # Students | % Students |
| Nursery / Preschool | 15 | 3.4% |
| Kindergarten | 0 | 0.0% |
| Elementary School | 81 | 18.5% |
| Middle School | 60 | 13.7% |
| High School | 213 | 48.6% |
| College / Undergraduate | 35 | 8.0% |
| Graduate / Professional | 34 | 7.8% |
| Total | 438 | 100.0% |
School Enrollment by Age by Funding Source in North Shore
Out of a total of 438 students who are enrolled in schools in North Shore, 67 (15.3%) attend a private institution, while the remaining 371 (84.7%) are enrolled in public schools. The age group of 3 to 4 year olds has the highest likelihood of being enrolled in private schools, with 15 (100.0% in the age bracket) enrolled. Conversely, the age group of 5 to 9 year old has the lowest likelihood of being enrolled in a private school, with 81 (100.0% in the age bracket) attending a public institution.
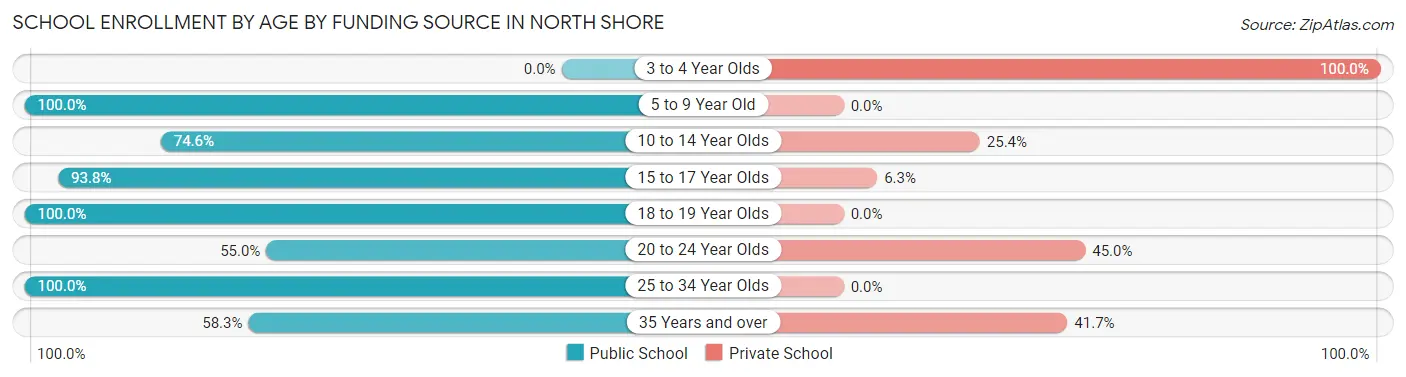
| Age Bracket | Public School | Private School |
| 3 to 4 Year Olds | 0 (0.0%) | 15 (100.0%) |
| 5 to 9 Year Old | 81 (100.0%) | 0 (0.0%) |
| 10 to 14 Year Olds | 50 (74.6%) | 17 (25.4%) |
| 15 to 17 Year Olds | 165 (93.8%) | 11 (6.2%) |
| 18 to 19 Year Olds | 9 (100.0%) | 0 (0.0%) |
| 20 to 24 Year Olds | 11 (55.0%) | 9 (45.0%) |
| 25 to 34 Year Olds | 34 (100.0%) | 0 (0.0%) |
| 35 Years and over | 21 (58.3%) | 15 (41.7%) |
| Total | 371 (84.7%) | 67 (15.3%) |
Educational Attainment by Field of Study in North Shore
Business (410 | 26.2%), education (235 | 15.0%), engineering (219 | 14.0%), science & technology (171 | 10.9%), and social sciences (96 | 6.1%) are the most common fields of study among 1,564 individuals in North Shore who have obtained a bachelor's degree or higher.
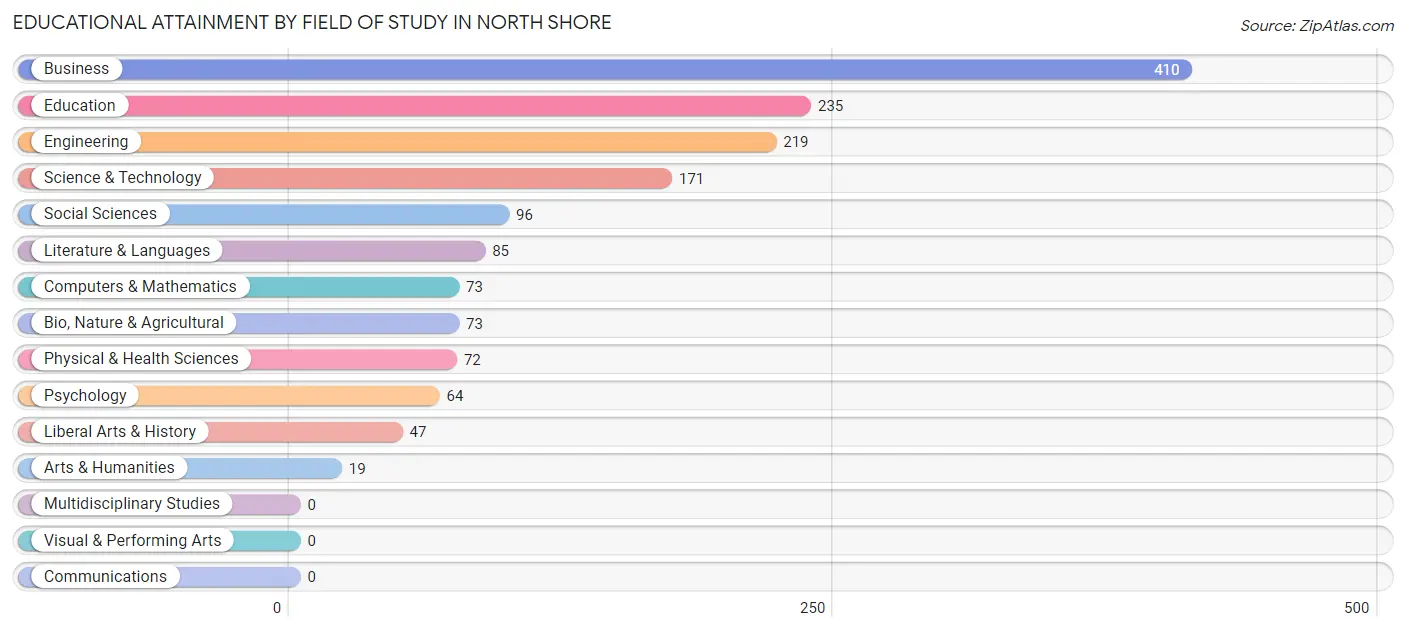
| Field of Study | # Graduates | % Graduates |
| Computers & Mathematics | 73 | 4.7% |
| Bio, Nature & Agricultural | 73 | 4.7% |
| Physical & Health Sciences | 72 | 4.6% |
| Psychology | 64 | 4.1% |
| Social Sciences | 96 | 6.1% |
| Engineering | 219 | 14.0% |
| Multidisciplinary Studies | 0 | 0.0% |
| Science & Technology | 171 | 10.9% |
| Business | 410 | 26.2% |
| Education | 235 | 15.0% |
| Literature & Languages | 85 | 5.4% |
| Liberal Arts & History | 47 | 3.0% |
| Visual & Performing Arts | 0 | 0.0% |
| Communications | 0 | 0.0% |
| Arts & Humanities | 19 | 1.2% |
| Total | 1,564 | 100.0% |
Transportation & Commute in North Shore
Vehicle Availability by Sex in North Shore
The most prevalent vehicle ownership categories in North Shore are males with 2 vehicles (297, accounting for 44.3%) and females with 2 vehicles (173, making up 48.4%).
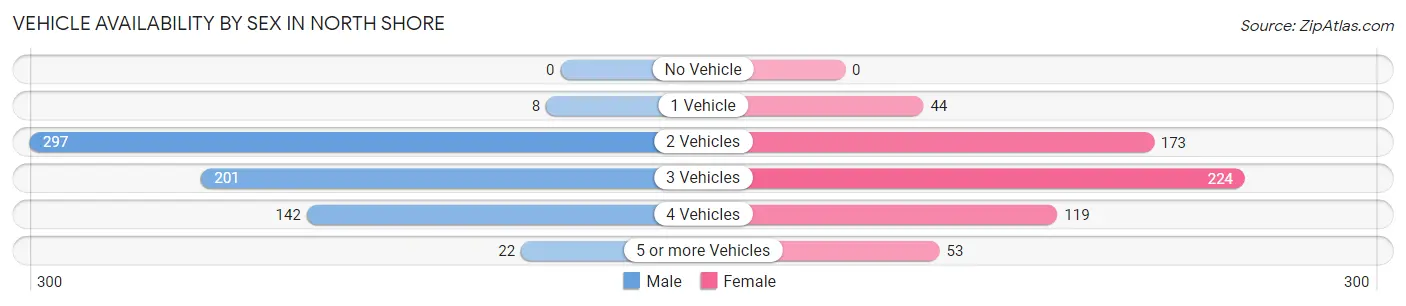
| Vehicles Available | Male | Female |
| No Vehicle | 0 (0.0%) | 0 (0.0%) |
| 1 Vehicle | 8 (1.2%) | 44 (7.2%) |
| 2 Vehicles | 297 (44.3%) | 173 (28.2%) |
| 3 Vehicles | 201 (30.0%) | 224 (36.5%) |
| 4 Vehicles | 142 (21.2%) | 119 (19.4%) |
| 5 or more Vehicles | 22 (3.3%) | 53 (8.6%) |
| Total | 670 (100.0%) | 613 (100.0%) |
Commute Time in North Shore
The most frequently occuring commute durations in North Shore are 30 to 34 minutes (268 commuters, 28.3%), 45 to 59 minutes (198 commuters, 20.9%), and 60 to 89 minutes (123 commuters, 13.0%).
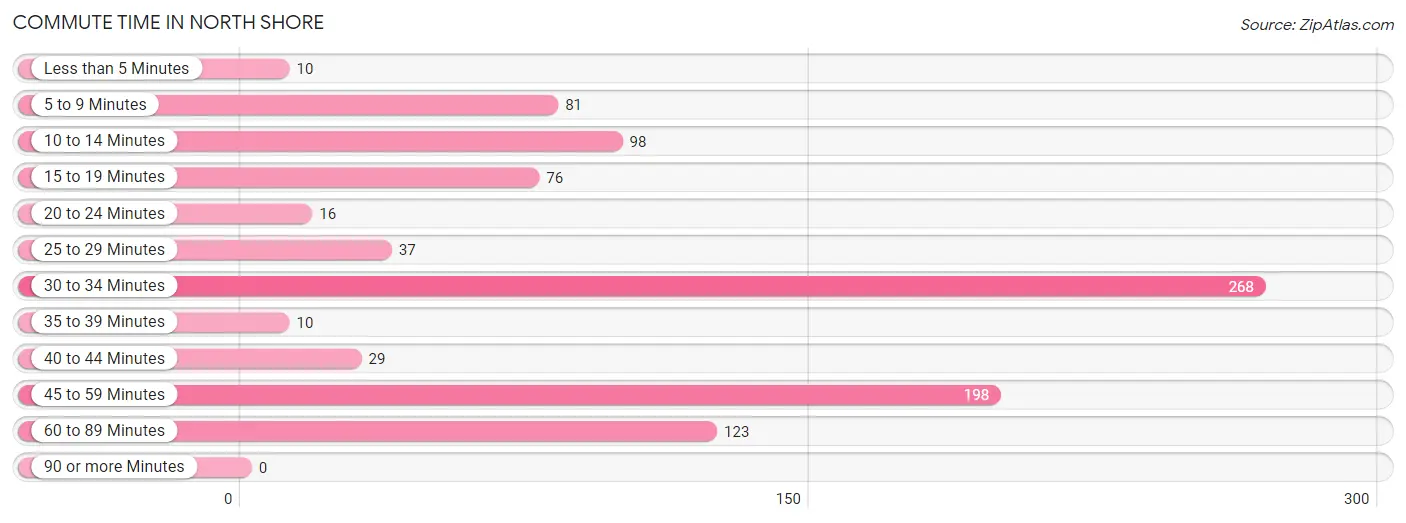
| Commute Time | # Commuters | % Commuters |
| Less than 5 Minutes | 10 | 1.1% |
| 5 to 9 Minutes | 81 | 8.6% |
| 10 to 14 Minutes | 98 | 10.4% |
| 15 to 19 Minutes | 76 | 8.0% |
| 20 to 24 Minutes | 16 | 1.7% |
| 25 to 29 Minutes | 37 | 3.9% |
| 30 to 34 Minutes | 268 | 28.3% |
| 35 to 39 Minutes | 10 | 1.1% |
| 40 to 44 Minutes | 29 | 3.1% |
| 45 to 59 Minutes | 198 | 20.9% |
| 60 to 89 Minutes | 123 | 13.0% |
| 90 or more Minutes | 0 | 0.0% |
Commute Time by Sex in North Shore
The most common commute times in North Shore are 30 to 34 minutes (128 commuters, 28.1%) for males and 30 to 34 minutes (140 commuters, 28.5%) for females.
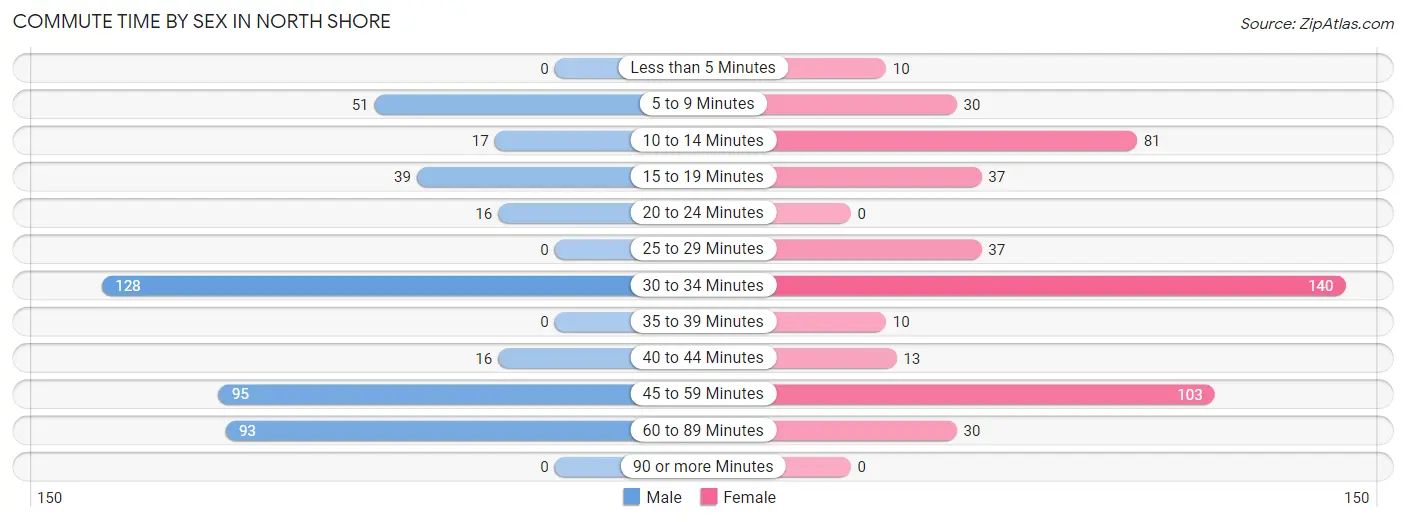
| Commute Time | Male | Female |
| Less than 5 Minutes | 0 (0.0%) | 10 (2.0%) |
| 5 to 9 Minutes | 51 (11.2%) | 30 (6.1%) |
| 10 to 14 Minutes | 17 (3.7%) | 81 (16.5%) |
| 15 to 19 Minutes | 39 (8.6%) | 37 (7.5%) |
| 20 to 24 Minutes | 16 (3.5%) | 0 (0.0%) |
| 25 to 29 Minutes | 0 (0.0%) | 37 (7.5%) |
| 30 to 34 Minutes | 128 (28.1%) | 140 (28.5%) |
| 35 to 39 Minutes | 0 (0.0%) | 10 (2.0%) |
| 40 to 44 Minutes | 16 (3.5%) | 13 (2.6%) |
| 45 to 59 Minutes | 95 (20.9%) | 103 (21.0%) |
| 60 to 89 Minutes | 93 (20.4%) | 30 (6.1%) |
| 90 or more Minutes | 0 (0.0%) | 0 (0.0%) |
Time of Departure to Work by Sex in North Shore
The most frequent times of departure to work in North Shore are 6:00 AM to 6:29 AM (97, 21.3%) for males and 8:00 AM to 8:29 AM (132, 26.9%) for females.
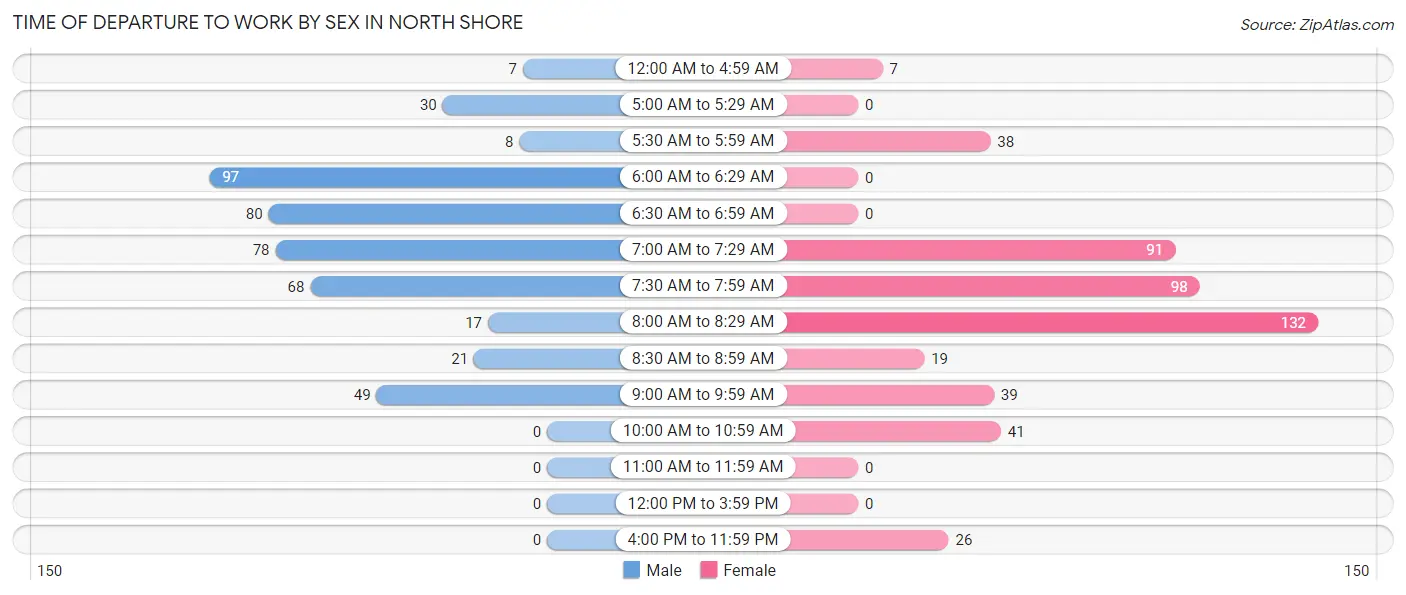
| Time of Departure | Male | Female |
| 12:00 AM to 4:59 AM | 7 (1.5%) | 7 (1.4%) |
| 5:00 AM to 5:29 AM | 30 (6.6%) | 0 (0.0%) |
| 5:30 AM to 5:59 AM | 8 (1.8%) | 38 (7.7%) |
| 6:00 AM to 6:29 AM | 97 (21.3%) | 0 (0.0%) |
| 6:30 AM to 6:59 AM | 80 (17.6%) | 0 (0.0%) |
| 7:00 AM to 7:29 AM | 78 (17.1%) | 91 (18.5%) |
| 7:30 AM to 7:59 AM | 68 (14.9%) | 98 (20.0%) |
| 8:00 AM to 8:29 AM | 17 (3.7%) | 132 (26.9%) |
| 8:30 AM to 8:59 AM | 21 (4.6%) | 19 (3.9%) |
| 9:00 AM to 9:59 AM | 49 (10.8%) | 39 (7.9%) |
| 10:00 AM to 10:59 AM | 0 (0.0%) | 41 (8.4%) |
| 11:00 AM to 11:59 AM | 0 (0.0%) | 0 (0.0%) |
| 12:00 PM to 3:59 PM | 0 (0.0%) | 0 (0.0%) |
| 4:00 PM to 11:59 PM | 0 (0.0%) | 26 (5.3%) |
| Total | 455 (100.0%) | 491 (100.0%) |
Housing Occupancy in North Shore
Occupancy by Ownership in North Shore
Of the total 1,646 dwellings in North Shore, owner-occupied units account for 1,602 (97.3%), while renter-occupied units make up 44 (2.7%).
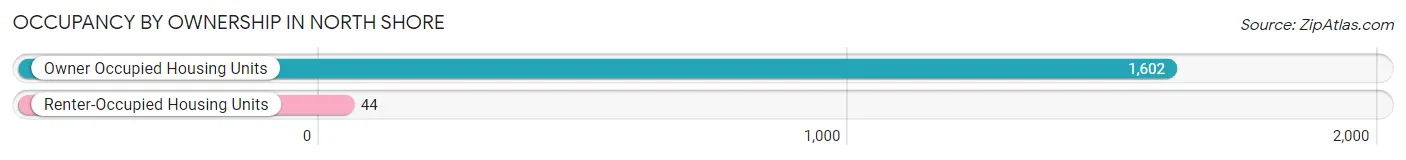
| Occupancy | # Housing Units | % Housing Units |
| Owner Occupied Housing Units | 1,602 | 97.3% |
| Renter-Occupied Housing Units | 44 | 2.7% |
| Total Occupied Housing Units | 1,646 | 100.0% |
Occupancy by Household Size in North Shore
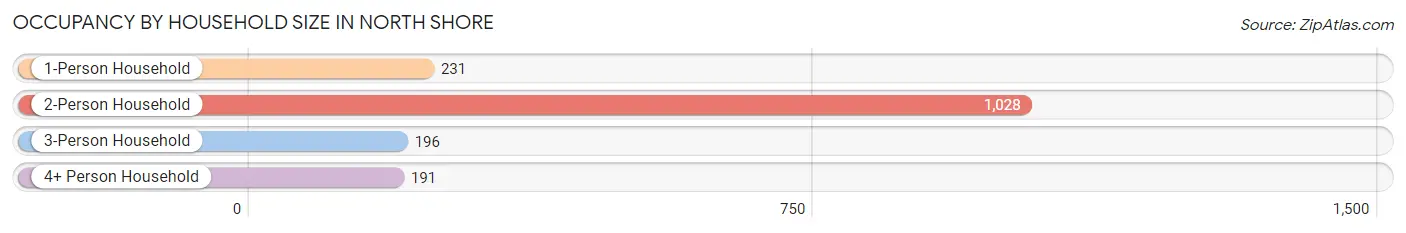
| Household Size | # Housing Units | % Housing Units |
| 1-Person Household | 231 | 14.0% |
| 2-Person Household | 1,028 | 62.5% |
| 3-Person Household | 196 | 11.9% |
| 4+ Person Household | 191 | 11.6% |
| Total Housing Units | 1,646 | 100.0% |
Occupancy by Ownership by Household Size in North Shore
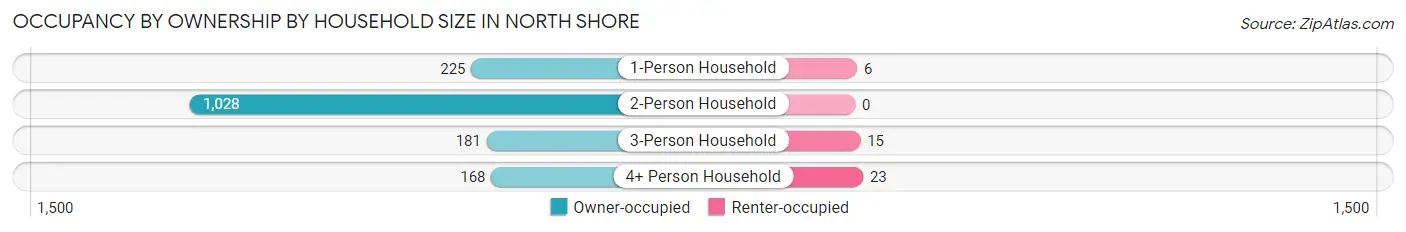
| Household Size | Owner-occupied | Renter-occupied |
| 1-Person Household | 225 (97.4%) | 6 (2.6%) |
| 2-Person Household | 1,028 (100.0%) | 0 (0.0%) |
| 3-Person Household | 181 (92.3%) | 15 (7.6%) |
| 4+ Person Household | 168 (88.0%) | 23 (12.0%) |
| Total Housing Units | 1,602 (97.3%) | 44 (2.7%) |
Occupancy by Educational Attainment in North Shore
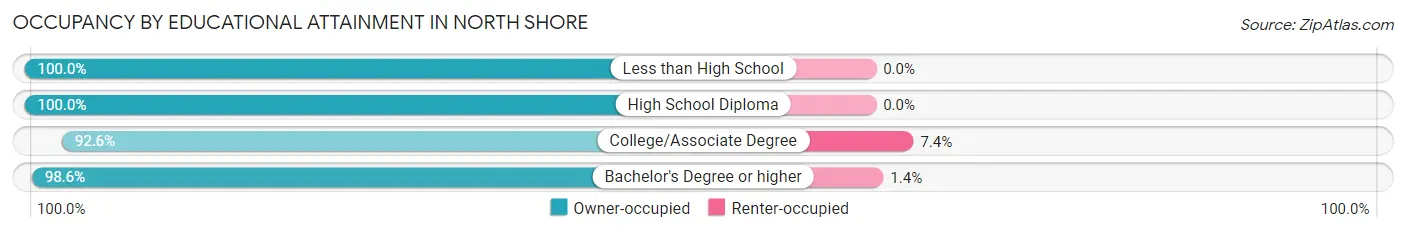
| Household Size | Owner-occupied | Renter-occupied |
| Less than High School | 45 (100.0%) | 0 (0.0%) |
| High School Diploma | 278 (100.0%) | 0 (0.0%) |
| College/Associate Degree | 388 (92.6%) | 31 (7.4%) |
| Bachelor's Degree or higher | 891 (98.6%) | 13 (1.4%) |
Occupancy by Age of Householder in North Shore
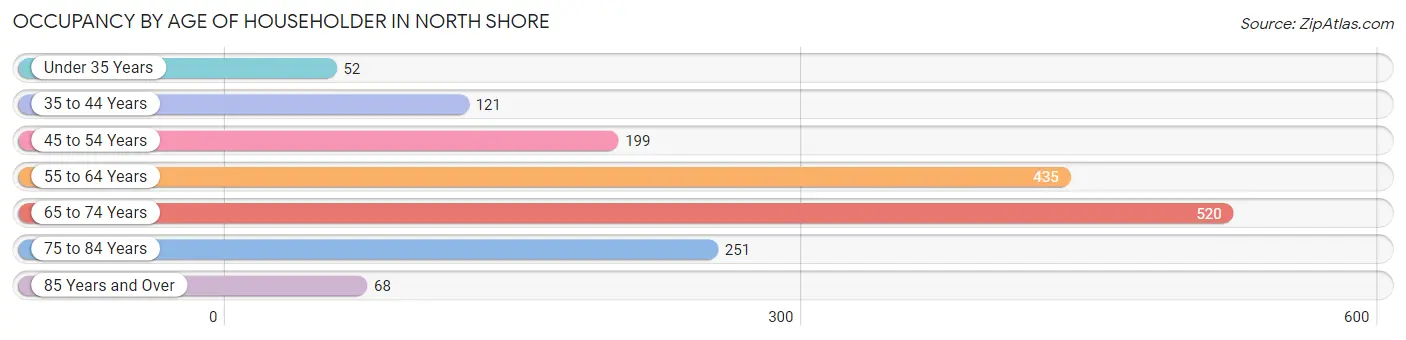
| Age Bracket | # Households | % Households |
| Under 35 Years | 52 | 3.2% |
| 35 to 44 Years | 121 | 7.3% |
| 45 to 54 Years | 199 | 12.1% |
| 55 to 64 Years | 435 | 26.4% |
| 65 to 74 Years | 520 | 31.6% |
| 75 to 84 Years | 251 | 15.2% |
| 85 Years and Over | 68 | 4.1% |
| Total | 1,646 | 100.0% |
Housing Finances in North Shore
Median Income by Occupancy in North Shore
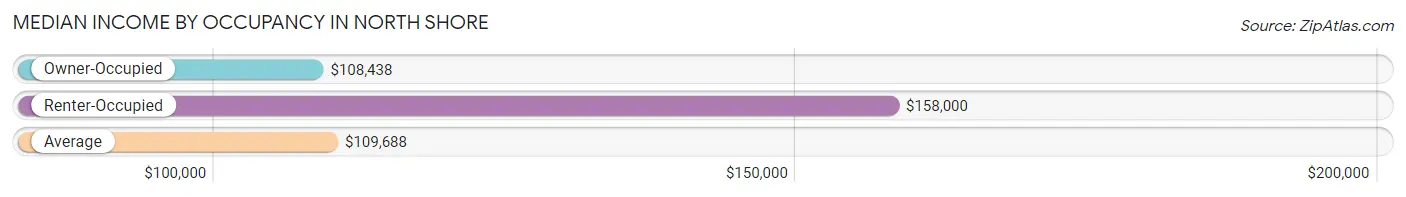
| Occupancy Type | # Households | Median Income |
| Owner-Occupied | 1,602 (97.3%) | $108,438 |
| Renter-Occupied | 44 (2.7%) | $158,000 |
| Average | 1,646 (100.0%) | $109,688 |
Occupancy by Householder Income Bracket in North Shore
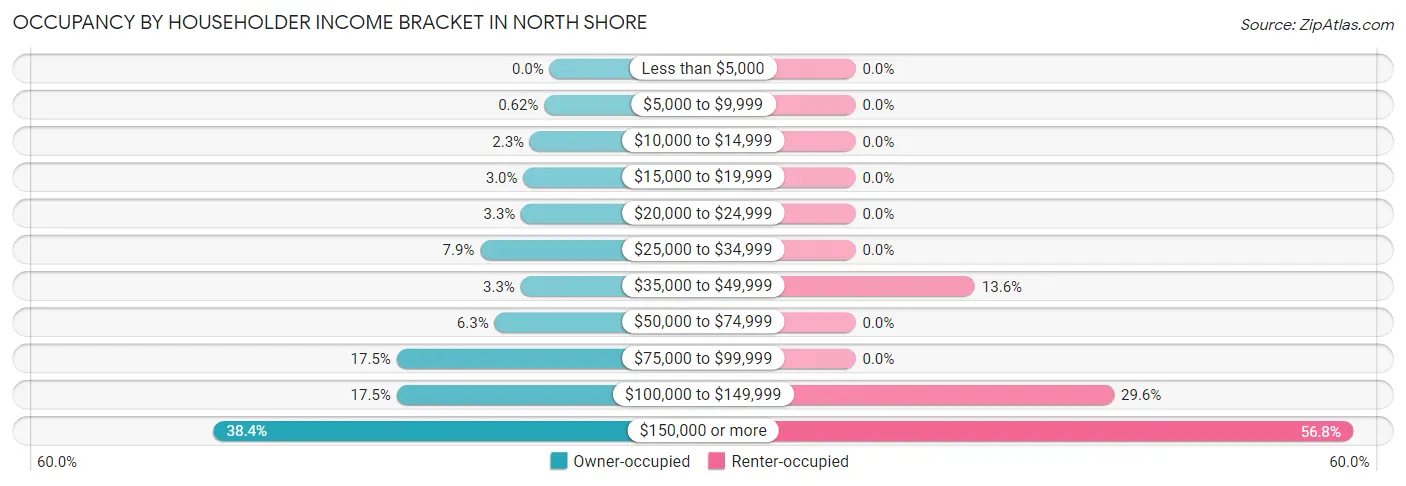
| Income Bracket | Owner-occupied | Renter-occupied |
| Less than $5,000 | 0 (0.0%) | 0 (0.0%) |
| $5,000 to $9,999 | 10 (0.6%) | 0 (0.0%) |
| $10,000 to $14,999 | 36 (2.2%) | 0 (0.0%) |
| $15,000 to $19,999 | 48 (3.0%) | 0 (0.0%) |
| $20,000 to $24,999 | 52 (3.3%) | 0 (0.0%) |
| $25,000 to $34,999 | 127 (7.9%) | 0 (0.0%) |
| $35,000 to $49,999 | 53 (3.3%) | 6 (13.6%) |
| $50,000 to $74,999 | 101 (6.3%) | 0 (0.0%) |
| $75,000 to $99,999 | 280 (17.5%) | 0 (0.0%) |
| $100,000 to $149,999 | 280 (17.5%) | 13 (29.5%) |
| $150,000 or more | 615 (38.4%) | 25 (56.8%) |
| Total | 1,602 (100.0%) | 44 (100.0%) |
Monthly Housing Cost Tiers in North Shore
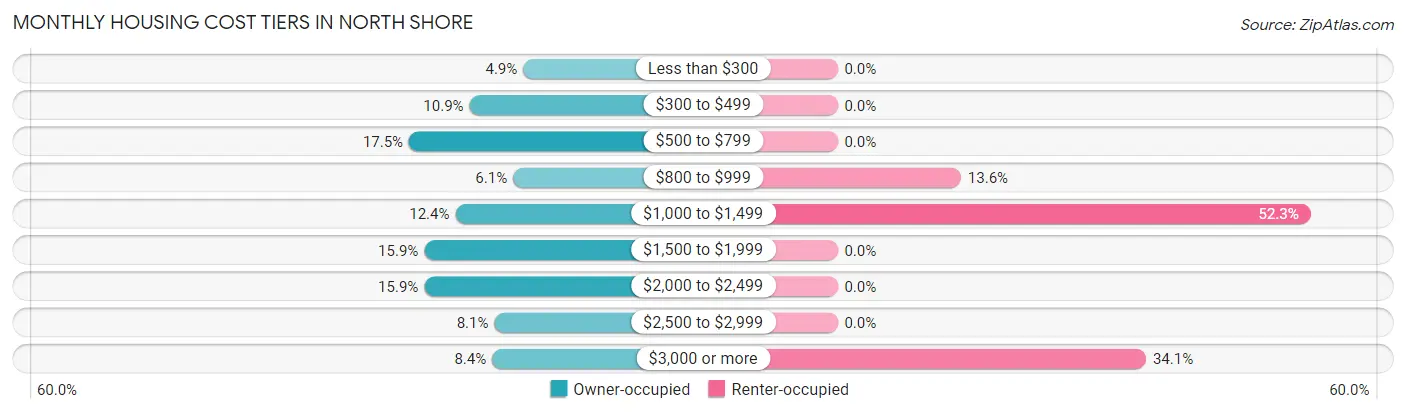
| Monthly Cost | Owner-occupied | Renter-occupied |
| Less than $300 | 79 (4.9%) | 0 (0.0%) |
| $300 to $499 | 174 (10.9%) | 0 (0.0%) |
| $500 to $799 | 281 (17.5%) | 0 (0.0%) |
| $800 to $999 | 97 (6.0%) | 6 (13.6%) |
| $1,000 to $1,499 | 199 (12.4%) | 23 (52.3%) |
| $1,500 to $1,999 | 254 (15.9%) | 0 (0.0%) |
| $2,000 to $2,499 | 254 (15.9%) | 0 (0.0%) |
| $2,500 to $2,999 | 130 (8.1%) | 0 (0.0%) |
| $3,000 or more | 134 (8.4%) | 15 (34.1%) |
| Total | 1,602 (100.0%) | 44 (100.0%) |
Physical Housing Characteristics in North Shore
Housing Structures in North Shore
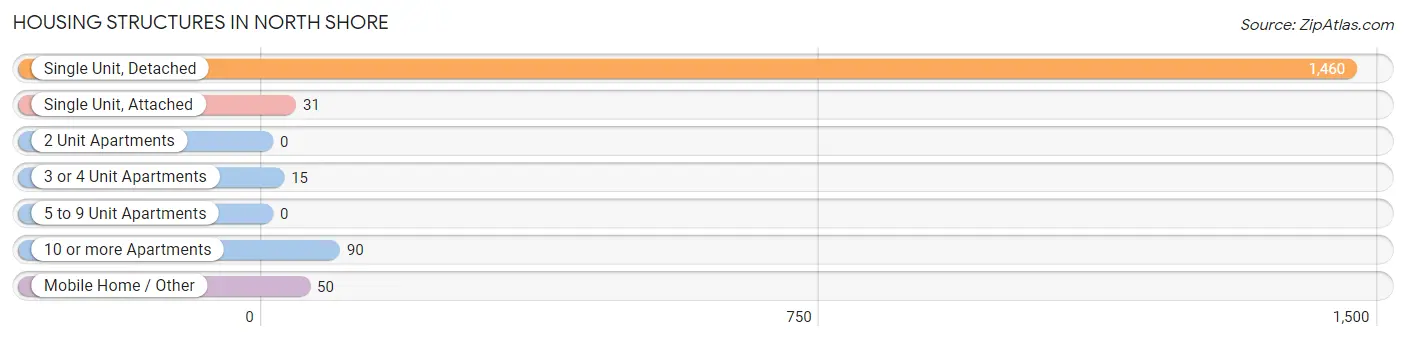
| Structure Type | # Housing Units | % Housing Units |
| Single Unit, Detached | 1,460 | 88.7% |
| Single Unit, Attached | 31 | 1.9% |
| 2 Unit Apartments | 0 | 0.0% |
| 3 or 4 Unit Apartments | 15 | 0.9% |
| 5 to 9 Unit Apartments | 0 | 0.0% |
| 10 or more Apartments | 90 | 5.5% |
| Mobile Home / Other | 50 | 3.0% |
| Total | 1,646 | 100.0% |
Housing Structures by Occupancy in North Shore
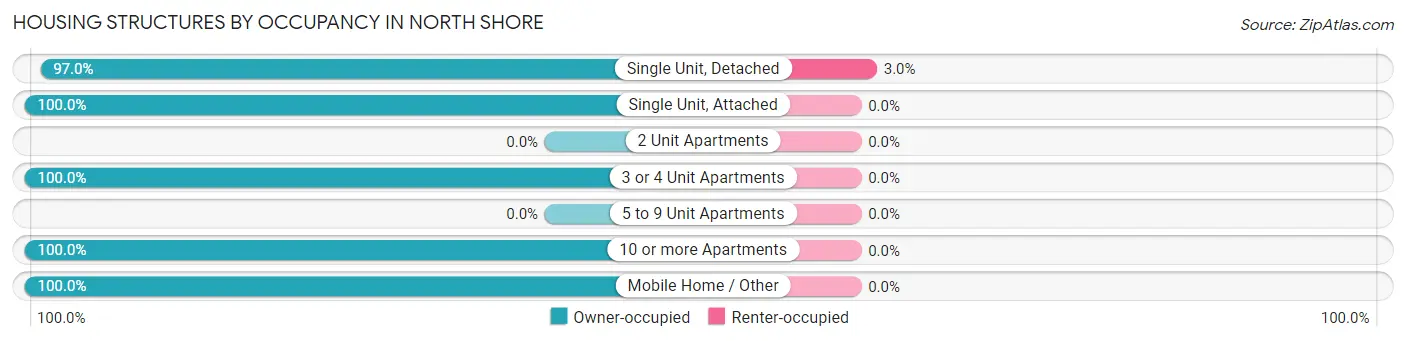
| Structure Type | Owner-occupied | Renter-occupied |
| Single Unit, Detached | 1,416 (97.0%) | 44 (3.0%) |
| Single Unit, Attached | 31 (100.0%) | 0 (0.0%) |
| 2 Unit Apartments | 0 (0.0%) | 0 (0.0%) |
| 3 or 4 Unit Apartments | 15 (100.0%) | 0 (0.0%) |
| 5 to 9 Unit Apartments | 0 (0.0%) | 0 (0.0%) |
| 10 or more Apartments | 90 (100.0%) | 0 (0.0%) |
| Mobile Home / Other | 50 (100.0%) | 0 (0.0%) |
| Total | 1,602 (97.3%) | 44 (2.7%) |
Housing Structures by Number of Rooms in North Shore
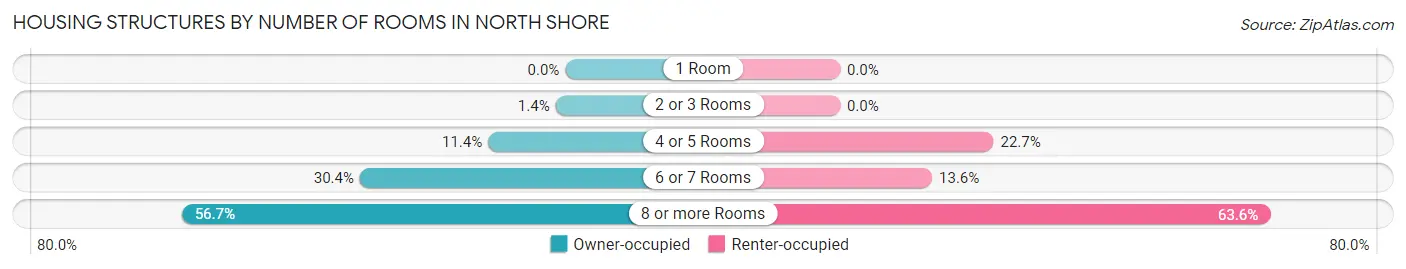
| Number of Rooms | Owner-occupied | Renter-occupied |
| 1 Room | 0 (0.0%) | 0 (0.0%) |
| 2 or 3 Rooms | 23 (1.4%) | 0 (0.0%) |
| 4 or 5 Rooms | 183 (11.4%) | 10 (22.7%) |
| 6 or 7 Rooms | 487 (30.4%) | 6 (13.6%) |
| 8 or more Rooms | 909 (56.7%) | 28 (63.6%) |
| Total | 1,602 (100.0%) | 44 (100.0%) |
Housing Structure by Heating Type in North Shore
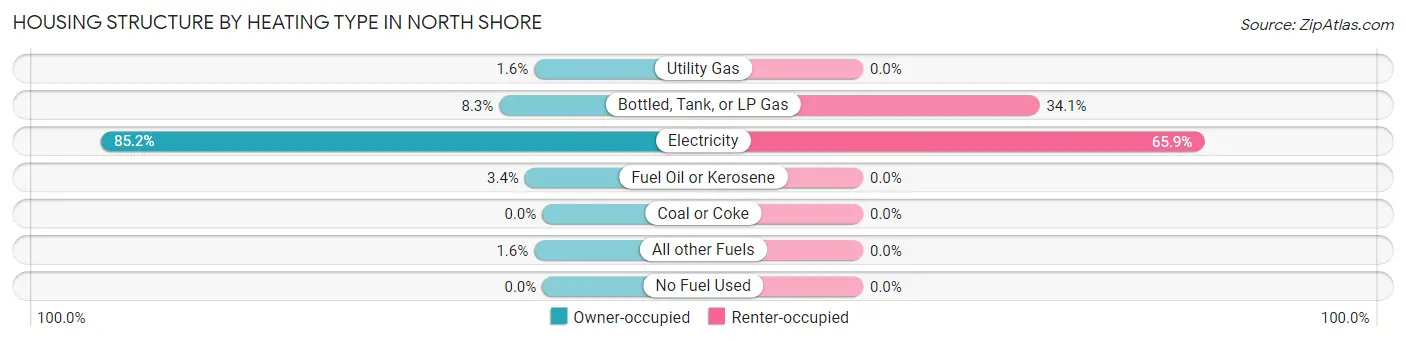
| Heating Type | Owner-occupied | Renter-occupied |
| Utility Gas | 25 (1.6%) | 0 (0.0%) |
| Bottled, Tank, or LP Gas | 133 (8.3%) | 15 (34.1%) |
| Electricity | 1,365 (85.2%) | 29 (65.9%) |
| Fuel Oil or Kerosene | 54 (3.4%) | 0 (0.0%) |
| Coal or Coke | 0 (0.0%) | 0 (0.0%) |
| All other Fuels | 25 (1.6%) | 0 (0.0%) |
| No Fuel Used | 0 (0.0%) | 0 (0.0%) |
| Total | 1,602 (100.0%) | 44 (100.0%) |
Household Vehicle Usage in North Shore
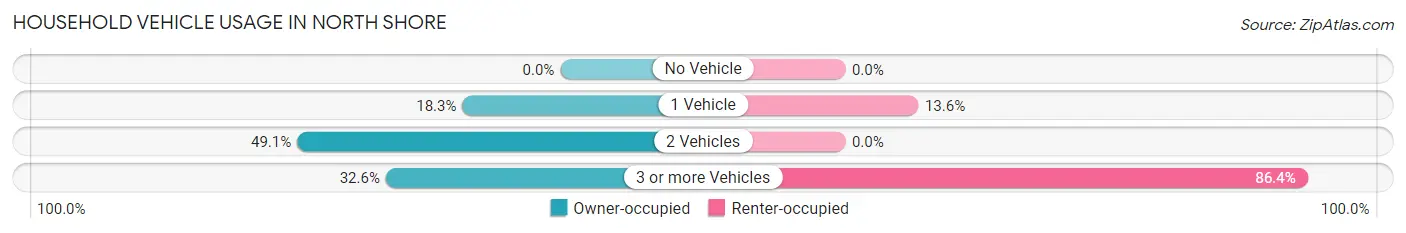
| Vehicles per Household | Owner-occupied | Renter-occupied |
| No Vehicle | 0 (0.0%) | 0 (0.0%) |
| 1 Vehicle | 293 (18.3%) | 6 (13.6%) |
| 2 Vehicles | 787 (49.1%) | 0 (0.0%) |
| 3 or more Vehicles | 522 (32.6%) | 38 (86.4%) |
| Total | 1,602 (100.0%) | 44 (100.0%) |
Real Estate & Mortgages in North Shore
Real Estate and Mortgage Overview in North Shore
| Characteristic | Without Mortgage | With Mortgage |
| Housing Units | 610 | 992 |
| Median Property Value | $572,100 | $442,700 |
| Median Household Income | $85,724 | $520 |
| Monthly Housing Costs | $626 | $134 |
| Real Estate Taxes | $3,385 | $7 |
Property Value by Mortgage Status in North Shore
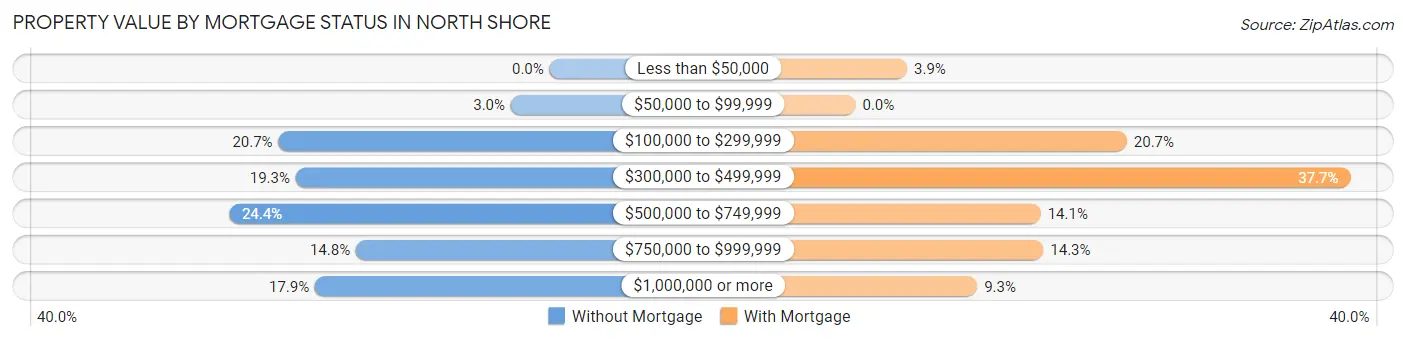
| Property Value | Without Mortgage | With Mortgage |
| Less than $50,000 | 0 (0.0%) | 39 (3.9%) |
| $50,000 to $99,999 | 18 (2.9%) | 0 (0.0%) |
| $100,000 to $299,999 | 126 (20.7%) | 205 (20.7%) |
| $300,000 to $499,999 | 118 (19.3%) | 374 (37.7%) |
| $500,000 to $749,999 | 149 (24.4%) | 140 (14.1%) |
| $750,000 to $999,999 | 90 (14.7%) | 142 (14.3%) |
| $1,000,000 or more | 109 (17.9%) | 92 (9.3%) |
| Total | 610 (100.0%) | 992 (100.0%) |
Household Income by Mortgage Status in North Shore
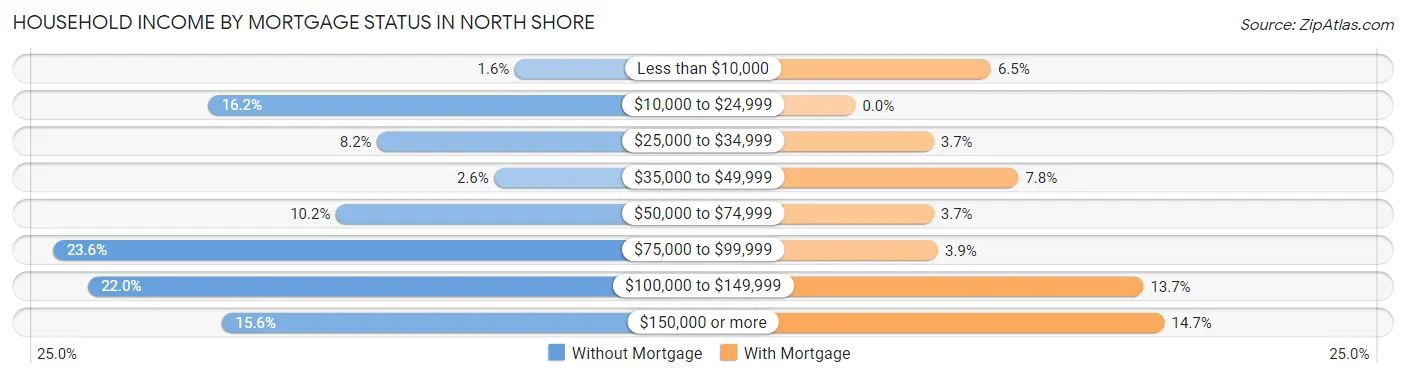
| Household Income | Without Mortgage | With Mortgage |
| Less than $10,000 | 10 (1.6%) | 64 (6.5%) |
| $10,000 to $24,999 | 99 (16.2%) | 0 (0.0%) |
| $25,000 to $34,999 | 50 (8.2%) | 37 (3.7%) |
| $35,000 to $49,999 | 16 (2.6%) | 77 (7.8%) |
| $50,000 to $74,999 | 62 (10.2%) | 37 (3.7%) |
| $75,000 to $99,999 | 144 (23.6%) | 39 (3.9%) |
| $100,000 to $149,999 | 134 (22.0%) | 136 (13.7%) |
| $150,000 or more | 95 (15.6%) | 146 (14.7%) |
| Total | 610 (100.0%) | 992 (100.0%) |
Property Value to Household Income Ratio in North Shore
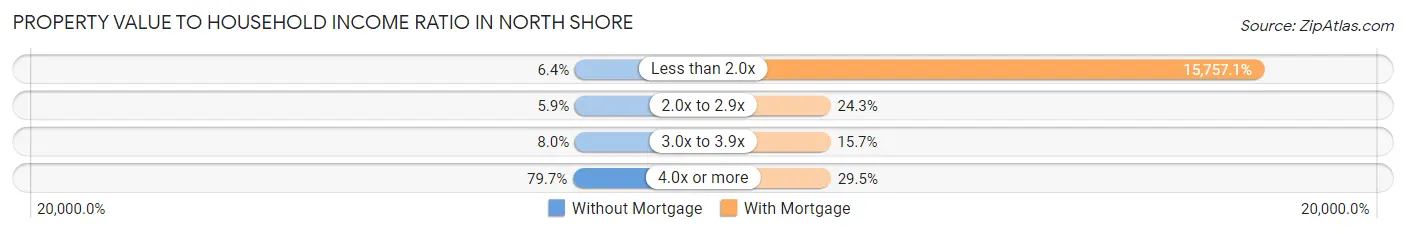
| Value-to-Income Ratio | Without Mortgage | With Mortgage |
| Less than 2.0x | 39 (6.4%) | 156,310 (15,757.1%) |
| 2.0x to 2.9x | 36 (5.9%) | 241 (24.3%) |
| 3.0x to 3.9x | 49 (8.0%) | 156 (15.7%) |
| 4.0x or more | 486 (79.7%) | 293 (29.5%) |
| Total | 610 (100.0%) | 992 (100.0%) |
Real Estate Taxes by Mortgage Status in North Shore
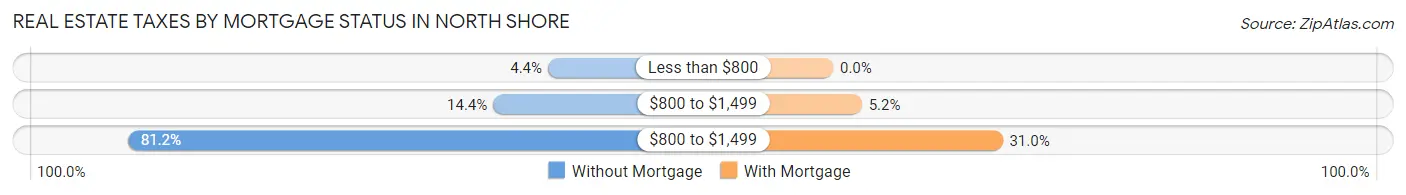
| Property Taxes | Without Mortgage | With Mortgage |
| Less than $800 | 27 (4.4%) | 0 (0.0%) |
| $800 to $1,499 | 88 (14.4%) | 52 (5.2%) |
| $800 to $1,499 | 495 (81.1%) | 307 (30.9%) |
| Total | 610 (100.0%) | 992 (100.0%) |
Health & Disability in North Shore
Health Insurance Coverage by Age in North Shore
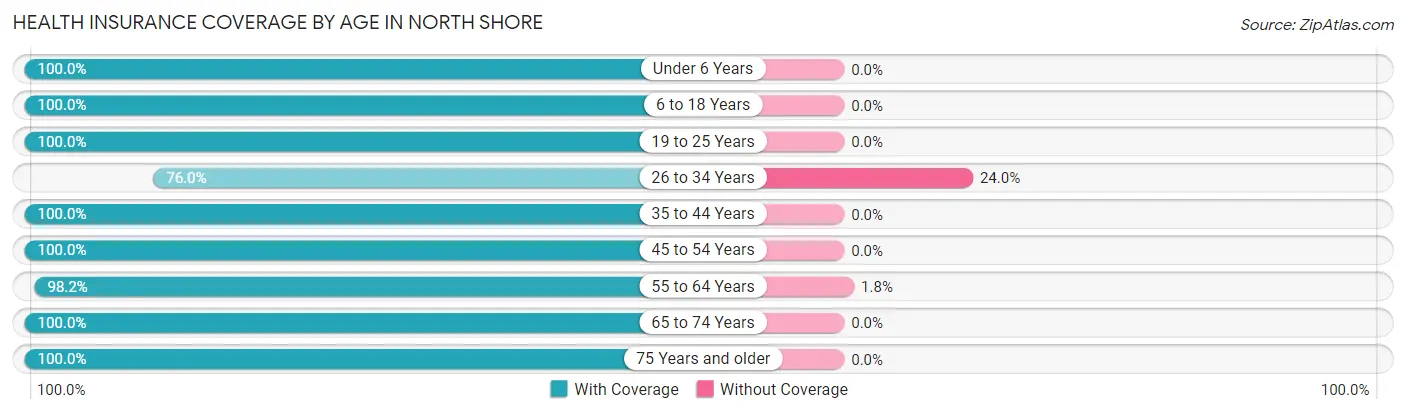
| Age Bracket | With Coverage | Without Coverage |
| Under 6 Years | 51 (100.0%) | 0 (0.0%) |
| 6 to 18 Years | 333 (100.0%) | 0 (0.0%) |
| 19 to 25 Years | 50 (100.0%) | 0 (0.0%) |
| 26 to 34 Years | 133 (76.0%) | 42 (24.0%) |
| 35 to 44 Years | 233 (100.0%) | 0 (0.0%) |
| 45 to 54 Years | 461 (100.0%) | 0 (0.0%) |
| 55 to 64 Years | 748 (98.2%) | 14 (1.8%) |
| 65 to 74 Years | 970 (100.0%) | 0 (0.0%) |
| 75 Years and older | 553 (100.0%) | 0 (0.0%) |
| Total | 3,532 (98.4%) | 56 (1.6%) |
Health Insurance Coverage by Citizenship Status in North Shore
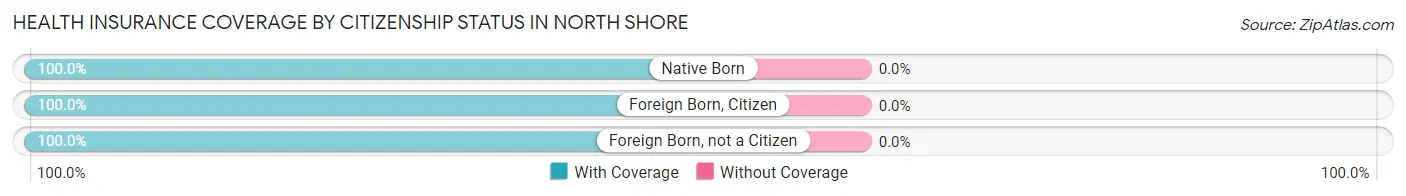
| Citizenship Status | With Coverage | Without Coverage |
| Native Born | 51 (100.0%) | 0 (0.0%) |
| Foreign Born, Citizen | 333 (100.0%) | 0 (0.0%) |
| Foreign Born, not a Citizen | 50 (100.0%) | 0 (0.0%) |
Health Insurance Coverage by Household Income in North Shore
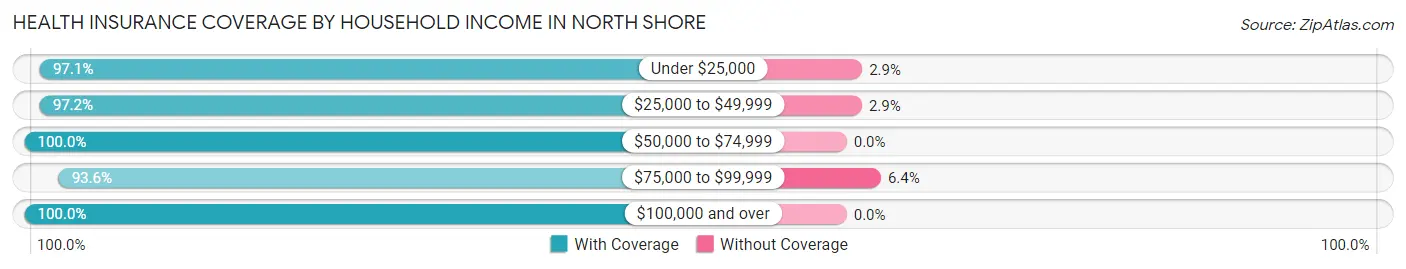
| Household Income | With Coverage | Without Coverage |
| Under $25,000 | 336 (97.1%) | 10 (2.9%) |
| $25,000 to $49,999 | 273 (97.2%) | 8 (2.9%) |
| $50,000 to $74,999 | 196 (100.0%) | 0 (0.0%) |
| $75,000 to $99,999 | 556 (93.6%) | 38 (6.4%) |
| $100,000 and over | 2,171 (100.0%) | 0 (0.0%) |
Public vs Private Health Insurance Coverage by Age in North Shore

| Age Bracket | Public Insurance | Private Insurance |
| Under 6 | 20 (39.2%) | 31 (60.8%) |
| 6 to 18 Years | 88 (26.4%) | 256 (76.9%) |
| 19 to 25 Years | 0 (0.0%) | 50 (100.0%) |
| 25 to 34 Years | 36 (20.6%) | 97 (55.4%) |
| 35 to 44 Years | 42 (18.0%) | 191 (82.0%) |
| 45 to 54 Years | 79 (17.1%) | 409 (88.7%) |
| 55 to 64 Years | 65 (8.5%) | 725 (95.1%) |
| 65 to 74 Years | 970 (100.0%) | 636 (65.6%) |
| 75 Years and over | 539 (97.5%) | 404 (73.1%) |
| Total | 1,839 (51.2%) | 2,799 (78.0%) |
Disability Status by Sex by Age in North Shore
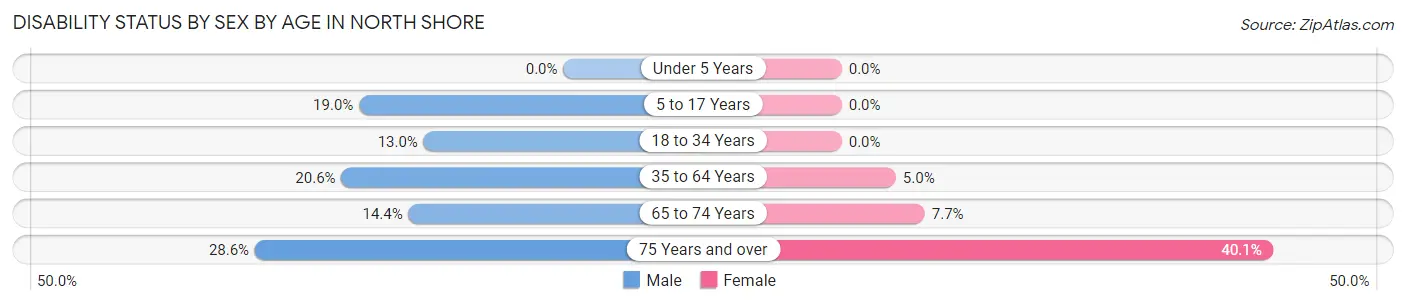
| Age Bracket | Male | Female |
| Under 5 Years | 0 (0.0%) | 0 (0.0%) |
| 5 to 17 Years | 29 (19.0%) | 0 (0.0%) |
| 18 to 34 Years | 21 (13.0%) | 0 (0.0%) |
| 35 to 64 Years | 144 (20.6%) | 38 (5.0%) |
| 65 to 74 Years | 76 (14.4%) | 34 (7.7%) |
| 75 Years and over | 79 (28.6%) | 111 (40.1%) |
Disability Class by Sex by Age in North Shore
Disability Class: Hearing Difficulty
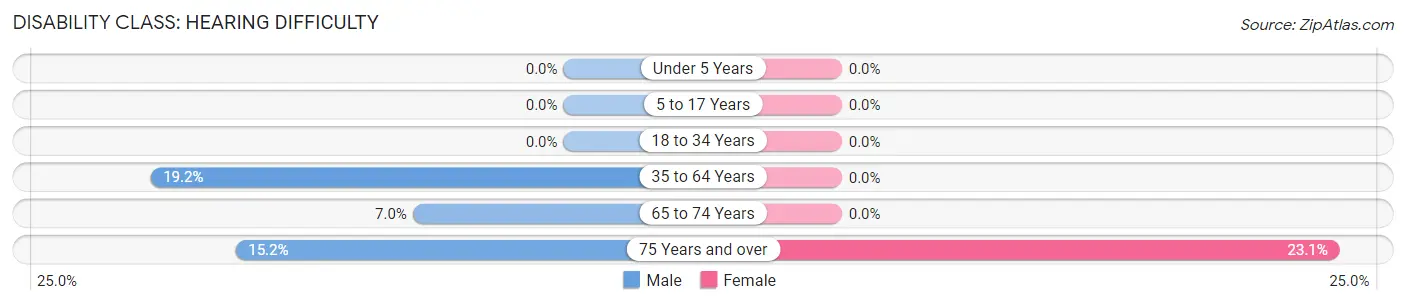
| Age Bracket | Male | Female |
| Under 5 Years | 0 (0.0%) | 0 (0.0%) |
| 5 to 17 Years | 0 (0.0%) | 0 (0.0%) |
| 18 to 34 Years | 0 (0.0%) | 0 (0.0%) |
| 35 to 64 Years | 134 (19.2%) | 0 (0.0%) |
| 65 to 74 Years | 37 (7.0%) | 0 (0.0%) |
| 75 Years and over | 42 (15.2%) | 64 (23.1%) |
Disability Class: Vision Difficulty
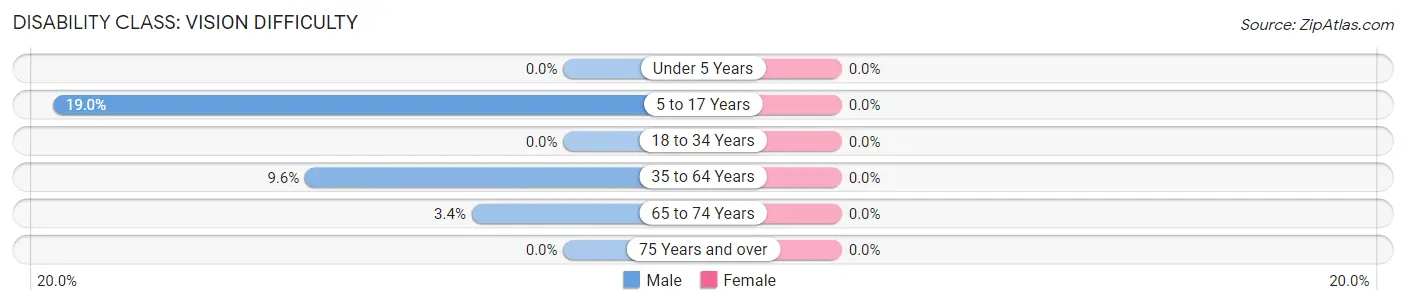
| Age Bracket | Male | Female |
| Under 5 Years | 0 (0.0%) | 0 (0.0%) |
| 5 to 17 Years | 29 (19.0%) | 0 (0.0%) |
| 18 to 34 Years | 0 (0.0%) | 0 (0.0%) |
| 35 to 64 Years | 67 (9.6%) | 0 (0.0%) |
| 65 to 74 Years | 18 (3.4%) | 0 (0.0%) |
| 75 Years and over | 0 (0.0%) | 0 (0.0%) |
Disability Class: Cognitive Difficulty
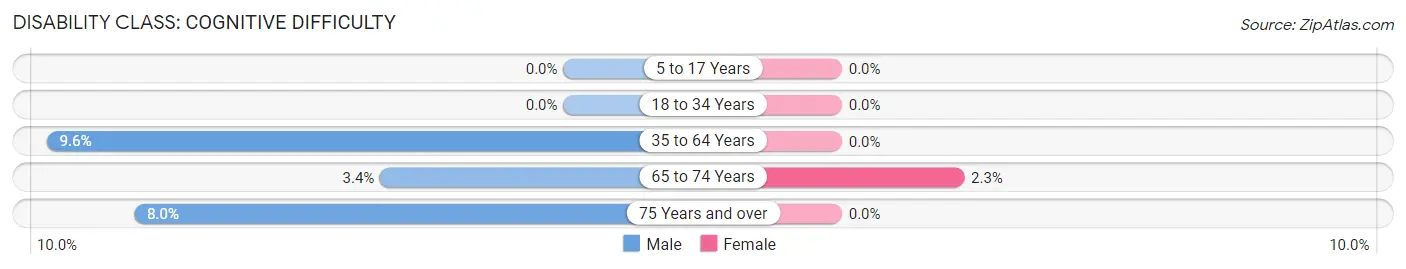
| Age Bracket | Male | Female |
| 5 to 17 Years | 0 (0.0%) | 0 (0.0%) |
| 18 to 34 Years | 0 (0.0%) | 0 (0.0%) |
| 35 to 64 Years | 67 (9.6%) | 0 (0.0%) |
| 65 to 74 Years | 18 (3.4%) | 10 (2.3%) |
| 75 Years and over | 22 (8.0%) | 0 (0.0%) |
Disability Class: Ambulatory Difficulty
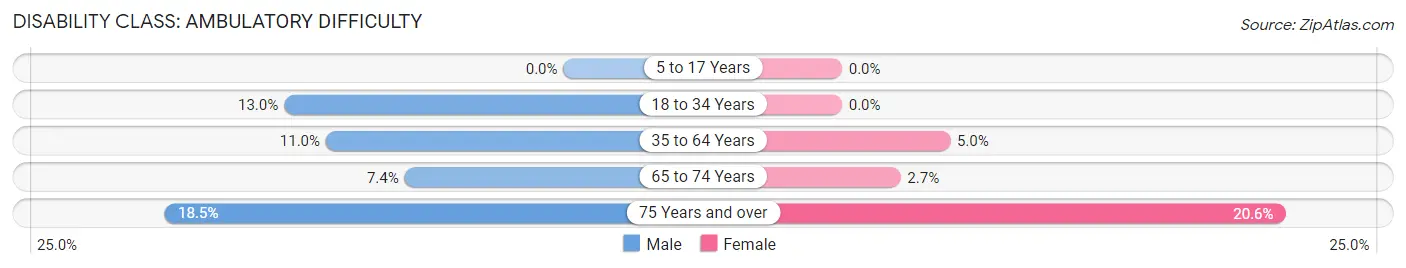
| Age Bracket | Male | Female |
| 5 to 17 Years | 0 (0.0%) | 0 (0.0%) |
| 18 to 34 Years | 21 (13.0%) | 0 (0.0%) |
| 35 to 64 Years | 77 (11.0%) | 38 (5.0%) |
| 65 to 74 Years | 39 (7.4%) | 12 (2.7%) |
| 75 Years and over | 51 (18.5%) | 57 (20.6%) |
Disability Class: Self-Care Difficulty
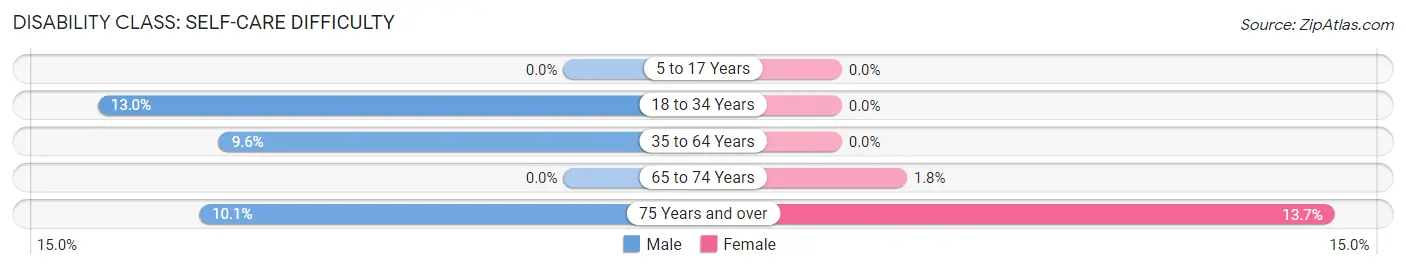
| Age Bracket | Male | Female |
| 5 to 17 Years | 0 (0.0%) | 0 (0.0%) |
| 18 to 34 Years | 21 (13.0%) | 0 (0.0%) |
| 35 to 64 Years | 67 (9.6%) | 0 (0.0%) |
| 65 to 74 Years | 0 (0.0%) | 8 (1.8%) |
| 75 Years and over | 28 (10.1%) | 38 (13.7%) |
Technology Access in North Shore
Computing Device Access in North Shore
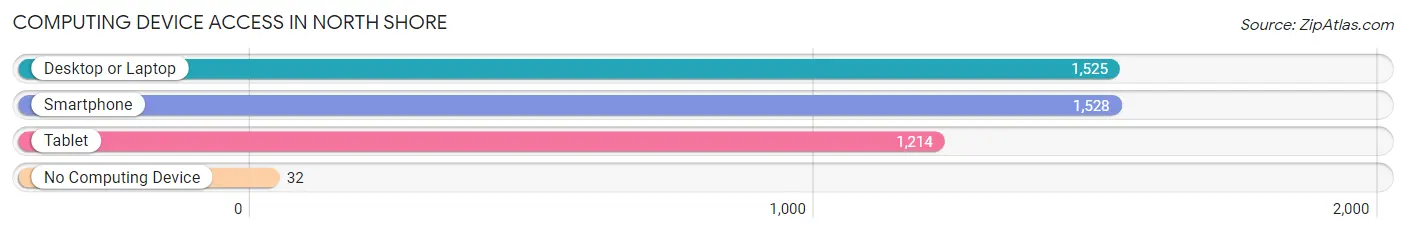
| Device Type | # Households | % Households |
| Desktop or Laptop | 1,525 | 92.6% |
| Smartphone | 1,528 | 92.8% |
| Tablet | 1,214 | 73.8% |
| No Computing Device | 32 | 1.9% |
| Total | 1,646 | 100.0% |
Internet Access in North Shore
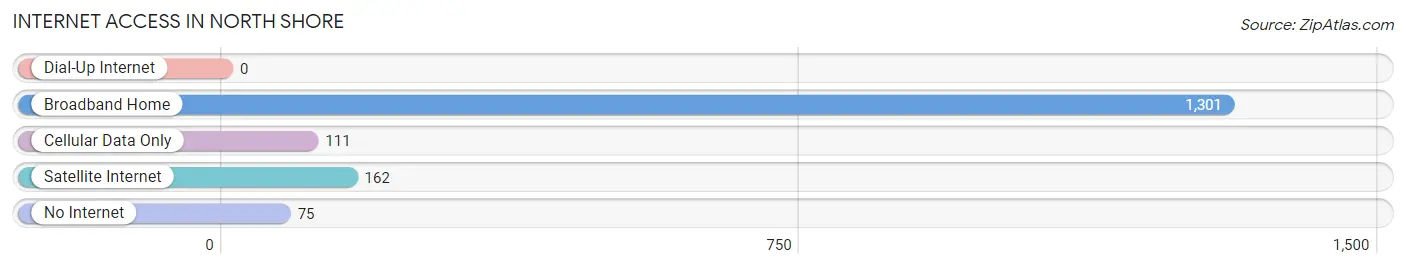
| Internet Type | # Households | % Households |
| Dial-Up Internet | 0 | 0.0% |
| Broadband Home | 1,301 | 79.0% |
| Cellular Data Only | 111 | 6.7% |
| Satellite Internet | 162 | 9.8% |
| No Internet | 75 | 4.6% |
| Total | 1,646 | 100.0% |
North Shore Summary
The North Shore of Virginia is a region located on the eastern side of the Chesapeake Bay. It is bordered by the Potomac River to the north, the Rappahannock River to the south, and the Chesapeake Bay to the east. The North Shore is a diverse region with a rich history, unique geography, and a vibrant economy.
History
The North Shore of Virginia has a long and storied history. The area was first inhabited by Native American tribes, including the Powhatan, Rappahannock, and Nottoway. The first European settlers arrived in the area in the early 1600s, and the region quickly became a hub of colonial activity. The North Shore was home to several important ports, including the port of Urbanna, which was the first port of entry for the Virginia Colony. The region also played an important role in the American Revolution, with several battles taking place in the area.
In the 19th century, the North Shore became an important center of industry and commerce. The region was home to several shipyards, which produced ships for the Union Navy during the Civil War. After the war, the North Shore continued to be an important center of industry, with several factories and mills located in the area.
Geography
The North Shore of Virginia is located on the eastern side of the Chesapeake Bay. The region is bordered by the Potomac River to the north, the Rappahannock River to the south, and the Chesapeake Bay to the east. The North Shore is a diverse region, with a variety of landscapes, including rolling hills, forests, and marshlands. The region is also home to several rivers, including the Rappahannock, Potomac, and York.
The North Shore is divided into two distinct regions: the Northern Neck and the Middle Peninsula. The Northern Neck is located north of the Rappahannock River and is home to several small towns and villages. The Middle Peninsula is located south of the Rappahannock River and is home to larger cities, such as Gloucester and Mathews.
Economy
The North Shore of Virginia has a vibrant economy. The region is home to several industries, including shipbuilding, fishing, and tourism. The region is also home to several large employers, including the Naval Weapons Station Yorktown, the Newport News Shipbuilding and Drydock Company, and the Norfolk Naval Shipyard.
The North Shore is also home to several small businesses, including restaurants, retail stores, and art galleries. The region is also home to several wineries, breweries, and distilleries.
Demographics
The North Shore of Virginia is home to a diverse population. According to the 2010 census, the population of the region was approximately 590,000. The population is predominantly white (83.3%), with African Americans (10.2%), Hispanics (3.2%), and Asians (2.2%) making up the remainder of the population.
The North Shore is also home to a variety of religious denominations, including Christianity (77.2%), Judaism (1.2%), and Islam (0.3%). The region is also home to a variety of languages, including English (90.2%), Spanish (3.2%), and Vietnamese (1.2%).
Conclusion
The North Shore of Virginia is a diverse region with a rich history, unique geography, and a vibrant economy. The region is home to a variety of industries, including shipbuilding, fishing, and tourism. The region is also home to a diverse population, with a variety of ethnicities, religions, and languages represented. The North Shore is an important part of the state of Virginia and is an integral part of the Chesapeake Bay region.
Common Questions
What is Per Capita Income in North Shore?
Per Capita income in North Shore is $68,107.
What is the Median Family Income in North Shore?
Median Family Income in North Shore is $129,490.
What is the Median Household income in North Shore?
Median Household Income in North Shore is $109,688.
What is Income or Wage Gap in North Shore?
Income or Wage Gap in North Shore is 43.1%.
Women in North Shore earn 56.9 cents for every dollar earned by a man.
What is Family Income Deficit in North Shore?
Family Income Deficit in North Shore is $7,110.
Families that are below poverty line in North Shore earn $7,110 less on average than the poverty threshold level.
What is Inequality or Gini Index in North Shore?
Inequality or Gini Index in North Shore is 0.44.
What is the Total Population of North Shore?
Total Population of North Shore is 3,588.
What is the Total Male Population of North Shore?
Total Male Population of North Shore is 1,855.
What is the Total Female Population of North Shore?
Total Female Population of North Shore is 1,733.
What is the Ratio of Males per 100 Females in North Shore?
There are 107.04 Males per 100 Females in North Shore.
What is the Ratio of Females per 100 Males in North Shore?
There are 93.42 Females per 100 Males in North Shore.
What is the Median Population Age in North Shore?
Median Population Age in North Shore is 61.7 Years.
What is the Average Family Size in North Shore
Average Family Size in North Shore is 2.4 People.
What is the Average Household Size in North Shore
Average Household Size in North Shore is 2.2 People.
How Large is the Labor Force in North Shore?
There are 1,345 People in the Labor Forcein in North Shore.
What is the Percentage of People in the Labor Force in North Shore?
40.7% of People are in the Labor Force in North Shore.
What is the Unemployment Rate in North Shore?
Unemployment Rate in North Shore is 3.9%.