Poquoson, VA Map & Demographics
Poquoson Map
Poquoson Overview
$47,329
PER CAPITA INCOME
$121,086
AVG FAMILY INCOME
$114,503
AVG HOUSEHOLD INCOME
23.6%
WAGE / INCOME GAP [ % ]
76.4¢/ $1
WAGE / INCOME GAP [ $ ]
0.35
INEQUALITY / GINI INDEX
12,479
TOTAL POPULATION
6,277
MALE POPULATION
6,202
FEMALE POPULATION
101.21
MALES / 100 FEMALES
98.81
FEMALES / 100 MALES
42.4
MEDIAN AGE
3.0
AVG FAMILY SIZE
2.7
AVG HOUSEHOLD SIZE
6,532
LABOR FORCE [ PEOPLE ]
64.5%
PERCENT IN LABOR FORCE
1.4%
UNEMPLOYMENT RATE
Poquoson Zip Codes
Poquoson Area Codes
Income in Poquoson
Income Overview in Poquoson
Per Capita Income in Poquoson is $47,329, while median incomes of families and households are $121,086 and $114,503 respectively.
| Characteristic | Number | Measure |
| Per Capita Income | 12,479 | $47,329 |
| Median Family Income | 3,838 | $121,086 |
| Mean Family Income | 3,838 | $138,750 |
| Median Household Income | 4,657 | $114,503 |
| Mean Household Income | 4,657 | $129,071 |
| Income Deficit | 3,838 | $0 |
| Wage / Income Gap (%) | 12,479 | 23.60% |
| Wage / Income Gap ($) | 12,479 | 76.40¢ per $1 |
| Gini / Inequality Index | 12,479 | 0.35 |
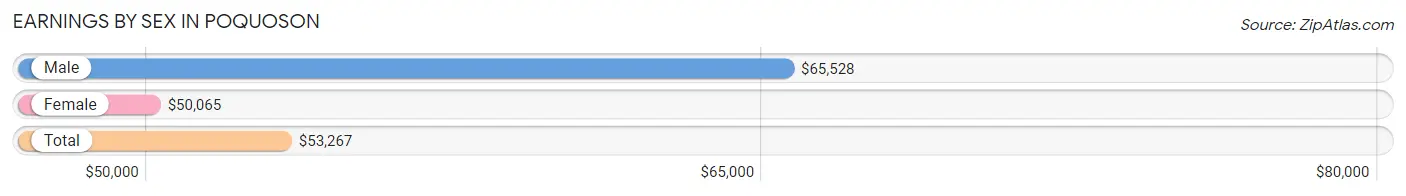
Earnings by Sex in Poquoson
Average Earnings in Poquoson are $53,267, $65,528 for men and $50,065 for women, a difference of 23.6%.
| Sex | Number | Average Earnings |
| Male | 3,684 (54.1%) | $65,528 |
| Female | 3,123 (45.9%) | $50,065 |
| Total | 6,807 (100.0%) | $53,267 |
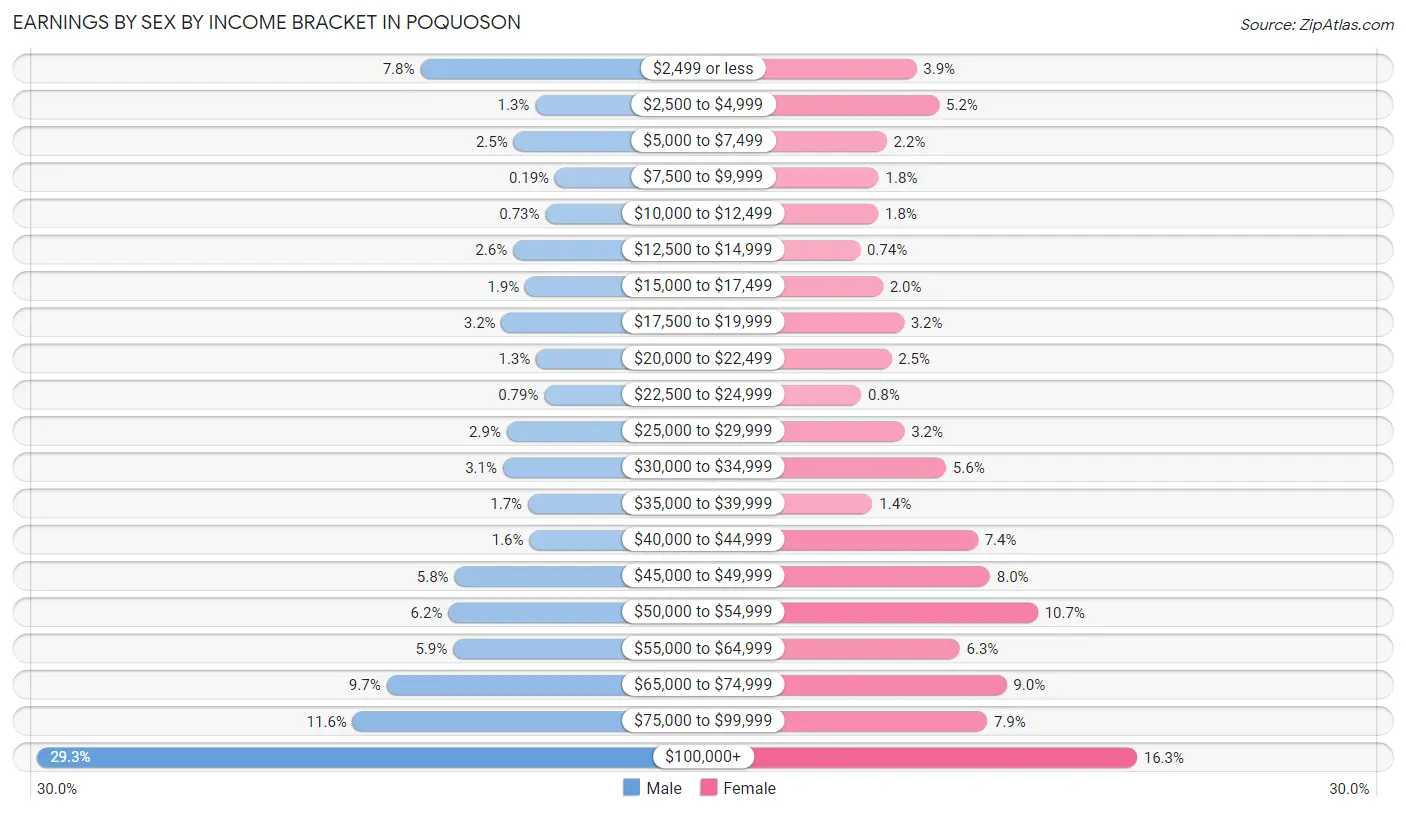
Earnings by Sex by Income Bracket in Poquoson
The most common earnings brackets in Poquoson are $100,000+ for men (1,079 | 29.3%) and $100,000+ for women (509 | 16.3%).
| Income | Male | Female |
| $2,499 or less | 286 (7.8%) | 122 (3.9%) |
| $2,500 to $4,999 | 48 (1.3%) | 162 (5.2%) |
| $5,000 to $7,499 | 93 (2.5%) | 70 (2.2%) |
| $7,500 to $9,999 | 7 (0.2%) | 56 (1.8%) |
| $10,000 to $12,499 | 27 (0.7%) | 55 (1.8%) |
| $12,500 to $14,999 | 94 (2.5%) | 23 (0.7%) |
| $15,000 to $17,499 | 69 (1.9%) | 63 (2.0%) |
| $17,500 to $19,999 | 118 (3.2%) | 100 (3.2%) |
| $20,000 to $22,499 | 46 (1.3%) | 78 (2.5%) |
| $22,500 to $24,999 | 29 (0.8%) | 25 (0.8%) |
| $25,000 to $29,999 | 107 (2.9%) | 101 (3.2%) |
| $30,000 to $34,999 | 115 (3.1%) | 174 (5.6%) |
| $35,000 to $39,999 | 63 (1.7%) | 45 (1.4%) |
| $40,000 to $44,999 | 60 (1.6%) | 230 (7.4%) |
| $45,000 to $49,999 | 215 (5.8%) | 251 (8.0%) |
| $50,000 to $54,999 | 228 (6.2%) | 335 (10.7%) |
| $55,000 to $64,999 | 218 (5.9%) | 198 (6.3%) |
| $65,000 to $74,999 | 356 (9.7%) | 280 (9.0%) |
| $75,000 to $99,999 | 426 (11.6%) | 246 (7.9%) |
| $100,000+ | 1,079 (29.3%) | 509 (16.3%) |
| Total | 3,684 (100.0%) | 3,123 (100.0%) |
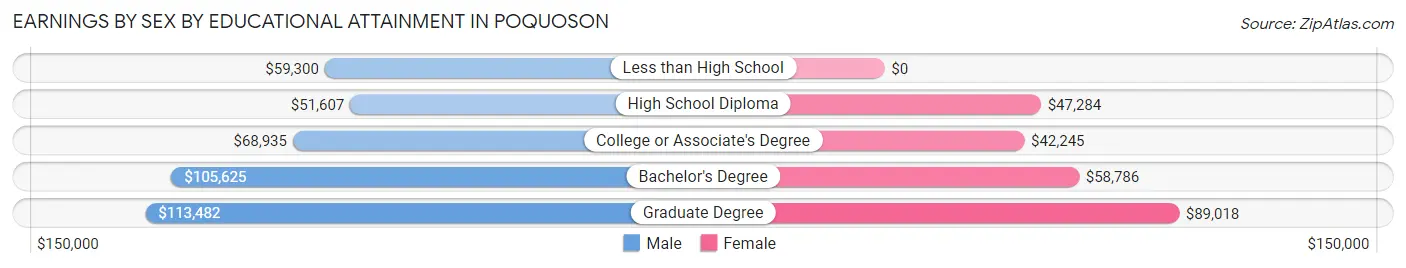
Earnings by Sex by Educational Attainment in Poquoson
Average earnings in Poquoson are $71,609 for men and $52,062 for women, a difference of 27.3%. Men with an educational attainment of graduate degree enjoy the highest average annual earnings of $113,482, while those with high school diploma education earn the least with $51,607. Women with an educational attainment of graduate degree earn the most with the average annual earnings of $89,018, while those with college or associate's degree education have the smallest earnings of $42,245.
| Educational Attainment | Male Income | Female Income |
| Less than High School | $59,300 | $0 |
| High School Diploma | $51,607 | $47,284 |
| College or Associate's Degree | $68,935 | $42,245 |
| Bachelor's Degree | $105,625 | $58,786 |
| Graduate Degree | $113,482 | $89,018 |
| Total | $71,609 | $52,062 |
Family Income in Poquoson
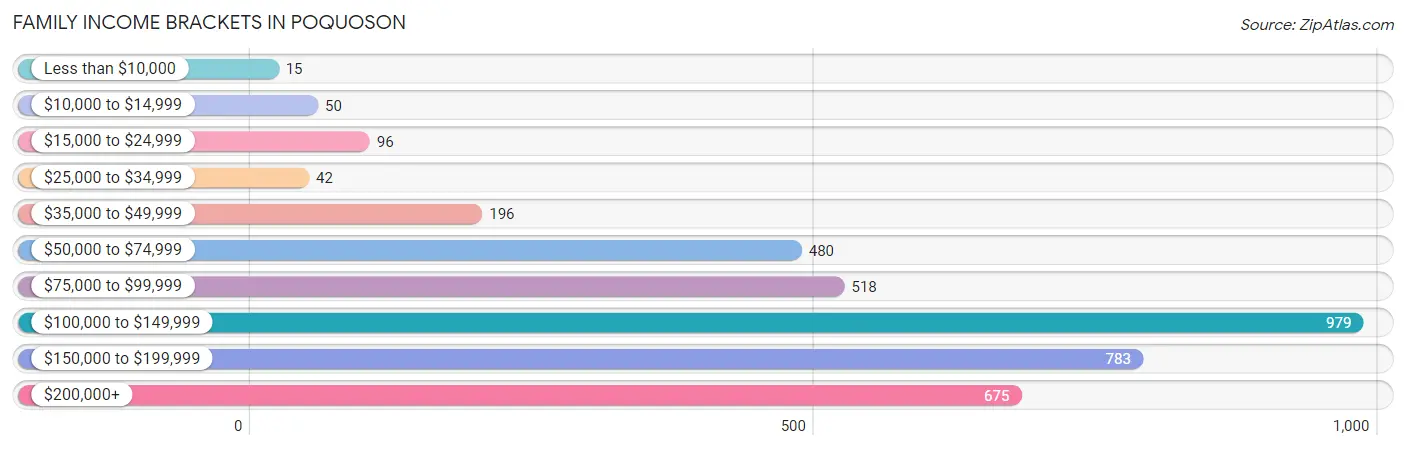
Family Income Brackets in Poquoson
According to the Poquoson family income data, there are 979 families falling into the $100,000 to $149,999 income range, which is the most common income bracket and makes up 25.5% of all families. Conversely, the less than $10,000 income bracket is the least frequent group with only 15 families (0.4%) belonging to this category.
| Income Bracket | # Families | % Families |
| Less than $10,000 | 15 | 0.4% |
| $10,000 to $14,999 | 50 | 1.3% |
| $15,000 to $24,999 | 96 | 2.5% |
| $25,000 to $34,999 | 42 | 1.1% |
| $35,000 to $49,999 | 196 | 5.1% |
| $50,000 to $74,999 | 480 | 12.5% |
| $75,000 to $99,999 | 518 | 13.5% |
| $100,000 to $149,999 | 979 | 25.5% |
| $150,000 to $199,999 | 783 | 20.4% |
| $200,000+ | 675 | 17.6% |
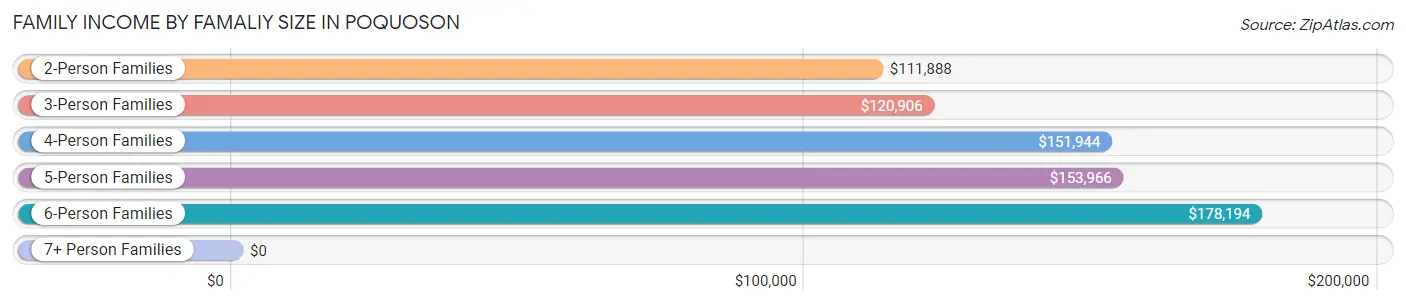
Family Income by Famaliy Size in Poquoson
6-person families (91 | 2.4%) account for the highest median family income in Poquoson with $178,194 per family, while 2-person families (1,702 | 44.4%) have the highest median income of $55,944 per family member.
| Income Bracket | # Families | Median Income |
| 2-Person Families | 1,702 (44.4%) | $111,888 |
| 3-Person Families | 925 (24.1%) | $120,906 |
| 4-Person Families | 712 (18.5%) | $151,944 |
| 5-Person Families | 377 (9.8%) | $153,966 |
| 6-Person Families | 91 (2.4%) | $178,194 |
| 7+ Person Families | 31 (0.8%) | $0 |
| Total | 3,838 (100.0%) | $121,086 |
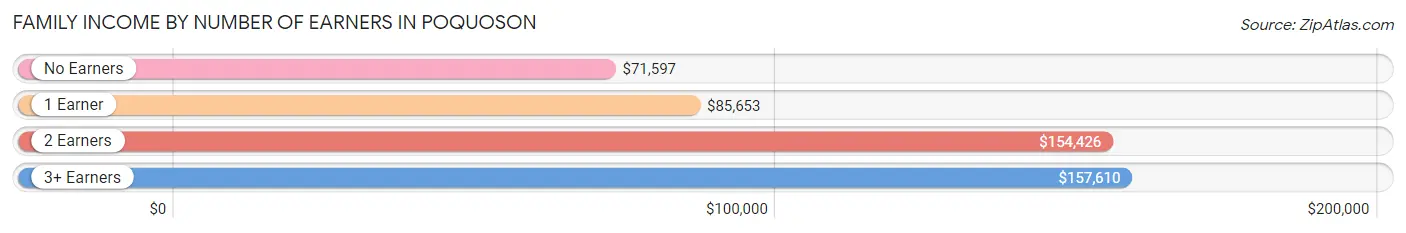
Family Income by Number of Earners in Poquoson
The median family income in Poquoson is $121,086, with families comprising 3+ earners (510) having the highest median family income of $157,610, while families with no earners (531) have the lowest median family income of $71,597, accounting for 13.3% and 13.8% of families, respectively.
| Number of Earners | # Families | Median Income |
| No Earners | 531 (13.8%) | $71,597 |
| 1 Earner | 1,041 (27.1%) | $85,653 |
| 2 Earners | 1,756 (45.8%) | $154,426 |
| 3+ Earners | 510 (13.3%) | $157,610 |
| Total | 3,838 (100.0%) | $121,086 |
Household Income in Poquoson
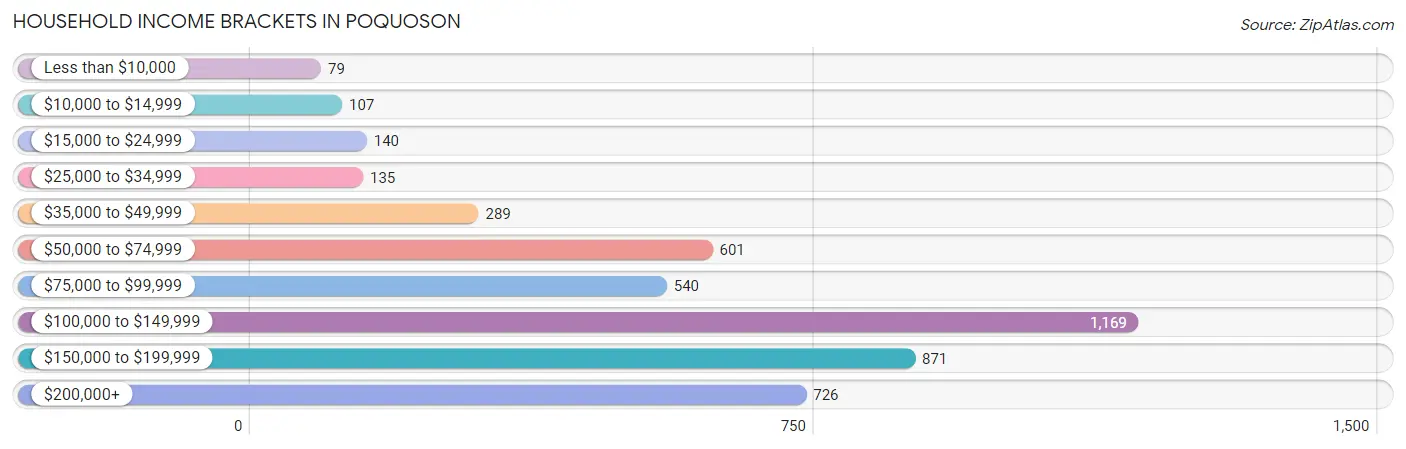
Household Income Brackets in Poquoson
With 1,169 households falling in the category, the $100,000 to $149,999 income range is the most frequent in Poquoson, accounting for 25.1% of all households. In contrast, only 79 households (1.7%) fall into the less than $10,000 income bracket, making it the least populous group.
| Income Bracket | # Households | % Households |
| Less than $10,000 | 79 | 1.7% |
| $10,000 to $14,999 | 107 | 2.3% |
| $15,000 to $24,999 | 140 | 3.0% |
| $25,000 to $34,999 | 135 | 2.9% |
| $35,000 to $49,999 | 289 | 6.2% |
| $50,000 to $74,999 | 601 | 12.9% |
| $75,000 to $99,999 | 540 | 11.6% |
| $100,000 to $149,999 | 1,169 | 25.1% |
| $150,000 to $199,999 | 871 | 18.7% |
| $200,000+ | 726 | 15.6% |
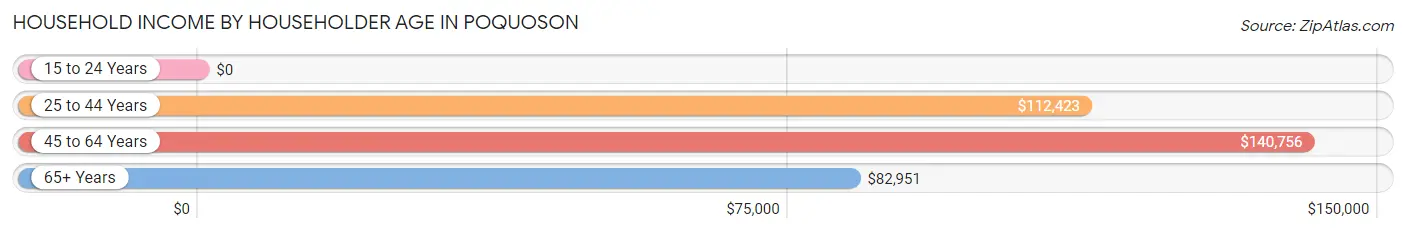
Household Income by Householder Age in Poquoson
The median household income in Poquoson is $114,503, with the highest median household income of $140,756 found in the 45 to 64 years age bracket for the primary householder. A total of 1,830 households (39.3%) fall into this category. Meanwhile, the 15 to 24 years age bracket for the primary householder has the lowest median household income of $0, with 4 households (0.1%) in this group.
| Income Bracket | # Households | Median Income |
| 15 to 24 Years | 4 (0.1%) | $0 |
| 25 to 44 Years | 1,464 (31.4%) | $112,423 |
| 45 to 64 Years | 1,830 (39.3%) | $140,756 |
| 65+ Years | 1,359 (29.2%) | $82,951 |
| Total | 4,657 (100.0%) | $114,503 |
Poverty in Poquoson
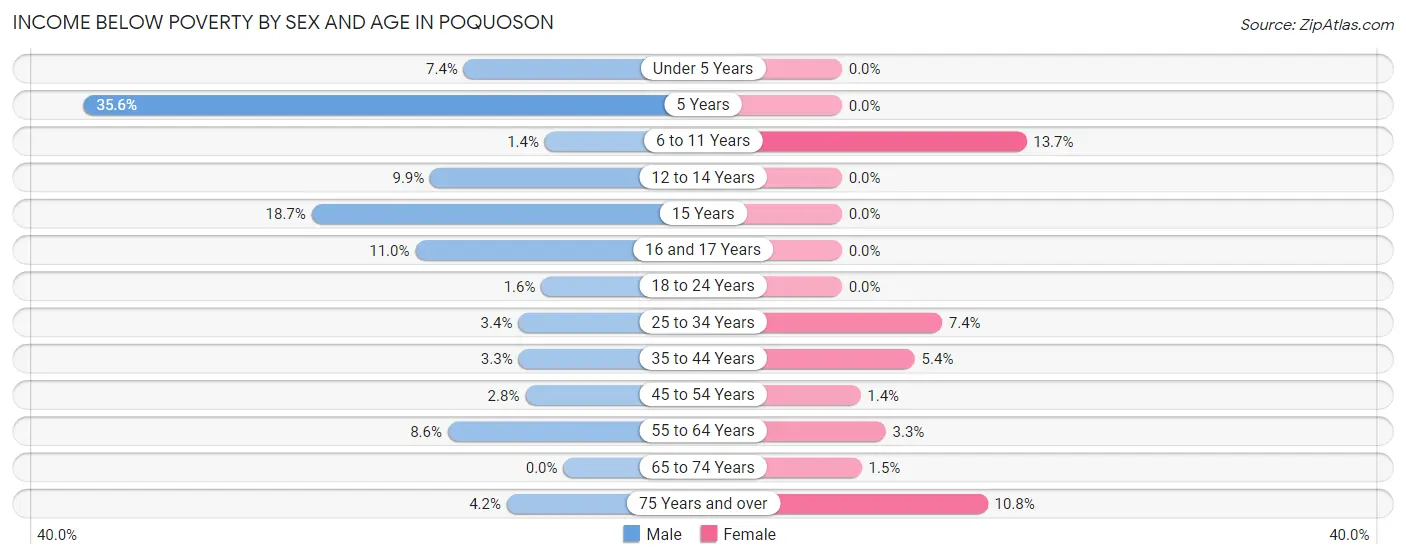
Income Below Poverty by Sex and Age in Poquoson
With 4.8% poverty level for males and 4.2% for females among the residents of Poquoson, 5 year old males and 6 to 11 year old females are the most vulnerable to poverty, with 26 males (35.6%) and 57 females (13.7%) in their respective age groups living below the poverty level.
| Age Bracket | Male | Female |
| Under 5 Years | 23 (7.4%) | 0 (0.0%) |
| 5 Years | 26 (35.6%) | 0 (0.0%) |
| 6 to 11 Years | 7 (1.4%) | 57 (13.7%) |
| 12 to 14 Years | 26 (9.9%) | 0 (0.0%) |
| 15 Years | 20 (18.7%) | 0 (0.0%) |
| 16 and 17 Years | 20 (11.0%) | 0 (0.0%) |
| 18 to 24 Years | 8 (1.6%) | 0 (0.0%) |
| 25 to 34 Years | 21 (3.4%) | 45 (7.4%) |
| 35 to 44 Years | 29 (3.3%) | 42 (5.4%) |
| 45 to 54 Years | 23 (2.8%) | 12 (1.4%) |
| 55 to 64 Years | 76 (8.6%) | 27 (3.3%) |
| 65 to 74 Years | 0 (0.0%) | 10 (1.5%) |
| 75 Years and over | 21 (4.2%) | 67 (10.8%) |
| Total | 300 (4.8%) | 260 (4.2%) |
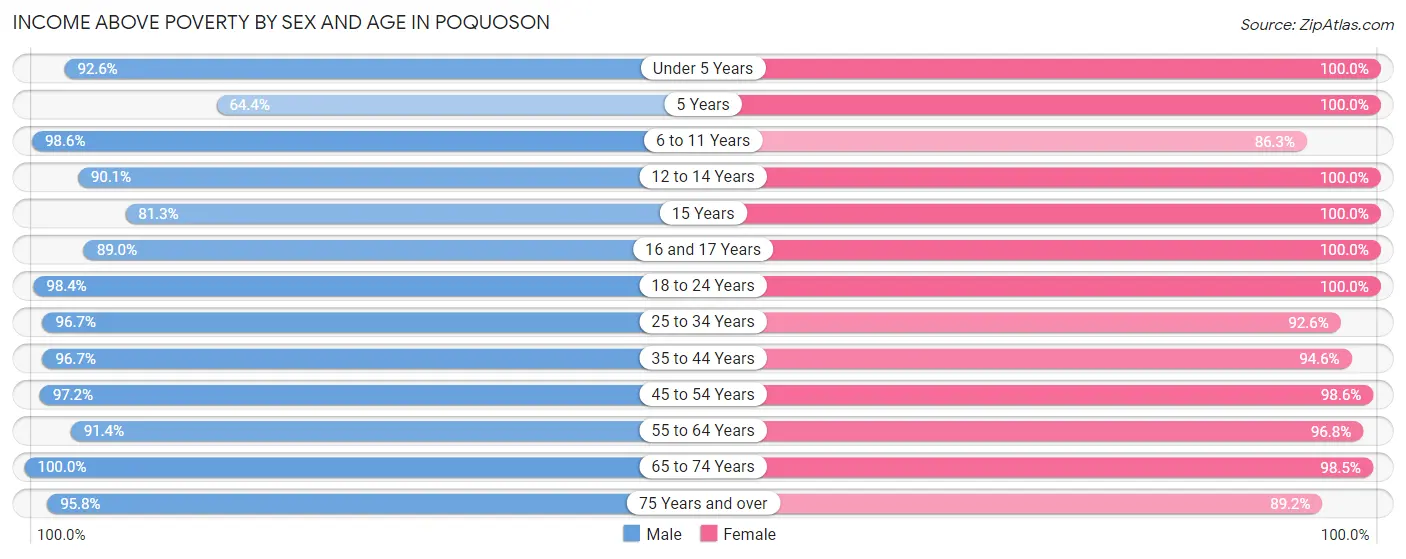
Income Above Poverty by Sex and Age in Poquoson
According to the poverty statistics in Poquoson, males aged 65 to 74 years and females aged under 5 years are the age groups that are most secure financially, with 100.0% of males and 100.0% of females in these age groups living above the poverty line.
| Age Bracket | Male | Female |
| Under 5 Years | 288 (92.6%) | 268 (100.0%) |
| 5 Years | 47 (64.4%) | 67 (100.0%) |
| 6 to 11 Years | 501 (98.6%) | 359 (86.3%) |
| 12 to 14 Years | 237 (90.1%) | 297 (100.0%) |
| 15 Years | 87 (81.3%) | 34 (100.0%) |
| 16 and 17 Years | 162 (89.0%) | 286 (100.0%) |
| 18 to 24 Years | 480 (98.4%) | 424 (100.0%) |
| 25 to 34 Years | 605 (96.7%) | 561 (92.6%) |
| 35 to 44 Years | 841 (96.7%) | 734 (94.6%) |
| 45 to 54 Years | 789 (97.2%) | 858 (98.6%) |
| 55 to 64 Years | 810 (91.4%) | 804 (96.8%) |
| 65 to 74 Years | 651 (100.0%) | 671 (98.5%) |
| 75 Years and over | 479 (95.8%) | 552 (89.2%) |
| Total | 5,977 (95.2%) | 5,915 (95.8%) |
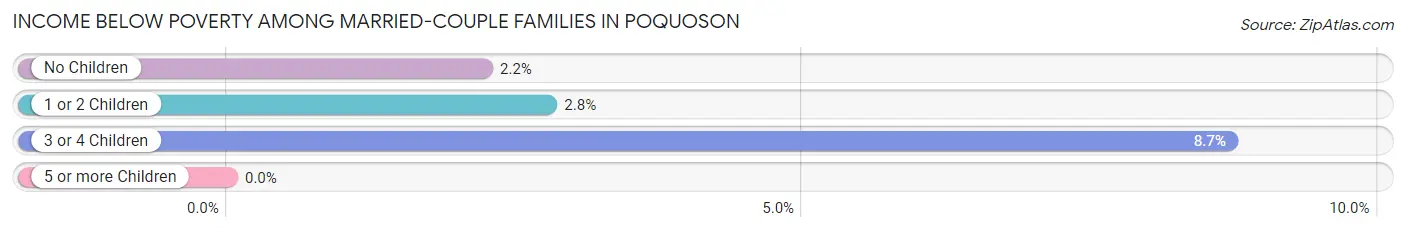
Income Below Poverty Among Married-Couple Families in Poquoson
The poverty statistics for married-couple families in Poquoson show that 3.0% or 101 of the total 3,331 families live below the poverty line. Families with 3 or 4 children have the highest poverty rate of 8.7%, comprising of 28 families. On the other hand, families with 5 or more children have the lowest poverty rate of 0.0%, which includes 0 families.
| Children | Above Poverty | Below Poverty |
| No Children | 1,802 (97.8%) | 41 (2.2%) |
| 1 or 2 Children | 1,120 (97.2%) | 32 (2.8%) |
| 3 or 4 Children | 294 (91.3%) | 28 (8.7%) |
| 5 or more Children | 14 (100.0%) | 0 (0.0%) |
| Total | 3,230 (97.0%) | 101 (3.0%) |
Income Below Poverty Among Single-Parent Households in Poquoson
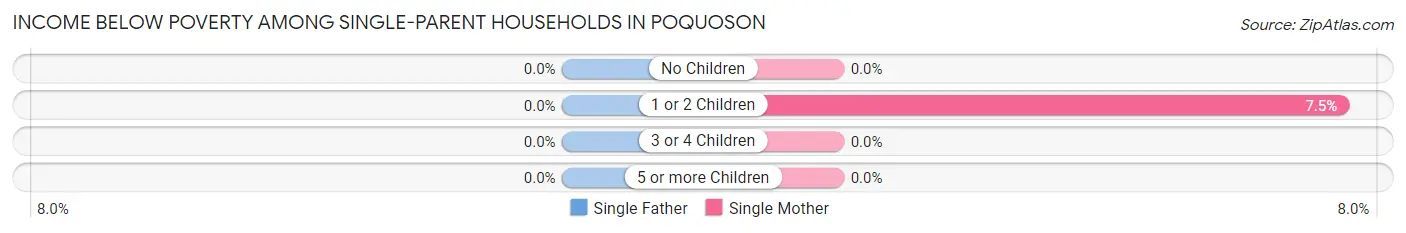
| Children | Single Father | Single Mother |
| No Children | 0 (0.0%) | 0 (0.0%) |
| 1 or 2 Children | 0 (0.0%) | 14 (7.5%) |
| 3 or 4 Children | 0 (0.0%) | 0 (0.0%) |
| 5 or more Children | 0 (0.0%) | 0 (0.0%) |
| Total | 0 (0.0%) | 14 (4.0%) |
Income Below Poverty Among Married-Couple vs Single-Parent Households in Poquoson
The poverty data for Poquoson shows that 101 of the married-couple family households (3.0%) and 14 of the single-parent households (2.8%) are living below the poverty level. Within the married-couple family households, those with 3 or 4 children have the highest poverty rate, with 28 households (8.7%) falling below the poverty line. Among the single-parent households, those with 1 or 2 children have the highest poverty rate, with 14 household (4.6%) living below poverty.
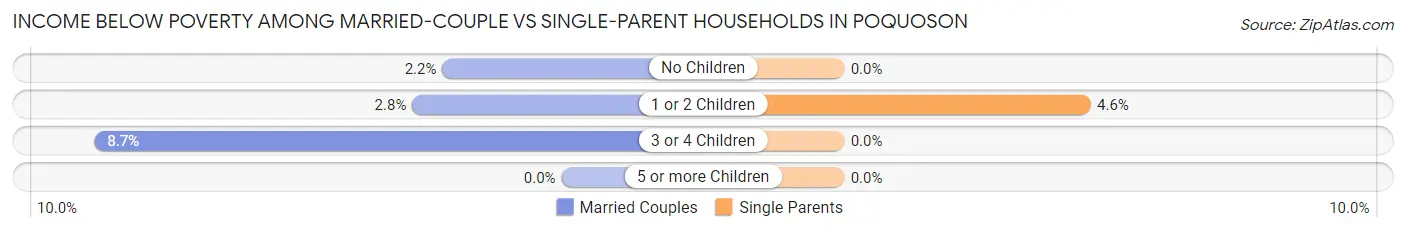
| Children | Married-Couple Families | Single-Parent Households |
| No Children | 41 (2.2%) | 0 (0.0%) |
| 1 or 2 Children | 32 (2.8%) | 14 (4.6%) |
| 3 or 4 Children | 28 (8.7%) | 0 (0.0%) |
| 5 or more Children | 0 (0.0%) | 0 (0.0%) |
| Total | 101 (3.0%) | 14 (2.8%) |
Race in Poquoson
The most populous races in Poquoson are White / Caucasian (11,544 | 92.5%), Hispanic or Latino (424 | 3.4%), and Two or more Races (361 | 2.9%).
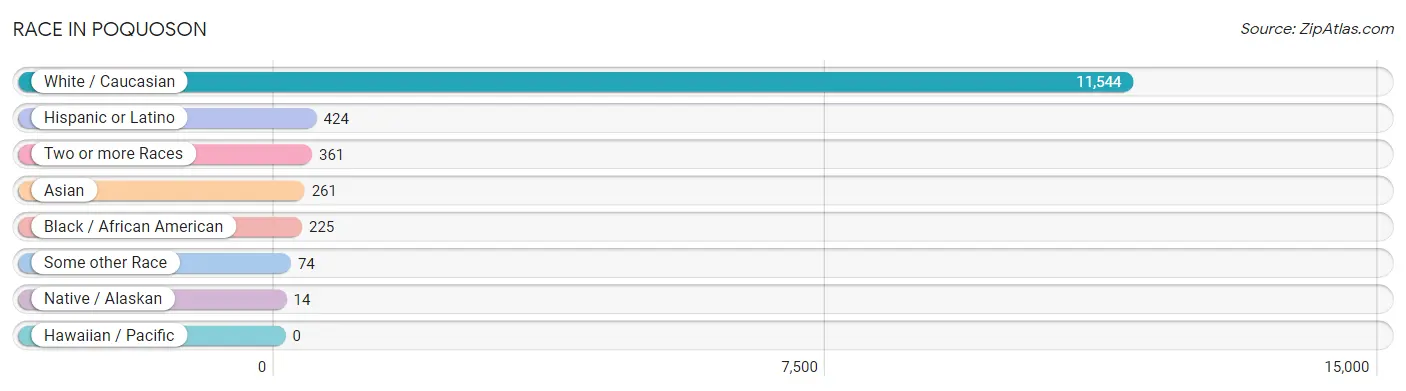
| Race | # Population | % Population |
| Asian | 261 | 2.1% |
| Black / African American | 225 | 1.8% |
| Hawaiian / Pacific | 0 | 0.0% |
| Hispanic or Latino | 424 | 3.4% |
| Native / Alaskan | 14 | 0.1% |
| White / Caucasian | 11,544 | 92.5% |
| Two or more Races | 361 | 2.9% |
| Some other Race | 74 | 0.6% |
| Total | 12,479 | 100.0% |
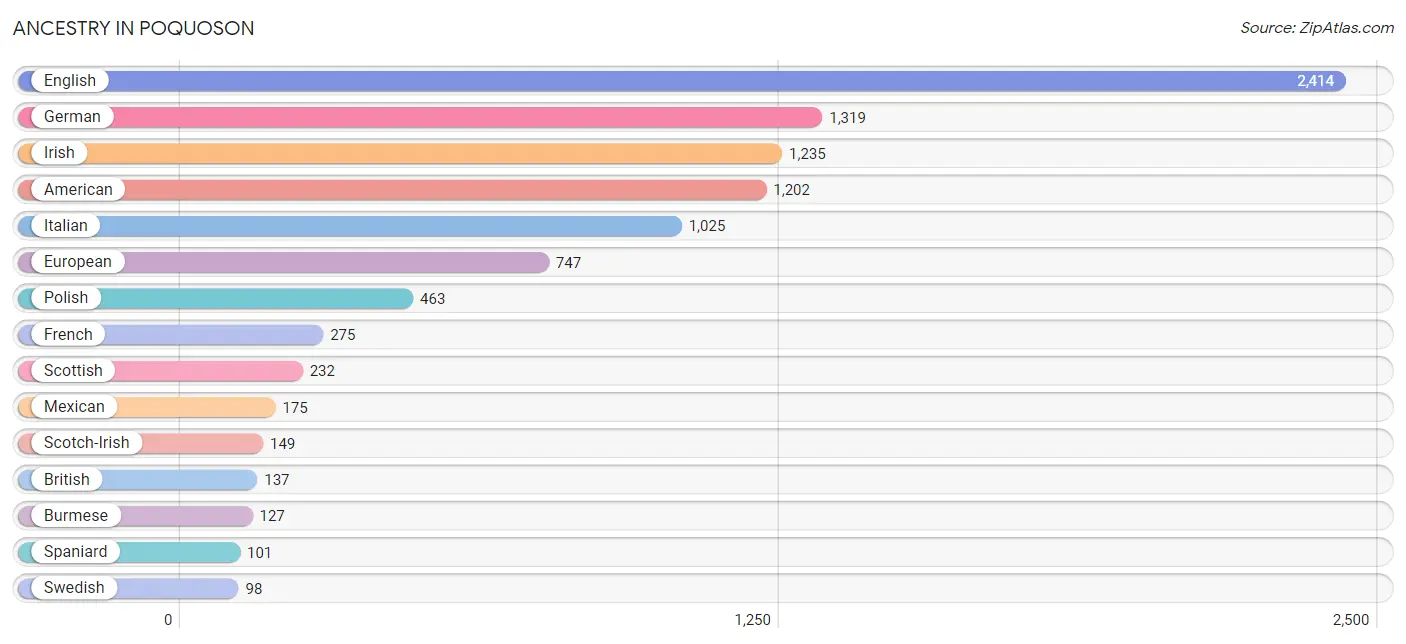
Ancestry in Poquoson
The most populous ancestries reported in Poquoson are English (2,414 | 19.3%), German (1,319 | 10.6%), Irish (1,235 | 9.9%), American (1,202 | 9.6%), and Italian (1,025 | 8.2%), together accounting for 57.7% of all Poquoson residents.
| Ancestry | # Population | % Population |
| Albanian | 8 | 0.1% |
| American | 1,202 | 9.6% |
| Arab | 11 | 0.1% |
| Austrian | 10 | 0.1% |
| Bhutanese | 33 | 0.3% |
| Brazilian | 15 | 0.1% |
| British | 137 | 1.1% |
| Burmese | 127 | 1.0% |
| Canadian | 25 | 0.2% |
| Central American | 34 | 0.3% |
| Cherokee | 57 | 0.5% |
| Chippewa | 10 | 0.1% |
| Colombian | 12 | 0.1% |
| Croatian | 9 | 0.1% |
| Danish | 7 | 0.1% |
| Dutch | 91 | 0.7% |
| Eastern European | 65 | 0.5% |
| English | 2,414 | 19.3% |
| Estonian | 16 | 0.1% |
| European | 747 | 6.0% |
| French | 275 | 2.2% |
| French Canadian | 26 | 0.2% |
| German | 1,319 | 10.6% |
| Greek | 76 | 0.6% |
| Hungarian | 48 | 0.4% |
| Indian (Asian) | 44 | 0.4% |
| Irish | 1,235 | 9.9% |
| Italian | 1,025 | 8.2% |
| Japanese | 27 | 0.2% |
| Korean | 58 | 0.5% |
| Lithuanian | 9 | 0.1% |
| Mexican | 175 | 1.4% |
| Northern European | 14 | 0.1% |
| Norwegian | 85 | 0.7% |
| Palestinian | 11 | 0.1% |
| Panamanian | 34 | 0.3% |
| Pennsylvania German | 15 | 0.1% |
| Polish | 463 | 3.7% |
| Portuguese | 78 | 0.6% |
| Puerto Rican | 82 | 0.7% |
| Romanian | 7 | 0.1% |
| Russian | 30 | 0.2% |
| Scandinavian | 19 | 0.2% |
| Scotch-Irish | 149 | 1.2% |
| Scottish | 232 | 1.9% |
| Slovene | 10 | 0.1% |
| South African | 15 | 0.1% |
| South American | 12 | 0.1% |
| Spaniard | 101 | 0.8% |
| Spanish | 20 | 0.2% |
| Sri Lankan | 36 | 0.3% |
| Subsaharan African | 15 | 0.1% |
| Swedish | 98 | 0.8% |
| Swiss | 33 | 0.3% |
| Thai | 75 | 0.6% |
| Ukrainian | 6 | 0.1% |
| Welsh | 96 | 0.8% |
| West Indian | 4 | 0.0% | View All 58 Rows |
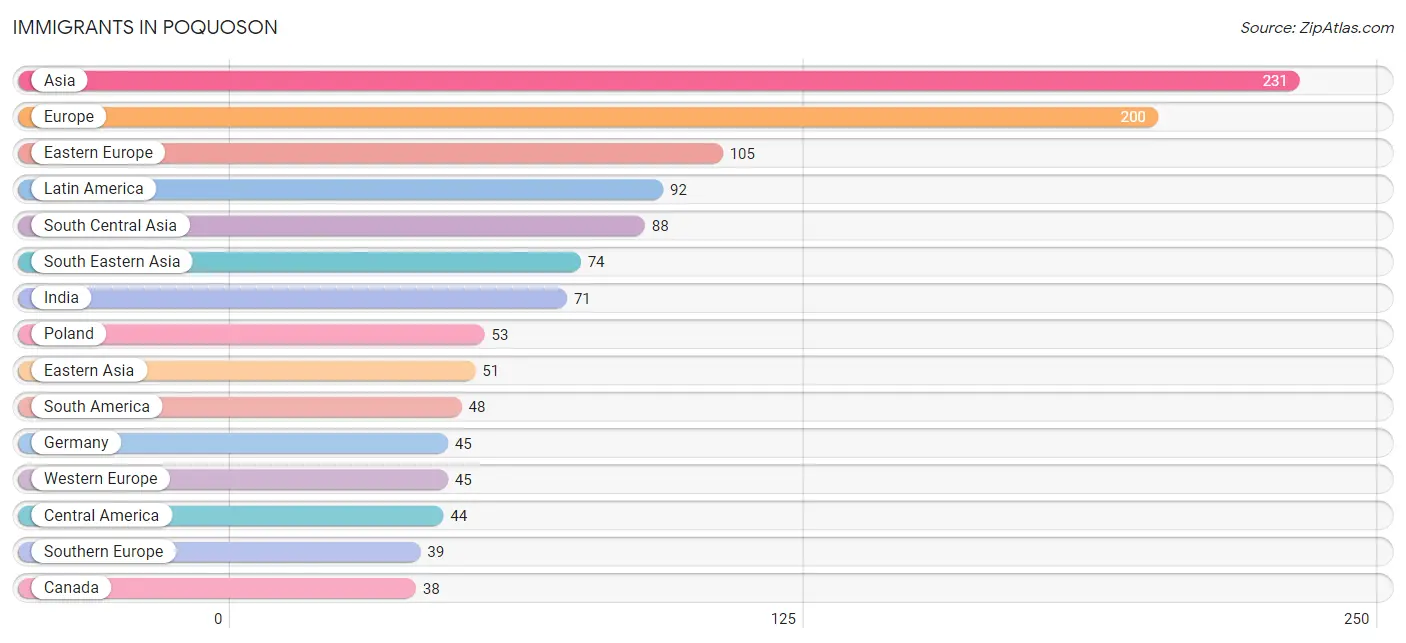
Immigrants in Poquoson
The most numerous immigrant groups reported in Poquoson came from Asia (231 | 1.8%), Europe (200 | 1.6%), Eastern Europe (105 | 0.8%), Latin America (92 | 0.7%), and South Central Asia (88 | 0.7%), together accounting for 5.7% of all Poquoson residents.
| Immigration Origin | # Population | % Population |
| Africa | 15 | 0.1% |
| Asia | 231 | 1.8% |
| Brazil | 27 | 0.2% |
| Canada | 38 | 0.3% |
| Central America | 44 | 0.4% |
| Chile | 9 | 0.1% |
| China | 14 | 0.1% |
| Colombia | 12 | 0.1% |
| Czechoslovakia | 13 | 0.1% |
| Eastern Africa | 15 | 0.1% |
| Eastern Asia | 51 | 0.4% |
| Eastern Europe | 105 | 0.8% |
| England | 11 | 0.1% |
| Europe | 200 | 1.6% |
| Germany | 45 | 0.4% |
| Greece | 32 | 0.3% |
| India | 71 | 0.6% |
| Italy | 7 | 0.1% |
| Japan | 5 | 0.0% |
| Jordan | 11 | 0.1% |
| Korea | 32 | 0.3% |
| Latin America | 92 | 0.7% |
| Mexico | 10 | 0.1% |
| Northern Europe | 11 | 0.1% |
| Pakistan | 17 | 0.1% |
| Panama | 34 | 0.3% |
| Philippines | 27 | 0.2% |
| Poland | 53 | 0.4% |
| Russia | 23 | 0.2% |
| South America | 48 | 0.4% |
| South Central Asia | 88 | 0.7% |
| South Eastern Asia | 74 | 0.6% |
| Southern Europe | 39 | 0.3% |
| Taiwan | 14 | 0.1% |
| Thailand | 18 | 0.1% |
| Vietnam | 29 | 0.2% |
| Western Asia | 11 | 0.1% |
| Western Europe | 45 | 0.4% |
| Zimbabwe | 15 | 0.1% | View All 39 Rows |
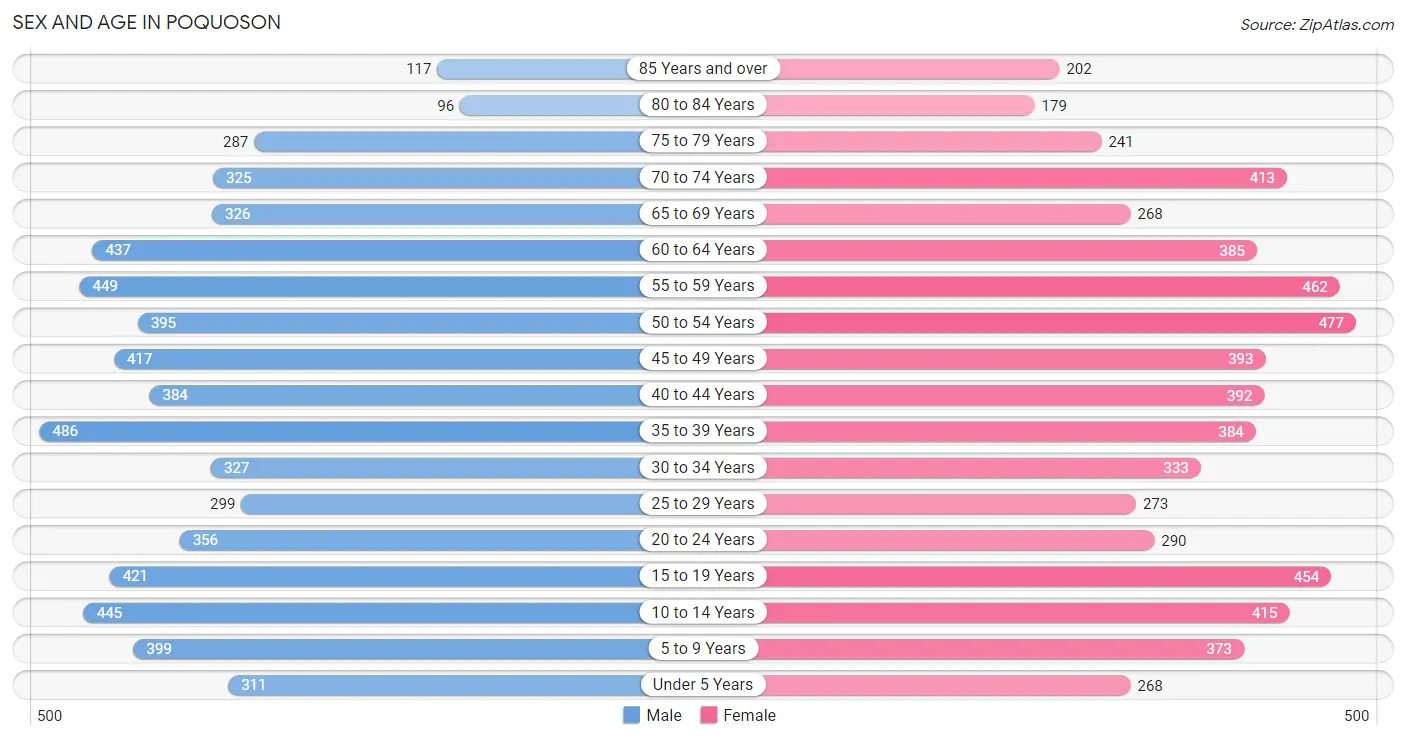
Sex and Age in Poquoson
Sex and Age in Poquoson
The most populous age groups in Poquoson are 35 to 39 Years (486 | 7.7%) for men and 50 to 54 Years (477 | 7.7%) for women.
| Age Bracket | Male | Female |
| Under 5 Years | 311 (5.0%) | 268 (4.3%) |
| 5 to 9 Years | 399 (6.4%) | 373 (6.0%) |
| 10 to 14 Years | 445 (7.1%) | 415 (6.7%) |
| 15 to 19 Years | 421 (6.7%) | 454 (7.3%) |
| 20 to 24 Years | 356 (5.7%) | 290 (4.7%) |
| 25 to 29 Years | 299 (4.8%) | 273 (4.4%) |
| 30 to 34 Years | 327 (5.2%) | 333 (5.4%) |
| 35 to 39 Years | 486 (7.7%) | 384 (6.2%) |
| 40 to 44 Years | 384 (6.1%) | 392 (6.3%) |
| 45 to 49 Years | 417 (6.6%) | 393 (6.3%) |
| 50 to 54 Years | 395 (6.3%) | 477 (7.7%) |
| 55 to 59 Years | 449 (7.1%) | 462 (7.4%) |
| 60 to 64 Years | 437 (7.0%) | 385 (6.2%) |
| 65 to 69 Years | 326 (5.2%) | 268 (4.3%) |
| 70 to 74 Years | 325 (5.2%) | 413 (6.7%) |
| 75 to 79 Years | 287 (4.6%) | 241 (3.9%) |
| 80 to 84 Years | 96 (1.5%) | 179 (2.9%) |
| 85 Years and over | 117 (1.9%) | 202 (3.3%) |
| Total | 6,277 (100.0%) | 6,202 (100.0%) |
Families and Households in Poquoson
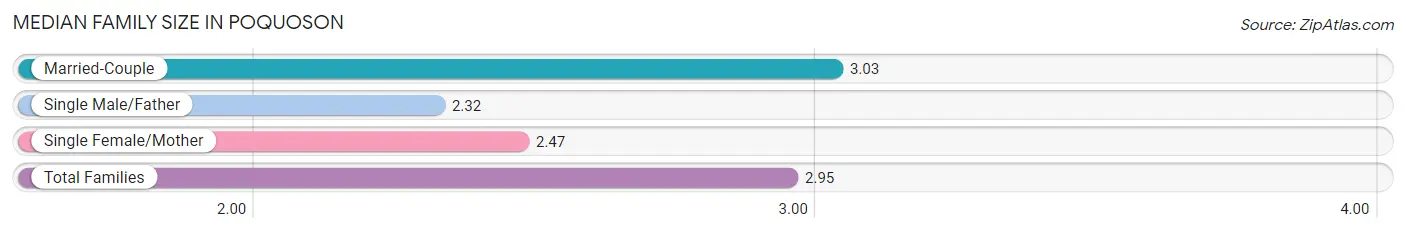
Median Family Size in Poquoson
The median family size in Poquoson is 2.95 persons per family, with married-couple families (3,331 | 86.8%) accounting for the largest median family size of 3.03 persons per family. On the other hand, single male/father families (157 | 4.1%) represent the smallest median family size with 2.32 persons per family.
| Family Type | # Families | Family Size |
| Married-Couple | 3,331 (86.8%) | 3.03 |
| Single Male/Father | 157 (4.1%) | 2.32 |
| Single Female/Mother | 350 (9.1%) | 2.47 |
| Total Families | 3,838 (100.0%) | 2.95 |
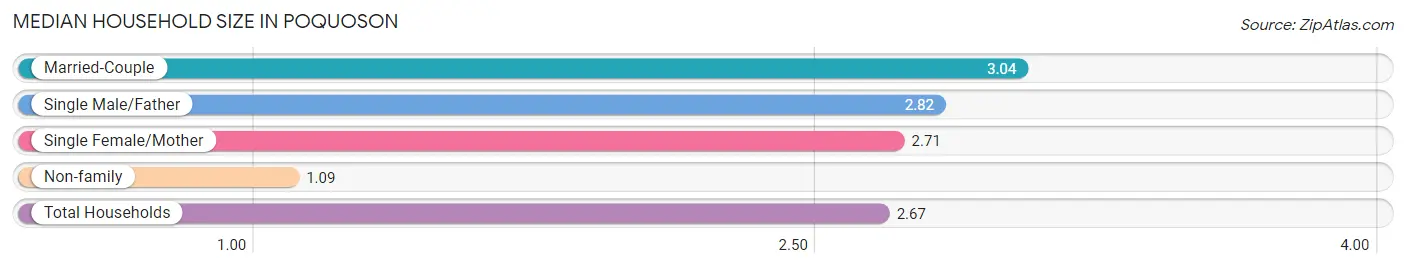
Median Household Size in Poquoson
The median household size in Poquoson is 2.67 persons per household, with married-couple households (3,331 | 71.5%) accounting for the largest median household size of 3.04 persons per household. non-family households (819 | 17.6%) represent the smallest median household size with 1.09 persons per household.
| Household Type | # Households | Household Size |
| Married-Couple | 3,331 (71.5%) | 3.04 |
| Single Male/Father | 157 (3.4%) | 2.82 |
| Single Female/Mother | 350 (7.5%) | 2.71 |
| Non-family | 819 (17.6%) | 1.09 |
| Total Households | 4,657 (100.0%) | 2.67 |
Household Size by Marriage Status in Poquoson
Out of a total of 4,657 households in Poquoson, 3,838 (82.4%) are family households, while 819 (17.6%) are nonfamily households. The most numerous type of family households are 2-person households, comprising 1,671, and the most common type of nonfamily households are 1-person households, comprising 733.
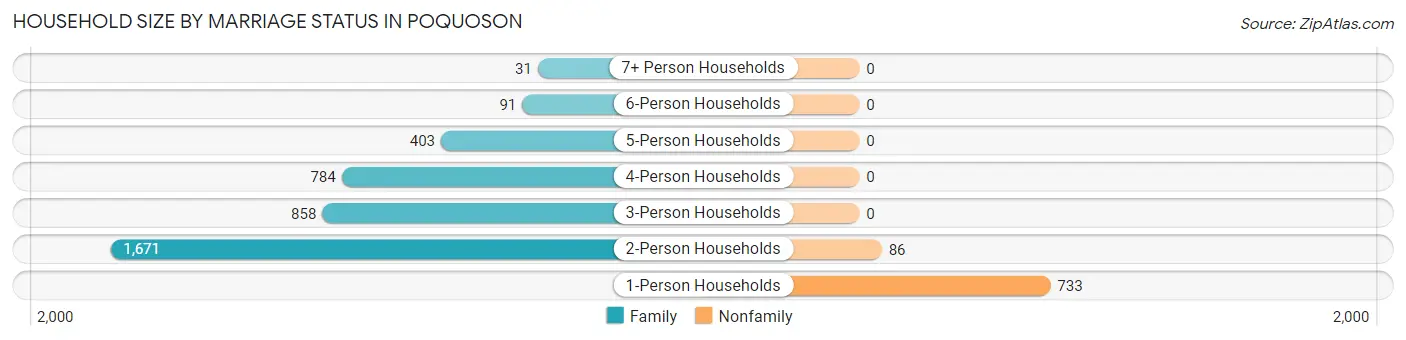
| Household Size | Family Households | Nonfamily Households |
| 1-Person Households | - | 733 (15.7%) |
| 2-Person Households | 1,671 (35.9%) | 86 (1.8%) |
| 3-Person Households | 858 (18.4%) | 0 (0.0%) |
| 4-Person Households | 784 (16.8%) | 0 (0.0%) |
| 5-Person Households | 403 (8.6%) | 0 (0.0%) |
| 6-Person Households | 91 (1.9%) | 0 (0.0%) |
| 7+ Person Households | 31 (0.7%) | 0 (0.0%) |
| Total | 3,838 (82.4%) | 819 (17.6%) |
Female Fertility in Poquoson
Fertility by Age in Poquoson
Average fertility rate in Poquoson is 71.0 births per 1,000 women. Women in the age bracket of 20 to 34 years have the highest fertility rate with 144.0 births per 1,000 women. Women in the age bracket of 20 to 34 years acount for 69.4% of all women with births.
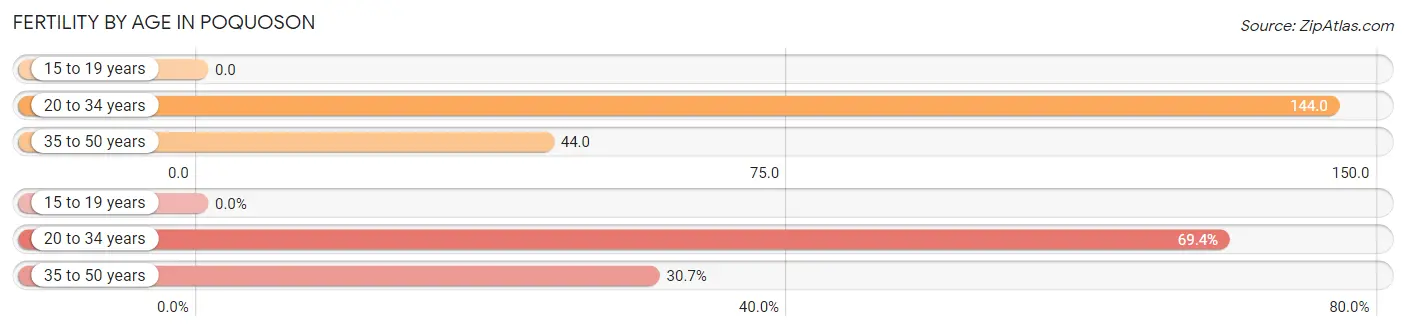
| Age Bracket | Women with Births | Births / 1,000 Women |
| 15 to 19 years | 0 (0.0%) | 0.0 |
| 20 to 34 years | 129 (69.4%) | 144.0 |
| 35 to 50 years | 57 (30.6%) | 44.0 |
| Total | 186 (100.0%) | 71.0 |
Fertility by Age by Marriage Status in Poquoson
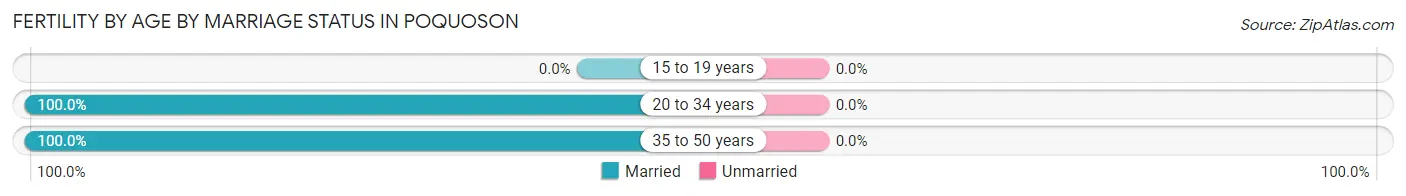
| Age Bracket | Married | Unmarried |
| 15 to 19 years | 0 (0.0%) | 0 (0.0%) |
| 20 to 34 years | 129 (100.0%) | 0 (0.0%) |
| 35 to 50 years | 57 (100.0%) | 0 (0.0%) |
| Total | 186 (100.0%) | 0 (0.0%) |
Fertility by Education in Poquoson
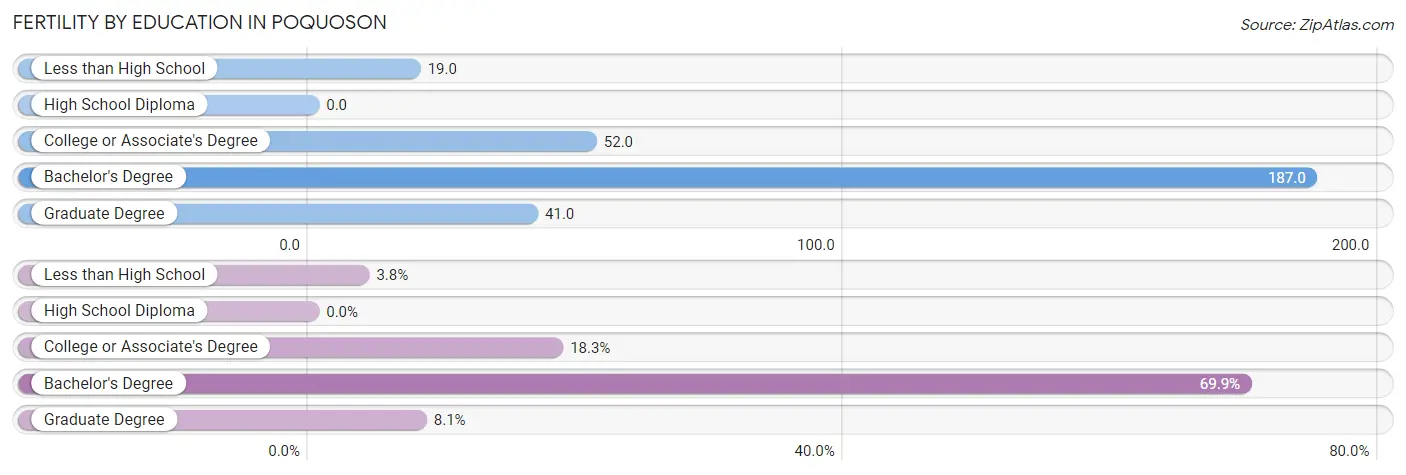
| Educational Attainment | Women with Births | Births / 1,000 Women |
| Less than High School | 7 (3.8%) | 19.0 |
| High School Diploma | 0 (0.0%) | 0.0 |
| College or Associate's Degree | 34 (18.3%) | 52.0 |
| Bachelor's Degree | 130 (69.9%) | 187.0 |
| Graduate Degree | 15 (8.1%) | 41.0 |
| Total | 186 (100.0%) | 71.0 |
Fertility by Education by Marriage Status in Poquoson
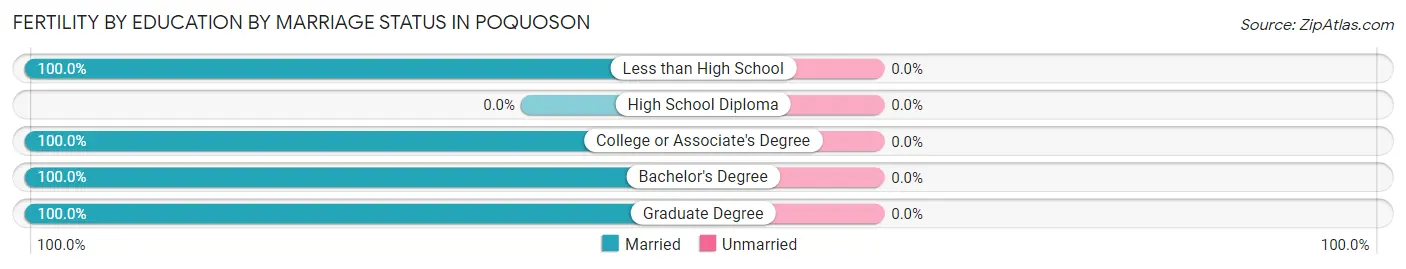
| Educational Attainment | Married | Unmarried |
| Less than High School | 7 (100.0%) | 0 (0.0%) |
| High School Diploma | 0 (0.0%) | 0 (0.0%) |
| College or Associate's Degree | 34 (100.0%) | 0 (0.0%) |
| Bachelor's Degree | 130 (100.0%) | 0 (0.0%) |
| Graduate Degree | 15 (100.0%) | 0 (0.0%) |
| Total | 186 (100.0%) | 0 (0.0%) |
Employment Characteristics in Poquoson
Employment by Class of Employer in Poquoson
Among the 6,350 employed individuals in Poquoson, private company employees (3,781 | 59.5%), federal government employees (863 | 13.6%), and not-for-profit organizations (613 | 9.7%) make up the most common classes of employment.
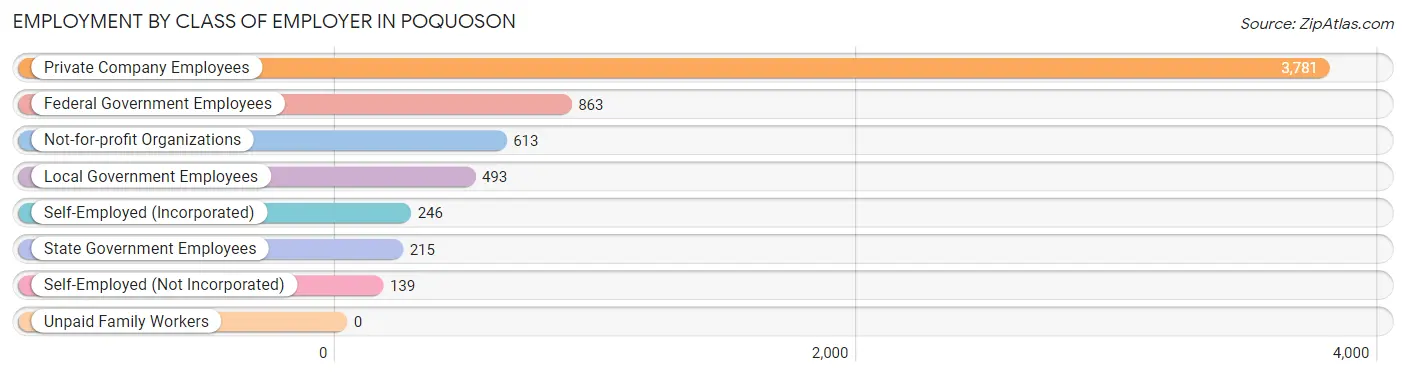
| Employer Class | # Employees | % Employees |
| Private Company Employees | 3,781 | 59.5% |
| Self-Employed (Incorporated) | 246 | 3.9% |
| Self-Employed (Not Incorporated) | 139 | 2.2% |
| Not-for-profit Organizations | 613 | 9.7% |
| Local Government Employees | 493 | 7.8% |
| State Government Employees | 215 | 3.4% |
| Federal Government Employees | 863 | 13.6% |
| Unpaid Family Workers | 0 | 0.0% |
| Total | 6,350 | 100.0% |
Employment Status by Age in Poquoson
According to the labor force statistics for Poquoson, out of the total population over 16 years of age (10,127), 64.5% or 6,532 individuals are in the labor force, with 1.4% or 91 of them unemployed. The age group with the highest labor force participation rate is 30 to 34 years, with 93.6% or 618 individuals in the labor force. Within the labor force, the 16 to 19 years age range has the highest percentage of unemployed individuals, with 10.1% or 36 of them being unemployed.
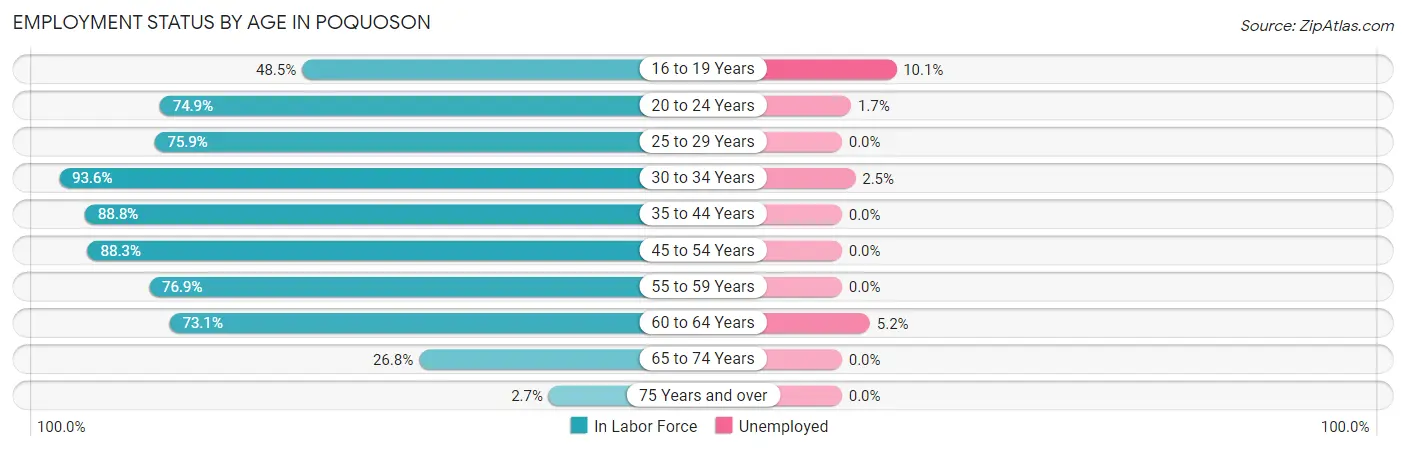
| Age Bracket | In Labor Force | Unemployed |
| 16 to 19 Years | 356 (48.5%) | 36 (10.1%) |
| 20 to 24 Years | 484 (74.9%) | 8 (1.7%) |
| 25 to 29 Years | 434 (75.9%) | 0 (0.0%) |
| 30 to 34 Years | 618 (93.6%) | 15 (2.5%) |
| 35 to 44 Years | 1,462 (88.8%) | 0 (0.0%) |
| 45 to 54 Years | 1,485 (88.3%) | 0 (0.0%) |
| 55 to 59 Years | 701 (76.9%) | 0 (0.0%) |
| 60 to 64 Years | 601 (73.1%) | 31 (5.2%) |
| 65 to 74 Years | 357 (26.8%) | 0 (0.0%) |
| 75 Years and over | 30 (2.7%) | 0 (0.0%) |
| Total | 6,532 (64.5%) | 91 (1.4%) |
Employment Status by Educational Attainment in Poquoson
According to labor force statistics for Poquoson, 84.3% of individuals (5,305) out of the total population between 25 and 64 years of age (6,293) are in the labor force, with 0.9% or 48 of them being unemployed. The group with the highest labor force participation rate are those with the educational attainment of bachelor's degree or higher, with 87.9% or 2,328 individuals in the labor force. Within the labor force, individuals with high school diploma education have the highest percentage of unemployment, with 1.7% or 20 of them being unemployed.
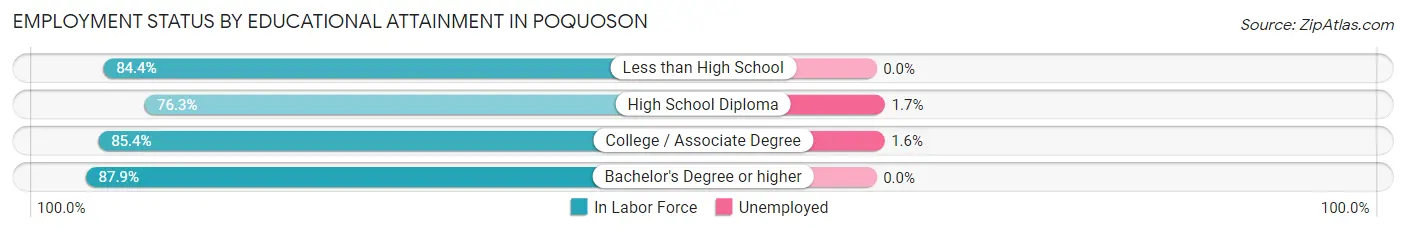
| Educational Attainment | In Labor Force | Unemployed |
| Less than High School | 114 (84.4%) | 0 (0.0%) |
| High School Diploma | 1,162 (76.3%) | 26 (1.7%) |
| College / Associate Degree | 1,696 (85.4%) | 32 (1.6%) |
| Bachelor's Degree or higher | 2,328 (87.9%) | 0 (0.0%) |
| Total | 5,305 (84.3%) | 57 (0.9%) |
Employment Occupations by Sex in Poquoson
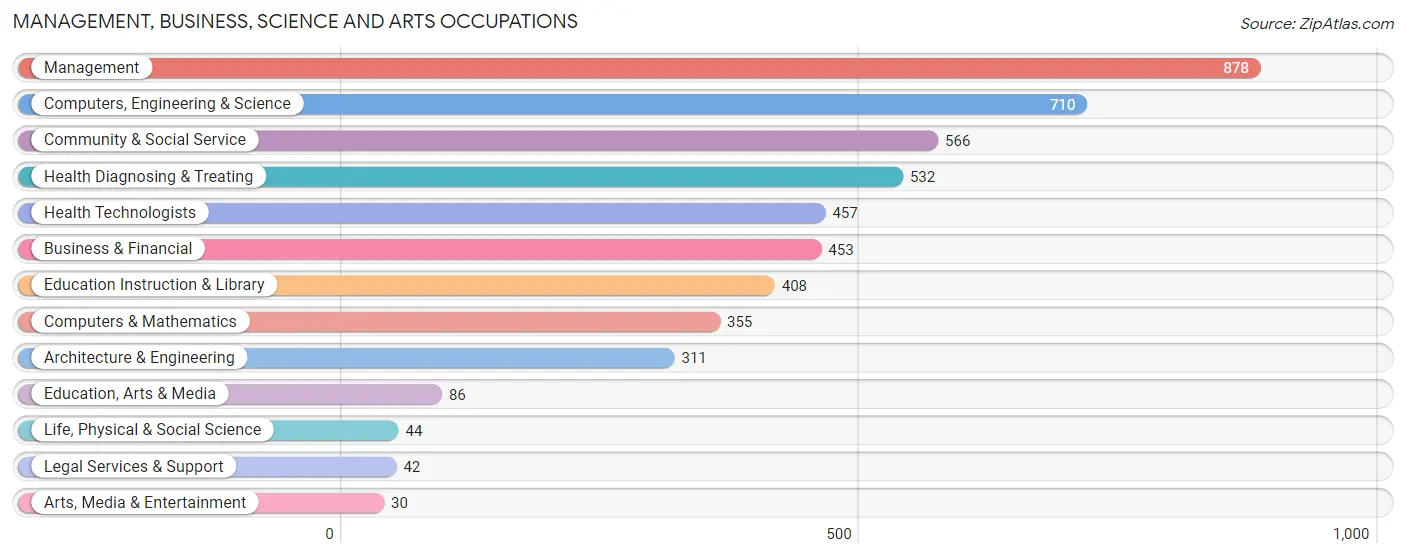
Management, Business, Science and Arts Occupations
The most common Management, Business, Science and Arts occupations in Poquoson are Management (878 | 14.1%), Computers, Engineering & Science (710 | 11.4%), Community & Social Service (566 | 9.1%), Health Diagnosing & Treating (532 | 8.5%), and Health Technologists (457 | 7.3%).
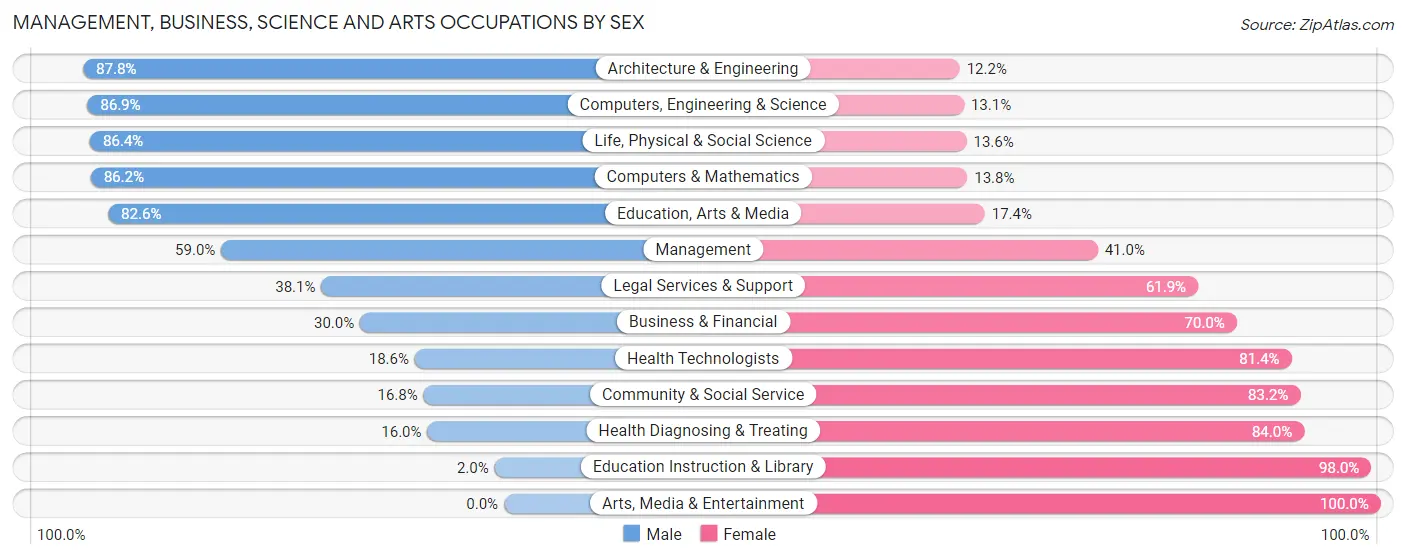
Management, Business, Science and Arts Occupations by Sex
Within the Management, Business, Science and Arts occupations in Poquoson, the most male-oriented occupations are Architecture & Engineering (87.8%), Computers, Engineering & Science (86.9%), and Life, Physical & Social Science (86.4%), while the most female-oriented occupations are Arts, Media & Entertainment (100.0%), Education Instruction & Library (98.0%), and Health Diagnosing & Treating (84.0%).
| Occupation | Male | Female |
| Management | 518 (59.0%) | 360 (41.0%) |
| Business & Financial | 136 (30.0%) | 317 (70.0%) |
| Computers, Engineering & Science | 617 (86.9%) | 93 (13.1%) |
| Computers & Mathematics | 306 (86.2%) | 49 (13.8%) |
| Architecture & Engineering | 273 (87.8%) | 38 (12.2%) |
| Life, Physical & Social Science | 38 (86.4%) | 6 (13.6%) |
| Community & Social Service | 95 (16.8%) | 471 (83.2%) |
| Education, Arts & Media | 71 (82.6%) | 15 (17.4%) |
| Legal Services & Support | 16 (38.1%) | 26 (61.9%) |
| Education Instruction & Library | 8 (2.0%) | 400 (98.0%) |
| Arts, Media & Entertainment | 0 (0.0%) | 30 (100.0%) |
| Health Diagnosing & Treating | 85 (16.0%) | 447 (84.0%) |
| Health Technologists | 85 (18.6%) | 372 (81.4%) |
| Total (Category) | 1,451 (46.2%) | 1,688 (53.8%) |
| Total (Overall) | 3,360 (53.8%) | 2,881 (46.2%) |
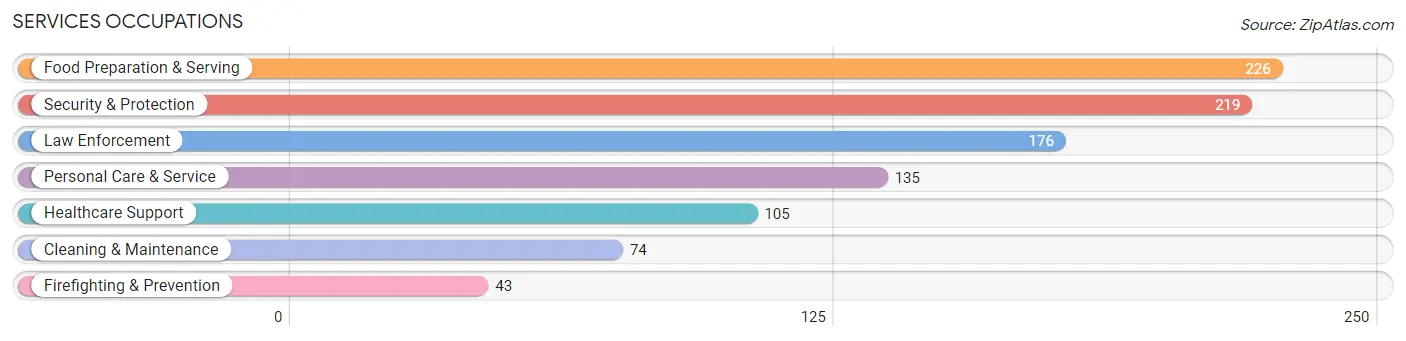
Services Occupations
The most common Services occupations in Poquoson are Food Preparation & Serving (226 | 3.6%), Security & Protection (219 | 3.5%), Law Enforcement (176 | 2.8%), Personal Care & Service (135 | 2.2%), and Healthcare Support (105 | 1.7%).
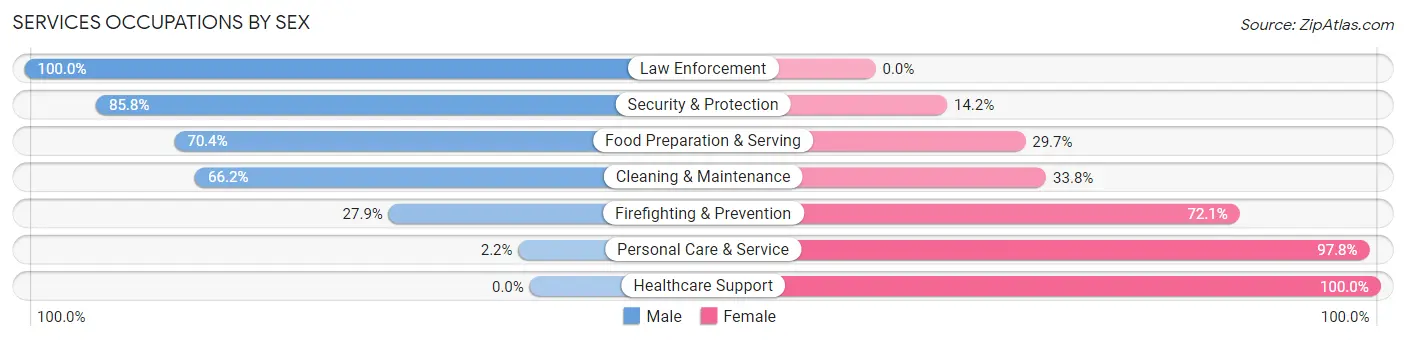
Services Occupations by Sex
Within the Services occupations in Poquoson, the most male-oriented occupations are Law Enforcement (100.0%), Security & Protection (85.8%), and Food Preparation & Serving (70.4%), while the most female-oriented occupations are Healthcare Support (100.0%), Personal Care & Service (97.8%), and Firefighting & Prevention (72.1%).
| Occupation | Male | Female |
| Healthcare Support | 0 (0.0%) | 105 (100.0%) |
| Security & Protection | 188 (85.8%) | 31 (14.2%) |
| Firefighting & Prevention | 12 (27.9%) | 31 (72.1%) |
| Law Enforcement | 176 (100.0%) | 0 (0.0%) |
| Food Preparation & Serving | 159 (70.4%) | 67 (29.6%) |
| Cleaning & Maintenance | 49 (66.2%) | 25 (33.8%) |
| Personal Care & Service | 3 (2.2%) | 132 (97.8%) |
| Total (Category) | 399 (52.6%) | 360 (47.4%) |
| Total (Overall) | 3,360 (53.8%) | 2,881 (46.2%) |
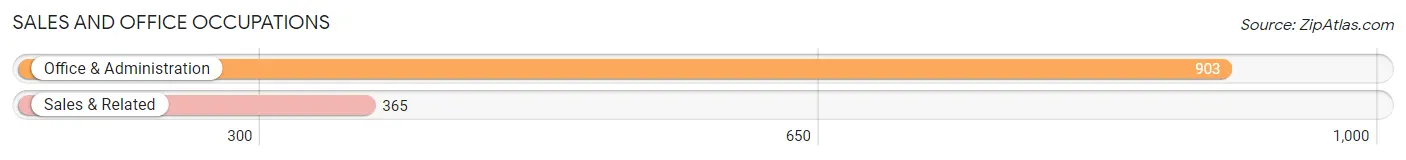
Sales and Office Occupations
The most common Sales and Office occupations in Poquoson are Office & Administration (903 | 14.5%), and Sales & Related (365 | 5.9%).
Sales and Office Occupations by Sex
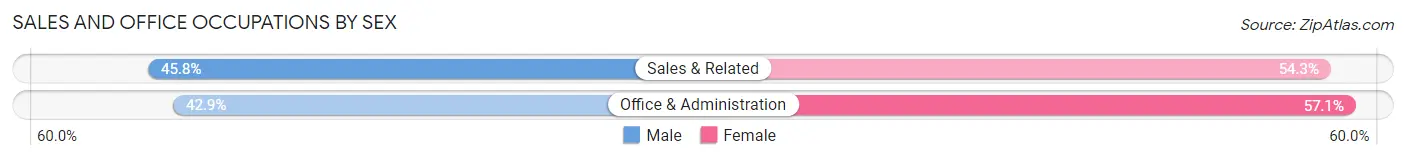
| Occupation | Male | Female |
| Sales & Related | 167 (45.8%) | 198 (54.2%) |
| Office & Administration | 387 (42.9%) | 516 (57.1%) |
| Total (Category) | 554 (43.7%) | 714 (56.3%) |
| Total (Overall) | 3,360 (53.8%) | 2,881 (46.2%) |
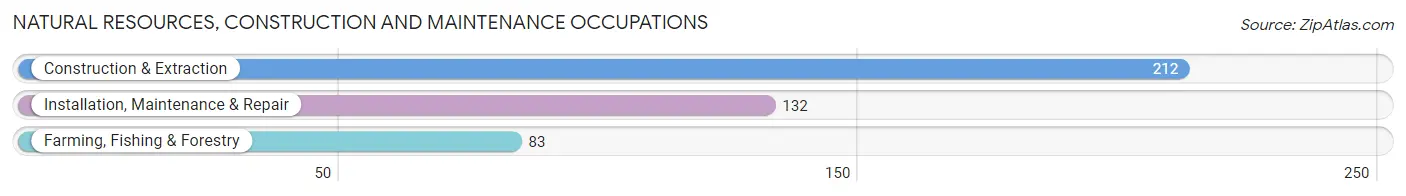
Natural Resources, Construction and Maintenance Occupations
The most common Natural Resources, Construction and Maintenance occupations in Poquoson are Construction & Extraction (212 | 3.4%), Installation, Maintenance & Repair (132 | 2.1%), and Farming, Fishing & Forestry (83 | 1.3%).
Natural Resources, Construction and Maintenance Occupations by Sex
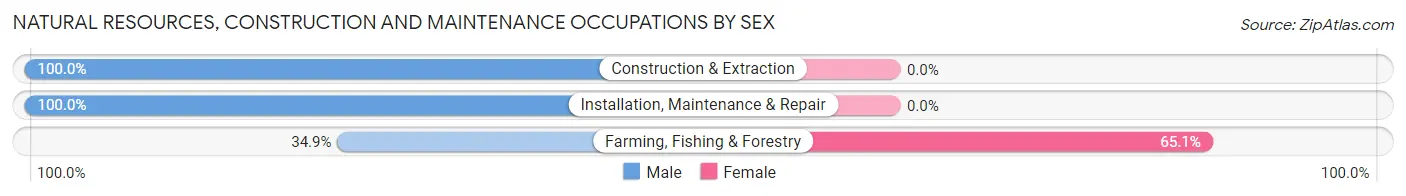
| Occupation | Male | Female |
| Farming, Fishing & Forestry | 29 (34.9%) | 54 (65.1%) |
| Construction & Extraction | 212 (100.0%) | 0 (0.0%) |
| Installation, Maintenance & Repair | 132 (100.0%) | 0 (0.0%) |
| Total (Category) | 373 (87.4%) | 54 (12.7%) |
| Total (Overall) | 3,360 (53.8%) | 2,881 (46.2%) |
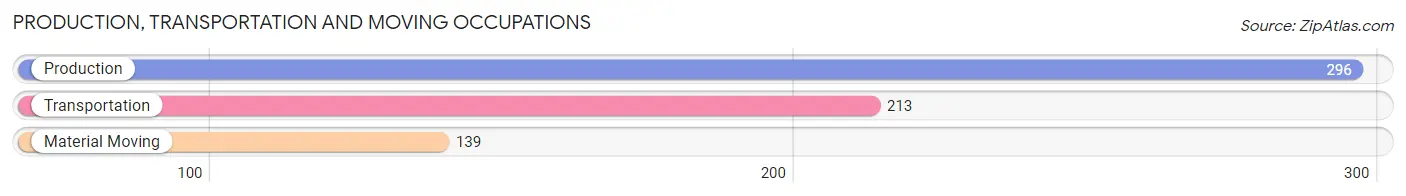
Production, Transportation and Moving Occupations
The most common Production, Transportation and Moving occupations in Poquoson are Production (296 | 4.7%), Transportation (213 | 3.4%), and Material Moving (139 | 2.2%).
Production, Transportation and Moving Occupations by Sex
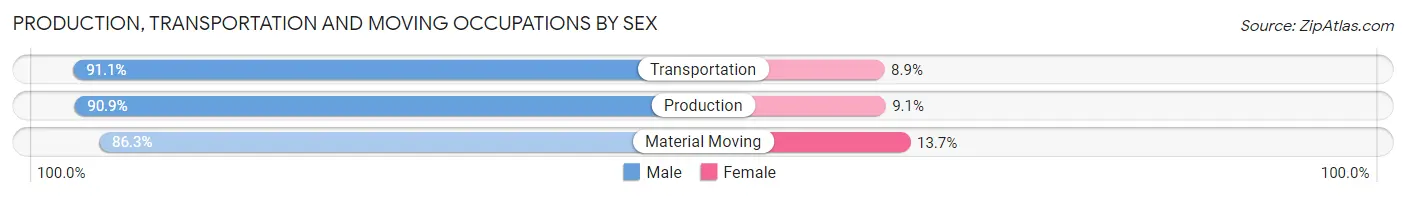
| Occupation | Male | Female |
| Production | 269 (90.9%) | 27 (9.1%) |
| Transportation | 194 (91.1%) | 19 (8.9%) |
| Material Moving | 120 (86.3%) | 19 (13.7%) |
| Total (Category) | 583 (90.0%) | 65 (10.0%) |
| Total (Overall) | 3,360 (53.8%) | 2,881 (46.2%) |
Employment Industries by Sex in Poquoson
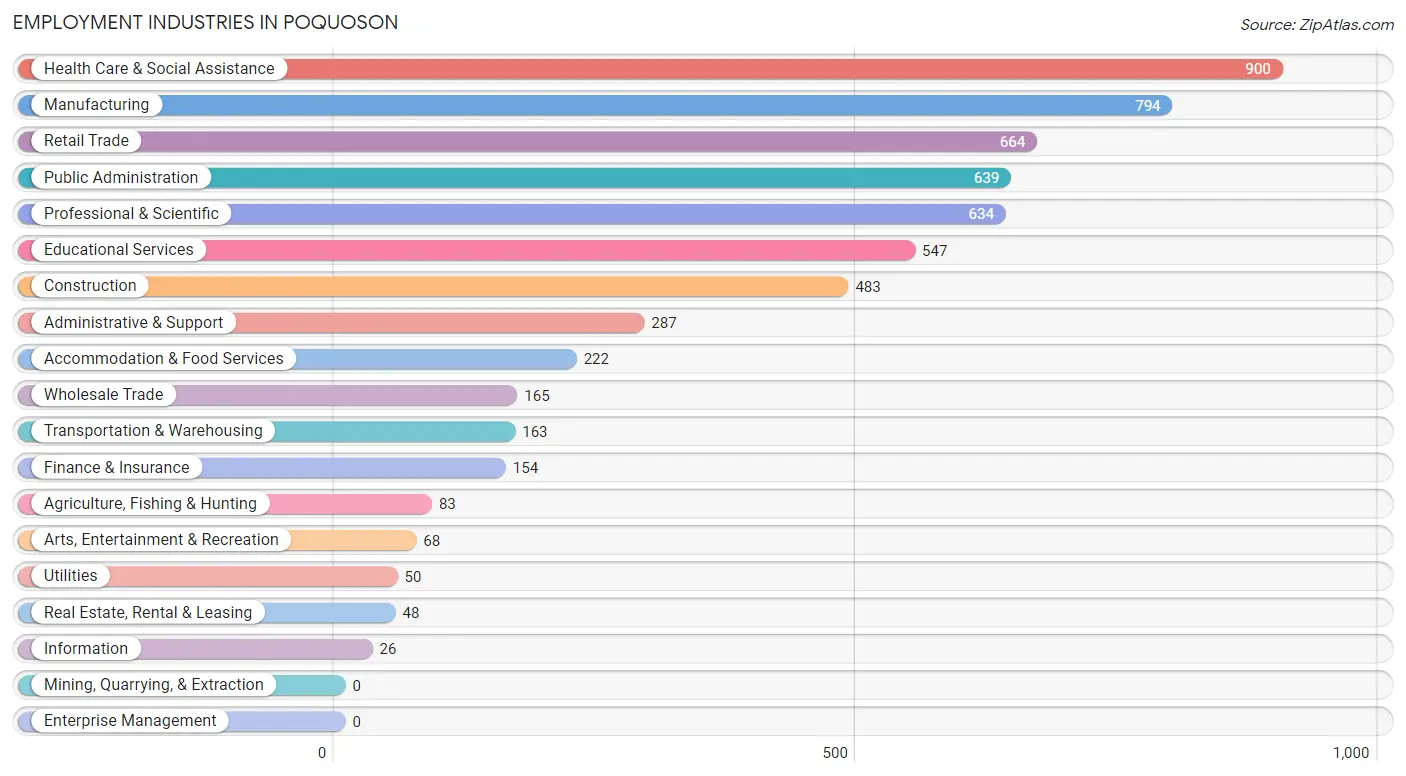
Employment Industries in Poquoson
The major employment industries in Poquoson include Health Care & Social Assistance (900 | 14.4%), Manufacturing (794 | 12.7%), Retail Trade (664 | 10.6%), Public Administration (639 | 10.2%), and Professional & Scientific (634 | 10.2%).
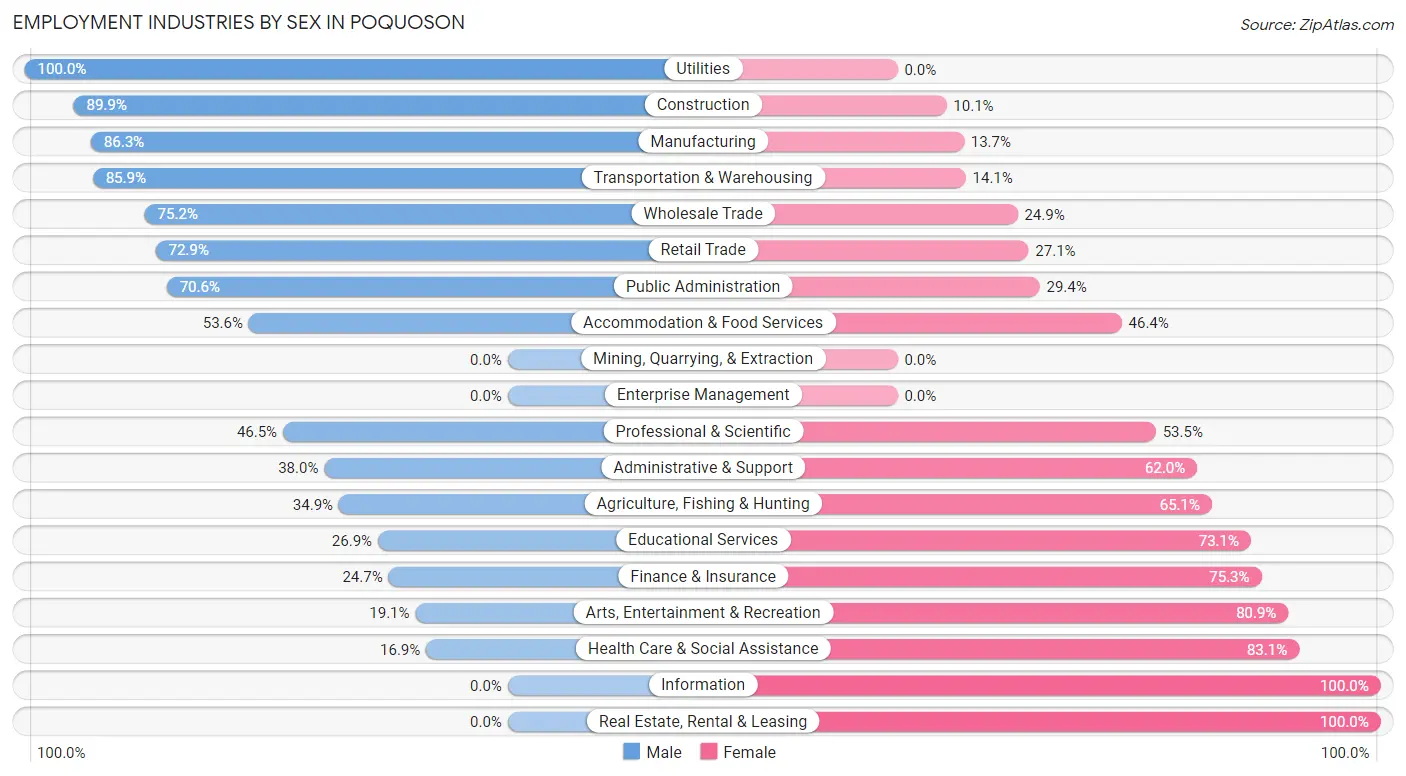
Employment Industries by Sex in Poquoson
The Poquoson industries that see more men than women are Utilities (100.0%), Construction (89.9%), and Manufacturing (86.3%), whereas the industries that tend to have a higher number of women are Information (100.0%), Real Estate, Rental & Leasing (100.0%), and Health Care & Social Assistance (83.1%).
| Industry | Male | Female |
| Agriculture, Fishing & Hunting | 29 (34.9%) | 54 (65.1%) |
| Mining, Quarrying, & Extraction | 0 (0.0%) | 0 (0.0%) |
| Construction | 434 (89.9%) | 49 (10.1%) |
| Manufacturing | 685 (86.3%) | 109 (13.7%) |
| Wholesale Trade | 124 (75.1%) | 41 (24.8%) |
| Retail Trade | 484 (72.9%) | 180 (27.1%) |
| Transportation & Warehousing | 140 (85.9%) | 23 (14.1%) |
| Utilities | 50 (100.0%) | 0 (0.0%) |
| Information | 0 (0.0%) | 26 (100.0%) |
| Finance & Insurance | 38 (24.7%) | 116 (75.3%) |
| Real Estate, Rental & Leasing | 0 (0.0%) | 48 (100.0%) |
| Professional & Scientific | 295 (46.5%) | 339 (53.5%) |
| Enterprise Management | 0 (0.0%) | 0 (0.0%) |
| Administrative & Support | 109 (38.0%) | 178 (62.0%) |
| Educational Services | 147 (26.9%) | 400 (73.1%) |
| Health Care & Social Assistance | 152 (16.9%) | 748 (83.1%) |
| Arts, Entertainment & Recreation | 13 (19.1%) | 55 (80.9%) |
| Accommodation & Food Services | 119 (53.6%) | 103 (46.4%) |
| Public Administration | 451 (70.6%) | 188 (29.4%) |
| Total | 3,360 (53.8%) | 2,881 (46.2%) |
Education in Poquoson
School Enrollment in Poquoson
The most common levels of schooling among the 3,193 students in Poquoson are high school (871 | 27.3%), elementary school (718 | 22.5%), and middle school (555 | 17.4%).
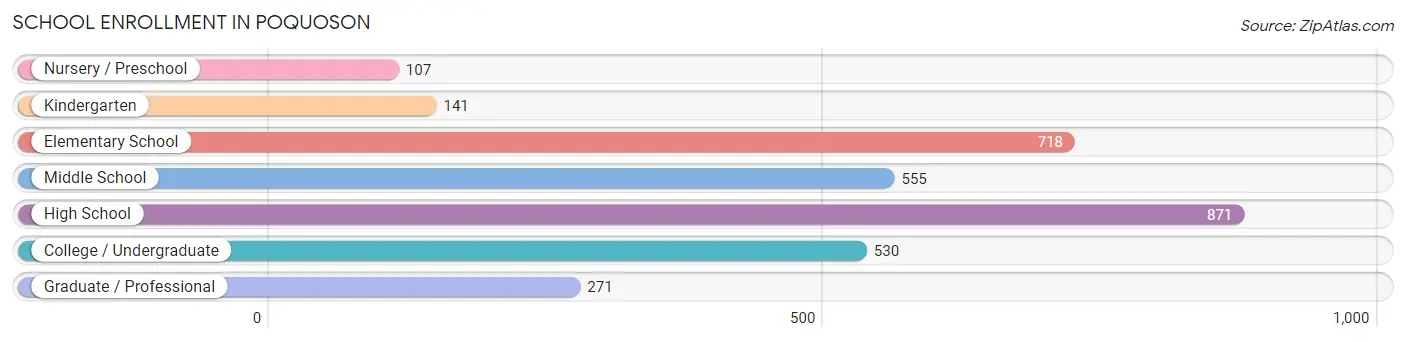
| School Level | # Students | % Students |
| Nursery / Preschool | 107 | 3.4% |
| Kindergarten | 141 | 4.4% |
| Elementary School | 718 | 22.5% |
| Middle School | 555 | 17.4% |
| High School | 871 | 27.3% |
| College / Undergraduate | 530 | 16.6% |
| Graduate / Professional | 271 | 8.5% |
| Total | 3,193 | 100.0% |
School Enrollment by Age by Funding Source in Poquoson
Out of a total of 3,193 students who are enrolled in schools in Poquoson, 307 (9.6%) attend a private institution, while the remaining 2,886 (90.4%) are enrolled in public schools. The age group of 15 to 17 year olds has the highest likelihood of being enrolled in private schools, with 88 (14.4% in the age bracket) enrolled. Conversely, the age group of 18 to 19 year olds has the lowest likelihood of being enrolled in a private school, with 231 (100.0% in the age bracket) attending a public institution.
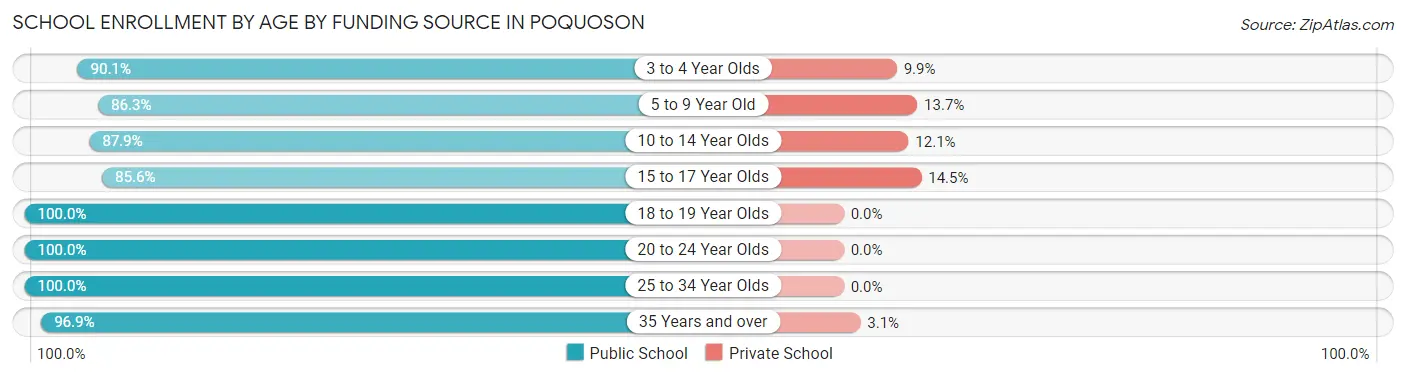
| Age Bracket | Public School | Private School |
| 3 to 4 Year Olds | 73 (90.1%) | 8 (9.9%) |
| 5 to 9 Year Old | 662 (86.3%) | 105 (13.7%) |
| 10 to 14 Year Olds | 722 (87.9%) | 99 (12.1%) |
| 15 to 17 Year Olds | 521 (85.6%) | 88 (14.4%) |
| 18 to 19 Year Olds | 231 (100.0%) | 0 (0.0%) |
| 20 to 24 Year Olds | 132 (100.0%) | 0 (0.0%) |
| 25 to 34 Year Olds | 294 (100.0%) | 0 (0.0%) |
| 35 Years and over | 250 (96.9%) | 8 (3.1%) |
| Total | 2,886 (90.4%) | 307 (9.6%) |
Educational Attainment by Field of Study in Poquoson
Business (753 | 21.4%), education (558 | 15.8%), arts & humanities (334 | 9.5%), science & technology (320 | 9.1%), and engineering (239 | 6.8%) are the most common fields of study among 3,526 individuals in Poquoson who have obtained a bachelor's degree or higher.
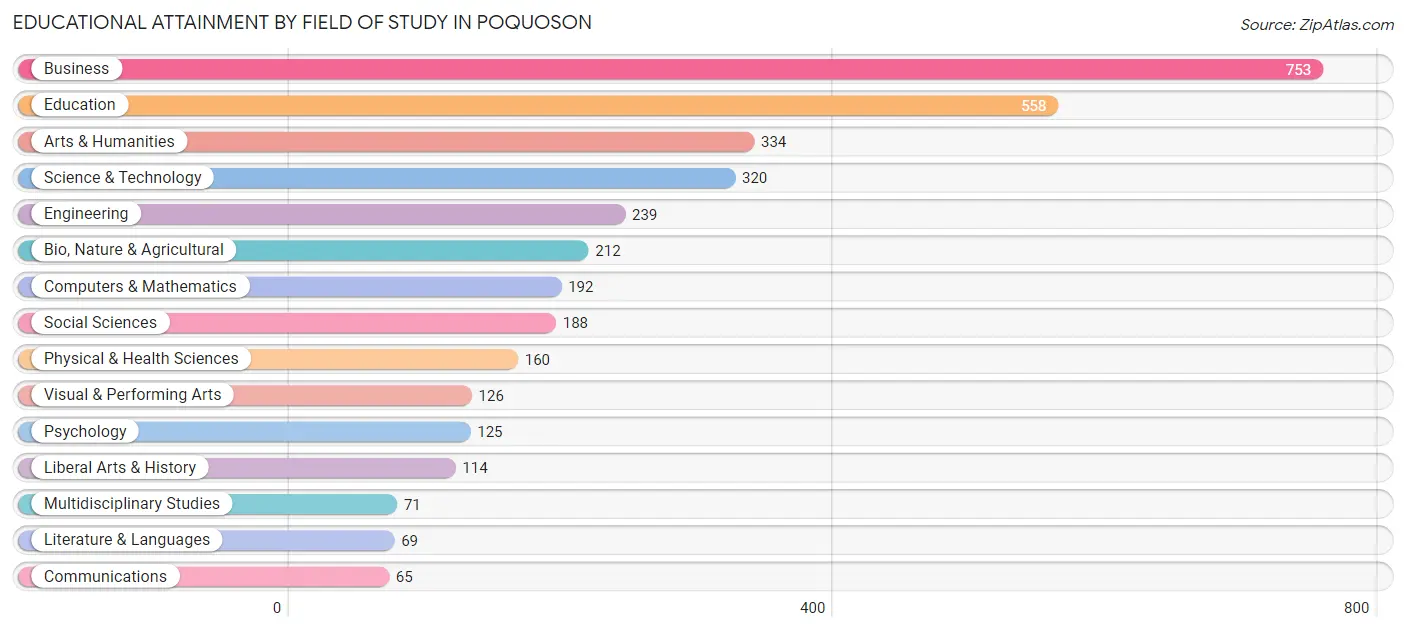
| Field of Study | # Graduates | % Graduates |
| Computers & Mathematics | 192 | 5.4% |
| Bio, Nature & Agricultural | 212 | 6.0% |
| Physical & Health Sciences | 160 | 4.5% |
| Psychology | 125 | 3.5% |
| Social Sciences | 188 | 5.3% |
| Engineering | 239 | 6.8% |
| Multidisciplinary Studies | 71 | 2.0% |
| Science & Technology | 320 | 9.1% |
| Business | 753 | 21.4% |
| Education | 558 | 15.8% |
| Literature & Languages | 69 | 2.0% |
| Liberal Arts & History | 114 | 3.2% |
| Visual & Performing Arts | 126 | 3.6% |
| Communications | 65 | 1.8% |
| Arts & Humanities | 334 | 9.5% |
| Total | 3,526 | 100.0% |
Transportation & Commute in Poquoson
Vehicle Availability by Sex in Poquoson
The most prevalent vehicle ownership categories in Poquoson are males with 2 vehicles (1,450, accounting for 41.6%) and females with 2 vehicles (1,250, making up 50.7%).
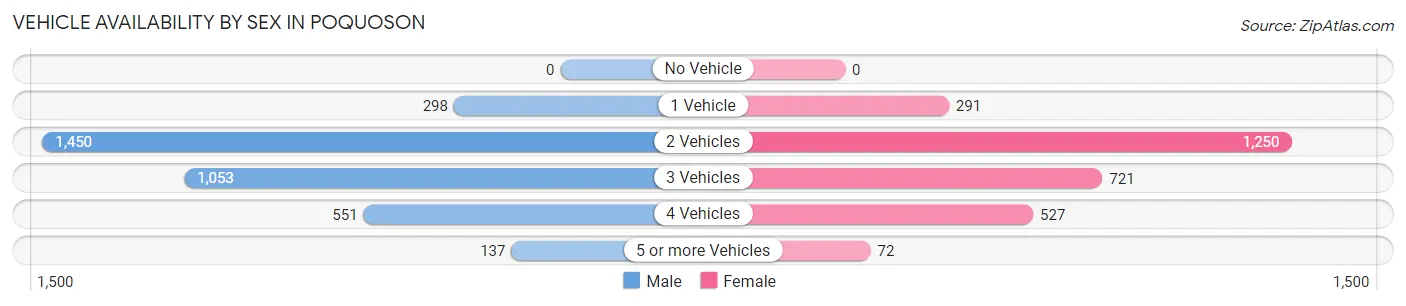
| Vehicles Available | Male | Female |
| No Vehicle | 0 (0.0%) | 0 (0.0%) |
| 1 Vehicle | 298 (8.5%) | 291 (10.2%) |
| 2 Vehicles | 1,450 (41.6%) | 1,250 (43.7%) |
| 3 Vehicles | 1,053 (30.2%) | 721 (25.2%) |
| 4 Vehicles | 551 (15.8%) | 527 (18.4%) |
| 5 or more Vehicles | 137 (3.9%) | 72 (2.5%) |
| Total | 3,489 (100.0%) | 2,861 (100.0%) |
Commute Time in Poquoson
The most frequently occuring commute durations in Poquoson are 20 to 24 minutes (1,429 commuters, 25.1%), 30 to 34 minutes (782 commuters, 13.7%), and 15 to 19 minutes (599 commuters, 10.5%).
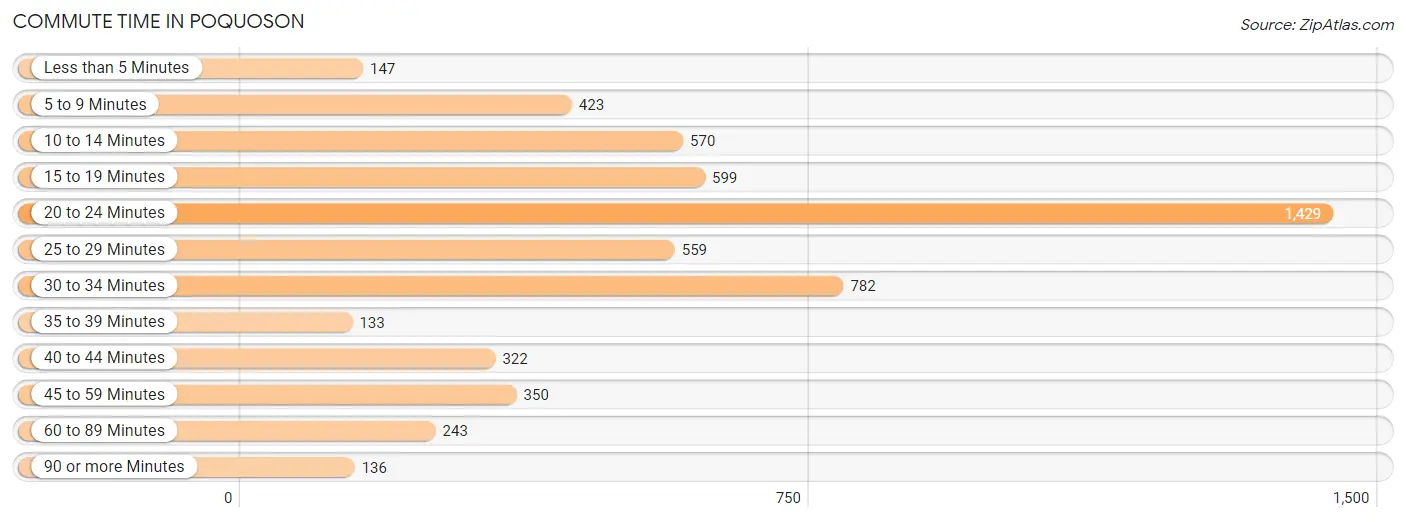
| Commute Time | # Commuters | % Commuters |
| Less than 5 Minutes | 147 | 2.6% |
| 5 to 9 Minutes | 423 | 7.4% |
| 10 to 14 Minutes | 570 | 10.0% |
| 15 to 19 Minutes | 599 | 10.5% |
| 20 to 24 Minutes | 1,429 | 25.1% |
| 25 to 29 Minutes | 559 | 9.8% |
| 30 to 34 Minutes | 782 | 13.7% |
| 35 to 39 Minutes | 133 | 2.3% |
| 40 to 44 Minutes | 322 | 5.7% |
| 45 to 59 Minutes | 350 | 6.1% |
| 60 to 89 Minutes | 243 | 4.3% |
| 90 or more Minutes | 136 | 2.4% |
Commute Time by Sex in Poquoson
The most common commute times in Poquoson are 20 to 24 minutes (703 commuters, 22.0%) for males and 20 to 24 minutes (726 commuters, 29.0%) for females.
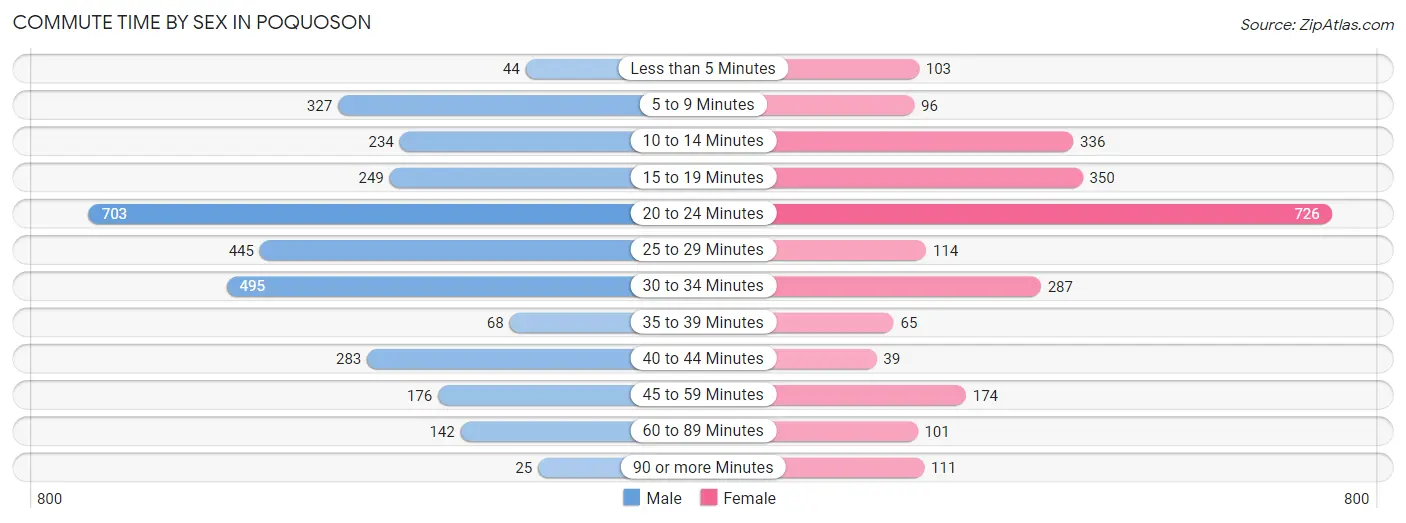
| Commute Time | Male | Female |
| Less than 5 Minutes | 44 (1.4%) | 103 (4.1%) |
| 5 to 9 Minutes | 327 (10.2%) | 96 (3.8%) |
| 10 to 14 Minutes | 234 (7.3%) | 336 (13.4%) |
| 15 to 19 Minutes | 249 (7.8%) | 350 (14.0%) |
| 20 to 24 Minutes | 703 (22.0%) | 726 (29.0%) |
| 25 to 29 Minutes | 445 (14.0%) | 114 (4.6%) |
| 30 to 34 Minutes | 495 (15.5%) | 287 (11.5%) |
| 35 to 39 Minutes | 68 (2.1%) | 65 (2.6%) |
| 40 to 44 Minutes | 283 (8.9%) | 39 (1.6%) |
| 45 to 59 Minutes | 176 (5.5%) | 174 (7.0%) |
| 60 to 89 Minutes | 142 (4.4%) | 101 (4.0%) |
| 90 or more Minutes | 25 (0.8%) | 111 (4.4%) |
Time of Departure to Work by Sex in Poquoson
The most frequent times of departure to work in Poquoson are 6:00 AM to 6:29 AM (570, 17.9%) for males and 7:00 AM to 7:29 AM (559, 22.3%) for females.
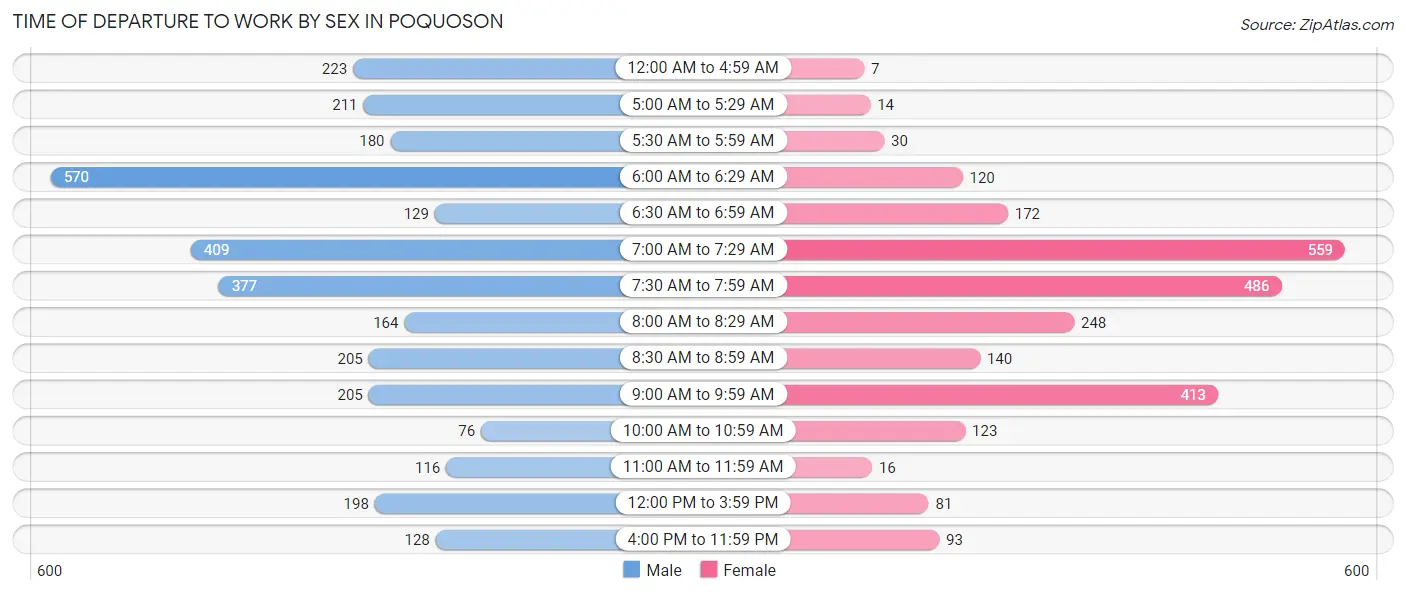
| Time of Departure | Male | Female |
| 12:00 AM to 4:59 AM | 223 (7.0%) | 7 (0.3%) |
| 5:00 AM to 5:29 AM | 211 (6.6%) | 14 (0.6%) |
| 5:30 AM to 5:59 AM | 180 (5.6%) | 30 (1.2%) |
| 6:00 AM to 6:29 AM | 570 (17.9%) | 120 (4.8%) |
| 6:30 AM to 6:59 AM | 129 (4.0%) | 172 (6.9%) |
| 7:00 AM to 7:29 AM | 409 (12.8%) | 559 (22.3%) |
| 7:30 AM to 7:59 AM | 377 (11.8%) | 486 (19.4%) |
| 8:00 AM to 8:29 AM | 164 (5.1%) | 248 (9.9%) |
| 8:30 AM to 8:59 AM | 205 (6.4%) | 140 (5.6%) |
| 9:00 AM to 9:59 AM | 205 (6.4%) | 413 (16.5%) |
| 10:00 AM to 10:59 AM | 76 (2.4%) | 123 (4.9%) |
| 11:00 AM to 11:59 AM | 116 (3.6%) | 16 (0.6%) |
| 12:00 PM to 3:59 PM | 198 (6.2%) | 81 (3.2%) |
| 4:00 PM to 11:59 PM | 128 (4.0%) | 93 (3.7%) |
| Total | 3,191 (100.0%) | 2,502 (100.0%) |
Housing Occupancy in Poquoson
Occupancy by Ownership in Poquoson
Of the total 4,657 dwellings in Poquoson, owner-occupied units account for 3,822 (82.1%), while renter-occupied units make up 835 (17.9%).
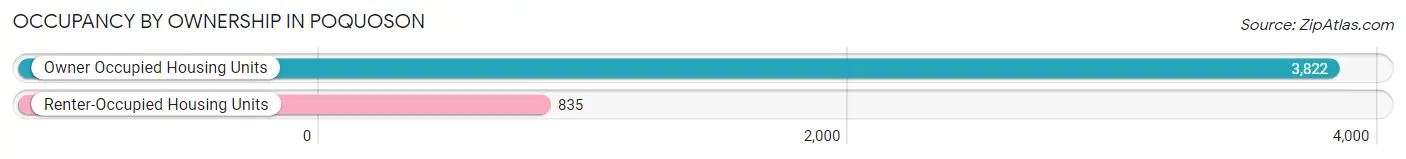
| Occupancy | # Housing Units | % Housing Units |
| Owner Occupied Housing Units | 3,822 | 82.1% |
| Renter-Occupied Housing Units | 835 | 17.9% |
| Total Occupied Housing Units | 4,657 | 100.0% |
Occupancy by Household Size in Poquoson
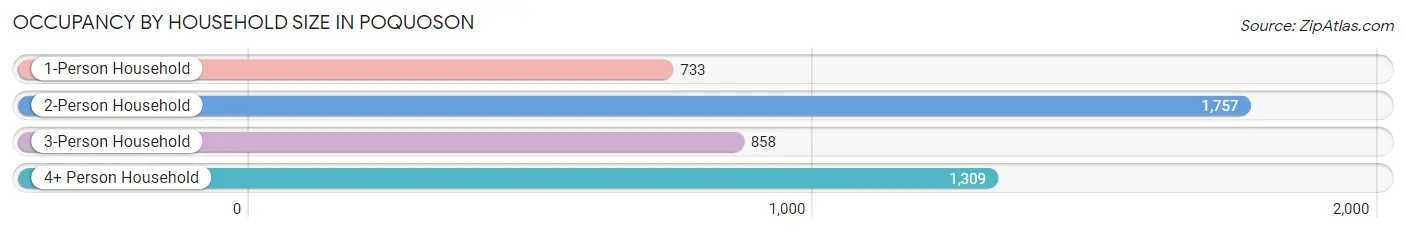
| Household Size | # Housing Units | % Housing Units |
| 1-Person Household | 733 | 15.7% |
| 2-Person Household | 1,757 | 37.7% |
| 3-Person Household | 858 | 18.4% |
| 4+ Person Household | 1,309 | 28.1% |
| Total Housing Units | 4,657 | 100.0% |
Occupancy by Ownership by Household Size in Poquoson
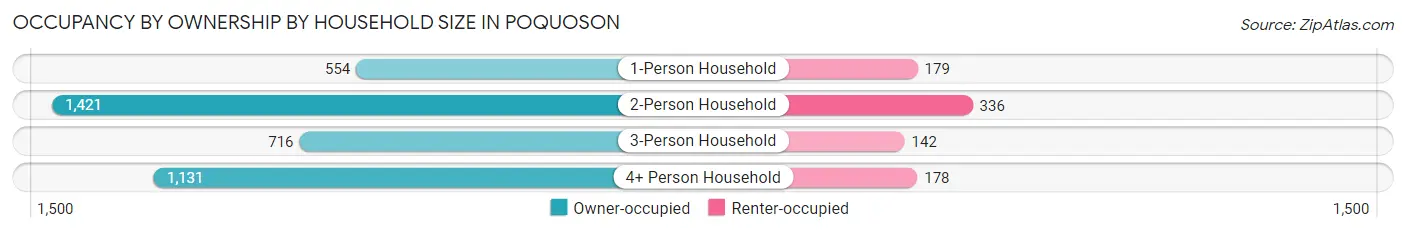
| Household Size | Owner-occupied | Renter-occupied |
| 1-Person Household | 554 (75.6%) | 179 (24.4%) |
| 2-Person Household | 1,421 (80.9%) | 336 (19.1%) |
| 3-Person Household | 716 (83.5%) | 142 (16.6%) |
| 4+ Person Household | 1,131 (86.4%) | 178 (13.6%) |
| Total Housing Units | 3,822 (82.1%) | 835 (17.9%) |
Occupancy by Educational Attainment in Poquoson
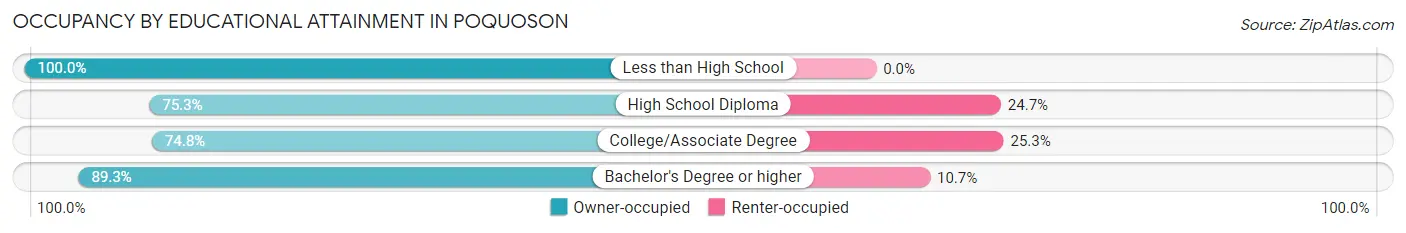
| Household Size | Owner-occupied | Renter-occupied |
| Less than High School | 124 (100.0%) | 0 (0.0%) |
| High School Diploma | 767 (75.3%) | 252 (24.7%) |
| College/Associate Degree | 1,066 (74.8%) | 360 (25.3%) |
| Bachelor's Degree or higher | 1,865 (89.3%) | 223 (10.7%) |
Occupancy by Age of Householder in Poquoson
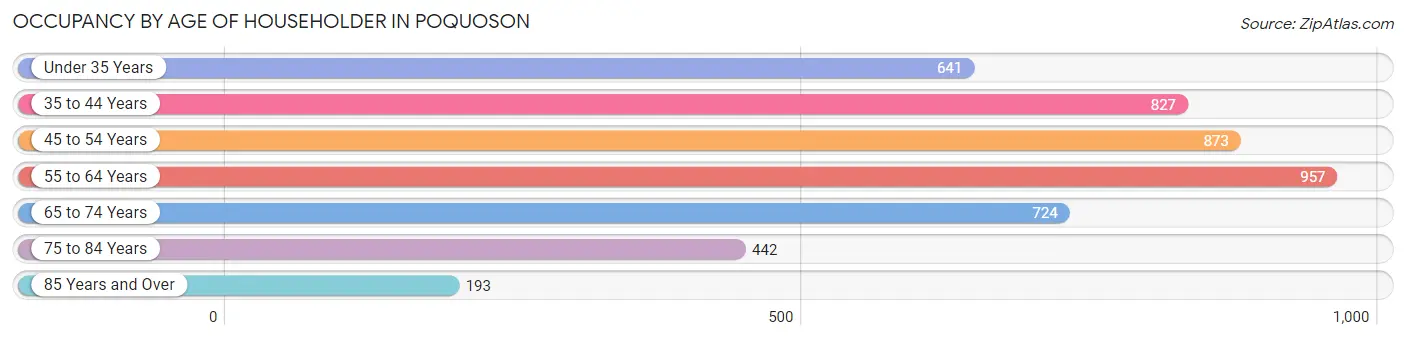
| Age Bracket | # Households | % Households |
| Under 35 Years | 641 | 13.8% |
| 35 to 44 Years | 827 | 17.8% |
| 45 to 54 Years | 873 | 18.8% |
| 55 to 64 Years | 957 | 20.5% |
| 65 to 74 Years | 724 | 15.5% |
| 75 to 84 Years | 442 | 9.5% |
| 85 Years and Over | 193 | 4.1% |
| Total | 4,657 | 100.0% |
Housing Finances in Poquoson
Median Income by Occupancy in Poquoson
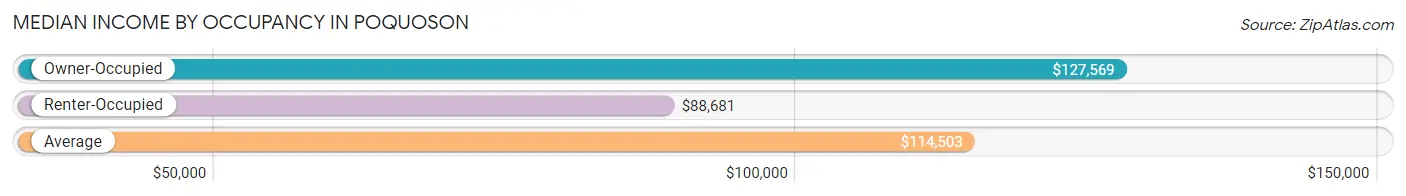
| Occupancy Type | # Households | Median Income |
| Owner-Occupied | 3,822 (82.1%) | $127,569 |
| Renter-Occupied | 835 (17.9%) | $88,681 |
| Average | 4,657 (100.0%) | $114,503 |
Occupancy by Householder Income Bracket in Poquoson
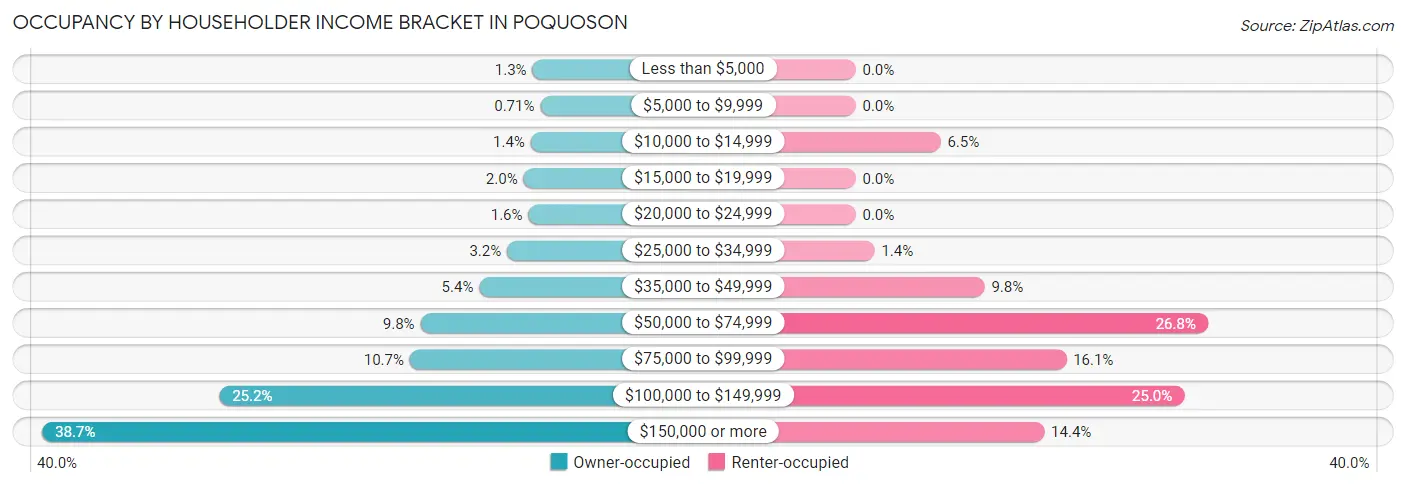
| Income Bracket | Owner-occupied | Renter-occupied |
| Less than $5,000 | 50 (1.3%) | 0 (0.0%) |
| $5,000 to $9,999 | 27 (0.7%) | 0 (0.0%) |
| $10,000 to $14,999 | 55 (1.4%) | 54 (6.5%) |
| $15,000 to $19,999 | 76 (2.0%) | 0 (0.0%) |
| $20,000 to $24,999 | 62 (1.6%) | 0 (0.0%) |
| $25,000 to $34,999 | 124 (3.2%) | 12 (1.4%) |
| $35,000 to $49,999 | 205 (5.4%) | 82 (9.8%) |
| $50,000 to $74,999 | 376 (9.8%) | 224 (26.8%) |
| $75,000 to $99,999 | 407 (10.6%) | 134 (16.1%) |
| $100,000 to $149,999 | 962 (25.2%) | 209 (25.0%) |
| $150,000 or more | 1,478 (38.7%) | 120 (14.4%) |
| Total | 3,822 (100.0%) | 835 (100.0%) |
Monthly Housing Cost Tiers in Poquoson
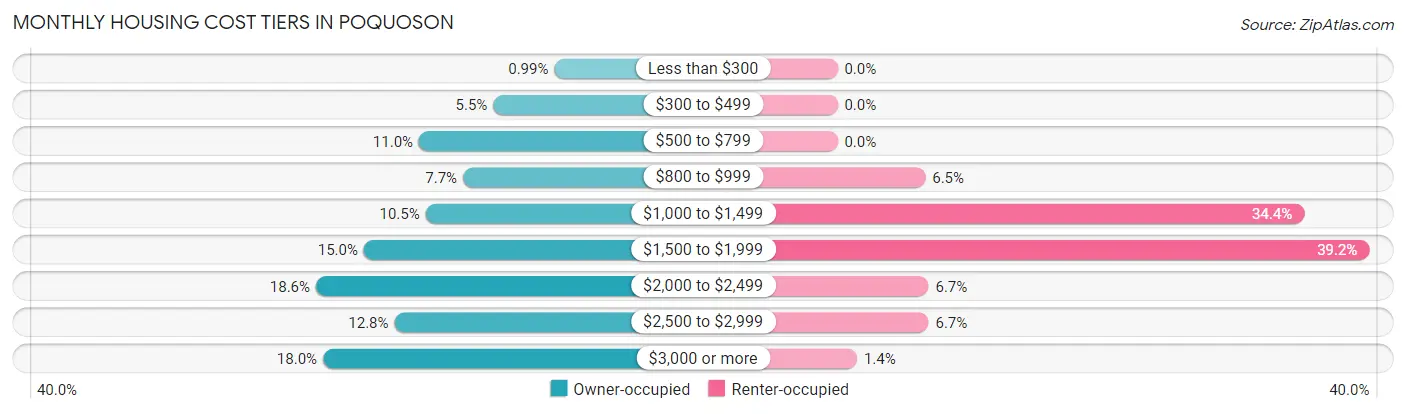
| Monthly Cost | Owner-occupied | Renter-occupied |
| Less than $300 | 38 (1.0%) | 0 (0.0%) |
| $300 to $499 | 210 (5.5%) | 0 (0.0%) |
| $500 to $799 | 419 (11.0%) | 0 (0.0%) |
| $800 to $999 | 295 (7.7%) | 54 (6.5%) |
| $1,000 to $1,499 | 400 (10.5%) | 287 (34.4%) |
| $1,500 to $1,999 | 574 (15.0%) | 327 (39.2%) |
| $2,000 to $2,499 | 709 (18.5%) | 56 (6.7%) |
| $2,500 to $2,999 | 488 (12.8%) | 56 (6.7%) |
| $3,000 or more | 689 (18.0%) | 12 (1.4%) |
| Total | 3,822 (100.0%) | 835 (100.0%) |
Physical Housing Characteristics in Poquoson
Housing Structures in Poquoson
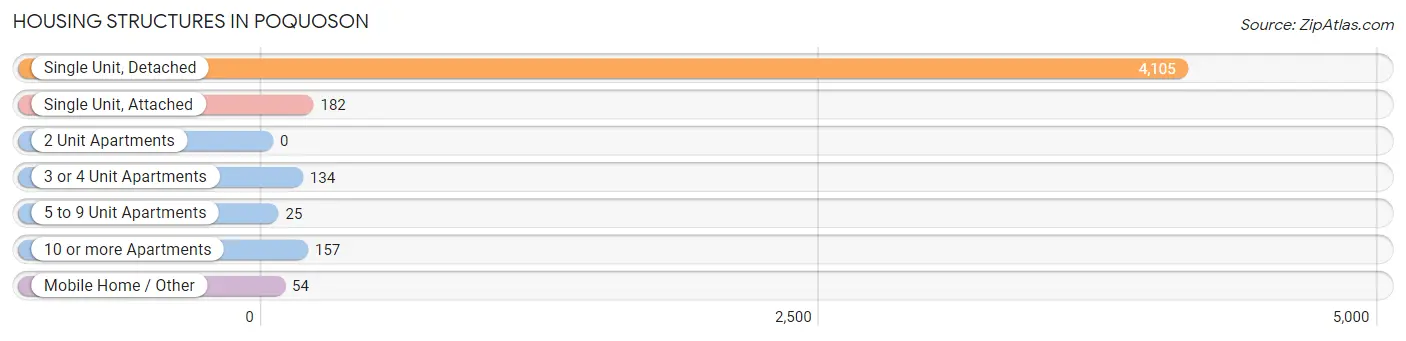
| Structure Type | # Housing Units | % Housing Units |
| Single Unit, Detached | 4,105 | 88.1% |
| Single Unit, Attached | 182 | 3.9% |
| 2 Unit Apartments | 0 | 0.0% |
| 3 or 4 Unit Apartments | 134 | 2.9% |
| 5 to 9 Unit Apartments | 25 | 0.5% |
| 10 or more Apartments | 157 | 3.4% |
| Mobile Home / Other | 54 | 1.2% |
| Total | 4,657 | 100.0% |
Housing Structures by Occupancy in Poquoson
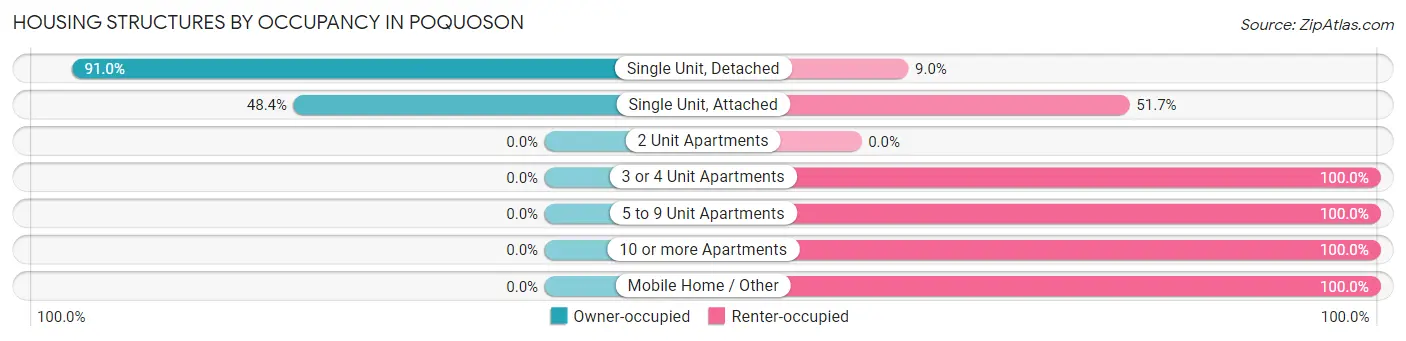
| Structure Type | Owner-occupied | Renter-occupied |
| Single Unit, Detached | 3,734 (91.0%) | 371 (9.0%) |
| Single Unit, Attached | 88 (48.3%) | 94 (51.6%) |
| 2 Unit Apartments | 0 (0.0%) | 0 (0.0%) |
| 3 or 4 Unit Apartments | 0 (0.0%) | 134 (100.0%) |
| 5 to 9 Unit Apartments | 0 (0.0%) | 25 (100.0%) |
| 10 or more Apartments | 0 (0.0%) | 157 (100.0%) |
| Mobile Home / Other | 0 (0.0%) | 54 (100.0%) |
| Total | 3,822 (82.1%) | 835 (17.9%) |
Housing Structures by Number of Rooms in Poquoson
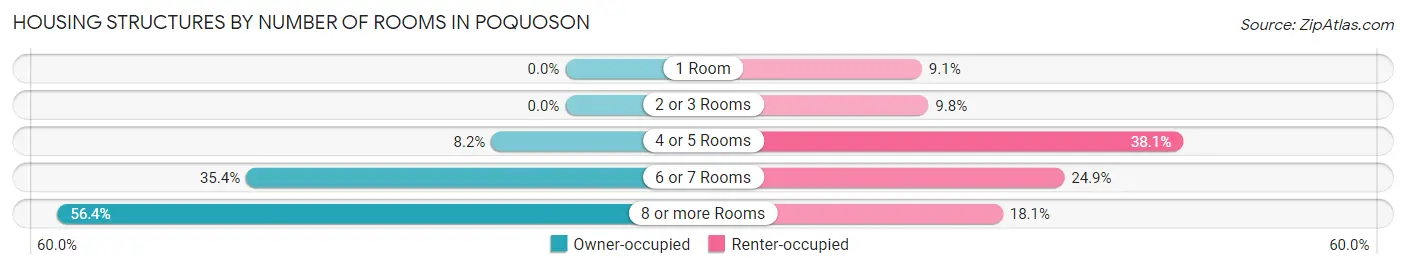
| Number of Rooms | Owner-occupied | Renter-occupied |
| 1 Room | 0 (0.0%) | 76 (9.1%) |
| 2 or 3 Rooms | 0 (0.0%) | 82 (9.8%) |
| 4 or 5 Rooms | 314 (8.2%) | 318 (38.1%) |
| 6 or 7 Rooms | 1,354 (35.4%) | 208 (24.9%) |
| 8 or more Rooms | 2,154 (56.4%) | 151 (18.1%) |
| Total | 3,822 (100.0%) | 835 (100.0%) |
Housing Structure by Heating Type in Poquoson
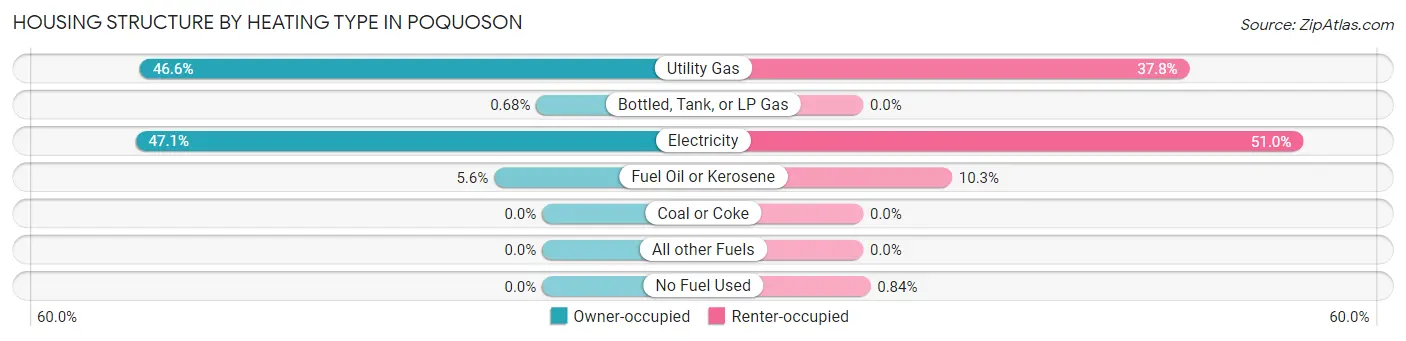
| Heating Type | Owner-occupied | Renter-occupied |
| Utility Gas | 1,782 (46.6%) | 316 (37.8%) |
| Bottled, Tank, or LP Gas | 26 (0.7%) | 0 (0.0%) |
| Electricity | 1,801 (47.1%) | 426 (51.0%) |
| Fuel Oil or Kerosene | 213 (5.6%) | 86 (10.3%) |
| Coal or Coke | 0 (0.0%) | 0 (0.0%) |
| All other Fuels | 0 (0.0%) | 0 (0.0%) |
| No Fuel Used | 0 (0.0%) | 7 (0.8%) |
| Total | 3,822 (100.0%) | 835 (100.0%) |
Household Vehicle Usage in Poquoson
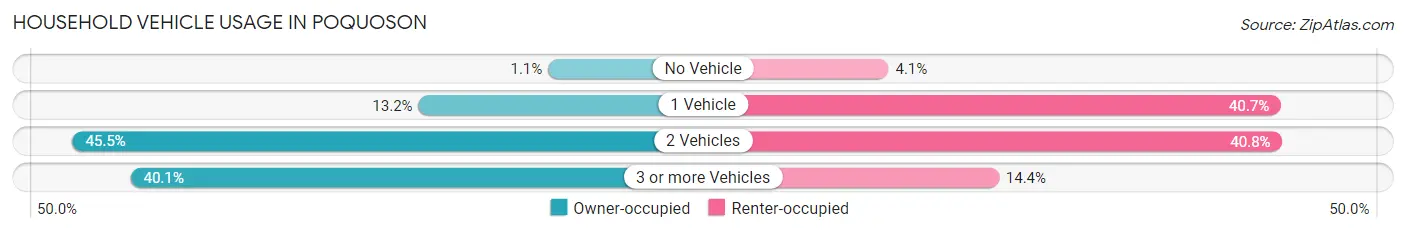
| Vehicles per Household | Owner-occupied | Renter-occupied |
| No Vehicle | 43 (1.1%) | 34 (4.1%) |
| 1 Vehicle | 506 (13.2%) | 340 (40.7%) |
| 2 Vehicles | 1,740 (45.5%) | 341 (40.8%) |
| 3 or more Vehicles | 1,533 (40.1%) | 120 (14.4%) |
| Total | 3,822 (100.0%) | 835 (100.0%) |
Real Estate & Mortgages in Poquoson
Real Estate and Mortgage Overview in Poquoson
| Characteristic | Without Mortgage | With Mortgage |
| Housing Units | 1,142 | 2,680 |
| Median Property Value | $404,800 | $407,500 |
| Median Household Income | $87,083 | $1,223 |
| Monthly Housing Costs | $772 | $681 |
| Real Estate Taxes | $3,753 | $10 |
Property Value by Mortgage Status in Poquoson
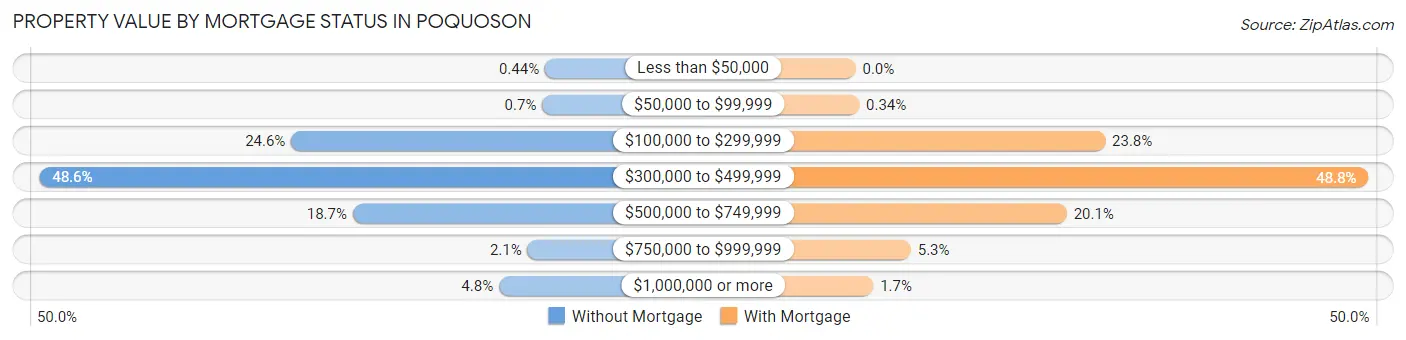
| Property Value | Without Mortgage | With Mortgage |
| Less than $50,000 | 5 (0.4%) | 0 (0.0%) |
| $50,000 to $99,999 | 8 (0.7%) | 9 (0.3%) |
| $100,000 to $299,999 | 281 (24.6%) | 637 (23.8%) |
| $300,000 to $499,999 | 555 (48.6%) | 1,309 (48.8%) |
| $500,000 to $749,999 | 214 (18.7%) | 539 (20.1%) |
| $750,000 to $999,999 | 24 (2.1%) | 141 (5.3%) |
| $1,000,000 or more | 55 (4.8%) | 45 (1.7%) |
| Total | 1,142 (100.0%) | 2,680 (100.0%) |
Household Income by Mortgage Status in Poquoson
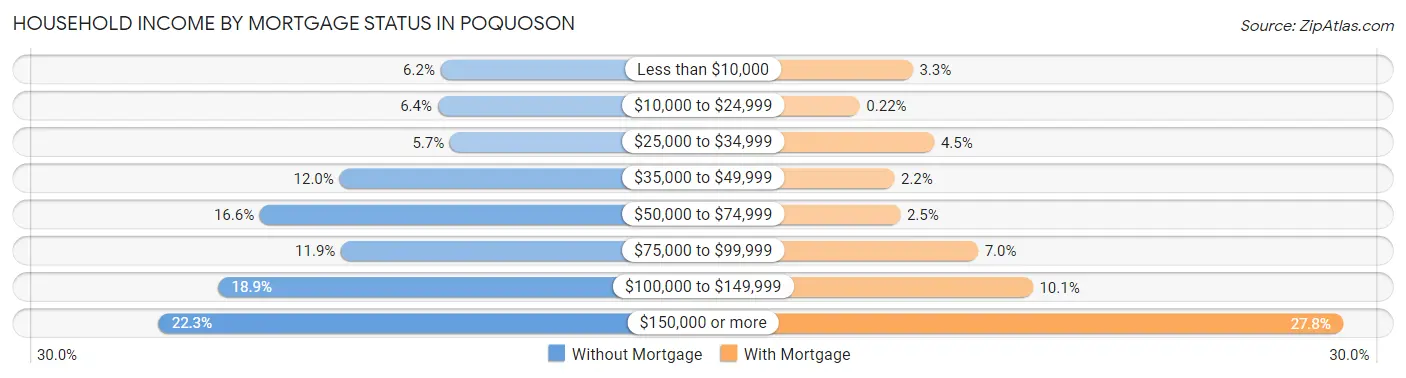
| Household Income | Without Mortgage | With Mortgage |
| Less than $10,000 | 71 (6.2%) | 87 (3.3%) |
| $10,000 to $24,999 | 73 (6.4%) | 6 (0.2%) |
| $25,000 to $34,999 | 65 (5.7%) | 120 (4.5%) |
| $35,000 to $49,999 | 137 (12.0%) | 59 (2.2%) |
| $50,000 to $74,999 | 189 (16.6%) | 68 (2.5%) |
| $75,000 to $99,999 | 136 (11.9%) | 187 (7.0%) |
| $100,000 to $149,999 | 216 (18.9%) | 271 (10.1%) |
| $150,000 or more | 255 (22.3%) | 746 (27.8%) |
| Total | 1,142 (100.0%) | 2,680 (100.0%) |
Property Value to Household Income Ratio in Poquoson
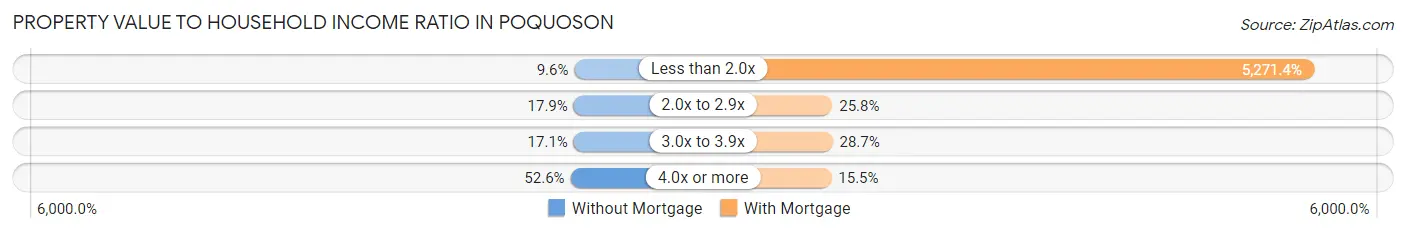
| Value-to-Income Ratio | Without Mortgage | With Mortgage |
| Less than 2.0x | 110 (9.6%) | 141,273 (5,271.4%) |
| 2.0x to 2.9x | 204 (17.9%) | 690 (25.8%) |
| 3.0x to 3.9x | 195 (17.1%) | 769 (28.7%) |
| 4.0x or more | 601 (52.6%) | 416 (15.5%) |
| Total | 1,142 (100.0%) | 2,680 (100.0%) |
Real Estate Taxes by Mortgage Status in Poquoson
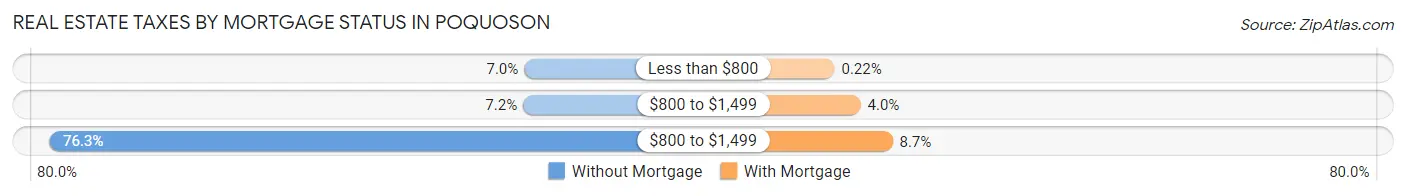
| Property Taxes | Without Mortgage | With Mortgage |
| Less than $800 | 80 (7.0%) | 6 (0.2%) |
| $800 to $1,499 | 82 (7.2%) | 108 (4.0%) |
| $800 to $1,499 | 871 (76.3%) | 233 (8.7%) |
| Total | 1,142 (100.0%) | 2,680 (100.0%) |
Health & Disability in Poquoson
Health Insurance Coverage by Age in Poquoson
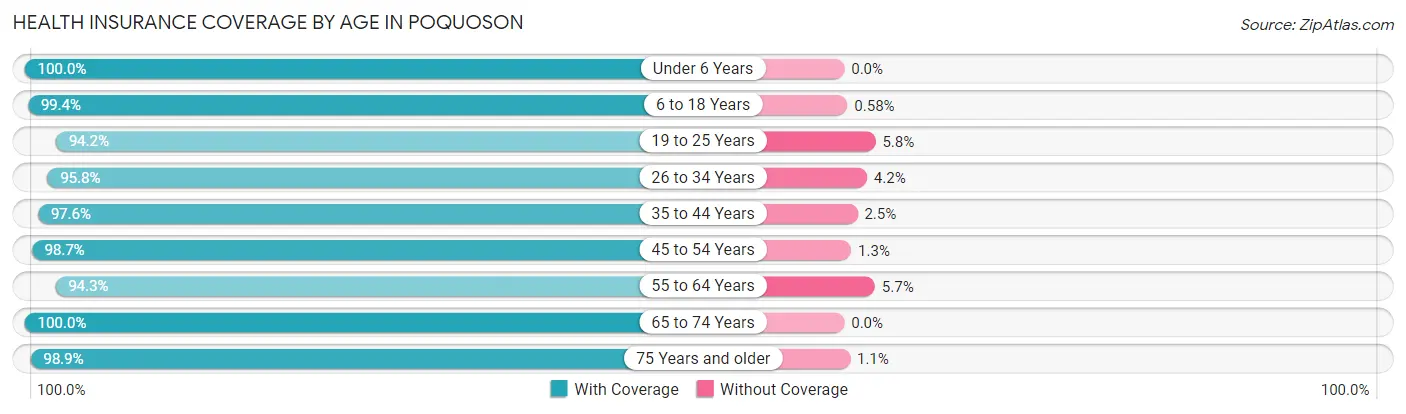
| Age Bracket | With Coverage | Without Coverage |
| Under 6 Years | 719 (100.0%) | 0 (0.0%) |
| 6 to 18 Years | 2,233 (99.4%) | 13 (0.6%) |
| 19 to 25 Years | 778 (94.2%) | 48 (5.8%) |
| 26 to 34 Years | 1,021 (95.8%) | 45 (4.2%) |
| 35 to 44 Years | 1,552 (97.6%) | 39 (2.5%) |
| 45 to 54 Years | 1,625 (98.7%) | 21 (1.3%) |
| 55 to 64 Years | 1,619 (94.3%) | 98 (5.7%) |
| 65 to 74 Years | 1,332 (100.0%) | 0 (0.0%) |
| 75 Years and older | 1,107 (98.9%) | 12 (1.1%) |
| Total | 11,986 (97.8%) | 276 (2.2%) |
Health Insurance Coverage by Citizenship Status in Poquoson
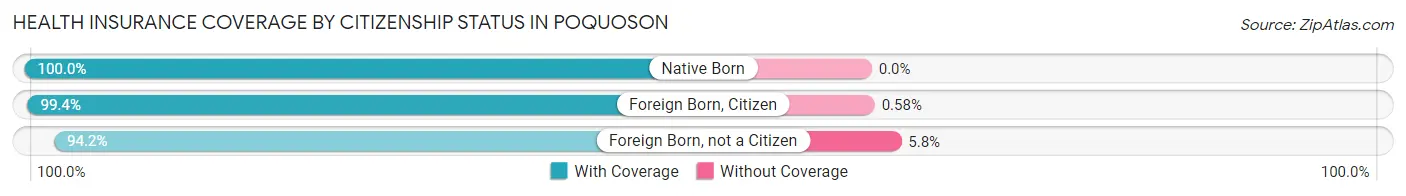
| Citizenship Status | With Coverage | Without Coverage |
| Native Born | 719 (100.0%) | 0 (0.0%) |
| Foreign Born, Citizen | 2,233 (99.4%) | 13 (0.6%) |
| Foreign Born, not a Citizen | 778 (94.2%) | 48 (5.8%) |
Health Insurance Coverage by Household Income in Poquoson
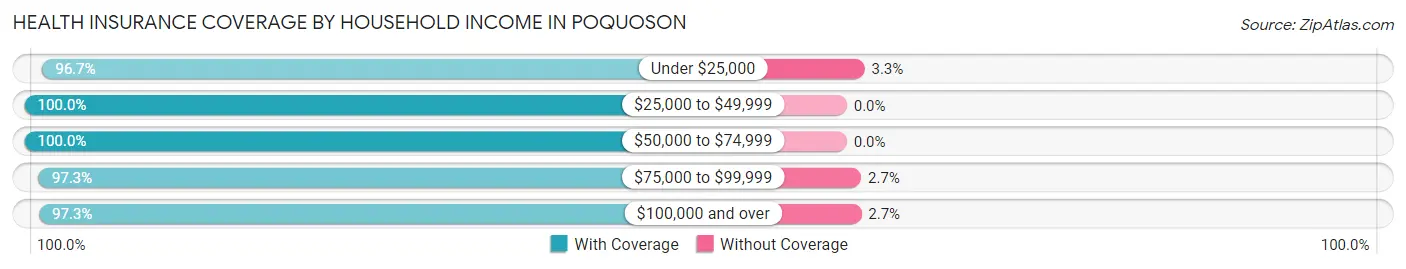
| Household Income | With Coverage | Without Coverage |
| Under $25,000 | 582 (96.7%) | 20 (3.3%) |
| $25,000 to $49,999 | 797 (100.0%) | 0 (0.0%) |
| $50,000 to $74,999 | 1,390 (100.0%) | 0 (0.0%) |
| $75,000 to $99,999 | 1,343 (97.3%) | 37 (2.7%) |
| $100,000 and over | 7,826 (97.3%) | 219 (2.7%) |
Public vs Private Health Insurance Coverage by Age in Poquoson
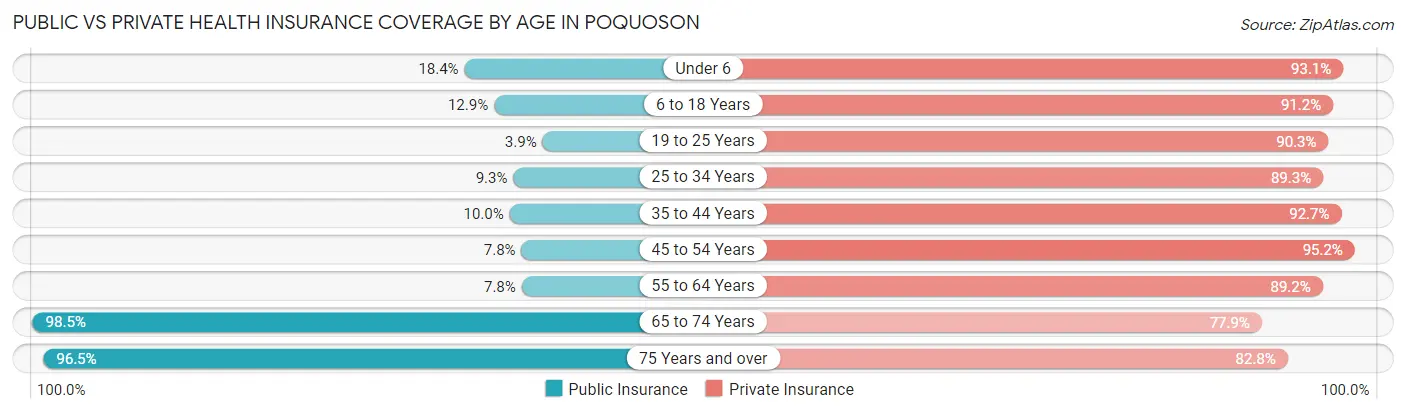
| Age Bracket | Public Insurance | Private Insurance |
| Under 6 | 132 (18.4%) | 669 (93.0%) |
| 6 to 18 Years | 289 (12.9%) | 2,048 (91.2%) |
| 19 to 25 Years | 32 (3.9%) | 746 (90.3%) |
| 25 to 34 Years | 99 (9.3%) | 952 (89.3%) |
| 35 to 44 Years | 159 (10.0%) | 1,475 (92.7%) |
| 45 to 54 Years | 128 (7.8%) | 1,567 (95.2%) |
| 55 to 64 Years | 133 (7.7%) | 1,532 (89.2%) |
| 65 to 74 Years | 1,312 (98.5%) | 1,038 (77.9%) |
| 75 Years and over | 1,080 (96.5%) | 926 (82.8%) |
| Total | 3,364 (27.4%) | 10,953 (89.3%) |
Disability Status by Sex by Age in Poquoson
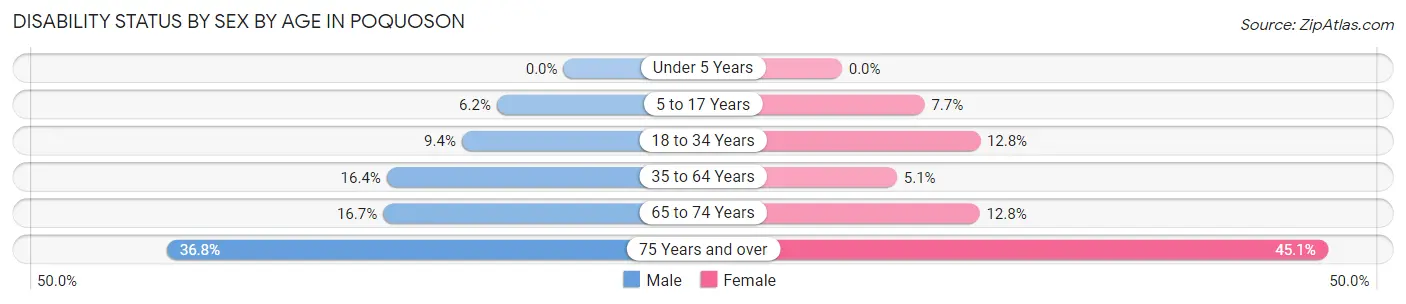
| Age Bracket | Male | Female |
| Under 5 Years | 0 (0.0%) | 0 (0.0%) |
| 5 to 17 Years | 70 (6.2%) | 85 (7.7%) |
| 18 to 34 Years | 95 (9.4%) | 132 (12.8%) |
| 35 to 64 Years | 411 (16.4%) | 125 (5.1%) |
| 65 to 74 Years | 109 (16.7%) | 87 (12.8%) |
| 75 Years and over | 184 (36.8%) | 279 (45.1%) |
Disability Class by Sex by Age in Poquoson
Disability Class: Hearing Difficulty
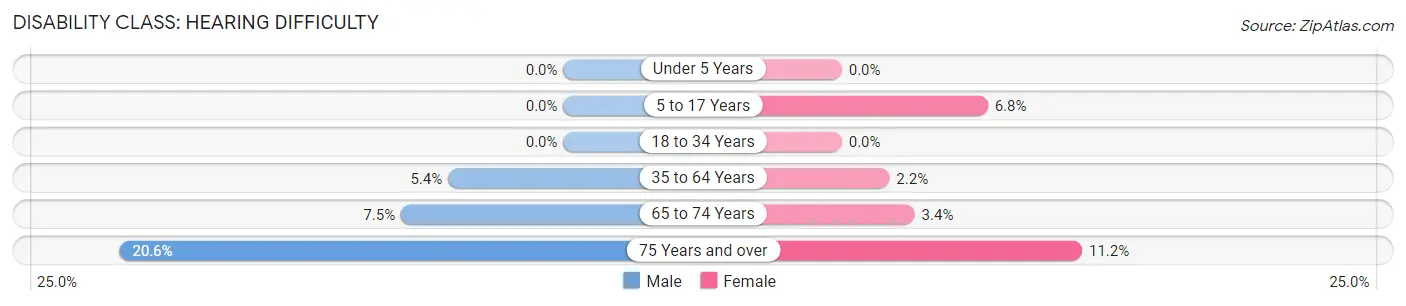
| Age Bracket | Male | Female |
| Under 5 Years | 0 (0.0%) | 0 (0.0%) |
| 5 to 17 Years | 0 (0.0%) | 75 (6.8%) |
| 18 to 34 Years | 0 (0.0%) | 0 (0.0%) |
| 35 to 64 Years | 134 (5.3%) | 54 (2.2%) |
| 65 to 74 Years | 49 (7.5%) | 23 (3.4%) |
| 75 Years and over | 103 (20.6%) | 69 (11.2%) |
Disability Class: Vision Difficulty
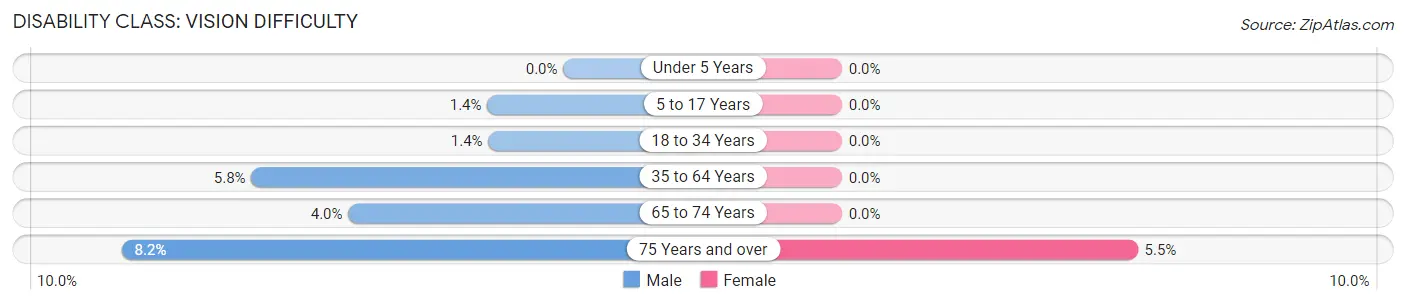
| Age Bracket | Male | Female |
| Under 5 Years | 0 (0.0%) | 0 (0.0%) |
| 5 to 17 Years | 16 (1.4%) | 0 (0.0%) |
| 18 to 34 Years | 14 (1.4%) | 0 (0.0%) |
| 35 to 64 Years | 145 (5.8%) | 0 (0.0%) |
| 65 to 74 Years | 26 (4.0%) | 0 (0.0%) |
| 75 Years and over | 41 (8.2%) | 34 (5.5%) |
Disability Class: Cognitive Difficulty
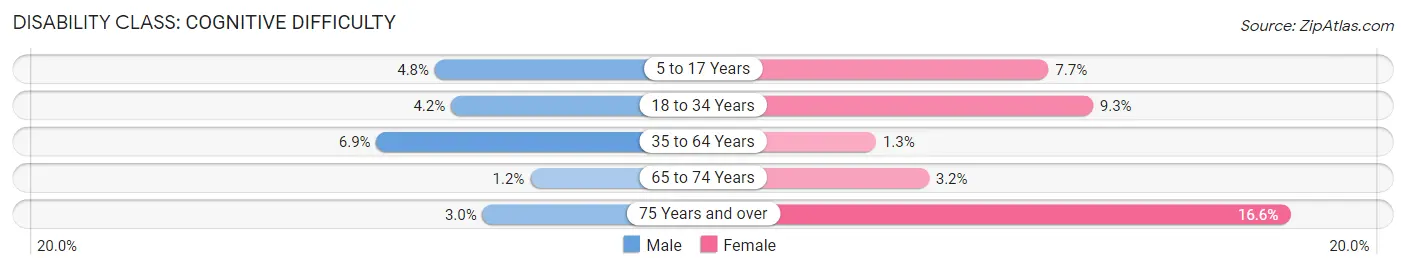
| Age Bracket | Male | Female |
| 5 to 17 Years | 54 (4.8%) | 85 (7.7%) |
| 18 to 34 Years | 42 (4.2%) | 96 (9.3%) |
| 35 to 64 Years | 174 (6.9%) | 31 (1.3%) |
| 65 to 74 Years | 8 (1.2%) | 22 (3.2%) |
| 75 Years and over | 15 (3.0%) | 103 (16.6%) |
Disability Class: Ambulatory Difficulty
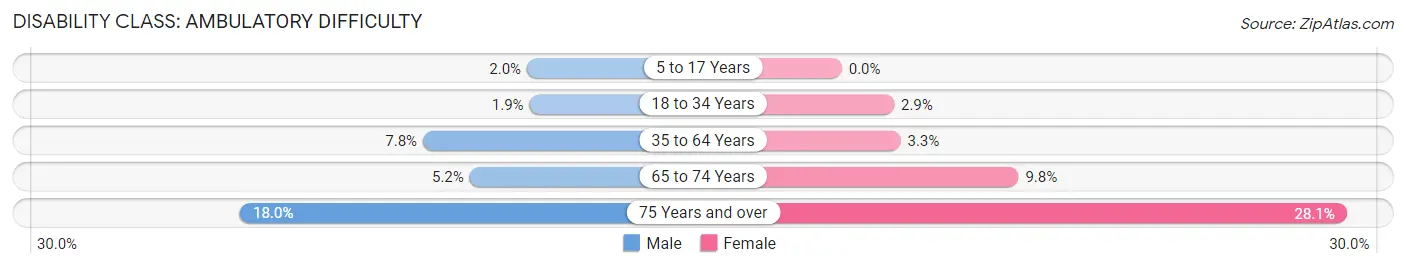
| Age Bracket | Male | Female |
| 5 to 17 Years | 23 (2.0%) | 0 (0.0%) |
| 18 to 34 Years | 19 (1.9%) | 30 (2.9%) |
| 35 to 64 Years | 196 (7.8%) | 80 (3.3%) |
| 65 to 74 Years | 34 (5.2%) | 67 (9.8%) |
| 75 Years and over | 90 (18.0%) | 174 (28.1%) |
Disability Class: Self-Care Difficulty
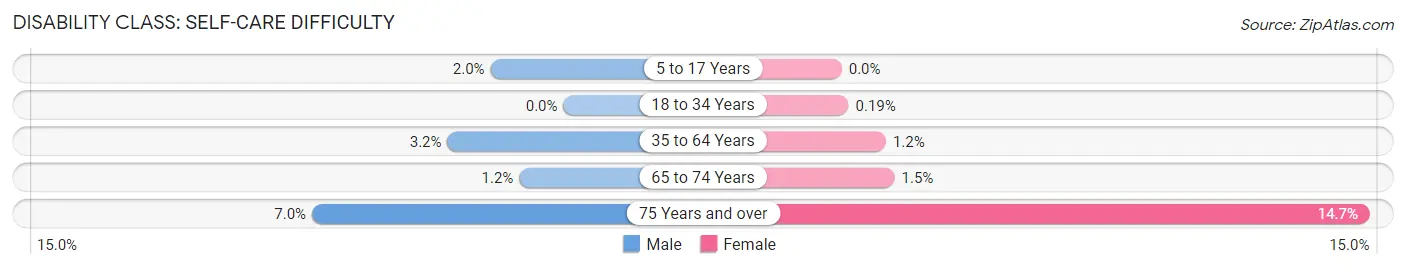
| Age Bracket | Male | Female |
| 5 to 17 Years | 23 (2.0%) | 0 (0.0%) |
| 18 to 34 Years | 0 (0.0%) | 2 (0.2%) |
| 35 to 64 Years | 81 (3.2%) | 30 (1.2%) |
| 65 to 74 Years | 8 (1.2%) | 10 (1.5%) |
| 75 Years and over | 35 (7.0%) | 91 (14.7%) |
Technology Access in Poquoson
Computing Device Access in Poquoson
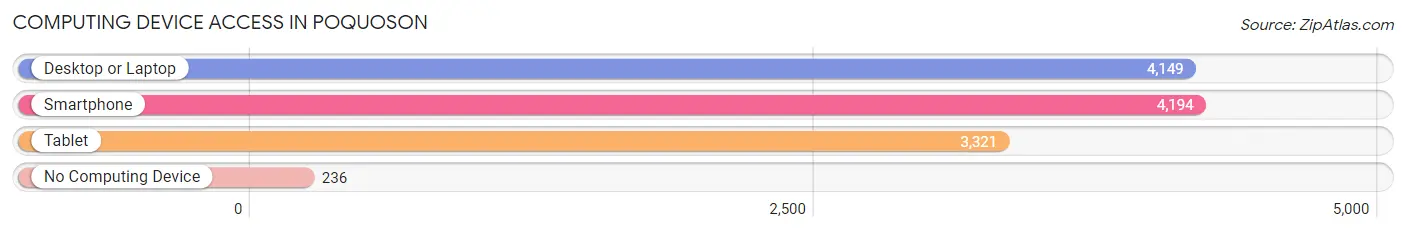
| Device Type | # Households | % Households |
| Desktop or Laptop | 4,149 | 89.1% |
| Smartphone | 4,194 | 90.1% |
| Tablet | 3,321 | 71.3% |
| No Computing Device | 236 | 5.1% |
| Total | 4,657 | 100.0% |
Internet Access in Poquoson
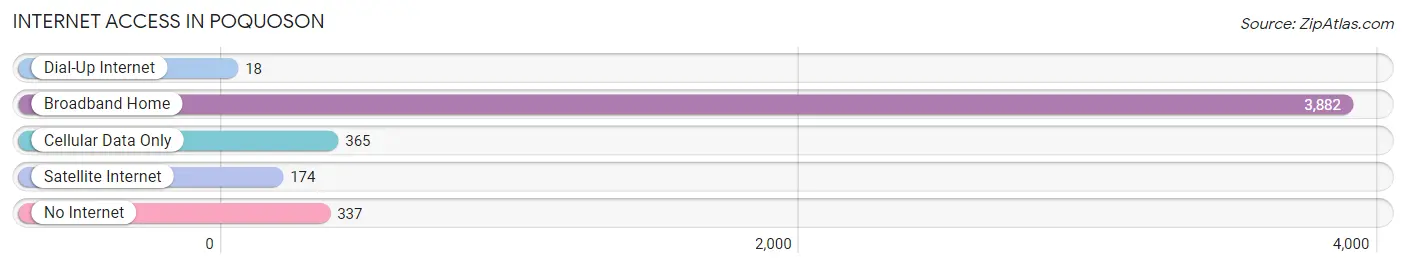
| Internet Type | # Households | % Households |
| Dial-Up Internet | 18 | 0.4% |
| Broadband Home | 3,882 | 83.4% |
| Cellular Data Only | 365 | 7.8% |
| Satellite Internet | 174 | 3.7% |
| No Internet | 337 | 7.2% |
| Total | 4,657 | 100.0% |
Poquoson Summary
Poquoson, Virginia is a small city located in the Hampton Roads region of the state. It is situated on the western shore of the Chesapeake Bay, just south of the James River. The city is bordered by York County to the north, Hampton to the east, and Newport News to the south. Poquoson is part of the Hampton Roads metropolitan area, which is the second largest metropolitan area in Virginia.
History
The area that is now Poquoson was originally inhabited by the Kecoughtan Indians, who were part of the Powhatan Confederacy. The first European settlers arrived in the area in the early 1600s, and the area was known as “New Poquoson” by 1634. The name “Poquoson” is derived from the Algonquian word “pokqut”, which means “a place of thicket”.
In 1637, the Virginia General Assembly established the Poquoson Parish, which included the area that is now Poquoson. The parish was part of York County until 1952, when it was incorporated as an independent city.
Geography
Poquoson is located on the western shore of the Chesapeake Bay, just south of the James River. The city covers an area of 8.3 square miles, and is bordered by York County to the north, Hampton to the east, and Newport News to the south. The city is part of the Hampton Roads metropolitan area, which is the second largest metropolitan area in Virginia.
The city is divided into two distinct sections: the mainland and the island. The mainland is located on the western shore of the Chesapeake Bay, and is home to most of the city’s residential and commercial areas. The island is located on the eastern side of the bay, and is home to the city’s marina and waterfront park.
Economy
The economy of Poquoson is largely based on the military, tourism, and retail. The city is home to several military installations, including the Naval Weapons Station Yorktown, the Langley Air Force Base, and the Fort Eustis Army Base. These installations provide a significant number of jobs to the local economy.
Tourism is also an important part of the local economy. The city is home to several popular attractions, including the Poquoson Museum, the Poquoson Public Library, and the Poquoson Marina. The city also hosts several annual events, such as the Poquoson Seafood Festival and the Poquoson Arts and Crafts Festival.
Retail is also an important part of the local economy. The city is home to several shopping centers, including the Poquoson Shopping Center and the Poquoson Town Center. These shopping centers provide a variety of retail options, including clothing stores, restaurants, and specialty shops.
Demographics
As of the 2010 census, the population of Poquoson was 12,150. The racial makeup of the city was 87.3% White, 8.2% African American, 0.7% Native American, 1.2% Asian, 0.2% Pacific Islander, 0.7% from other races, and 1.9% from two or more races. Hispanic or Latino of any race were 2.7% of the population.
The median household income in Poquoson was $68,945, and the median family income was $77,945. The per capita income for the city was $30,945. About 4.3% of families and 5.7% of the population were below the poverty line, including 6.3% of those under age 18 and 4.2% of those age 65 or over.
Common Questions
What is Per Capita Income in Poquoson?
Per Capita income in Poquoson is $47,329.
What is the Median Family Income in Poquoson?
Median Family Income in Poquoson is $121,086.
What is the Median Household income in Poquoson?
Median Household Income in Poquoson is $114,503.
What is Income or Wage Gap in Poquoson?
Income or Wage Gap in Poquoson is 23.6%.
Women in Poquoson earn 76.4 cents for every dollar earned by a man.
What is Inequality or Gini Index in Poquoson?
Inequality or Gini Index in Poquoson is 0.35.
What is the Total Population of Poquoson?
Total Population of Poquoson is 12,479.
What is the Total Male Population of Poquoson?
Total Male Population of Poquoson is 6,277.
What is the Total Female Population of Poquoson?
Total Female Population of Poquoson is 6,202.
What is the Ratio of Males per 100 Females in Poquoson?
There are 101.21 Males per 100 Females in Poquoson.
What is the Ratio of Females per 100 Males in Poquoson?
There are 98.81 Females per 100 Males in Poquoson.
What is the Median Population Age in Poquoson?
Median Population Age in Poquoson is 42.4 Years.
What is the Average Family Size in Poquoson
Average Family Size in Poquoson is 3.0 People.
What is the Average Household Size in Poquoson
Average Household Size in Poquoson is 2.7 People.
How Large is the Labor Force in Poquoson?
There are 6,532 People in the Labor Forcein in Poquoson.
What is the Percentage of People in the Labor Force in Poquoson?
64.5% of People are in the Labor Force in Poquoson.
What is the Unemployment Rate in Poquoson?
Unemployment Rate in Poquoson is 1.4%.