Cities with the Most Immigrants from Ireland in Virginia
RELATED REPORTS & OPTIONS
Ireland
Virginia
Compare Cities
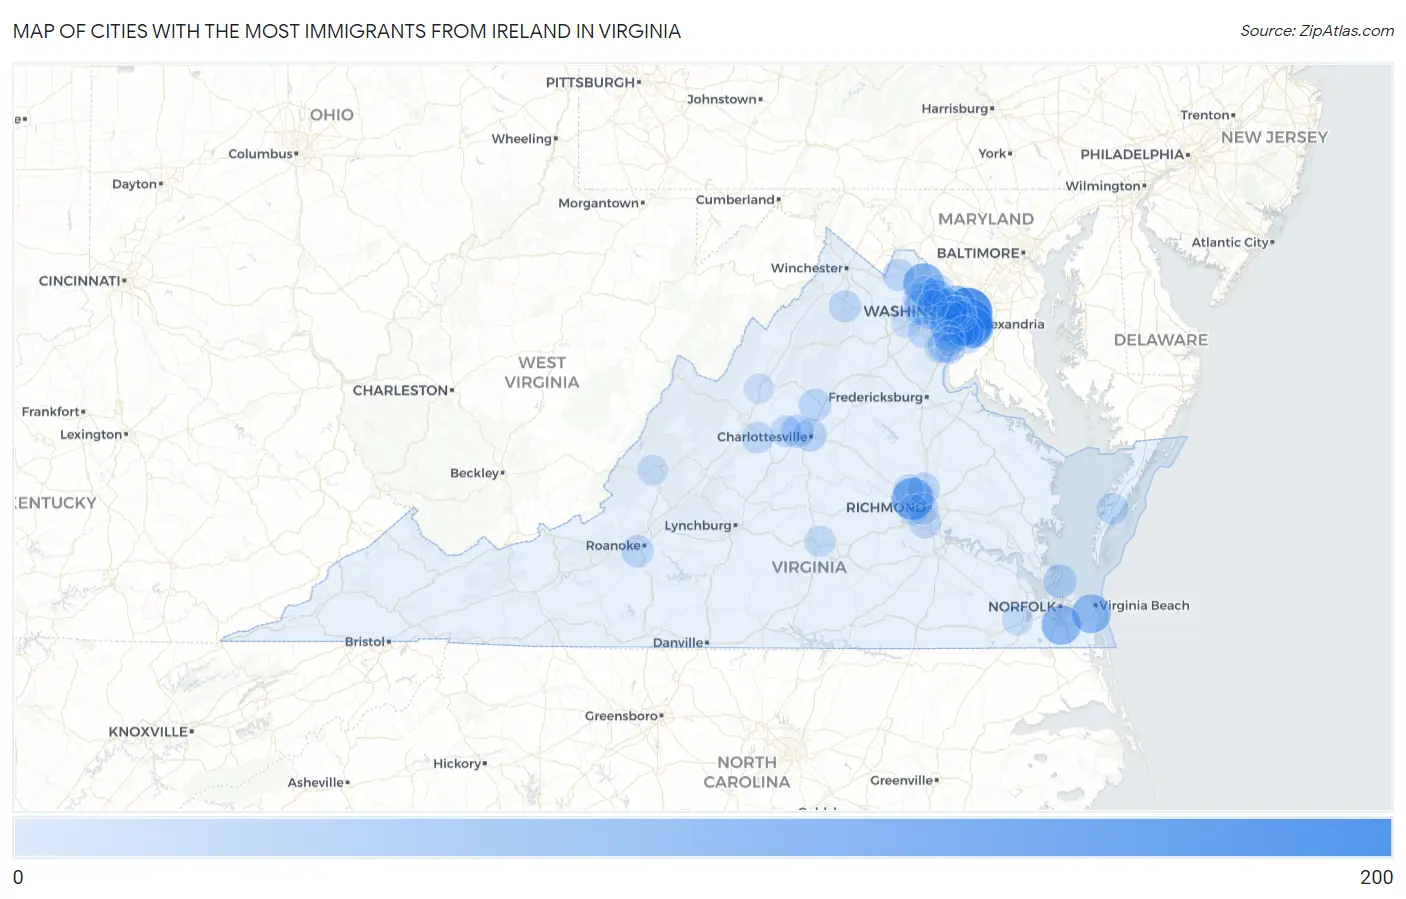
Map of Cities with the Most Immigrants from Ireland in Virginia
0
200
Cities with the Most Immigrants from Ireland in Virginia
| City | Ireland | vs State | vs National | |
| 1. | Arlington | 171 | 2,080(8.22%)#1 | 119,836(0.14%)#61 |
| 2. | Alexandria | 159 | 2,080(7.64%)#2 | 119,836(0.13%)#73 |
| 3. | Tuckahoe | 103 | 2,080(4.95%)#3 | 119,836(0.09%)#154 |
| 4. | Belle Haven | 97 | 2,080(4.66%)#4 | 119,836(0.08%)#166 |
| 5. | Lansdowne | 93 | 2,080(4.47%)#5 | 119,836(0.08%)#178 |
| 6. | Chesapeake | 80 | 2,080(3.85%)#6 | 119,836(0.07%)#221 |
| 7. | Virginia Beach | 77 | 2,080(3.70%)#7 | 119,836(0.06%)#233 |
| 8. | Mclean | 76 | 2,080(3.65%)#8 | 119,836(0.06%)#239 |
| 9. | Burke | 48 | 2,080(2.31%)#9 | 119,836(0.04%)#397 |
| 10. | South Riding | 38 | 2,080(1.83%)#10 | 119,836(0.03%)#533 |
| 11. | Sterling | 31 | 2,080(1.49%)#11 | 119,836(0.03%)#664 |
| 12. | Hampton | 29 | 2,080(1.39%)#12 | 119,836(0.02%)#694 |
| 13. | Charlottesville | 27 | 2,080(1.30%)#13 | 119,836(0.02%)#747 |
| 14. | Potomac Mills | 27 | 2,080(1.30%)#14 | 119,836(0.02%)#758 |
| 15. | Ivy | 25 | 2,080(1.20%)#15 | 119,836(0.02%)#823 |
| 16. | Franklin Farm | 24 | 2,080(1.15%)#16 | 119,836(0.02%)#831 |
| 17. | Tysons | 23 | 2,080(1.11%)#17 | 119,836(0.02%)#861 |
| 18. | Oakton | 22 | 2,080(1.06%)#18 | 119,836(0.02%)#892 |
| 19. | Chantilly | 22 | 2,080(1.06%)#19 | 119,836(0.02%)#899 |
| 20. | Fair Oaks | 20 | 2,080(0.96%)#20 | 119,836(0.02%)#975 |
| 21. | Cave Spring | 20 | 2,080(0.96%)#21 | 119,836(0.02%)#977 |
| 22. | Glen Allen | 20 | 2,080(0.96%)#22 | 119,836(0.02%)#981 |
| 23. | Purcellville | 19 | 2,080(0.91%)#23 | 119,836(0.02%)#1,030 |
| 24. | Twin Lakes | 19 | 2,080(0.91%)#24 | 119,836(0.02%)#1,040 |
| 25. | Meadowbrook | 18 | 2,080(0.87%)#25 | 119,836(0.02%)#1,059 |
| 26. | Front Royal | 18 | 2,080(0.87%)#26 | 119,836(0.02%)#1,061 |
| 27. | Brambleton | 17 | 2,080(0.82%)#27 | 119,836(0.01%)#1,096 |
| 28. | Mount Vernon | 17 | 2,080(0.82%)#28 | 119,836(0.01%)#1,100 |
| 29. | Herndon | 16 | 2,080(0.77%)#29 | 119,836(0.01%)#1,140 |
| 30. | Richmond | 15 | 2,080(0.72%)#30 | 119,836(0.01%)#1,169 |
| 31. | Leesylvania | 15 | 2,080(0.72%)#31 | 119,836(0.01%)#1,194 |
| 32. | Crozet | 15 | 2,080(0.72%)#32 | 119,836(0.01%)#1,207 |
| 33. | West Falls Church | 14 | 2,080(0.67%)#33 | 119,836(0.01%)#1,251 |
| 34. | Dranesville | 14 | 2,080(0.67%)#34 | 119,836(0.01%)#1,271 |
| 35. | Lyndhurst | 14 | 2,080(0.67%)#35 | 119,836(0.01%)#1,291 |
| 36. | Exmore | 14 | 2,080(0.67%)#36 | 119,836(0.01%)#1,292 |
| 37. | Manassas | 13 | 2,080(0.62%)#37 | 119,836(0.01%)#1,312 |
| 38. | Difficult Run | 13 | 2,080(0.62%)#38 | 119,836(0.01%)#1,331 |
| 39. | Newington | 11 | 2,080(0.53%)#39 | 119,836(0.01%)#1,445 |
| 40. | Dale City | 10 | 2,080(0.48%)#40 | 119,836(0.01%)#1,490 |
| 41. | Short Pump | 10 | 2,080(0.48%)#41 | 119,836(0.01%)#1,502 |
| 42. | Farmville | 10 | 2,080(0.48%)#42 | 119,836(0.01%)#1,532 |
| 43. | Falls Church | 9 | 2,080(0.43%)#43 | 119,836(0.01%)#1,598 |
| 44. | Suffolk | 8 | 2,080(0.38%)#44 | 119,836(0.01%)#1,642 |
| 45. | Reston | 8 | 2,080(0.38%)#45 | 119,836(0.01%)#1,649 |
| 46. | Ashburn | 8 | 2,080(0.38%)#46 | 119,836(0.01%)#1,656 |
| 47. | Burke Centre | 8 | 2,080(0.38%)#47 | 119,836(0.01%)#1,677 |
| 48. | Wolf Trap | 8 | 2,080(0.38%)#48 | 119,836(0.01%)#1,681 |
| 49. | Groveton | 8 | 2,080(0.38%)#49 | 119,836(0.01%)#1,686 |
| 50. | Lowes Island | 8 | 2,080(0.38%)#50 | 119,836(0.01%)#1,696 |
| 51. | Idylwood | 7 | 2,080(0.34%)#51 | 119,836(0.01%)#1,780 |
| 52. | Fairfax | 6 | 2,080(0.29%)#52 | 119,836(0.01%)#1,857 |
| 53. | Bon Air | 6 | 2,080(0.29%)#53 | 119,836(0.01%)#1,862 |
| 54. | Lake Barcroft | 6 | 2,080(0.29%)#54 | 119,836(0.01%)#1,873 |
| 55. | Woodburn | 6 | 2,080(0.29%)#55 | 119,836(0.01%)#1,875 |
| 56. | Dunn Loring | 6 | 2,080(0.29%)#56 | 119,836(0.01%)#1,876 |
| 57. | Crosspointe | 6 | 2,080(0.29%)#57 | 119,836(0.01%)#1,886 |
| 58. | Union Mill | 6 | 2,080(0.29%)#58 | 119,836(0.01%)#1,888 |
| 59. | Hayfield | 5 | 2,080(0.24%)#59 | 119,836(0.00%)#1,943 |
| 60. | Low Moor | 5 | 2,080(0.24%)#60 | 119,836(0.00%)#1,975 |
| 61. | Rose Hill Cdp Fairfax County | 4 | 2,080(0.19%)#61 | 119,836(0.00%)#1,995 |
| 62. | Floris | 4 | 2,080(0.19%)#62 | 119,836(0.00%)#2,011 |
| 63. | Woodbridge | 3 | 2,080(0.14%)#63 | 119,836(0.00%)#2,053 |
| 64. | Haymarket | 3 | 2,080(0.14%)#64 | 119,836(0.00%)#2,092 |
| 65. | Mount Crawford | 2 | 2,080(0.10%)#65 | 119,836(0.00%)#2,181 |
| 66. | Occoquan | 1 | 2,080(0.05%)#66 | 119,836(0.00%)#2,234 |
Common Questions
What are the Top 10 Cities with the Most Immigrants from Ireland in Virginia?
Top 10 Cities with the Most Immigrants from Ireland in Virginia are:
#1
171
#2
159
#3
103
#4
97
#5
93
#6
80
#7
77
#8
76
#9
48
#10
38
What city has the Most Immigrants from Ireland in Virginia?
Arlington has the Most Immigrants from Ireland in Virginia with 171.
What is the Total Immigrants from Ireland in the State of Virginia?
Total Immigrants from Ireland in Virginia is 2,080.
What is the Total Immigrants from Ireland in the United States?
Total Immigrants from Ireland in the United States is 119,836.