Pungoteague, VA Map & Demographics
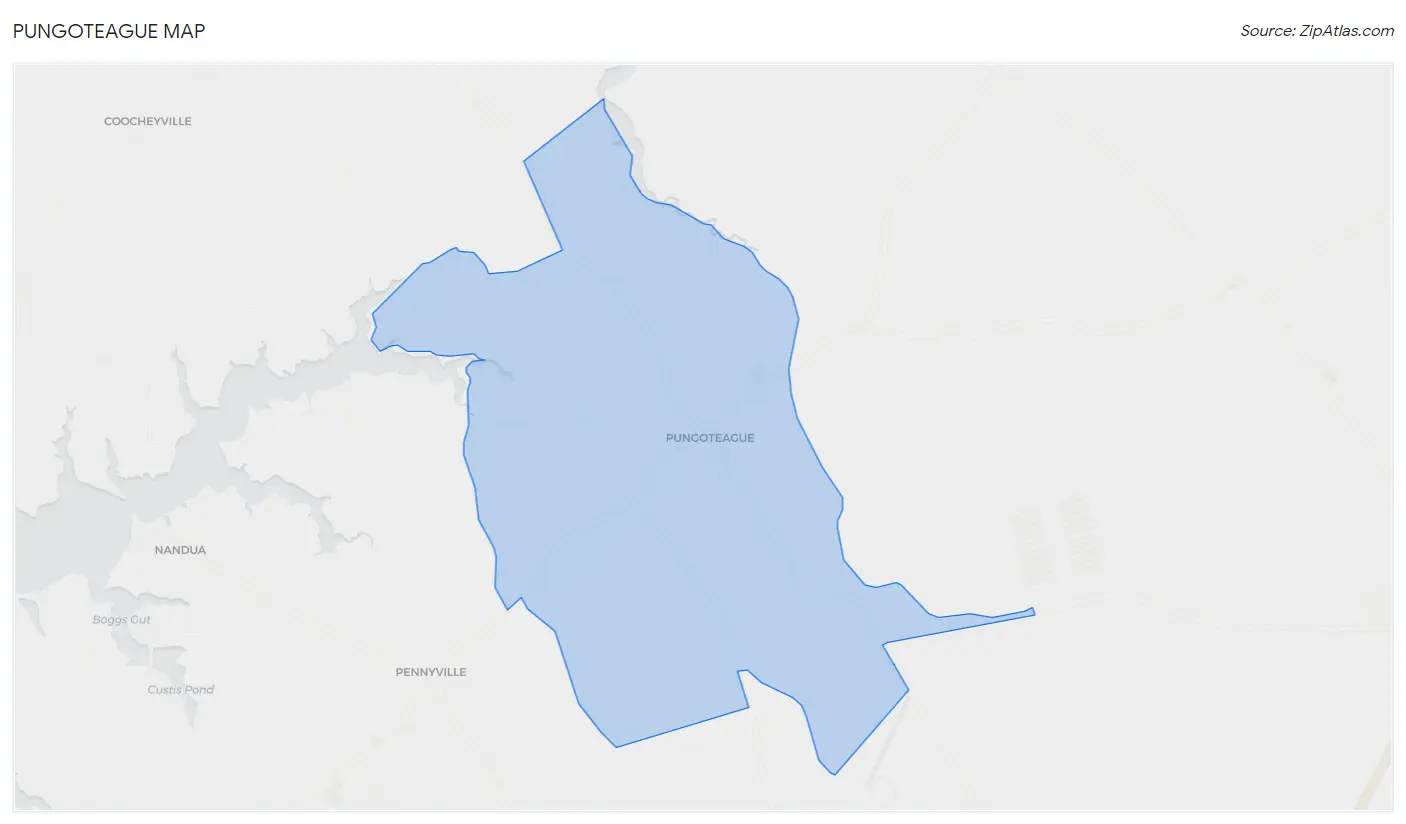
Pungoteague Map
Pungoteague Overview
$51,745
PER CAPITA INCOME
$148,476
AVG FAMILY INCOME
$148,018
AVG HOUSEHOLD INCOME
0.16
INEQUALITY / GINI INDEX
195
TOTAL POPULATION
85
MALE POPULATION
110
FEMALE POPULATION
77.27
MALES / 100 FEMALES
129.41
FEMALES / 100 MALES
61.0
MEDIAN AGE
2.6
AVG FAMILY SIZE
2.4
AVG HOUSEHOLD SIZE
80
LABOR FORCE [ PEOPLE ]
41.0%
PERCENT IN LABOR FORCE
Pungoteague Zip Codes
Pungoteague Area Codes
Income in Pungoteague
Income Overview in Pungoteague
Per Capita Income in Pungoteague is $51,745, while median incomes of families and households are $148,476 and $148,018 respectively.
| Characteristic | Number | Measure |
| Per Capita Income | 195 | $51,745 |
| Median Family Income | 68 | $148,476 |
| Mean Family Income | 68 | $134,810 |
| Median Household Income | 83 | $148,018 |
| Mean Household Income | 83 | $127,173 |
| Income Deficit | 68 | $0 |
| Wage / Income Gap (%) | 195 | 0.00% |
| Wage / Income Gap ($) | 195 | 100.00¢ per $1 |
| Gini / Inequality Index | 195 | 0.16 |
Earnings by Sex in Pungoteague
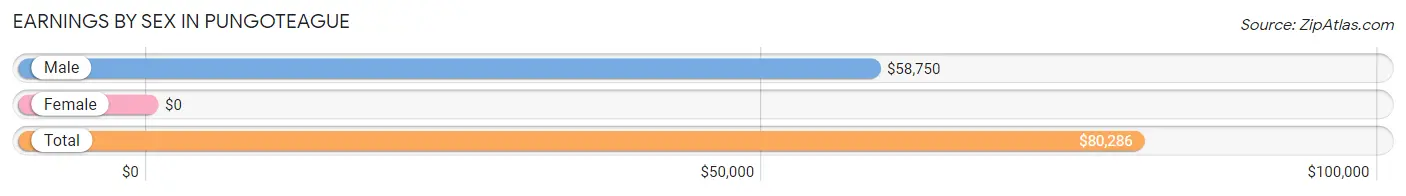
| Sex | Number | Average Earnings |
| Male | 36 (45.0%) | $58,750 |
| Female | 44 (55.0%) | $0 |
| Total | 80 (100.0%) | $80,286 |
Earnings by Sex by Income Bracket in Pungoteague
The most common earnings brackets in Pungoteague are $50,000 to $54,999 for men (15 | 41.7%) and $75,000 to $99,999 for women (35 | 79.5%).
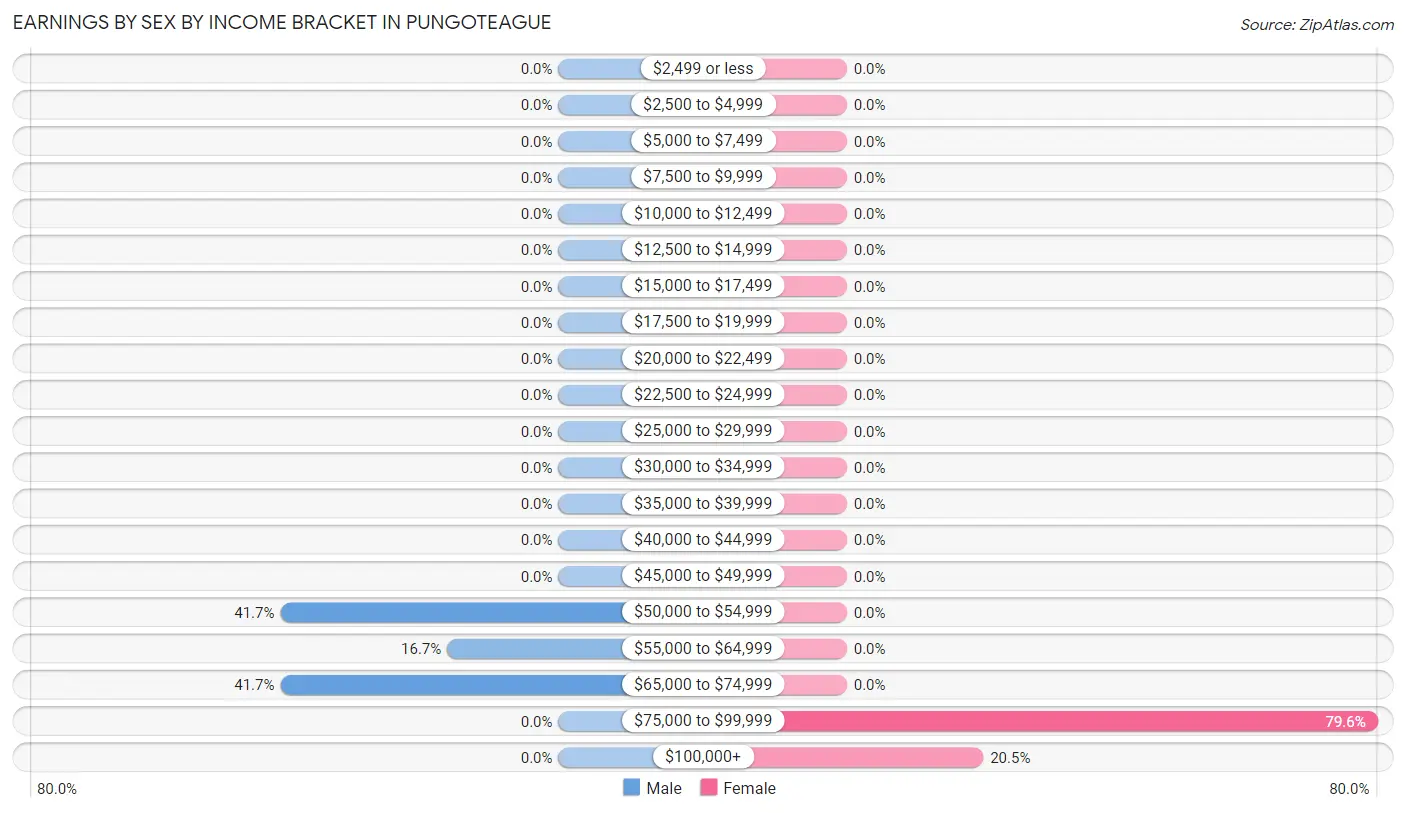
| Income | Male | Female |
| $2,499 or less | 0 (0.0%) | 0 (0.0%) |
| $2,500 to $4,999 | 0 (0.0%) | 0 (0.0%) |
| $5,000 to $7,499 | 0 (0.0%) | 0 (0.0%) |
| $7,500 to $9,999 | 0 (0.0%) | 0 (0.0%) |
| $10,000 to $12,499 | 0 (0.0%) | 0 (0.0%) |
| $12,500 to $14,999 | 0 (0.0%) | 0 (0.0%) |
| $15,000 to $17,499 | 0 (0.0%) | 0 (0.0%) |
| $17,500 to $19,999 | 0 (0.0%) | 0 (0.0%) |
| $20,000 to $22,499 | 0 (0.0%) | 0 (0.0%) |
| $22,500 to $24,999 | 0 (0.0%) | 0 (0.0%) |
| $25,000 to $29,999 | 0 (0.0%) | 0 (0.0%) |
| $30,000 to $34,999 | 0 (0.0%) | 0 (0.0%) |
| $35,000 to $39,999 | 0 (0.0%) | 0 (0.0%) |
| $40,000 to $44,999 | 0 (0.0%) | 0 (0.0%) |
| $45,000 to $49,999 | 0 (0.0%) | 0 (0.0%) |
| $50,000 to $54,999 | 15 (41.7%) | 0 (0.0%) |
| $55,000 to $64,999 | 6 (16.7%) | 0 (0.0%) |
| $65,000 to $74,999 | 15 (41.7%) | 0 (0.0%) |
| $75,000 to $99,999 | 0 (0.0%) | 35 (79.5%) |
| $100,000+ | 0 (0.0%) | 9 (20.4%) |
| Total | 36 (100.0%) | 44 (100.0%) |
Earnings by Sex by Educational Attainment in Pungoteague
| Educational Attainment | Male Income | Female Income |
| Less than High School | - | - |
| High School Diploma | - | - |
| College or Associate's Degree | - | - |
| Bachelor's Degree | - | - |
| Graduate Degree | - | - |
| Total | $58,750 | $0 |
Family Income in Pungoteague
Family Income Brackets in Pungoteague
According to the Pungoteague family income data, there are 41 families falling into the $100,000 to $149,999 income range, which is the most common income bracket and makes up 60.3% of all families.
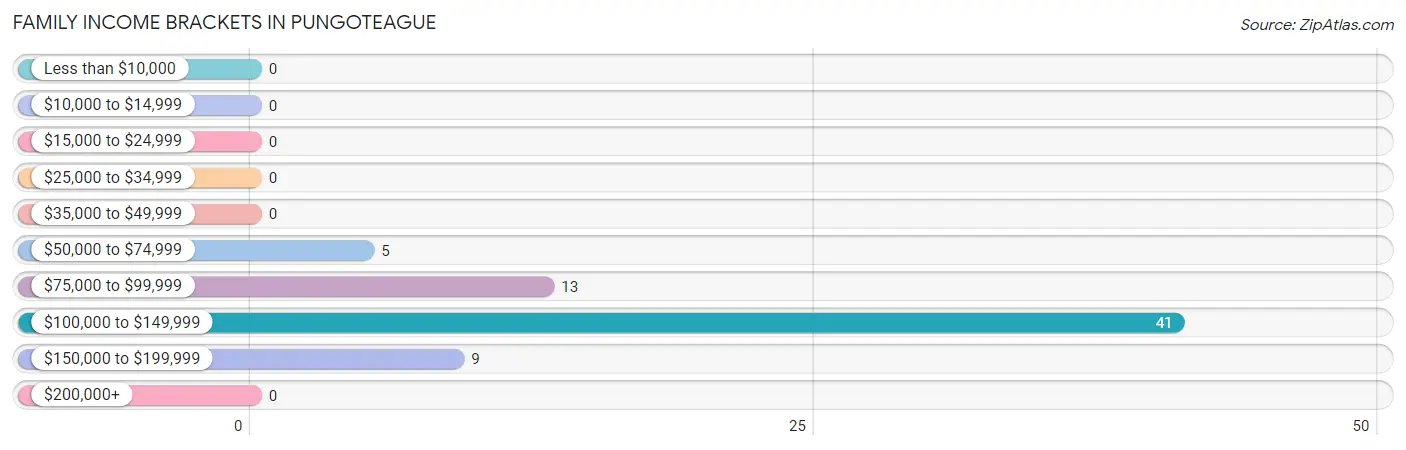
| Income Bracket | # Families | % Families |
| Less than $10,000 | 0 | 0.0% |
| $10,000 to $14,999 | 0 | 0.0% |
| $15,000 to $24,999 | 0 | 0.0% |
| $25,000 to $34,999 | 0 | 0.0% |
| $35,000 to $49,999 | 0 | 0.0% |
| $50,000 to $74,999 | 5 | 7.4% |
| $75,000 to $99,999 | 13 | 19.1% |
| $100,000 to $149,999 | 41 | 60.3% |
| $150,000 to $199,999 | 9 | 13.2% |
| $200,000+ | 0 | 0.0% |
Family Income by Famaliy Size in Pungoteague
| Income Bracket | # Families | Median Income |
| 2-Person Families | 18 (26.5%) | $0 |
| 3-Person Families | 41 (60.3%) | $0 |
| 4-Person Families | 9 (13.2%) | $0 |
| 5-Person Families | 0 (0.0%) | $0 |
| 6-Person Families | 0 (0.0%) | $0 |
| 7+ Person Families | 0 (0.0%) | $0 |
| Total | 68 (100.0%) | $148,476 |
Family Income by Number of Earners in Pungoteague
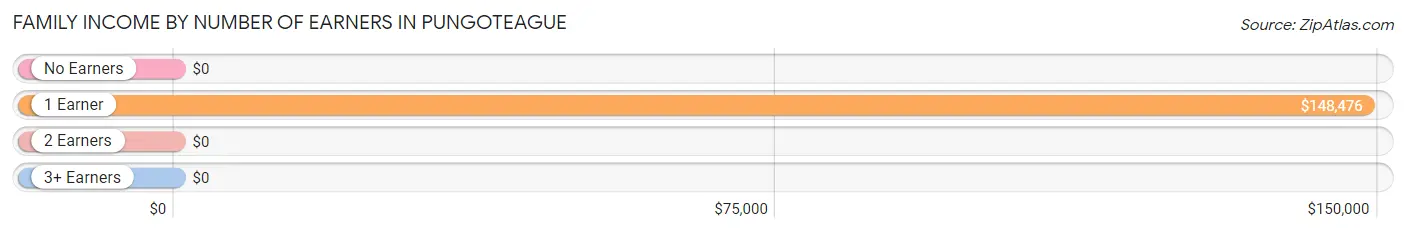
| Number of Earners | # Families | Median Income |
| No Earners | 0 (0.0%) | $0 |
| 1 Earner | 68 (100.0%) | $148,476 |
| 2 Earners | 0 (0.0%) | $0 |
| 3+ Earners | 0 (0.0%) | $0 |
| Total | 68 (100.0%) | $148,476 |
Household Income in Pungoteague
Household Income Brackets in Pungoteague
With 41 households falling in the category, the $100,000 to $149,999 income range is the most frequent in Pungoteague, accounting for 49.4% of all households.
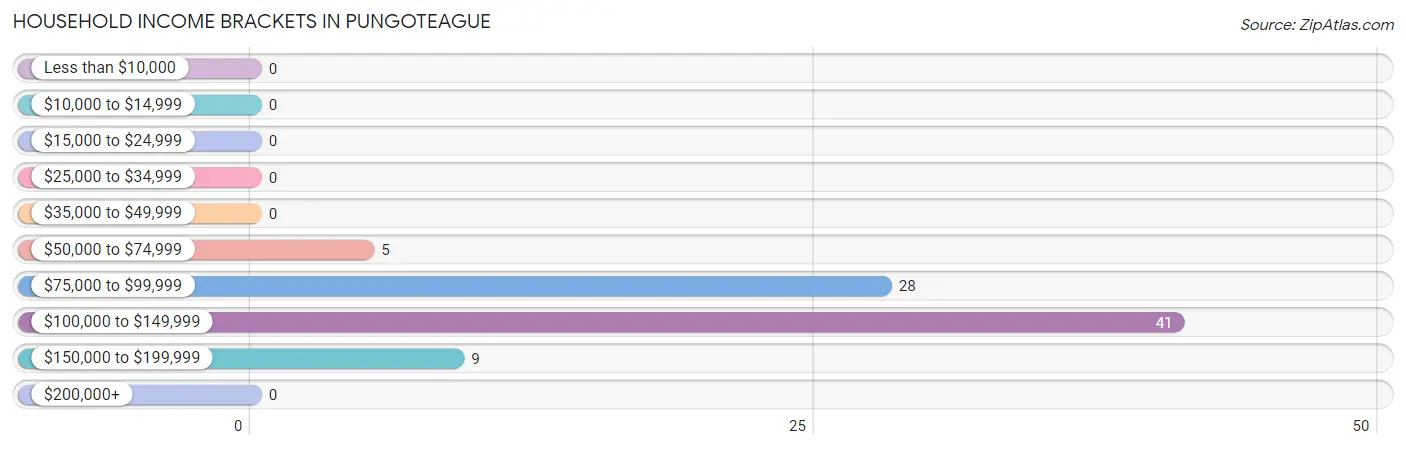
| Income Bracket | # Households | % Households |
| Less than $10,000 | 0 | 0.0% |
| $10,000 to $14,999 | 0 | 0.0% |
| $15,000 to $24,999 | 0 | 0.0% |
| $25,000 to $34,999 | 0 | 0.0% |
| $35,000 to $49,999 | 0 | 0.0% |
| $50,000 to $74,999 | 5 | 6.0% |
| $75,000 to $99,999 | 28 | 33.7% |
| $100,000 to $149,999 | 41 | 49.4% |
| $150,000 to $199,999 | 9 | 10.8% |
| $200,000+ | 0 | 0.0% |
Household Income by Householder Age in Pungoteague
The median household income in Pungoteague is $148,018, with the highest median household income of $93,000 found in the 45 to 64 years age bracket for the primary householder. A total of 42 households (50.6%) fall into this category.
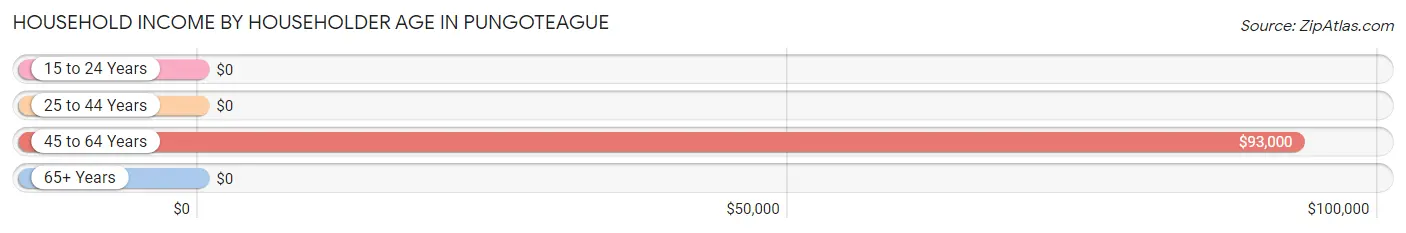
| Income Bracket | # Households | Median Income |
| 15 to 24 Years | 0 (0.0%) | $0 |
| 25 to 44 Years | 0 (0.0%) | $0 |
| 45 to 64 Years | 42 (50.6%) | $93,000 |
| 65+ Years | 41 (49.4%) | $0 |
| Total | 83 (100.0%) | $148,018 |
Poverty in Pungoteague
Income Below Poverty by Sex and Age in Pungoteague
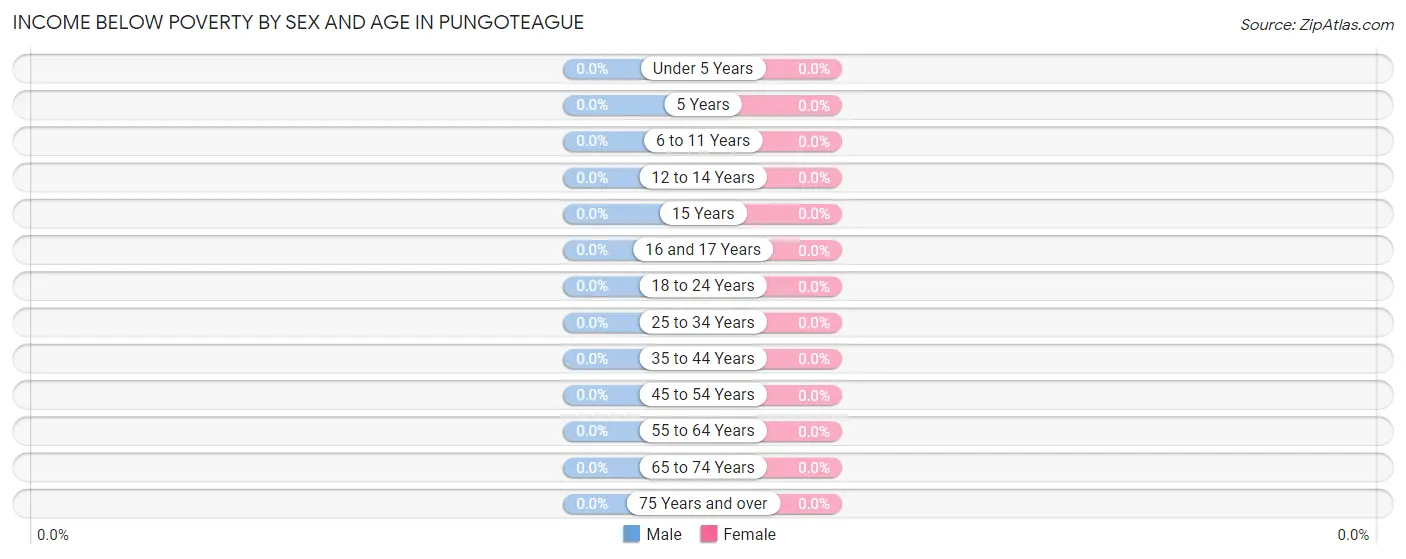
| Age Bracket | Male | Female |
| Under 5 Years | 0 (0.0%) | 0 (0.0%) |
| 5 Years | 0 (0.0%) | 0 (0.0%) |
| 6 to 11 Years | 0 (0.0%) | 0 (0.0%) |
| 12 to 14 Years | 0 (0.0%) | 0 (0.0%) |
| 15 Years | 0 (0.0%) | 0 (0.0%) |
| 16 and 17 Years | 0 (0.0%) | 0 (0.0%) |
| 18 to 24 Years | 0 (0.0%) | 0 (0.0%) |
| 25 to 34 Years | 0 (0.0%) | 0 (0.0%) |
| 35 to 44 Years | 0 (0.0%) | 0 (0.0%) |
| 45 to 54 Years | 0 (0.0%) | 0 (0.0%) |
| 55 to 64 Years | 0 (0.0%) | 0 (0.0%) |
| 65 to 74 Years | 0 (0.0%) | 0 (0.0%) |
| 75 Years and over | 0 (0.0%) | 0 (0.0%) |
| Total | 0 (0.0%) | 0 (0.0%) |
Income Above Poverty by Sex and Age in Pungoteague
According to the poverty statistics in Pungoteague, males aged 45 to 54 years and females aged 45 to 54 years are the age groups that are most secure financially, with 100.0% of males and 100.0% of females in these age groups living above the poverty line.
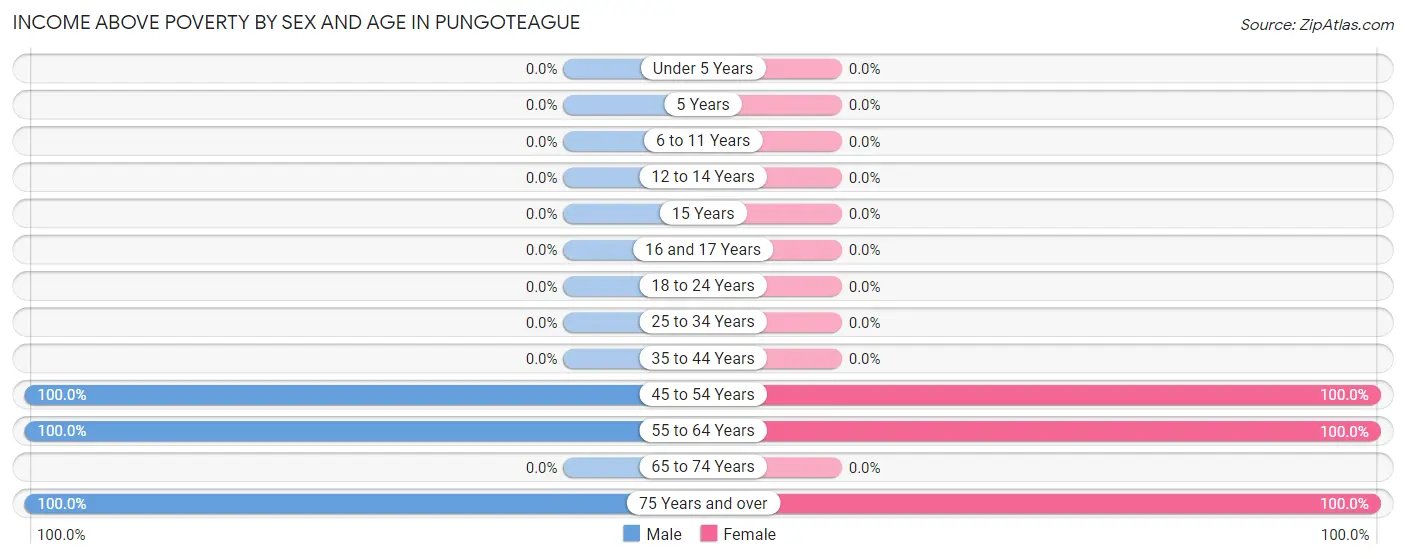
| Age Bracket | Male | Female |
| Under 5 Years | 0 (0.0%) | 0 (0.0%) |
| 5 Years | 0 (0.0%) | 0 (0.0%) |
| 6 to 11 Years | 0 (0.0%) | 0 (0.0%) |
| 12 to 14 Years | 0 (0.0%) | 0 (0.0%) |
| 15 Years | 0 (0.0%) | 0 (0.0%) |
| 16 and 17 Years | 0 (0.0%) | 0 (0.0%) |
| 18 to 24 Years | 0 (0.0%) | 0 (0.0%) |
| 25 to 34 Years | 0 (0.0%) | 0 (0.0%) |
| 35 to 44 Years | 0 (0.0%) | 0 (0.0%) |
| 45 to 54 Years | 21 (100.0%) | 13 (100.0%) |
| 55 to 64 Years | 57 (100.0%) | 49 (100.0%) |
| 65 to 74 Years | 0 (0.0%) | 0 (0.0%) |
| 75 Years and over | 7 (100.0%) | 48 (100.0%) |
| Total | 85 (100.0%) | 110 (100.0%) |
Income Below Poverty Among Married-Couple Families in Pungoteague
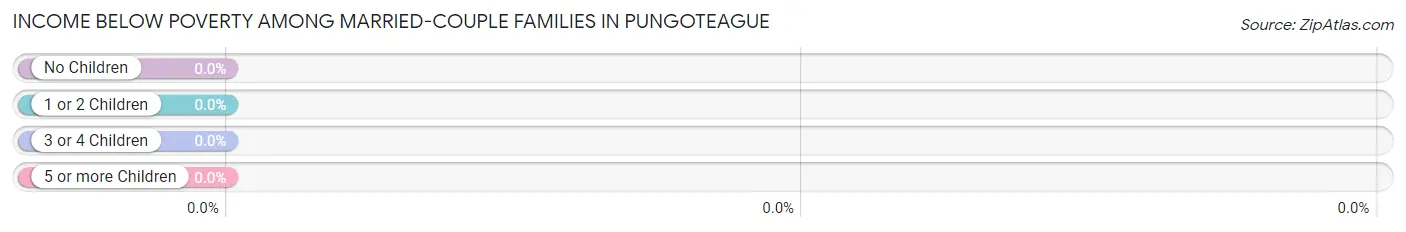
| Children | Above Poverty | Below Poverty |
| No Children | 27 (100.0%) | 0 (0.0%) |
| 1 or 2 Children | 0 (0.0%) | 0 (0.0%) |
| 3 or 4 Children | 0 (0.0%) | 0 (0.0%) |
| 5 or more Children | 0 (0.0%) | 0 (0.0%) |
| Total | 27 (100.0%) | 0 (0.0%) |
Income Below Poverty Among Single-Parent Households in Pungoteague
| Children | Single Father | Single Mother |
| No Children | 0 (0.0%) | 0 (0.0%) |
| 1 or 2 Children | 0 (0.0%) | 0 (0.0%) |
| 3 or 4 Children | 0 (0.0%) | 0 (0.0%) |
| 5 or more Children | 0 (0.0%) | 0 (0.0%) |
| Total | 0 (0.0%) | 0 (0.0%) |
Income Below Poverty Among Married-Couple vs Single-Parent Households in Pungoteague
| Children | Married-Couple Families | Single-Parent Households |
| No Children | 0 (0.0%) | 0 (0.0%) |
| 1 or 2 Children | 0 (0.0%) | 0 (0.0%) |
| 3 or 4 Children | 0 (0.0%) | 0 (0.0%) |
| 5 or more Children | 0 (0.0%) | 0 (0.0%) |
| Total | 0 (0.0%) | 0 (0.0%) |
Race in Pungoteague
The most populous races in Pungoteague are White / Caucasian (190 | 97.4%), and Two or more Races (5 | 2.6%).
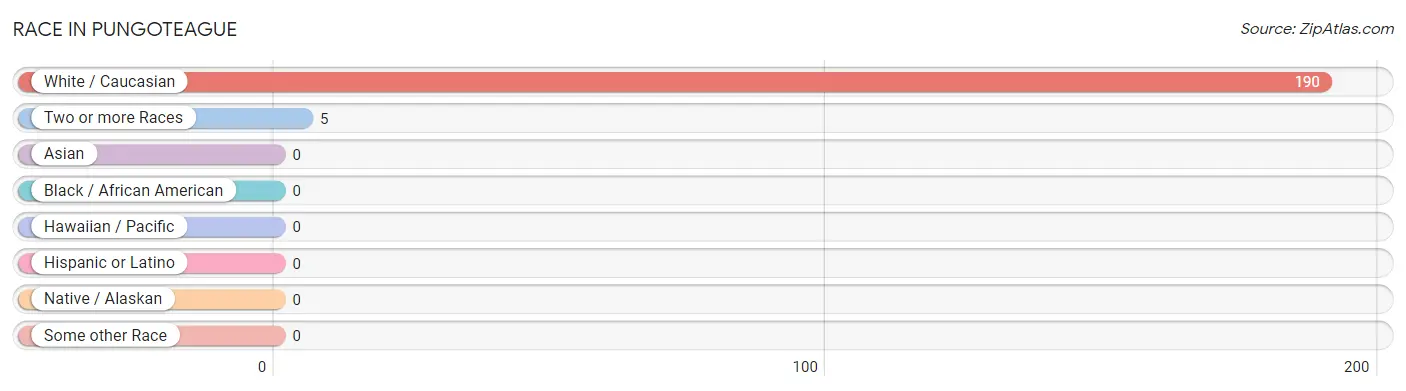
| Race | # Population | % Population |
| Asian | 0 | 0.0% |
| Black / African American | 0 | 0.0% |
| Hawaiian / Pacific | 0 | 0.0% |
| Hispanic or Latino | 0 | 0.0% |
| Native / Alaskan | 0 | 0.0% |
| White / Caucasian | 190 | 97.4% |
| Two or more Races | 5 | 2.6% |
| Some other Race | 0 | 0.0% |
| Total | 195 | 100.0% |
Ancestry in Pungoteague
The most populous ancestries reported in Pungoteague are American (148 | 75.9%), English (40 | 20.5%), French Canadian (16 | 8.2%), Irish (16 | 8.2%), and Scotch-Irish (15 | 7.7%), together accounting for 120.5% of all Pungoteague residents.
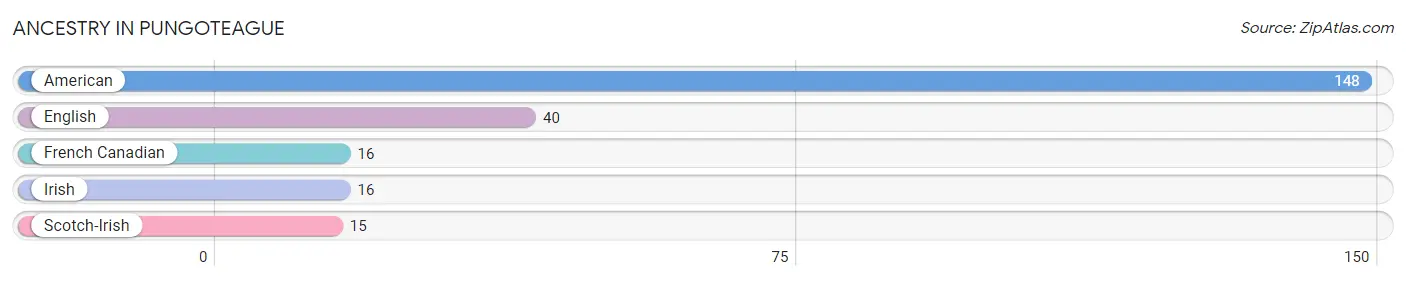
| Ancestry | # Population | % Population |
| American | 148 | 75.9% |
| English | 40 | 20.5% |
| French Canadian | 16 | 8.2% |
| Irish | 16 | 8.2% |
| Scotch-Irish | 15 | 7.7% | View All 5 Rows |
Immigrants in Pungoteague

| Immigration Origin | # Population | % Population | View All 0 Rows |
Sex and Age in Pungoteague
Sex and Age in Pungoteague
The most populous age groups in Pungoteague are 60 to 64 Years (42 | 49.4%) for men and 80 to 84 Years (41 | 37.3%) for women.
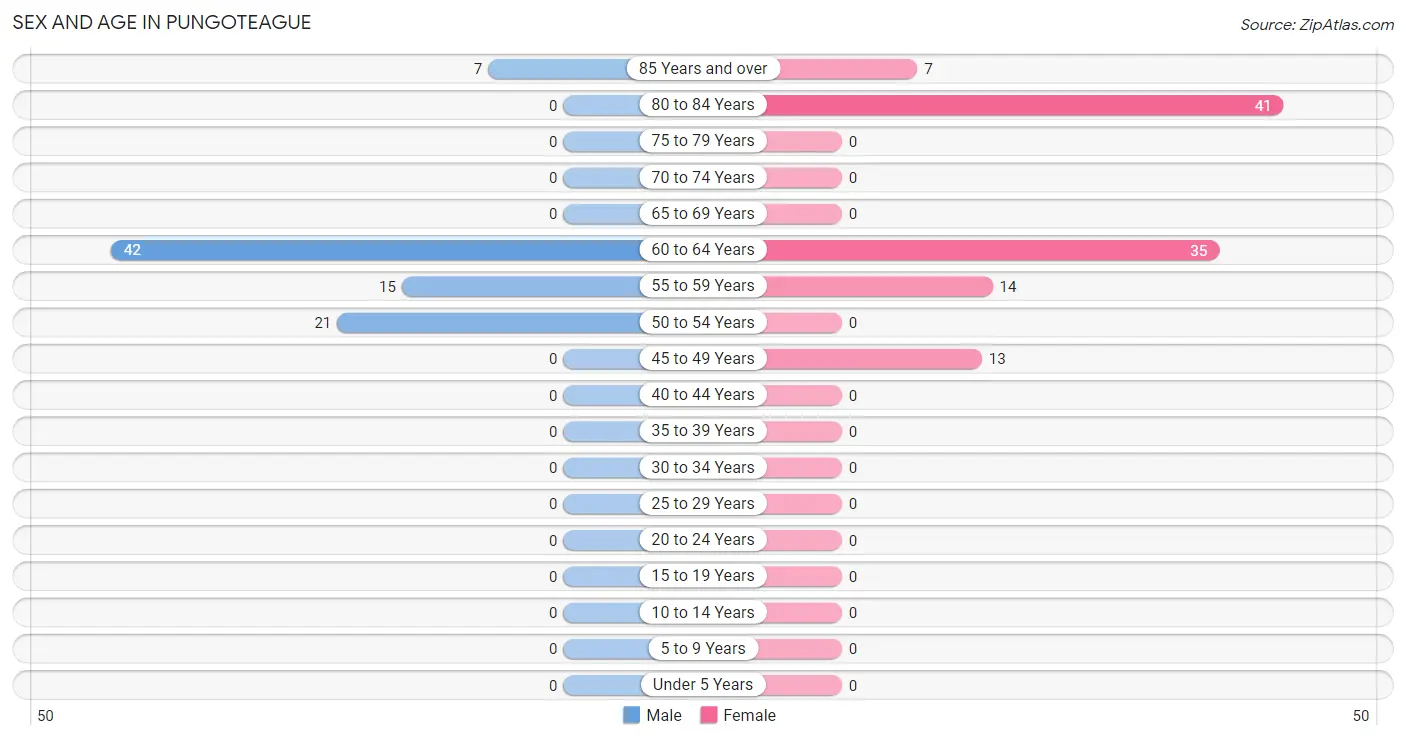
| Age Bracket | Male | Female |
| Under 5 Years | 0 (0.0%) | 0 (0.0%) |
| 5 to 9 Years | 0 (0.0%) | 0 (0.0%) |
| 10 to 14 Years | 0 (0.0%) | 0 (0.0%) |
| 15 to 19 Years | 0 (0.0%) | 0 (0.0%) |
| 20 to 24 Years | 0 (0.0%) | 0 (0.0%) |
| 25 to 29 Years | 0 (0.0%) | 0 (0.0%) |
| 30 to 34 Years | 0 (0.0%) | 0 (0.0%) |
| 35 to 39 Years | 0 (0.0%) | 0 (0.0%) |
| 40 to 44 Years | 0 (0.0%) | 0 (0.0%) |
| 45 to 49 Years | 0 (0.0%) | 13 (11.8%) |
| 50 to 54 Years | 21 (24.7%) | 0 (0.0%) |
| 55 to 59 Years | 15 (17.6%) | 14 (12.7%) |
| 60 to 64 Years | 42 (49.4%) | 35 (31.8%) |
| 65 to 69 Years | 0 (0.0%) | 0 (0.0%) |
| 70 to 74 Years | 0 (0.0%) | 0 (0.0%) |
| 75 to 79 Years | 0 (0.0%) | 0 (0.0%) |
| 80 to 84 Years | 0 (0.0%) | 41 (37.3%) |
| 85 Years and over | 7 (8.2%) | 7 (6.4%) |
| Total | 85 (100.0%) | 110 (100.0%) |
Families and Households in Pungoteague
Median Family Size in Pungoteague
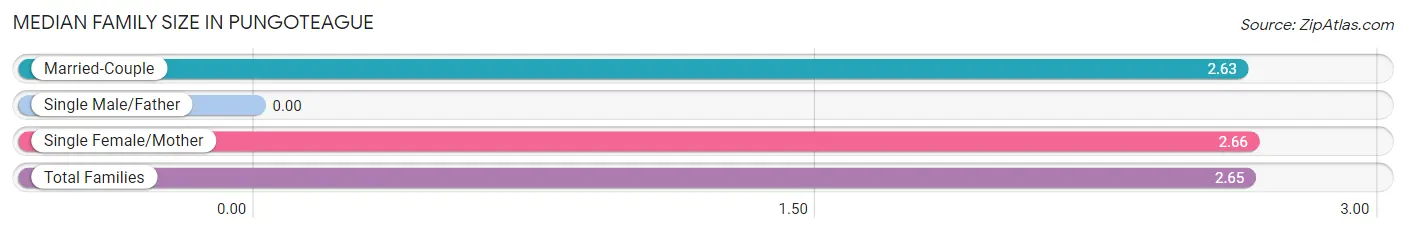
| Family Type | # Families | Family Size |
| Married-Couple | 27 (39.7%) | 2.63 |
| Single Male/Father | 0 (0.0%) | - |
| Single Female/Mother | 41 (60.3%) | 2.66 |
| Total Families | 68 (100.0%) | 2.65 |
Median Household Size in Pungoteague
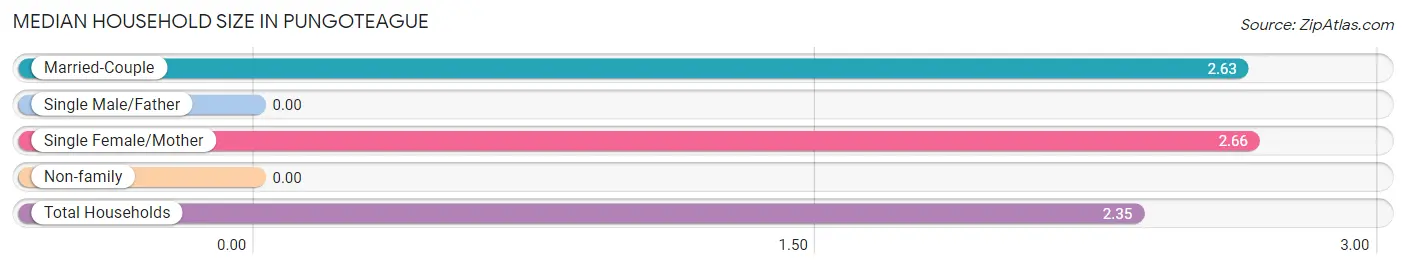
| Household Type | # Households | Household Size |
| Married-Couple | 27 (32.5%) | 2.63 |
| Single Male/Father | 0 (0.0%) | - |
| Single Female/Mother | 41 (49.4%) | 2.66 |
| Non-family | 15 (18.1%) | - |
| Total Households | 83 (100.0%) | 2.35 |
Household Size by Marriage Status in Pungoteague
Out of a total of 83 households in Pungoteague, 68 (81.9%) are family households, while 15 (18.1%) are nonfamily households. The most numerous type of family households are 3-person households, comprising 41, and the most common type of nonfamily households are 1-person households, comprising 15.
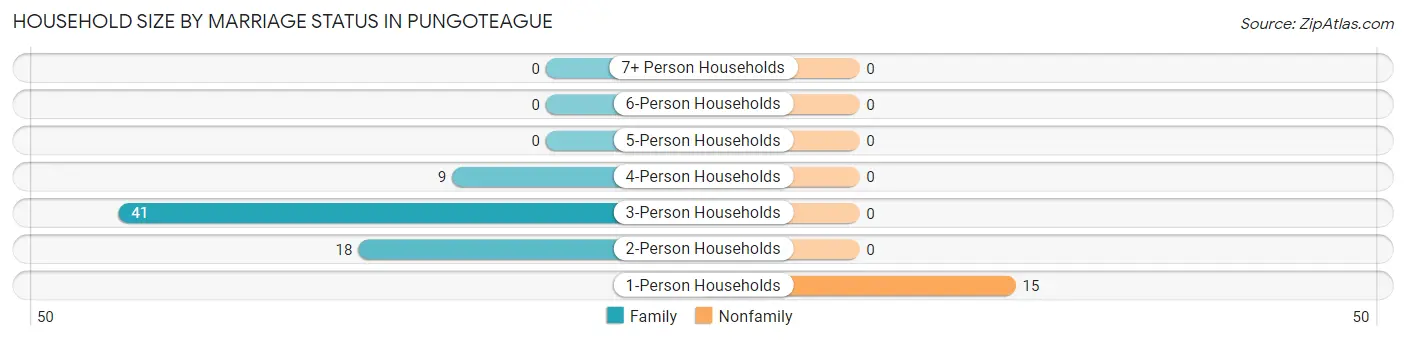
| Household Size | Family Households | Nonfamily Households |
| 1-Person Households | - | 15 (18.1%) |
| 2-Person Households | 18 (21.7%) | 0 (0.0%) |
| 3-Person Households | 41 (49.4%) | 0 (0.0%) |
| 4-Person Households | 9 (10.8%) | 0 (0.0%) |
| 5-Person Households | 0 (0.0%) | 0 (0.0%) |
| 6-Person Households | 0 (0.0%) | 0 (0.0%) |
| 7+ Person Households | 0 (0.0%) | 0 (0.0%) |
| Total | 68 (81.9%) | 15 (18.1%) |
Female Fertility in Pungoteague
Fertility by Age in Pungoteague
| Age Bracket | Women with Births | Births / 1,000 Women |
| 15 to 19 years | 0 (0.0%) | 0.0 |
| 20 to 34 years | 0 (0.0%) | 0.0 |
| 35 to 50 years | 0 (0.0%) | 0.0 |
| Total | 0 (0.0%) | 0.0 |
Fertility by Age by Marriage Status in Pungoteague
| Age Bracket | Married | Unmarried |
| 15 to 19 years | 0 (0.0%) | 0 (0.0%) |
| 20 to 34 years | 0 (0.0%) | 0 (0.0%) |
| 35 to 50 years | 0 (0.0%) | 0 (0.0%) |
| Total | 0 (0.0%) | 0 (0.0%) |
Fertility by Education in Pungoteague
| Educational Attainment | Women with Births | Births / 1,000 Women |
| Less than High School | 0 (0.0%) | 0.0 |
| High School Diploma | 0 (0.0%) | 0.0 |
| College or Associate's Degree | 0 (0.0%) | 0.0 |
| Bachelor's Degree | 0 (0.0%) | 0.0 |
| Graduate Degree | 0 (0.0%) | 0.0 |
| Total | 0 (0.0%) | 0.0 |
Fertility by Education by Marriage Status in Pungoteague
| Educational Attainment | Married | Unmarried |
| Less than High School | 0 (0.0%) | 0 (0.0%) |
| High School Diploma | 0 (0.0%) | 0 (0.0%) |
| College or Associate's Degree | 0 (0.0%) | 0 (0.0%) |
| Bachelor's Degree | 0 (0.0%) | 0 (0.0%) |
| Graduate Degree | 0 (0.0%) | 0 (0.0%) |
| Total | 0 (0.0%) | 0 (0.0%) |
Employment Characteristics in Pungoteague
Employment by Class of Employer in Pungoteague
Among the 65 employed individuals in Pungoteague, local government employees (35 | 53.8%), private company employees (21 | 32.3%), and not-for-profit organizations (9 | 13.9%) make up the most common classes of employment.
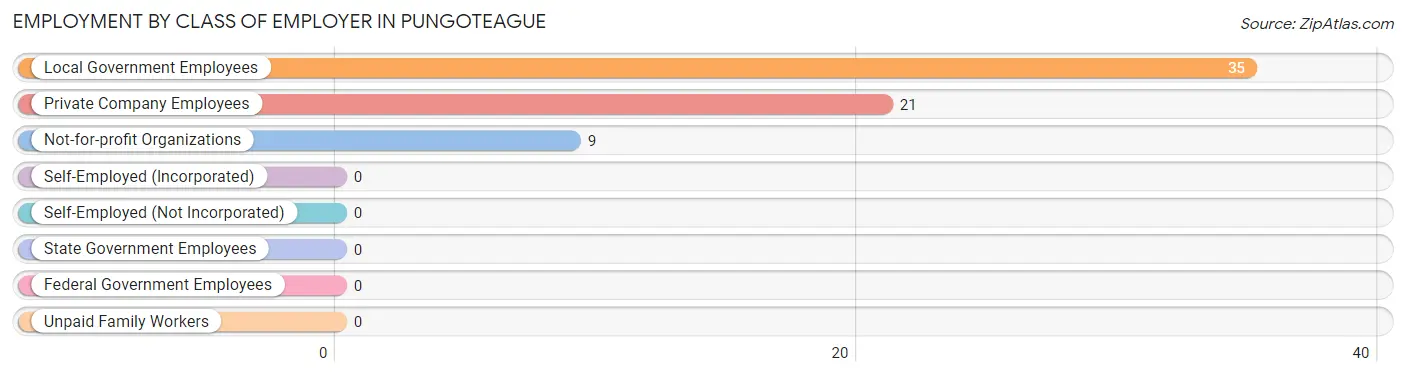
| Employer Class | # Employees | % Employees |
| Private Company Employees | 21 | 32.3% |
| Self-Employed (Incorporated) | 0 | 0.0% |
| Self-Employed (Not Incorporated) | 0 | 0.0% |
| Not-for-profit Organizations | 9 | 13.9% |
| Local Government Employees | 35 | 53.8% |
| State Government Employees | 0 | 0.0% |
| Federal Government Employees | 0 | 0.0% |
| Unpaid Family Workers | 0 | 0.0% |
| Total | 65 | 100.0% |
Employment Status by Age in Pungoteague
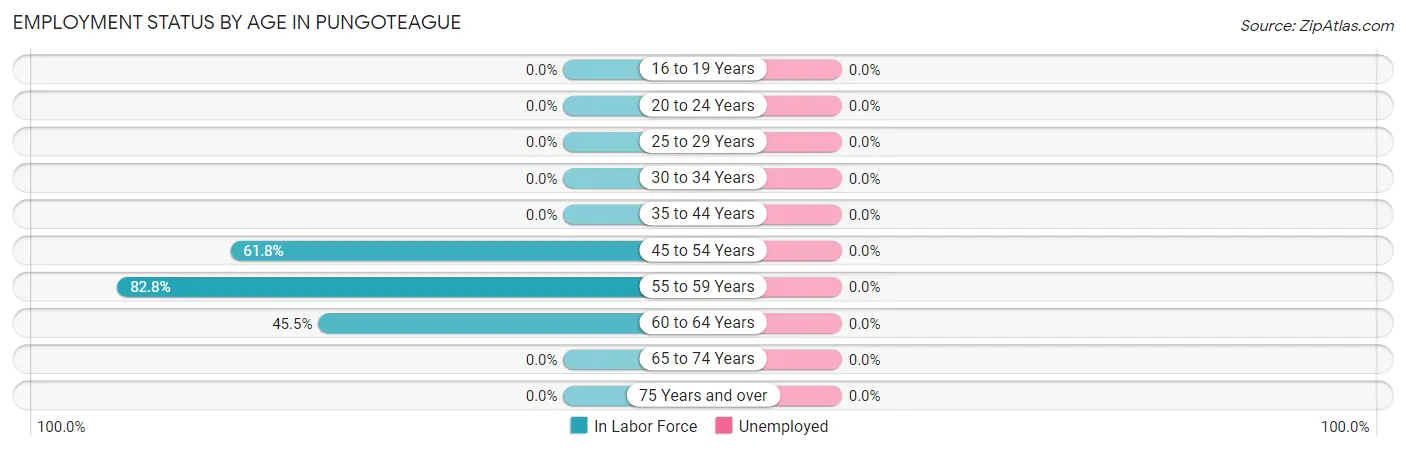
| Age Bracket | In Labor Force | Unemployed |
| 16 to 19 Years | 0 (0.0%) | 0 (0.0%) |
| 20 to 24 Years | 0 (0.0%) | 0 (0.0%) |
| 25 to 29 Years | 0 (0.0%) | 0 (0.0%) |
| 30 to 34 Years | 0 (0.0%) | 0 (0.0%) |
| 35 to 44 Years | 0 (0.0%) | 0 (0.0%) |
| 45 to 54 Years | 21 (61.8%) | 0 (0.0%) |
| 55 to 59 Years | 24 (82.8%) | 0 (0.0%) |
| 60 to 64 Years | 35 (45.5%) | 0 (0.0%) |
| 65 to 74 Years | 0 (0.0%) | 0 (0.0%) |
| 75 Years and over | 0 (0.0%) | 0 (0.0%) |
| Total | 80 (41.0%) | 0 (0.0%) |
Employment Status by Educational Attainment in Pungoteague
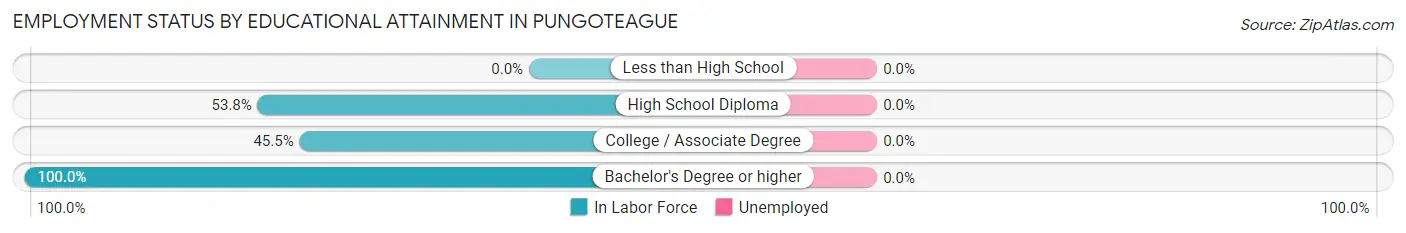
| Educational Attainment | In Labor Force | Unemployed |
| Less than High School | 0 (0.0%) | 0 (0.0%) |
| High School Diploma | 21 (53.8%) | 0 (0.0%) |
| College / Associate Degree | 35 (45.5%) | 0 (0.0%) |
| Bachelor's Degree or higher | 24 (100.0%) | 0 (0.0%) |
| Total | 80 (57.1%) | 0 (0.0%) |
Employment Occupations by Sex in Pungoteague
Management, Business, Science and Arts Occupations
The most common Management, Business, Science and Arts occupations in Pungoteague are Community & Social Service (35 | 43.8%), Education, Arts & Media (35 | 43.8%), Computers, Engineering & Science (24 | 30.0%), Architecture & Engineering (15 | 18.8%), and Computers & Mathematics (9 | 11.3%).
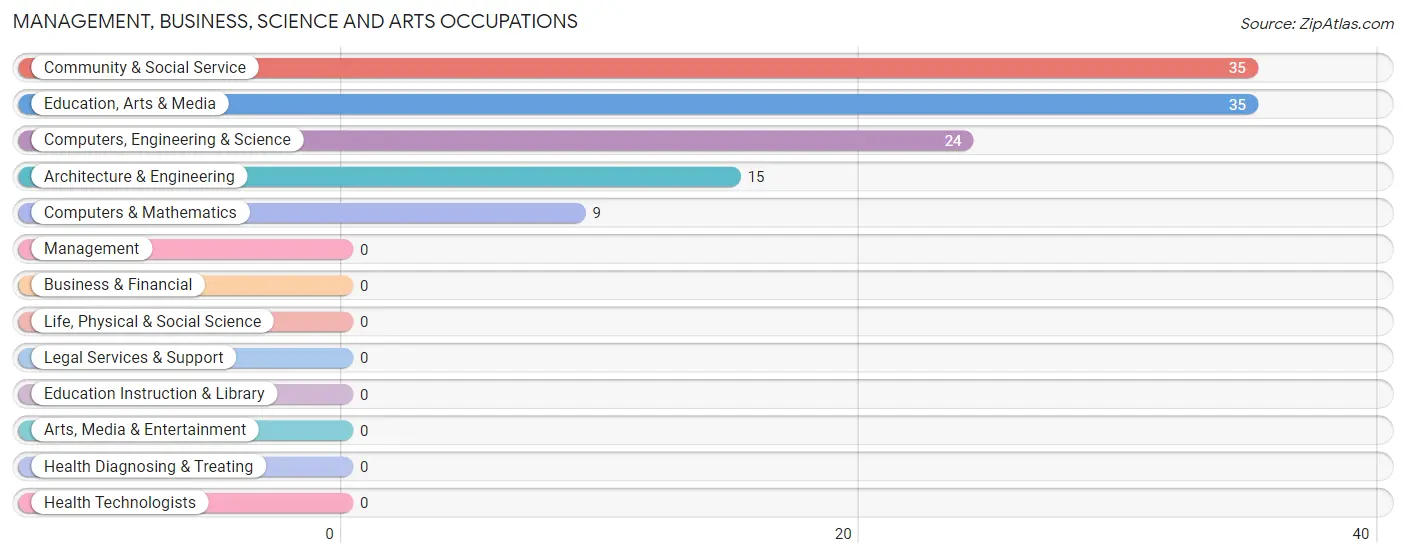
Management, Business, Science and Arts Occupations by Sex
Within the Management, Business, Science and Arts occupations in Pungoteague, the most male-oriented occupations are Architecture & Engineering (100.0%), and Computers, Engineering & Science (62.5%), while the most female-oriented occupations are Computers & Mathematics (100.0%), Community & Social Service (100.0%), and Education, Arts & Media (100.0%).
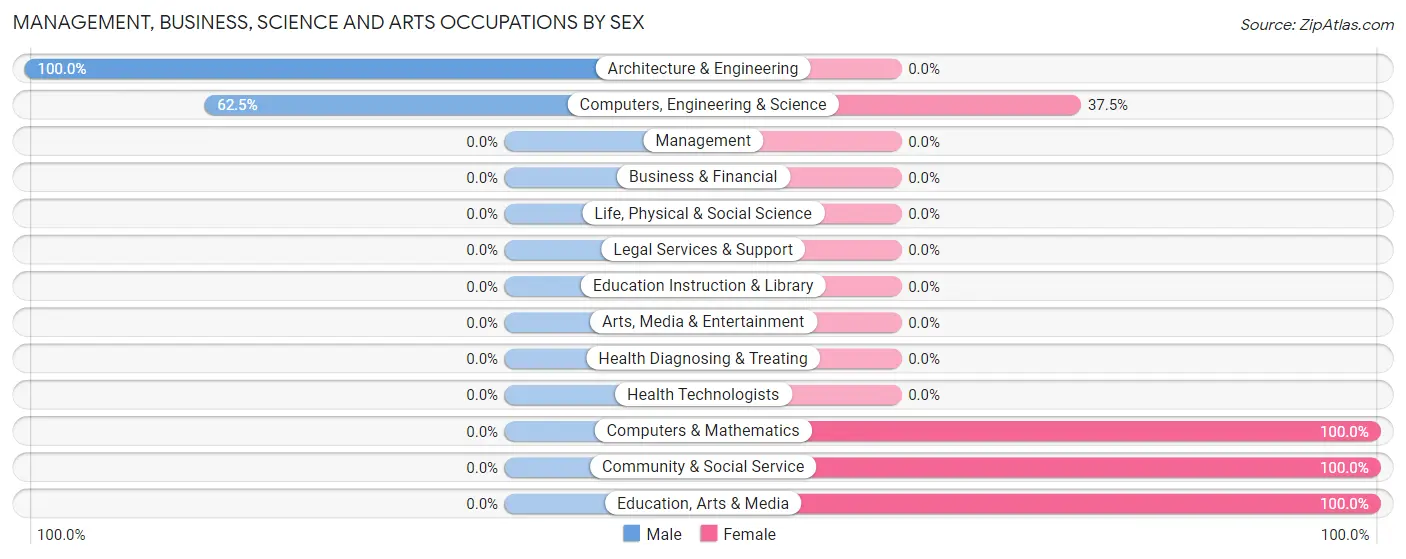
| Occupation | Male | Female |
| Management | 0 (0.0%) | 0 (0.0%) |
| Business & Financial | 0 (0.0%) | 0 (0.0%) |
| Computers, Engineering & Science | 15 (62.5%) | 9 (37.5%) |
| Computers & Mathematics | 0 (0.0%) | 9 (100.0%) |
| Architecture & Engineering | 15 (100.0%) | 0 (0.0%) |
| Life, Physical & Social Science | 0 (0.0%) | 0 (0.0%) |
| Community & Social Service | 0 (0.0%) | 35 (100.0%) |
| Education, Arts & Media | 0 (0.0%) | 35 (100.0%) |
| Legal Services & Support | 0 (0.0%) | 0 (0.0%) |
| Education Instruction & Library | 0 (0.0%) | 0 (0.0%) |
| Arts, Media & Entertainment | 0 (0.0%) | 0 (0.0%) |
| Health Diagnosing & Treating | 0 (0.0%) | 0 (0.0%) |
| Health Technologists | 0 (0.0%) | 0 (0.0%) |
| Total (Category) | 15 (25.4%) | 44 (74.6%) |
| Total (Overall) | 36 (45.0%) | 44 (55.0%) |
Services Occupations
Services Occupations by Sex
| Occupation | Male | Female |
| Healthcare Support | 0 (0.0%) | 0 (0.0%) |
| Security & Protection | 0 (0.0%) | 0 (0.0%) |
| Firefighting & Prevention | 0 (0.0%) | 0 (0.0%) |
| Law Enforcement | 0 (0.0%) | 0 (0.0%) |
| Food Preparation & Serving | 0 (0.0%) | 0 (0.0%) |
| Cleaning & Maintenance | 0 (0.0%) | 0 (0.0%) |
| Personal Care & Service | 0 (0.0%) | 0 (0.0%) |
| Total (Category) | 0 (0.0%) | 0 (0.0%) |
| Total (Overall) | 36 (45.0%) | 44 (55.0%) |
Sales and Office Occupations
Sales and Office Occupations by Sex
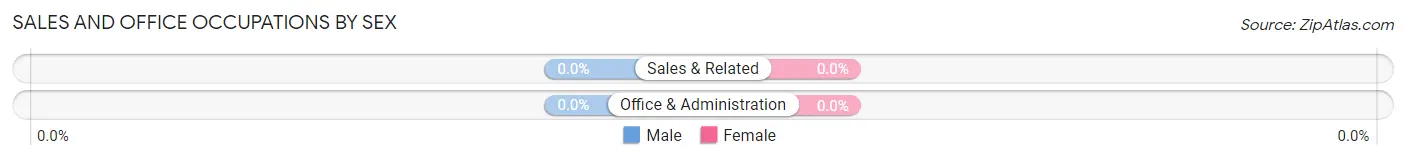
| Occupation | Male | Female |
| Sales & Related | 0 (0.0%) | 0 (0.0%) |
| Office & Administration | 0 (0.0%) | 0 (0.0%) |
| Total (Category) | 0 (0.0%) | 0 (0.0%) |
| Total (Overall) | 36 (45.0%) | 44 (55.0%) |
Natural Resources, Construction and Maintenance Occupations
The most common Natural Resources, Construction and Maintenance occupations in Pungoteague are , and Installation, Maintenance & Repair (21 | 26.3%).
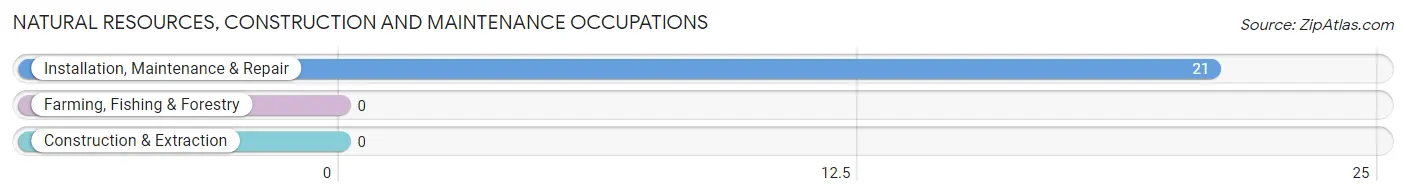
Natural Resources, Construction and Maintenance Occupations by Sex
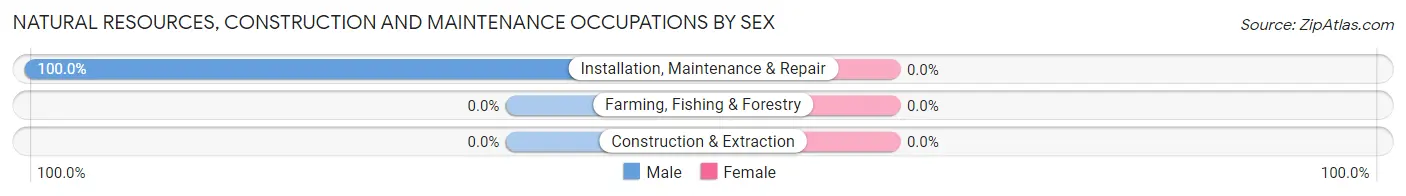
| Occupation | Male | Female |
| Farming, Fishing & Forestry | 0 (0.0%) | 0 (0.0%) |
| Construction & Extraction | 0 (0.0%) | 0 (0.0%) |
| Installation, Maintenance & Repair | 21 (100.0%) | 0 (0.0%) |
| Total (Category) | 21 (100.0%) | 0 (0.0%) |
| Total (Overall) | 36 (45.0%) | 44 (55.0%) |
Production, Transportation and Moving Occupations
Production, Transportation and Moving Occupations by Sex
| Occupation | Male | Female |
| Production | 0 (0.0%) | 0 (0.0%) |
| Transportation | 0 (0.0%) | 0 (0.0%) |
| Material Moving | 0 (0.0%) | 0 (0.0%) |
| Total (Category) | 0 (0.0%) | 0 (0.0%) |
| Total (Overall) | 36 (45.0%) | 44 (55.0%) |
Employment Industries by Sex in Pungoteague
Employment Industries in Pungoteague
The major employment industries in Pungoteague include Health Care & Social Assistance (35 | 43.8%), Manufacturing (15 | 18.8%), Administrative & Support (15 | 18.8%), Educational Services (9 | 11.3%), and Professional & Scientific (6 | 7.5%).
Employment Industries by Sex in Pungoteague
The Pungoteague industries that see more men than women are Manufacturing (100.0%), Professional & Scientific (100.0%), and Administrative & Support (100.0%), whereas the industries that tend to have a higher number of women are Educational Services (100.0%), and Health Care & Social Assistance (100.0%).
| Industry | Male | Female |
| Agriculture, Fishing & Hunting | 0 (0.0%) | 0 (0.0%) |
| Mining, Quarrying, & Extraction | 0 (0.0%) | 0 (0.0%) |
| Construction | 0 (0.0%) | 0 (0.0%) |
| Manufacturing | 15 (100.0%) | 0 (0.0%) |
| Wholesale Trade | 0 (0.0%) | 0 (0.0%) |
| Retail Trade | 0 (0.0%) | 0 (0.0%) |
| Transportation & Warehousing | 0 (0.0%) | 0 (0.0%) |
| Utilities | 0 (0.0%) | 0 (0.0%) |
| Information | 0 (0.0%) | 0 (0.0%) |
| Finance & Insurance | 0 (0.0%) | 0 (0.0%) |
| Real Estate, Rental & Leasing | 0 (0.0%) | 0 (0.0%) |
| Professional & Scientific | 6 (100.0%) | 0 (0.0%) |
| Enterprise Management | 0 (0.0%) | 0 (0.0%) |
| Administrative & Support | 15 (100.0%) | 0 (0.0%) |
| Educational Services | 0 (0.0%) | 9 (100.0%) |
| Health Care & Social Assistance | 0 (0.0%) | 35 (100.0%) |
| Arts, Entertainment & Recreation | 0 (0.0%) | 0 (0.0%) |
| Accommodation & Food Services | 0 (0.0%) | 0 (0.0%) |
| Public Administration | 0 (0.0%) | 0 (0.0%) |
| Total | 36 (45.0%) | 44 (55.0%) |
Education in Pungoteague
School Enrollment in Pungoteague
| School Level | # Students | % Students |
| Nursery / Preschool | 0 | 0.0% |
| Kindergarten | 0 | 0.0% |
| Elementary School | 0 | 0.0% |
| Middle School | 0 | 0.0% |
| High School | 0 | 0.0% |
| College / Undergraduate | 15 | 100.0% |
| Graduate / Professional | 0 | 0.0% |
| Total | 15 | 100.0% |
School Enrollment by Age by Funding Source in Pungoteague
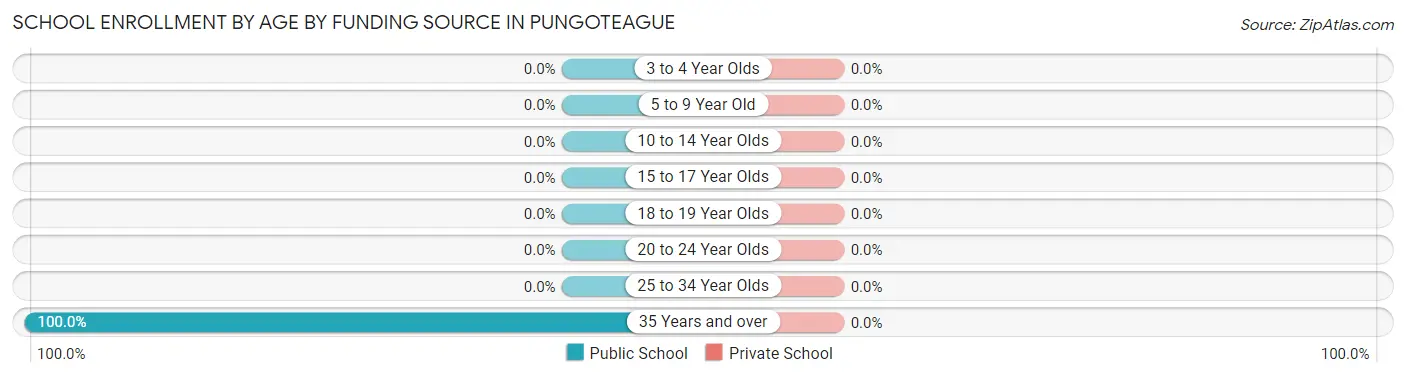
| Age Bracket | Public School | Private School |
| 3 to 4 Year Olds | 0 (0.0%) | 0 (0.0%) |
| 5 to 9 Year Old | 0 (0.0%) | 0 (0.0%) |
| 10 to 14 Year Olds | 0 (0.0%) | 0 (0.0%) |
| 15 to 17 Year Olds | 0 (0.0%) | 0 (0.0%) |
| 18 to 19 Year Olds | 0 (0.0%) | 0 (0.0%) |
| 20 to 24 Year Olds | 0 (0.0%) | 0 (0.0%) |
| 25 to 34 Year Olds | 0 (0.0%) | 0 (0.0%) |
| 35 Years and over | 15 (100.0%) | 0 (0.0%) |
| Total | 15 (100.0%) | 0 (0.0%) |
Educational Attainment by Field of Study in Pungoteague
Education (41 | 55.4%), literature & languages (15 | 20.3%), science & technology (9 | 12.2%), and business (9 | 12.2%) are the most common fields of study among 74 individuals in Pungoteague who have obtained a bachelor's degree or higher.
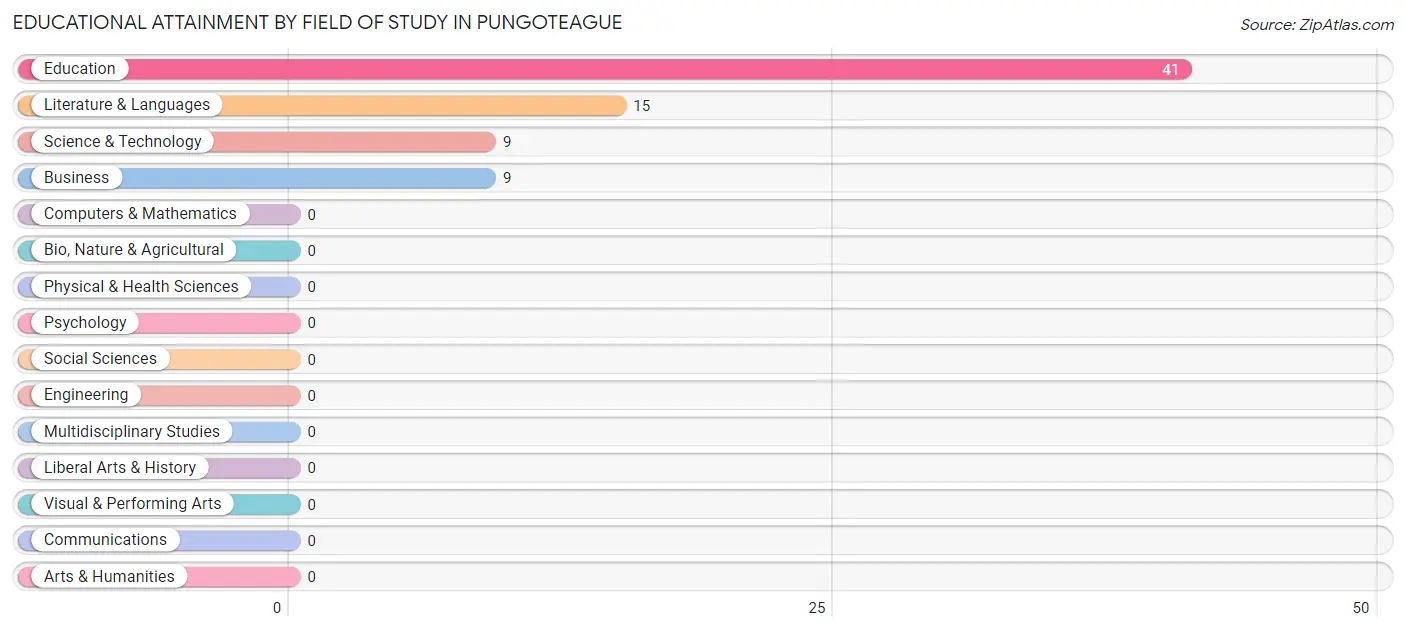
| Field of Study | # Graduates | % Graduates |
| Computers & Mathematics | 0 | 0.0% |
| Bio, Nature & Agricultural | 0 | 0.0% |
| Physical & Health Sciences | 0 | 0.0% |
| Psychology | 0 | 0.0% |
| Social Sciences | 0 | 0.0% |
| Engineering | 0 | 0.0% |
| Multidisciplinary Studies | 0 | 0.0% |
| Science & Technology | 9 | 12.2% |
| Business | 9 | 12.2% |
| Education | 41 | 55.4% |
| Literature & Languages | 15 | 20.3% |
| Liberal Arts & History | 0 | 0.0% |
| Visual & Performing Arts | 0 | 0.0% |
| Communications | 0 | 0.0% |
| Arts & Humanities | 0 | 0.0% |
| Total | 74 | 100.0% |
Transportation & Commute in Pungoteague
Vehicle Availability by Sex in Pungoteague
The most prevalent vehicle ownership categories in Pungoteague are males with 1 vehicle (15, accounting for 71.4%) and females with 1 vehicle (0, making up 34.1%).
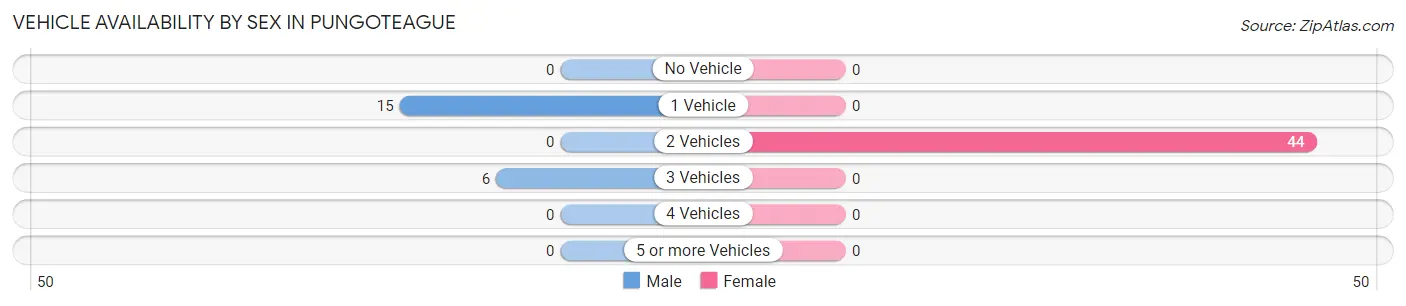
| Vehicles Available | Male | Female |
| No Vehicle | 0 (0.0%) | 0 (0.0%) |
| 1 Vehicle | 15 (71.4%) | 0 (0.0%) |
| 2 Vehicles | 0 (0.0%) | 44 (100.0%) |
| 3 Vehicles | 6 (28.6%) | 0 (0.0%) |
| 4 Vehicles | 0 (0.0%) | 0 (0.0%) |
| 5 or more Vehicles | 0 (0.0%) | 0 (0.0%) |
| Total | 21 (100.0%) | 44 (100.0%) |
Commute Time in Pungoteague
The most frequently occuring commute durations in Pungoteague are 30 to 34 minutes (35 commuters, 62.5%), 60 to 89 minutes (15 commuters, 26.8%), and 40 to 44 minutes (6 commuters, 10.7%).
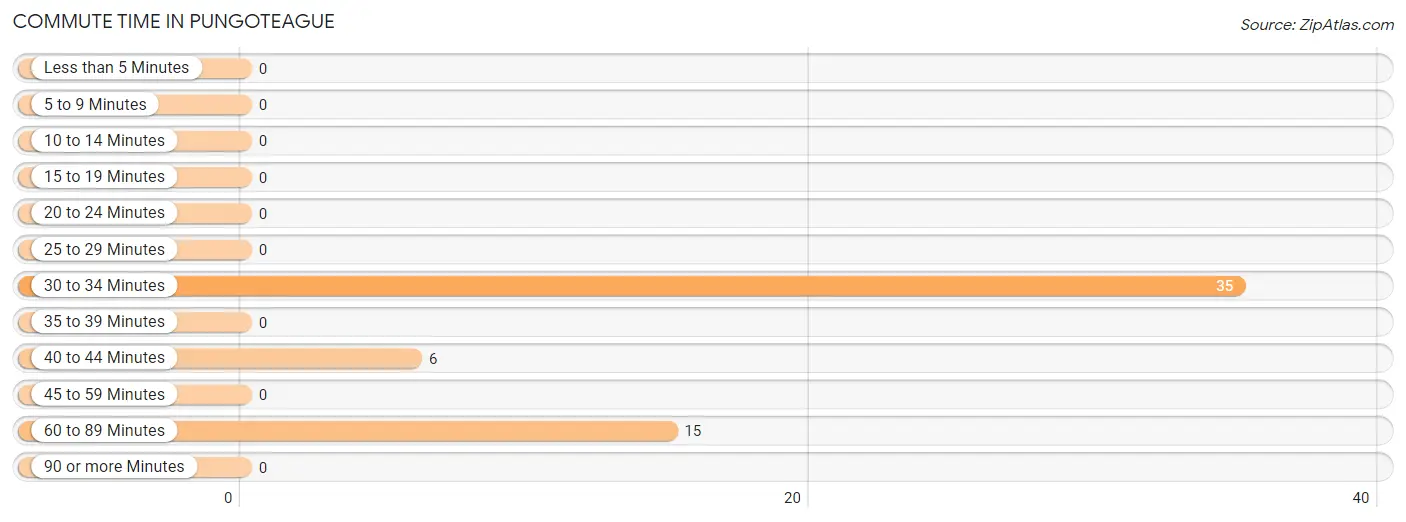
| Commute Time | # Commuters | % Commuters |
| Less than 5 Minutes | 0 | 0.0% |
| 5 to 9 Minutes | 0 | 0.0% |
| 10 to 14 Minutes | 0 | 0.0% |
| 15 to 19 Minutes | 0 | 0.0% |
| 20 to 24 Minutes | 0 | 0.0% |
| 25 to 29 Minutes | 0 | 0.0% |
| 30 to 34 Minutes | 35 | 62.5% |
| 35 to 39 Minutes | 0 | 0.0% |
| 40 to 44 Minutes | 6 | 10.7% |
| 45 to 59 Minutes | 0 | 0.0% |
| 60 to 89 Minutes | 15 | 26.8% |
| 90 or more Minutes | 0 | 0.0% |
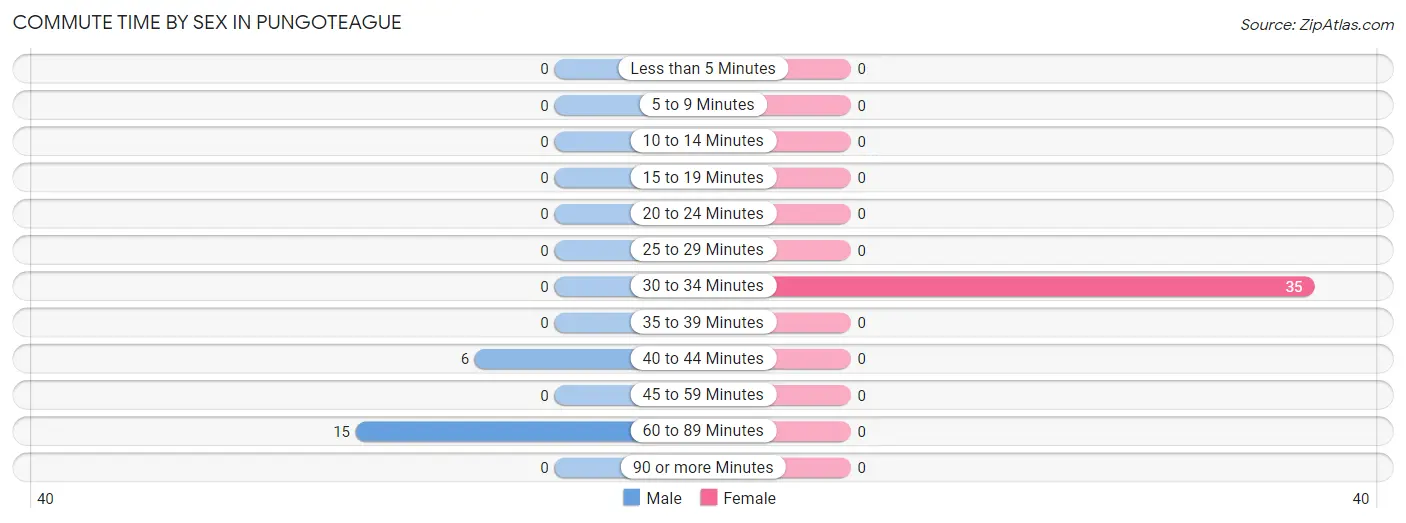
Commute Time by Sex in Pungoteague
The most common commute times in Pungoteague are 60 to 89 minutes (15 commuters, 71.4%) for males and 30 to 34 minutes (35 commuters, 100.0%) for females.
| Commute Time | Male | Female |
| Less than 5 Minutes | 0 (0.0%) | 0 (0.0%) |
| 5 to 9 Minutes | 0 (0.0%) | 0 (0.0%) |
| 10 to 14 Minutes | 0 (0.0%) | 0 (0.0%) |
| 15 to 19 Minutes | 0 (0.0%) | 0 (0.0%) |
| 20 to 24 Minutes | 0 (0.0%) | 0 (0.0%) |
| 25 to 29 Minutes | 0 (0.0%) | 0 (0.0%) |
| 30 to 34 Minutes | 0 (0.0%) | 35 (100.0%) |
| 35 to 39 Minutes | 0 (0.0%) | 0 (0.0%) |
| 40 to 44 Minutes | 6 (28.6%) | 0 (0.0%) |
| 45 to 59 Minutes | 0 (0.0%) | 0 (0.0%) |
| 60 to 89 Minutes | 15 (71.4%) | 0 (0.0%) |
| 90 or more Minutes | 0 (0.0%) | 0 (0.0%) |
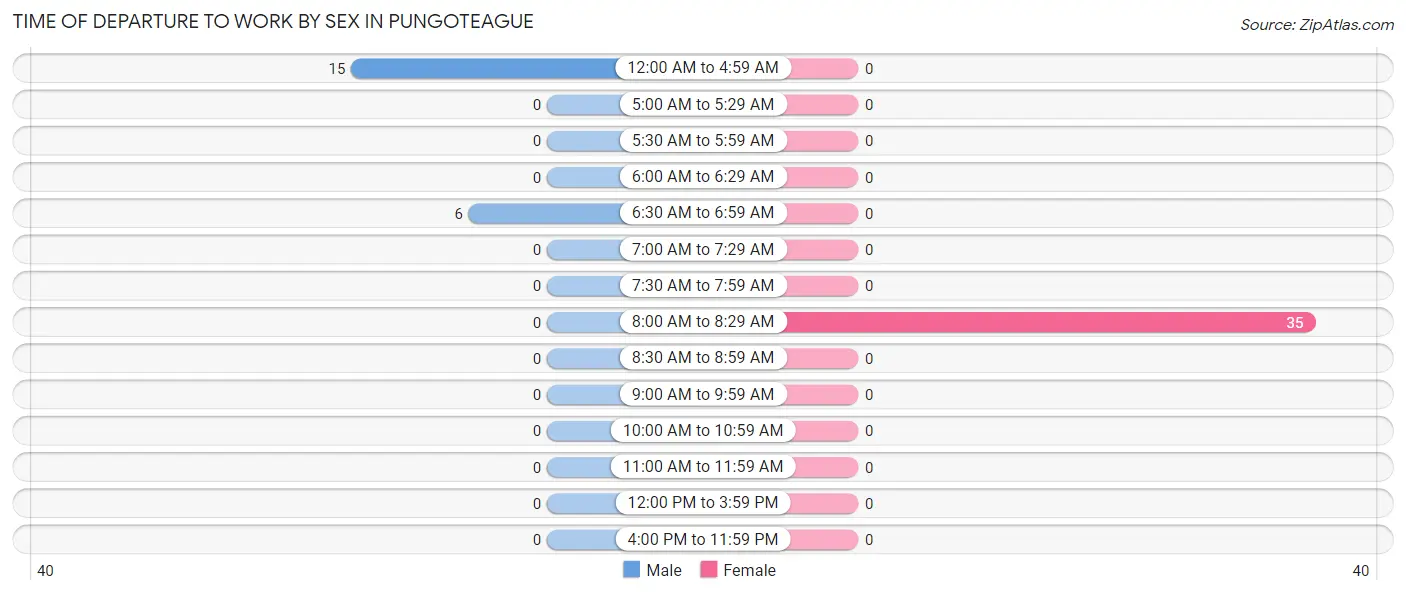
Time of Departure to Work by Sex in Pungoteague
The most frequent times of departure to work in Pungoteague are 12:00 AM to 4:59 AM (15, 71.4%) for males and 8:00 AM to 8:29 AM (35, 100.0%) for females.
| Time of Departure | Male | Female |
| 12:00 AM to 4:59 AM | 15 (71.4%) | 0 (0.0%) |
| 5:00 AM to 5:29 AM | 0 (0.0%) | 0 (0.0%) |
| 5:30 AM to 5:59 AM | 0 (0.0%) | 0 (0.0%) |
| 6:00 AM to 6:29 AM | 0 (0.0%) | 0 (0.0%) |
| 6:30 AM to 6:59 AM | 6 (28.6%) | 0 (0.0%) |
| 7:00 AM to 7:29 AM | 0 (0.0%) | 0 (0.0%) |
| 7:30 AM to 7:59 AM | 0 (0.0%) | 0 (0.0%) |
| 8:00 AM to 8:29 AM | 0 (0.0%) | 35 (100.0%) |
| 8:30 AM to 8:59 AM | 0 (0.0%) | 0 (0.0%) |
| 9:00 AM to 9:59 AM | 0 (0.0%) | 0 (0.0%) |
| 10:00 AM to 10:59 AM | 0 (0.0%) | 0 (0.0%) |
| 11:00 AM to 11:59 AM | 0 (0.0%) | 0 (0.0%) |
| 12:00 PM to 3:59 PM | 0 (0.0%) | 0 (0.0%) |
| 4:00 PM to 11:59 PM | 0 (0.0%) | 0 (0.0%) |
| Total | 21 (100.0%) | 35 (100.0%) |
Housing Occupancy in Pungoteague
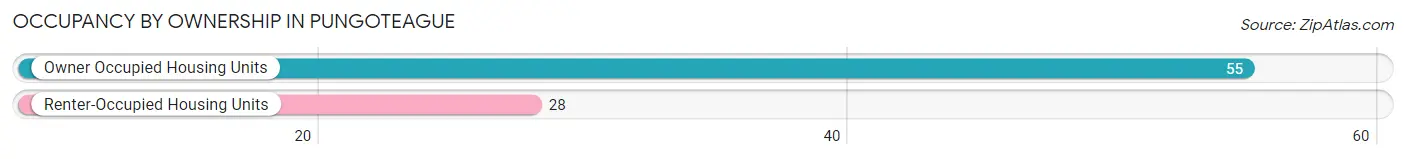
Occupancy by Ownership in Pungoteague
Of the total 83 dwellings in Pungoteague, owner-occupied units account for 55 (66.3%), while renter-occupied units make up 28 (33.7%).
| Occupancy | # Housing Units | % Housing Units |
| Owner Occupied Housing Units | 55 | 66.3% |
| Renter-Occupied Housing Units | 28 | 33.7% |
| Total Occupied Housing Units | 83 | 100.0% |
Occupancy by Household Size in Pungoteague
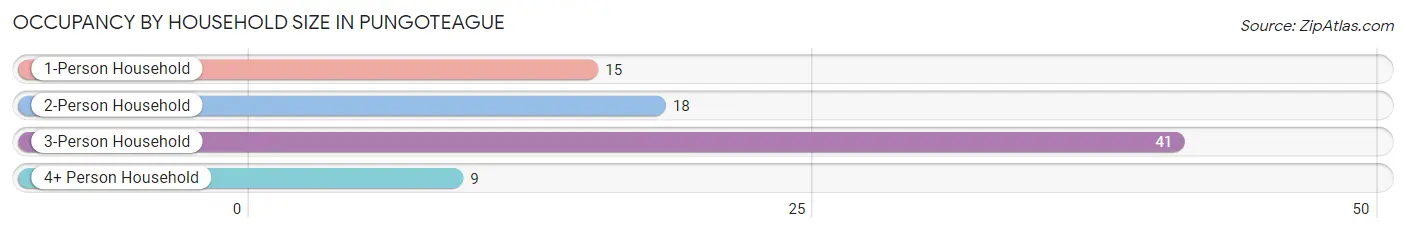
| Household Size | # Housing Units | % Housing Units |
| 1-Person Household | 15 | 18.1% |
| 2-Person Household | 18 | 21.7% |
| 3-Person Household | 41 | 49.4% |
| 4+ Person Household | 9 | 10.8% |
| Total Housing Units | 83 | 100.0% |
Occupancy by Ownership by Household Size in Pungoteague
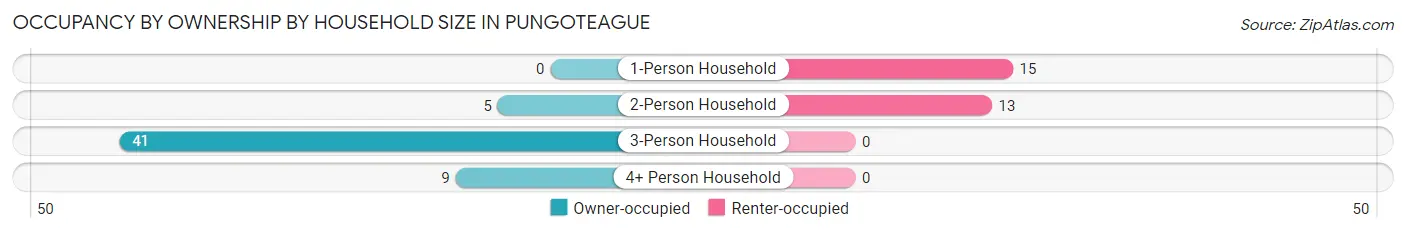
| Household Size | Owner-occupied | Renter-occupied |
| 1-Person Household | 0 (0.0%) | 15 (100.0%) |
| 2-Person Household | 5 (27.8%) | 13 (72.2%) |
| 3-Person Household | 41 (100.0%) | 0 (0.0%) |
| 4+ Person Household | 9 (100.0%) | 0 (0.0%) |
| Total Housing Units | 55 (66.3%) | 28 (33.7%) |
Occupancy by Educational Attainment in Pungoteague
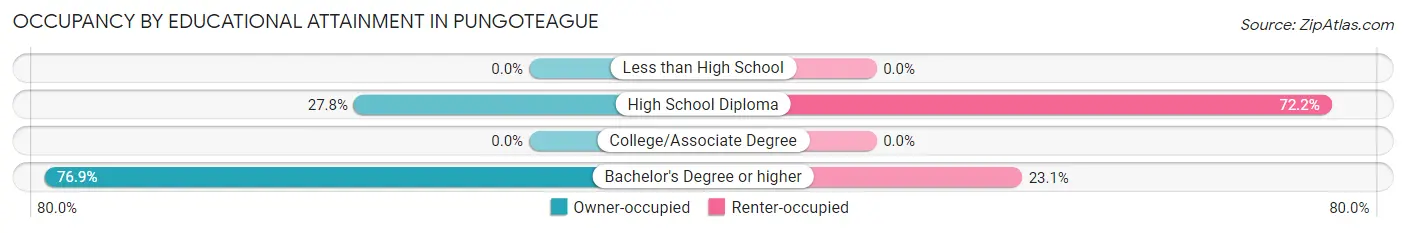
| Household Size | Owner-occupied | Renter-occupied |
| Less than High School | 0 (0.0%) | 0 (0.0%) |
| High School Diploma | 5 (27.8%) | 13 (72.2%) |
| College/Associate Degree | 0 (0.0%) | 0 (0.0%) |
| Bachelor's Degree or higher | 50 (76.9%) | 15 (23.1%) |
Occupancy by Age of Householder in Pungoteague
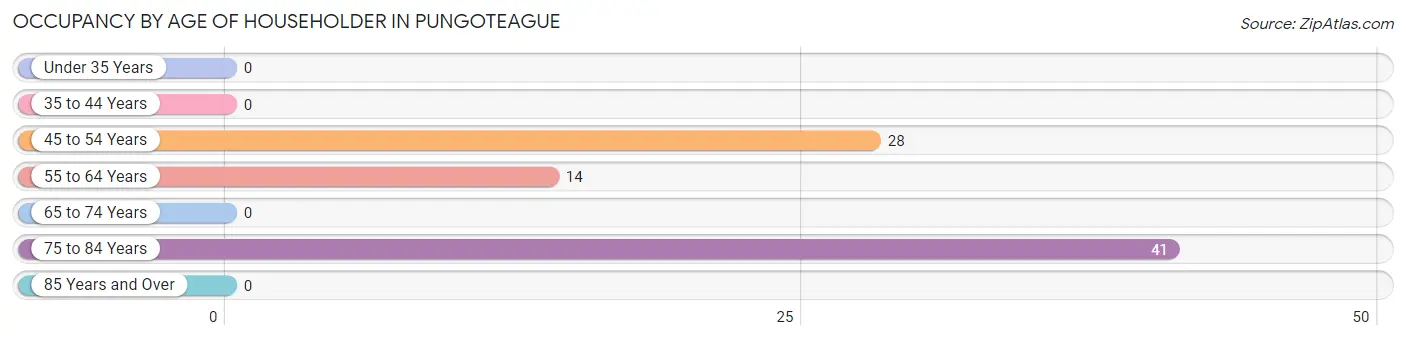
| Age Bracket | # Households | % Households |
| Under 35 Years | 0 | 0.0% |
| 35 to 44 Years | 0 | 0.0% |
| 45 to 54 Years | 28 | 33.7% |
| 55 to 64 Years | 14 | 16.9% |
| 65 to 74 Years | 0 | 0.0% |
| 75 to 84 Years | 41 | 49.4% |
| 85 Years and Over | 0 | 0.0% |
| Total | 83 | 100.0% |
Housing Finances in Pungoteague
Median Income by Occupancy in Pungoteague
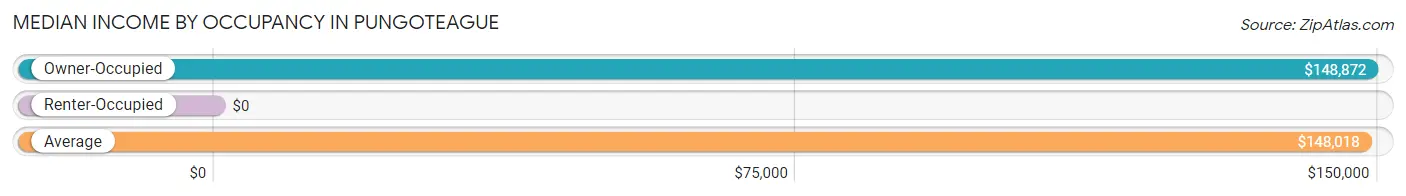
| Occupancy Type | # Households | Median Income |
| Owner-Occupied | 55 (66.3%) | $148,872 |
| Renter-Occupied | 28 (33.7%) | $0 |
| Average | 83 (100.0%) | $148,018 |
Occupancy by Householder Income Bracket in Pungoteague
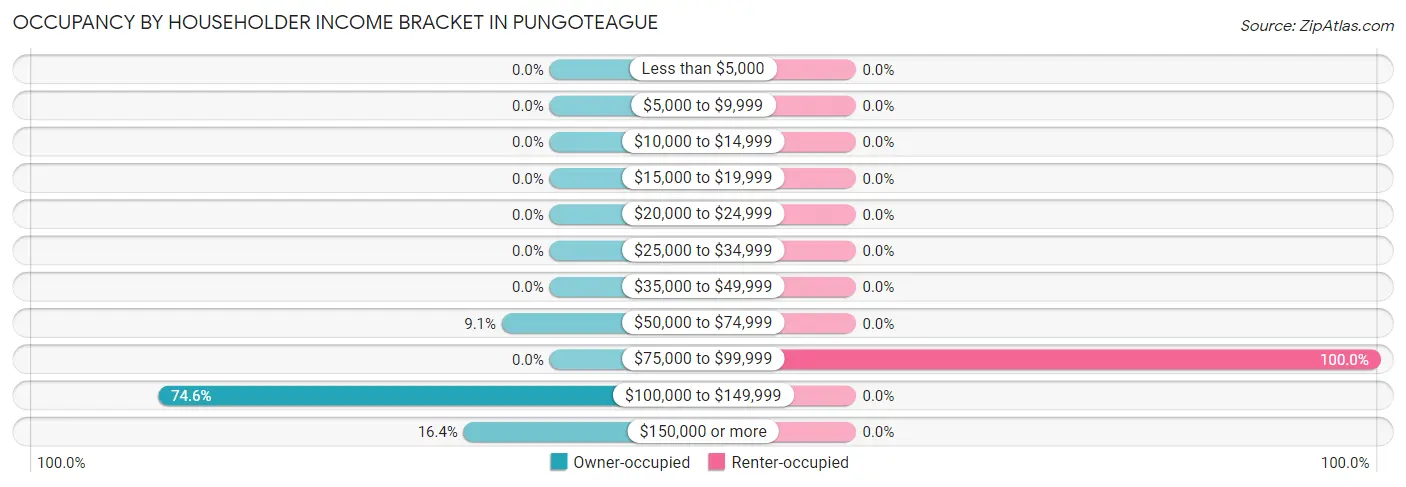
| Income Bracket | Owner-occupied | Renter-occupied |
| Less than $5,000 | 0 (0.0%) | 0 (0.0%) |
| $5,000 to $9,999 | 0 (0.0%) | 0 (0.0%) |
| $10,000 to $14,999 | 0 (0.0%) | 0 (0.0%) |
| $15,000 to $19,999 | 0 (0.0%) | 0 (0.0%) |
| $20,000 to $24,999 | 0 (0.0%) | 0 (0.0%) |
| $25,000 to $34,999 | 0 (0.0%) | 0 (0.0%) |
| $35,000 to $49,999 | 0 (0.0%) | 0 (0.0%) |
| $50,000 to $74,999 | 5 (9.1%) | 0 (0.0%) |
| $75,000 to $99,999 | 0 (0.0%) | 28 (100.0%) |
| $100,000 to $149,999 | 41 (74.6%) | 0 (0.0%) |
| $150,000 or more | 9 (16.4%) | 0 (0.0%) |
| Total | 55 (100.0%) | 28 (100.0%) |
Monthly Housing Cost Tiers in Pungoteague
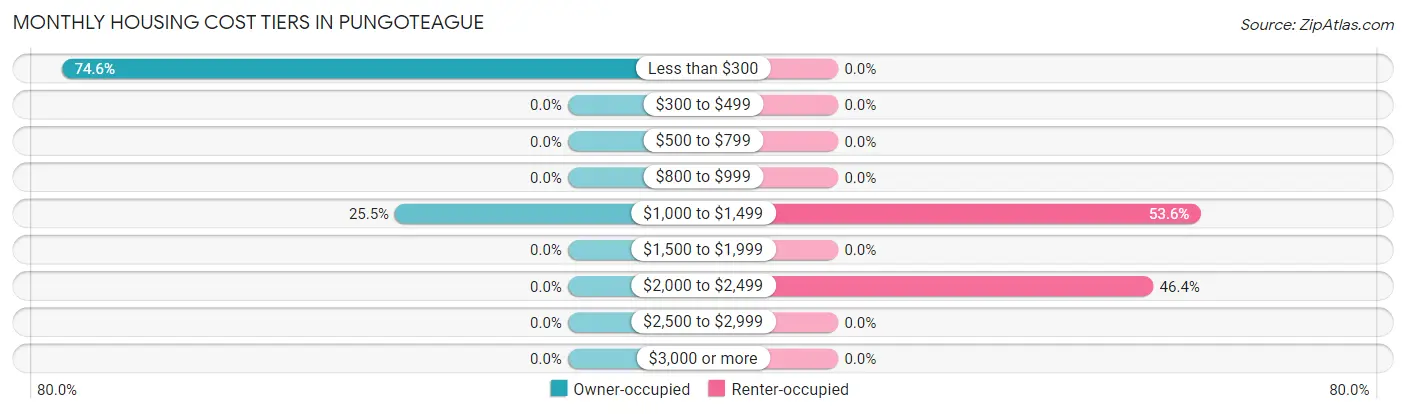
| Monthly Cost | Owner-occupied | Renter-occupied |
| Less than $300 | 41 (74.6%) | 0 (0.0%) |
| $300 to $499 | 0 (0.0%) | 0 (0.0%) |
| $500 to $799 | 0 (0.0%) | 0 (0.0%) |
| $800 to $999 | 0 (0.0%) | 0 (0.0%) |
| $1,000 to $1,499 | 14 (25.5%) | 15 (53.6%) |
| $1,500 to $1,999 | 0 (0.0%) | 0 (0.0%) |
| $2,000 to $2,499 | 0 (0.0%) | 13 (46.4%) |
| $2,500 to $2,999 | 0 (0.0%) | 0 (0.0%) |
| $3,000 or more | 0 (0.0%) | 0 (0.0%) |
| Total | 55 (100.0%) | 28 (100.0%) |
Physical Housing Characteristics in Pungoteague
Housing Structures in Pungoteague
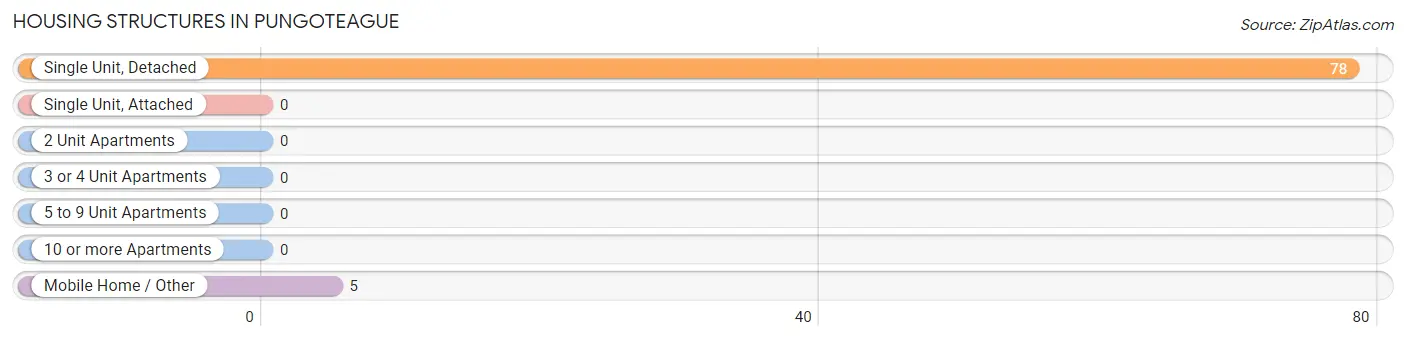
| Structure Type | # Housing Units | % Housing Units |
| Single Unit, Detached | 78 | 94.0% |
| Single Unit, Attached | 0 | 0.0% |
| 2 Unit Apartments | 0 | 0.0% |
| 3 or 4 Unit Apartments | 0 | 0.0% |
| 5 to 9 Unit Apartments | 0 | 0.0% |
| 10 or more Apartments | 0 | 0.0% |
| Mobile Home / Other | 5 | 6.0% |
| Total | 83 | 100.0% |
Housing Structures by Occupancy in Pungoteague
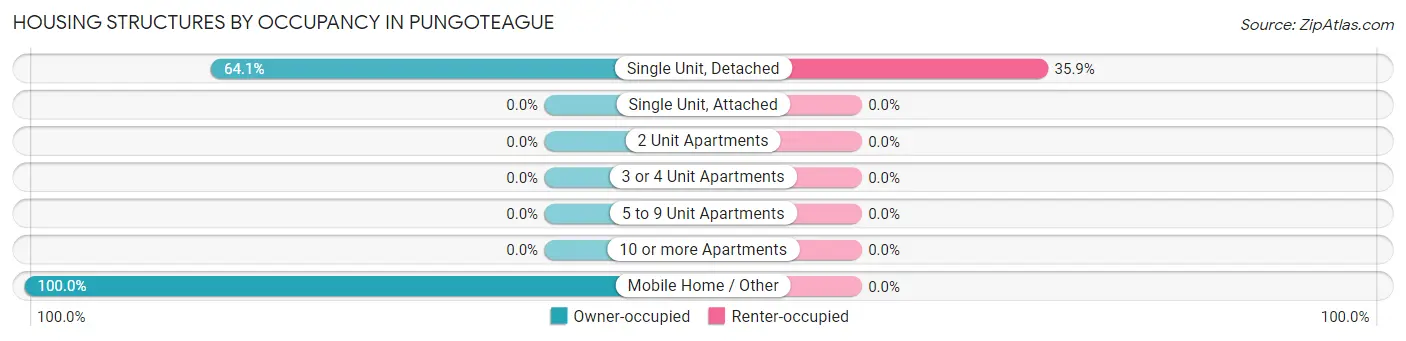
| Structure Type | Owner-occupied | Renter-occupied |
| Single Unit, Detached | 50 (64.1%) | 28 (35.9%) |
| Single Unit, Attached | 0 (0.0%) | 0 (0.0%) |
| 2 Unit Apartments | 0 (0.0%) | 0 (0.0%) |
| 3 or 4 Unit Apartments | 0 (0.0%) | 0 (0.0%) |
| 5 to 9 Unit Apartments | 0 (0.0%) | 0 (0.0%) |
| 10 or more Apartments | 0 (0.0%) | 0 (0.0%) |
| Mobile Home / Other | 5 (100.0%) | 0 (0.0%) |
| Total | 55 (66.3%) | 28 (33.7%) |
Housing Structures by Number of Rooms in Pungoteague
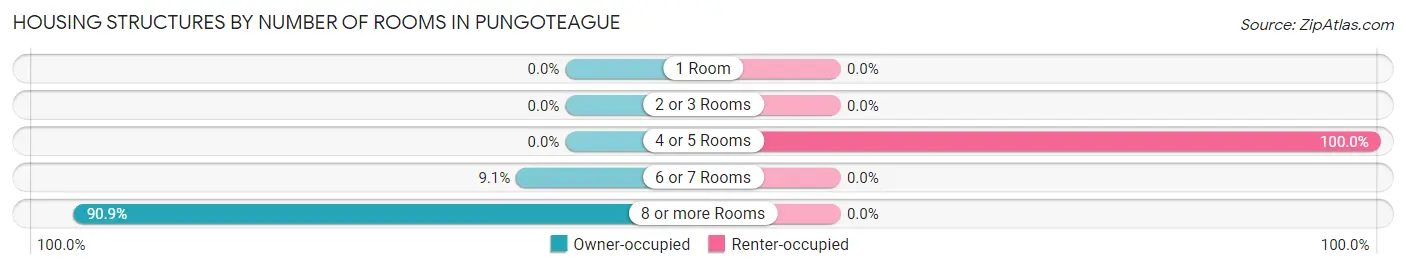
| Number of Rooms | Owner-occupied | Renter-occupied |
| 1 Room | 0 (0.0%) | 0 (0.0%) |
| 2 or 3 Rooms | 0 (0.0%) | 0 (0.0%) |
| 4 or 5 Rooms | 0 (0.0%) | 28 (100.0%) |
| 6 or 7 Rooms | 5 (9.1%) | 0 (0.0%) |
| 8 or more Rooms | 50 (90.9%) | 0 (0.0%) |
| Total | 55 (100.0%) | 28 (100.0%) |
Housing Structure by Heating Type in Pungoteague
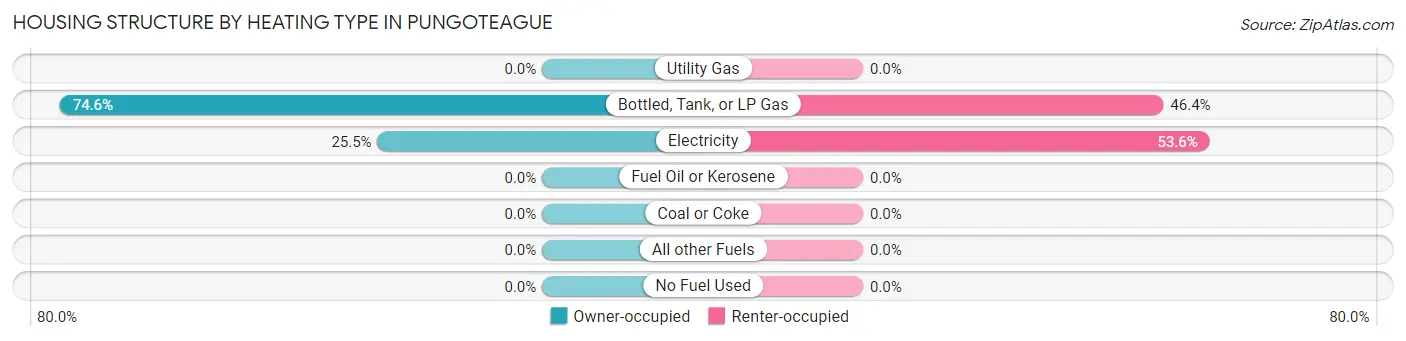
| Heating Type | Owner-occupied | Renter-occupied |
| Utility Gas | 0 (0.0%) | 0 (0.0%) |
| Bottled, Tank, or LP Gas | 41 (74.6%) | 13 (46.4%) |
| Electricity | 14 (25.5%) | 15 (53.6%) |
| Fuel Oil or Kerosene | 0 (0.0%) | 0 (0.0%) |
| Coal or Coke | 0 (0.0%) | 0 (0.0%) |
| All other Fuels | 0 (0.0%) | 0 (0.0%) |
| No Fuel Used | 0 (0.0%) | 0 (0.0%) |
| Total | 55 (100.0%) | 28 (100.0%) |
Household Vehicle Usage in Pungoteague
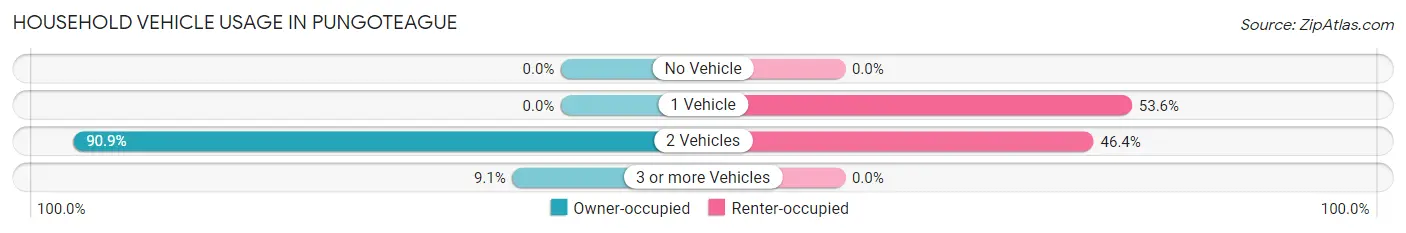
| Vehicles per Household | Owner-occupied | Renter-occupied |
| No Vehicle | 0 (0.0%) | 0 (0.0%) |
| 1 Vehicle | 0 (0.0%) | 15 (53.6%) |
| 2 Vehicles | 50 (90.9%) | 13 (46.4%) |
| 3 or more Vehicles | 5 (9.1%) | 0 (0.0%) |
| Total | 55 (100.0%) | 28 (100.0%) |
Real Estate & Mortgages in Pungoteague
Real Estate and Mortgage Overview in Pungoteague
| Characteristic | Without Mortgage | With Mortgage |
| Housing Units | 41 | 14 |
| Median Property Value | - | - |
| Median Household Income | - | - |
| Monthly Housing Costs | - | - |
| Real Estate Taxes | - | - |
Property Value by Mortgage Status in Pungoteague
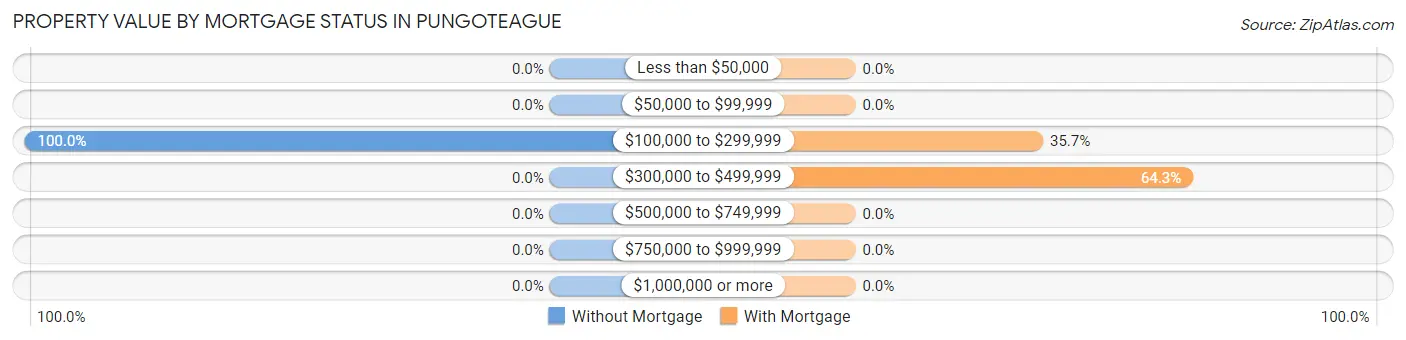
| Property Value | Without Mortgage | With Mortgage |
| Less than $50,000 | 0 (0.0%) | 0 (0.0%) |
| $50,000 to $99,999 | 0 (0.0%) | 0 (0.0%) |
| $100,000 to $299,999 | 41 (100.0%) | 5 (35.7%) |
| $300,000 to $499,999 | 0 (0.0%) | 9 (64.3%) |
| $500,000 to $749,999 | 0 (0.0%) | 0 (0.0%) |
| $750,000 to $999,999 | 0 (0.0%) | 0 (0.0%) |
| $1,000,000 or more | 0 (0.0%) | 0 (0.0%) |
| Total | 41 (100.0%) | 14 (100.0%) |
Household Income by Mortgage Status in Pungoteague
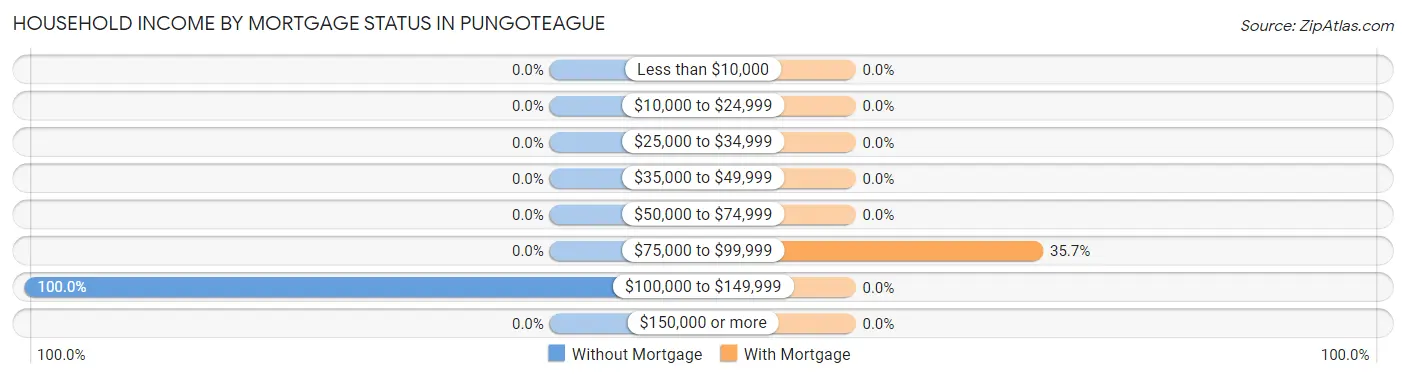
| Household Income | Without Mortgage | With Mortgage |
| Less than $10,000 | 0 (0.0%) | 0 (0.0%) |
| $10,000 to $24,999 | 0 (0.0%) | 0 (0.0%) |
| $25,000 to $34,999 | 0 (0.0%) | 0 (0.0%) |
| $35,000 to $49,999 | 0 (0.0%) | 0 (0.0%) |
| $50,000 to $74,999 | 0 (0.0%) | 0 (0.0%) |
| $75,000 to $99,999 | 0 (0.0%) | 5 (35.7%) |
| $100,000 to $149,999 | 41 (100.0%) | 0 (0.0%) |
| $150,000 or more | 0 (0.0%) | 0 (0.0%) |
| Total | 41 (100.0%) | 14 (100.0%) |
Property Value to Household Income Ratio in Pungoteague
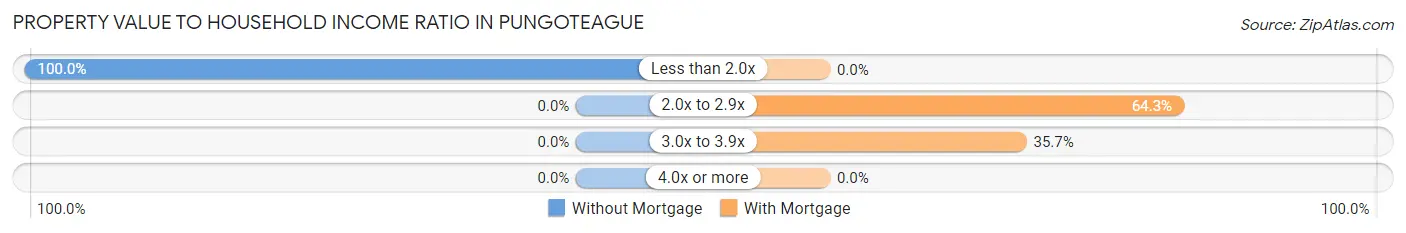
| Value-to-Income Ratio | Without Mortgage | With Mortgage |
| Less than 2.0x | 41 (100.0%) | 0 (0.0%) |
| 2.0x to 2.9x | 0 (0.0%) | 9 (64.3%) |
| 3.0x to 3.9x | 0 (0.0%) | 5 (35.7%) |
| 4.0x or more | 0 (0.0%) | 0 (0.0%) |
| Total | 41 (100.0%) | 14 (100.0%) |
Real Estate Taxes by Mortgage Status in Pungoteague
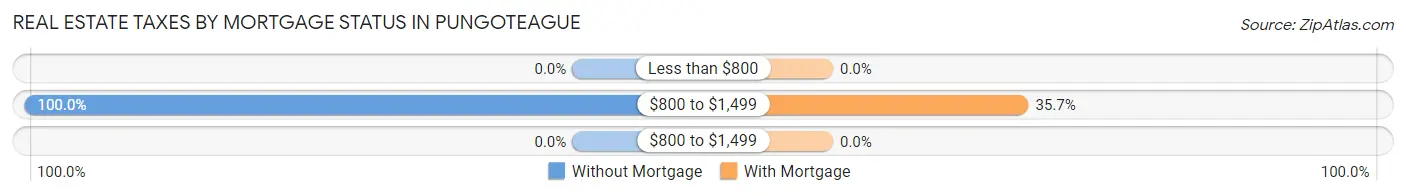
| Property Taxes | Without Mortgage | With Mortgage |
| Less than $800 | 0 (0.0%) | 0 (0.0%) |
| $800 to $1,499 | 41 (100.0%) | 5 (35.7%) |
| $800 to $1,499 | 0 (0.0%) | 0 (0.0%) |
| Total | 41 (100.0%) | 14 (100.0%) |
Health & Disability in Pungoteague
Health Insurance Coverage by Age in Pungoteague
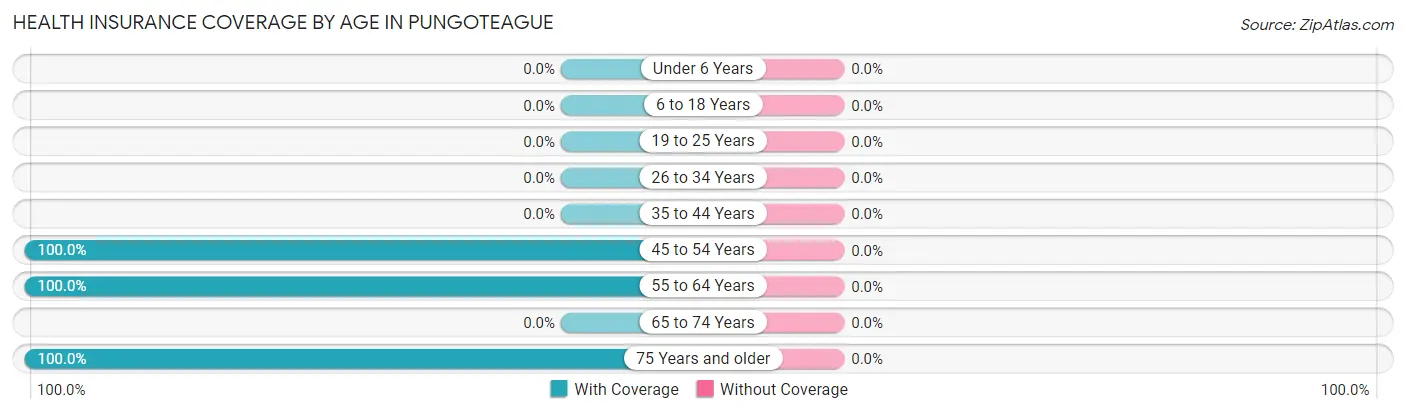
| Age Bracket | With Coverage | Without Coverage |
| Under 6 Years | 0 (0.0%) | 0 (0.0%) |
| 6 to 18 Years | 0 (0.0%) | 0 (0.0%) |
| 19 to 25 Years | 0 (0.0%) | 0 (0.0%) |
| 26 to 34 Years | 0 (0.0%) | 0 (0.0%) |
| 35 to 44 Years | 0 (0.0%) | 0 (0.0%) |
| 45 to 54 Years | 34 (100.0%) | 0 (0.0%) |
| 55 to 64 Years | 106 (100.0%) | 0 (0.0%) |
| 65 to 74 Years | 0 (0.0%) | 0 (0.0%) |
| 75 Years and older | 55 (100.0%) | 0 (0.0%) |
| Total | 195 (100.0%) | 0 (0.0%) |
Health Insurance Coverage by Citizenship Status in Pungoteague
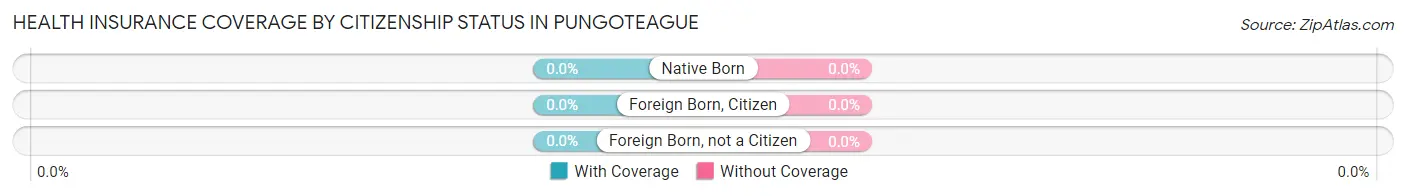
| Citizenship Status | With Coverage | Without Coverage |
| Native Born | 0 (0.0%) | 0 (0.0%) |
| Foreign Born, Citizen | 0 (0.0%) | 0 (0.0%) |
| Foreign Born, not a Citizen | 0 (0.0%) | 0 (0.0%) |
Health Insurance Coverage by Household Income in Pungoteague
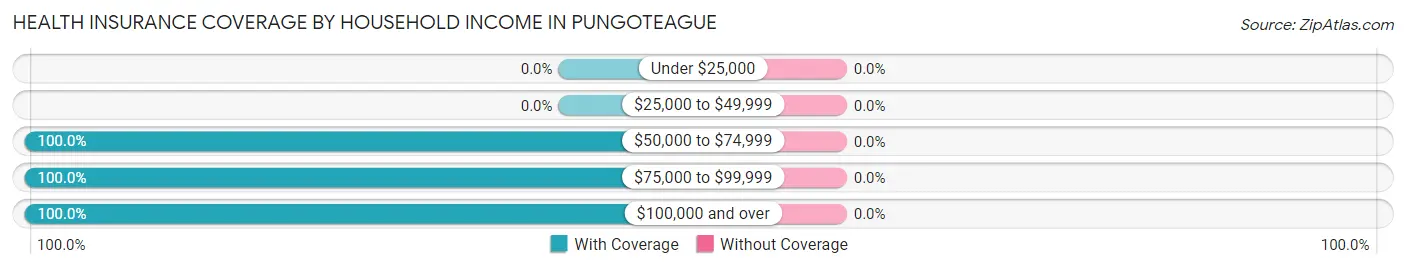
| Household Income | With Coverage | Without Coverage |
| Under $25,000 | 0 (0.0%) | 0 (0.0%) |
| $25,000 to $49,999 | 0 (0.0%) | 0 (0.0%) |
| $50,000 to $74,999 | 11 (100.0%) | 0 (0.0%) |
| $75,000 to $99,999 | 43 (100.0%) | 0 (0.0%) |
| $100,000 and over | 141 (100.0%) | 0 (0.0%) |
Public vs Private Health Insurance Coverage by Age in Pungoteague
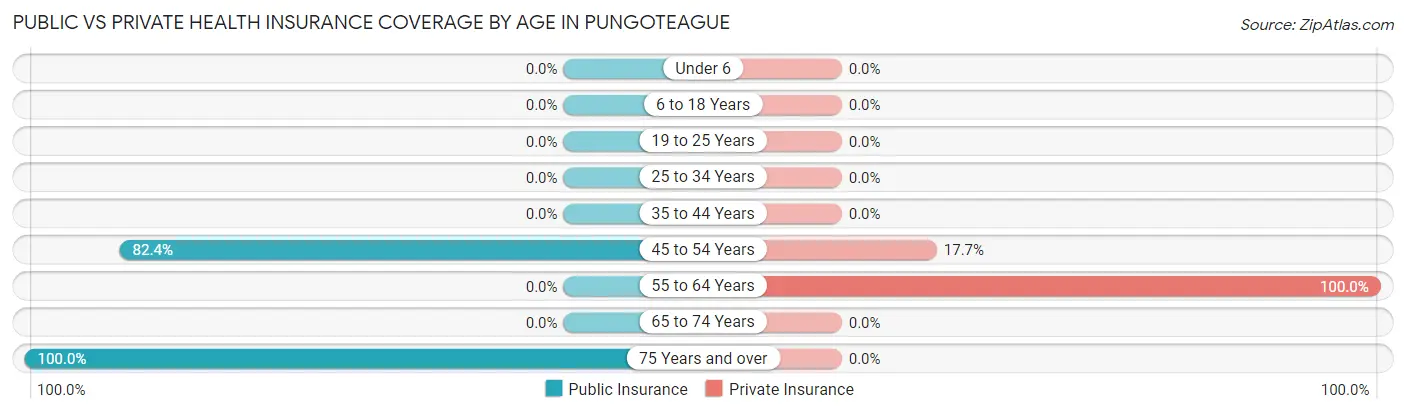
| Age Bracket | Public Insurance | Private Insurance |
| Under 6 | 0 (0.0%) | 0 (0.0%) |
| 6 to 18 Years | 0 (0.0%) | 0 (0.0%) |
| 19 to 25 Years | 0 (0.0%) | 0 (0.0%) |
| 25 to 34 Years | 0 (0.0%) | 0 (0.0%) |
| 35 to 44 Years | 0 (0.0%) | 0 (0.0%) |
| 45 to 54 Years | 28 (82.4%) | 6 (17.6%) |
| 55 to 64 Years | 0 (0.0%) | 106 (100.0%) |
| 65 to 74 Years | 0 (0.0%) | 0 (0.0%) |
| 75 Years and over | 55 (100.0%) | 0 (0.0%) |
| Total | 83 (42.6%) | 112 (57.4%) |
Disability Status by Sex by Age in Pungoteague
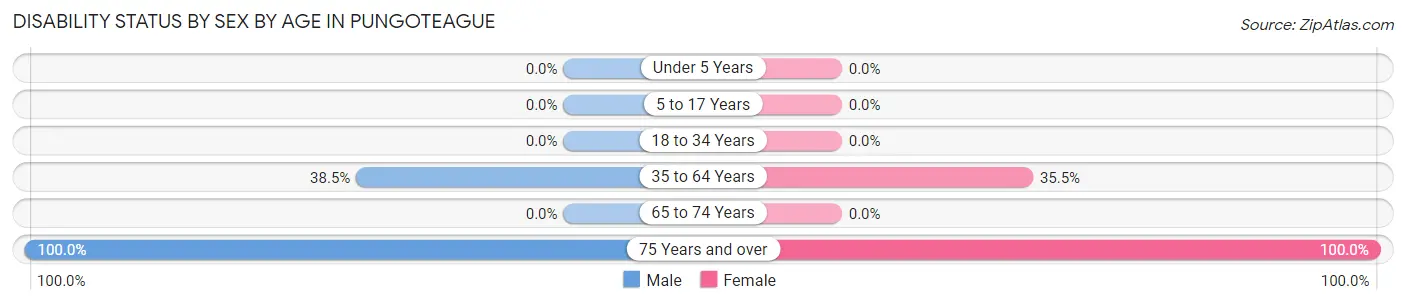
| Age Bracket | Male | Female |
| Under 5 Years | 0 (0.0%) | 0 (0.0%) |
| 5 to 17 Years | 0 (0.0%) | 0 (0.0%) |
| 18 to 34 Years | 0 (0.0%) | 0 (0.0%) |
| 35 to 64 Years | 30 (38.5%) | 22 (35.5%) |
| 65 to 74 Years | 0 (0.0%) | 0 (0.0%) |
| 75 Years and over | 7 (100.0%) | 48 (100.0%) |
Disability Class by Sex by Age in Pungoteague
Disability Class: Hearing Difficulty
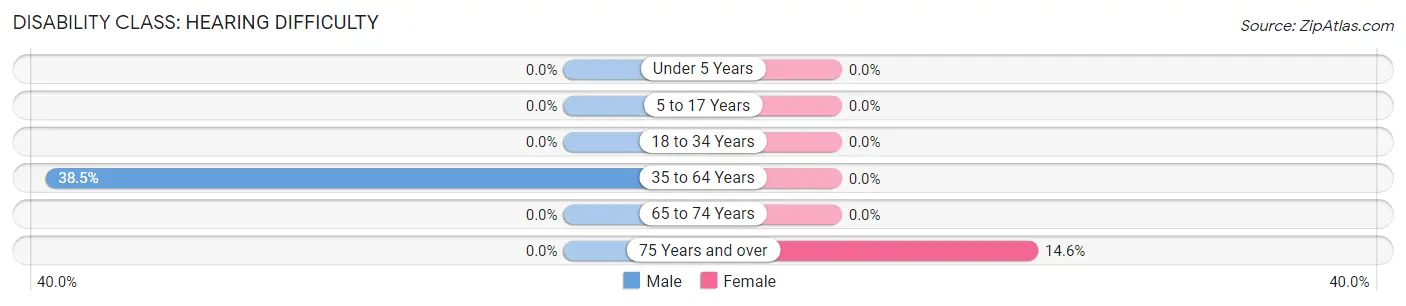
| Age Bracket | Male | Female |
| Under 5 Years | 0 (0.0%) | 0 (0.0%) |
| 5 to 17 Years | 0 (0.0%) | 0 (0.0%) |
| 18 to 34 Years | 0 (0.0%) | 0 (0.0%) |
| 35 to 64 Years | 30 (38.5%) | 0 (0.0%) |
| 65 to 74 Years | 0 (0.0%) | 0 (0.0%) |
| 75 Years and over | 0 (0.0%) | 7 (14.6%) |
Disability Class: Vision Difficulty
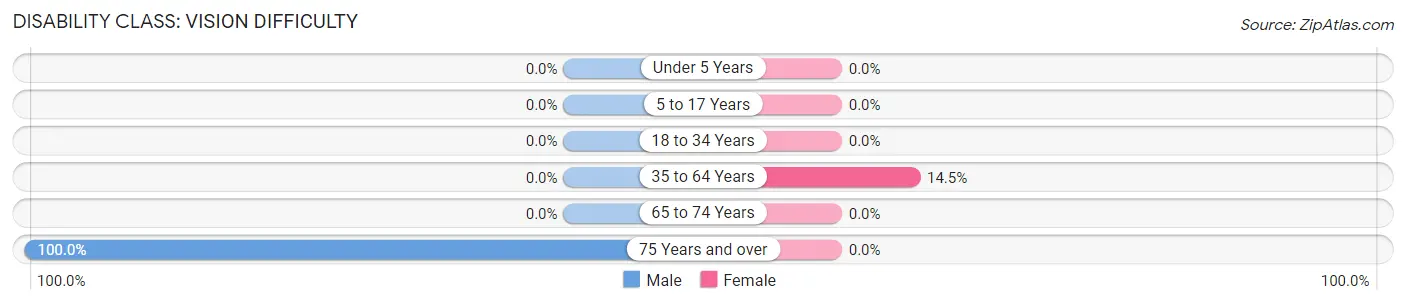
| Age Bracket | Male | Female |
| Under 5 Years | 0 (0.0%) | 0 (0.0%) |
| 5 to 17 Years | 0 (0.0%) | 0 (0.0%) |
| 18 to 34 Years | 0 (0.0%) | 0 (0.0%) |
| 35 to 64 Years | 0 (0.0%) | 9 (14.5%) |
| 65 to 74 Years | 0 (0.0%) | 0 (0.0%) |
| 75 Years and over | 7 (100.0%) | 0 (0.0%) |
Disability Class: Cognitive Difficulty
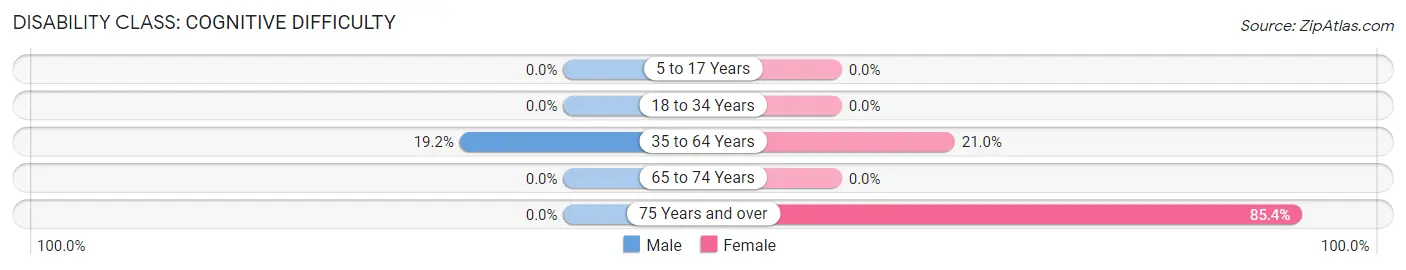
| Age Bracket | Male | Female |
| 5 to 17 Years | 0 (0.0%) | 0 (0.0%) |
| 18 to 34 Years | 0 (0.0%) | 0 (0.0%) |
| 35 to 64 Years | 15 (19.2%) | 13 (21.0%) |
| 65 to 74 Years | 0 (0.0%) | 0 (0.0%) |
| 75 Years and over | 0 (0.0%) | 41 (85.4%) |
Disability Class: Ambulatory Difficulty
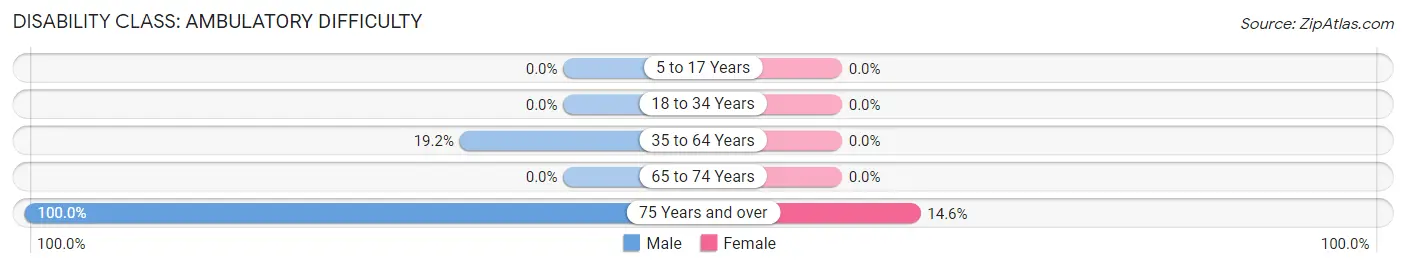
| Age Bracket | Male | Female |
| 5 to 17 Years | 0 (0.0%) | 0 (0.0%) |
| 18 to 34 Years | 0 (0.0%) | 0 (0.0%) |
| 35 to 64 Years | 15 (19.2%) | 0 (0.0%) |
| 65 to 74 Years | 0 (0.0%) | 0 (0.0%) |
| 75 Years and over | 7 (100.0%) | 7 (14.6%) |
Disability Class: Self-Care Difficulty
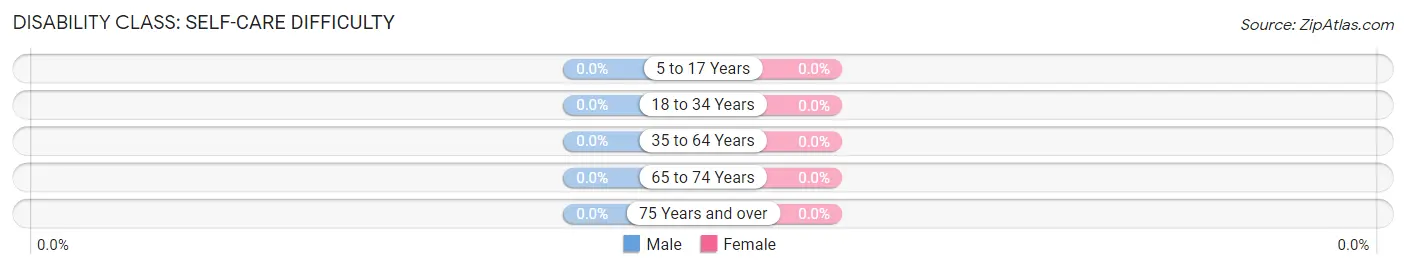
| Age Bracket | Male | Female |
| 5 to 17 Years | 0 (0.0%) | 0 (0.0%) |
| 18 to 34 Years | 0 (0.0%) | 0 (0.0%) |
| 35 to 64 Years | 0 (0.0%) | 0 (0.0%) |
| 65 to 74 Years | 0 (0.0%) | 0 (0.0%) |
| 75 Years and over | 0 (0.0%) | 0 (0.0%) |
Technology Access in Pungoteague
Computing Device Access in Pungoteague
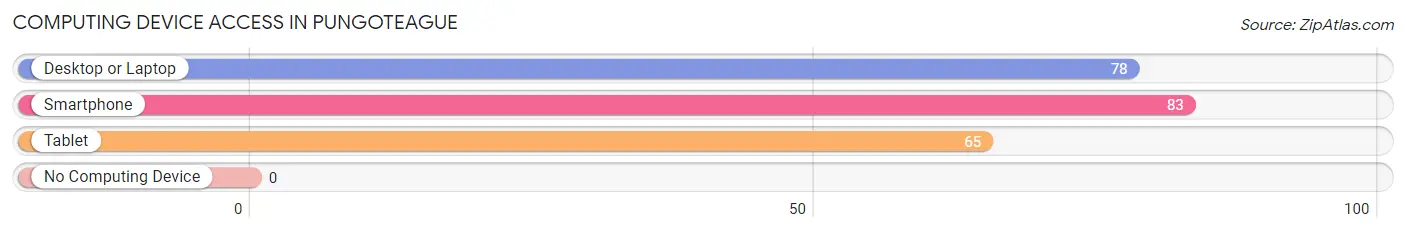
| Device Type | # Households | % Households |
| Desktop or Laptop | 78 | 94.0% |
| Smartphone | 83 | 100.0% |
| Tablet | 65 | 78.3% |
| No Computing Device | 0 | 0.0% |
| Total | 83 | 100.0% |
Internet Access in Pungoteague
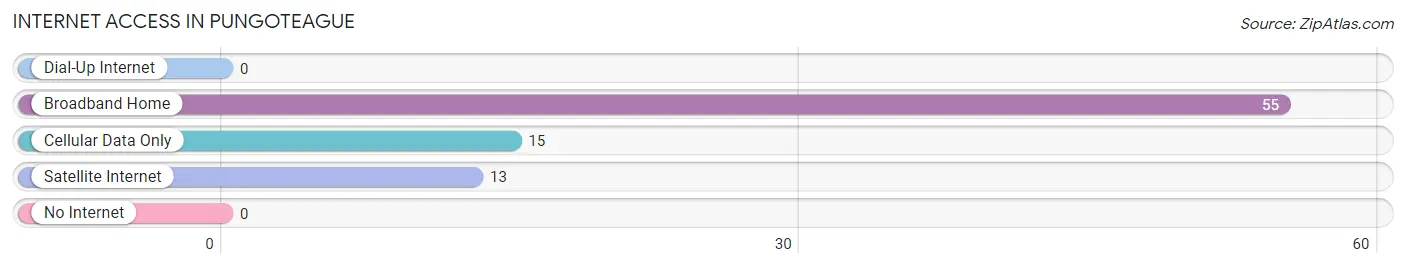
| Internet Type | # Households | % Households |
| Dial-Up Internet | 0 | 0.0% |
| Broadband Home | 55 | 66.3% |
| Cellular Data Only | 15 | 18.1% |
| Satellite Internet | 13 | 15.7% |
| No Internet | 0 | 0.0% |
| Total | 83 | 100.0% |
Pungoteague Summary
Pungoteague is an unincorporated community located in Accomack County, Virginia. It is situated on the Eastern Shore of Virginia, near the Chesapeake Bay. The community is located on the south side of the Pungoteague Creek, which is a tributary of the Chesapeake Bay. The population of Pungoteague was estimated to be around 1,000 people in 2020.
History
Pungoteague was first settled in the early 1700s by English colonists. The community was named after the Pungoteague Creek, which was named after the Native American tribe that lived in the area. The creek was used as a transportation route for goods and people, and the community grew around it.
In the late 1700s, Pungoteague was a thriving port town. It was a major hub for the shipping of goods and people between the Eastern Shore of Virginia and the Chesapeake Bay. The town was also a major center for the production of oysters, which were harvested from the nearby waters.
In the early 1800s, Pungoteague was a major stop on the Underground Railroad. Slaves escaping from the South would use the creek to travel to freedom in the North.
Geography
Pungoteague is located on the Eastern Shore of Virginia, near the Chesapeake Bay. The community is situated on the south side of the Pungoteague Creek, which is a tributary of the Chesapeake Bay. The creek is used for recreational activities such as fishing and boating.
The town is located in a rural area, surrounded by farmland and forests. The nearest major city is Norfolk, which is located about 50 miles to the north.
Economy
The economy of Pungoteague is largely based on agriculture and fishing. The town is home to several farms, which produce a variety of crops such as corn, soybeans, and wheat. The nearby waters are also a major source of seafood, such as oysters, crabs, and clams.
The town is also home to several small businesses, such as restaurants, convenience stores, and gas stations.
Demographics
The population of Pungoteague was estimated to be around 1,000 people in 2020. The town is predominantly white, with a small African American population. The median household income is around $45,000, and the median home value is around $150,000.
The town is served by the Accomack County Public Schools system. The nearest high school is located in nearby Onancock.
Conclusion
Pungoteague is a small, rural community located on the Eastern Shore of Virginia. The town has a long history, and it is still a major hub for the production of oysters and other seafood. The economy of the town is largely based on agriculture and fishing, and the population is predominantly white. The town is served by the Accomack County Public Schools system, and the median household income is around $45,000.
Common Questions
What is Per Capita Income in Pungoteague?
Per Capita income in Pungoteague is $51,745.
What is the Median Family Income in Pungoteague?
Median Family Income in Pungoteague is $148,476.
What is the Median Household income in Pungoteague?
Median Household Income in Pungoteague is $148,018.
What is Inequality or Gini Index in Pungoteague?
Inequality or Gini Index in Pungoteague is 0.16.
What is the Total Population of Pungoteague?
Total Population of Pungoteague is 195.
What is the Total Male Population of Pungoteague?
Total Male Population of Pungoteague is 85.
What is the Total Female Population of Pungoteague?
Total Female Population of Pungoteague is 110.
What is the Ratio of Males per 100 Females in Pungoteague?
There are 77.27 Males per 100 Females in Pungoteague.
What is the Ratio of Females per 100 Males in Pungoteague?
There are 129.41 Females per 100 Males in Pungoteague.
What is the Median Population Age in Pungoteague?
Median Population Age in Pungoteague is 61.0 Years.
What is the Average Family Size in Pungoteague
Average Family Size in Pungoteague is 2.6 People.
What is the Average Household Size in Pungoteague
Average Household Size in Pungoteague is 2.4 People.
How Large is the Labor Force in Pungoteague?
There are 80 People in the Labor Forcein in Pungoteague.
What is the Percentage of People in the Labor Force in Pungoteague?
41.0% of People are in the Labor Force in Pungoteague.