Southern Gateway, VA Map & Demographics
Southern Gateway Map
Southern Gateway Overview
$41,300
PER CAPITA INCOME
$85,714
AVG FAMILY INCOME
$79,278
AVG HOUSEHOLD INCOME
7.7%
WAGE / INCOME GAP [ % ]
92.3¢/ $1
WAGE / INCOME GAP [ $ ]
$4,577
FAMILY INCOME DEFICIT
0.31
INEQUALITY / GINI INDEX
2,551
TOTAL POPULATION
1,458
MALE POPULATION
1,093
FEMALE POPULATION
133.39
MALES / 100 FEMALES
74.97
FEMALES / 100 MALES
31.4
MEDIAN AGE
2.7
AVG FAMILY SIZE
2.3
AVG HOUSEHOLD SIZE
1,745
LABOR FORCE [ PEOPLE ]
84.7%
PERCENT IN LABOR FORCE
4.2%
UNEMPLOYMENT RATE
Income in Southern Gateway
Income Overview in Southern Gateway
Per Capita Income in Southern Gateway is $41,300, while median incomes of families and households are $85,714 and $79,278 respectively.
| Characteristic | Number | Measure |
| Per Capita Income | 2,551 | $41,300 |
| Median Family Income | 716 | $85,714 |
| Mean Family Income | 716 | $109,383 |
| Median Household Income | 1,106 | $79,278 |
| Mean Household Income | 1,106 | $100,838 |
| Income Deficit | 716 | $4,577 |
| Wage / Income Gap (%) | 2,551 | 7.69% |
| Wage / Income Gap ($) | 2,551 | 92.31¢ per $1 |
| Gini / Inequality Index | 2,551 | 0.31 |
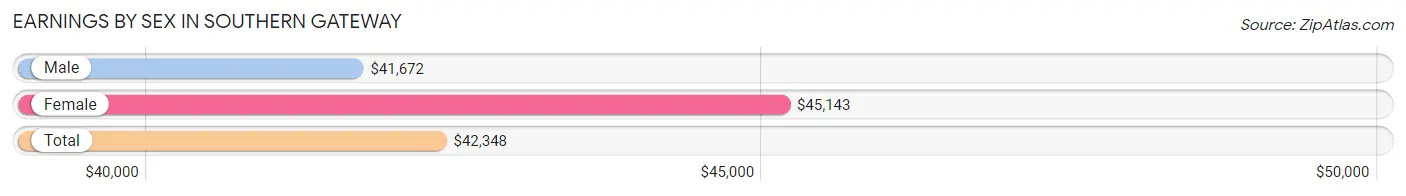
Earnings by Sex in Southern Gateway
Average Earnings in Southern Gateway are $42,348, $41,672 for men and $45,143 for women, a difference of 7.7%.
| Sex | Number | Average Earnings |
| Male | 1,033 (58.7%) | $41,672 |
| Female | 726 (41.3%) | $45,143 |
| Total | 1,759 (100.0%) | $42,348 |
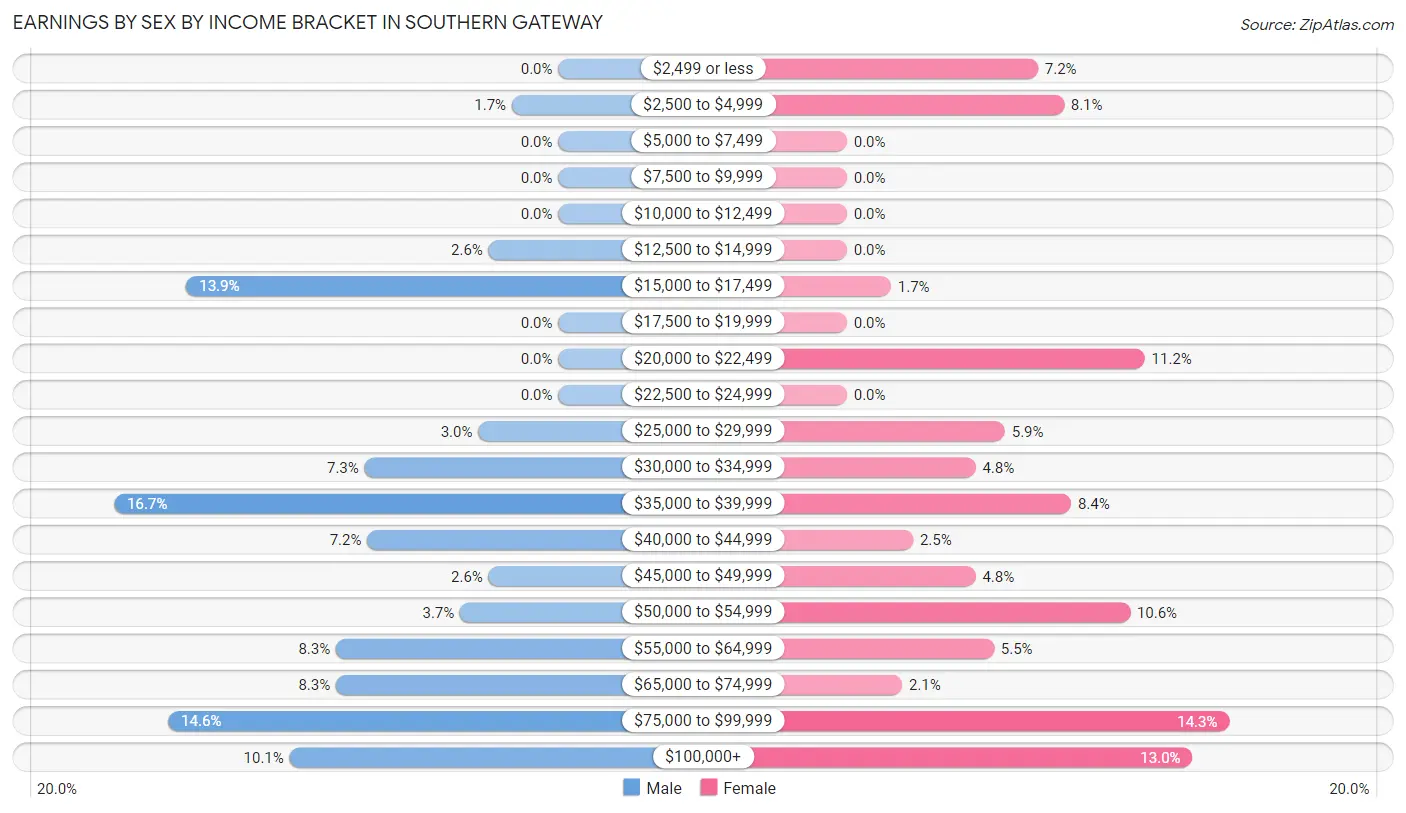
Earnings by Sex by Income Bracket in Southern Gateway
The most common earnings brackets in Southern Gateway are $35,000 to $39,999 for men (172 | 16.7%) and $75,000 to $99,999 for women (104 | 14.3%).
| Income | Male | Female |
| $2,499 or less | 0 (0.0%) | 52 (7.2%) |
| $2,500 to $4,999 | 18 (1.7%) | 59 (8.1%) |
| $5,000 to $7,499 | 0 (0.0%) | 0 (0.0%) |
| $7,500 to $9,999 | 0 (0.0%) | 0 (0.0%) |
| $10,000 to $12,499 | 0 (0.0%) | 0 (0.0%) |
| $12,500 to $14,999 | 27 (2.6%) | 0 (0.0%) |
| $15,000 to $17,499 | 144 (13.9%) | 12 (1.7%) |
| $17,500 to $19,999 | 0 (0.0%) | 0 (0.0%) |
| $20,000 to $22,499 | 0 (0.0%) | 81 (11.2%) |
| $22,500 to $24,999 | 0 (0.0%) | 0 (0.0%) |
| $25,000 to $29,999 | 31 (3.0%) | 43 (5.9%) |
| $30,000 to $34,999 | 75 (7.3%) | 35 (4.8%) |
| $35,000 to $39,999 | 172 (16.7%) | 61 (8.4%) |
| $40,000 to $44,999 | 74 (7.2%) | 18 (2.5%) |
| $45,000 to $49,999 | 27 (2.6%) | 35 (4.8%) |
| $50,000 to $54,999 | 38 (3.7%) | 77 (10.6%) |
| $55,000 to $64,999 | 86 (8.3%) | 40 (5.5%) |
| $65,000 to $74,999 | 86 (8.3%) | 15 (2.1%) |
| $75,000 to $99,999 | 151 (14.6%) | 104 (14.3%) |
| $100,000+ | 104 (10.1%) | 94 (13.0%) |
| Total | 1,033 (100.0%) | 726 (100.0%) |
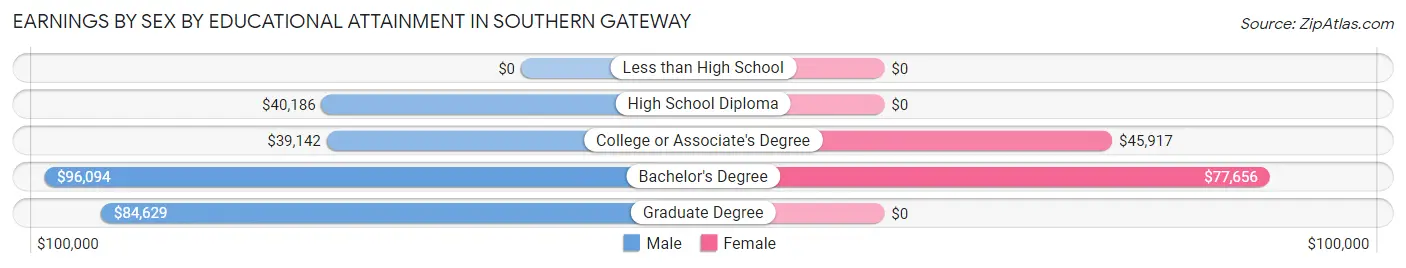
Earnings by Sex by Educational Attainment in Southern Gateway
Average earnings in Southern Gateway are $49,352 for men and $51,146 for women, a difference of 3.5%. Men with an educational attainment of bachelor's degree enjoy the highest average annual earnings of $96,094, while those with college or associate's degree education earn the least with $39,142. Women with an educational attainment of bachelor's degree earn the most with the average annual earnings of $77,656, while those with college or associate's degree education have the smallest earnings of $45,917.
| Educational Attainment | Male Income | Female Income |
| Less than High School | - | - |
| High School Diploma | $40,186 | $0 |
| College or Associate's Degree | $39,142 | $45,917 |
| Bachelor's Degree | $96,094 | $77,656 |
| Graduate Degree | $84,629 | $0 |
| Total | $49,352 | $51,146 |
Family Income in Southern Gateway
Family Income Brackets in Southern Gateway
According to the Southern Gateway family income data, there are 242 families falling into the $50,000 to $74,999 income range, which is the most common income bracket and makes up 33.8% of all families.
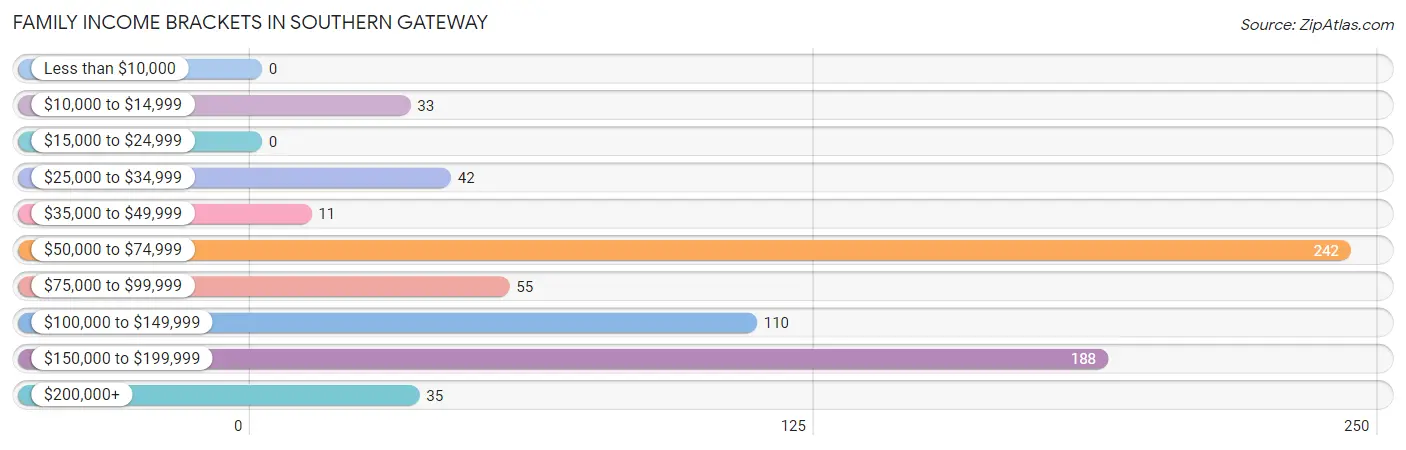
| Income Bracket | # Families | % Families |
| Less than $10,000 | 0 | 0.0% |
| $10,000 to $14,999 | 33 | 4.6% |
| $15,000 to $24,999 | 0 | 0.0% |
| $25,000 to $34,999 | 42 | 5.9% |
| $35,000 to $49,999 | 11 | 1.5% |
| $50,000 to $74,999 | 242 | 33.8% |
| $75,000 to $99,999 | 55 | 7.7% |
| $100,000 to $149,999 | 110 | 15.4% |
| $150,000 to $199,999 | 188 | 26.3% |
| $200,000+ | 35 | 4.9% |
Family Income by Famaliy Size in Southern Gateway
4-person families (67 | 9.4%) account for the highest median family income in Southern Gateway with $142,796 per family, while 4-person families (67 | 9.4%) have the highest median income of $35,699 per family member.
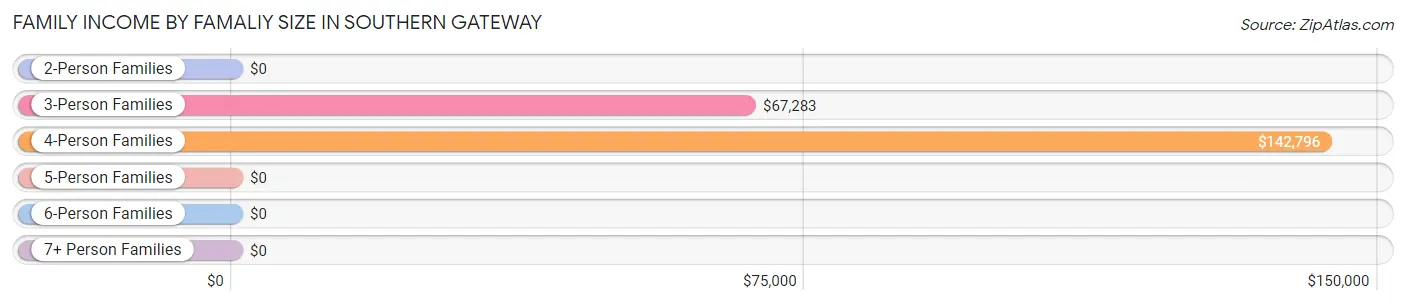
| Income Bracket | # Families | Median Income |
| 2-Person Families | 206 (28.8%) | $0 |
| 3-Person Families | 336 (46.9%) | $67,283 |
| 4-Person Families | 67 (9.4%) | $142,796 |
| 5-Person Families | 86 (12.0%) | $0 |
| 6-Person Families | 21 (2.9%) | $0 |
| 7+ Person Families | 0 (0.0%) | $0 |
| Total | 716 (100.0%) | $85,714 |
Family Income by Number of Earners in Southern Gateway
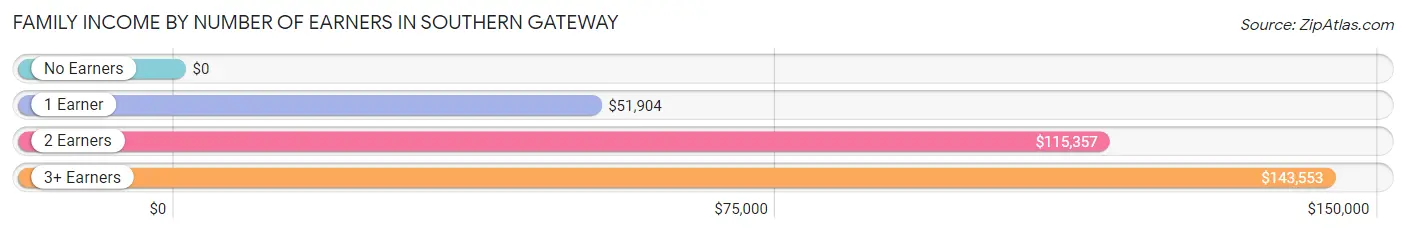
| Number of Earners | # Families | Median Income |
| No Earners | 33 (4.6%) | $0 |
| 1 Earner | 121 (16.9%) | $51,904 |
| 2 Earners | 448 (62.6%) | $115,357 |
| 3+ Earners | 114 (15.9%) | $143,553 |
| Total | 716 (100.0%) | $85,714 |
Household Income in Southern Gateway
Household Income Brackets in Southern Gateway
With 299 households falling in the category, the $50,000 to $74,999 income range is the most frequent in Southern Gateway, accounting for 27.0% of all households. In contrast, only 9 households (0.8%) fall into the $15,000 to $24,999 income bracket, making it the least populous group.
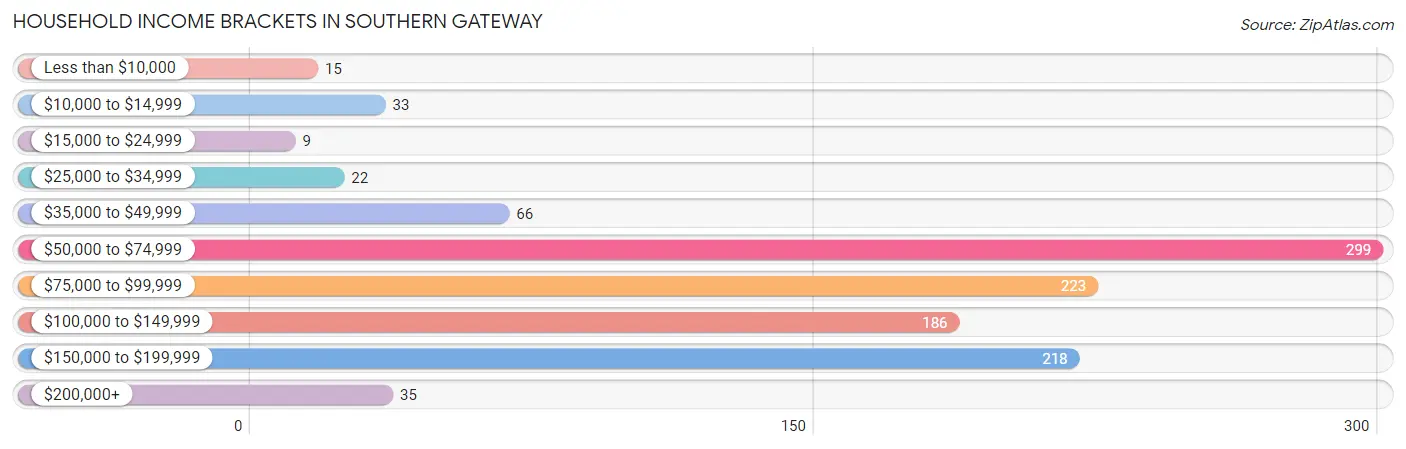
| Income Bracket | # Households | % Households |
| Less than $10,000 | 15 | 1.4% |
| $10,000 to $14,999 | 33 | 3.0% |
| $15,000 to $24,999 | 9 | 0.8% |
| $25,000 to $34,999 | 22 | 2.0% |
| $35,000 to $49,999 | 66 | 6.0% |
| $50,000 to $74,999 | 299 | 27.0% |
| $75,000 to $99,999 | 223 | 20.2% |
| $100,000 to $149,999 | 186 | 16.8% |
| $150,000 to $199,999 | 218 | 19.7% |
| $200,000+ | 35 | 3.2% |
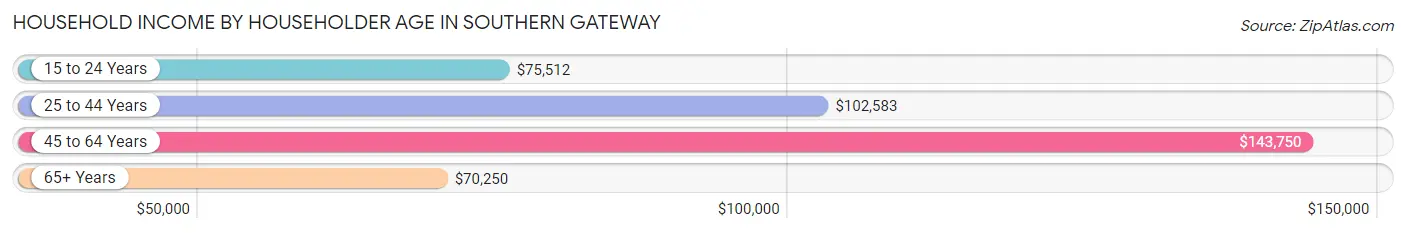
Household Income by Householder Age in Southern Gateway
The median household income in Southern Gateway is $79,278, with the highest median household income of $143,750 found in the 45 to 64 years age bracket for the primary householder. A total of 280 households (25.3%) fall into this category. Meanwhile, the 65+ years age bracket for the primary householder has the lowest median household income of $70,250, with 152 households (13.7%) in this group.
| Income Bracket | # Households | Median Income |
| 15 to 24 Years | 209 (18.9%) | $75,512 |
| 25 to 44 Years | 465 (42.0%) | $102,583 |
| 45 to 64 Years | 280 (25.3%) | $143,750 |
| 65+ Years | 152 (13.7%) | $70,250 |
| Total | 1,106 (100.0%) | $79,278 |
Poverty in Southern Gateway
Income Below Poverty by Sex and Age in Southern Gateway
With 6.6% poverty level for males and 22.8% for females among the residents of Southern Gateway, 6 to 11 year old males and under 5 year old females are the most vulnerable to poverty, with 51 males (56.0%) and 22 females (81.5%) in their respective age groups living below the poverty level.
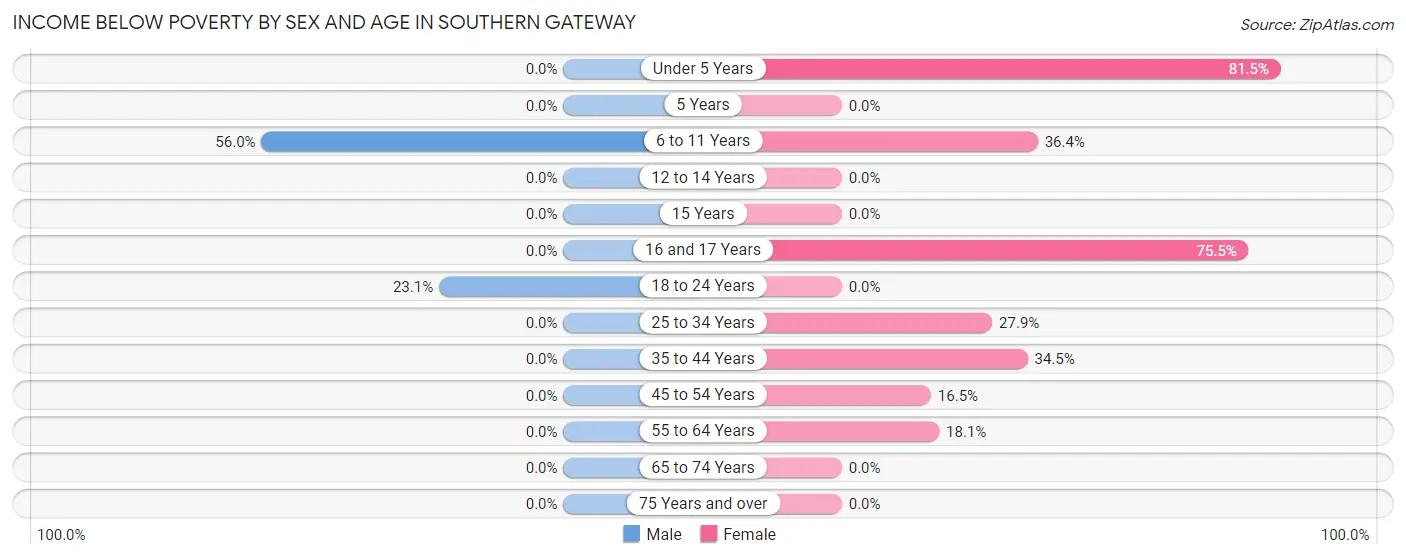
| Age Bracket | Male | Female |
| Under 5 Years | 0 (0.0%) | 22 (81.5%) |
| 5 Years | 0 (0.0%) | 0 (0.0%) |
| 6 to 11 Years | 51 (56.0%) | 40 (36.4%) |
| 12 to 14 Years | 0 (0.0%) | 0 (0.0%) |
| 15 Years | 0 (0.0%) | 0 (0.0%) |
| 16 and 17 Years | 0 (0.0%) | 37 (75.5%) |
| 18 to 24 Years | 45 (23.1%) | 0 (0.0%) |
| 25 to 34 Years | 0 (0.0%) | 60 (27.9%) |
| 35 to 44 Years | 0 (0.0%) | 50 (34.5%) |
| 45 to 54 Years | 0 (0.0%) | 22 (16.5%) |
| 55 to 64 Years | 0 (0.0%) | 15 (18.1%) |
| 65 to 74 Years | 0 (0.0%) | 0 (0.0%) |
| 75 Years and over | 0 (0.0%) | 0 (0.0%) |
| Total | 96 (6.6%) | 246 (22.8%) |
Income Above Poverty by Sex and Age in Southern Gateway
According to the poverty statistics in Southern Gateway, males aged under 5 years and females aged 12 to 14 years are the age groups that are most secure financially, with 100.0% of males and 100.0% of females in these age groups living above the poverty line.
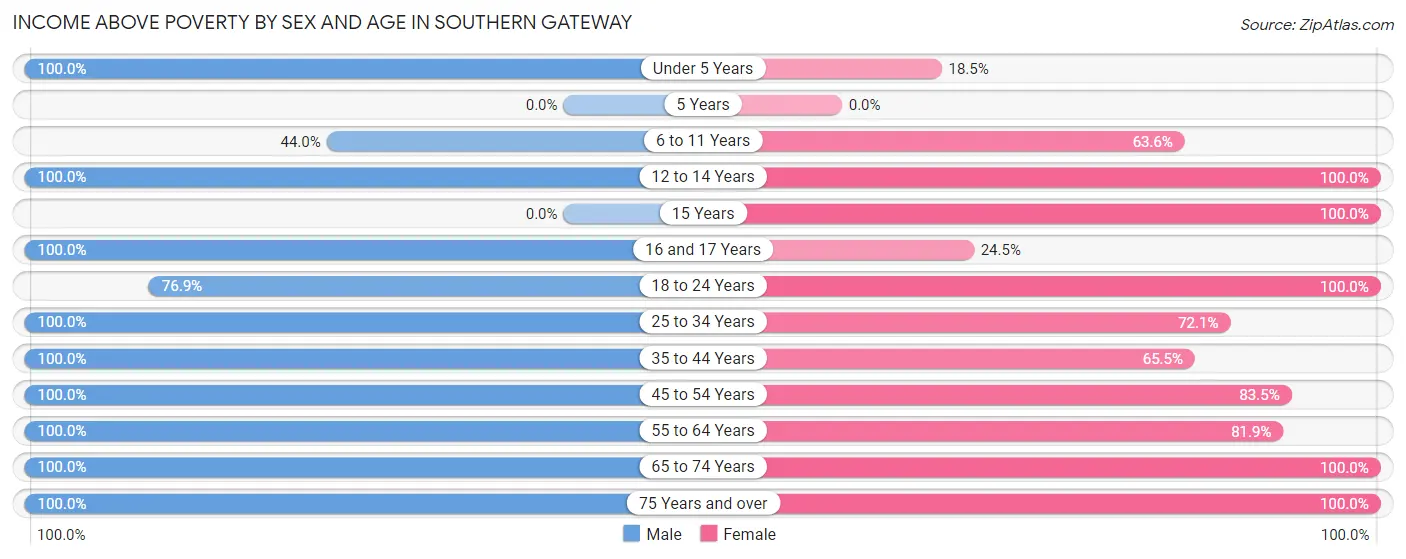
| Age Bracket | Male | Female |
| Under 5 Years | 161 (100.0%) | 5 (18.5%) |
| 5 Years | 0 (0.0%) | 0 (0.0%) |
| 6 to 11 Years | 40 (44.0%) | 70 (63.6%) |
| 12 to 14 Years | 11 (100.0%) | 76 (100.0%) |
| 15 Years | 0 (0.0%) | 15 (100.0%) |
| 16 and 17 Years | 44 (100.0%) | 12 (24.5%) |
| 18 to 24 Years | 150 (76.9%) | 170 (100.0%) |
| 25 to 34 Years | 371 (100.0%) | 155 (72.1%) |
| 35 to 44 Years | 247 (100.0%) | 95 (65.5%) |
| 45 to 54 Years | 168 (100.0%) | 111 (83.5%) |
| 55 to 64 Years | 62 (100.0%) | 68 (81.9%) |
| 65 to 74 Years | 59 (100.0%) | 44 (100.0%) |
| 75 Years and over | 49 (100.0%) | 12 (100.0%) |
| Total | 1,362 (93.4%) | 833 (77.2%) |
Income Below Poverty Among Married-Couple Families in Southern Gateway
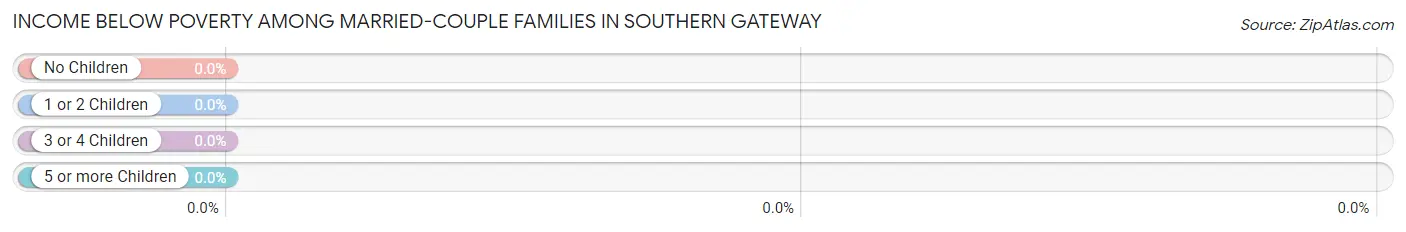
| Children | Above Poverty | Below Poverty |
| No Children | 132 (100.0%) | 0 (0.0%) |
| 1 or 2 Children | 305 (100.0%) | 0 (0.0%) |
| 3 or 4 Children | 64 (100.0%) | 0 (0.0%) |
| 5 or more Children | 0 (0.0%) | 0 (0.0%) |
| Total | 501 (100.0%) | 0 (0.0%) |
Income Below Poverty Among Single-Parent Households in Southern Gateway
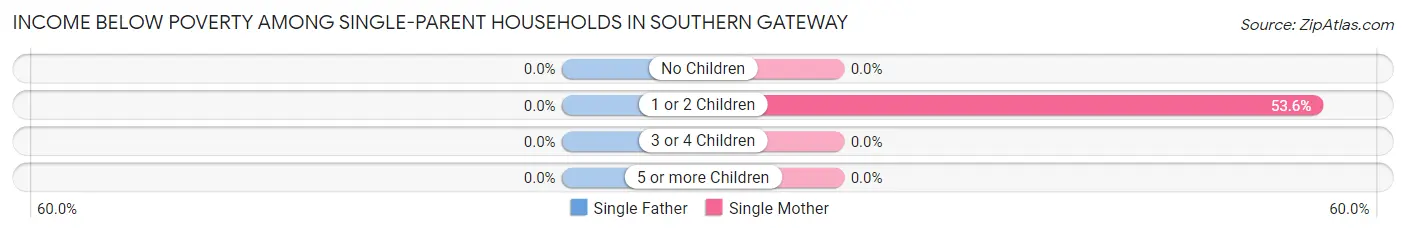
| Children | Single Father | Single Mother |
| No Children | 0 (0.0%) | 0 (0.0%) |
| 1 or 2 Children | 0 (0.0%) | 75 (53.6%) |
| 3 or 4 Children | 0 (0.0%) | 0 (0.0%) |
| 5 or more Children | 0 (0.0%) | 0 (0.0%) |
| Total | 0 (0.0%) | 75 (48.4%) |
Income Below Poverty Among Married-Couple vs Single-Parent Households in Southern Gateway
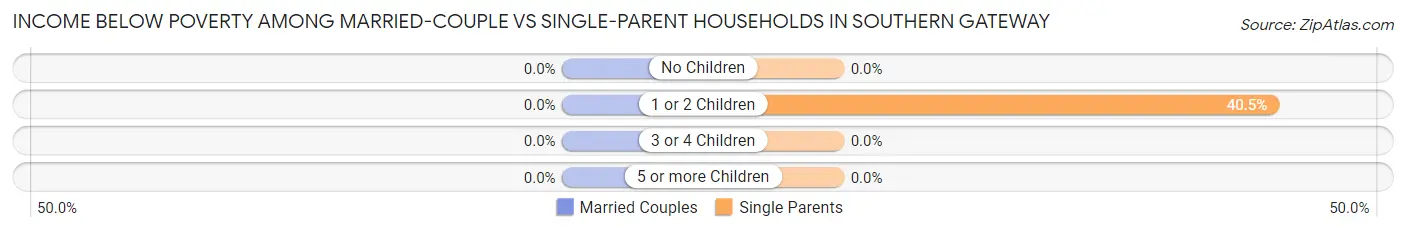
| Children | Married-Couple Families | Single-Parent Households |
| No Children | 0 (0.0%) | 0 (0.0%) |
| 1 or 2 Children | 0 (0.0%) | 75 (40.5%) |
| 3 or 4 Children | 0 (0.0%) | 0 (0.0%) |
| 5 or more Children | 0 (0.0%) | 0 (0.0%) |
| Total | 0 (0.0%) | 75 (34.9%) |
Race in Southern Gateway
The most populous races in Southern Gateway are White / Caucasian (1,211 | 47.5%), Black / African American (895 | 35.1%), and Hispanic or Latino (470 | 18.4%).
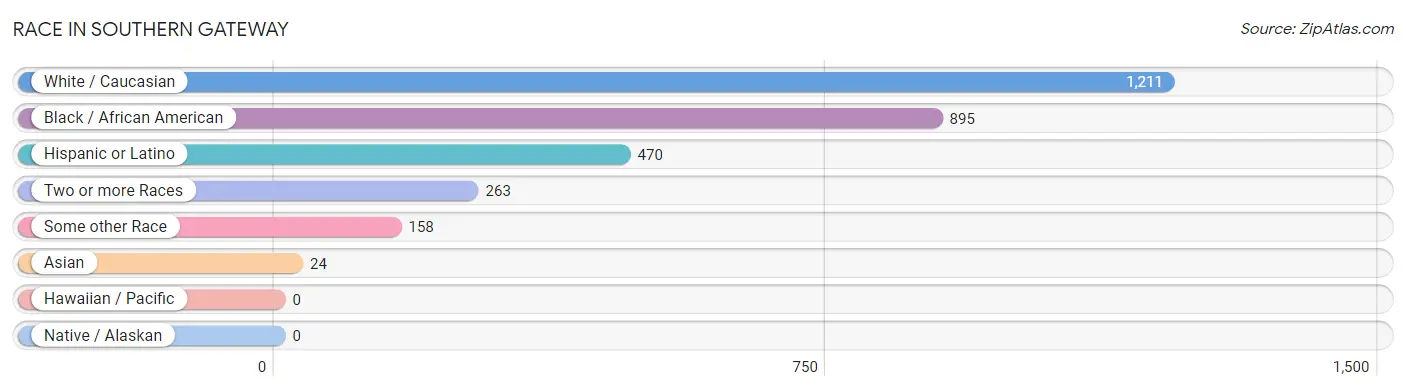
| Race | # Population | % Population |
| Asian | 24 | 0.9% |
| Black / African American | 895 | 35.1% |
| Hawaiian / Pacific | 0 | 0.0% |
| Hispanic or Latino | 470 | 18.4% |
| Native / Alaskan | 0 | 0.0% |
| White / Caucasian | 1,211 | 47.5% |
| Two or more Races | 263 | 10.3% |
| Some other Race | 158 | 6.2% |
| Total | 2,551 | 100.0% |
Ancestry in Southern Gateway
The most populous ancestries reported in Southern Gateway are English (279 | 10.9%), Subsaharan African (204 | 8.0%), American (197 | 7.7%), African (178 | 7.0%), and Italian (167 | 6.6%), together accounting for 40.2% of all Southern Gateway residents.
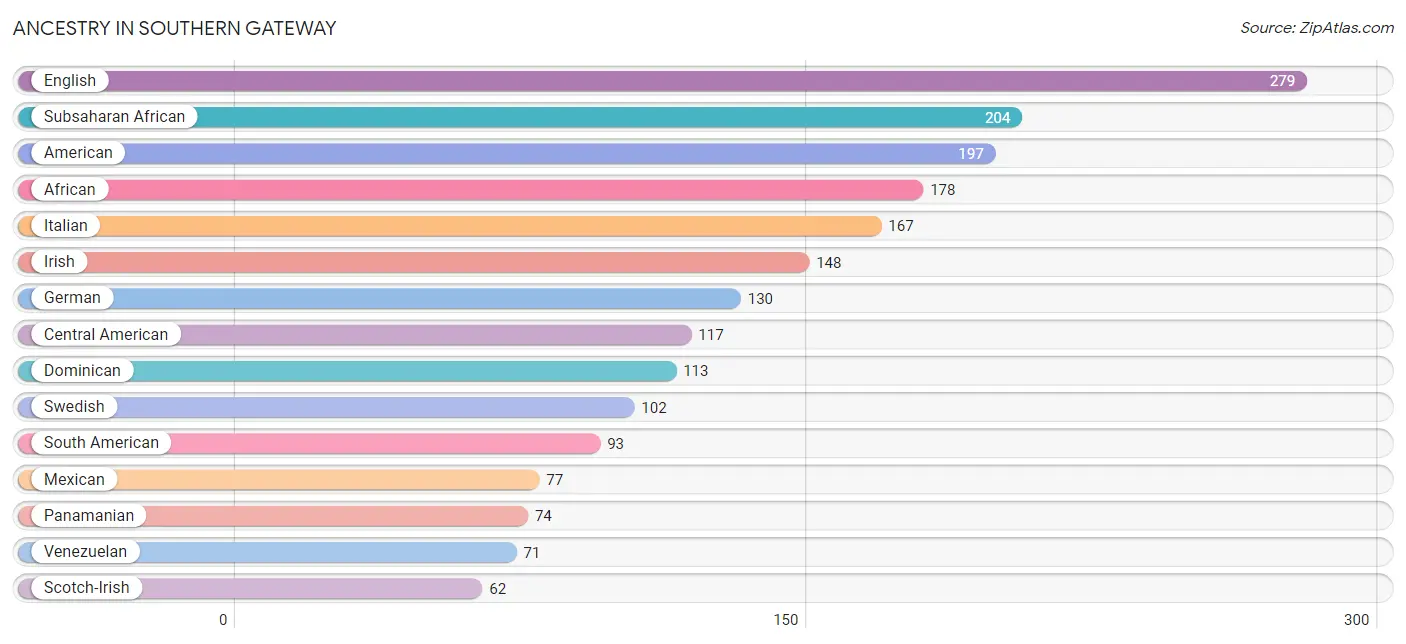
| Ancestry | # Population | % Population |
| African | 178 | 7.0% |
| American | 197 | 7.7% |
| Barbadian | 37 | 1.5% |
| Burmese | 24 | 0.9% |
| Central American | 117 | 4.6% |
| Colombian | 22 | 0.9% |
| Cuban | 32 | 1.3% |
| Dominican | 113 | 4.4% |
| English | 279 | 10.9% |
| French | 60 | 2.4% |
| German | 130 | 5.1% |
| Irish | 148 | 5.8% |
| Italian | 167 | 6.6% |
| Jamaican | 34 | 1.3% |
| Latvian | 12 | 0.5% |
| Mexican | 77 | 3.0% |
| Nicaraguan | 18 | 0.7% |
| Nigerian | 26 | 1.0% |
| Northern European | 8 | 0.3% |
| Panamanian | 74 | 2.9% |
| Puerto Rican | 38 | 1.5% |
| Russian | 48 | 1.9% |
| Salvadoran | 25 | 1.0% |
| Scotch-Irish | 62 | 2.4% |
| South American | 93 | 3.6% |
| Subsaharan African | 204 | 8.0% |
| Swedish | 102 | 4.0% |
| Venezuelan | 71 | 2.8% |
| Welsh | 10 | 0.4% | View All 29 Rows |
Immigrants in Southern Gateway
The most numerous immigrant groups reported in Southern Gateway came from Africa (252 | 9.9%), Western Africa (252 | 9.9%), Ghana (108 | 4.2%), Latin America (99 | 3.9%), and Caribbean (56 | 2.2%), together accounting for 30.1% of all Southern Gateway residents.
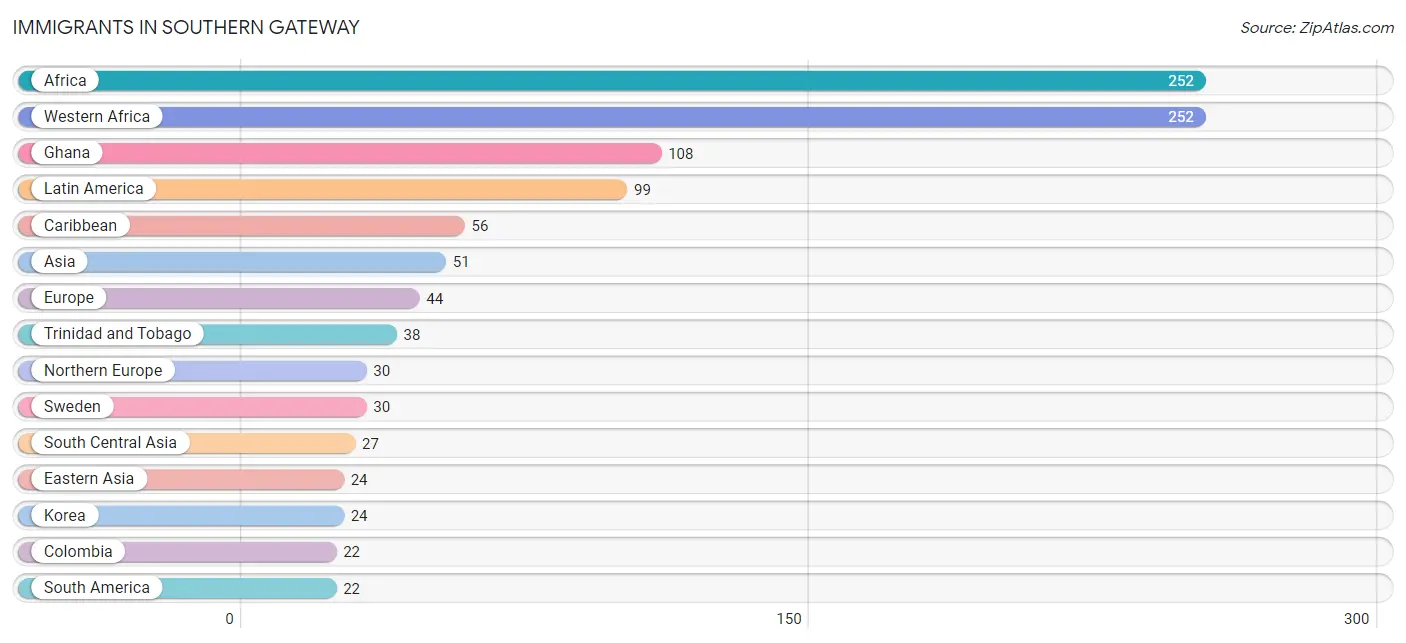
| Immigration Origin | # Population | % Population |
| Africa | 252 | 9.9% |
| Asia | 51 | 2.0% |
| Caribbean | 56 | 2.2% |
| Central America | 21 | 0.8% |
| Colombia | 22 | 0.9% |
| Eastern Asia | 24 | 0.9% |
| Eastern Europe | 14 | 0.5% |
| Europe | 44 | 1.7% |
| Ghana | 108 | 4.2% |
| Jamaica | 18 | 0.7% |
| Korea | 24 | 0.9% |
| Latin America | 99 | 3.9% |
| Nicaragua | 21 | 0.8% |
| Northern Europe | 30 | 1.2% |
| Russia | 14 | 0.5% |
| South America | 22 | 0.9% |
| South Central Asia | 27 | 1.1% |
| Sweden | 30 | 1.2% |
| Trinidad and Tobago | 38 | 1.5% |
| Western Africa | 252 | 9.9% | View All 20 Rows |
Sex and Age in Southern Gateway
Sex and Age in Southern Gateway
The most populous age groups in Southern Gateway are 25 to 29 Years (217 | 14.9%) for men and 20 to 24 Years (170 | 15.5%) for women.
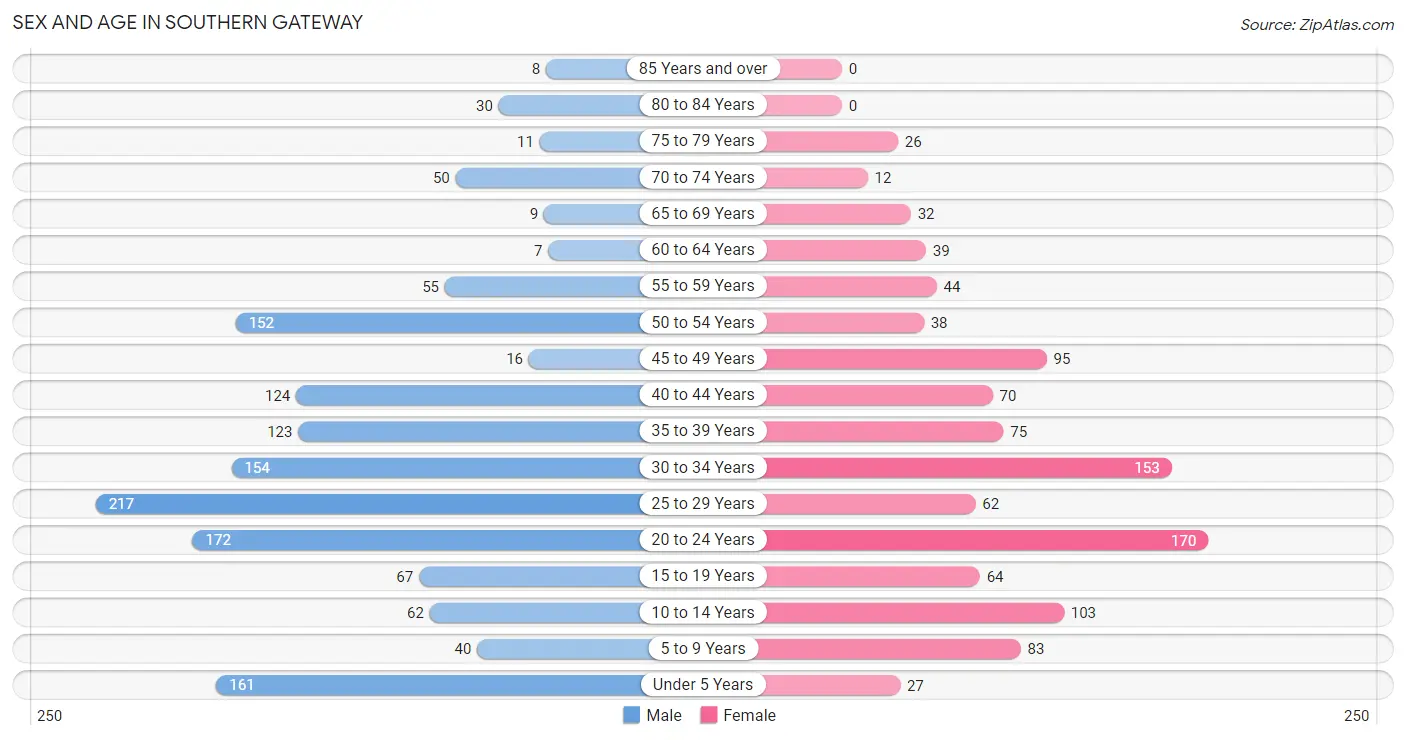
| Age Bracket | Male | Female |
| Under 5 Years | 161 (11.0%) | 27 (2.5%) |
| 5 to 9 Years | 40 (2.7%) | 83 (7.6%) |
| 10 to 14 Years | 62 (4.3%) | 103 (9.4%) |
| 15 to 19 Years | 67 (4.6%) | 64 (5.9%) |
| 20 to 24 Years | 172 (11.8%) | 170 (15.5%) |
| 25 to 29 Years | 217 (14.9%) | 62 (5.7%) |
| 30 to 34 Years | 154 (10.6%) | 153 (14.0%) |
| 35 to 39 Years | 123 (8.4%) | 75 (6.9%) |
| 40 to 44 Years | 124 (8.5%) | 70 (6.4%) |
| 45 to 49 Years | 16 (1.1%) | 95 (8.7%) |
| 50 to 54 Years | 152 (10.4%) | 38 (3.5%) |
| 55 to 59 Years | 55 (3.8%) | 44 (4.0%) |
| 60 to 64 Years | 7 (0.5%) | 39 (3.6%) |
| 65 to 69 Years | 9 (0.6%) | 32 (2.9%) |
| 70 to 74 Years | 50 (3.4%) | 12 (1.1%) |
| 75 to 79 Years | 11 (0.7%) | 26 (2.4%) |
| 80 to 84 Years | 30 (2.1%) | 0 (0.0%) |
| 85 Years and over | 8 (0.5%) | 0 (0.0%) |
| Total | 1,458 (100.0%) | 1,093 (100.0%) |
Families and Households in Southern Gateway
Median Family Size in Southern Gateway
The median family size in Southern Gateway is 2.73 persons per family, with single female/mother families (155 | 21.6%) accounting for the largest median family size of 2.94 persons per family. On the other hand, married-couple families (501 | 70.0%) represent the smallest median family size with 2.67 persons per family.
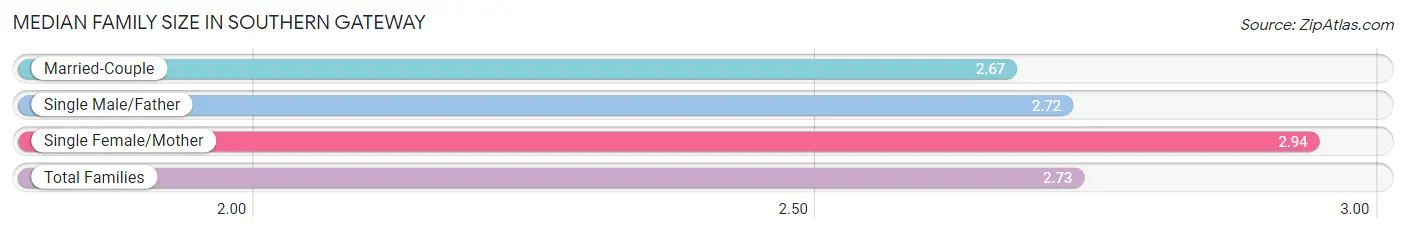
| Family Type | # Families | Family Size |
| Married-Couple | 501 (70.0%) | 2.67 |
| Single Male/Father | 60 (8.4%) | 2.72 |
| Single Female/Mother | 155 (21.6%) | 2.94 |
| Total Families | 716 (100.0%) | 2.73 |
Median Household Size in Southern Gateway
The median household size in Southern Gateway is 2.29 persons per household, with single female/mother households (155 | 14.0%) accounting for the largest median household size of 3.15 persons per household. non-family households (390 | 35.3%) represent the smallest median household size with 1.37 persons per household.
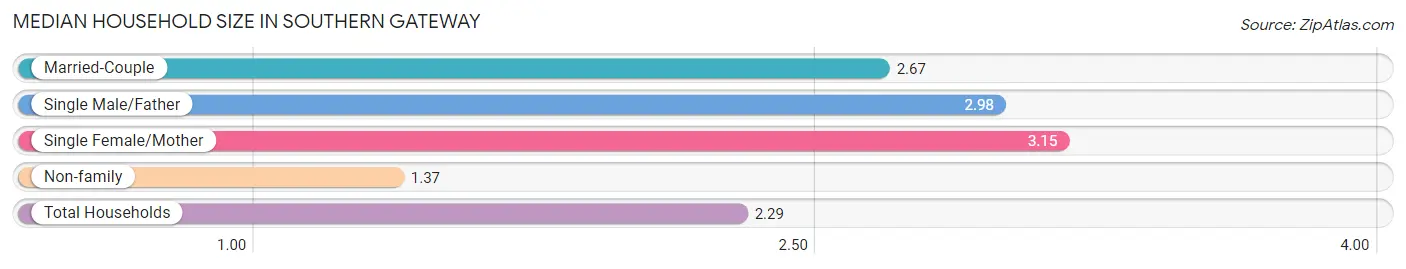
| Household Type | # Households | Household Size |
| Married-Couple | 501 (45.3%) | 2.67 |
| Single Male/Father | 60 (5.4%) | 2.98 |
| Single Female/Mother | 155 (14.0%) | 3.15 |
| Non-family | 390 (35.3%) | 1.37 |
| Total Households | 1,106 (100.0%) | 2.29 |
Household Size by Marriage Status in Southern Gateway
Out of a total of 1,106 households in Southern Gateway, 716 (64.7%) are family households, while 390 (35.3%) are nonfamily households. The most numerous type of family households are 3-person households, comprising 351, and the most common type of nonfamily households are 1-person households, comprising 299.
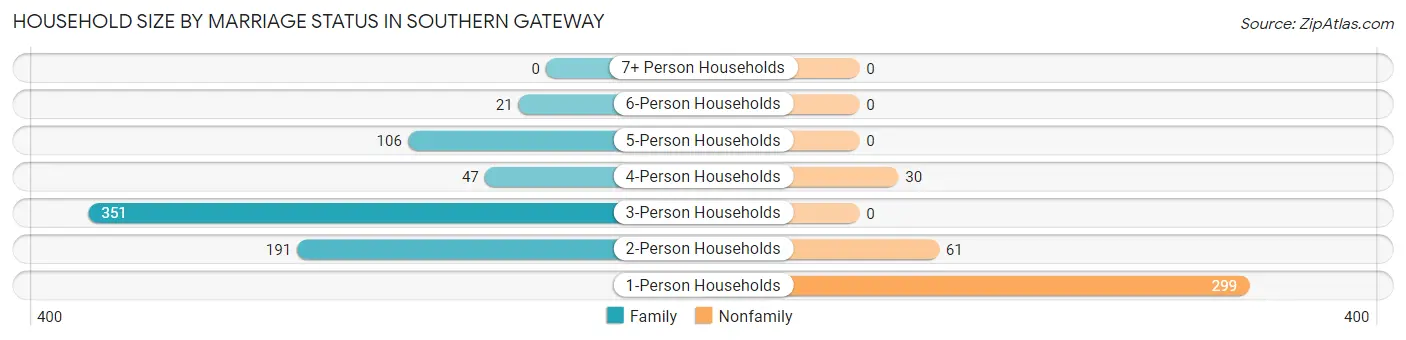
| Household Size | Family Households | Nonfamily Households |
| 1-Person Households | - | 299 (27.0%) |
| 2-Person Households | 191 (17.3%) | 61 (5.5%) |
| 3-Person Households | 351 (31.7%) | 0 (0.0%) |
| 4-Person Households | 47 (4.3%) | 30 (2.7%) |
| 5-Person Households | 106 (9.6%) | 0 (0.0%) |
| 6-Person Households | 21 (1.9%) | 0 (0.0%) |
| 7+ Person Households | 0 (0.0%) | 0 (0.0%) |
| Total | 716 (64.7%) | 390 (35.3%) |
Female Fertility in Southern Gateway
Fertility by Age in Southern Gateway
Average fertility rate in Southern Gateway is 7.0 births per 1,000 women. Women in the age bracket of 20 to 34 years have the highest fertility rate with 13.0 births per 1,000 women. Women in the age bracket of 20 to 34 years acount for 100.0% of all women with births.
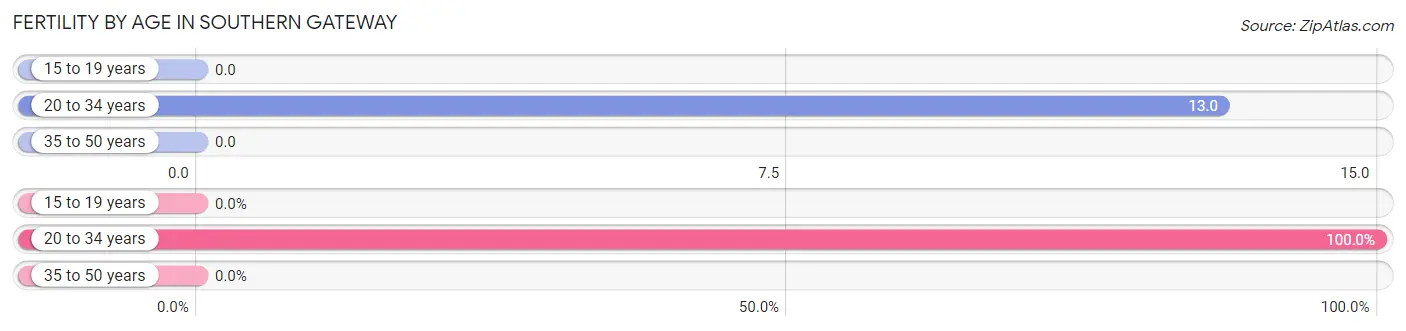
| Age Bracket | Women with Births | Births / 1,000 Women |
| 15 to 19 years | 0 (0.0%) | 0.0 |
| 20 to 34 years | 5 (100.0%) | 13.0 |
| 35 to 50 years | 0 (0.0%) | 0.0 |
| Total | 5 (100.0%) | 7.0 |
Fertility by Age by Marriage Status in Southern Gateway
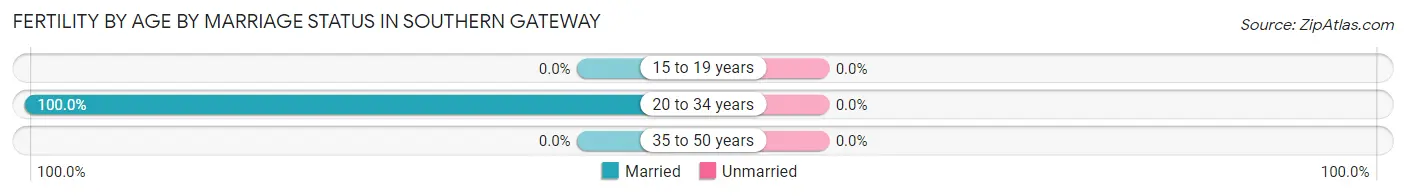
| Age Bracket | Married | Unmarried |
| 15 to 19 years | 0 (0.0%) | 0 (0.0%) |
| 20 to 34 years | 5 (100.0%) | 0 (0.0%) |
| 35 to 50 years | 0 (0.0%) | 0 (0.0%) |
| Total | 5 (100.0%) | 0 (0.0%) |
Fertility by Education in Southern Gateway
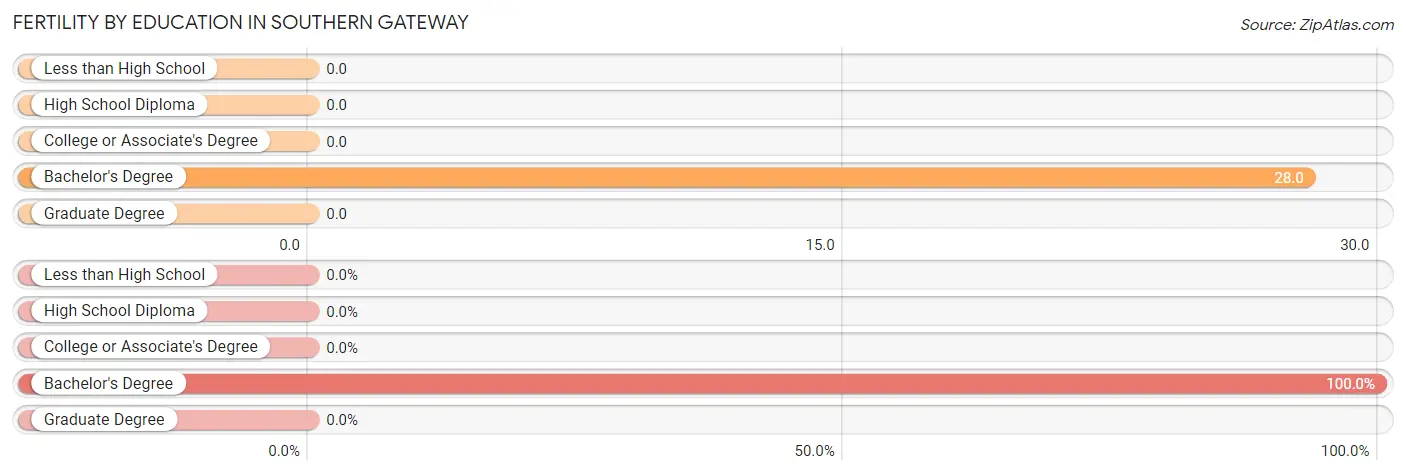
| Educational Attainment | Women with Births | Births / 1,000 Women |
| Less than High School | 0 (0.0%) | 0.0 |
| High School Diploma | 0 (0.0%) | 0.0 |
| College or Associate's Degree | 0 (0.0%) | 0.0 |
| Bachelor's Degree | 5 (100.0%) | 28.0 |
| Graduate Degree | 0 (0.0%) | 0.0 |
| Total | 5 (100.0%) | 7.0 |
Fertility by Education by Marriage Status in Southern Gateway
| Educational Attainment | Married | Unmarried |
| Less than High School | 0 (0.0%) | 0 (0.0%) |
| High School Diploma | 0 (0.0%) | 0 (0.0%) |
| College or Associate's Degree | 0 (0.0%) | 0 (0.0%) |
| Bachelor's Degree | 5 (100.0%) | 0 (0.0%) |
| Graduate Degree | 0 (0.0%) | 0 (0.0%) |
| Total | 5 (100.0%) | 0 (0.0%) |
Employment Characteristics in Southern Gateway
Employment by Class of Employer in Southern Gateway
Among the 1,650 employed individuals in Southern Gateway, private company employees (1,148 | 69.6%), federal government employees (267 | 16.2%), and local government employees (135 | 8.2%) make up the most common classes of employment.
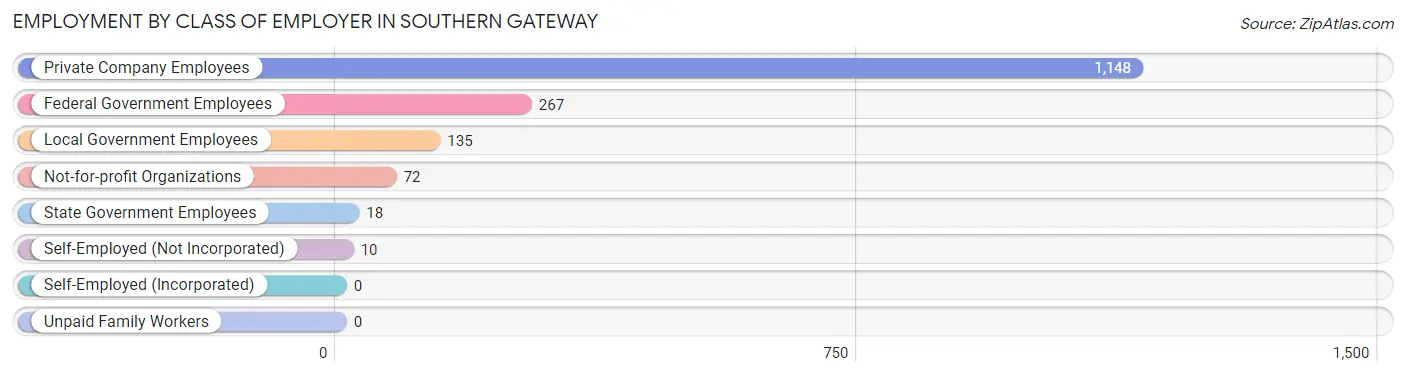
| Employer Class | # Employees | % Employees |
| Private Company Employees | 1,148 | 69.6% |
| Self-Employed (Incorporated) | 0 | 0.0% |
| Self-Employed (Not Incorporated) | 10 | 0.6% |
| Not-for-profit Organizations | 72 | 4.4% |
| Local Government Employees | 135 | 8.2% |
| State Government Employees | 18 | 1.1% |
| Federal Government Employees | 267 | 16.2% |
| Unpaid Family Workers | 0 | 0.0% |
| Total | 1,650 | 100.0% |
Employment Status by Age in Southern Gateway
According to the labor force statistics for Southern Gateway, out of the total population over 16 years of age (2,060), 84.7% or 1,745 individuals are in the labor force, with 4.2% or 73 of them unemployed. The age group with the highest labor force participation rate is 20 to 24 years, with 100.0% or 342 individuals in the labor force. Within the labor force, the 75 years and over age range has the highest percentage of unemployed individuals, with 100.0% or 12 of them being unemployed.
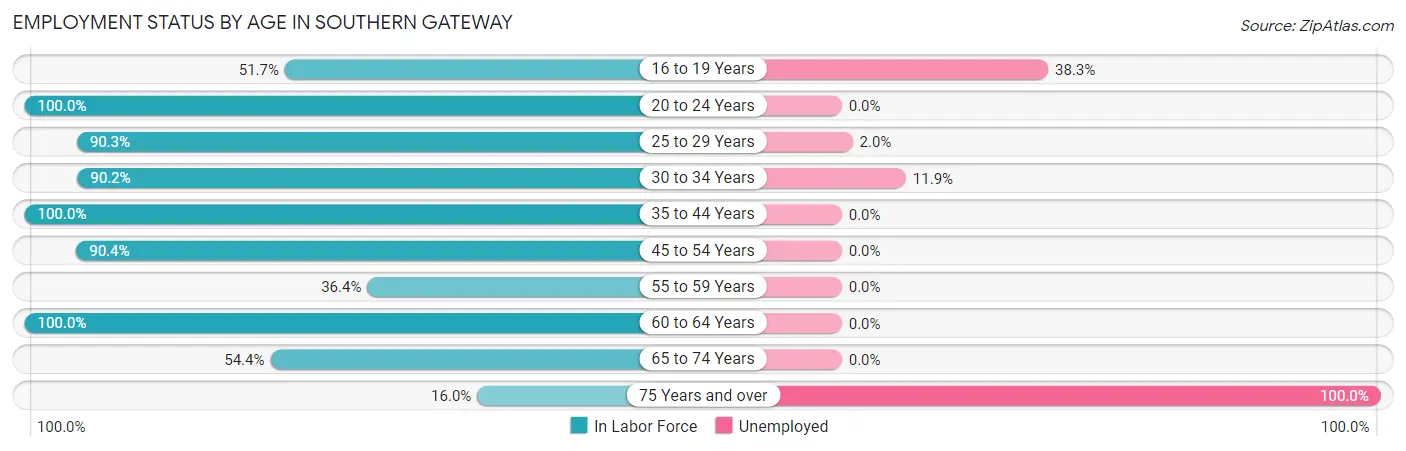
| Age Bracket | In Labor Force | Unemployed |
| 16 to 19 Years | 60 (51.7%) | 23 (38.3%) |
| 20 to 24 Years | 342 (100.0%) | 0 (0.0%) |
| 25 to 29 Years | 252 (90.3%) | 5 (2.0%) |
| 30 to 34 Years | 277 (90.2%) | 33 (11.9%) |
| 35 to 44 Years | 392 (100.0%) | 0 (0.0%) |
| 45 to 54 Years | 272 (90.4%) | 0 (0.0%) |
| 55 to 59 Years | 36 (36.4%) | 0 (0.0%) |
| 60 to 64 Years | 46 (100.0%) | 0 (0.0%) |
| 65 to 74 Years | 56 (54.4%) | 0 (0.0%) |
| 75 Years and over | 12 (16.0%) | 12 (100.0%) |
| Total | 1,745 (84.7%) | 73 (4.2%) |
Employment Status by Educational Attainment in Southern Gateway
According to labor force statistics for Southern Gateway, 89.5% of individuals (1,274) out of the total population between 25 and 64 years of age (1,424) are in the labor force, with 3.0% or 38 of them being unemployed. The group with the highest labor force participation rate are those with the educational attainment of college / associate degree, with 100.0% or 557 individuals in the labor force. Within the labor force, individuals with college / associate degree education have the highest percentage of unemployment, with 5.9% or 33 of them being unemployed.
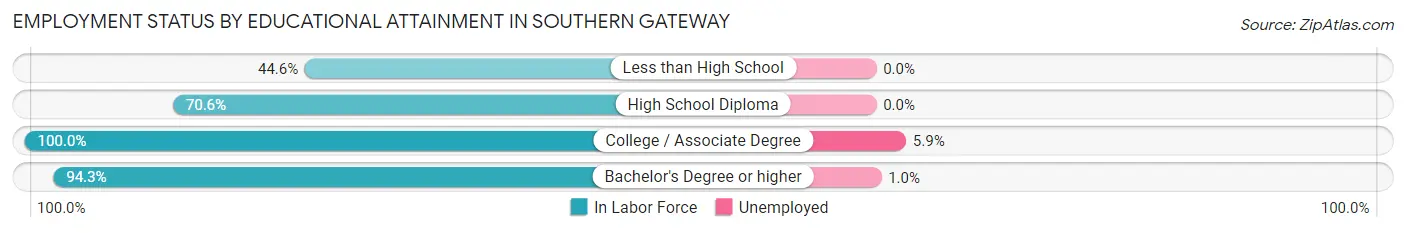
| Educational Attainment | In Labor Force | Unemployed |
| Less than High School | 33 (44.6%) | 0 (0.0%) |
| High School Diploma | 187 (70.6%) | 0 (0.0%) |
| College / Associate Degree | 557 (100.0%) | 33 (5.9%) |
| Bachelor's Degree or higher | 498 (94.3%) | 5 (1.0%) |
| Total | 1,274 (89.5%) | 43 (3.0%) |
Employment Occupations by Sex in Southern Gateway
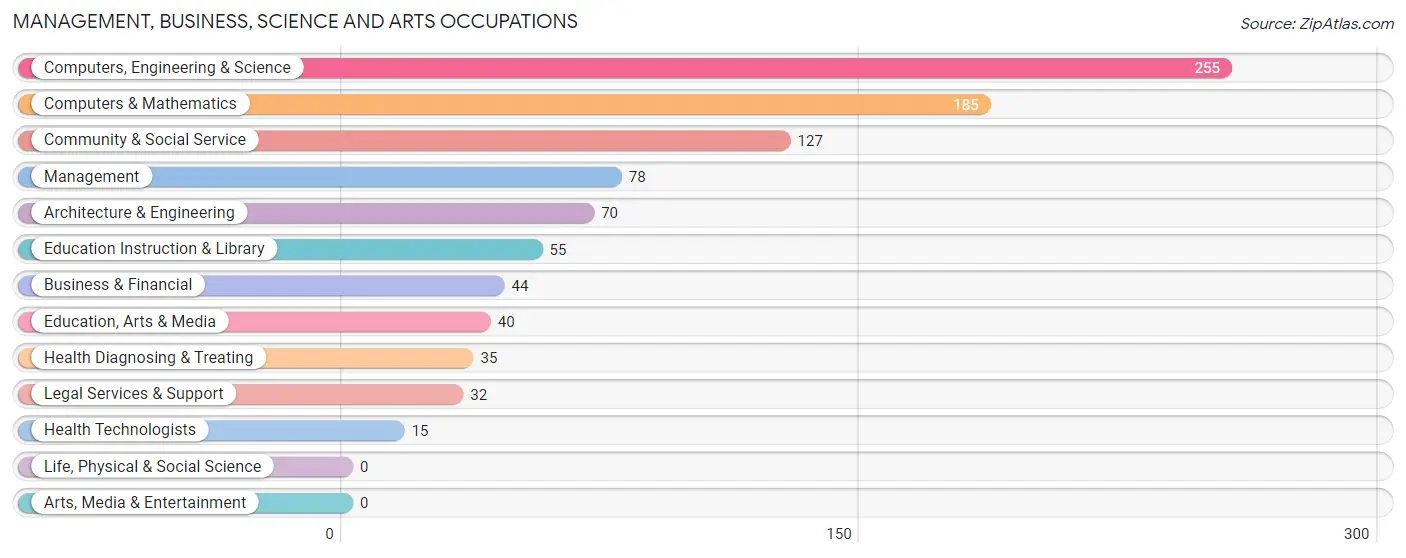
Management, Business, Science and Arts Occupations
The most common Management, Business, Science and Arts occupations in Southern Gateway are Computers, Engineering & Science (255 | 15.2%), Computers & Mathematics (185 | 11.1%), Community & Social Service (127 | 7.6%), Management (78 | 4.7%), and Architecture & Engineering (70 | 4.2%).
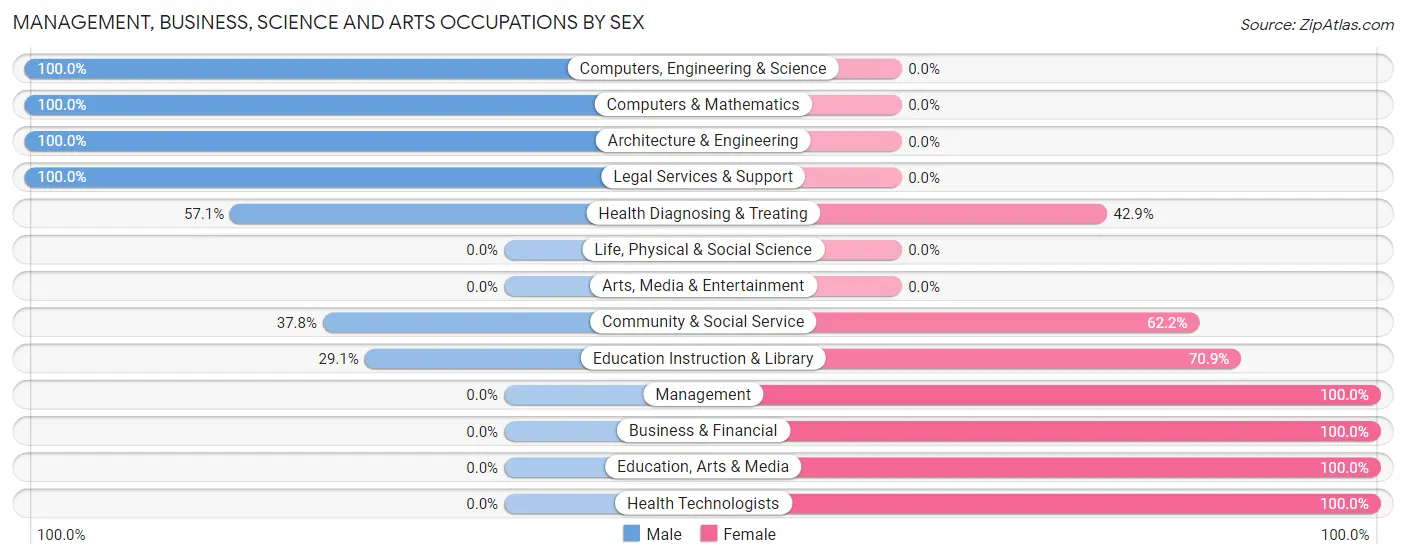
Management, Business, Science and Arts Occupations by Sex
Within the Management, Business, Science and Arts occupations in Southern Gateway, the most male-oriented occupations are Computers, Engineering & Science (100.0%), Computers & Mathematics (100.0%), and Architecture & Engineering (100.0%), while the most female-oriented occupations are Management (100.0%), Business & Financial (100.0%), and Education, Arts & Media (100.0%).
| Occupation | Male | Female |
| Management | 0 (0.0%) | 78 (100.0%) |
| Business & Financial | 0 (0.0%) | 44 (100.0%) |
| Computers, Engineering & Science | 255 (100.0%) | 0 (0.0%) |
| Computers & Mathematics | 185 (100.0%) | 0 (0.0%) |
| Architecture & Engineering | 70 (100.0%) | 0 (0.0%) |
| Life, Physical & Social Science | 0 (0.0%) | 0 (0.0%) |
| Community & Social Service | 48 (37.8%) | 79 (62.2%) |
| Education, Arts & Media | 0 (0.0%) | 40 (100.0%) |
| Legal Services & Support | 32 (100.0%) | 0 (0.0%) |
| Education Instruction & Library | 16 (29.1%) | 39 (70.9%) |
| Arts, Media & Entertainment | 0 (0.0%) | 0 (0.0%) |
| Health Diagnosing & Treating | 20 (57.1%) | 15 (42.9%) |
| Health Technologists | 0 (0.0%) | 15 (100.0%) |
| Total (Category) | 323 (59.9%) | 216 (40.1%) |
| Total (Overall) | 1,010 (60.4%) | 662 (39.6%) |
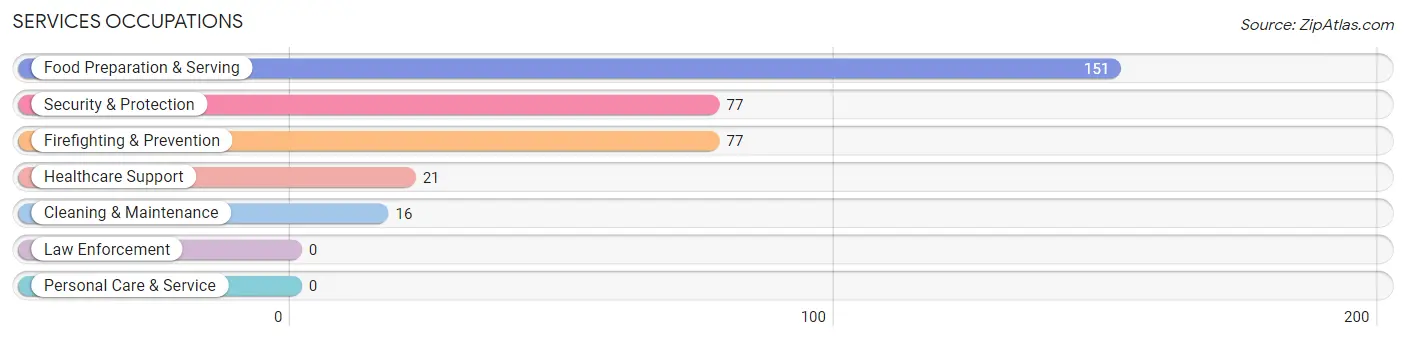
Services Occupations
The most common Services occupations in Southern Gateway are Food Preparation & Serving (151 | 9.0%), Security & Protection (77 | 4.6%), Firefighting & Prevention (77 | 4.6%), Healthcare Support (21 | 1.3%), and Cleaning & Maintenance (16 | 1.0%).
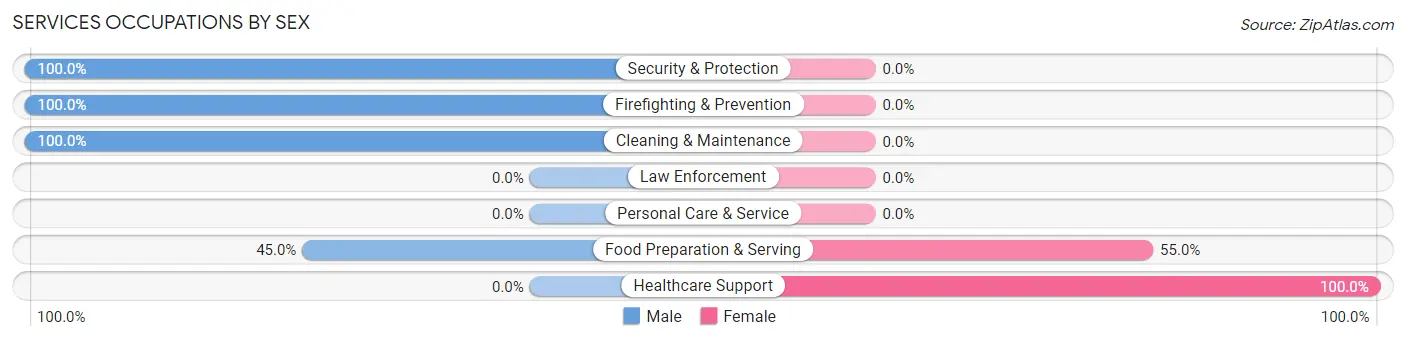
Services Occupations by Sex
Within the Services occupations in Southern Gateway, the most male-oriented occupations are Security & Protection (100.0%), Firefighting & Prevention (100.0%), and Cleaning & Maintenance (100.0%), while the most female-oriented occupations are Healthcare Support (100.0%), and Food Preparation & Serving (55.0%).
| Occupation | Male | Female |
| Healthcare Support | 0 (0.0%) | 21 (100.0%) |
| Security & Protection | 77 (100.0%) | 0 (0.0%) |
| Firefighting & Prevention | 77 (100.0%) | 0 (0.0%) |
| Law Enforcement | 0 (0.0%) | 0 (0.0%) |
| Food Preparation & Serving | 68 (45.0%) | 83 (55.0%) |
| Cleaning & Maintenance | 16 (100.0%) | 0 (0.0%) |
| Personal Care & Service | 0 (0.0%) | 0 (0.0%) |
| Total (Category) | 161 (60.8%) | 104 (39.3%) |
| Total (Overall) | 1,010 (60.4%) | 662 (39.6%) |
Sales and Office Occupations
The most common Sales and Office occupations in Southern Gateway are Office & Administration (189 | 11.3%), and Sales & Related (176 | 10.5%).
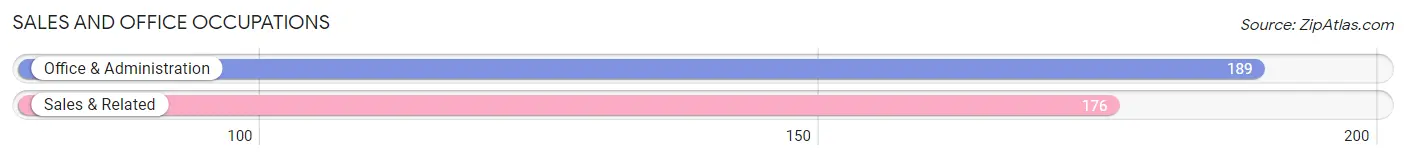
Sales and Office Occupations by Sex
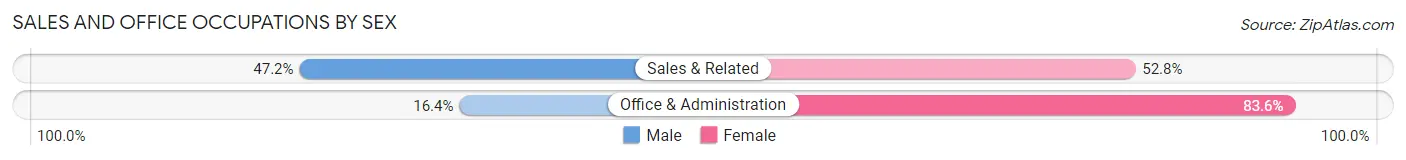
| Occupation | Male | Female |
| Sales & Related | 83 (47.2%) | 93 (52.8%) |
| Office & Administration | 31 (16.4%) | 158 (83.6%) |
| Total (Category) | 114 (31.2%) | 251 (68.8%) |
| Total (Overall) | 1,010 (60.4%) | 662 (39.6%) |
Natural Resources, Construction and Maintenance Occupations
The most common Natural Resources, Construction and Maintenance occupations in Southern Gateway are Installation, Maintenance & Repair (275 | 16.5%), and Construction & Extraction (74 | 4.4%).
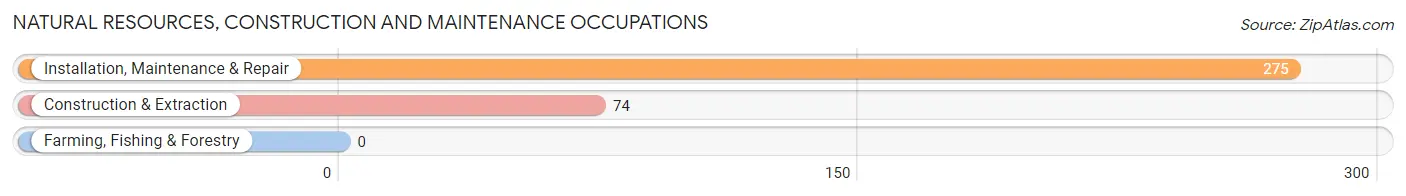
Natural Resources, Construction and Maintenance Occupations by Sex
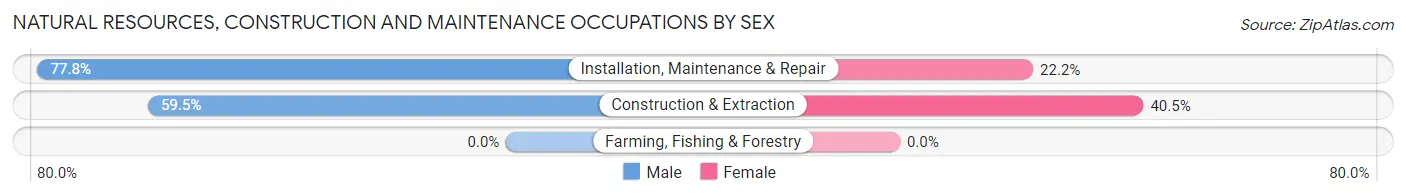
| Occupation | Male | Female |
| Farming, Fishing & Forestry | 0 (0.0%) | 0 (0.0%) |
| Construction & Extraction | 44 (59.5%) | 30 (40.5%) |
| Installation, Maintenance & Repair | 214 (77.8%) | 61 (22.2%) |
| Total (Category) | 258 (73.9%) | 91 (26.1%) |
| Total (Overall) | 1,010 (60.4%) | 662 (39.6%) |
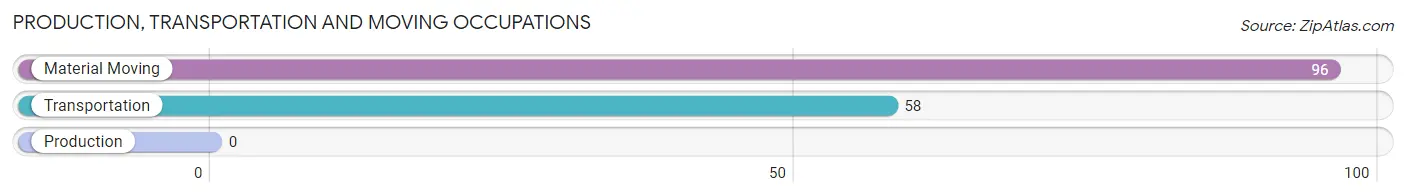
Production, Transportation and Moving Occupations
The most common Production, Transportation and Moving occupations in Southern Gateway are Material Moving (96 | 5.7%), and Transportation (58 | 3.5%).
Production, Transportation and Moving Occupations by Sex
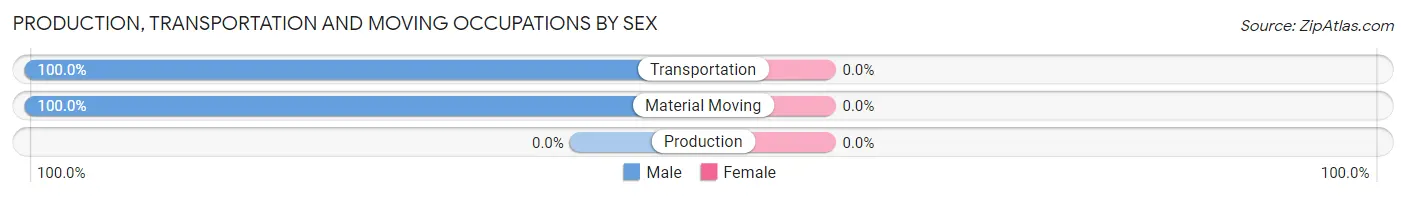
| Occupation | Male | Female |
| Production | 0 (0.0%) | 0 (0.0%) |
| Transportation | 58 (100.0%) | 0 (0.0%) |
| Material Moving | 96 (100.0%) | 0 (0.0%) |
| Total (Category) | 154 (100.0%) | 0 (0.0%) |
| Total (Overall) | 1,010 (60.4%) | 662 (39.6%) |
Employment Industries by Sex in Southern Gateway
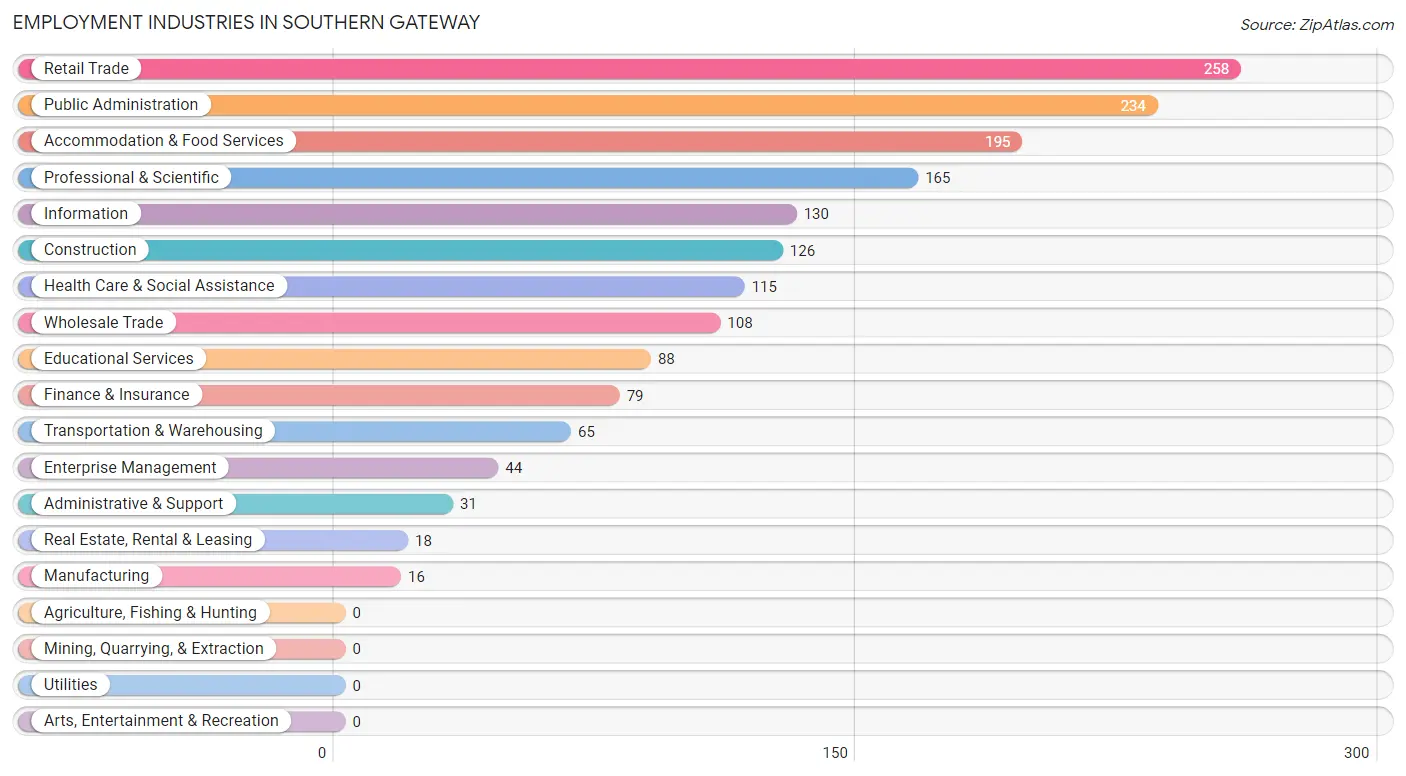
Employment Industries in Southern Gateway
The major employment industries in Southern Gateway include Retail Trade (258 | 15.4%), Public Administration (234 | 14.0%), Accommodation & Food Services (195 | 11.7%), Professional & Scientific (165 | 9.9%), and Information (130 | 7.8%).
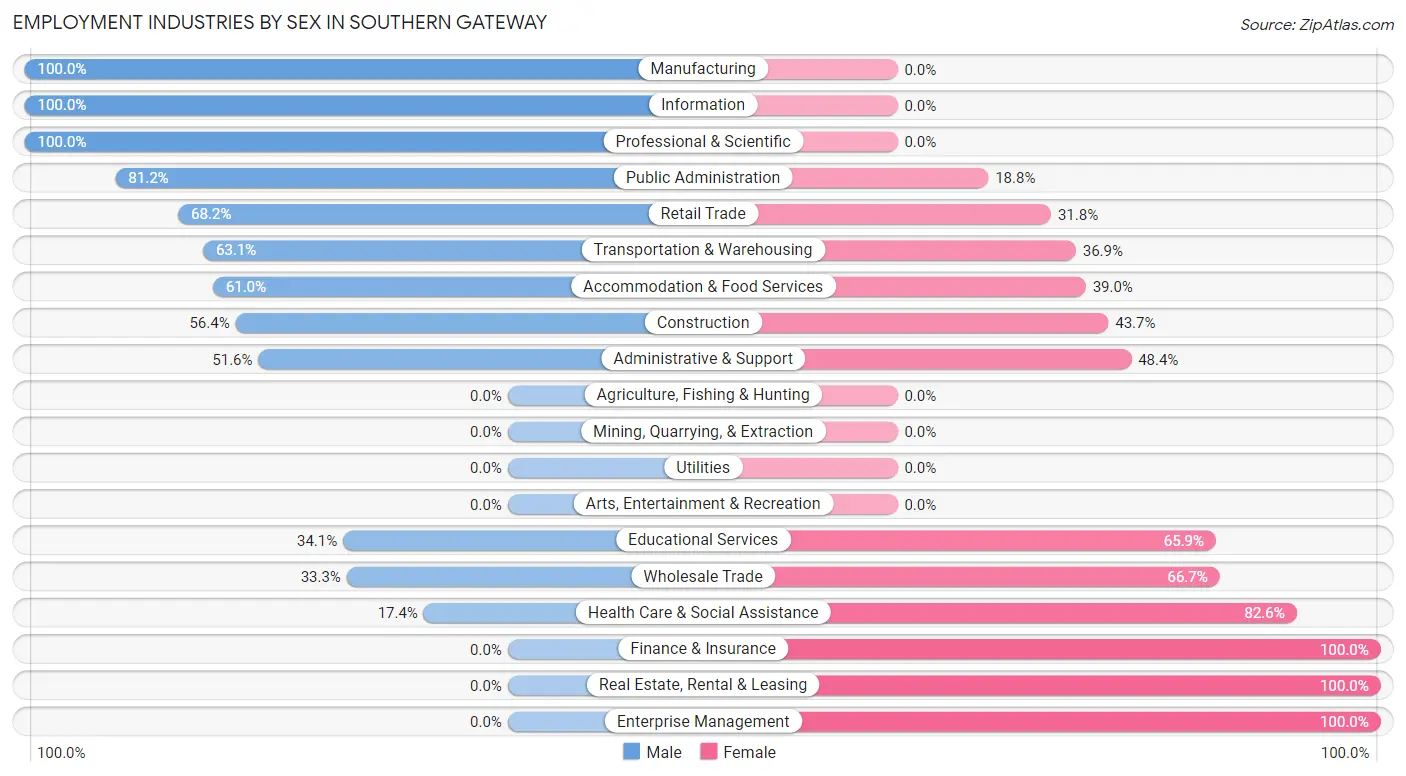
Employment Industries by Sex in Southern Gateway
The Southern Gateway industries that see more men than women are Manufacturing (100.0%), Information (100.0%), and Professional & Scientific (100.0%), whereas the industries that tend to have a higher number of women are Finance & Insurance (100.0%), Real Estate, Rental & Leasing (100.0%), and Enterprise Management (100.0%).
| Industry | Male | Female |
| Agriculture, Fishing & Hunting | 0 (0.0%) | 0 (0.0%) |
| Mining, Quarrying, & Extraction | 0 (0.0%) | 0 (0.0%) |
| Construction | 71 (56.4%) | 55 (43.6%) |
| Manufacturing | 16 (100.0%) | 0 (0.0%) |
| Wholesale Trade | 36 (33.3%) | 72 (66.7%) |
| Retail Trade | 176 (68.2%) | 82 (31.8%) |
| Transportation & Warehousing | 41 (63.1%) | 24 (36.9%) |
| Utilities | 0 (0.0%) | 0 (0.0%) |
| Information | 130 (100.0%) | 0 (0.0%) |
| Finance & Insurance | 0 (0.0%) | 79 (100.0%) |
| Real Estate, Rental & Leasing | 0 (0.0%) | 18 (100.0%) |
| Professional & Scientific | 165 (100.0%) | 0 (0.0%) |
| Enterprise Management | 0 (0.0%) | 44 (100.0%) |
| Administrative & Support | 16 (51.6%) | 15 (48.4%) |
| Educational Services | 30 (34.1%) | 58 (65.9%) |
| Health Care & Social Assistance | 20 (17.4%) | 95 (82.6%) |
| Arts, Entertainment & Recreation | 0 (0.0%) | 0 (0.0%) |
| Accommodation & Food Services | 119 (61.0%) | 76 (39.0%) |
| Public Administration | 190 (81.2%) | 44 (18.8%) |
| Total | 1,010 (60.4%) | 662 (39.6%) |
Education in Southern Gateway
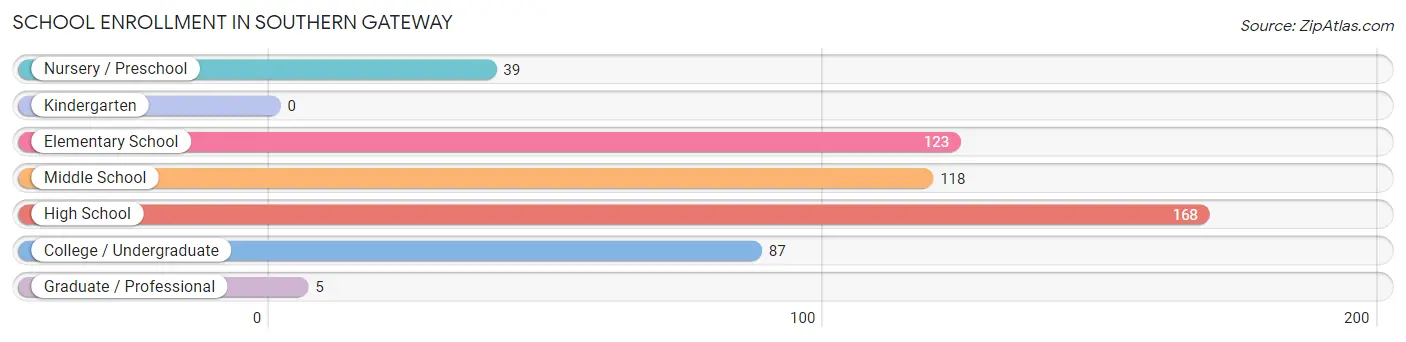
School Enrollment in Southern Gateway
The most common levels of schooling among the 540 students in Southern Gateway are high school (168 | 31.1%), elementary school (123 | 22.8%), and middle school (118 | 21.8%).
| School Level | # Students | % Students |
| Nursery / Preschool | 39 | 7.2% |
| Kindergarten | 0 | 0.0% |
| Elementary School | 123 | 22.8% |
| Middle School | 118 | 21.8% |
| High School | 168 | 31.1% |
| College / Undergraduate | 87 | 16.1% |
| Graduate / Professional | 5 | 0.9% |
| Total | 540 | 100.0% |
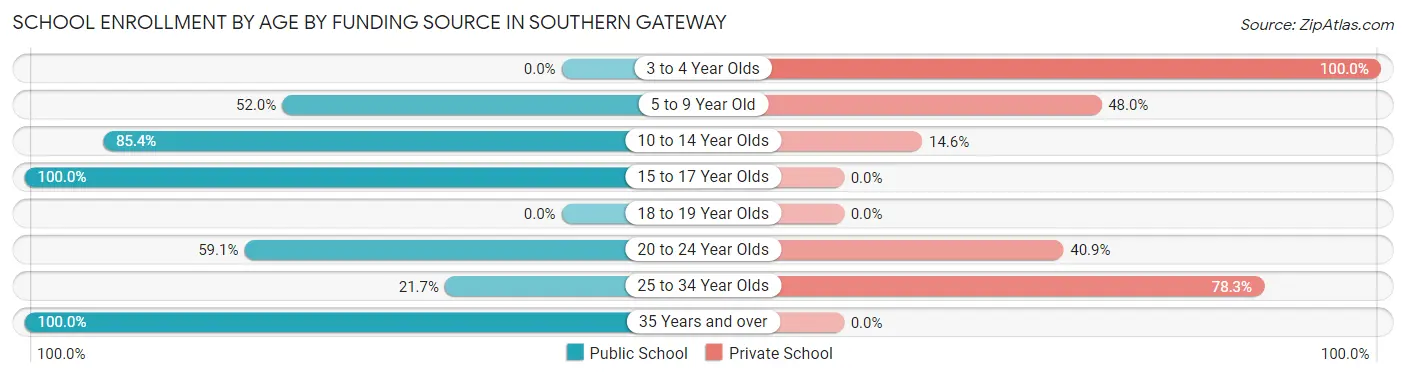
School Enrollment by Age by Funding Source in Southern Gateway
Out of a total of 540 students who are enrolled in schools in Southern Gateway, 154 (28.5%) attend a private institution, while the remaining 386 (71.5%) are enrolled in public schools. The age group of 3 to 4 year olds has the highest likelihood of being enrolled in private schools, with 39 (100.0% in the age bracket) enrolled. Conversely, the age group of 15 to 17 year olds has the lowest likelihood of being enrolled in a private school, with 108 (100.0% in the age bracket) attending a public institution.
| Age Bracket | Public School | Private School |
| 3 to 4 Year Olds | 0 (0.0%) | 39 (100.0%) |
| 5 to 9 Year Old | 64 (52.0%) | 59 (48.0%) |
| 10 to 14 Year Olds | 117 (85.4%) | 20 (14.6%) |
| 15 to 17 Year Olds | 108 (100.0%) | 0 (0.0%) |
| 18 to 19 Year Olds | 0 (0.0%) | 0 (0.0%) |
| 20 to 24 Year Olds | 26 (59.1%) | 18 (40.9%) |
| 25 to 34 Year Olds | 5 (21.7%) | 18 (78.3%) |
| 35 Years and over | 66 (100.0%) | 0 (0.0%) |
| Total | 386 (71.5%) | 154 (28.5%) |
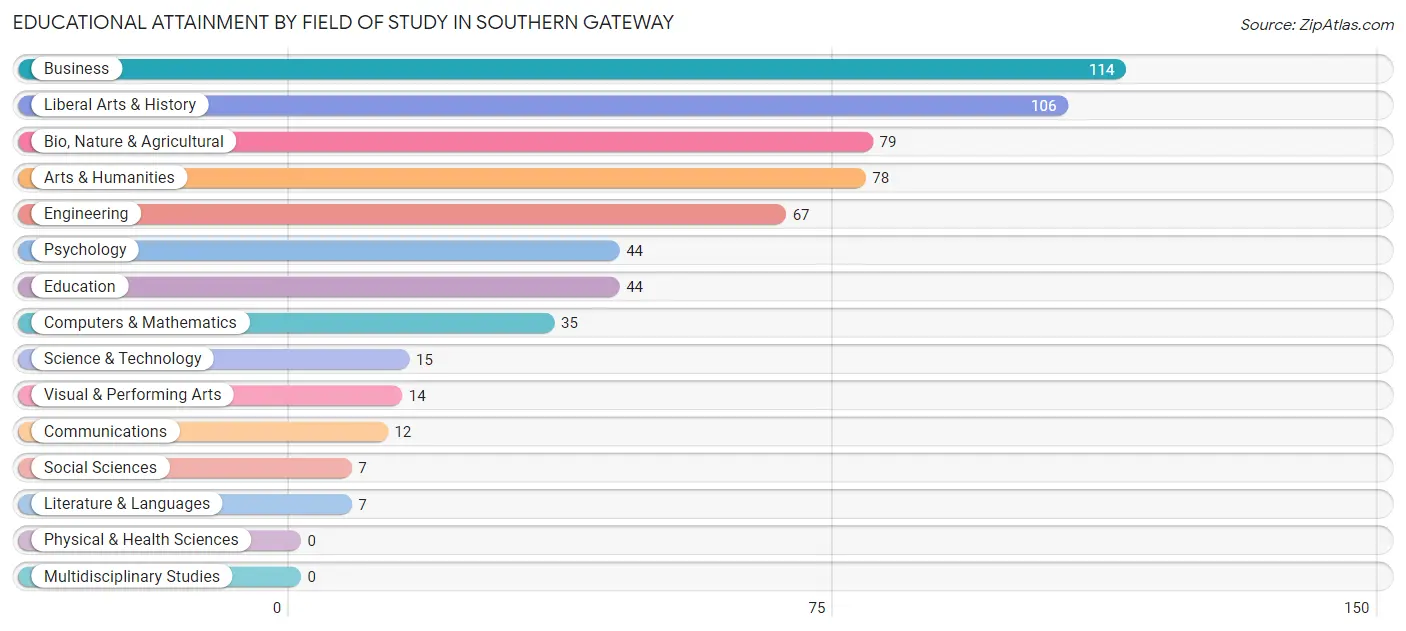
Educational Attainment by Field of Study in Southern Gateway
Business (114 | 18.3%), liberal arts & history (106 | 17.0%), bio, nature & agricultural (79 | 12.7%), arts & humanities (78 | 12.5%), and engineering (67 | 10.8%) are the most common fields of study among 622 individuals in Southern Gateway who have obtained a bachelor's degree or higher.
| Field of Study | # Graduates | % Graduates |
| Computers & Mathematics | 35 | 5.6% |
| Bio, Nature & Agricultural | 79 | 12.7% |
| Physical & Health Sciences | 0 | 0.0% |
| Psychology | 44 | 7.1% |
| Social Sciences | 7 | 1.1% |
| Engineering | 67 | 10.8% |
| Multidisciplinary Studies | 0 | 0.0% |
| Science & Technology | 15 | 2.4% |
| Business | 114 | 18.3% |
| Education | 44 | 7.1% |
| Literature & Languages | 7 | 1.1% |
| Liberal Arts & History | 106 | 17.0% |
| Visual & Performing Arts | 14 | 2.2% |
| Communications | 12 | 1.9% |
| Arts & Humanities | 78 | 12.5% |
| Total | 622 | 100.0% |
Transportation & Commute in Southern Gateway
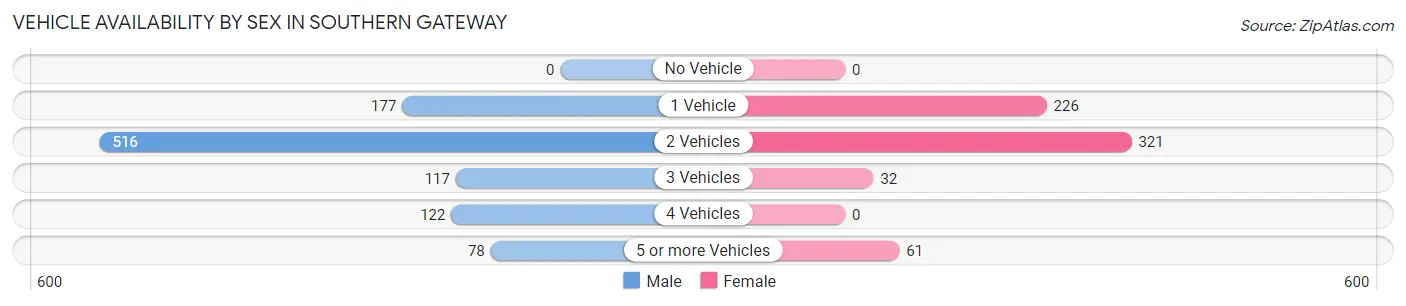
Vehicle Availability by Sex in Southern Gateway
The most prevalent vehicle ownership categories in Southern Gateway are males with 2 vehicles (516, accounting for 51.1%) and females with 2 vehicles (321, making up 80.6%).
| Vehicles Available | Male | Female |
| No Vehicle | 0 (0.0%) | 0 (0.0%) |
| 1 Vehicle | 177 (17.5%) | 226 (35.3%) |
| 2 Vehicles | 516 (51.1%) | 321 (50.2%) |
| 3 Vehicles | 117 (11.6%) | 32 (5.0%) |
| 4 Vehicles | 122 (12.1%) | 0 (0.0%) |
| 5 or more Vehicles | 78 (7.7%) | 61 (9.5%) |
| Total | 1,010 (100.0%) | 640 (100.0%) |
Commute Time in Southern Gateway
The most frequently occuring commute durations in Southern Gateway are 60 to 89 minutes (216 commuters, 13.9%), 15 to 19 minutes (199 commuters, 12.8%), and 10 to 14 minutes (189 commuters, 12.2%).
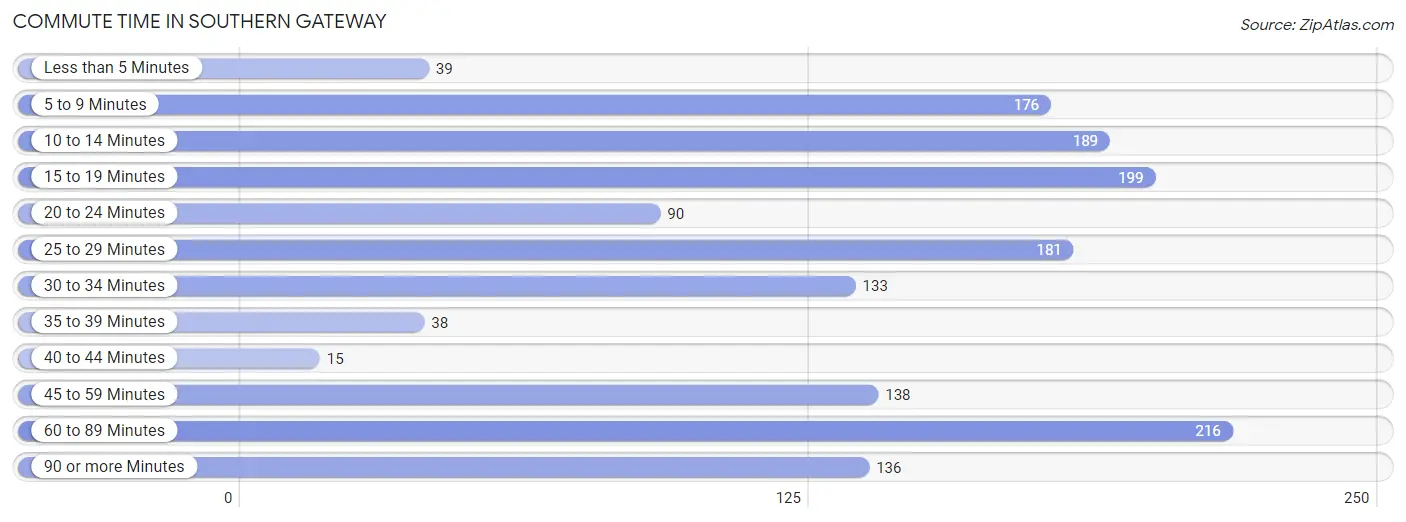
| Commute Time | # Commuters | % Commuters |
| Less than 5 Minutes | 39 | 2.5% |
| 5 to 9 Minutes | 176 | 11.4% |
| 10 to 14 Minutes | 189 | 12.2% |
| 15 to 19 Minutes | 199 | 12.8% |
| 20 to 24 Minutes | 90 | 5.8% |
| 25 to 29 Minutes | 181 | 11.7% |
| 30 to 34 Minutes | 133 | 8.6% |
| 35 to 39 Minutes | 38 | 2.5% |
| 40 to 44 Minutes | 15 | 1.0% |
| 45 to 59 Minutes | 138 | 8.9% |
| 60 to 89 Minutes | 216 | 13.9% |
| 90 or more Minutes | 136 | 8.8% |
Commute Time by Sex in Southern Gateway
The most common commute times in Southern Gateway are 60 to 89 minutes (154 commuters, 15.9%) for males and 15 to 19 minutes (199 commuters, 34.3%) for females.
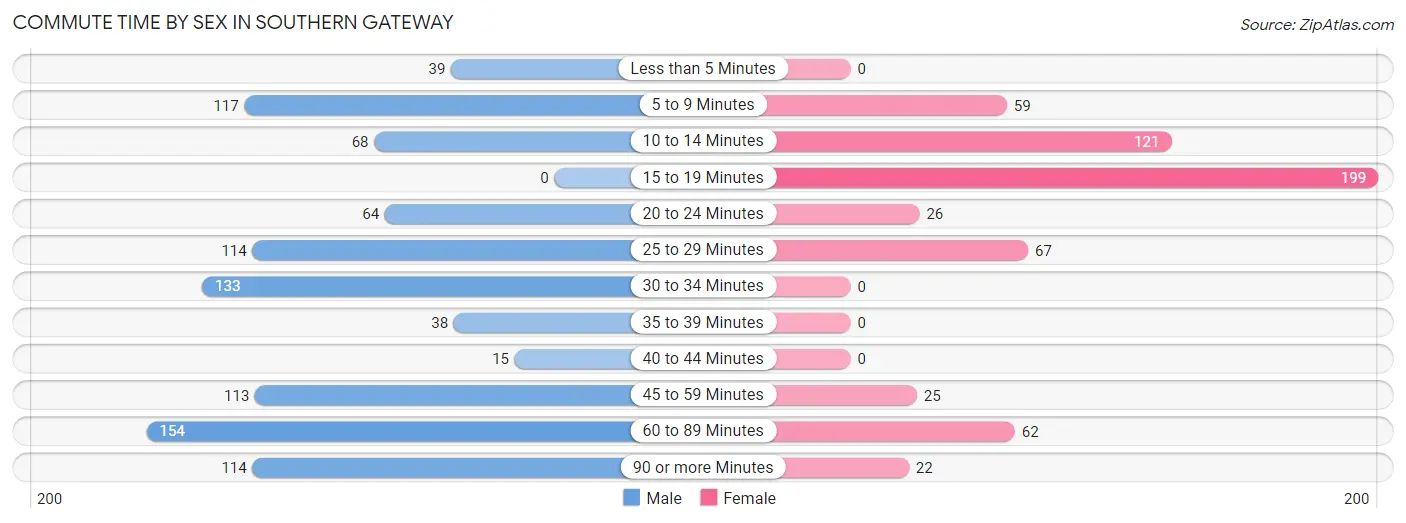
| Commute Time | Male | Female |
| Less than 5 Minutes | 39 (4.0%) | 0 (0.0%) |
| 5 to 9 Minutes | 117 (12.1%) | 59 (10.2%) |
| 10 to 14 Minutes | 68 (7.0%) | 121 (20.8%) |
| 15 to 19 Minutes | 0 (0.0%) | 199 (34.3%) |
| 20 to 24 Minutes | 64 (6.6%) | 26 (4.5%) |
| 25 to 29 Minutes | 114 (11.8%) | 67 (11.5%) |
| 30 to 34 Minutes | 133 (13.7%) | 0 (0.0%) |
| 35 to 39 Minutes | 38 (3.9%) | 0 (0.0%) |
| 40 to 44 Minutes | 15 (1.5%) | 0 (0.0%) |
| 45 to 59 Minutes | 113 (11.7%) | 25 (4.3%) |
| 60 to 89 Minutes | 154 (15.9%) | 62 (10.7%) |
| 90 or more Minutes | 114 (11.8%) | 22 (3.8%) |
Time of Departure to Work by Sex in Southern Gateway
The most frequent times of departure to work in Southern Gateway are 6:30 AM to 6:59 AM (221, 22.8%) for males and 8:00 AM to 8:29 AM (192, 33.1%) for females.
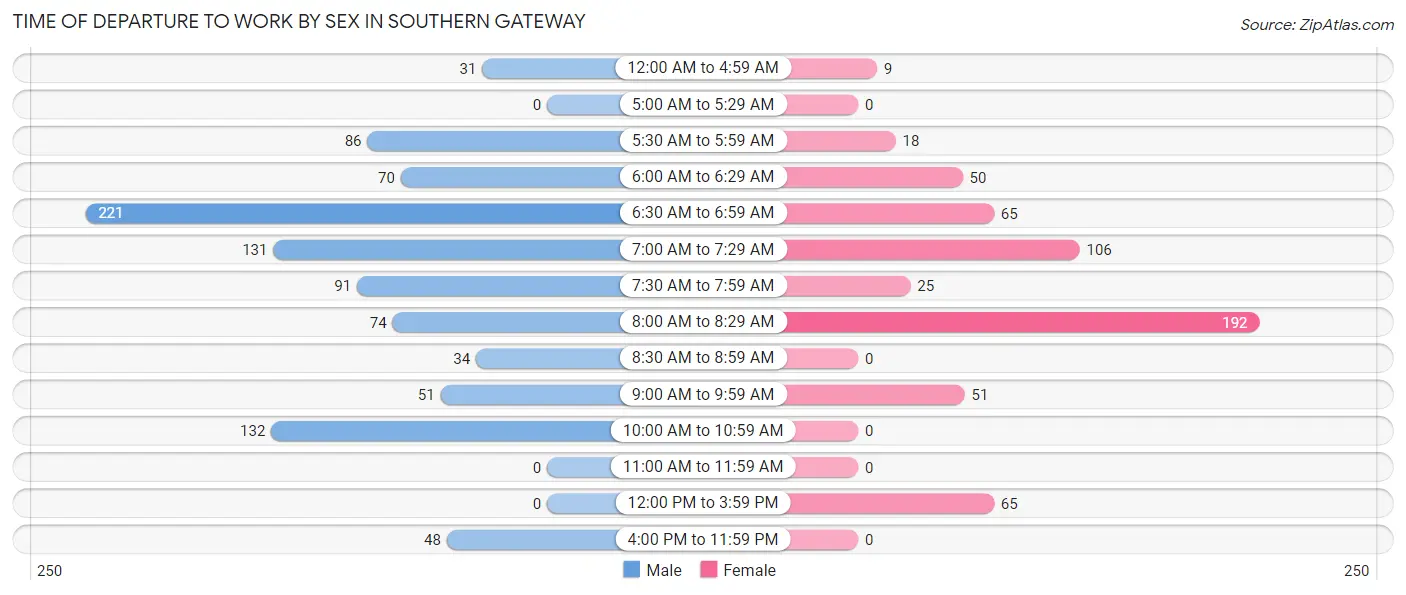
| Time of Departure | Male | Female |
| 12:00 AM to 4:59 AM | 31 (3.2%) | 9 (1.5%) |
| 5:00 AM to 5:29 AM | 0 (0.0%) | 0 (0.0%) |
| 5:30 AM to 5:59 AM | 86 (8.9%) | 18 (3.1%) |
| 6:00 AM to 6:29 AM | 70 (7.2%) | 50 (8.6%) |
| 6:30 AM to 6:59 AM | 221 (22.8%) | 65 (11.2%) |
| 7:00 AM to 7:29 AM | 131 (13.5%) | 106 (18.2%) |
| 7:30 AM to 7:59 AM | 91 (9.4%) | 25 (4.3%) |
| 8:00 AM to 8:29 AM | 74 (7.6%) | 192 (33.1%) |
| 8:30 AM to 8:59 AM | 34 (3.5%) | 0 (0.0%) |
| 9:00 AM to 9:59 AM | 51 (5.3%) | 51 (8.8%) |
| 10:00 AM to 10:59 AM | 132 (13.6%) | 0 (0.0%) |
| 11:00 AM to 11:59 AM | 0 (0.0%) | 0 (0.0%) |
| 12:00 PM to 3:59 PM | 0 (0.0%) | 65 (11.2%) |
| 4:00 PM to 11:59 PM | 48 (5.0%) | 0 (0.0%) |
| Total | 969 (100.0%) | 581 (100.0%) |
Housing Occupancy in Southern Gateway
Occupancy by Ownership in Southern Gateway
Of the total 1,106 dwellings in Southern Gateway, owner-occupied units account for 379 (34.3%), while renter-occupied units make up 727 (65.7%).
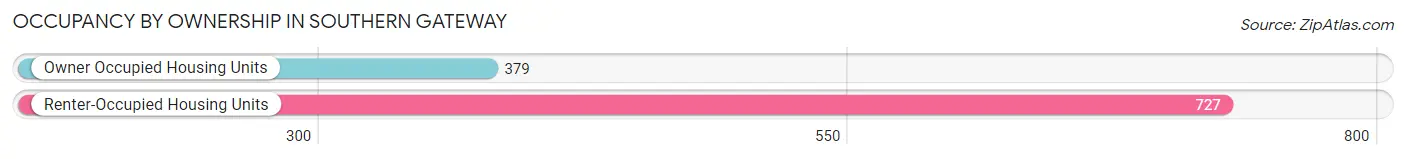
| Occupancy | # Housing Units | % Housing Units |
| Owner Occupied Housing Units | 379 | 34.3% |
| Renter-Occupied Housing Units | 727 | 65.7% |
| Total Occupied Housing Units | 1,106 | 100.0% |
Occupancy by Household Size in Southern Gateway
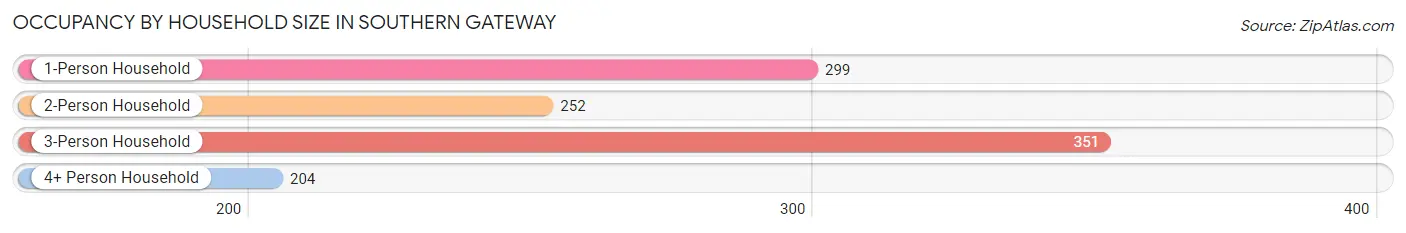
| Household Size | # Housing Units | % Housing Units |
| 1-Person Household | 299 | 27.0% |
| 2-Person Household | 252 | 22.8% |
| 3-Person Household | 351 | 31.7% |
| 4+ Person Household | 204 | 18.4% |
| Total Housing Units | 1,106 | 100.0% |
Occupancy by Ownership by Household Size in Southern Gateway
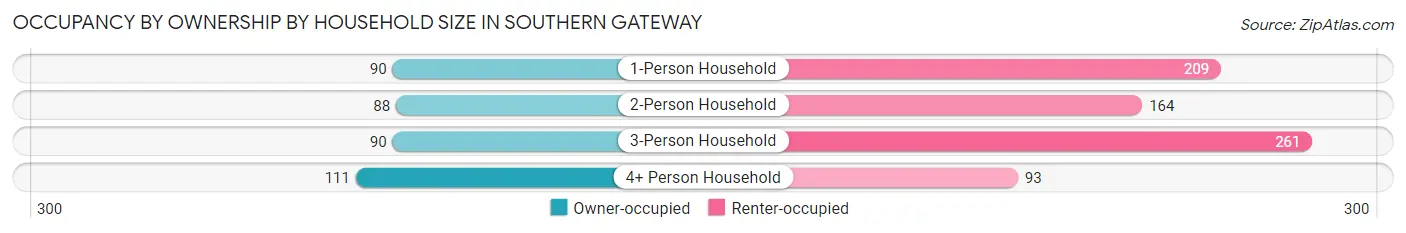
| Household Size | Owner-occupied | Renter-occupied |
| 1-Person Household | 90 (30.1%) | 209 (69.9%) |
| 2-Person Household | 88 (34.9%) | 164 (65.1%) |
| 3-Person Household | 90 (25.6%) | 261 (74.4%) |
| 4+ Person Household | 111 (54.4%) | 93 (45.6%) |
| Total Housing Units | 379 (34.3%) | 727 (65.7%) |
Occupancy by Educational Attainment in Southern Gateway
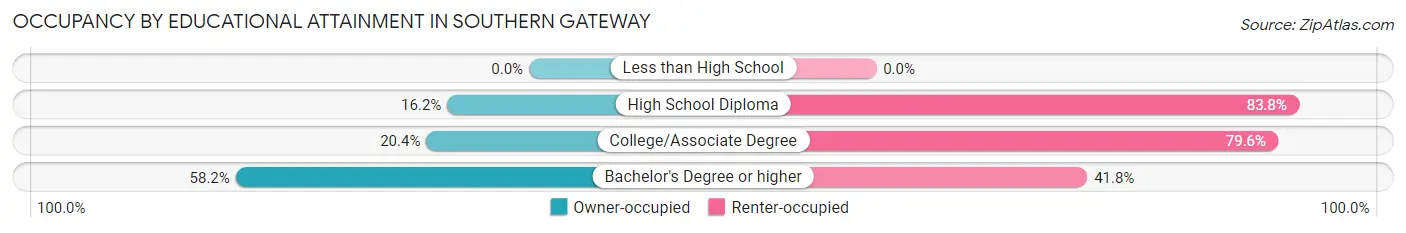
| Household Size | Owner-occupied | Renter-occupied |
| Less than High School | 0 (0.0%) | 0 (0.0%) |
| High School Diploma | 24 (16.2%) | 124 (83.8%) |
| College/Associate Degree | 109 (20.4%) | 426 (79.6%) |
| Bachelor's Degree or higher | 246 (58.2%) | 177 (41.8%) |
Occupancy by Age of Householder in Southern Gateway
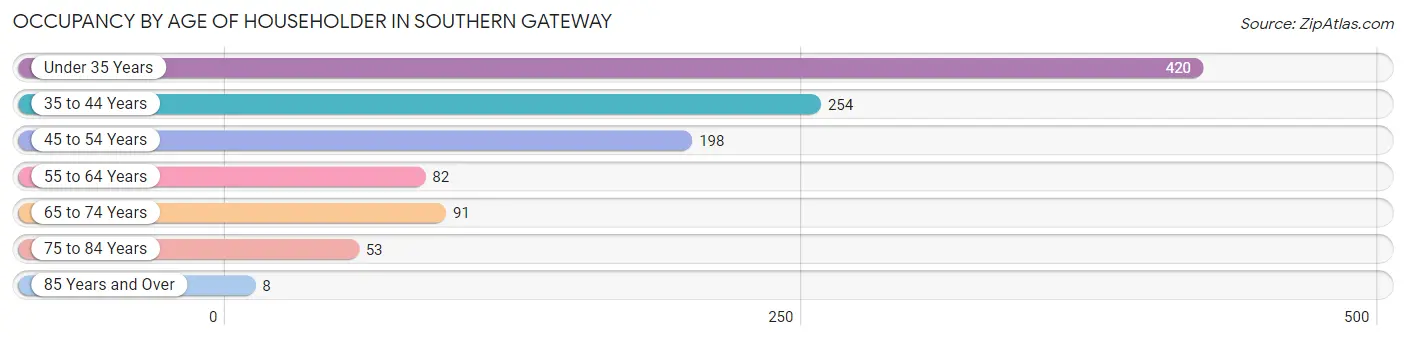
| Age Bracket | # Households | % Households |
| Under 35 Years | 420 | 38.0% |
| 35 to 44 Years | 254 | 23.0% |
| 45 to 54 Years | 198 | 17.9% |
| 55 to 64 Years | 82 | 7.4% |
| 65 to 74 Years | 91 | 8.2% |
| 75 to 84 Years | 53 | 4.8% |
| 85 Years and Over | 8 | 0.7% |
| Total | 1,106 | 100.0% |
Housing Finances in Southern Gateway
Median Income by Occupancy in Southern Gateway
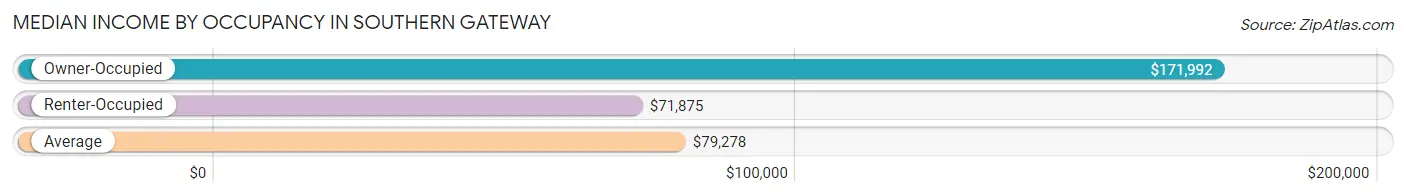
| Occupancy Type | # Households | Median Income |
| Owner-Occupied | 379 (34.3%) | $171,992 |
| Renter-Occupied | 727 (65.7%) | $71,875 |
| Average | 1,106 (100.0%) | $79,278 |
Occupancy by Householder Income Bracket in Southern Gateway
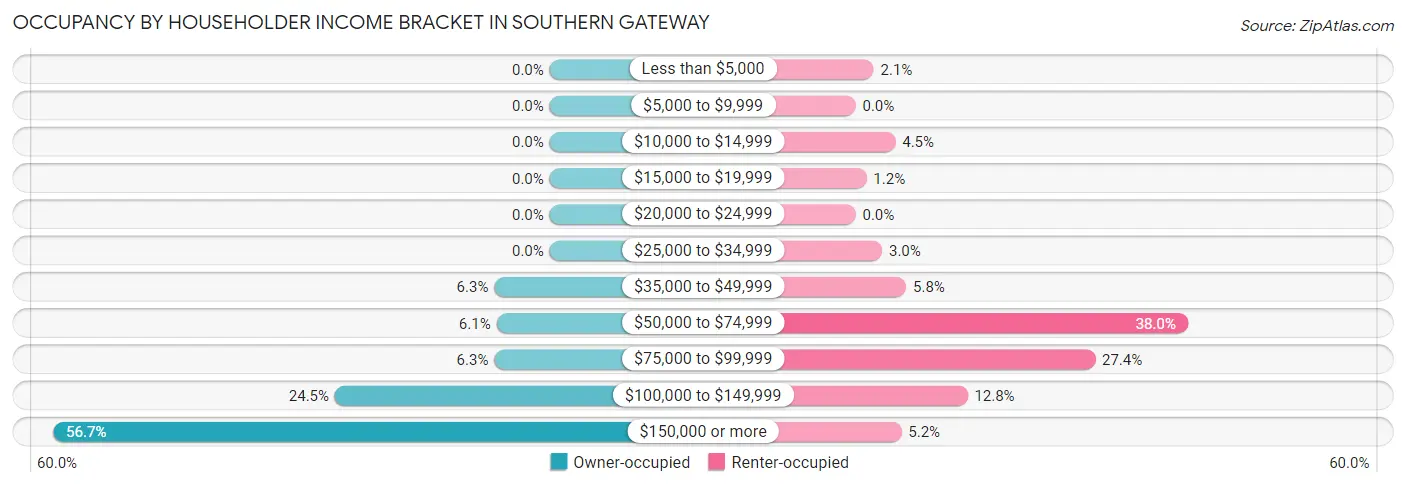
| Income Bracket | Owner-occupied | Renter-occupied |
| Less than $5,000 | 0 (0.0%) | 15 (2.1%) |
| $5,000 to $9,999 | 0 (0.0%) | 0 (0.0%) |
| $10,000 to $14,999 | 0 (0.0%) | 33 (4.5%) |
| $15,000 to $19,999 | 0 (0.0%) | 9 (1.2%) |
| $20,000 to $24,999 | 0 (0.0%) | 0 (0.0%) |
| $25,000 to $34,999 | 0 (0.0%) | 22 (3.0%) |
| $35,000 to $49,999 | 24 (6.3%) | 42 (5.8%) |
| $50,000 to $74,999 | 23 (6.1%) | 276 (38.0%) |
| $75,000 to $99,999 | 24 (6.3%) | 199 (27.4%) |
| $100,000 to $149,999 | 93 (24.5%) | 93 (12.8%) |
| $150,000 or more | 215 (56.7%) | 38 (5.2%) |
| Total | 379 (100.0%) | 727 (100.0%) |
Monthly Housing Cost Tiers in Southern Gateway
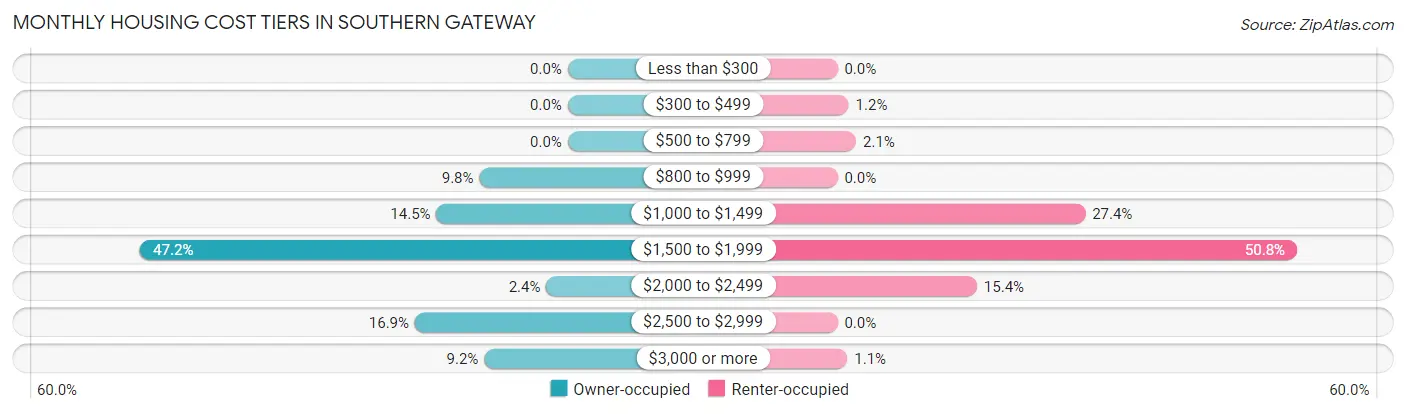
| Monthly Cost | Owner-occupied | Renter-occupied |
| Less than $300 | 0 (0.0%) | 0 (0.0%) |
| $300 to $499 | 0 (0.0%) | 9 (1.2%) |
| $500 to $799 | 0 (0.0%) | 15 (2.1%) |
| $800 to $999 | 37 (9.8%) | 0 (0.0%) |
| $1,000 to $1,499 | 55 (14.5%) | 199 (27.4%) |
| $1,500 to $1,999 | 179 (47.2%) | 369 (50.8%) |
| $2,000 to $2,499 | 9 (2.4%) | 112 (15.4%) |
| $2,500 to $2,999 | 64 (16.9%) | 0 (0.0%) |
| $3,000 or more | 35 (9.2%) | 8 (1.1%) |
| Total | 379 (100.0%) | 727 (100.0%) |
Physical Housing Characteristics in Southern Gateway
Housing Structures in Southern Gateway
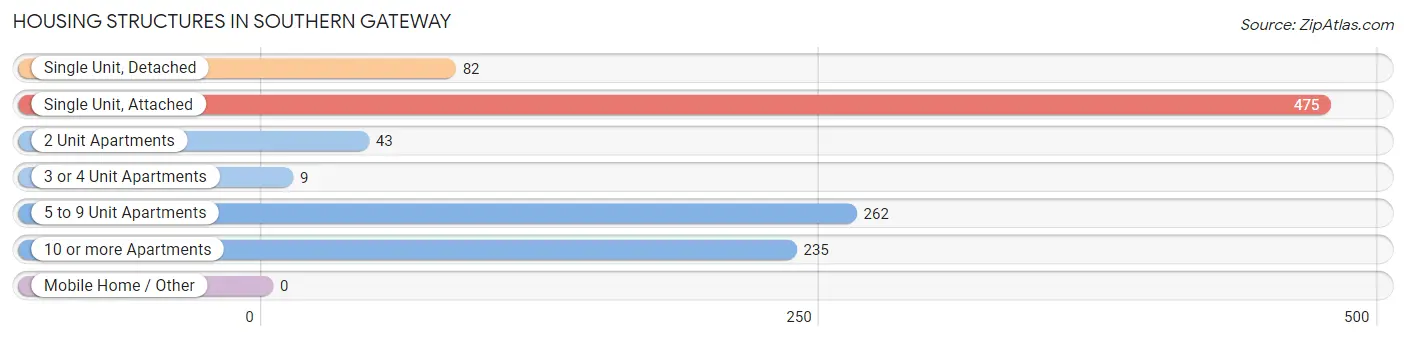
| Structure Type | # Housing Units | % Housing Units |
| Single Unit, Detached | 82 | 7.4% |
| Single Unit, Attached | 475 | 42.9% |
| 2 Unit Apartments | 43 | 3.9% |
| 3 or 4 Unit Apartments | 9 | 0.8% |
| 5 to 9 Unit Apartments | 262 | 23.7% |
| 10 or more Apartments | 235 | 21.2% |
| Mobile Home / Other | 0 | 0.0% |
| Total | 1,106 | 100.0% |
Housing Structures by Occupancy in Southern Gateway
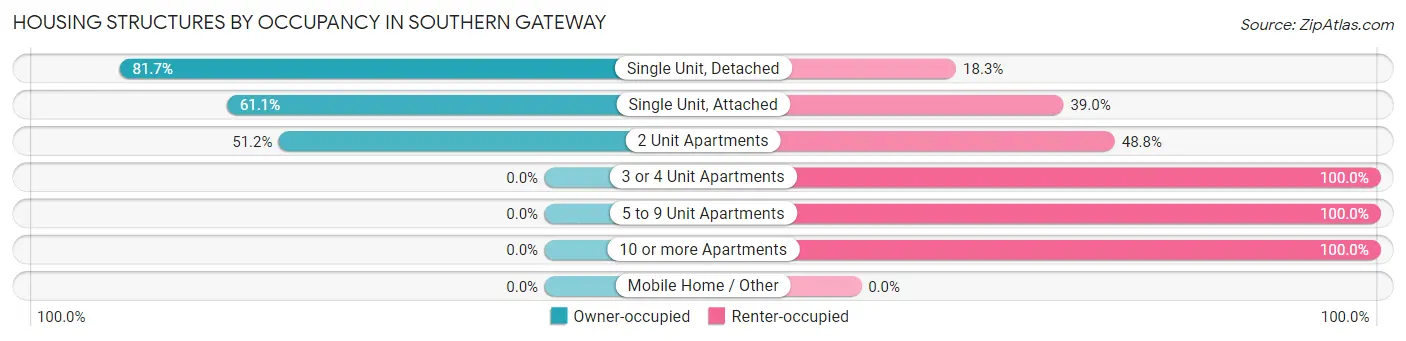
| Structure Type | Owner-occupied | Renter-occupied |
| Single Unit, Detached | 67 (81.7%) | 15 (18.3%) |
| Single Unit, Attached | 290 (61.1%) | 185 (39.0%) |
| 2 Unit Apartments | 22 (51.2%) | 21 (48.8%) |
| 3 or 4 Unit Apartments | 0 (0.0%) | 9 (100.0%) |
| 5 to 9 Unit Apartments | 0 (0.0%) | 262 (100.0%) |
| 10 or more Apartments | 0 (0.0%) | 235 (100.0%) |
| Mobile Home / Other | 0 (0.0%) | 0 (0.0%) |
| Total | 379 (34.3%) | 727 (65.7%) |
Housing Structures by Number of Rooms in Southern Gateway
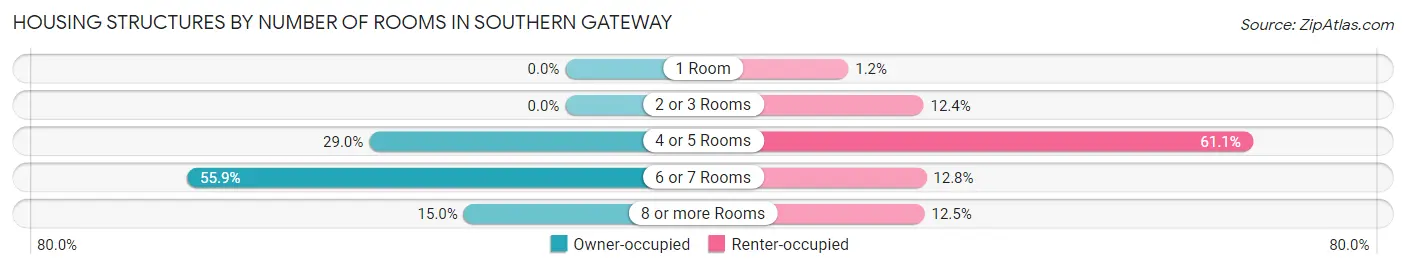
| Number of Rooms | Owner-occupied | Renter-occupied |
| 1 Room | 0 (0.0%) | 9 (1.2%) |
| 2 or 3 Rooms | 0 (0.0%) | 90 (12.4%) |
| 4 or 5 Rooms | 110 (29.0%) | 444 (61.1%) |
| 6 or 7 Rooms | 212 (55.9%) | 93 (12.8%) |
| 8 or more Rooms | 57 (15.0%) | 91 (12.5%) |
| Total | 379 (100.0%) | 727 (100.0%) |
Housing Structure by Heating Type in Southern Gateway
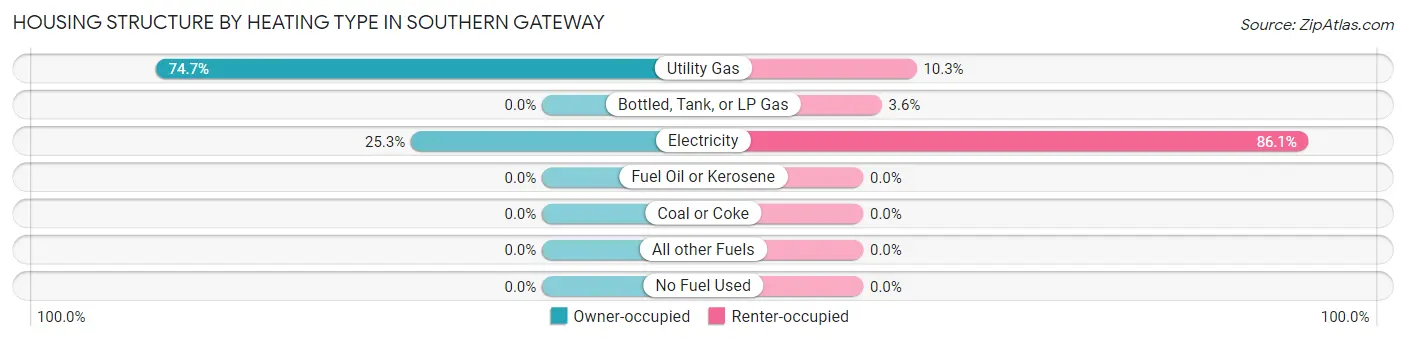
| Heating Type | Owner-occupied | Renter-occupied |
| Utility Gas | 283 (74.7%) | 75 (10.3%) |
| Bottled, Tank, or LP Gas | 0 (0.0%) | 26 (3.6%) |
| Electricity | 96 (25.3%) | 626 (86.1%) |
| Fuel Oil or Kerosene | 0 (0.0%) | 0 (0.0%) |
| Coal or Coke | 0 (0.0%) | 0 (0.0%) |
| All other Fuels | 0 (0.0%) | 0 (0.0%) |
| No Fuel Used | 0 (0.0%) | 0 (0.0%) |
| Total | 379 (100.0%) | 727 (100.0%) |
Household Vehicle Usage in Southern Gateway
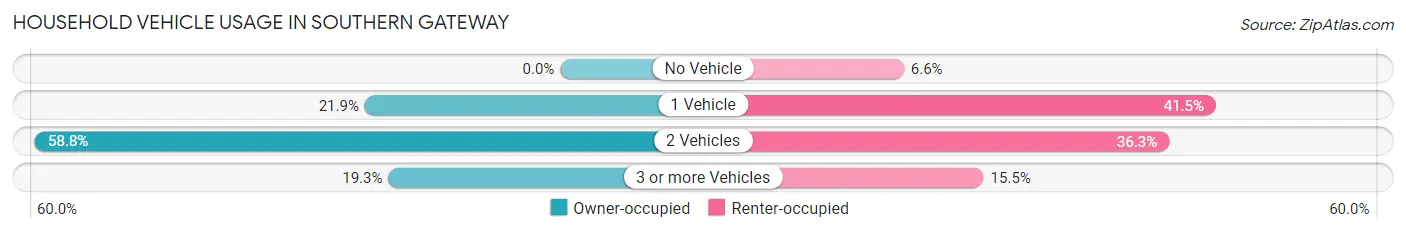
| Vehicles per Household | Owner-occupied | Renter-occupied |
| No Vehicle | 0 (0.0%) | 48 (6.6%) |
| 1 Vehicle | 83 (21.9%) | 302 (41.5%) |
| 2 Vehicles | 223 (58.8%) | 264 (36.3%) |
| 3 or more Vehicles | 73 (19.3%) | 113 (15.5%) |
| Total | 379 (100.0%) | 727 (100.0%) |
Real Estate & Mortgages in Southern Gateway
Real Estate and Mortgage Overview in Southern Gateway
| Characteristic | Without Mortgage | With Mortgage |
| Housing Units | 0 | 379 |
| Median Property Value | - | - |
| Median Household Income | - | - |
| Monthly Housing Costs | - | - |
| Real Estate Taxes | - | - |
Property Value by Mortgage Status in Southern Gateway
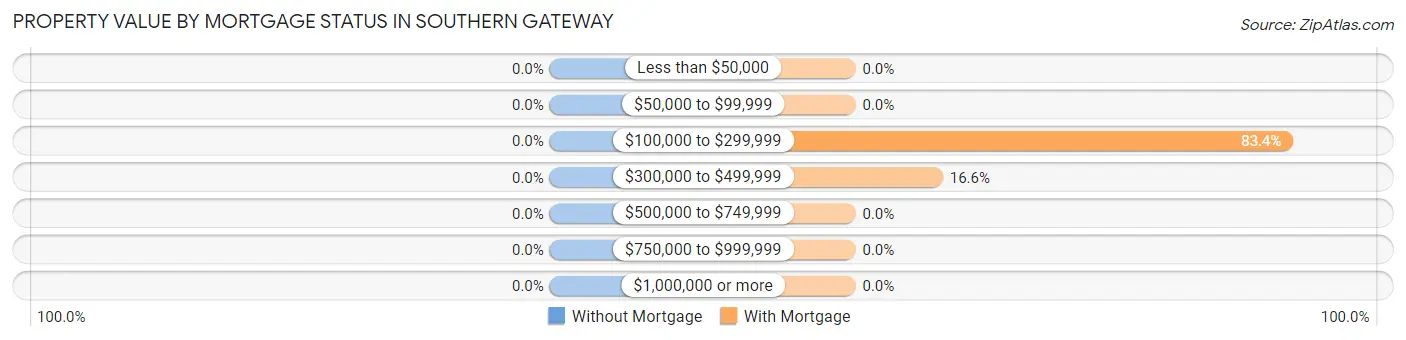
| Property Value | Without Mortgage | With Mortgage |
| Less than $50,000 | 0 (0.0%) | 0 (0.0%) |
| $50,000 to $99,999 | 0 (0.0%) | 0 (0.0%) |
| $100,000 to $299,999 | 0 (0.0%) | 316 (83.4%) |
| $300,000 to $499,999 | 0 (0.0%) | 63 (16.6%) |
| $500,000 to $749,999 | 0 (0.0%) | 0 (0.0%) |
| $750,000 to $999,999 | 0 (0.0%) | 0 (0.0%) |
| $1,000,000 or more | 0 (0.0%) | 0 (0.0%) |
| Total | 0 (0.0%) | 379 (100.0%) |
Household Income by Mortgage Status in Southern Gateway
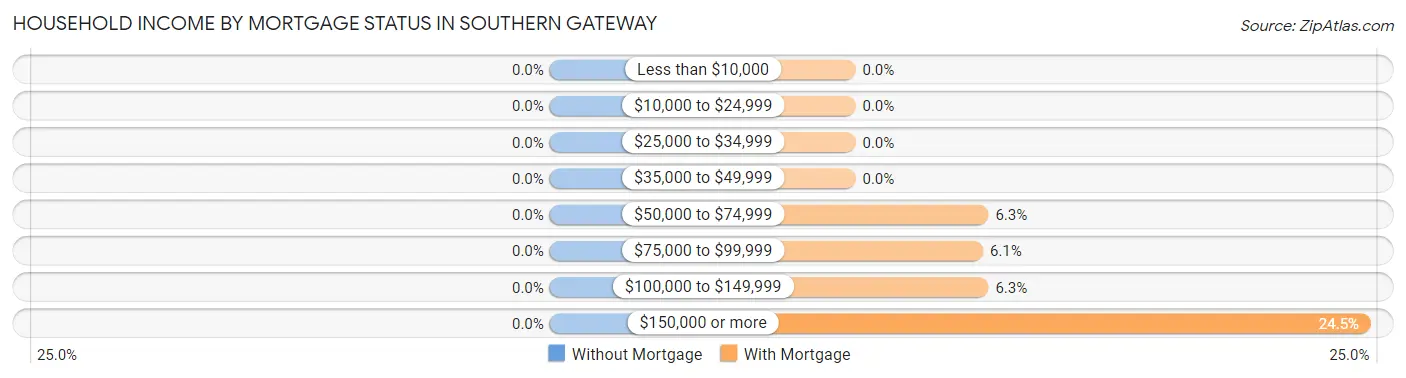
| Household Income | Without Mortgage | With Mortgage |
| Less than $10,000 | 0 (0.0%) | 0 (0.0%) |
| $10,000 to $24,999 | 0 (0.0%) | 0 (0.0%) |
| $25,000 to $34,999 | 0 (0.0%) | 0 (0.0%) |
| $35,000 to $49,999 | 0 (0.0%) | 0 (0.0%) |
| $50,000 to $74,999 | 0 (0.0%) | 24 (6.3%) |
| $75,000 to $99,999 | 0 (0.0%) | 23 (6.1%) |
| $100,000 to $149,999 | 0 (0.0%) | 24 (6.3%) |
| $150,000 or more | 0 (0.0%) | 93 (24.5%) |
| Total | 0 (0.0%) | 379 (100.0%) |
Property Value to Household Income Ratio in Southern Gateway
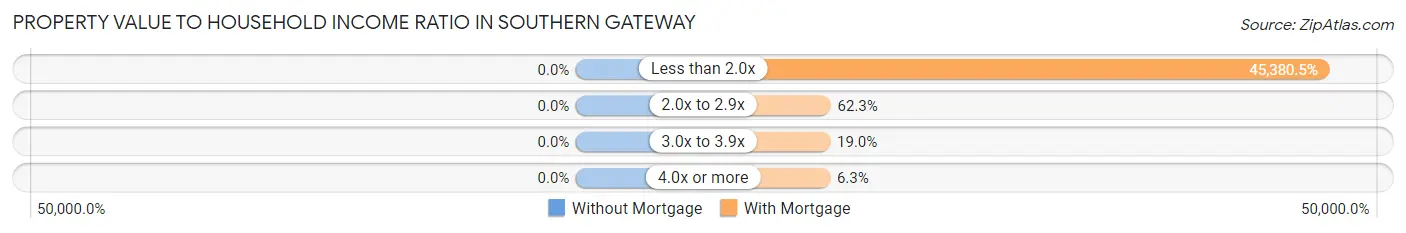
| Value-to-Income Ratio | Without Mortgage | With Mortgage |
| Less than 2.0x | 0 (0.0%) | 171,992 (45,380.5%) |
| 2.0x to 2.9x | 0 (0.0%) | 236 (62.3%) |
| 3.0x to 3.9x | 0 (0.0%) | 72 (19.0%) |
| 4.0x or more | 0 (0.0%) | 24 (6.3%) |
| Total | 0 (0.0%) | 379 (100.0%) |
Real Estate Taxes by Mortgage Status in Southern Gateway
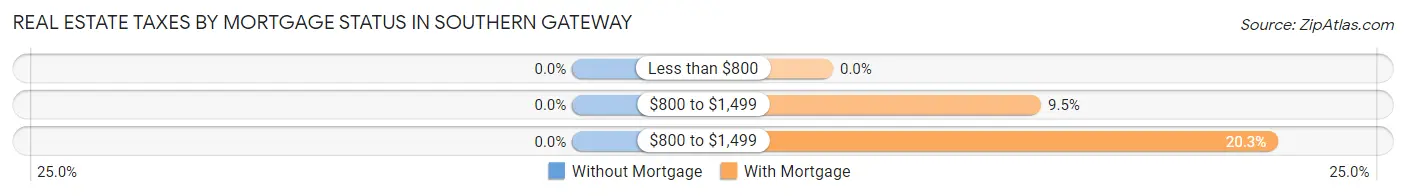
| Property Taxes | Without Mortgage | With Mortgage |
| Less than $800 | 0 (0.0%) | 0 (0.0%) |
| $800 to $1,499 | 0 (0.0%) | 36 (9.5%) |
| $800 to $1,499 | 0 (0.0%) | 77 (20.3%) |
| Total | 0 (0.0%) | 379 (100.0%) |
Health & Disability in Southern Gateway
Health Insurance Coverage by Age in Southern Gateway
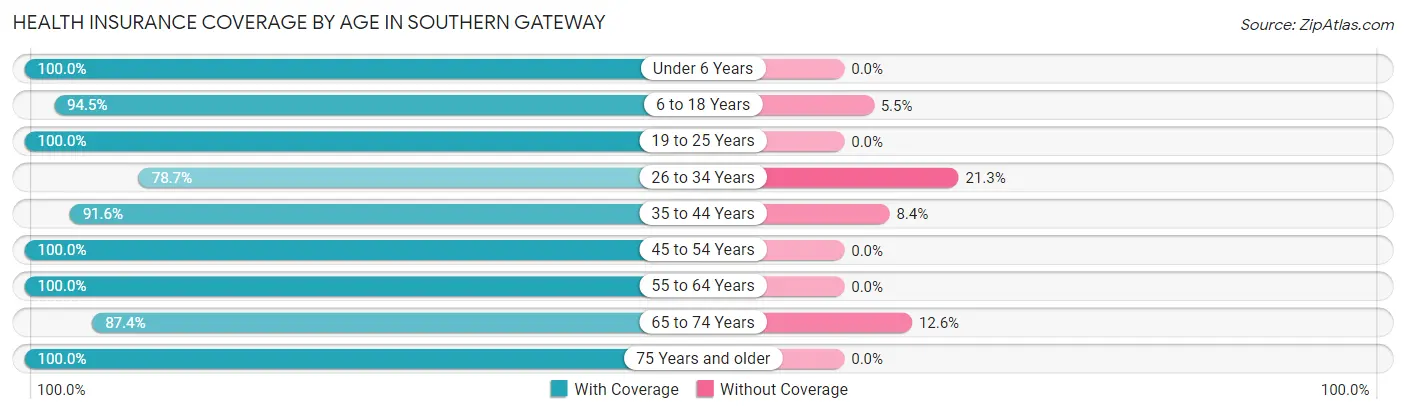
| Age Bracket | With Coverage | Without Coverage |
| Under 6 Years | 188 (100.0%) | 0 (0.0%) |
| 6 to 18 Years | 396 (94.5%) | 23 (5.5%) |
| 19 to 25 Years | 393 (100.0%) | 0 (0.0%) |
| 26 to 34 Years | 421 (78.7%) | 114 (21.3%) |
| 35 to 44 Years | 359 (91.6%) | 33 (8.4%) |
| 45 to 54 Years | 301 (100.0%) | 0 (0.0%) |
| 55 to 64 Years | 145 (100.0%) | 0 (0.0%) |
| 65 to 74 Years | 90 (87.4%) | 13 (12.6%) |
| 75 Years and older | 61 (100.0%) | 0 (0.0%) |
| Total | 2,354 (92.8%) | 183 (7.2%) |
Health Insurance Coverage by Citizenship Status in Southern Gateway
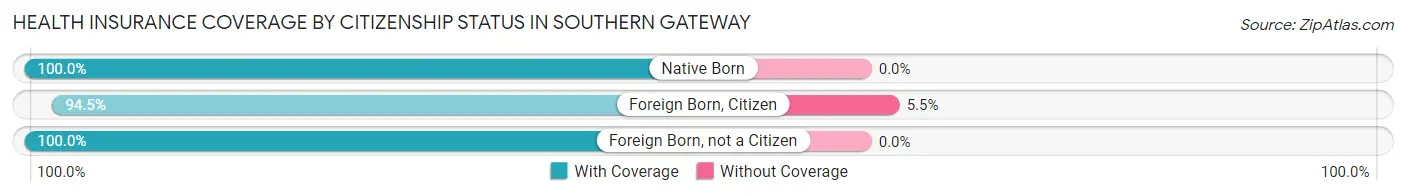
| Citizenship Status | With Coverage | Without Coverage |
| Native Born | 188 (100.0%) | 0 (0.0%) |
| Foreign Born, Citizen | 396 (94.5%) | 23 (5.5%) |
| Foreign Born, not a Citizen | 393 (100.0%) | 0 (0.0%) |
Health Insurance Coverage by Household Income in Southern Gateway
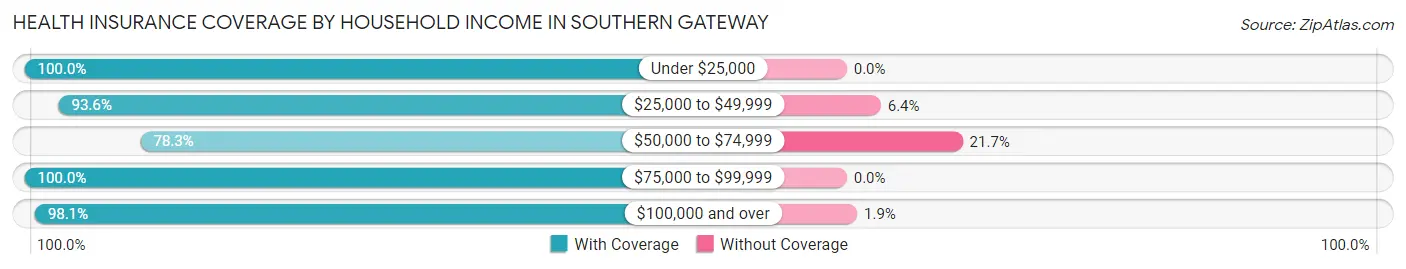
| Household Income | With Coverage | Without Coverage |
| Under $25,000 | 98 (100.0%) | 0 (0.0%) |
| $25,000 to $49,999 | 191 (93.6%) | 13 (6.4%) |
| $50,000 to $74,999 | 530 (78.3%) | 147 (21.7%) |
| $75,000 to $99,999 | 366 (100.0%) | 0 (0.0%) |
| $100,000 and over | 1,169 (98.1%) | 23 (1.9%) |
Public vs Private Health Insurance Coverage by Age in Southern Gateway
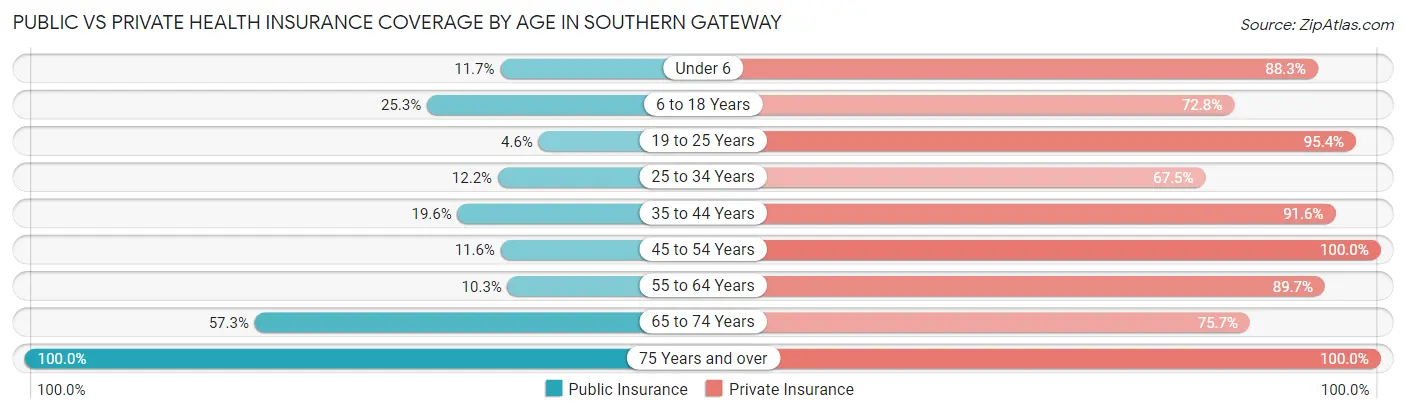
| Age Bracket | Public Insurance | Private Insurance |
| Under 6 | 22 (11.7%) | 166 (88.3%) |
| 6 to 18 Years | 106 (25.3%) | 305 (72.8%) |
| 19 to 25 Years | 18 (4.6%) | 375 (95.4%) |
| 25 to 34 Years | 65 (12.1%) | 361 (67.5%) |
| 35 to 44 Years | 77 (19.6%) | 359 (91.6%) |
| 45 to 54 Years | 35 (11.6%) | 301 (100.0%) |
| 55 to 64 Years | 15 (10.3%) | 130 (89.7%) |
| 65 to 74 Years | 59 (57.3%) | 78 (75.7%) |
| 75 Years and over | 61 (100.0%) | 61 (100.0%) |
| Total | 458 (18.0%) | 2,136 (84.2%) |
Disability Status by Sex by Age in Southern Gateway
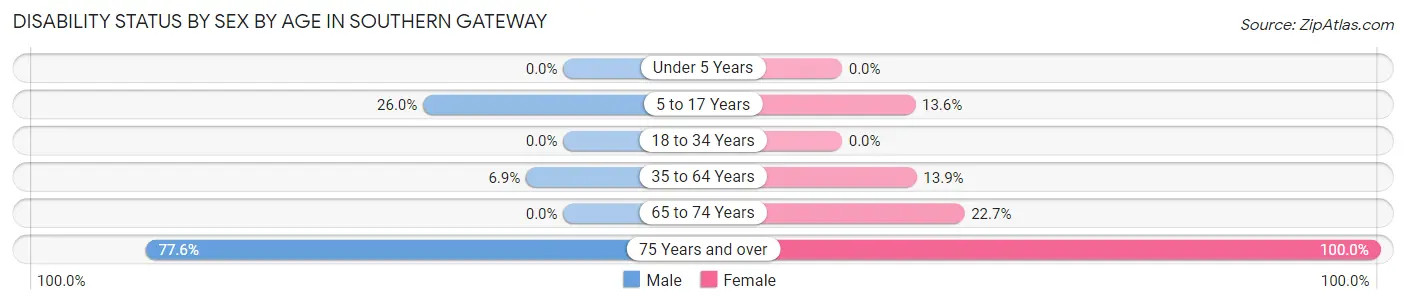
| Age Bracket | Male | Female |
| Under 5 Years | 0 (0.0%) | 0 (0.0%) |
| 5 to 17 Years | 38 (26.0%) | 34 (13.6%) |
| 18 to 34 Years | 0 (0.0%) | 0 (0.0%) |
| 35 to 64 Years | 33 (6.9%) | 50 (13.9%) |
| 65 to 74 Years | 0 (0.0%) | 10 (22.7%) |
| 75 Years and over | 38 (77.5%) | 12 (100.0%) |
Disability Class by Sex by Age in Southern Gateway
Disability Class: Hearing Difficulty
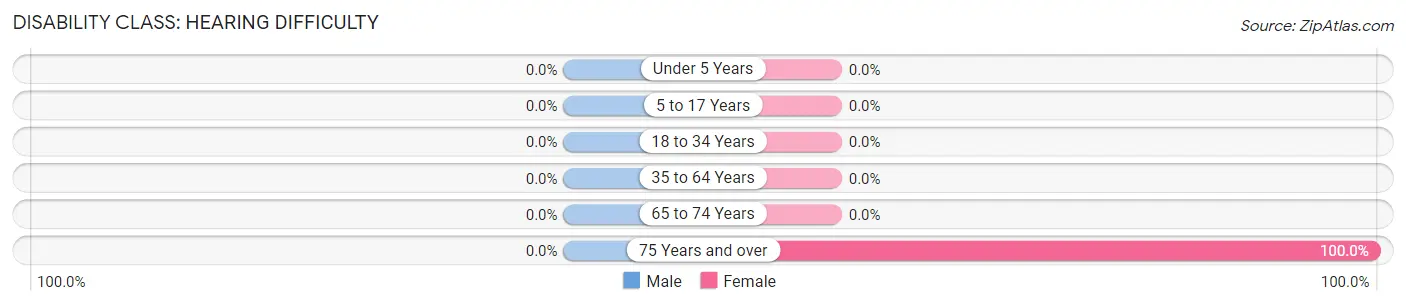
| Age Bracket | Male | Female |
| Under 5 Years | 0 (0.0%) | 0 (0.0%) |
| 5 to 17 Years | 0 (0.0%) | 0 (0.0%) |
| 18 to 34 Years | 0 (0.0%) | 0 (0.0%) |
| 35 to 64 Years | 0 (0.0%) | 0 (0.0%) |
| 65 to 74 Years | 0 (0.0%) | 0 (0.0%) |
| 75 Years and over | 0 (0.0%) | 12 (100.0%) |
Disability Class: Vision Difficulty
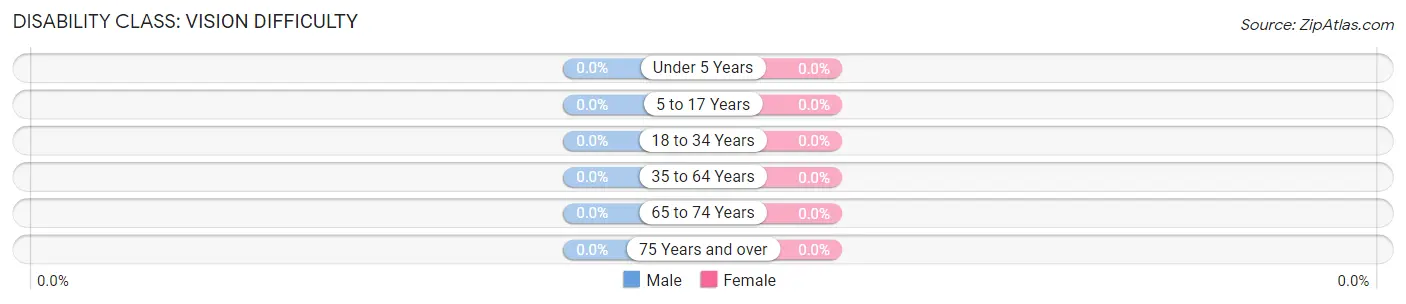
| Age Bracket | Male | Female |
| Under 5 Years | 0 (0.0%) | 0 (0.0%) |
| 5 to 17 Years | 0 (0.0%) | 0 (0.0%) |
| 18 to 34 Years | 0 (0.0%) | 0 (0.0%) |
| 35 to 64 Years | 0 (0.0%) | 0 (0.0%) |
| 65 to 74 Years | 0 (0.0%) | 0 (0.0%) |
| 75 Years and over | 0 (0.0%) | 0 (0.0%) |
Disability Class: Cognitive Difficulty
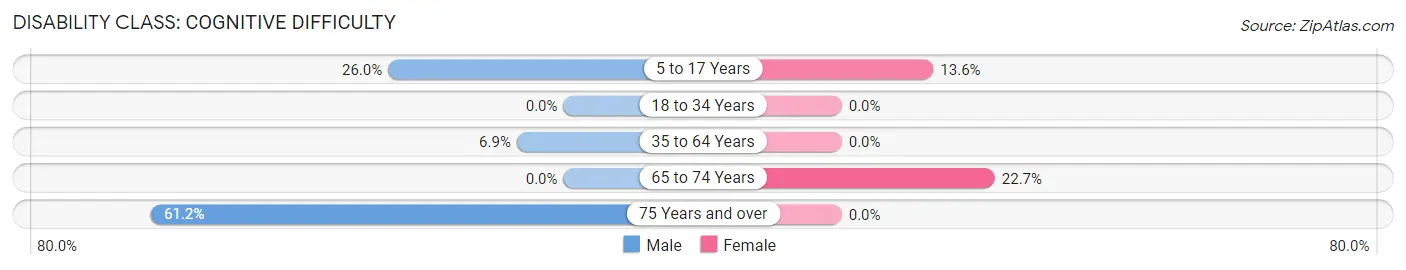
| Age Bracket | Male | Female |
| 5 to 17 Years | 38 (26.0%) | 34 (13.6%) |
| 18 to 34 Years | 0 (0.0%) | 0 (0.0%) |
| 35 to 64 Years | 33 (6.9%) | 0 (0.0%) |
| 65 to 74 Years | 0 (0.0%) | 10 (22.7%) |
| 75 Years and over | 30 (61.2%) | 0 (0.0%) |
Disability Class: Ambulatory Difficulty
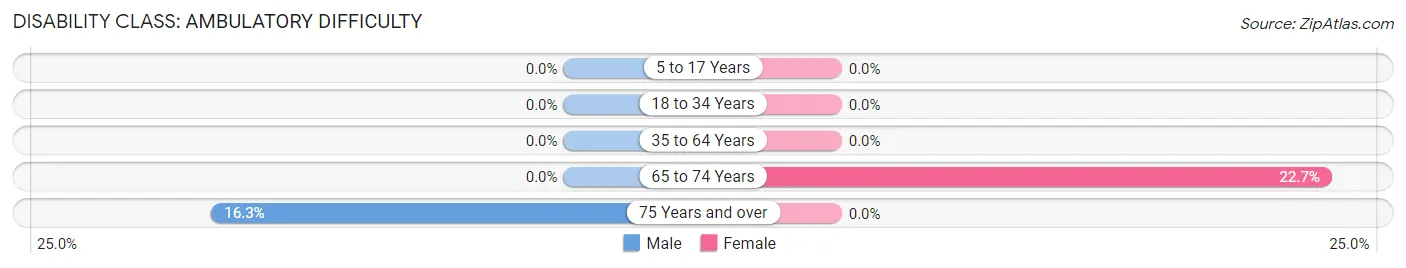
| Age Bracket | Male | Female |
| 5 to 17 Years | 0 (0.0%) | 0 (0.0%) |
| 18 to 34 Years | 0 (0.0%) | 0 (0.0%) |
| 35 to 64 Years | 0 (0.0%) | 0 (0.0%) |
| 65 to 74 Years | 0 (0.0%) | 10 (22.7%) |
| 75 Years and over | 8 (16.3%) | 0 (0.0%) |
Disability Class: Self-Care Difficulty
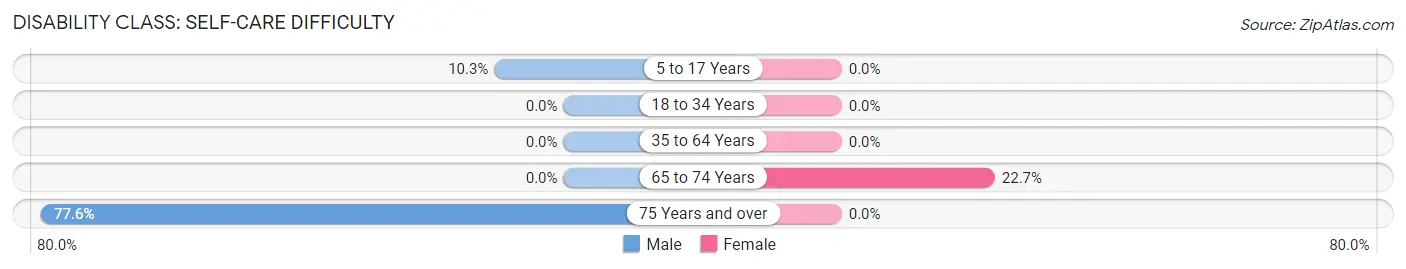
| Age Bracket | Male | Female |
| 5 to 17 Years | 15 (10.3%) | 0 (0.0%) |
| 18 to 34 Years | 0 (0.0%) | 0 (0.0%) |
| 35 to 64 Years | 0 (0.0%) | 0 (0.0%) |
| 65 to 74 Years | 0 (0.0%) | 10 (22.7%) |
| 75 Years and over | 38 (77.5%) | 0 (0.0%) |
Technology Access in Southern Gateway
Computing Device Access in Southern Gateway
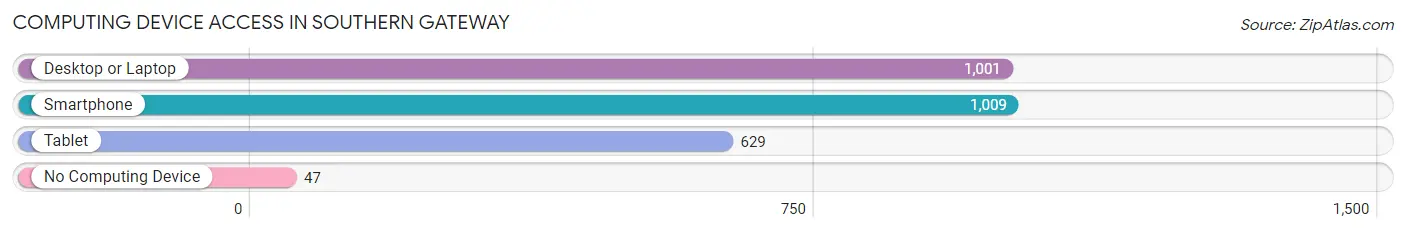
| Device Type | # Households | % Households |
| Desktop or Laptop | 1,001 | 90.5% |
| Smartphone | 1,009 | 91.2% |
| Tablet | 629 | 56.9% |
| No Computing Device | 47 | 4.3% |
| Total | 1,106 | 100.0% |
Internet Access in Southern Gateway
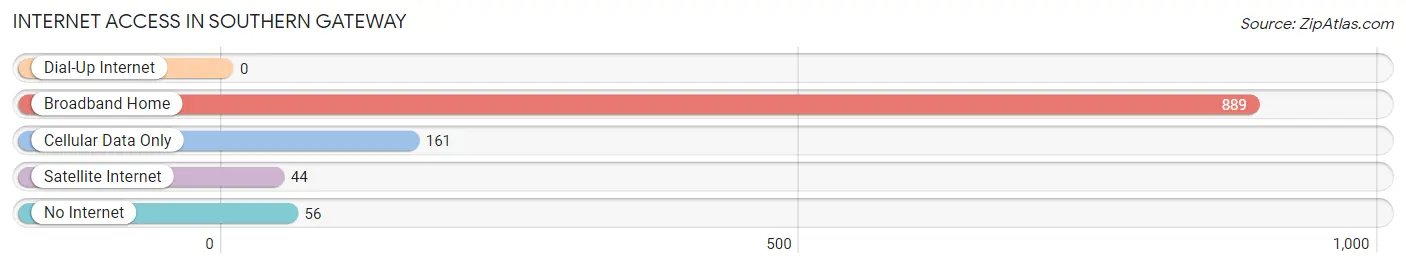
| Internet Type | # Households | % Households |
| Dial-Up Internet | 0 | 0.0% |
| Broadband Home | 889 | 80.4% |
| Cellular Data Only | 161 | 14.6% |
| Satellite Internet | 44 | 4.0% |
| No Internet | 56 | 5.1% |
| Total | 1,106 | 100.0% |
Southern Gateway Summary
The small town of Gateway, Virginia is located in the southeastern corner of the state, just north of the North Carolina border. It is a rural community with a population of just over 1,000 people, and is part of the larger Hampton Roads metropolitan area. Gateway is a small town with a rich history, a diverse economy, and a unique geography.
History
Gateway was first settled in the early 1700s by English colonists. The town was originally known as “Gateway to the South” due to its location near the North Carolina border. In the late 1700s, the town was renamed “Gateway” and became an important stop on the stagecoach route between Richmond and Norfolk. During the Civil War, Gateway was a strategic location for the Confederate Army, and the town was the site of several battles. After the war, the town experienced a period of growth and prosperity, and by the early 1900s, Gateway had become a thriving agricultural center.
In the mid-1900s, Gateway began to experience a decline in population and economic activity. The town’s economy shifted from agriculture to tourism, and the town began to attract visitors from all over the country. In the late 1990s, Gateway experienced a resurgence in population and economic activity, and the town has since become a popular destination for outdoor recreation and tourism.
Geography
Gateway is located in the southeastern corner of Virginia, just north of the North Carolina border. The town is situated in a rural area, surrounded by rolling hills and forests. The town is located near the Great Dismal Swamp National Wildlife Refuge, which is home to a variety of wildlife and plant species. The town is also located near the Atlantic Ocean, and is just a short drive from the popular beach towns of Virginia Beach and Norfolk.
Economy
Gateway’s economy is largely based on tourism and outdoor recreation. The town is home to several popular attractions, including the Great Dismal Swamp National Wildlife Refuge, the Gateway Marina, and the Gateway Museum. The town also has several restaurants, shops, and other businesses that cater to visitors. In addition, Gateway is home to several small businesses, including a local winery, a farm, and a bed and breakfast.
Demographics
As of the 2010 census, Gateway had a population of 1,072 people. The town is predominantly white, with a small African American population. The median household income in Gateway is $45,000, and the median home value is $150,000. The town has a low unemployment rate, and the majority of residents are employed in the tourism and outdoor recreation industries.
Gateway is a small town with a rich history, a diverse economy, and a unique geography. The town is a popular destination for outdoor recreation and tourism, and is home to a variety of businesses and attractions. Gateway is a great place to live, work, and visit, and is a great example of the beauty and diversity of rural Virginia.
Common Questions
What is Per Capita Income in Southern Gateway?
Per Capita income in Southern Gateway is $41,300.
What is the Median Family Income in Southern Gateway?
Median Family Income in Southern Gateway is $85,714.
What is the Median Household income in Southern Gateway?
Median Household Income in Southern Gateway is $79,278.
What is Income or Wage Gap in Southern Gateway?
Income or Wage Gap in Southern Gateway is 7.7%.
Women in Southern Gateway earn 92.3 cents for every dollar earned by a man.
What is Family Income Deficit in Southern Gateway?
Family Income Deficit in Southern Gateway is $4,577.
Families that are below poverty line in Southern Gateway earn $4,577 less on average than the poverty threshold level.
What is Inequality or Gini Index in Southern Gateway?
Inequality or Gini Index in Southern Gateway is 0.31.
What is the Total Population of Southern Gateway?
Total Population of Southern Gateway is 2,551.
What is the Total Male Population of Southern Gateway?
Total Male Population of Southern Gateway is 1,458.
What is the Total Female Population of Southern Gateway?
Total Female Population of Southern Gateway is 1,093.
What is the Ratio of Males per 100 Females in Southern Gateway?
There are 133.39 Males per 100 Females in Southern Gateway.
What is the Ratio of Females per 100 Males in Southern Gateway?
There are 74.97 Females per 100 Males in Southern Gateway.
What is the Median Population Age in Southern Gateway?
Median Population Age in Southern Gateway is 31.4 Years.
What is the Average Family Size in Southern Gateway
Average Family Size in Southern Gateway is 2.7 People.
What is the Average Household Size in Southern Gateway
Average Household Size in Southern Gateway is 2.3 People.
How Large is the Labor Force in Southern Gateway?
There are 1,745 People in the Labor Forcein in Southern Gateway.
What is the Percentage of People in the Labor Force in Southern Gateway?
84.7% of People are in the Labor Force in Southern Gateway.
What is the Unemployment Rate in Southern Gateway?
Unemployment Rate in Southern Gateway is 4.2%.