Clifton, VA Map & Demographics
Clifton Map
Clifton Overview
$77,527
PER CAPITA INCOME
$250,001
AVG FAMILY INCOME
$219,500
AVG HOUSEHOLD INCOME
0.38
INEQUALITY / GINI INDEX
358
TOTAL POPULATION
204
MALE POPULATION
154
FEMALE POPULATION
132.47
MALES / 100 FEMALES
75.49
FEMALES / 100 MALES
36.3
MEDIAN AGE
3.9
AVG FAMILY SIZE
3.5
AVG HOUSEHOLD SIZE
185
LABOR FORCE [ PEOPLE ]
71.2%
PERCENT IN LABOR FORCE
Clifton Zip Codes
Clifton Area Codes
Income in Clifton
Income Overview in Clifton
Per Capita Income in Clifton is $77,527, while median incomes of families and households are $250,001 and $219,500 respectively.
| Characteristic | Number | Measure |
| Per Capita Income | 358 | $77,527 |
| Median Family Income | 89 | $250,001 |
| Mean Family Income | 89 | $318,078 |
| Median Household Income | 102 | $219,500 |
| Mean Household Income | 102 | $290,422 |
| Income Deficit | 89 | $0 |
| Wage / Income Gap (%) | 358 | 0.00% |
| Wage / Income Gap ($) | 358 | 100.00¢ per $1 |
| Gini / Inequality Index | 358 | 0.38 |
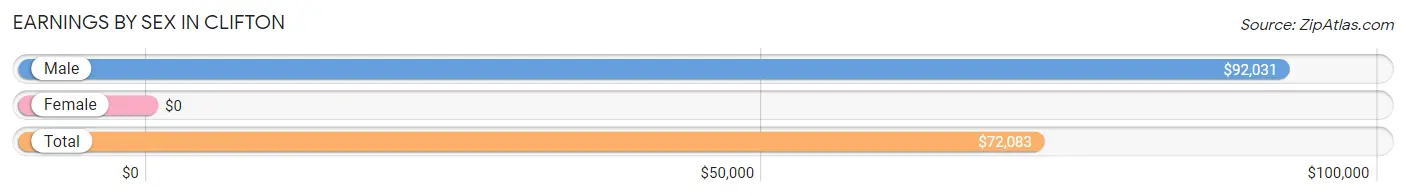
Earnings by Sex in Clifton
| Sex | Number | Average Earnings |
| Male | 115 (59.6%) | $92,031 |
| Female | 78 (40.4%) | $0 |
| Total | 193 (100.0%) | $72,083 |
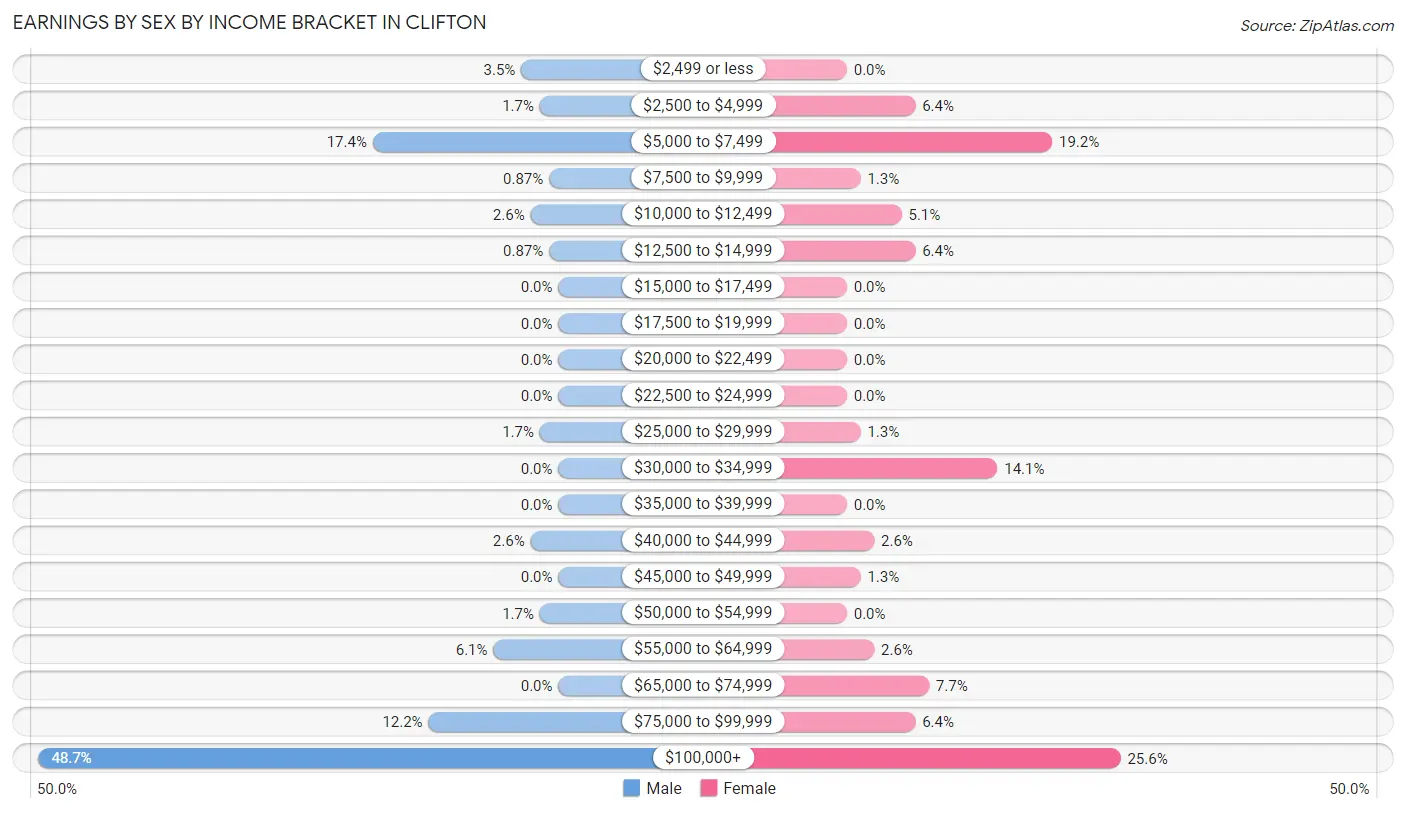
Earnings by Sex by Income Bracket in Clifton
The most common earnings brackets in Clifton are $100,000+ for men (56 | 48.7%) and $100,000+ for women (20 | 25.6%).
| Income | Male | Female |
| $2,499 or less | 4 (3.5%) | 0 (0.0%) |
| $2,500 to $4,999 | 2 (1.7%) | 5 (6.4%) |
| $5,000 to $7,499 | 20 (17.4%) | 15 (19.2%) |
| $7,500 to $9,999 | 1 (0.9%) | 1 (1.3%) |
| $10,000 to $12,499 | 3 (2.6%) | 4 (5.1%) |
| $12,500 to $14,999 | 1 (0.9%) | 5 (6.4%) |
| $15,000 to $17,499 | 0 (0.0%) | 0 (0.0%) |
| $17,500 to $19,999 | 0 (0.0%) | 0 (0.0%) |
| $20,000 to $22,499 | 0 (0.0%) | 0 (0.0%) |
| $22,500 to $24,999 | 0 (0.0%) | 0 (0.0%) |
| $25,000 to $29,999 | 2 (1.7%) | 1 (1.3%) |
| $30,000 to $34,999 | 0 (0.0%) | 11 (14.1%) |
| $35,000 to $39,999 | 0 (0.0%) | 0 (0.0%) |
| $40,000 to $44,999 | 3 (2.6%) | 2 (2.6%) |
| $45,000 to $49,999 | 0 (0.0%) | 1 (1.3%) |
| $50,000 to $54,999 | 2 (1.7%) | 0 (0.0%) |
| $55,000 to $64,999 | 7 (6.1%) | 2 (2.6%) |
| $65,000 to $74,999 | 0 (0.0%) | 6 (7.7%) |
| $75,000 to $99,999 | 14 (12.2%) | 5 (6.4%) |
| $100,000+ | 56 (48.7%) | 20 (25.6%) |
| Total | 115 (100.0%) | 78 (100.0%) |
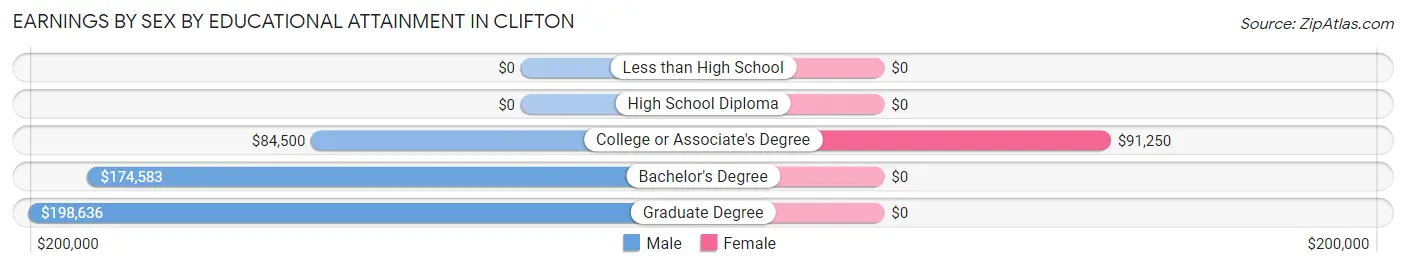
Earnings by Sex by Educational Attainment in Clifton
Average earnings in Clifton are $176,875 for men and $68,125 for women, a difference of 61.5%. Men with an educational attainment of graduate degree enjoy the highest average annual earnings of $198,636, while those with college or associate's degree education earn the least with $84,500. Women with an educational attainment of college or associate's degree earn the most with the average annual earnings of $91,250, while those with college or associate's degree education have the smallest earnings of $91,250.
| Educational Attainment | Male Income | Female Income |
| Less than High School | - | - |
| High School Diploma | - | - |
| College or Associate's Degree | $84,500 | $91,250 |
| Bachelor's Degree | $174,583 | $0 |
| Graduate Degree | $198,636 | $0 |
| Total | $176,875 | $68,125 |
Family Income in Clifton
Family Income Brackets in Clifton
According to the Clifton family income data, there are 66 families falling into the $200,000+ income range, which is the most common income bracket and makes up 74.2% of all families.
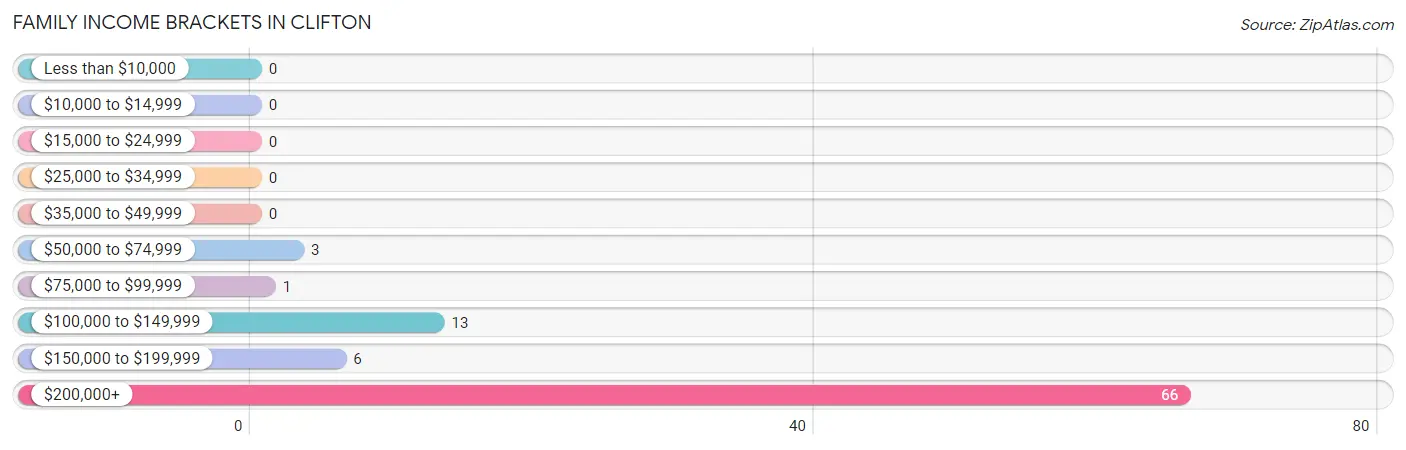
| Income Bracket | # Families | % Families |
| Less than $10,000 | 0 | 0.0% |
| $10,000 to $14,999 | 0 | 0.0% |
| $15,000 to $24,999 | 0 | 0.0% |
| $25,000 to $34,999 | 0 | 0.0% |
| $35,000 to $49,999 | 0 | 0.0% |
| $50,000 to $74,999 | 3 | 3.4% |
| $75,000 to $99,999 | 1 | 1.1% |
| $100,000 to $149,999 | 13 | 14.6% |
| $150,000 to $199,999 | 6 | 6.7% |
| $200,000+ | 66 | 74.2% |
Family Income by Famaliy Size in Clifton
5-person families (17 | 19.1%) account for the highest median family income in Clifton with $250,001 per family, while 2-person families (31 | 34.8%) have the highest median income of $84,375 per family member.
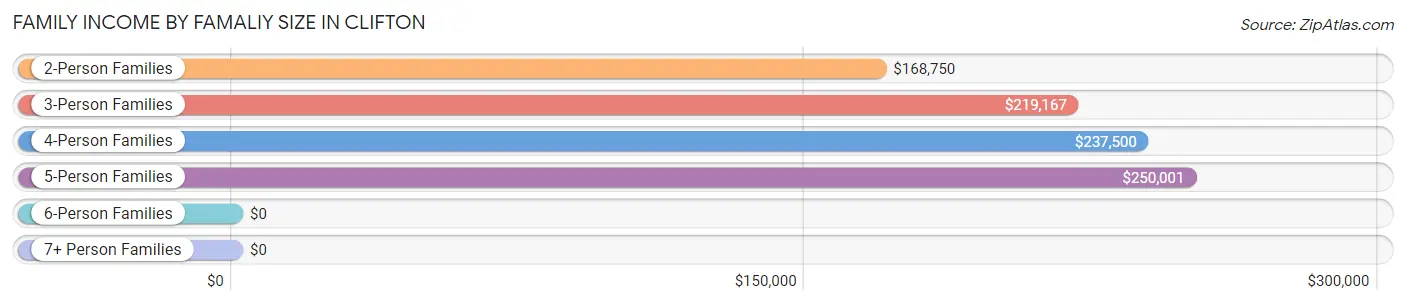
| Income Bracket | # Families | Median Income |
| 2-Person Families | 31 (34.8%) | $168,750 |
| 3-Person Families | 14 (15.7%) | $219,167 |
| 4-Person Families | 8 (9.0%) | $237,500 |
| 5-Person Families | 17 (19.1%) | $250,001 |
| 6-Person Families | 19 (21.3%) | $0 |
| 7+ Person Families | 0 (0.0%) | $0 |
| Total | 89 (100.0%) | $250,001 |
Family Income by Number of Earners in Clifton
The median family income in Clifton is $250,001, with families comprising 3+ earners (26) having the highest median family income of $250,001, while families with no earners (10) have the lowest median family income of $112,500, accounting for 29.2% and 11.2% of families, respectively.
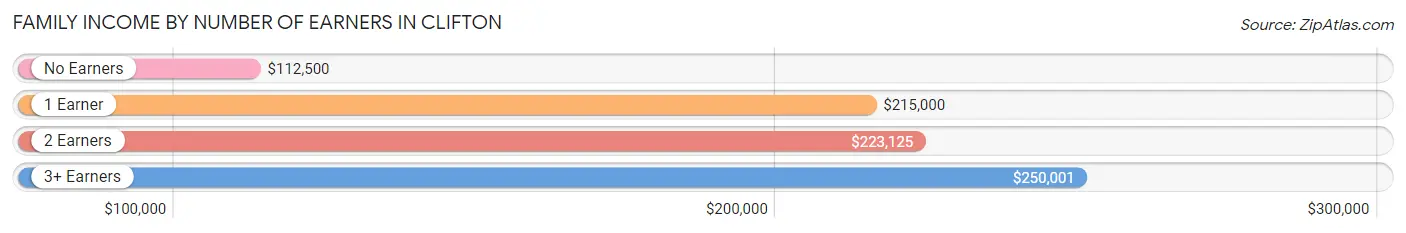
| Number of Earners | # Families | Median Income |
| No Earners | 10 (11.2%) | $112,500 |
| 1 Earner | 10 (11.2%) | $215,000 |
| 2 Earners | 43 (48.3%) | $223,125 |
| 3+ Earners | 26 (29.2%) | $250,001 |
| Total | 89 (100.0%) | $250,001 |
Household Income in Clifton
Household Income Brackets in Clifton
With 67 households falling in the category, the $200,000+ income range is the most frequent in Clifton, accounting for 65.7% of all households.
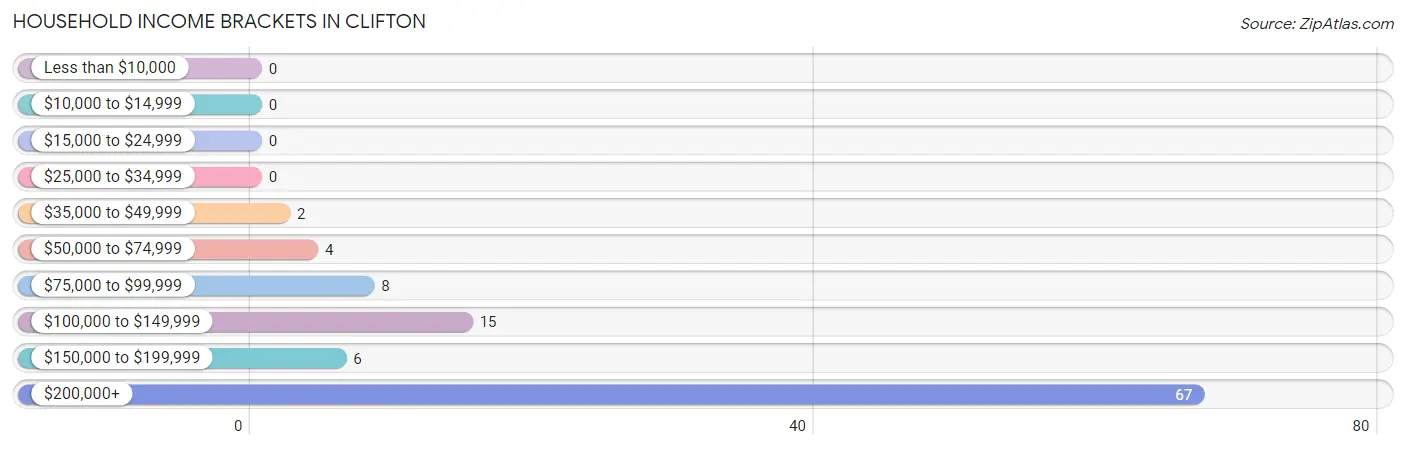
| Income Bracket | # Households | % Households |
| Less than $10,000 | 0 | 0.0% |
| $10,000 to $14,999 | 0 | 0.0% |
| $15,000 to $24,999 | 0 | 0.0% |
| $25,000 to $34,999 | 0 | 0.0% |
| $35,000 to $49,999 | 2 | 2.0% |
| $50,000 to $74,999 | 4 | 3.9% |
| $75,000 to $99,999 | 8 | 7.8% |
| $100,000 to $149,999 | 15 | 14.7% |
| $150,000 to $199,999 | 6 | 5.9% |
| $200,000+ | 67 | 65.7% |
Household Income by Householder Age in Clifton
The median household income in Clifton is $219,500, with the highest median household income of $250,001 found in the 25 to 44 years age bracket for the primary householder. A total of 18 households (17.6%) fall into this category. Meanwhile, the 15 to 24 years age bracket for the primary householder has the lowest median household income of $0, with 2 households (2.0%) in this group.
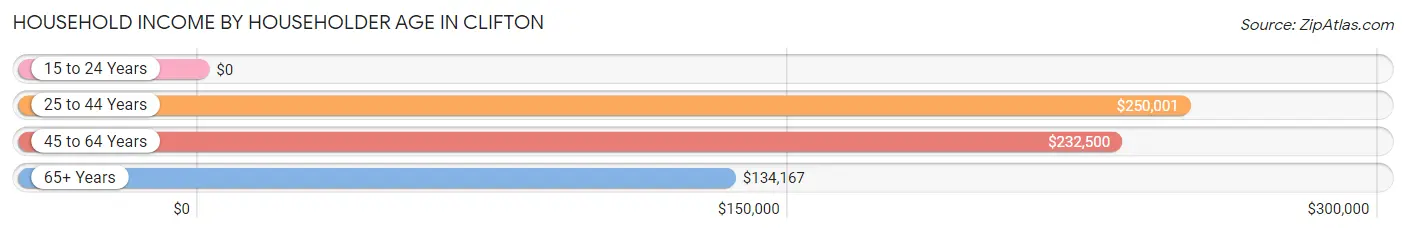
| Income Bracket | # Households | Median Income |
| 15 to 24 Years | 2 (2.0%) | $0 |
| 25 to 44 Years | 18 (17.6%) | $250,001 |
| 45 to 64 Years | 54 (52.9%) | $232,500 |
| 65+ Years | 28 (27.5%) | $134,167 |
| Total | 102 (100.0%) | $219,500 |
Poverty in Clifton
Income Below Poverty by Sex and Age in Clifton
| Age Bracket | Male | Female |
| Under 5 Years | 0 (0.0%) | 0 (0.0%) |
| 5 Years | 0 (0.0%) | 0 (0.0%) |
| 6 to 11 Years | 0 (0.0%) | 0 (0.0%) |
| 12 to 14 Years | 0 (0.0%) | 0 (0.0%) |
| 15 Years | 0 (0.0%) | 0 (0.0%) |
| 16 and 17 Years | 0 (0.0%) | 0 (0.0%) |
| 18 to 24 Years | 0 (0.0%) | 0 (0.0%) |
| 25 to 34 Years | 0 (0.0%) | 0 (0.0%) |
| 35 to 44 Years | 0 (0.0%) | 0 (0.0%) |
| 45 to 54 Years | 0 (0.0%) | 0 (0.0%) |
| 55 to 64 Years | 0 (0.0%) | 0 (0.0%) |
| 65 to 74 Years | 0 (0.0%) | 0 (0.0%) |
| 75 Years and over | 0 (0.0%) | 0 (0.0%) |
| Total | 0 (0.0%) | 0 (0.0%) |
Income Above Poverty by Sex and Age in Clifton
According to the poverty statistics in Clifton, males aged under 5 years and females aged 5 years are the age groups that are most secure financially, with 100.0% of males and 100.0% of females in these age groups living above the poverty line.
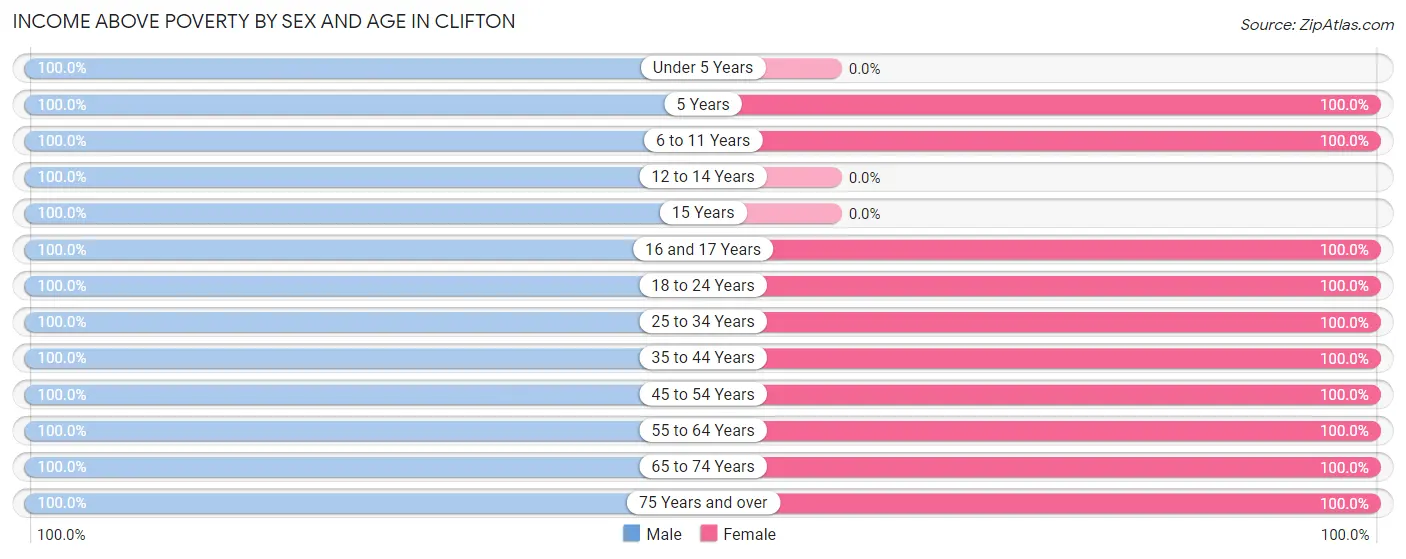
| Age Bracket | Male | Female |
| Under 5 Years | 4 (100.0%) | 0 (0.0%) |
| 5 Years | 7 (100.0%) | 17 (100.0%) |
| 6 to 11 Years | 20 (100.0%) | 10 (100.0%) |
| 12 to 14 Years | 27 (100.0%) | 0 (0.0%) |
| 15 Years | 13 (100.0%) | 0 (0.0%) |
| 16 and 17 Years | 3 (100.0%) | 15 (100.0%) |
| 18 to 24 Years | 29 (100.0%) | 11 (100.0%) |
| 25 to 34 Years | 13 (100.0%) | 8 (100.0%) |
| 35 to 44 Years | 7 (100.0%) | 10 (100.0%) |
| 45 to 54 Years | 34 (100.0%) | 38 (100.0%) |
| 55 to 64 Years | 20 (100.0%) | 15 (100.0%) |
| 65 to 74 Years | 20 (100.0%) | 17 (100.0%) |
| 75 Years and over | 7 (100.0%) | 13 (100.0%) |
| Total | 204 (100.0%) | 154 (100.0%) |
Income Below Poverty Among Married-Couple Families in Clifton
| Children | Above Poverty | Below Poverty |
| No Children | 41 (100.0%) | 0 (0.0%) |
| 1 or 2 Children | 19 (100.0%) | 0 (0.0%) |
| 3 or 4 Children | 27 (100.0%) | 0 (0.0%) |
| 5 or more Children | 0 (0.0%) | 0 (0.0%) |
| Total | 87 (100.0%) | 0 (0.0%) |
Income Below Poverty Among Single-Parent Households in Clifton
| Children | Single Father | Single Mother |
| No Children | 0 (0.0%) | 0 (0.0%) |
| 1 or 2 Children | 0 (0.0%) | 0 (0.0%) |
| 3 or 4 Children | 0 (0.0%) | 0 (0.0%) |
| 5 or more Children | 0 (0.0%) | 0 (0.0%) |
| Total | 0 (0.0%) | 0 (0.0%) |
Income Below Poverty Among Married-Couple vs Single-Parent Households in Clifton
| Children | Married-Couple Families | Single-Parent Households |
| No Children | 0 (0.0%) | 0 (0.0%) |
| 1 or 2 Children | 0 (0.0%) | 0 (0.0%) |
| 3 or 4 Children | 0 (0.0%) | 0 (0.0%) |
| 5 or more Children | 0 (0.0%) | 0 (0.0%) |
| Total | 0 (0.0%) | 0 (0.0%) |
Race in Clifton
The most populous races in Clifton are White / Caucasian (354 | 98.9%), Two or more Races (3 | 0.8%), and Hispanic or Latino (2 | 0.6%).
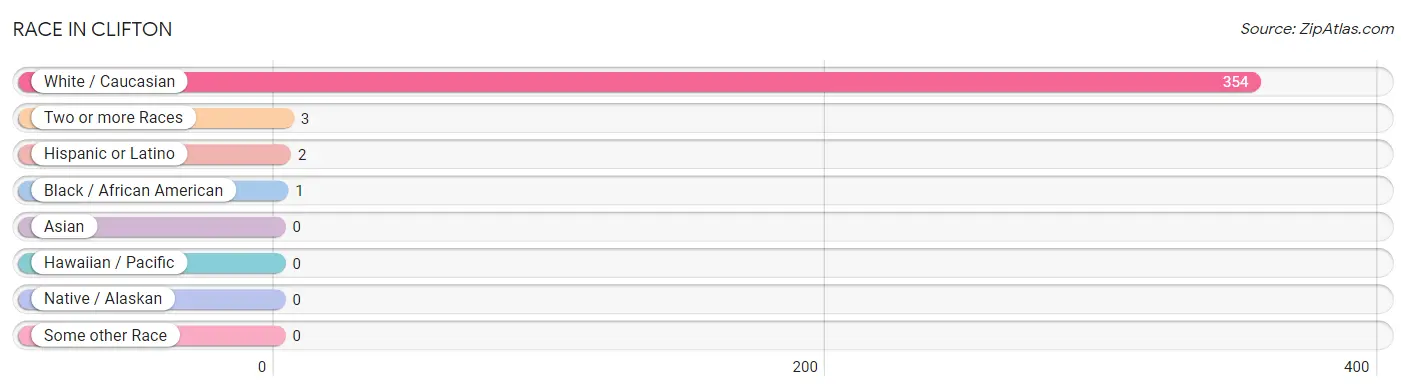
| Race | # Population | % Population |
| Asian | 0 | 0.0% |
| Black / African American | 1 | 0.3% |
| Hawaiian / Pacific | 0 | 0.0% |
| Hispanic or Latino | 2 | 0.6% |
| Native / Alaskan | 0 | 0.0% |
| White / Caucasian | 354 | 98.9% |
| Two or more Races | 3 | 0.8% |
| Some other Race | 0 | 0.0% |
| Total | 358 | 100.0% |
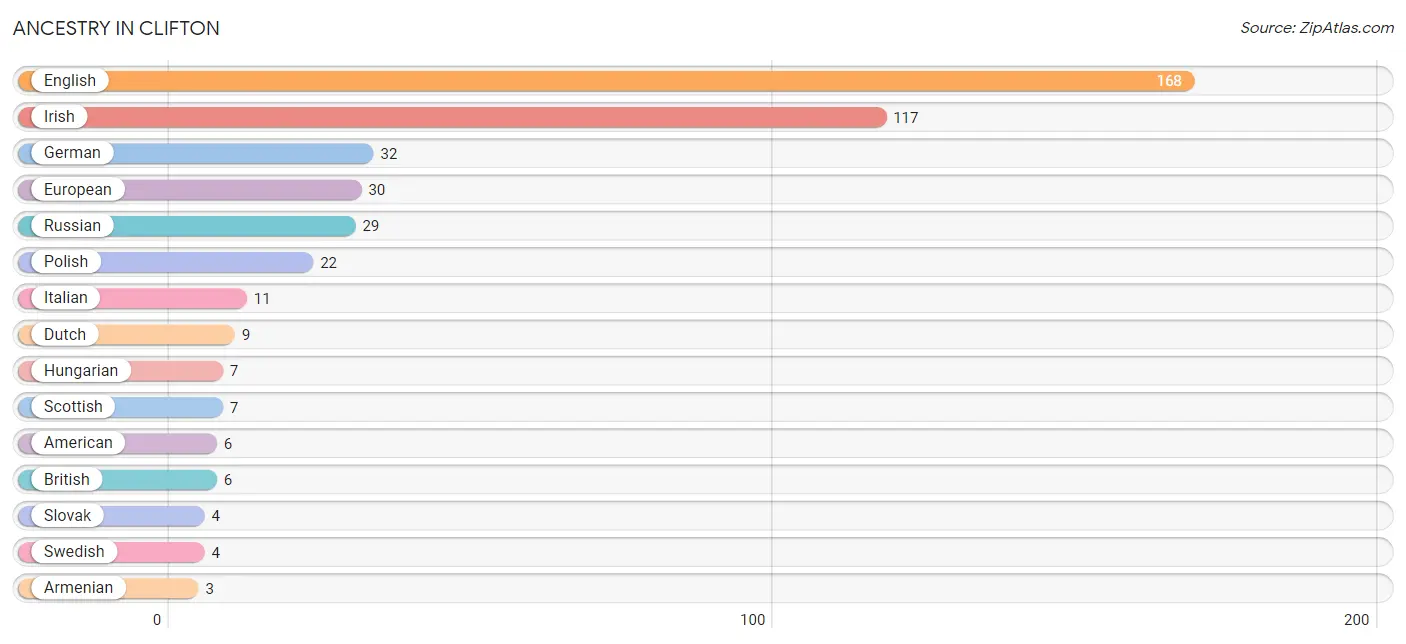
Ancestry in Clifton
The most populous ancestries reported in Clifton are English (168 | 46.9%), Irish (117 | 32.7%), German (32 | 8.9%), European (30 | 8.4%), and Russian (29 | 8.1%), together accounting for 105.0% of all Clifton residents.
| Ancestry | # Population | % Population |
| African | 1 | 0.3% |
| American | 6 | 1.7% |
| Armenian | 3 | 0.8% |
| British | 6 | 1.7% |
| Cherokee | 1 | 0.3% |
| Colombian | 1 | 0.3% |
| Danish | 1 | 0.3% |
| Dutch | 9 | 2.5% |
| Eastern European | 2 | 0.6% |
| English | 168 | 46.9% |
| European | 30 | 8.4% |
| German | 32 | 8.9% |
| Greek | 3 | 0.8% |
| Hungarian | 7 | 2.0% |
| Iranian | 2 | 0.6% |
| Irish | 117 | 32.7% |
| Italian | 11 | 3.1% |
| Polish | 22 | 6.1% |
| Portuguese | 3 | 0.8% |
| Russian | 29 | 8.1% |
| Scandinavian | 2 | 0.6% |
| Scotch-Irish | 3 | 0.8% |
| Scottish | 7 | 2.0% |
| Slovak | 4 | 1.1% |
| South American | 1 | 0.3% |
| Spaniard | 1 | 0.3% |
| Subsaharan African | 1 | 0.3% |
| Swedish | 4 | 1.1% |
| Ukrainian | 2 | 0.6% | View All 29 Rows |
Immigrants in Clifton
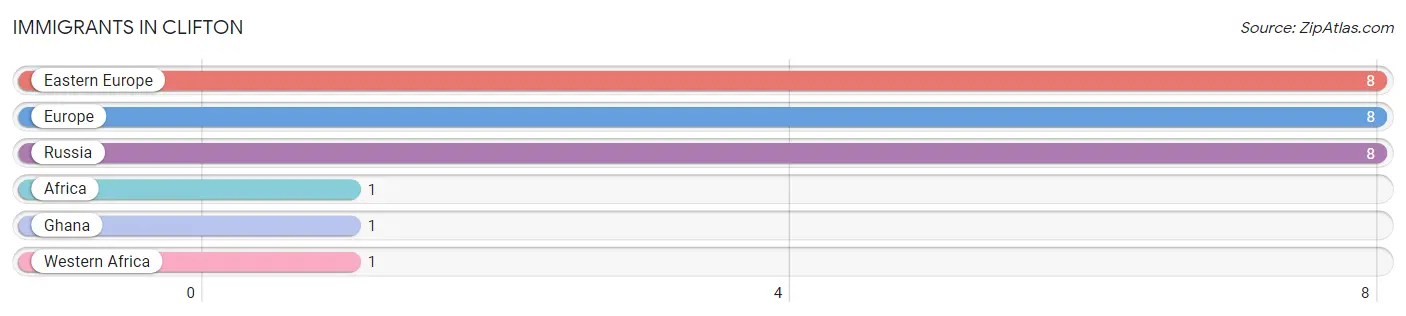
The most numerous immigrant groups reported in Clifton came from Eastern Europe (8 | 2.2%), Europe (8 | 2.2%), Russia (8 | 2.2%), Africa (1 | 0.3%), and Ghana (1 | 0.3%), together accounting for 7.2% of all Clifton residents.
| Immigration Origin | # Population | % Population |
| Africa | 1 | 0.3% |
| Eastern Europe | 8 | 2.2% |
| Europe | 8 | 2.2% |
| Ghana | 1 | 0.3% |
| Russia | 8 | 2.2% |
| Western Africa | 1 | 0.3% | View All 6 Rows |
Sex and Age in Clifton
Sex and Age in Clifton
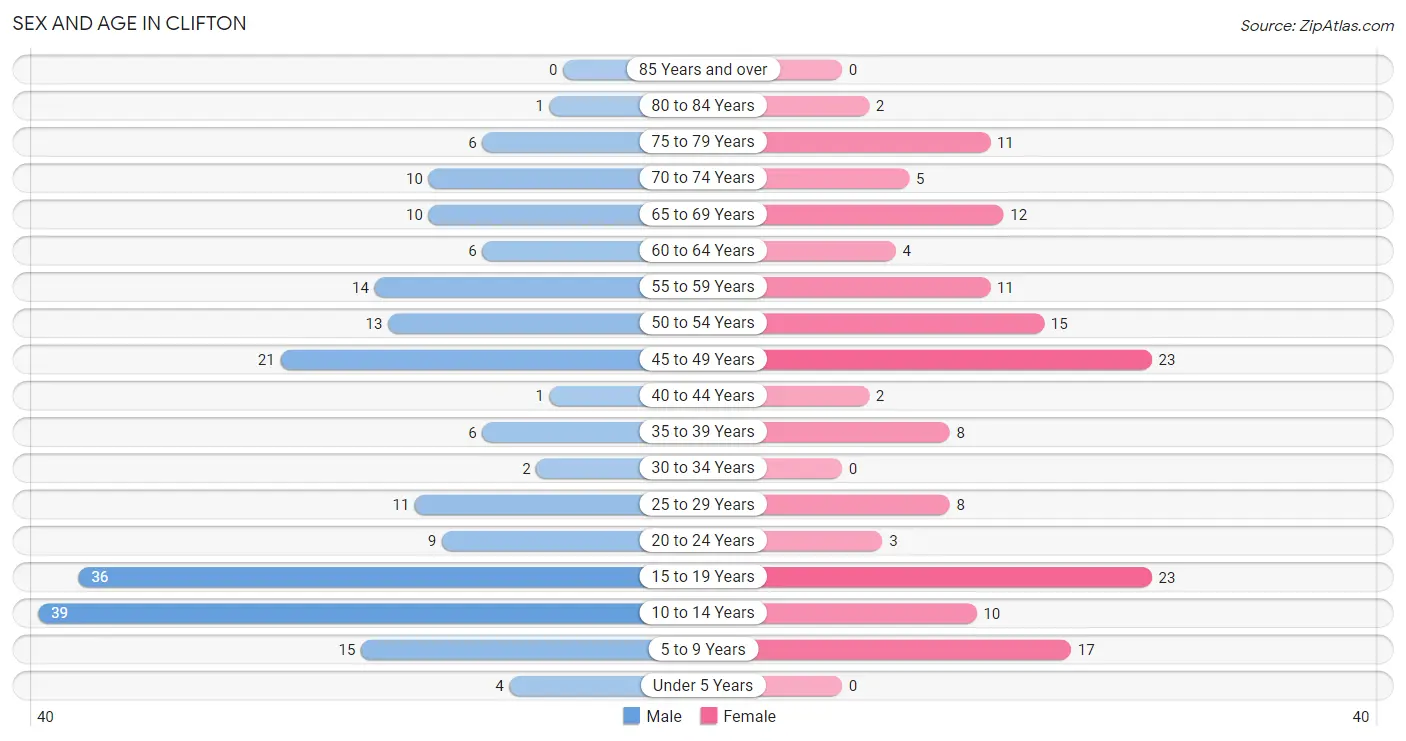
The most populous age groups in Clifton are 10 to 14 Years (39 | 19.1%) for men and 15 to 19 Years (23 | 14.9%) for women.
| Age Bracket | Male | Female |
| Under 5 Years | 4 (2.0%) | 0 (0.0%) |
| 5 to 9 Years | 15 (7.3%) | 17 (11.0%) |
| 10 to 14 Years | 39 (19.1%) | 10 (6.5%) |
| 15 to 19 Years | 36 (17.6%) | 23 (14.9%) |
| 20 to 24 Years | 9 (4.4%) | 3 (1.9%) |
| 25 to 29 Years | 11 (5.4%) | 8 (5.2%) |
| 30 to 34 Years | 2 (1.0%) | 0 (0.0%) |
| 35 to 39 Years | 6 (2.9%) | 8 (5.2%) |
| 40 to 44 Years | 1 (0.5%) | 2 (1.3%) |
| 45 to 49 Years | 21 (10.3%) | 23 (14.9%) |
| 50 to 54 Years | 13 (6.4%) | 15 (9.7%) |
| 55 to 59 Years | 14 (6.9%) | 11 (7.1%) |
| 60 to 64 Years | 6 (2.9%) | 4 (2.6%) |
| 65 to 69 Years | 10 (4.9%) | 12 (7.8%) |
| 70 to 74 Years | 10 (4.9%) | 5 (3.3%) |
| 75 to 79 Years | 6 (2.9%) | 11 (7.1%) |
| 80 to 84 Years | 1 (0.5%) | 2 (1.3%) |
| 85 Years and over | 0 (0.0%) | 0 (0.0%) |
| Total | 204 (100.0%) | 154 (100.0%) |
Families and Households in Clifton
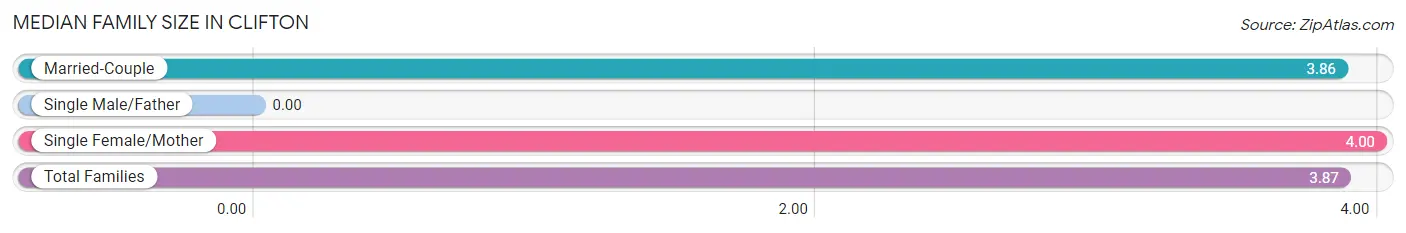
Median Family Size in Clifton
| Family Type | # Families | Family Size |
| Married-Couple | 87 (97.8%) | 3.86 |
| Single Male/Father | 0 (0.0%) | - |
| Single Female/Mother | 2 (2.2%) | 4.00 |
| Total Families | 89 (100.0%) | 3.87 |
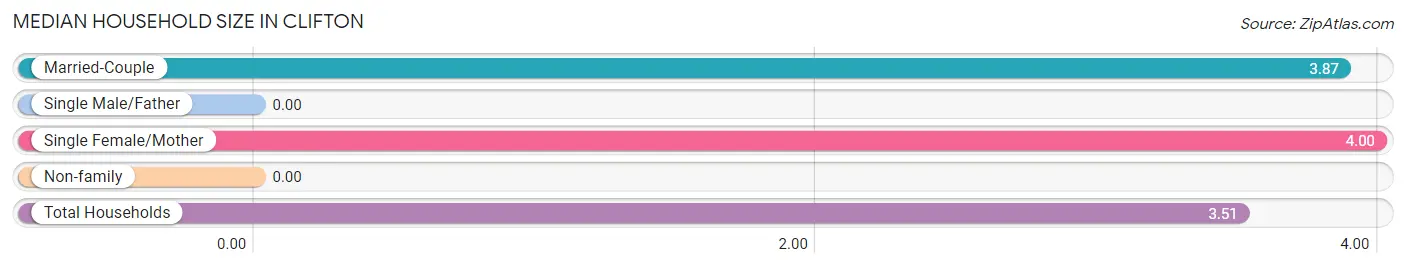
Median Household Size in Clifton
| Household Type | # Households | Household Size |
| Married-Couple | 87 (85.3%) | 3.87 |
| Single Male/Father | 0 (0.0%) | - |
| Single Female/Mother | 2 (2.0%) | 4.00 |
| Non-family | 13 (12.8%) | - |
| Total Households | 102 (100.0%) | 3.51 |
Household Size by Marriage Status in Clifton
Out of a total of 102 households in Clifton, 89 (87.3%) are family households, while 13 (12.8%) are nonfamily households. The most numerous type of family households are 2-person households, comprising 30, and the most common type of nonfamily households are 1-person households, comprising 13.
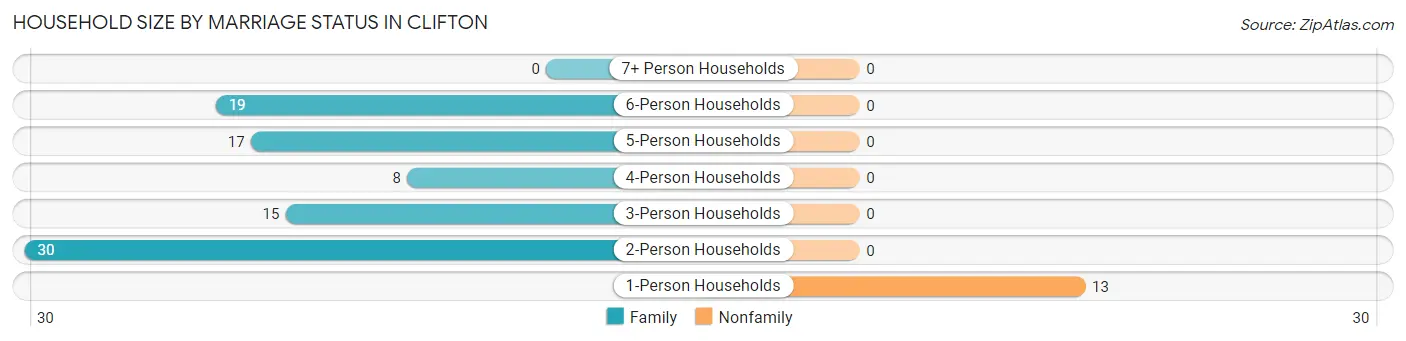
| Household Size | Family Households | Nonfamily Households |
| 1-Person Households | - | 13 (12.8%) |
| 2-Person Households | 30 (29.4%) | 0 (0.0%) |
| 3-Person Households | 15 (14.7%) | 0 (0.0%) |
| 4-Person Households | 8 (7.8%) | 0 (0.0%) |
| 5-Person Households | 17 (16.7%) | 0 (0.0%) |
| 6-Person Households | 19 (18.6%) | 0 (0.0%) |
| 7+ Person Households | 0 (0.0%) | 0 (0.0%) |
| Total | 89 (87.3%) | 13 (12.8%) |
Female Fertility in Clifton
Fertility by Age in Clifton
Average fertility rate in Clifton is 30.0 births per 1,000 women. Women in the age bracket of 35 to 50 years have the highest fertility rate with 61.0 births per 1,000 women. Women in the age bracket of 35 to 50 years acount for 100.0% of all women with births.
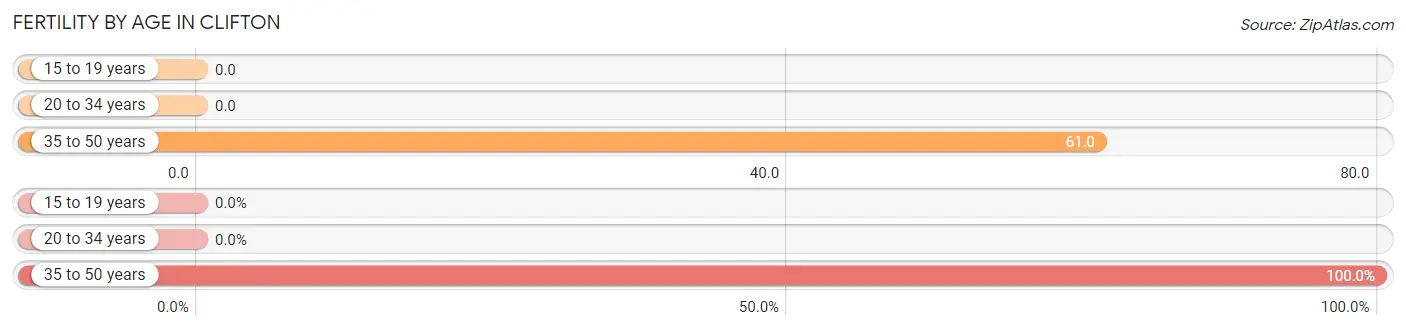
| Age Bracket | Women with Births | Births / 1,000 Women |
| 15 to 19 years | 0 (0.0%) | 0.0 |
| 20 to 34 years | 0 (0.0%) | 0.0 |
| 35 to 50 years | 2 (100.0%) | 61.0 |
| Total | 2 (100.0%) | 30.0 |
Fertility by Age by Marriage Status in Clifton
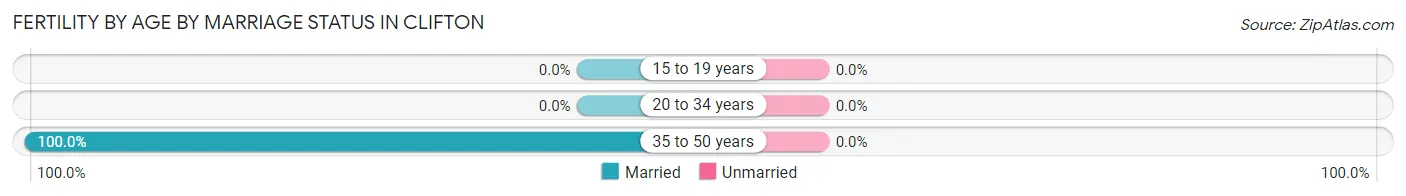
| Age Bracket | Married | Unmarried |
| 15 to 19 years | 0 (0.0%) | 0 (0.0%) |
| 20 to 34 years | 0 (0.0%) | 0 (0.0%) |
| 35 to 50 years | 2 (100.0%) | 0 (0.0%) |
| Total | 2 (100.0%) | 0 (0.0%) |
Fertility by Education in Clifton
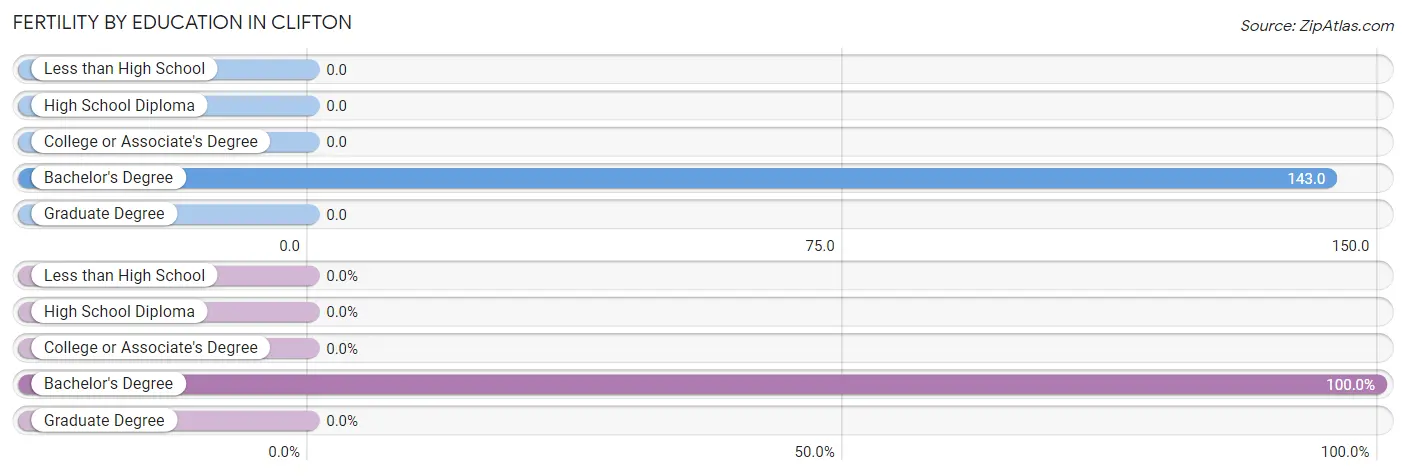
| Educational Attainment | Women with Births | Births / 1,000 Women |
| Less than High School | 0 (0.0%) | 0.0 |
| High School Diploma | 0 (0.0%) | 0.0 |
| College or Associate's Degree | 0 (0.0%) | 0.0 |
| Bachelor's Degree | 2 (100.0%) | 143.0 |
| Graduate Degree | 0 (0.0%) | 0.0 |
| Total | 2 (100.0%) | 30.0 |
Fertility by Education by Marriage Status in Clifton
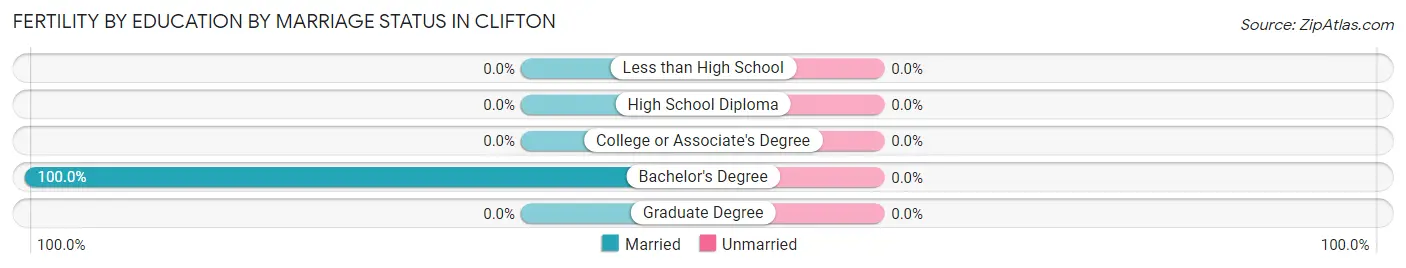
| Educational Attainment | Married | Unmarried |
| Less than High School | 0 (0.0%) | 0 (0.0%) |
| High School Diploma | 0 (0.0%) | 0 (0.0%) |
| College or Associate's Degree | 0 (0.0%) | 0 (0.0%) |
| Bachelor's Degree | 2 (100.0%) | 0 (0.0%) |
| Graduate Degree | 0 (0.0%) | 0 (0.0%) |
| Total | 2 (100.0%) | 0 (0.0%) |
Employment Characteristics in Clifton
Employment by Class of Employer in Clifton
Among the 185 employed individuals in Clifton, private company employees (133 | 71.9%), not-for-profit organizations (13 | 7.0%), and federal government employees (13 | 7.0%) make up the most common classes of employment.
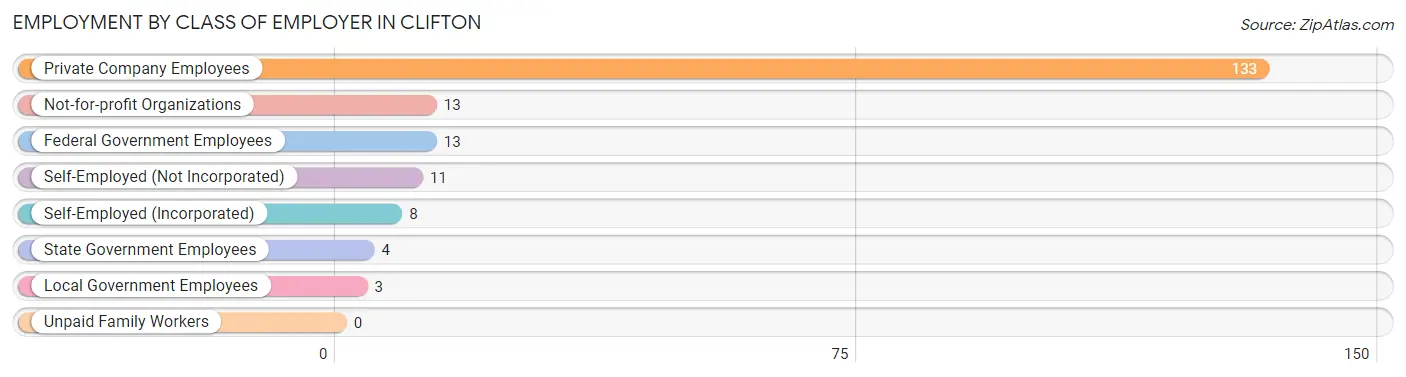
| Employer Class | # Employees | % Employees |
| Private Company Employees | 133 | 71.9% |
| Self-Employed (Incorporated) | 8 | 4.3% |
| Self-Employed (Not Incorporated) | 11 | 5.9% |
| Not-for-profit Organizations | 13 | 7.0% |
| Local Government Employees | 3 | 1.6% |
| State Government Employees | 4 | 2.2% |
| Federal Government Employees | 13 | 7.0% |
| Unpaid Family Workers | 0 | 0.0% |
| Total | 185 | 100.0% |
Employment Status by Age in Clifton
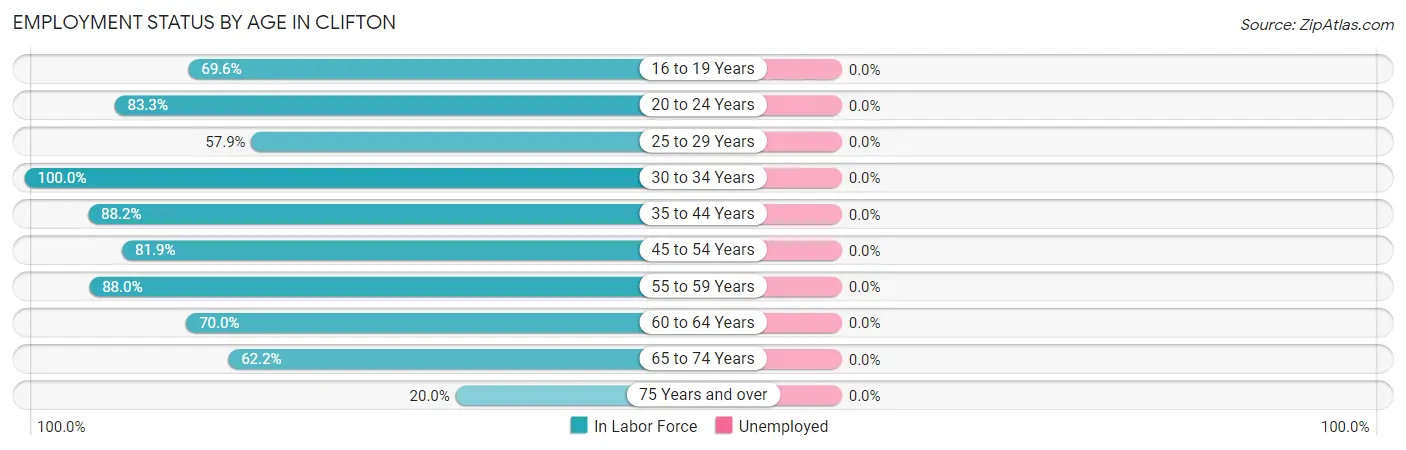
| Age Bracket | In Labor Force | Unemployed |
| 16 to 19 Years | 32 (69.6%) | 0 (0.0%) |
| 20 to 24 Years | 10 (83.3%) | 0 (0.0%) |
| 25 to 29 Years | 11 (57.9%) | 0 (0.0%) |
| 30 to 34 Years | 2 (100.0%) | 0 (0.0%) |
| 35 to 44 Years | 15 (88.2%) | 0 (0.0%) |
| 45 to 54 Years | 59 (81.9%) | 0 (0.0%) |
| 55 to 59 Years | 22 (88.0%) | 0 (0.0%) |
| 60 to 64 Years | 7 (70.0%) | 0 (0.0%) |
| 65 to 74 Years | 23 (62.2%) | 0 (0.0%) |
| 75 Years and over | 4 (20.0%) | 0 (0.0%) |
| Total | 185 (71.2%) | 0 (0.0%) |
Employment Status by Educational Attainment in Clifton
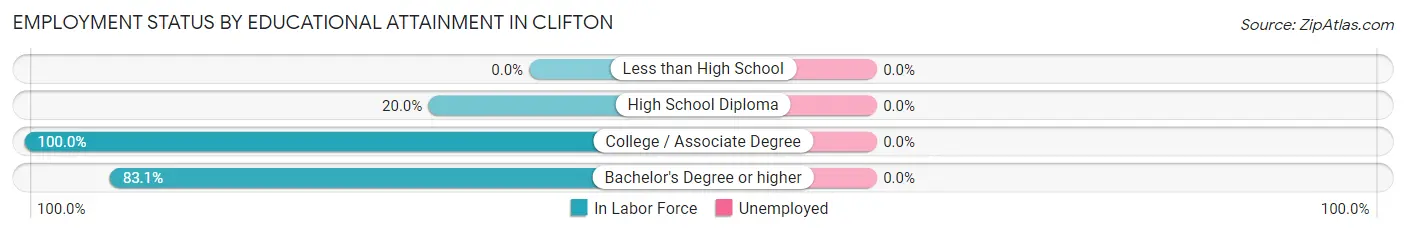
| Educational Attainment | In Labor Force | Unemployed |
| Less than High School | 0 (0.0%) | 0 (0.0%) |
| High School Diploma | 2 (20.0%) | 0 (0.0%) |
| College / Associate Degree | 11 (100.0%) | 0 (0.0%) |
| Bachelor's Degree or higher | 103 (83.1%) | 0 (0.0%) |
| Total | 116 (80.0%) | 0 (0.0%) |
Employment Occupations by Sex in Clifton
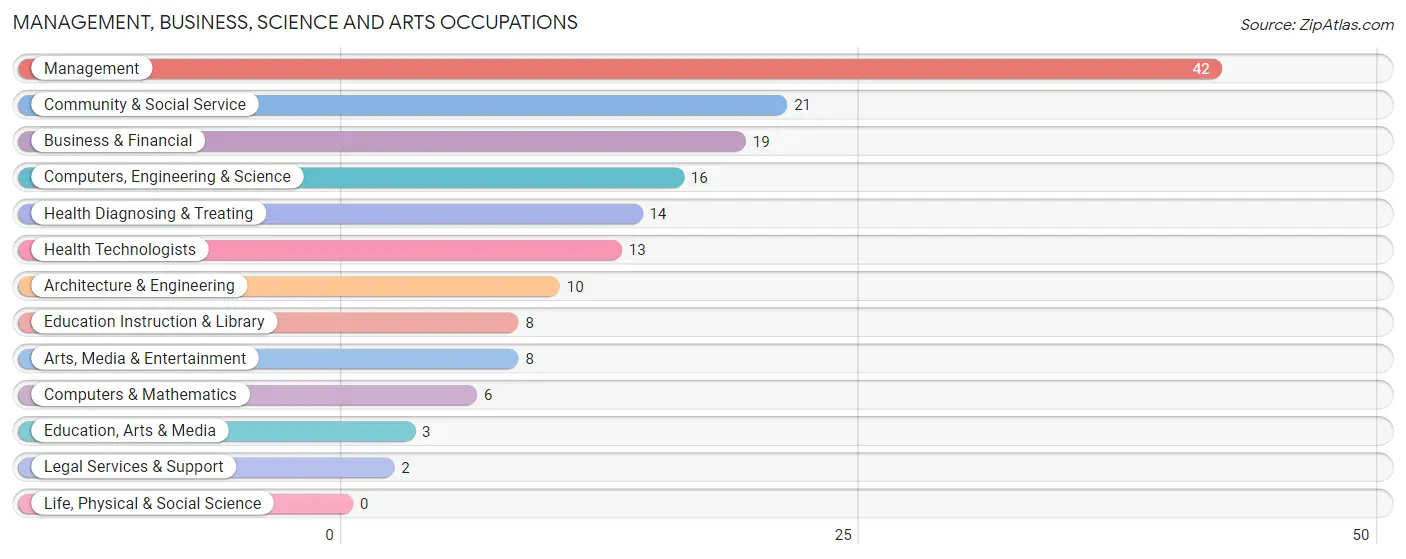
Management, Business, Science and Arts Occupations
The most common Management, Business, Science and Arts occupations in Clifton are Management (42 | 22.8%), Community & Social Service (21 | 11.4%), Business & Financial (19 | 10.3%), Computers, Engineering & Science (16 | 8.7%), and Health Diagnosing & Treating (14 | 7.6%).
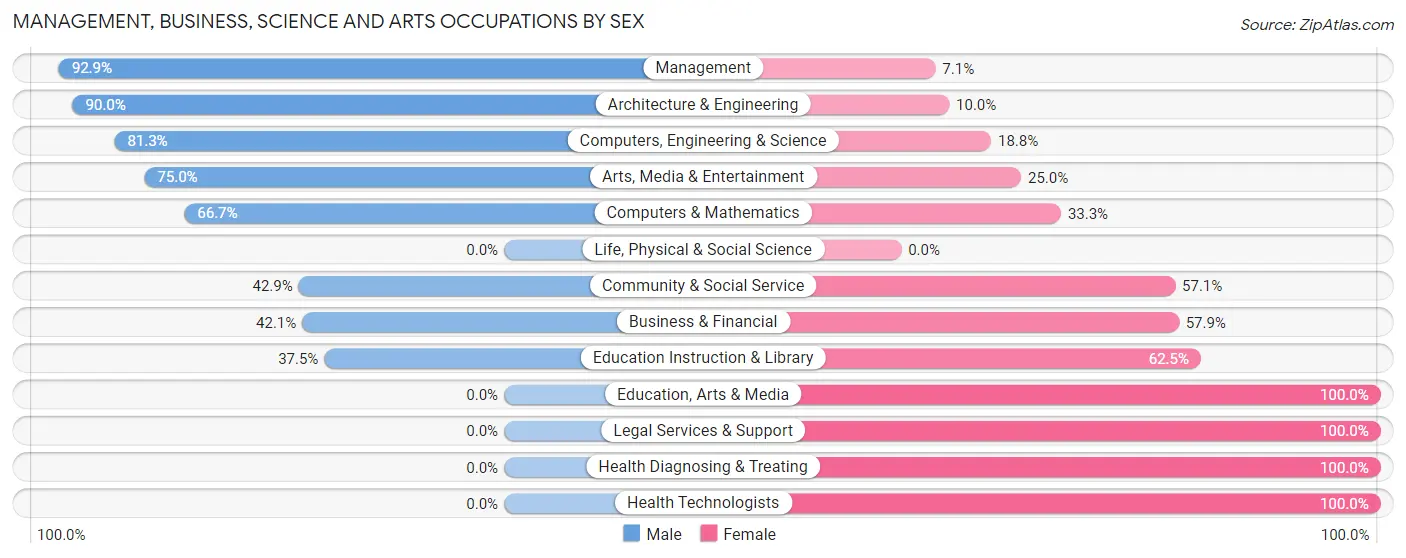
Management, Business, Science and Arts Occupations by Sex
Within the Management, Business, Science and Arts occupations in Clifton, the most male-oriented occupations are Management (92.9%), Architecture & Engineering (90.0%), and Computers, Engineering & Science (81.2%), while the most female-oriented occupations are Education, Arts & Media (100.0%), Legal Services & Support (100.0%), and Health Diagnosing & Treating (100.0%).
| Occupation | Male | Female |
| Management | 39 (92.9%) | 3 (7.1%) |
| Business & Financial | 8 (42.1%) | 11 (57.9%) |
| Computers, Engineering & Science | 13 (81.2%) | 3 (18.8%) |
| Computers & Mathematics | 4 (66.7%) | 2 (33.3%) |
| Architecture & Engineering | 9 (90.0%) | 1 (10.0%) |
| Life, Physical & Social Science | 0 (0.0%) | 0 (0.0%) |
| Community & Social Service | 9 (42.9%) | 12 (57.1%) |
| Education, Arts & Media | 0 (0.0%) | 3 (100.0%) |
| Legal Services & Support | 0 (0.0%) | 2 (100.0%) |
| Education Instruction & Library | 3 (37.5%) | 5 (62.5%) |
| Arts, Media & Entertainment | 6 (75.0%) | 2 (25.0%) |
| Health Diagnosing & Treating | 0 (0.0%) | 14 (100.0%) |
| Health Technologists | 0 (0.0%) | 13 (100.0%) |
| Total (Category) | 69 (61.6%) | 43 (38.4%) |
| Total (Overall) | 113 (61.4%) | 71 (38.6%) |
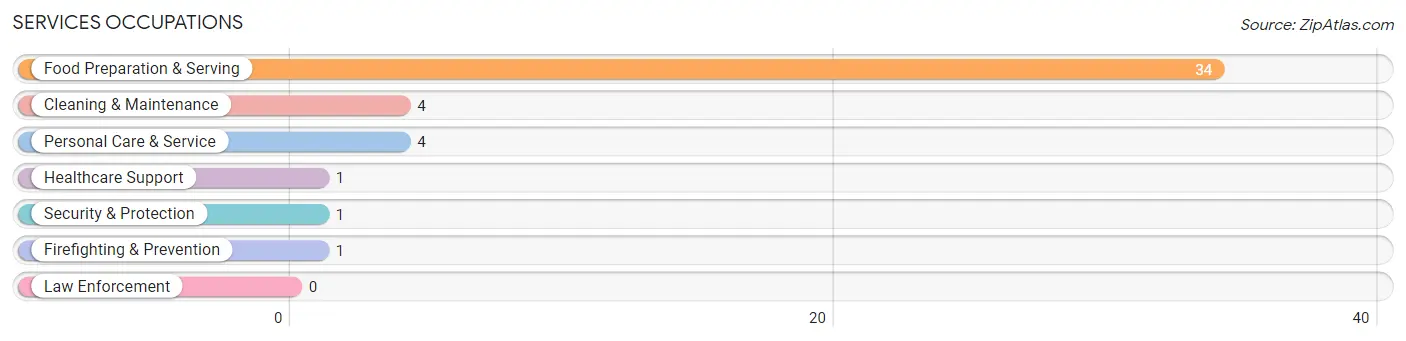
Services Occupations
The most common Services occupations in Clifton are Food Preparation & Serving (34 | 18.5%), Cleaning & Maintenance (4 | 2.2%), Personal Care & Service (4 | 2.2%), Healthcare Support (1 | 0.5%), and Security & Protection (1 | 0.5%).
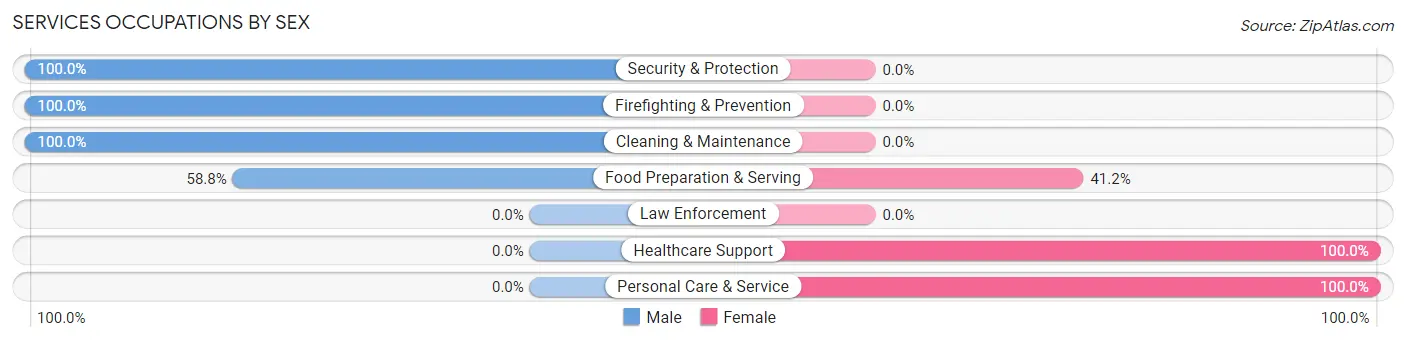
Services Occupations by Sex
Within the Services occupations in Clifton, the most male-oriented occupations are Security & Protection (100.0%), Firefighting & Prevention (100.0%), and Cleaning & Maintenance (100.0%), while the most female-oriented occupations are Healthcare Support (100.0%), Personal Care & Service (100.0%), and Food Preparation & Serving (41.2%).
| Occupation | Male | Female |
| Healthcare Support | 0 (0.0%) | 1 (100.0%) |
| Security & Protection | 1 (100.0%) | 0 (0.0%) |
| Firefighting & Prevention | 1 (100.0%) | 0 (0.0%) |
| Law Enforcement | 0 (0.0%) | 0 (0.0%) |
| Food Preparation & Serving | 20 (58.8%) | 14 (41.2%) |
| Cleaning & Maintenance | 4 (100.0%) | 0 (0.0%) |
| Personal Care & Service | 0 (0.0%) | 4 (100.0%) |
| Total (Category) | 25 (56.8%) | 19 (43.2%) |
| Total (Overall) | 113 (61.4%) | 71 (38.6%) |
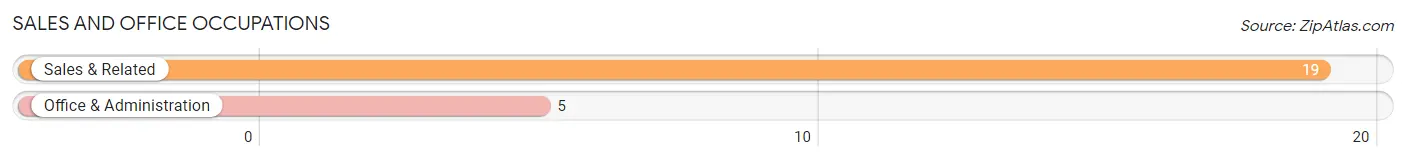
Sales and Office Occupations
The most common Sales and Office occupations in Clifton are Sales & Related (19 | 10.3%), and Office & Administration (5 | 2.7%).
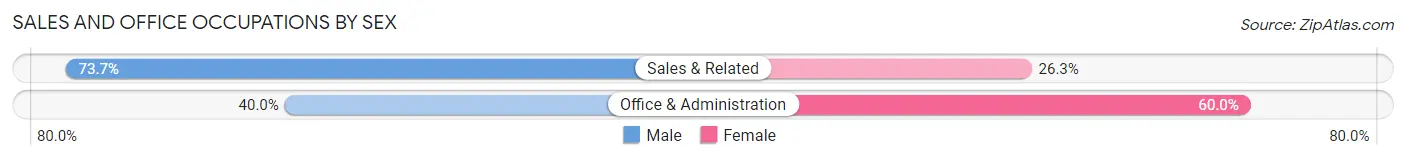
Sales and Office Occupations by Sex
| Occupation | Male | Female |
| Sales & Related | 14 (73.7%) | 5 (26.3%) |
| Office & Administration | 2 (40.0%) | 3 (60.0%) |
| Total (Category) | 16 (66.7%) | 8 (33.3%) |
| Total (Overall) | 113 (61.4%) | 71 (38.6%) |
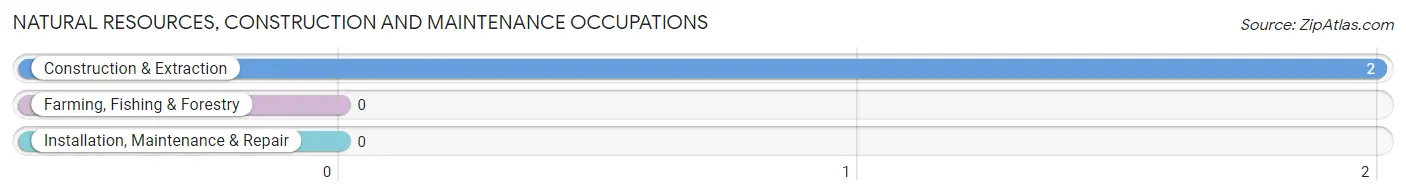
Natural Resources, Construction and Maintenance Occupations
The most common Natural Resources, Construction and Maintenance occupations in Clifton are , and Construction & Extraction (2 | 1.1%).
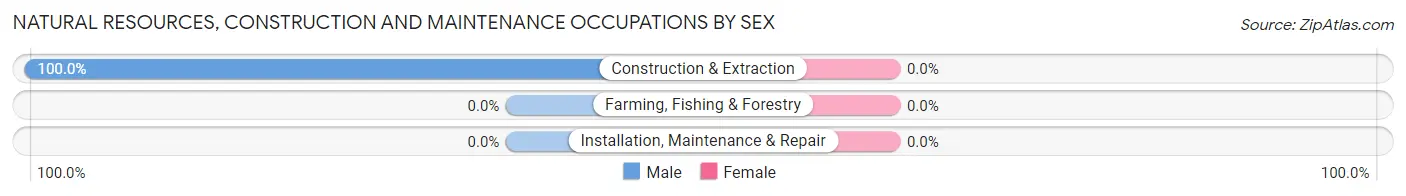
Natural Resources, Construction and Maintenance Occupations by Sex
| Occupation | Male | Female |
| Farming, Fishing & Forestry | 0 (0.0%) | 0 (0.0%) |
| Construction & Extraction | 2 (100.0%) | 0 (0.0%) |
| Installation, Maintenance & Repair | 0 (0.0%) | 0 (0.0%) |
| Total (Category) | 2 (100.0%) | 0 (0.0%) |
| Total (Overall) | 113 (61.4%) | 71 (38.6%) |
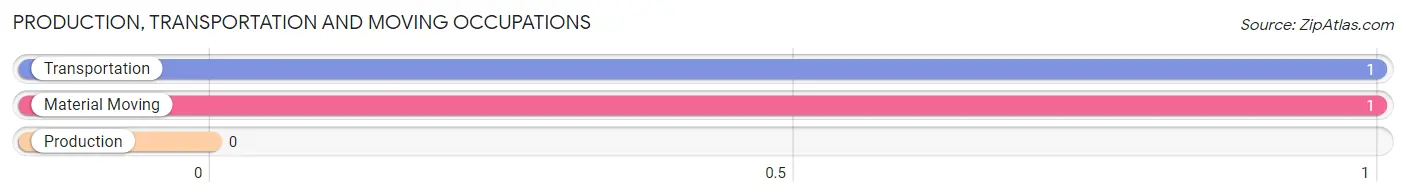
Production, Transportation and Moving Occupations
The most common Production, Transportation and Moving occupations in Clifton are Transportation (1 | 0.5%), and Material Moving (1 | 0.5%).
Production, Transportation and Moving Occupations by Sex
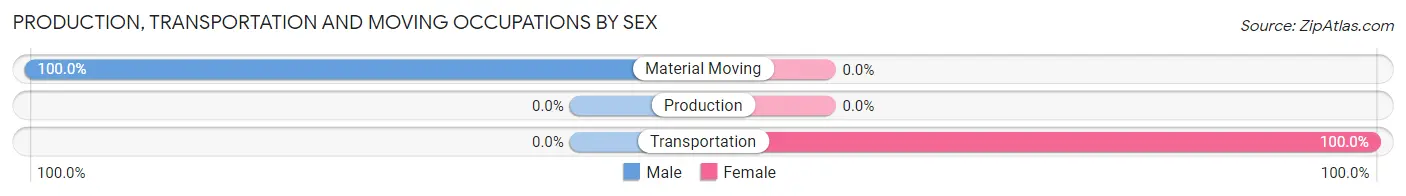
| Occupation | Male | Female |
| Production | 0 (0.0%) | 0 (0.0%) |
| Transportation | 0 (0.0%) | 1 (100.0%) |
| Material Moving | 1 (100.0%) | 0 (0.0%) |
| Total (Category) | 1 (50.0%) | 1 (50.0%) |
| Total (Overall) | 113 (61.4%) | 71 (38.6%) |
Employment Industries by Sex in Clifton
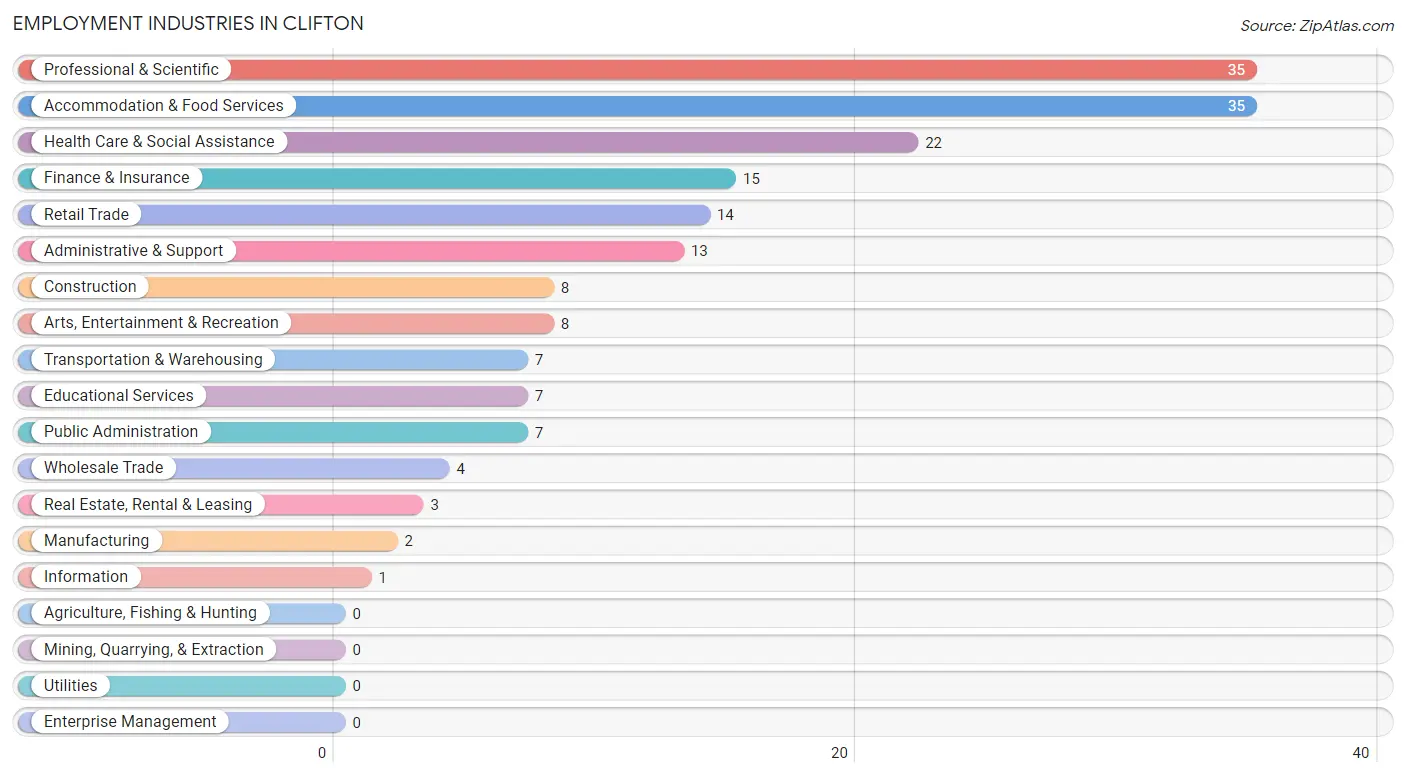
Employment Industries in Clifton
The major employment industries in Clifton include Professional & Scientific (35 | 19.0%), Accommodation & Food Services (35 | 19.0%), Health Care & Social Assistance (22 | 12.0%), Finance & Insurance (15 | 8.2%), and Retail Trade (14 | 7.6%).
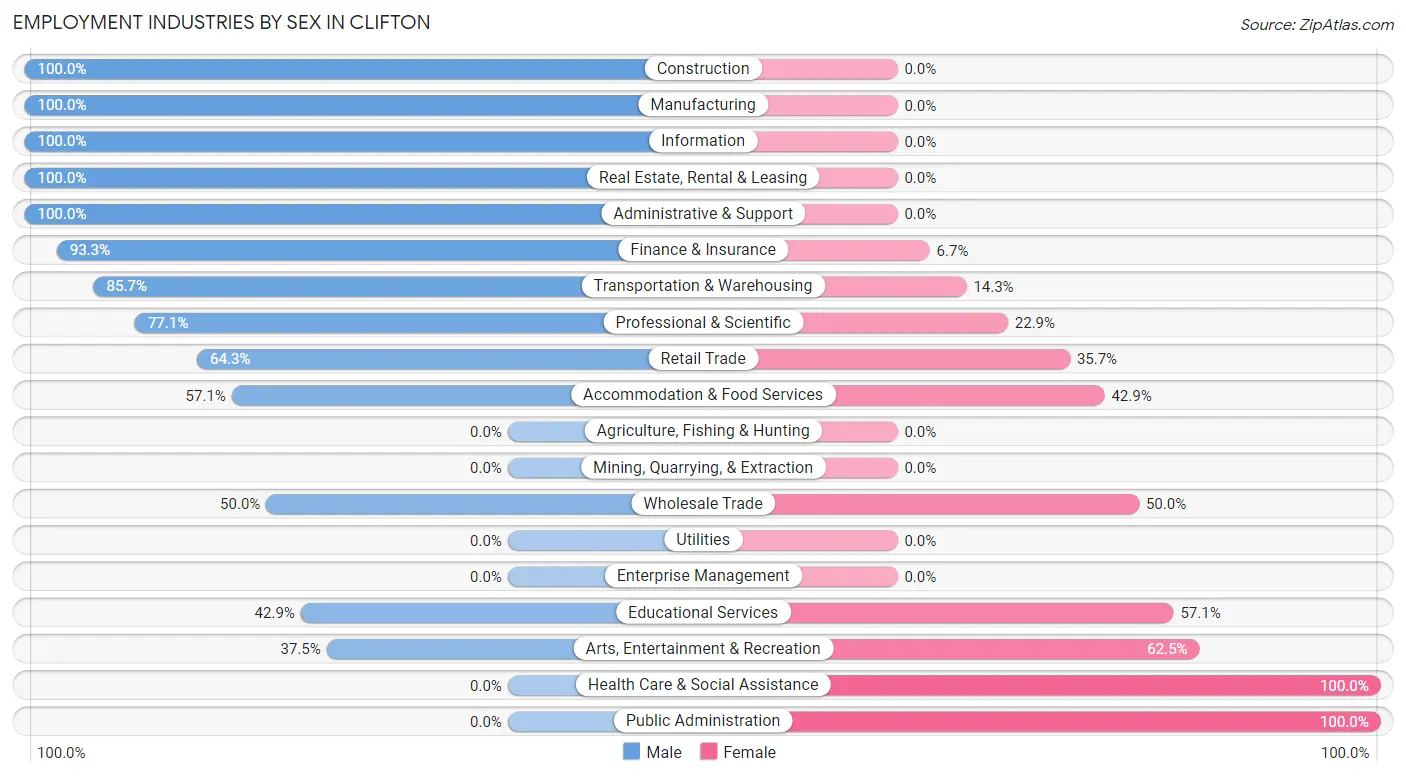
Employment Industries by Sex in Clifton
The Clifton industries that see more men than women are Construction (100.0%), Manufacturing (100.0%), and Information (100.0%), whereas the industries that tend to have a higher number of women are Health Care & Social Assistance (100.0%), Public Administration (100.0%), and Arts, Entertainment & Recreation (62.5%).
| Industry | Male | Female |
| Agriculture, Fishing & Hunting | 0 (0.0%) | 0 (0.0%) |
| Mining, Quarrying, & Extraction | 0 (0.0%) | 0 (0.0%) |
| Construction | 8 (100.0%) | 0 (0.0%) |
| Manufacturing | 2 (100.0%) | 0 (0.0%) |
| Wholesale Trade | 2 (50.0%) | 2 (50.0%) |
| Retail Trade | 9 (64.3%) | 5 (35.7%) |
| Transportation & Warehousing | 6 (85.7%) | 1 (14.3%) |
| Utilities | 0 (0.0%) | 0 (0.0%) |
| Information | 1 (100.0%) | 0 (0.0%) |
| Finance & Insurance | 14 (93.3%) | 1 (6.7%) |
| Real Estate, Rental & Leasing | 3 (100.0%) | 0 (0.0%) |
| Professional & Scientific | 27 (77.1%) | 8 (22.9%) |
| Enterprise Management | 0 (0.0%) | 0 (0.0%) |
| Administrative & Support | 13 (100.0%) | 0 (0.0%) |
| Educational Services | 3 (42.9%) | 4 (57.1%) |
| Health Care & Social Assistance | 0 (0.0%) | 22 (100.0%) |
| Arts, Entertainment & Recreation | 3 (37.5%) | 5 (62.5%) |
| Accommodation & Food Services | 20 (57.1%) | 15 (42.9%) |
| Public Administration | 0 (0.0%) | 7 (100.0%) |
| Total | 113 (61.4%) | 71 (38.6%) |
Education in Clifton
School Enrollment in Clifton
The most common levels of schooling among the 143 students in Clifton are high school (63 | 44.1%), elementary school (21 | 14.7%), and middle school (21 | 14.7%).
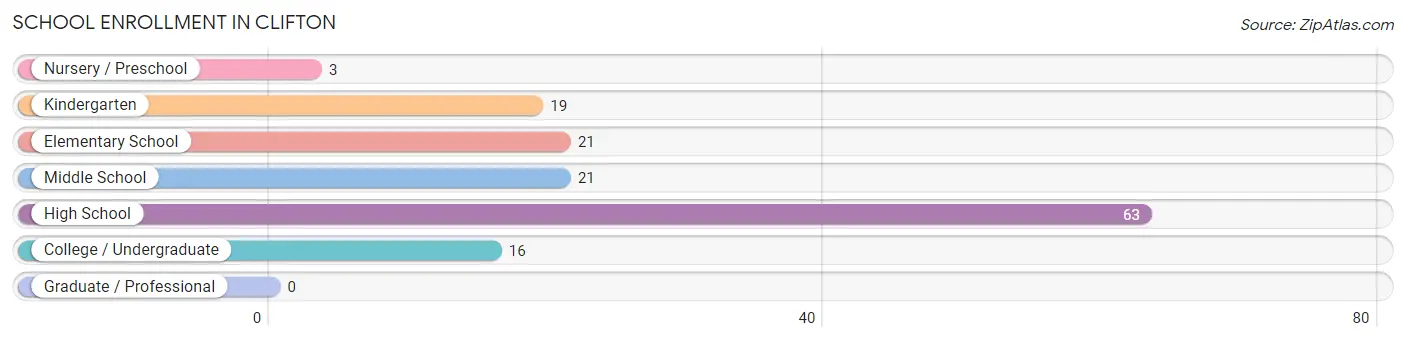
| School Level | # Students | % Students |
| Nursery / Preschool | 3 | 2.1% |
| Kindergarten | 19 | 13.3% |
| Elementary School | 21 | 14.7% |
| Middle School | 21 | 14.7% |
| High School | 63 | 44.1% |
| College / Undergraduate | 16 | 11.2% |
| Graduate / Professional | 0 | 0.0% |
| Total | 143 | 100.0% |
School Enrollment by Age by Funding Source in Clifton
Out of a total of 143 students who are enrolled in schools in Clifton, 74 (51.7%) attend a private institution, while the remaining 69 (48.3%) are enrolled in public schools. The age group of 3 to 4 year olds has the highest likelihood of being enrolled in private schools, with 1 (100.0% in the age bracket) enrolled. Conversely, the age group of 20 to 24 year olds has the lowest likelihood of being enrolled in a private school, with 10 (100.0% in the age bracket) attending a public institution.
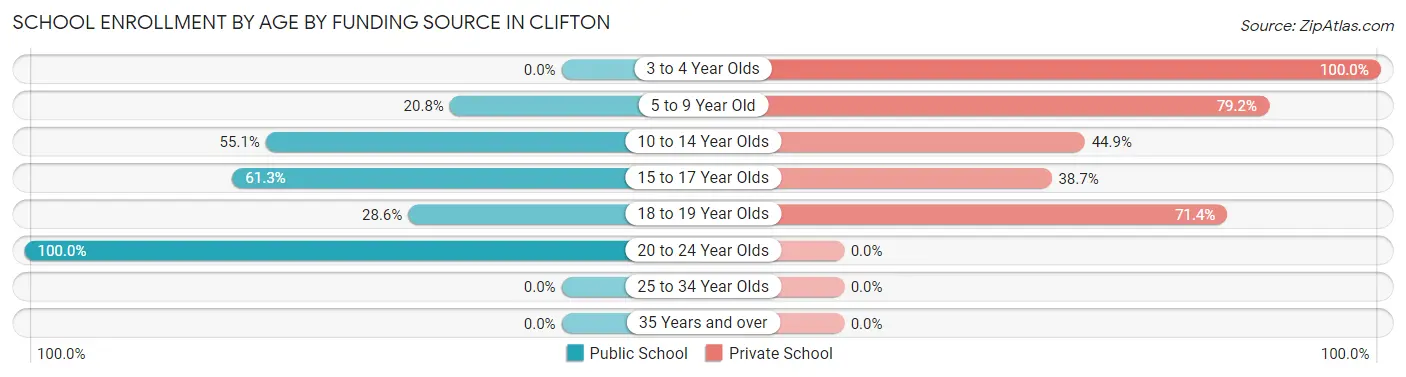
| Age Bracket | Public School | Private School |
| 3 to 4 Year Olds | 0 (0.0%) | 1 (100.0%) |
| 5 to 9 Year Old | 5 (20.8%) | 19 (79.2%) |
| 10 to 14 Year Olds | 27 (55.1%) | 22 (44.9%) |
| 15 to 17 Year Olds | 19 (61.3%) | 12 (38.7%) |
| 18 to 19 Year Olds | 8 (28.6%) | 20 (71.4%) |
| 20 to 24 Year Olds | 10 (100.0%) | 0 (0.0%) |
| 25 to 34 Year Olds | 0 (0.0%) | 0 (0.0%) |
| 35 Years and over | 0 (0.0%) | 0 (0.0%) |
| Total | 69 (48.3%) | 74 (51.7%) |
Educational Attainment by Field of Study in Clifton
Business (29 | 14.7%), science & technology (28 | 14.2%), bio, nature & agricultural (25 | 12.7%), psychology (21 | 10.7%), and engineering (15 | 7.6%) are the most common fields of study among 197 individuals in Clifton who have obtained a bachelor's degree or higher.
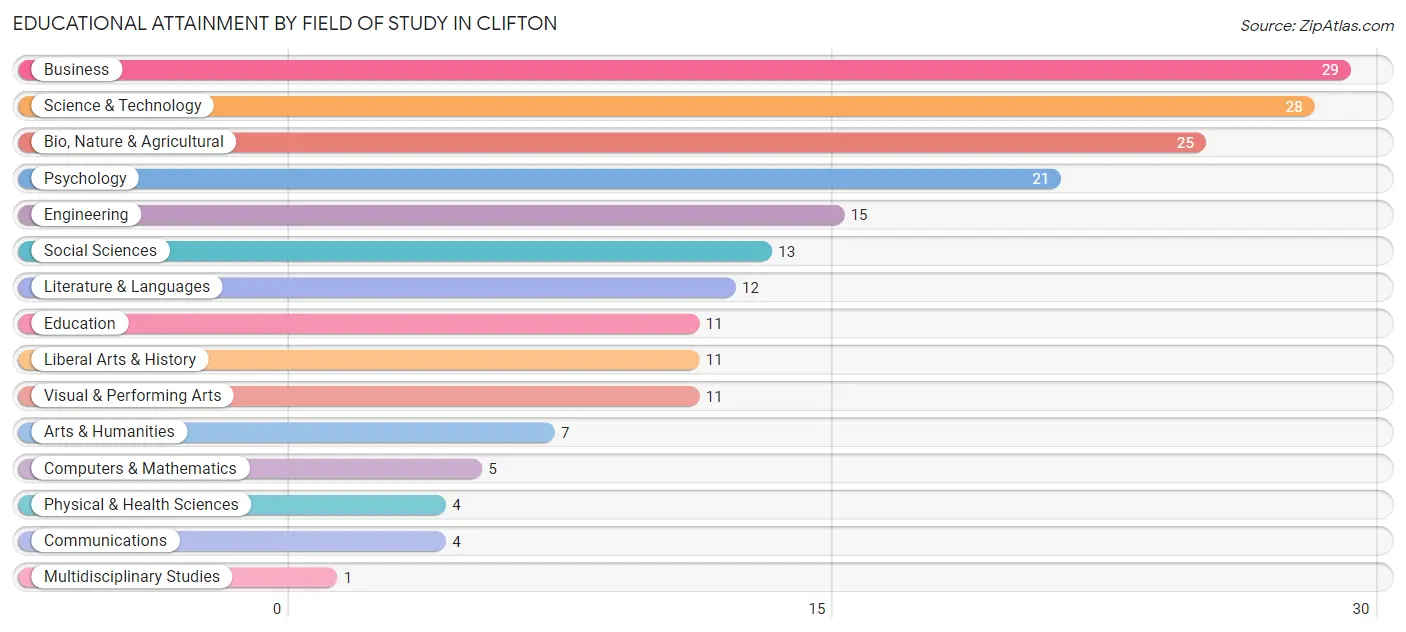
| Field of Study | # Graduates | % Graduates |
| Computers & Mathematics | 5 | 2.5% |
| Bio, Nature & Agricultural | 25 | 12.7% |
| Physical & Health Sciences | 4 | 2.0% |
| Psychology | 21 | 10.7% |
| Social Sciences | 13 | 6.6% |
| Engineering | 15 | 7.6% |
| Multidisciplinary Studies | 1 | 0.5% |
| Science & Technology | 28 | 14.2% |
| Business | 29 | 14.7% |
| Education | 11 | 5.6% |
| Literature & Languages | 12 | 6.1% |
| Liberal Arts & History | 11 | 5.6% |
| Visual & Performing Arts | 11 | 5.6% |
| Communications | 4 | 2.0% |
| Arts & Humanities | 7 | 3.5% |
| Total | 197 | 100.0% |
Transportation & Commute in Clifton
Vehicle Availability by Sex in Clifton
The most prevalent vehicle ownership categories in Clifton are males with 3 vehicles (65, accounting for 57.5%) and females with 3 vehicles (42, making up 90.3%).
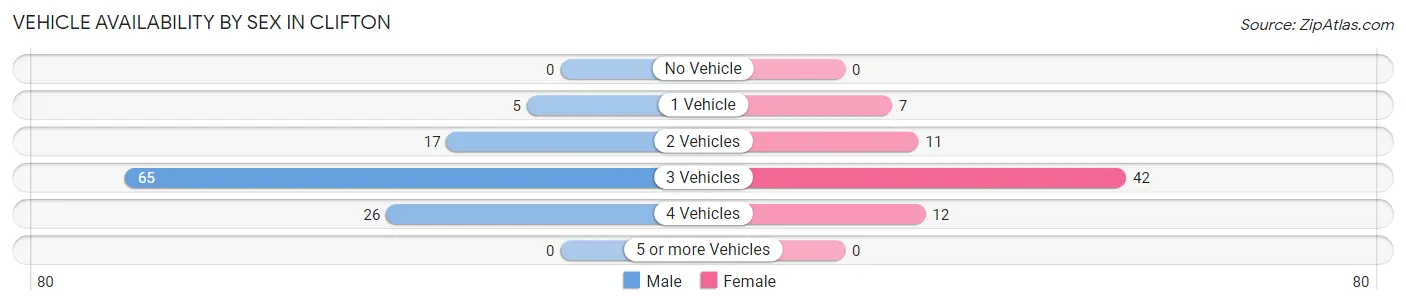
| Vehicles Available | Male | Female |
| No Vehicle | 0 (0.0%) | 0 (0.0%) |
| 1 Vehicle | 5 (4.4%) | 7 (9.7%) |
| 2 Vehicles | 17 (15.0%) | 11 (15.3%) |
| 3 Vehicles | 65 (57.5%) | 42 (58.3%) |
| 4 Vehicles | 26 (23.0%) | 12 (16.7%) |
| 5 or more Vehicles | 0 (0.0%) | 0 (0.0%) |
| Total | 113 (100.0%) | 72 (100.0%) |
Commute Time in Clifton
The most frequently occuring commute durations in Clifton are 15 to 19 minutes (36 commuters, 22.5%), 30 to 34 minutes (28 commuters, 17.5%), and 20 to 24 minutes (23 commuters, 14.4%).
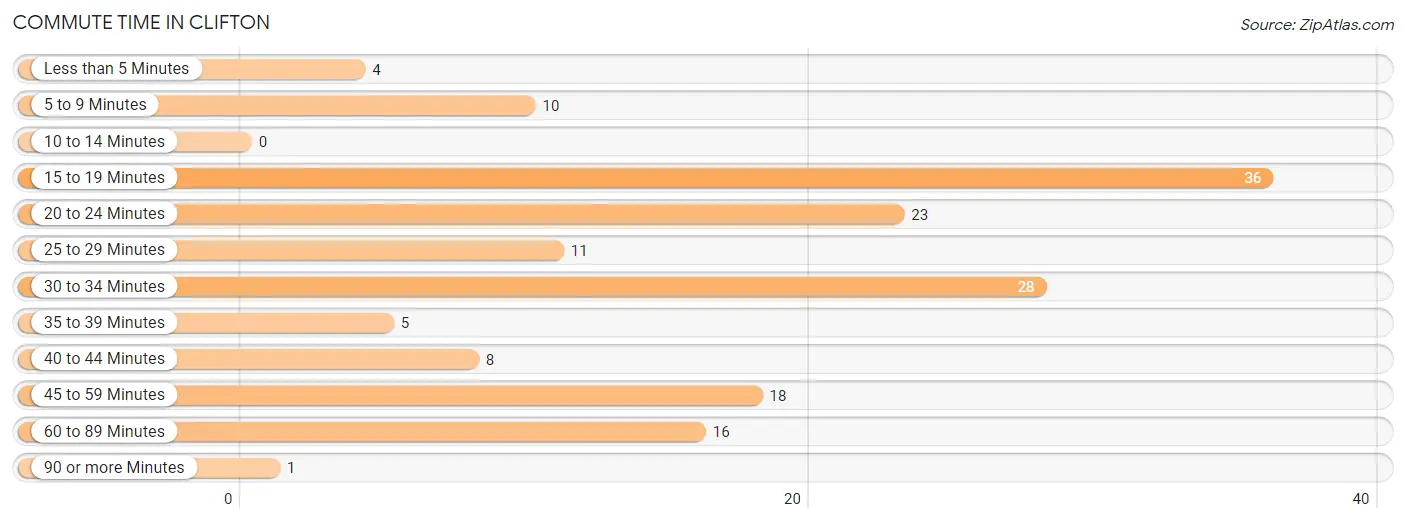
| Commute Time | # Commuters | % Commuters |
| Less than 5 Minutes | 4 | 2.5% |
| 5 to 9 Minutes | 10 | 6.2% |
| 10 to 14 Minutes | 0 | 0.0% |
| 15 to 19 Minutes | 36 | 22.5% |
| 20 to 24 Minutes | 23 | 14.4% |
| 25 to 29 Minutes | 11 | 6.9% |
| 30 to 34 Minutes | 28 | 17.5% |
| 35 to 39 Minutes | 5 | 3.1% |
| 40 to 44 Minutes | 8 | 5.0% |
| 45 to 59 Minutes | 18 | 11.3% |
| 60 to 89 Minutes | 16 | 10.0% |
| 90 or more Minutes | 1 | 0.6% |
Commute Time by Sex in Clifton
The most common commute times in Clifton are 15 to 19 minutes (25 commuters, 24.5%) for males and 20 to 24 minutes (15 commuters, 25.9%) for females.
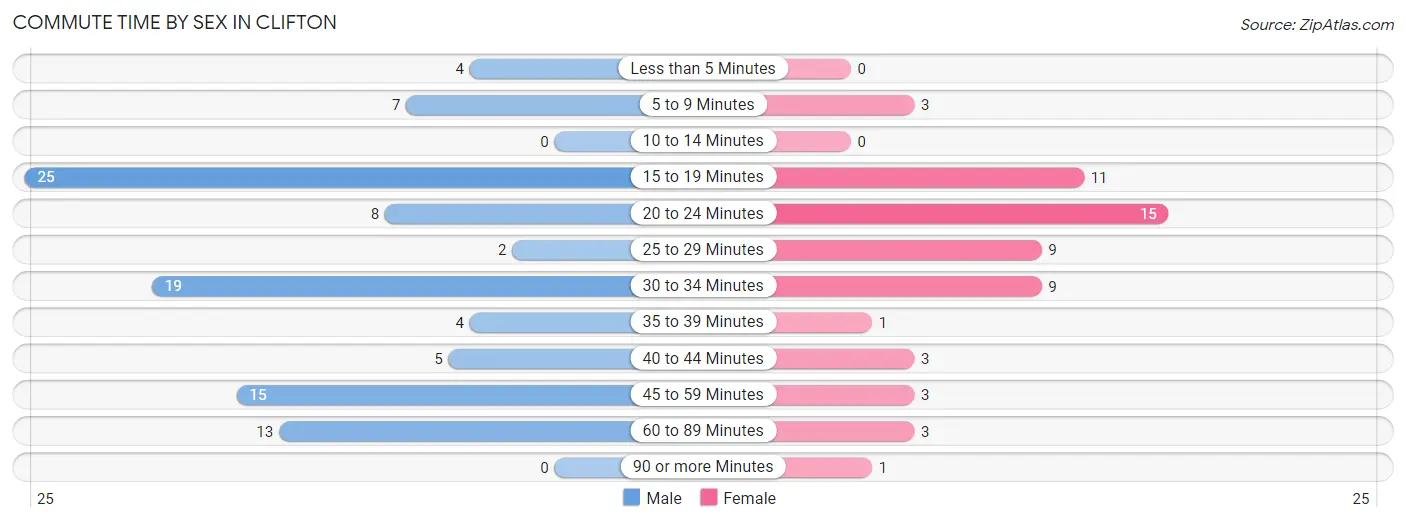
| Commute Time | Male | Female |
| Less than 5 Minutes | 4 (3.9%) | 0 (0.0%) |
| 5 to 9 Minutes | 7 (6.9%) | 3 (5.2%) |
| 10 to 14 Minutes | 0 (0.0%) | 0 (0.0%) |
| 15 to 19 Minutes | 25 (24.5%) | 11 (19.0%) |
| 20 to 24 Minutes | 8 (7.8%) | 15 (25.9%) |
| 25 to 29 Minutes | 2 (2.0%) | 9 (15.5%) |
| 30 to 34 Minutes | 19 (18.6%) | 9 (15.5%) |
| 35 to 39 Minutes | 4 (3.9%) | 1 (1.7%) |
| 40 to 44 Minutes | 5 (4.9%) | 3 (5.2%) |
| 45 to 59 Minutes | 15 (14.7%) | 3 (5.2%) |
| 60 to 89 Minutes | 13 (12.8%) | 3 (5.2%) |
| 90 or more Minutes | 0 (0.0%) | 1 (1.7%) |
Time of Departure to Work by Sex in Clifton
The most frequent times of departure to work in Clifton are 10:00 AM to 10:59 AM (22, 21.6%) for males and 4:00 PM to 11:59 PM (14, 24.1%) for females.
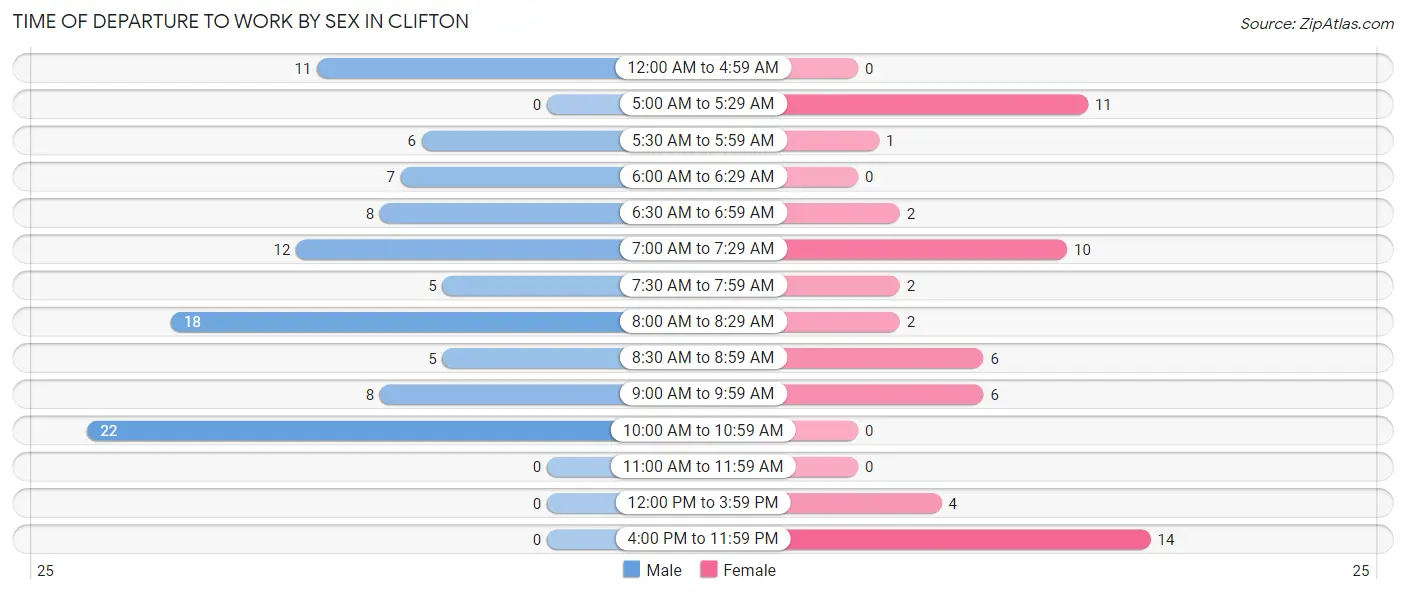
| Time of Departure | Male | Female |
| 12:00 AM to 4:59 AM | 11 (10.8%) | 0 (0.0%) |
| 5:00 AM to 5:29 AM | 0 (0.0%) | 11 (19.0%) |
| 5:30 AM to 5:59 AM | 6 (5.9%) | 1 (1.7%) |
| 6:00 AM to 6:29 AM | 7 (6.9%) | 0 (0.0%) |
| 6:30 AM to 6:59 AM | 8 (7.8%) | 2 (3.5%) |
| 7:00 AM to 7:29 AM | 12 (11.8%) | 10 (17.2%) |
| 7:30 AM to 7:59 AM | 5 (4.9%) | 2 (3.5%) |
| 8:00 AM to 8:29 AM | 18 (17.6%) | 2 (3.5%) |
| 8:30 AM to 8:59 AM | 5 (4.9%) | 6 (10.3%) |
| 9:00 AM to 9:59 AM | 8 (7.8%) | 6 (10.3%) |
| 10:00 AM to 10:59 AM | 22 (21.6%) | 0 (0.0%) |
| 11:00 AM to 11:59 AM | 0 (0.0%) | 0 (0.0%) |
| 12:00 PM to 3:59 PM | 0 (0.0%) | 4 (6.9%) |
| 4:00 PM to 11:59 PM | 0 (0.0%) | 14 (24.1%) |
| Total | 102 (100.0%) | 58 (100.0%) |
Housing Occupancy in Clifton
Occupancy by Ownership in Clifton
Of the total 102 dwellings in Clifton, owner-occupied units account for 100 (98.0%), while renter-occupied units make up 2 (2.0%).
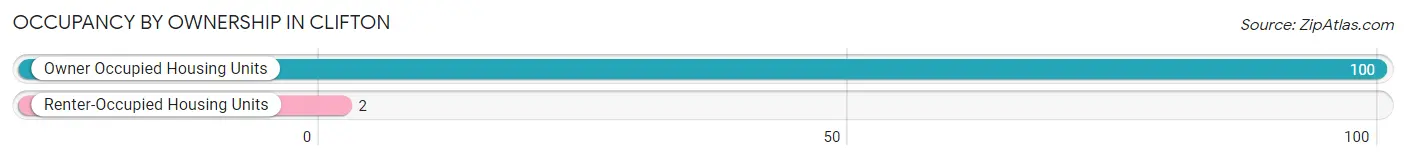
| Occupancy | # Housing Units | % Housing Units |
| Owner Occupied Housing Units | 100 | 98.0% |
| Renter-Occupied Housing Units | 2 | 2.0% |
| Total Occupied Housing Units | 102 | 100.0% |
Occupancy by Household Size in Clifton
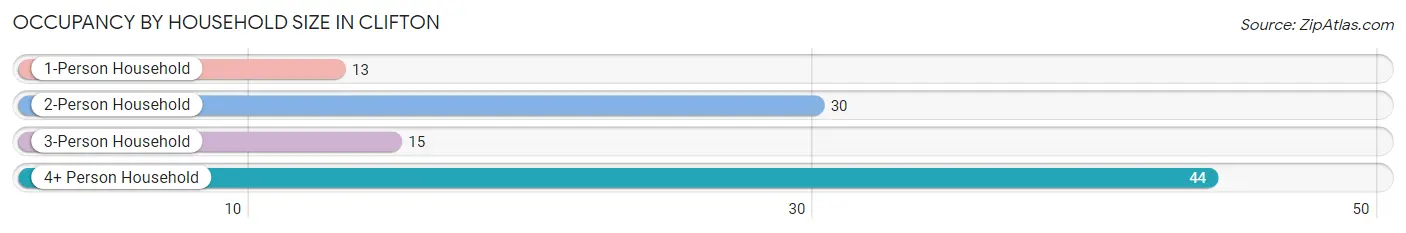
| Household Size | # Housing Units | % Housing Units |
| 1-Person Household | 13 | 12.8% |
| 2-Person Household | 30 | 29.4% |
| 3-Person Household | 15 | 14.7% |
| 4+ Person Household | 44 | 43.1% |
| Total Housing Units | 102 | 100.0% |
Occupancy by Ownership by Household Size in Clifton
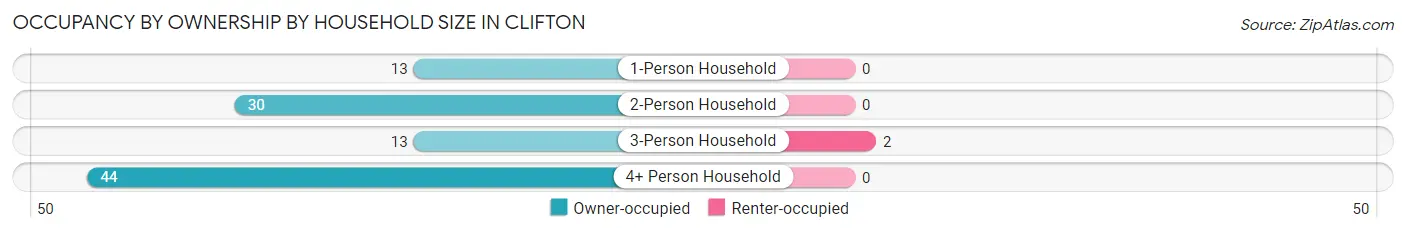
| Household Size | Owner-occupied | Renter-occupied |
| 1-Person Household | 13 (100.0%) | 0 (0.0%) |
| 2-Person Household | 30 (100.0%) | 0 (0.0%) |
| 3-Person Household | 13 (86.7%) | 2 (13.3%) |
| 4+ Person Household | 44 (100.0%) | 0 (0.0%) |
| Total Housing Units | 100 (98.0%) | 2 (2.0%) |
Occupancy by Educational Attainment in Clifton
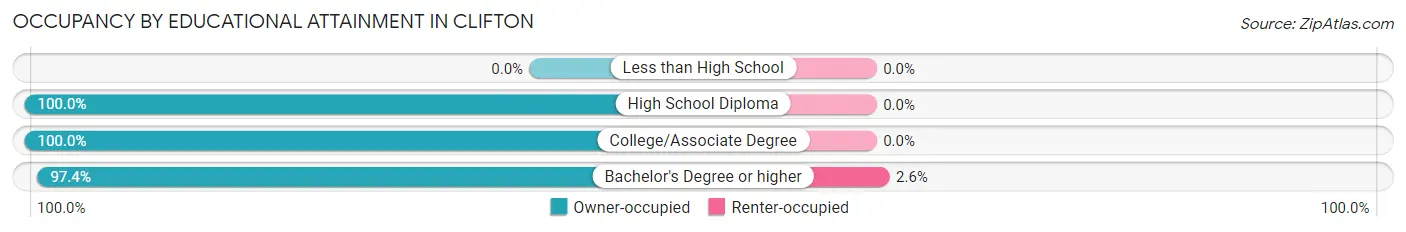
| Household Size | Owner-occupied | Renter-occupied |
| Less than High School | 0 (0.0%) | 0 (0.0%) |
| High School Diploma | 10 (100.0%) | 0 (0.0%) |
| College/Associate Degree | 14 (100.0%) | 0 (0.0%) |
| Bachelor's Degree or higher | 76 (97.4%) | 2 (2.6%) |
Occupancy by Age of Householder in Clifton
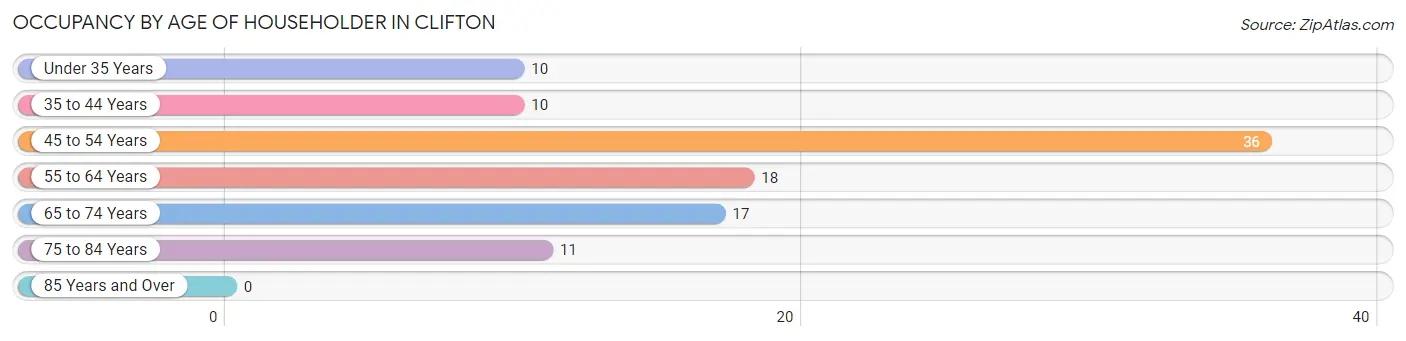
| Age Bracket | # Households | % Households |
| Under 35 Years | 10 | 9.8% |
| 35 to 44 Years | 10 | 9.8% |
| 45 to 54 Years | 36 | 35.3% |
| 55 to 64 Years | 18 | 17.6% |
| 65 to 74 Years | 17 | 16.7% |
| 75 to 84 Years | 11 | 10.8% |
| 85 Years and Over | 0 | 0.0% |
| Total | 102 | 100.0% |
Housing Finances in Clifton
Median Income by Occupancy in Clifton
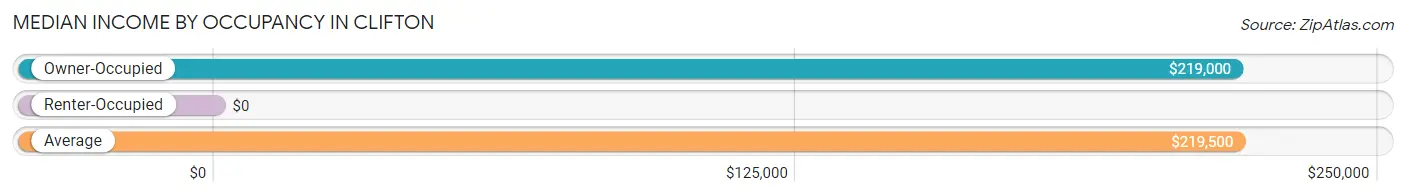
| Occupancy Type | # Households | Median Income |
| Owner-Occupied | 100 (98.0%) | $219,000 |
| Renter-Occupied | 2 (2.0%) | $0 |
| Average | 102 (100.0%) | $219,500 |
Occupancy by Householder Income Bracket in Clifton
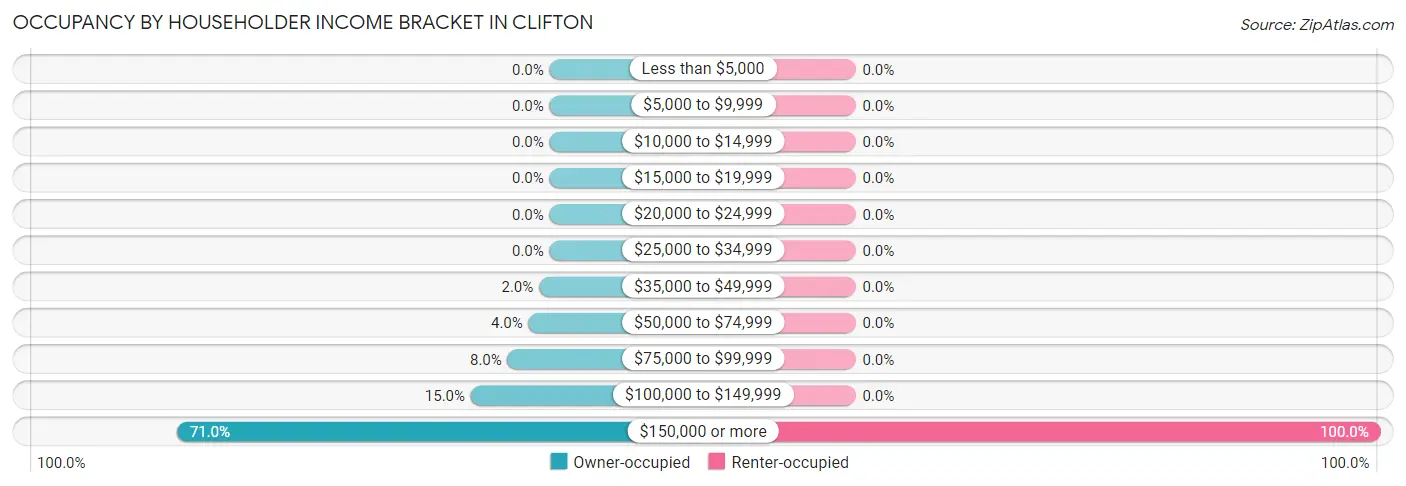
| Income Bracket | Owner-occupied | Renter-occupied |
| Less than $5,000 | 0 (0.0%) | 0 (0.0%) |
| $5,000 to $9,999 | 0 (0.0%) | 0 (0.0%) |
| $10,000 to $14,999 | 0 (0.0%) | 0 (0.0%) |
| $15,000 to $19,999 | 0 (0.0%) | 0 (0.0%) |
| $20,000 to $24,999 | 0 (0.0%) | 0 (0.0%) |
| $25,000 to $34,999 | 0 (0.0%) | 0 (0.0%) |
| $35,000 to $49,999 | 2 (2.0%) | 0 (0.0%) |
| $50,000 to $74,999 | 4 (4.0%) | 0 (0.0%) |
| $75,000 to $99,999 | 8 (8.0%) | 0 (0.0%) |
| $100,000 to $149,999 | 15 (15.0%) | 0 (0.0%) |
| $150,000 or more | 71 (71.0%) | 2 (100.0%) |
| Total | 100 (100.0%) | 2 (100.0%) |
Monthly Housing Cost Tiers in Clifton
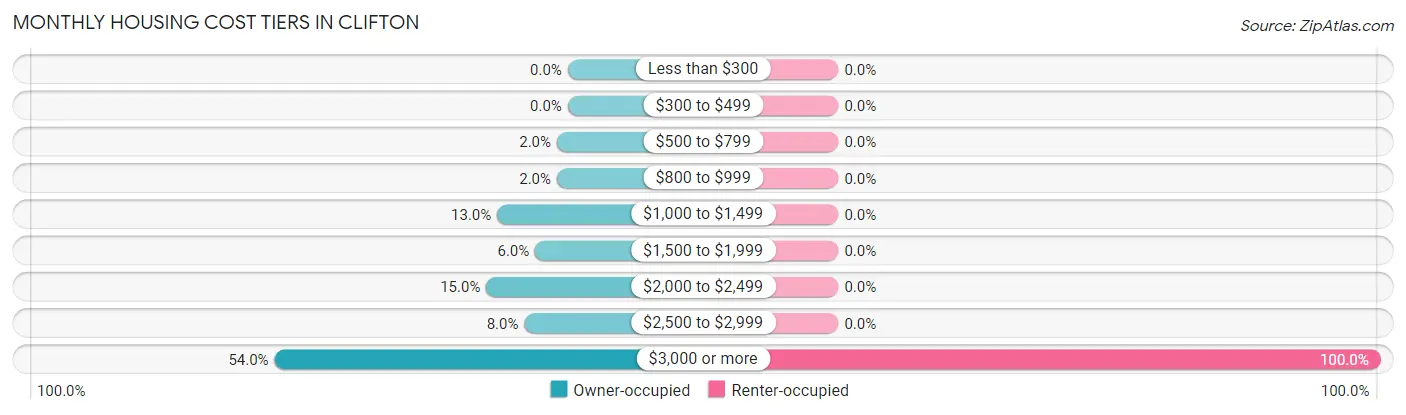
| Monthly Cost | Owner-occupied | Renter-occupied |
| Less than $300 | 0 (0.0%) | 0 (0.0%) |
| $300 to $499 | 0 (0.0%) | 0 (0.0%) |
| $500 to $799 | 2 (2.0%) | 0 (0.0%) |
| $800 to $999 | 2 (2.0%) | 0 (0.0%) |
| $1,000 to $1,499 | 13 (13.0%) | 0 (0.0%) |
| $1,500 to $1,999 | 6 (6.0%) | 0 (0.0%) |
| $2,000 to $2,499 | 15 (15.0%) | 0 (0.0%) |
| $2,500 to $2,999 | 8 (8.0%) | 0 (0.0%) |
| $3,000 or more | 54 (54.0%) | 2 (100.0%) |
| Total | 100 (100.0%) | 2 (100.0%) |
Physical Housing Characteristics in Clifton
Housing Structures in Clifton
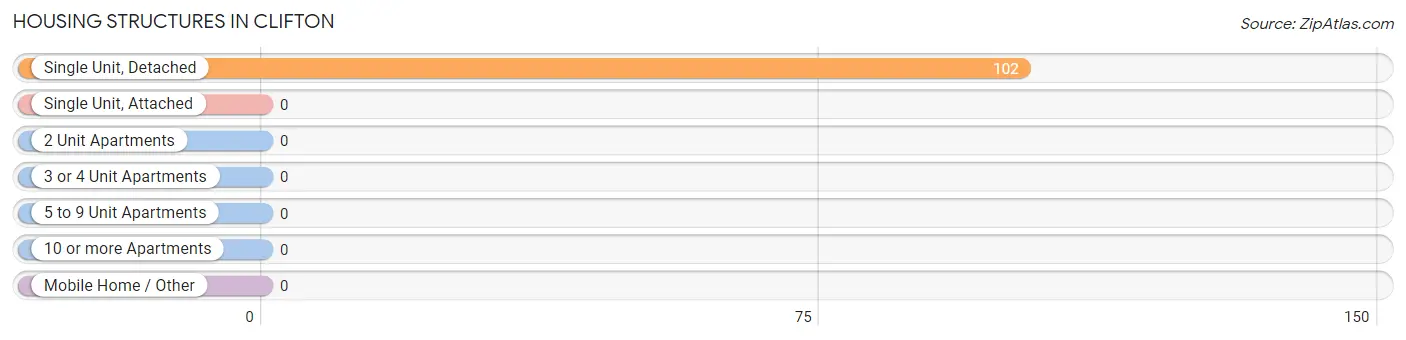
| Structure Type | # Housing Units | % Housing Units |
| Single Unit, Detached | 102 | 100.0% |
| Single Unit, Attached | 0 | 0.0% |
| 2 Unit Apartments | 0 | 0.0% |
| 3 or 4 Unit Apartments | 0 | 0.0% |
| 5 to 9 Unit Apartments | 0 | 0.0% |
| 10 or more Apartments | 0 | 0.0% |
| Mobile Home / Other | 0 | 0.0% |
| Total | 102 | 100.0% |
Housing Structures by Occupancy in Clifton
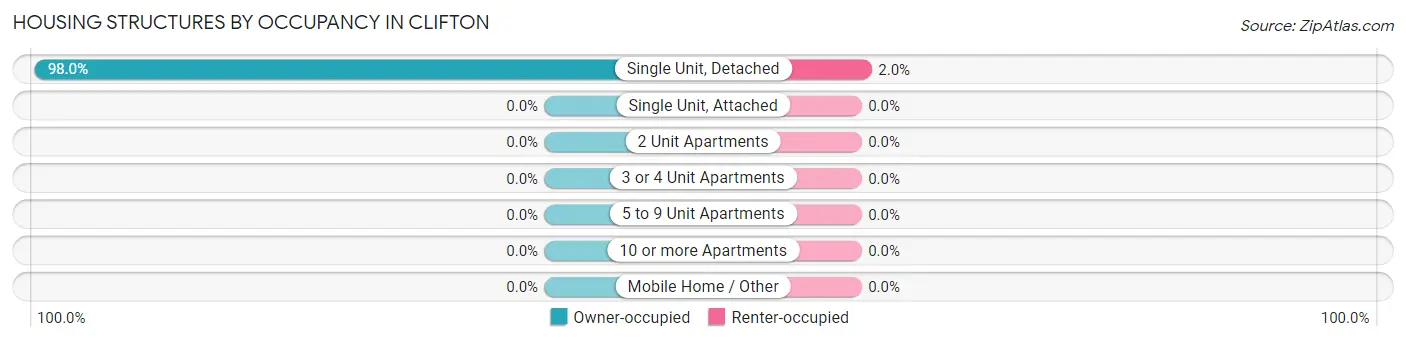
| Structure Type | Owner-occupied | Renter-occupied |
| Single Unit, Detached | 100 (98.0%) | 2 (2.0%) |
| Single Unit, Attached | 0 (0.0%) | 0 (0.0%) |
| 2 Unit Apartments | 0 (0.0%) | 0 (0.0%) |
| 3 or 4 Unit Apartments | 0 (0.0%) | 0 (0.0%) |
| 5 to 9 Unit Apartments | 0 (0.0%) | 0 (0.0%) |
| 10 or more Apartments | 0 (0.0%) | 0 (0.0%) |
| Mobile Home / Other | 0 (0.0%) | 0 (0.0%) |
| Total | 100 (98.0%) | 2 (2.0%) |
Housing Structures by Number of Rooms in Clifton
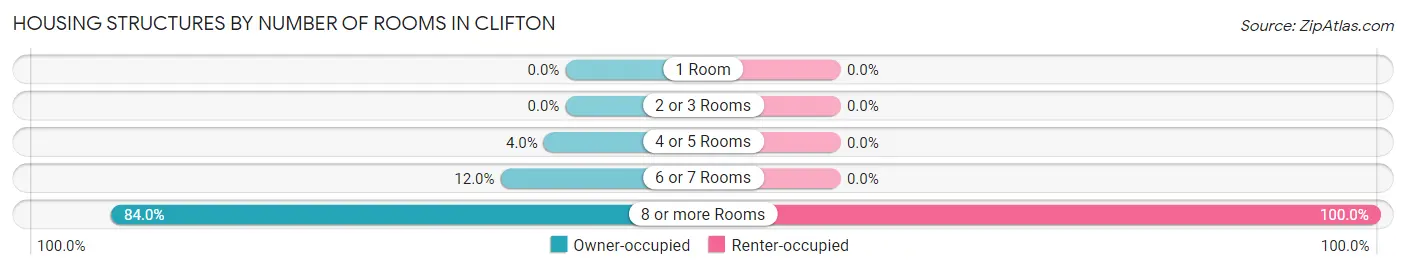
| Number of Rooms | Owner-occupied | Renter-occupied |
| 1 Room | 0 (0.0%) | 0 (0.0%) |
| 2 or 3 Rooms | 0 (0.0%) | 0 (0.0%) |
| 4 or 5 Rooms | 4 (4.0%) | 0 (0.0%) |
| 6 or 7 Rooms | 12 (12.0%) | 0 (0.0%) |
| 8 or more Rooms | 84 (84.0%) | 2 (100.0%) |
| Total | 100 (100.0%) | 2 (100.0%) |
Housing Structure by Heating Type in Clifton
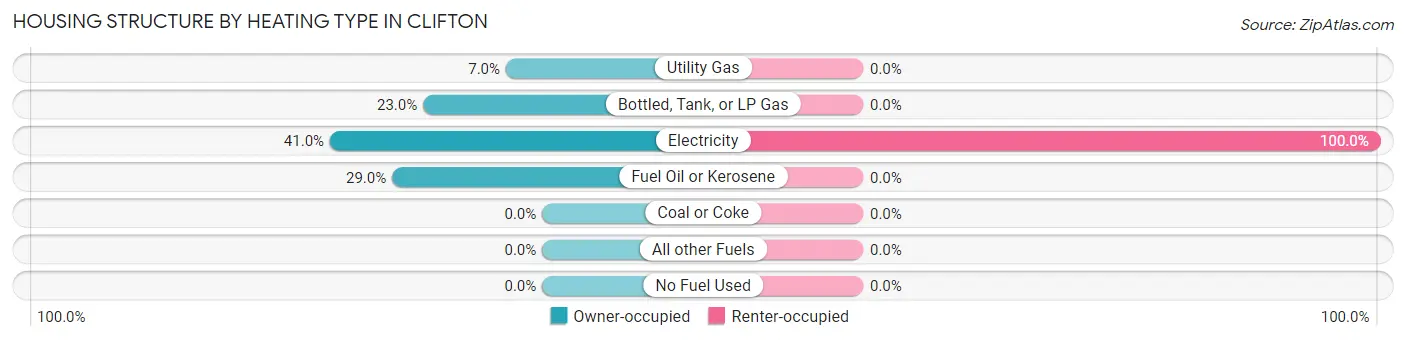
| Heating Type | Owner-occupied | Renter-occupied |
| Utility Gas | 7 (7.0%) | 0 (0.0%) |
| Bottled, Tank, or LP Gas | 23 (23.0%) | 0 (0.0%) |
| Electricity | 41 (41.0%) | 2 (100.0%) |
| Fuel Oil or Kerosene | 29 (29.0%) | 0 (0.0%) |
| Coal or Coke | 0 (0.0%) | 0 (0.0%) |
| All other Fuels | 0 (0.0%) | 0 (0.0%) |
| No Fuel Used | 0 (0.0%) | 0 (0.0%) |
| Total | 100 (100.0%) | 2 (100.0%) |
Household Vehicle Usage in Clifton
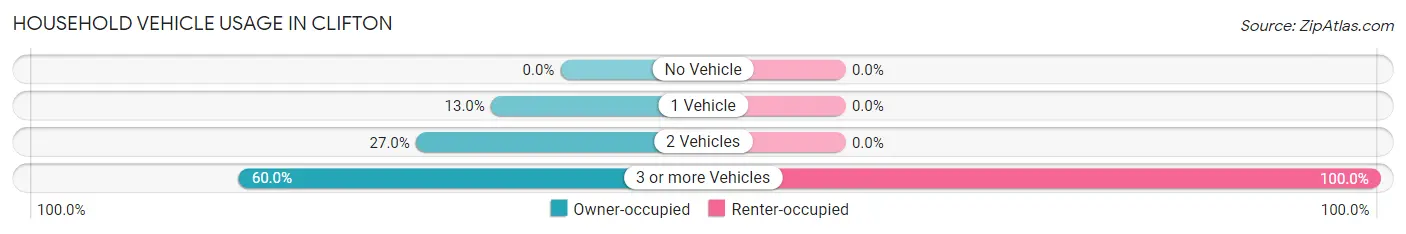
| Vehicles per Household | Owner-occupied | Renter-occupied |
| No Vehicle | 0 (0.0%) | 0 (0.0%) |
| 1 Vehicle | 13 (13.0%) | 0 (0.0%) |
| 2 Vehicles | 27 (27.0%) | 0 (0.0%) |
| 3 or more Vehicles | 60 (60.0%) | 2 (100.0%) |
| Total | 100 (100.0%) | 2 (100.0%) |
Real Estate & Mortgages in Clifton
Real Estate and Mortgage Overview in Clifton
| Characteristic | Without Mortgage | With Mortgage |
| Housing Units | 21 | 79 |
| Median Property Value | $737,500 | $1,011,400 |
| Median Household Income | $143,125 | $63 |
| Monthly Housing Costs | $1,275 | $54 |
| Real Estate Taxes | $8,438 | $0 |
Property Value by Mortgage Status in Clifton
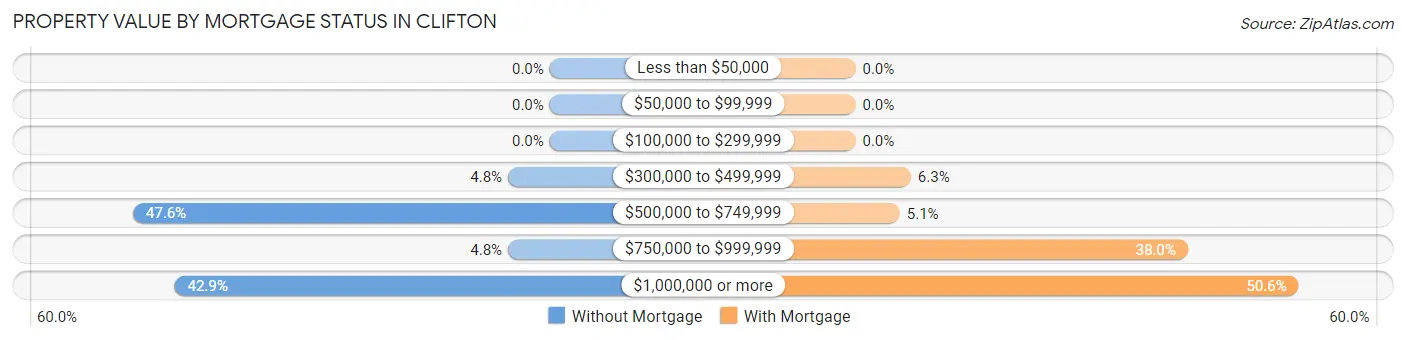
| Property Value | Without Mortgage | With Mortgage |
| Less than $50,000 | 0 (0.0%) | 0 (0.0%) |
| $50,000 to $99,999 | 0 (0.0%) | 0 (0.0%) |
| $100,000 to $299,999 | 0 (0.0%) | 0 (0.0%) |
| $300,000 to $499,999 | 1 (4.8%) | 5 (6.3%) |
| $500,000 to $749,999 | 10 (47.6%) | 4 (5.1%) |
| $750,000 to $999,999 | 1 (4.8%) | 30 (38.0%) |
| $1,000,000 or more | 9 (42.9%) | 40 (50.6%) |
| Total | 21 (100.0%) | 79 (100.0%) |
Household Income by Mortgage Status in Clifton
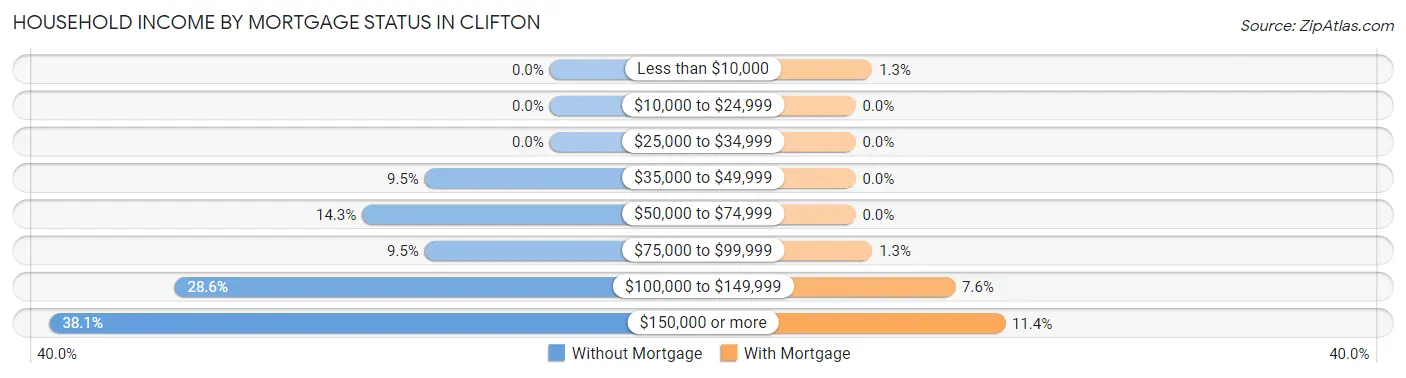
| Household Income | Without Mortgage | With Mortgage |
| Less than $10,000 | 0 (0.0%) | 1 (1.3%) |
| $10,000 to $24,999 | 0 (0.0%) | 0 (0.0%) |
| $25,000 to $34,999 | 0 (0.0%) | 0 (0.0%) |
| $35,000 to $49,999 | 2 (9.5%) | 0 (0.0%) |
| $50,000 to $74,999 | 3 (14.3%) | 0 (0.0%) |
| $75,000 to $99,999 | 2 (9.5%) | 1 (1.3%) |
| $100,000 to $149,999 | 6 (28.6%) | 6 (7.6%) |
| $150,000 or more | 8 (38.1%) | 9 (11.4%) |
| Total | 21 (100.0%) | 79 (100.0%) |
Property Value to Household Income Ratio in Clifton
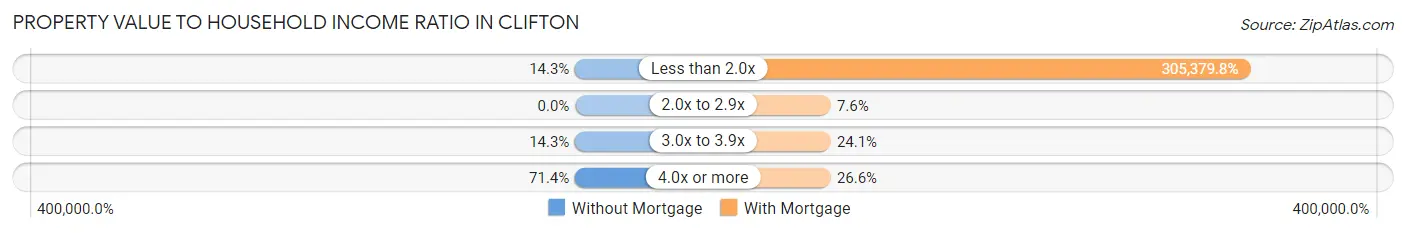
| Value-to-Income Ratio | Without Mortgage | With Mortgage |
| Less than 2.0x | 3 (14.3%) | 241,250 (305,379.8%) |
| 2.0x to 2.9x | 0 (0.0%) | 6 (7.6%) |
| 3.0x to 3.9x | 3 (14.3%) | 19 (24.0%) |
| 4.0x or more | 15 (71.4%) | 21 (26.6%) |
| Total | 21 (100.0%) | 79 (100.0%) |
Real Estate Taxes by Mortgage Status in Clifton
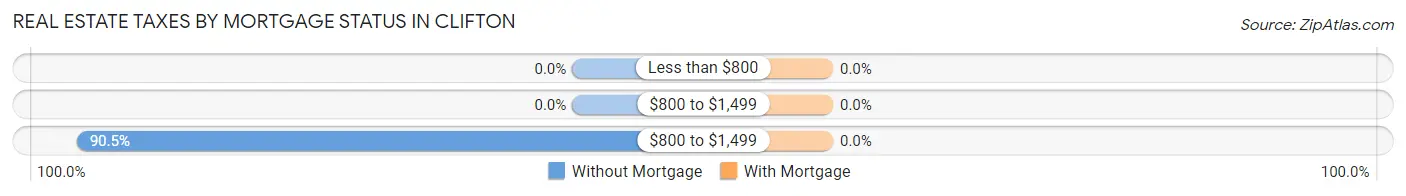
| Property Taxes | Without Mortgage | With Mortgage |
| Less than $800 | 0 (0.0%) | 0 (0.0%) |
| $800 to $1,499 | 0 (0.0%) | 0 (0.0%) |
| $800 to $1,499 | 19 (90.5%) | 0 (0.0%) |
| Total | 21 (100.0%) | 79 (100.0%) |
Health & Disability in Clifton
Health Insurance Coverage by Age in Clifton
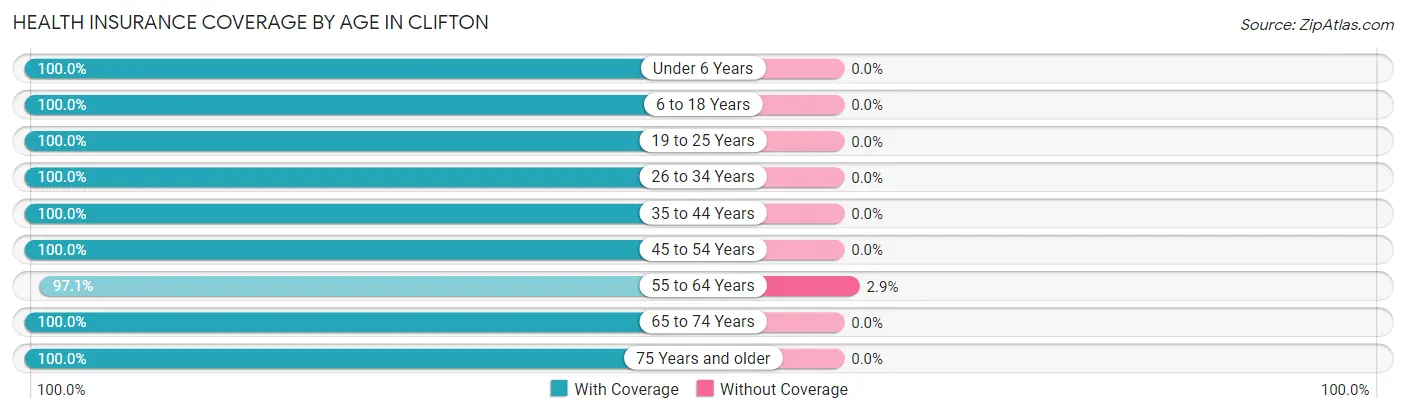
| Age Bracket | With Coverage | Without Coverage |
| Under 6 Years | 28 (100.0%) | 0 (0.0%) |
| 6 to 18 Years | 110 (100.0%) | 0 (0.0%) |
| 19 to 25 Years | 20 (100.0%) | 0 (0.0%) |
| 26 to 34 Years | 19 (100.0%) | 0 (0.0%) |
| 35 to 44 Years | 16 (100.0%) | 0 (0.0%) |
| 45 to 54 Years | 72 (100.0%) | 0 (0.0%) |
| 55 to 64 Years | 34 (97.1%) | 1 (2.9%) |
| 65 to 74 Years | 37 (100.0%) | 0 (0.0%) |
| 75 Years and older | 20 (100.0%) | 0 (0.0%) |
| Total | 356 (99.7%) | 1 (0.3%) |
Health Insurance Coverage by Citizenship Status in Clifton
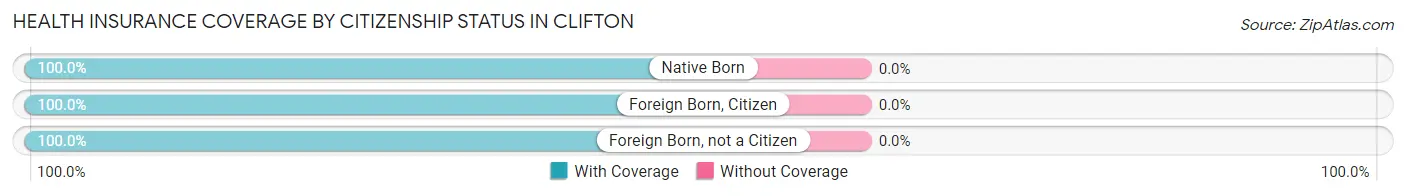
| Citizenship Status | With Coverage | Without Coverage |
| Native Born | 28 (100.0%) | 0 (0.0%) |
| Foreign Born, Citizen | 110 (100.0%) | 0 (0.0%) |
| Foreign Born, not a Citizen | 20 (100.0%) | 0 (0.0%) |
Health Insurance Coverage by Household Income in Clifton
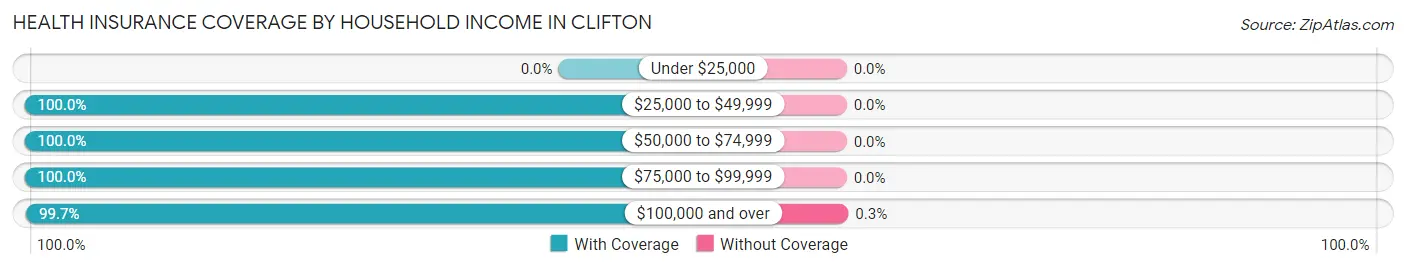
| Household Income | With Coverage | Without Coverage |
| Under $25,000 | 0 (0.0%) | 0 (0.0%) |
| $25,000 to $49,999 | 2 (100.0%) | 0 (0.0%) |
| $50,000 to $74,999 | 13 (100.0%) | 0 (0.0%) |
| $75,000 to $99,999 | 9 (100.0%) | 0 (0.0%) |
| $100,000 and over | 332 (99.7%) | 1 (0.3%) |
Public vs Private Health Insurance Coverage by Age in Clifton
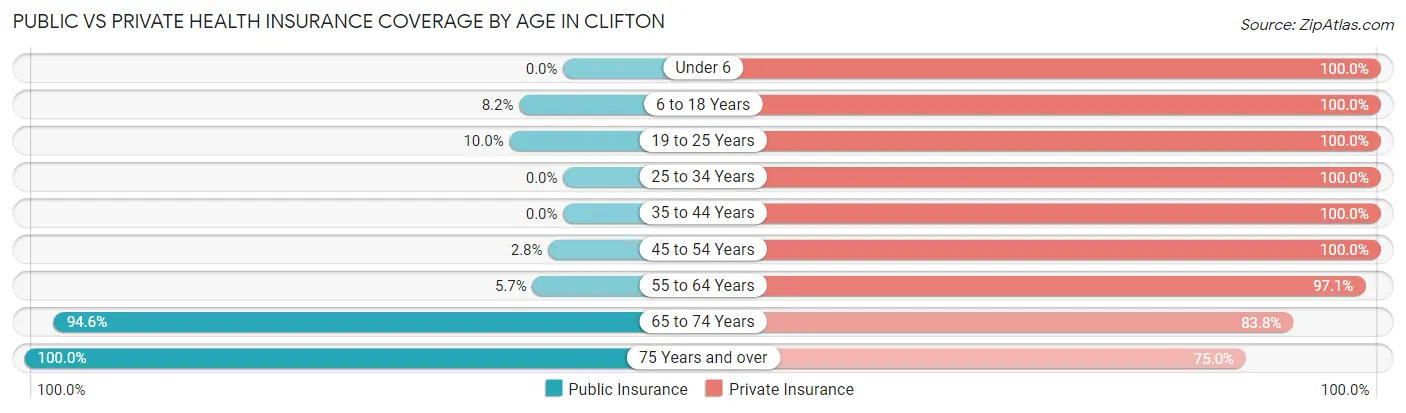
| Age Bracket | Public Insurance | Private Insurance |
| Under 6 | 0 (0.0%) | 28 (100.0%) |
| 6 to 18 Years | 9 (8.2%) | 110 (100.0%) |
| 19 to 25 Years | 2 (10.0%) | 20 (100.0%) |
| 25 to 34 Years | 0 (0.0%) | 19 (100.0%) |
| 35 to 44 Years | 0 (0.0%) | 16 (100.0%) |
| 45 to 54 Years | 2 (2.8%) | 72 (100.0%) |
| 55 to 64 Years | 2 (5.7%) | 34 (97.1%) |
| 65 to 74 Years | 35 (94.6%) | 31 (83.8%) |
| 75 Years and over | 20 (100.0%) | 15 (75.0%) |
| Total | 70 (19.6%) | 345 (96.6%) |
Disability Status by Sex by Age in Clifton
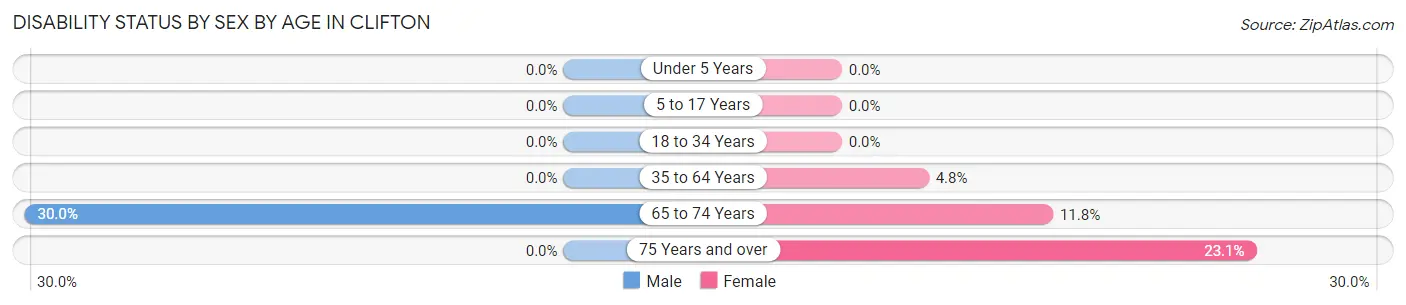
| Age Bracket | Male | Female |
| Under 5 Years | 0 (0.0%) | 0 (0.0%) |
| 5 to 17 Years | 0 (0.0%) | 0 (0.0%) |
| 18 to 34 Years | 0 (0.0%) | 0 (0.0%) |
| 35 to 64 Years | 0 (0.0%) | 3 (4.8%) |
| 65 to 74 Years | 6 (30.0%) | 2 (11.8%) |
| 75 Years and over | 0 (0.0%) | 3 (23.1%) |
Disability Class by Sex by Age in Clifton
Disability Class: Hearing Difficulty
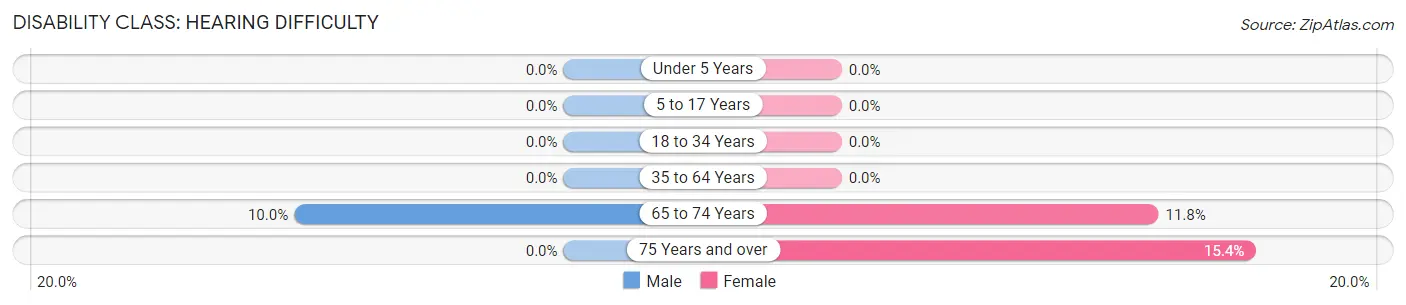
| Age Bracket | Male | Female |
| Under 5 Years | 0 (0.0%) | 0 (0.0%) |
| 5 to 17 Years | 0 (0.0%) | 0 (0.0%) |
| 18 to 34 Years | 0 (0.0%) | 0 (0.0%) |
| 35 to 64 Years | 0 (0.0%) | 0 (0.0%) |
| 65 to 74 Years | 2 (10.0%) | 2 (11.8%) |
| 75 Years and over | 0 (0.0%) | 2 (15.4%) |
Disability Class: Vision Difficulty
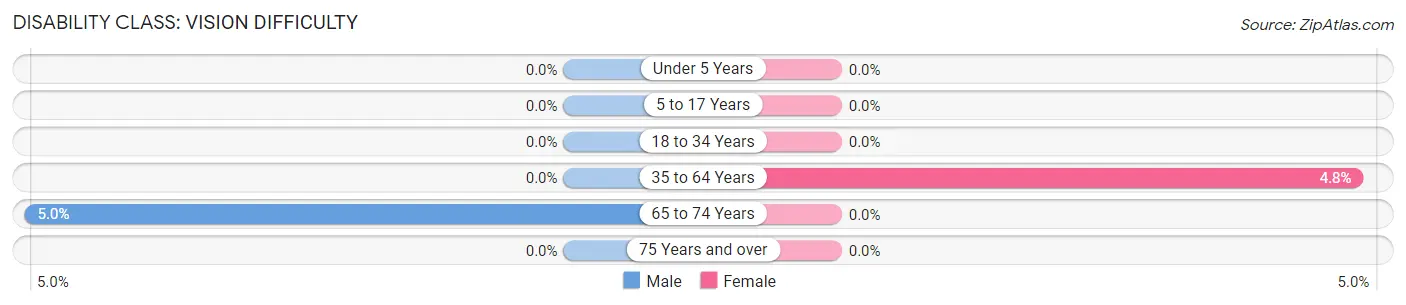
| Age Bracket | Male | Female |
| Under 5 Years | 0 (0.0%) | 0 (0.0%) |
| 5 to 17 Years | 0 (0.0%) | 0 (0.0%) |
| 18 to 34 Years | 0 (0.0%) | 0 (0.0%) |
| 35 to 64 Years | 0 (0.0%) | 3 (4.8%) |
| 65 to 74 Years | 1 (5.0%) | 0 (0.0%) |
| 75 Years and over | 0 (0.0%) | 0 (0.0%) |
Disability Class: Cognitive Difficulty
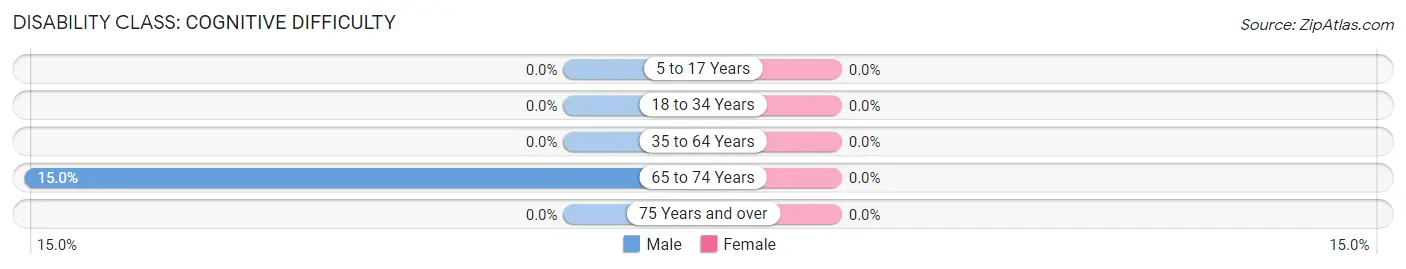
| Age Bracket | Male | Female |
| 5 to 17 Years | 0 (0.0%) | 0 (0.0%) |
| 18 to 34 Years | 0 (0.0%) | 0 (0.0%) |
| 35 to 64 Years | 0 (0.0%) | 0 (0.0%) |
| 65 to 74 Years | 3 (15.0%) | 0 (0.0%) |
| 75 Years and over | 0 (0.0%) | 0 (0.0%) |
Disability Class: Ambulatory Difficulty
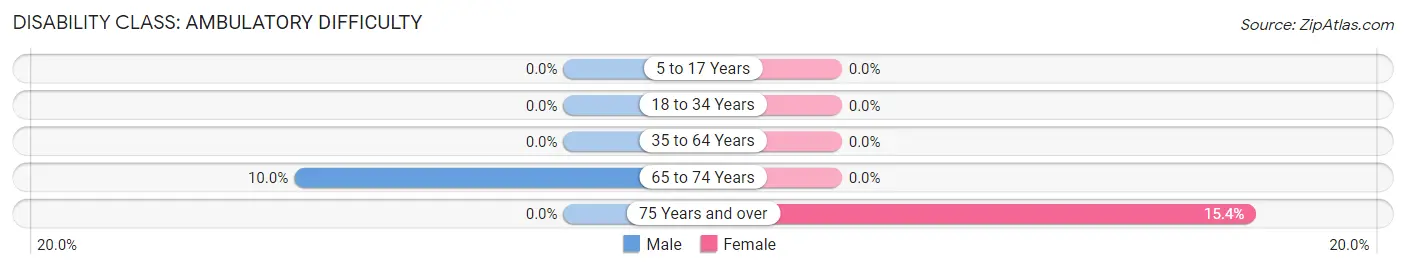
| Age Bracket | Male | Female |
| 5 to 17 Years | 0 (0.0%) | 0 (0.0%) |
| 18 to 34 Years | 0 (0.0%) | 0 (0.0%) |
| 35 to 64 Years | 0 (0.0%) | 0 (0.0%) |
| 65 to 74 Years | 2 (10.0%) | 0 (0.0%) |
| 75 Years and over | 0 (0.0%) | 2 (15.4%) |
Disability Class: Self-Care Difficulty

| Age Bracket | Male | Female |
| 5 to 17 Years | 0 (0.0%) | 0 (0.0%) |
| 18 to 34 Years | 0 (0.0%) | 0 (0.0%) |
| 35 to 64 Years | 0 (0.0%) | 0 (0.0%) |
| 65 to 74 Years | 2 (10.0%) | 0 (0.0%) |
| 75 Years and over | 0 (0.0%) | 0 (0.0%) |
Technology Access in Clifton
Computing Device Access in Clifton
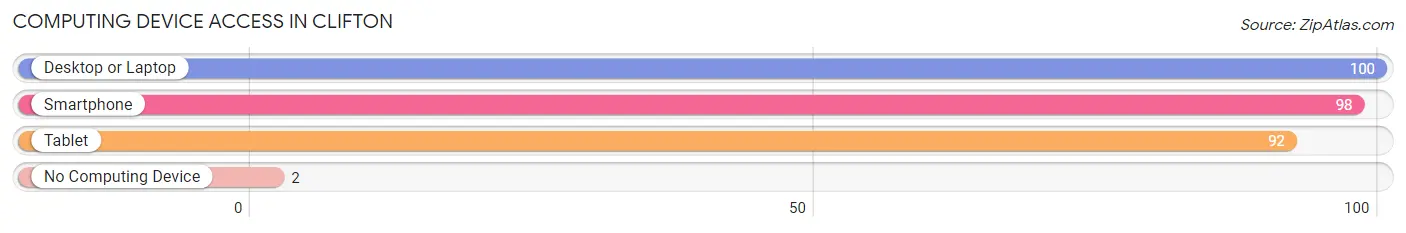
| Device Type | # Households | % Households |
| Desktop or Laptop | 100 | 98.0% |
| Smartphone | 98 | 96.1% |
| Tablet | 92 | 90.2% |
| No Computing Device | 2 | 2.0% |
| Total | 102 | 100.0% |
Internet Access in Clifton
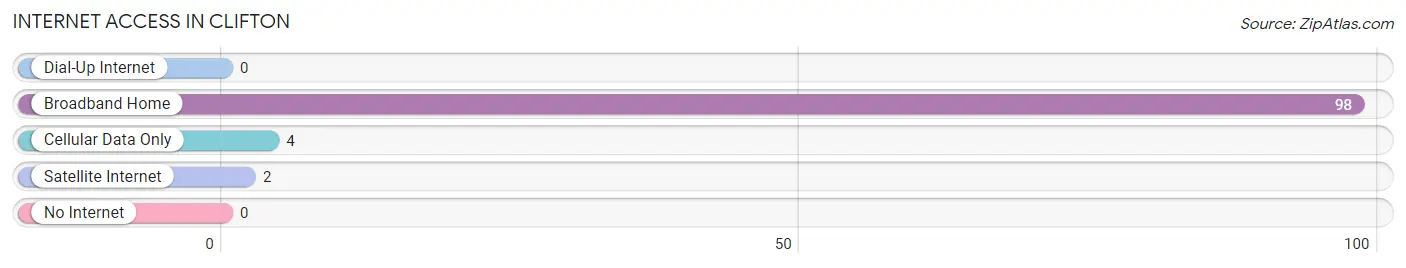
| Internet Type | # Households | % Households |
| Dial-Up Internet | 0 | 0.0% |
| Broadband Home | 98 | 96.1% |
| Cellular Data Only | 4 | 3.9% |
| Satellite Internet | 2 | 2.0% |
| No Internet | 0 | 0.0% |
| Total | 102 | 100.0% |
Clifton Summary
Clifton, Virginia is a small town located in Fairfax County, Virginia, about 20 miles west of Washington, D.C. It is a part of the Washington Metropolitan Area and is home to a population of approximately 8,000 people.
History
Clifton was first settled in the late 1700s by a group of Quakers from Pennsylvania. The town was originally known as “Clifton’s Ford” and was named after the nearby Clifton Ford on Bull Run. The town was officially incorporated in 1868 and was named after the Clifton family, who had owned the land since the late 1700s.
In the late 1800s, Clifton was a thriving agricultural community, with many farms and orchards. The town was also home to a number of mills, including a grist mill, a saw mill, and a woolen mill. The town also had a number of stores, including a general store, a blacksmith shop, and a post office.
In the early 1900s, Clifton began to experience a period of growth and development. The town was connected to the Washington, D.C. area by the Washington and Old Dominion Railroad, which ran through the town. This allowed for increased commerce and industry in the area. The town also saw the construction of a number of new homes and businesses.
Geography
Clifton is located in the Piedmont region of Virginia, about 20 miles west of Washington, D.C. The town is situated on the banks of Bull Run, a tributary of the Potomac River. The town is surrounded by rolling hills and is home to a number of parks and recreational areas.
The climate in Clifton is typical of the mid-Atlantic region, with hot, humid summers and cold, wet winters. The average annual temperature is around 55 degrees Fahrenheit.
Economy
Clifton’s economy is largely based on the service industry. The town is home to a number of restaurants, retail stores, and other businesses. The town is also home to a number of government contractors, which provide employment to many of the town’s residents.
The town is also home to a number of small businesses, including a number of farms and orchards. The town is also home to a number of wineries, which produce a variety of wines.
Demographics
As of the 2010 census, Clifton had a population of 8,000 people. The town is predominantly white, with a small African American population. The town also has a small Hispanic population. The median household income in Clifton is around $90,000, which is higher than the national average.
Clifton is a small town with a rich history and a vibrant economy. The town is home to a diverse population and is a great place to live and work.
Common Questions
What is Per Capita Income in Clifton?
Per Capita income in Clifton is $77,527.
What is the Median Family Income in Clifton?
Median Family Income in Clifton is $250,001.
What is the Median Household income in Clifton?
Median Household Income in Clifton is $219,500.
What is Inequality or Gini Index in Clifton?
Inequality or Gini Index in Clifton is 0.38.
What is the Total Population of Clifton?
Total Population of Clifton is 358.
What is the Total Male Population of Clifton?
Total Male Population of Clifton is 204.
What is the Total Female Population of Clifton?
Total Female Population of Clifton is 154.
What is the Ratio of Males per 100 Females in Clifton?
There are 132.47 Males per 100 Females in Clifton.
What is the Ratio of Females per 100 Males in Clifton?
There are 75.49 Females per 100 Males in Clifton.
What is the Median Population Age in Clifton?
Median Population Age in Clifton is 36.3 Years.
What is the Average Family Size in Clifton
Average Family Size in Clifton is 3.9 People.
What is the Average Household Size in Clifton
Average Household Size in Clifton is 3.5 People.
How Large is the Labor Force in Clifton?
There are 185 People in the Labor Forcein in Clifton.
What is the Percentage of People in the Labor Force in Clifton?
71.2% of People are in the Labor Force in Clifton.