Blue Ridge Shores, VA Map & Demographics
Blue Ridge Shores Map
Blue Ridge Shores Overview
$30,140
PER CAPITA INCOME
$91,458
AVG FAMILY INCOME
$90,938
AVG HOUSEHOLD INCOME
1.1%
WAGE / INCOME GAP [ % ]
98.9¢/ $1
WAGE / INCOME GAP [ $ ]
0.24
INEQUALITY / GINI INDEX
666
TOTAL POPULATION
352
MALE POPULATION
314
FEMALE POPULATION
112.10
MALES / 100 FEMALES
89.20
FEMALES / 100 MALES
34.9
MEDIAN AGE
3.3
AVG FAMILY SIZE
3.5
AVG HOUSEHOLD SIZE
381
LABOR FORCE [ PEOPLE ]
72.0%
PERCENT IN LABOR FORCE
6.0%
UNEMPLOYMENT RATE
Income in Blue Ridge Shores
Income Overview in Blue Ridge Shores
Per Capita Income in Blue Ridge Shores is $30,140, while median incomes of families and households are $91,458 and $90,938 respectively.
| Characteristic | Number | Measure |
| Per Capita Income | 666 | $30,140 |
| Median Family Income | 144 | $91,458 |
| Mean Family Income | 144 | $93,645 |
| Median Household Income | 189 | $90,938 |
| Mean Household Income | 189 | $94,295 |
| Income Deficit | 144 | $0 |
| Wage / Income Gap (%) | 666 | 1.13% |
| Wage / Income Gap ($) | 666 | 98.87¢ per $1 |
| Gini / Inequality Index | 666 | 0.24 |
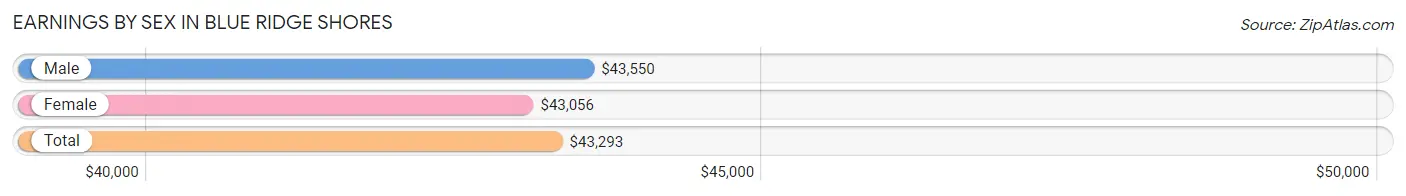
Earnings by Sex in Blue Ridge Shores
Average Earnings in Blue Ridge Shores are $43,293, $43,550 for men and $43,056 for women, a difference of 1.1%.
| Sex | Number | Average Earnings |
| Male | 206 (57.5%) | $43,550 |
| Female | 152 (42.5%) | $43,056 |
| Total | 358 (100.0%) | $43,293 |
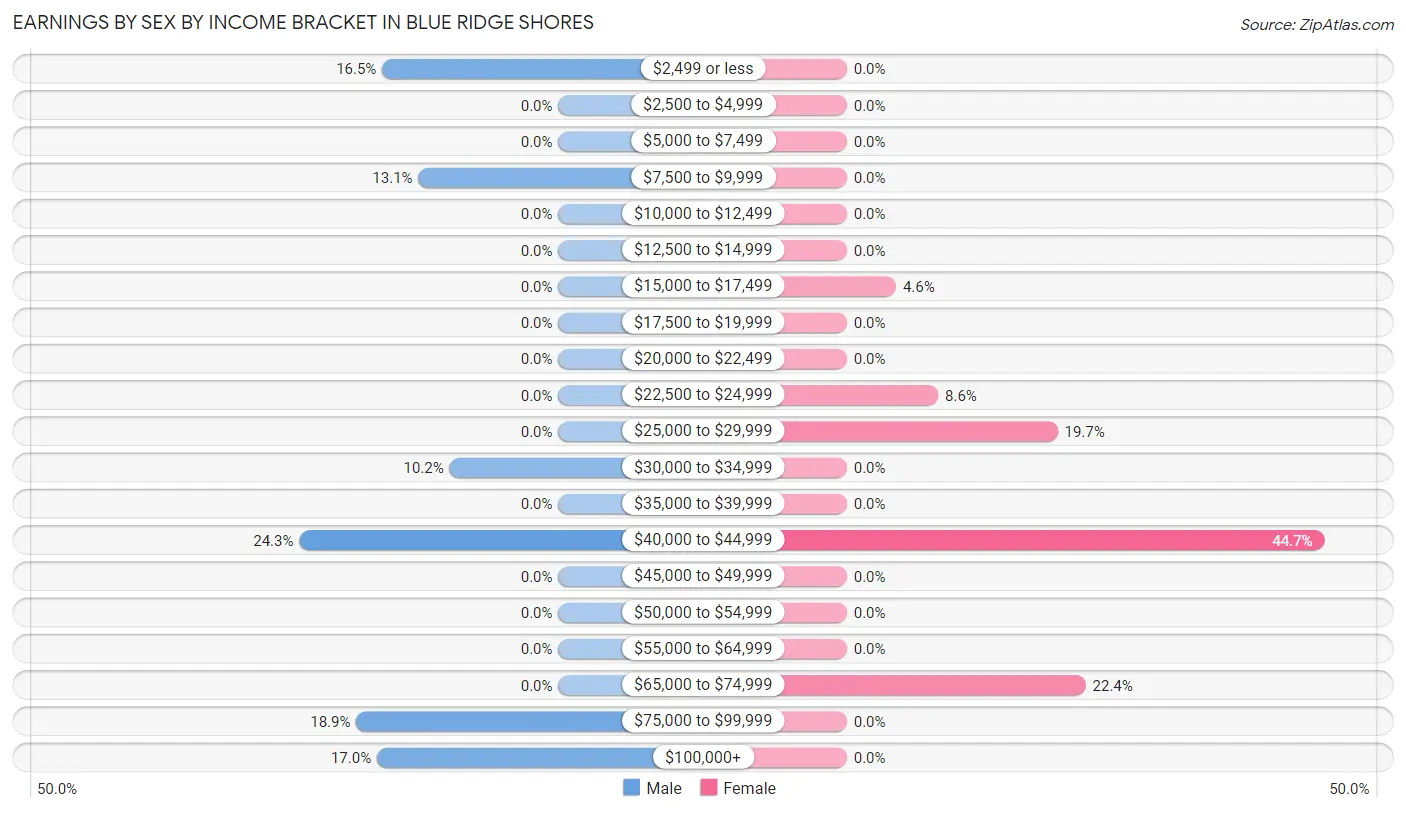
Earnings by Sex by Income Bracket in Blue Ridge Shores
The most common earnings brackets in Blue Ridge Shores are $40,000 to $44,999 for men (50 | 24.3%) and $40,000 to $44,999 for women (68 | 44.7%).
| Income | Male | Female |
| $2,499 or less | 34 (16.5%) | 0 (0.0%) |
| $2,500 to $4,999 | 0 (0.0%) | 0 (0.0%) |
| $5,000 to $7,499 | 0 (0.0%) | 0 (0.0%) |
| $7,500 to $9,999 | 27 (13.1%) | 0 (0.0%) |
| $10,000 to $12,499 | 0 (0.0%) | 0 (0.0%) |
| $12,500 to $14,999 | 0 (0.0%) | 0 (0.0%) |
| $15,000 to $17,499 | 0 (0.0%) | 7 (4.6%) |
| $17,500 to $19,999 | 0 (0.0%) | 0 (0.0%) |
| $20,000 to $22,499 | 0 (0.0%) | 0 (0.0%) |
| $22,500 to $24,999 | 0 (0.0%) | 13 (8.6%) |
| $25,000 to $29,999 | 0 (0.0%) | 30 (19.7%) |
| $30,000 to $34,999 | 21 (10.2%) | 0 (0.0%) |
| $35,000 to $39,999 | 0 (0.0%) | 0 (0.0%) |
| $40,000 to $44,999 | 50 (24.3%) | 68 (44.7%) |
| $45,000 to $49,999 | 0 (0.0%) | 0 (0.0%) |
| $50,000 to $54,999 | 0 (0.0%) | 0 (0.0%) |
| $55,000 to $64,999 | 0 (0.0%) | 0 (0.0%) |
| $65,000 to $74,999 | 0 (0.0%) | 34 (22.4%) |
| $75,000 to $99,999 | 39 (18.9%) | 0 (0.0%) |
| $100,000+ | 35 (17.0%) | 0 (0.0%) |
| Total | 206 (100.0%) | 152 (100.0%) |
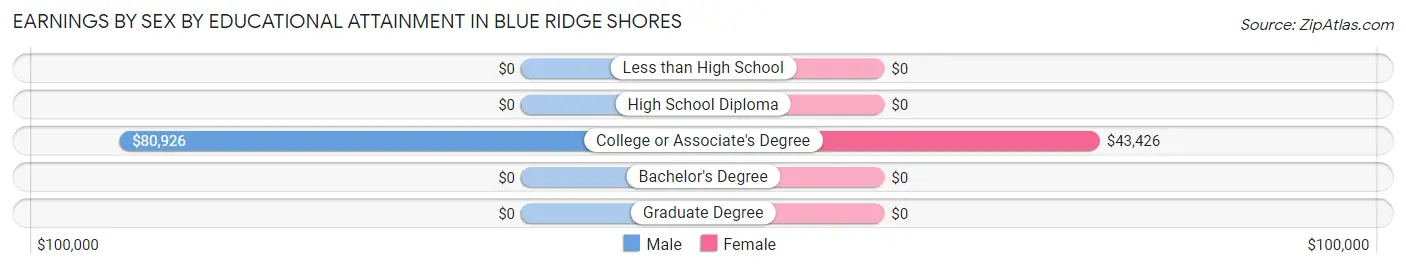
Earnings by Sex by Educational Attainment in Blue Ridge Shores
Average earnings in Blue Ridge Shores are $80,556 for men and $43,056 for women, a difference of 46.6%. Men with an educational attainment of college or associate's degree enjoy the highest average annual earnings of $80,926, while those with college or associate's degree education earn the least with $80,926. Women with an educational attainment of college or associate's degree earn the most with the average annual earnings of $43,426, while those with college or associate's degree education have the smallest earnings of $43,426.
| Educational Attainment | Male Income | Female Income |
| Less than High School | - | - |
| High School Diploma | - | - |
| College or Associate's Degree | $80,926 | $43,426 |
| Bachelor's Degree | - | - |
| Graduate Degree | - | - |
| Total | $80,556 | $43,056 |
Family Income in Blue Ridge Shores
Family Income Brackets in Blue Ridge Shores
According to the Blue Ridge Shores family income data, there are 47 families falling into the $100,000 to $149,999 income range, which is the most common income bracket and makes up 32.6% of all families.
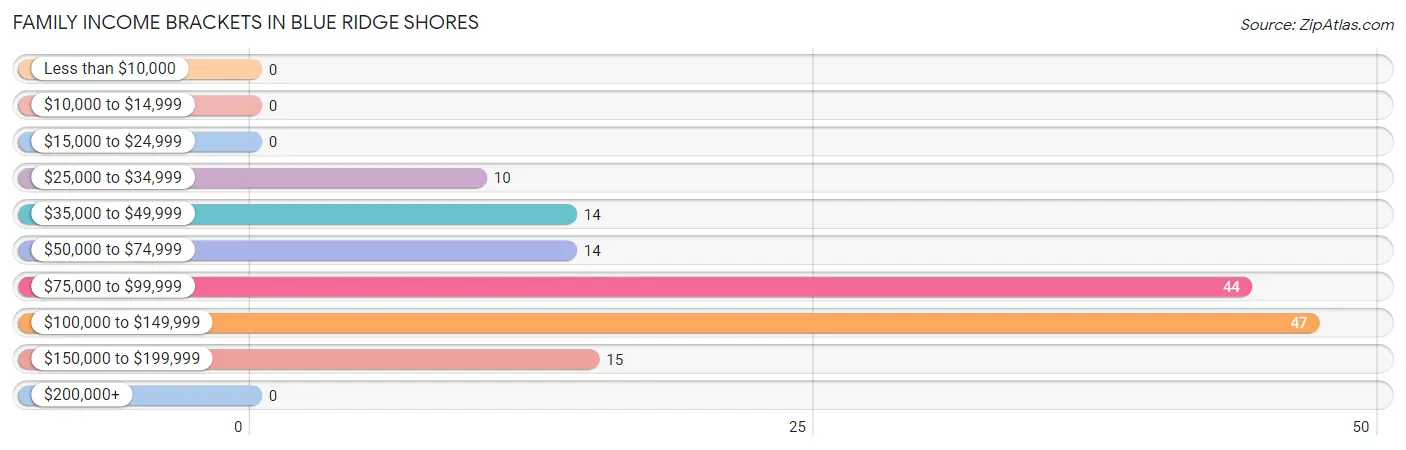
| Income Bracket | # Families | % Families |
| Less than $10,000 | 0 | 0.0% |
| $10,000 to $14,999 | 0 | 0.0% |
| $15,000 to $24,999 | 0 | 0.0% |
| $25,000 to $34,999 | 10 | 6.9% |
| $35,000 to $49,999 | 14 | 9.7% |
| $50,000 to $74,999 | 14 | 9.7% |
| $75,000 to $99,999 | 44 | 30.6% |
| $100,000 to $149,999 | 47 | 32.6% |
| $150,000 to $199,999 | 15 | 10.4% |
| $200,000+ | 0 | 0.0% |
Family Income by Famaliy Size in Blue Ridge Shores
2-person families (36 | 25.0%) account for the highest median family income in Blue Ridge Shores with $61,429 per family, while 2-person families (36 | 25.0%) have the highest median income of $30,714 per family member.
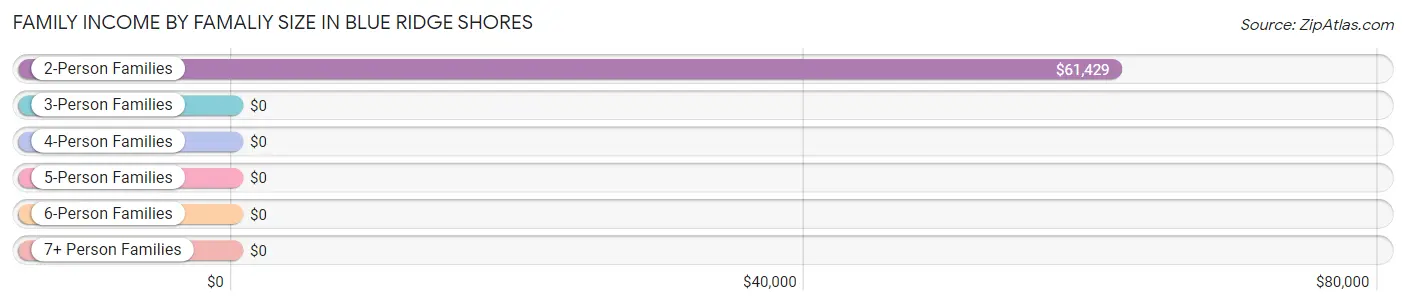
| Income Bracket | # Families | Median Income |
| 2-Person Families | 36 (25.0%) | $61,429 |
| 3-Person Families | 76 (52.8%) | $0 |
| 4-Person Families | 5 (3.5%) | $0 |
| 5-Person Families | 27 (18.8%) | $0 |
| 6-Person Families | 0 (0.0%) | $0 |
| 7+ Person Families | 0 (0.0%) | $0 |
| Total | 144 (100.0%) | $91,458 |
Family Income by Number of Earners in Blue Ridge Shores
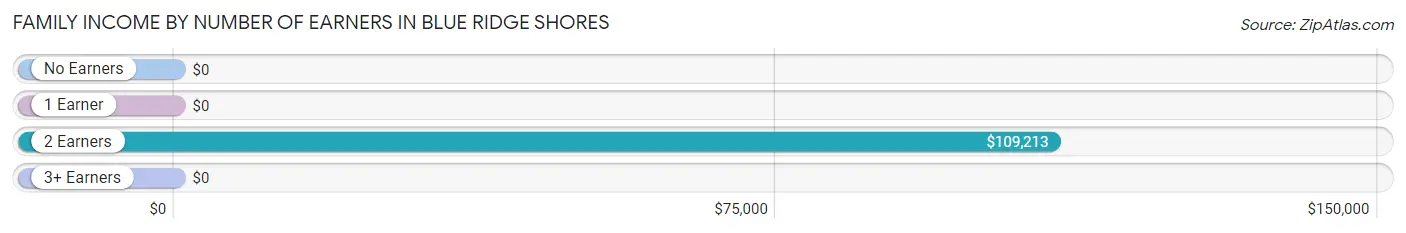
| Number of Earners | # Families | Median Income |
| No Earners | 24 (16.7%) | $0 |
| 1 Earner | 46 (31.9%) | $0 |
| 2 Earners | 47 (32.6%) | $109,213 |
| 3+ Earners | 27 (18.8%) | $0 |
| Total | 144 (100.0%) | $91,458 |
Household Income in Blue Ridge Shores
Household Income Brackets in Blue Ridge Shores
With 60 households falling in the category, the $75,000 to $99,999 income range is the most frequent in Blue Ridge Shores, accounting for 31.8% of all households.
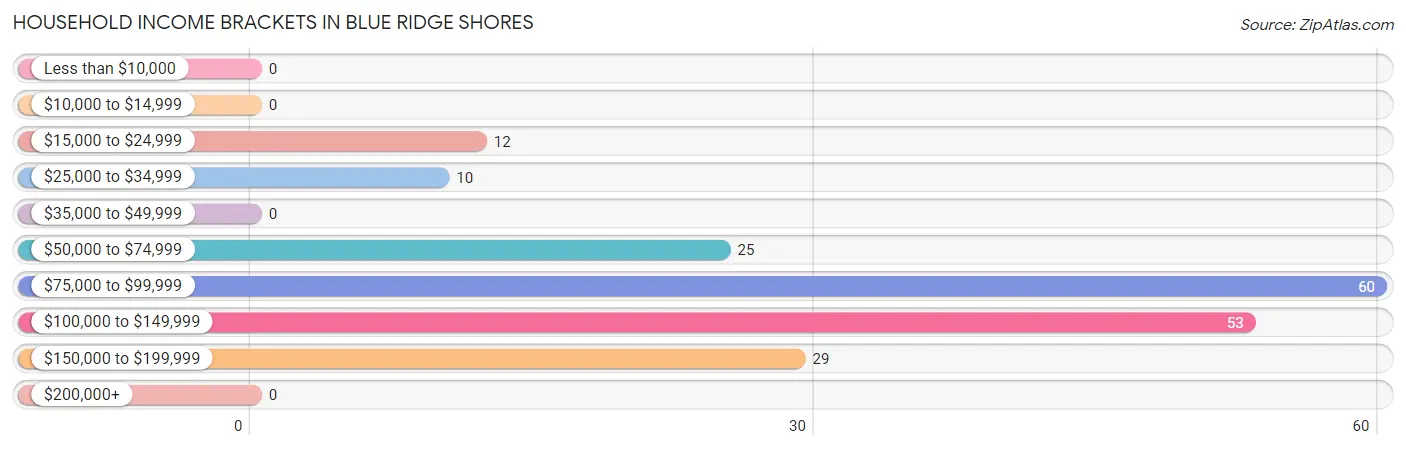
| Income Bracket | # Households | % Households |
| Less than $10,000 | 0 | 0.0% |
| $10,000 to $14,999 | 0 | 0.0% |
| $15,000 to $24,999 | 12 | 6.3% |
| $25,000 to $34,999 | 10 | 5.3% |
| $35,000 to $49,999 | 0 | 0.0% |
| $50,000 to $74,999 | 25 | 13.2% |
| $75,000 to $99,999 | 60 | 31.7% |
| $100,000 to $149,999 | 53 | 28.0% |
| $150,000 to $199,999 | 29 | 15.3% |
| $200,000+ | 0 | 0.0% |
Household Income by Householder Age in Blue Ridge Shores
The median household income in Blue Ridge Shores is $90,938, with the highest median household income of $124,563 found in the 25 to 44 years age bracket for the primary householder. A total of 65 households (34.4%) fall into this category.
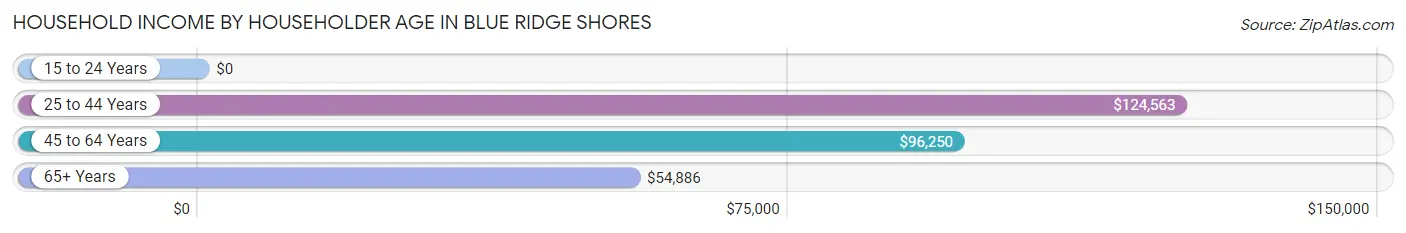
| Income Bracket | # Households | Median Income |
| 15 to 24 Years | 0 (0.0%) | $0 |
| 25 to 44 Years | 65 (34.4%) | $124,563 |
| 45 to 64 Years | 59 (31.2%) | $96,250 |
| 65+ Years | 65 (34.4%) | $54,886 |
| Total | 189 (100.0%) | $90,938 |
Poverty in Blue Ridge Shores
Income Below Poverty by Sex and Age in Blue Ridge Shores
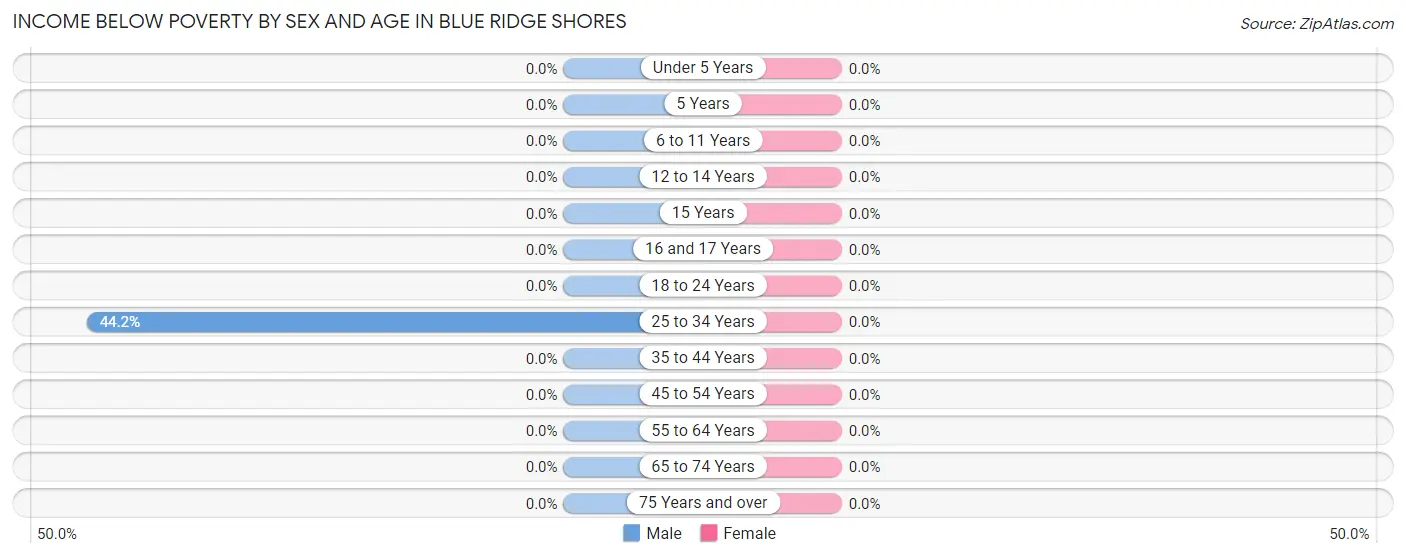
| Age Bracket | Male | Female |
| Under 5 Years | 0 (0.0%) | 0 (0.0%) |
| 5 Years | 0 (0.0%) | 0 (0.0%) |
| 6 to 11 Years | 0 (0.0%) | 0 (0.0%) |
| 12 to 14 Years | 0 (0.0%) | 0 (0.0%) |
| 15 Years | 0 (0.0%) | 0 (0.0%) |
| 16 and 17 Years | 0 (0.0%) | 0 (0.0%) |
| 18 to 24 Years | 0 (0.0%) | 0 (0.0%) |
| 25 to 34 Years | 23 (44.2%) | 0 (0.0%) |
| 35 to 44 Years | 0 (0.0%) | 0 (0.0%) |
| 45 to 54 Years | 0 (0.0%) | 0 (0.0%) |
| 55 to 64 Years | 0 (0.0%) | 0 (0.0%) |
| 65 to 74 Years | 0 (0.0%) | 0 (0.0%) |
| 75 Years and over | 0 (0.0%) | 0 (0.0%) |
| Total | 23 (6.5%) | 0 (0.0%) |
Income Above Poverty by Sex and Age in Blue Ridge Shores
According to the poverty statistics in Blue Ridge Shores, males aged 6 to 11 years and females aged under 5 years are the age groups that are most secure financially, with 100.0% of males and 100.0% of females in these age groups living above the poverty line.
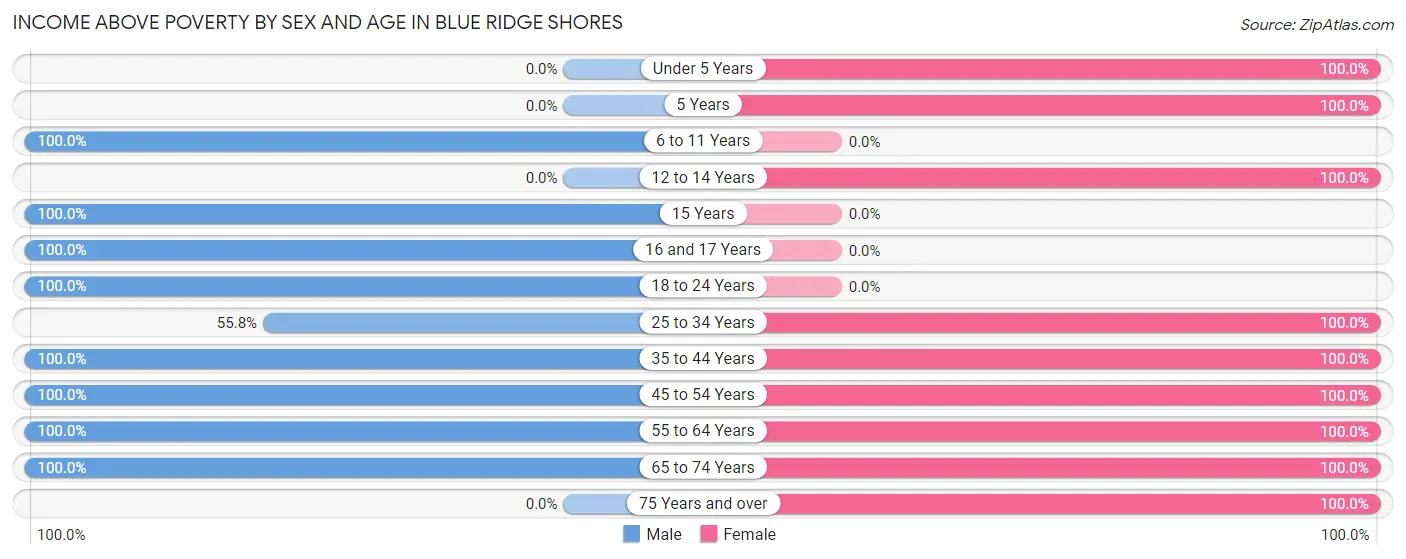
| Age Bracket | Male | Female |
| Under 5 Years | 0 (0.0%) | 33 (100.0%) |
| 5 Years | 0 (0.0%) | 14 (100.0%) |
| 6 to 11 Years | 41 (100.0%) | 0 (0.0%) |
| 12 to 14 Years | 0 (0.0%) | 18 (100.0%) |
| 15 Years | 31 (100.0%) | 0 (0.0%) |
| 16 and 17 Years | 61 (100.0%) | 0 (0.0%) |
| 18 to 24 Years | 36 (100.0%) | 0 (0.0%) |
| 25 to 34 Years | 29 (55.8%) | 48 (100.0%) |
| 35 to 44 Years | 36 (100.0%) | 30 (100.0%) |
| 45 to 54 Years | 32 (100.0%) | 61 (100.0%) |
| 55 to 64 Years | 27 (100.0%) | 55 (100.0%) |
| 65 to 74 Years | 36 (100.0%) | 32 (100.0%) |
| 75 Years and over | 0 (0.0%) | 23 (100.0%) |
| Total | 329 (93.5%) | 314 (100.0%) |
Income Below Poverty Among Married-Couple Families in Blue Ridge Shores
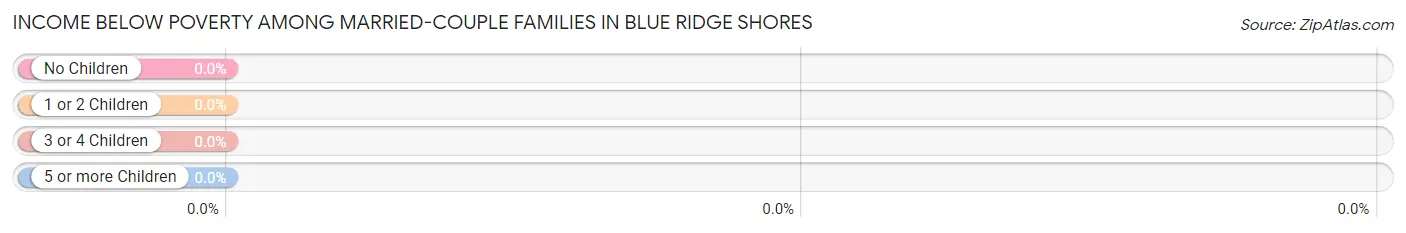
| Children | Above Poverty | Below Poverty |
| No Children | 36 (100.0%) | 0 (0.0%) |
| 1 or 2 Children | 67 (100.0%) | 0 (0.0%) |
| 3 or 4 Children | 27 (100.0%) | 0 (0.0%) |
| 5 or more Children | 0 (0.0%) | 0 (0.0%) |
| Total | 130 (100.0%) | 0 (0.0%) |
Income Below Poverty Among Single-Parent Households in Blue Ridge Shores
| Children | Single Father | Single Mother |
| No Children | 0 (0.0%) | 0 (0.0%) |
| 1 or 2 Children | 0 (0.0%) | 0 (0.0%) |
| 3 or 4 Children | 0 (0.0%) | 0 (0.0%) |
| 5 or more Children | 0 (0.0%) | 0 (0.0%) |
| Total | 0 (0.0%) | 0 (0.0%) |
Income Below Poverty Among Married-Couple vs Single-Parent Households in Blue Ridge Shores
| Children | Married-Couple Families | Single-Parent Households |
| No Children | 0 (0.0%) | 0 (0.0%) |
| 1 or 2 Children | 0 (0.0%) | 0 (0.0%) |
| 3 or 4 Children | 0 (0.0%) | 0 (0.0%) |
| 5 or more Children | 0 (0.0%) | 0 (0.0%) |
| Total | 0 (0.0%) | 0 (0.0%) |
Race in Blue Ridge Shores
The most populous races in Blue Ridge Shores are White / Caucasian (636 | 95.5%), Two or more Races (16 | 2.4%), and Black / African American (14 | 2.1%).
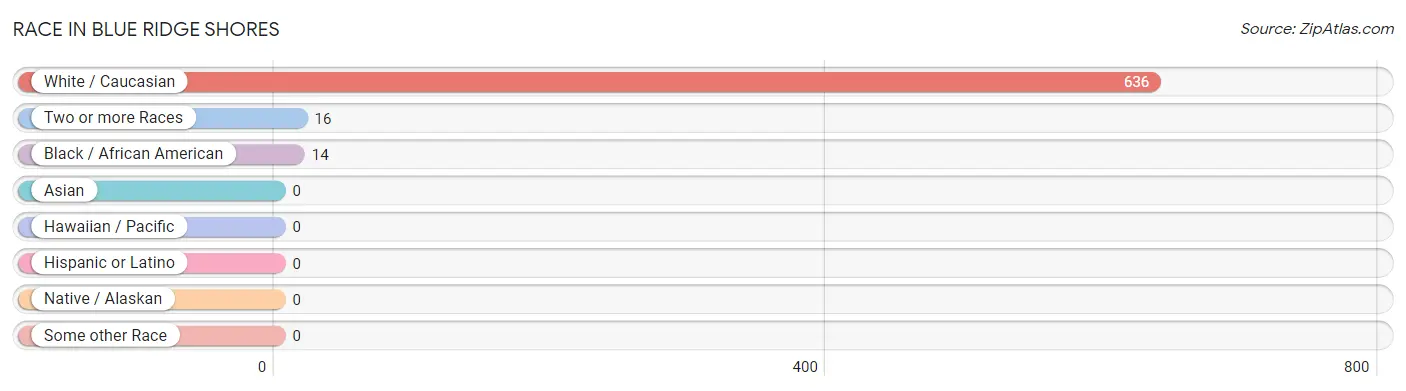
| Race | # Population | % Population |
| Asian | 0 | 0.0% |
| Black / African American | 14 | 2.1% |
| Hawaiian / Pacific | 0 | 0.0% |
| Hispanic or Latino | 0 | 0.0% |
| Native / Alaskan | 0 | 0.0% |
| White / Caucasian | 636 | 95.5% |
| Two or more Races | 16 | 2.4% |
| Some other Race | 0 | 0.0% |
| Total | 666 | 100.0% |
Ancestry in Blue Ridge Shores
The most populous ancestries reported in Blue Ridge Shores are American (288 | 43.2%), German (120 | 18.0%), English (51 | 7.7%), Albanian (28 | 4.2%), and Irish (27 | 4.1%), together accounting for 77.2% of all Blue Ridge Shores residents.
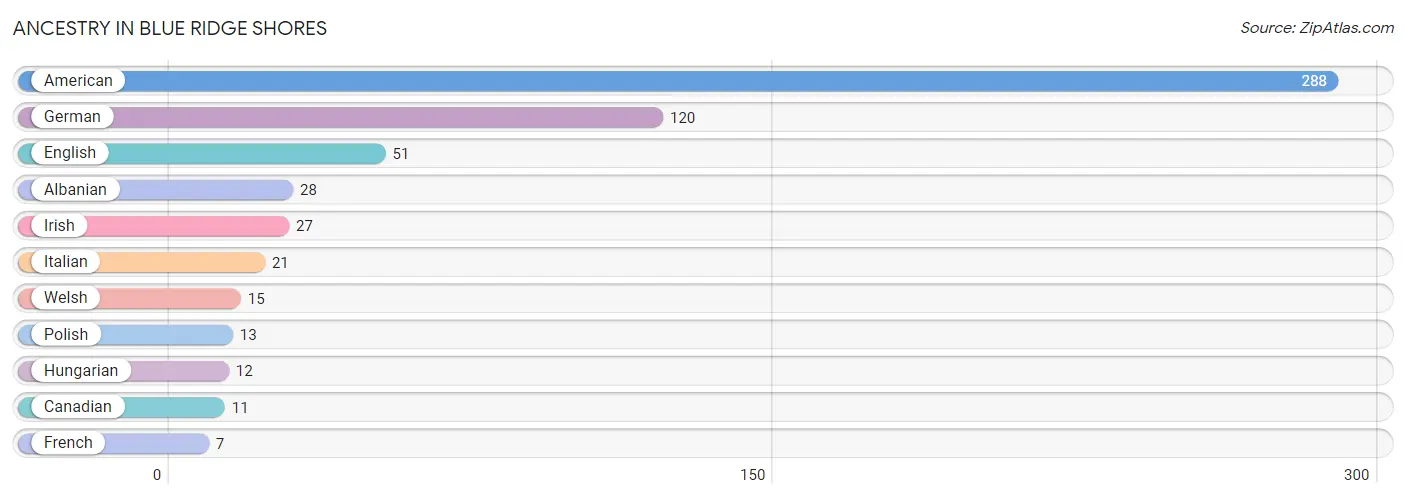
| Ancestry | # Population | % Population |
| Albanian | 28 | 4.2% |
| American | 288 | 43.2% |
| Canadian | 11 | 1.7% |
| English | 51 | 7.7% |
| French | 7 | 1.1% |
| German | 120 | 18.0% |
| Hungarian | 12 | 1.8% |
| Irish | 27 | 4.1% |
| Italian | 21 | 3.2% |
| Polish | 13 | 1.9% |
| Welsh | 15 | 2.2% | View All 11 Rows |
Immigrants in Blue Ridge Shores
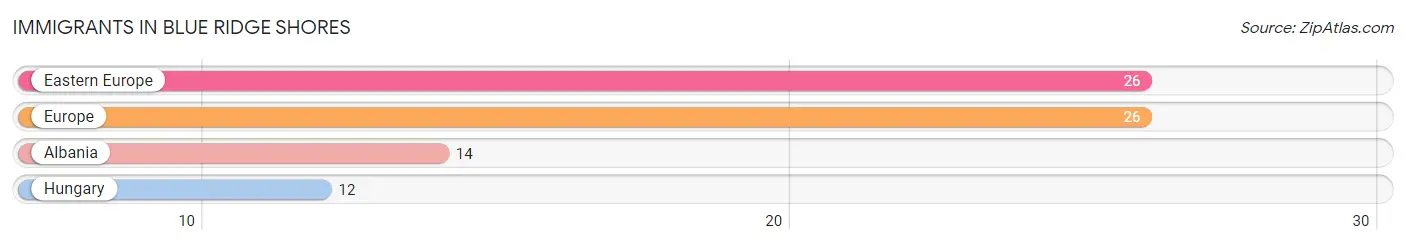
The most numerous immigrant groups reported in Blue Ridge Shores came from Eastern Europe (26 | 3.9%), Europe (26 | 3.9%), Albania (14 | 2.1%), and Hungary (12 | 1.8%), together accounting for 11.7% of all Blue Ridge Shores residents.
| Immigration Origin | # Population | % Population |
| Albania | 14 | 2.1% |
| Eastern Europe | 26 | 3.9% |
| Europe | 26 | 3.9% |
| Hungary | 12 | 1.8% | View All 4 Rows |
Sex and Age in Blue Ridge Shores
Sex and Age in Blue Ridge Shores
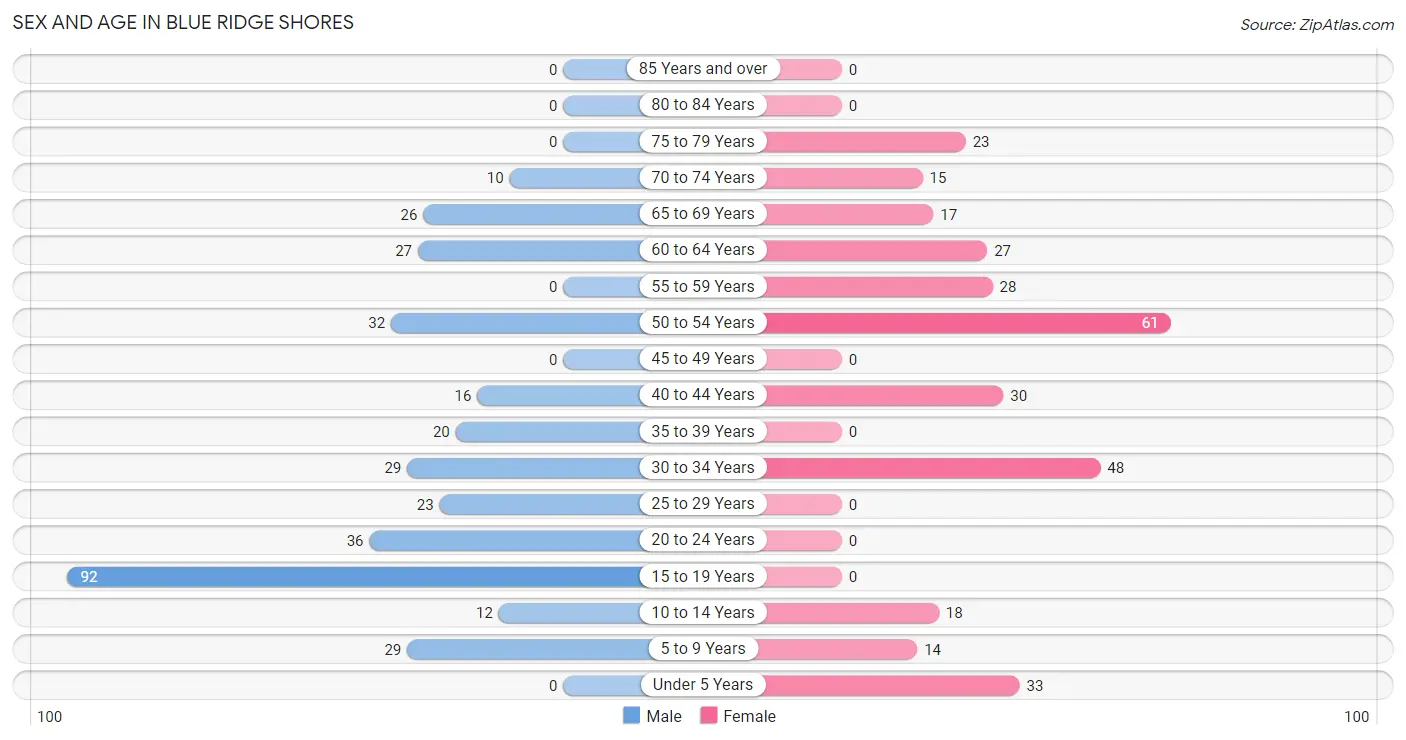
The most populous age groups in Blue Ridge Shores are 15 to 19 Years (92 | 26.1%) for men and 50 to 54 Years (61 | 19.4%) for women.
| Age Bracket | Male | Female |
| Under 5 Years | 0 (0.0%) | 33 (10.5%) |
| 5 to 9 Years | 29 (8.2%) | 14 (4.5%) |
| 10 to 14 Years | 12 (3.4%) | 18 (5.7%) |
| 15 to 19 Years | 92 (26.1%) | 0 (0.0%) |
| 20 to 24 Years | 36 (10.2%) | 0 (0.0%) |
| 25 to 29 Years | 23 (6.5%) | 0 (0.0%) |
| 30 to 34 Years | 29 (8.2%) | 48 (15.3%) |
| 35 to 39 Years | 20 (5.7%) | 0 (0.0%) |
| 40 to 44 Years | 16 (4.5%) | 30 (9.6%) |
| 45 to 49 Years | 0 (0.0%) | 0 (0.0%) |
| 50 to 54 Years | 32 (9.1%) | 61 (19.4%) |
| 55 to 59 Years | 0 (0.0%) | 28 (8.9%) |
| 60 to 64 Years | 27 (7.7%) | 27 (8.6%) |
| 65 to 69 Years | 26 (7.4%) | 17 (5.4%) |
| 70 to 74 Years | 10 (2.8%) | 15 (4.8%) |
| 75 to 79 Years | 0 (0.0%) | 23 (7.3%) |
| 80 to 84 Years | 0 (0.0%) | 0 (0.0%) |
| 85 Years and over | 0 (0.0%) | 0 (0.0%) |
| Total | 352 (100.0%) | 314 (100.0%) |
Families and Households in Blue Ridge Shores
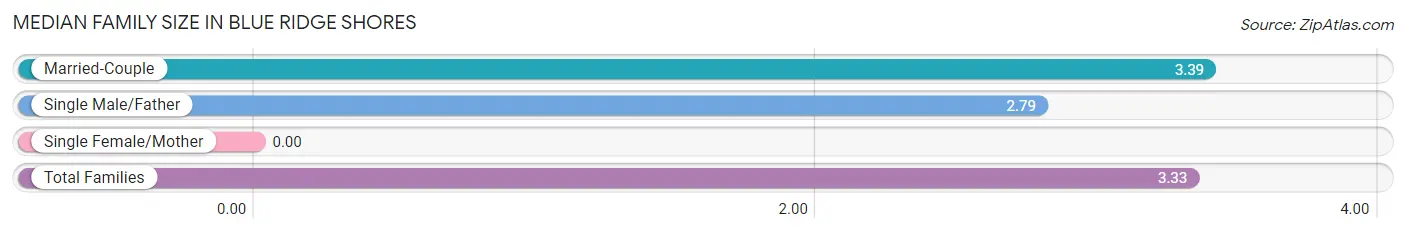
Median Family Size in Blue Ridge Shores
| Family Type | # Families | Family Size |
| Married-Couple | 130 (90.3%) | 3.39 |
| Single Male/Father | 14 (9.7%) | 2.79 |
| Single Female/Mother | 0 (0.0%) | - |
| Total Families | 144 (100.0%) | 3.33 |
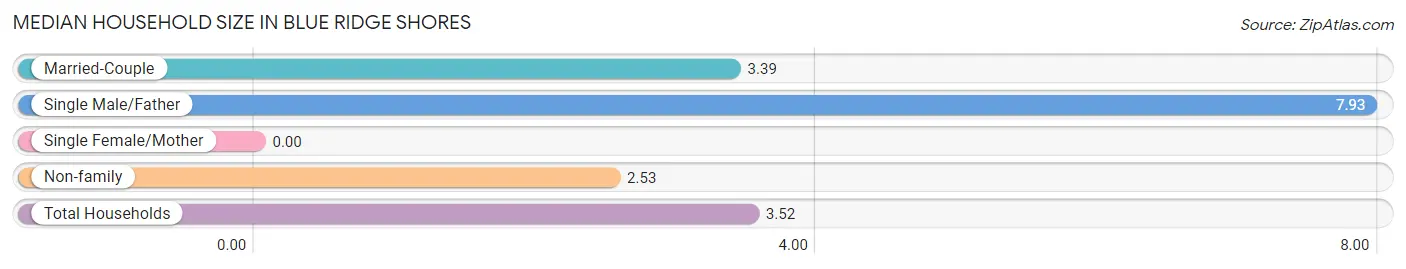
Median Household Size in Blue Ridge Shores
| Household Type | # Households | Household Size |
| Married-Couple | 130 (68.8%) | 3.39 |
| Single Male/Father | 14 (7.4%) | 7.93 |
| Single Female/Mother | 0 (0.0%) | - |
| Non-family | 45 (23.8%) | 2.53 |
| Total Households | 189 (100.0%) | 3.52 |
Household Size by Marriage Status in Blue Ridge Shores
Out of a total of 189 households in Blue Ridge Shores, 144 (76.2%) are family households, while 45 (23.8%) are nonfamily households. The most numerous type of family households are 3-person households, comprising 62, and the most common type of nonfamily households are 2-person households, comprising 27.
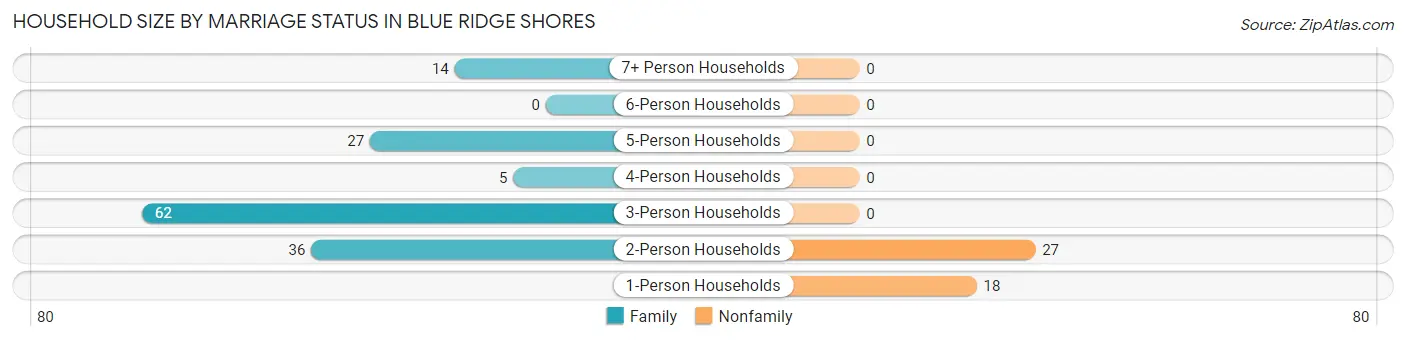
| Household Size | Family Households | Nonfamily Households |
| 1-Person Households | - | 18 (9.5%) |
| 2-Person Households | 36 (19.1%) | 27 (14.3%) |
| 3-Person Households | 62 (32.8%) | 0 (0.0%) |
| 4-Person Households | 5 (2.6%) | 0 (0.0%) |
| 5-Person Households | 27 (14.3%) | 0 (0.0%) |
| 6-Person Households | 0 (0.0%) | 0 (0.0%) |
| 7+ Person Households | 14 (7.4%) | 0 (0.0%) |
| Total | 144 (76.2%) | 45 (23.8%) |
Female Fertility in Blue Ridge Shores
Fertility by Age in Blue Ridge Shores
| Age Bracket | Women with Births | Births / 1,000 Women |
| 15 to 19 years | 0 (0.0%) | 0.0 |
| 20 to 34 years | 0 (0.0%) | 0.0 |
| 35 to 50 years | 0 (0.0%) | 0.0 |
| Total | 0 (0.0%) | 0.0 |
Fertility by Age by Marriage Status in Blue Ridge Shores
| Age Bracket | Married | Unmarried |
| 15 to 19 years | 0 (0.0%) | 0 (0.0%) |
| 20 to 34 years | 0 (0.0%) | 0 (0.0%) |
| 35 to 50 years | 0 (0.0%) | 0 (0.0%) |
| Total | 0 (0.0%) | 0 (0.0%) |
Fertility by Education in Blue Ridge Shores
| Educational Attainment | Women with Births | Births / 1,000 Women |
| Less than High School | 0 (0.0%) | 0.0 |
| High School Diploma | 0 (0.0%) | 0.0 |
| College or Associate's Degree | 0 (0.0%) | 0.0 |
| Bachelor's Degree | 0 (0.0%) | 0.0 |
| Graduate Degree | 0 (0.0%) | 0.0 |
| Total | 0 (0.0%) | 0.0 |
Fertility by Education by Marriage Status in Blue Ridge Shores
| Educational Attainment | Married | Unmarried |
| Less than High School | 0 (0.0%) | 0 (0.0%) |
| High School Diploma | 0 (0.0%) | 0 (0.0%) |
| College or Associate's Degree | 0 (0.0%) | 0 (0.0%) |
| Bachelor's Degree | 0 (0.0%) | 0 (0.0%) |
| Graduate Degree | 0 (0.0%) | 0 (0.0%) |
| Total | 0 (0.0%) | 0 (0.0%) |
Employment Characteristics in Blue Ridge Shores
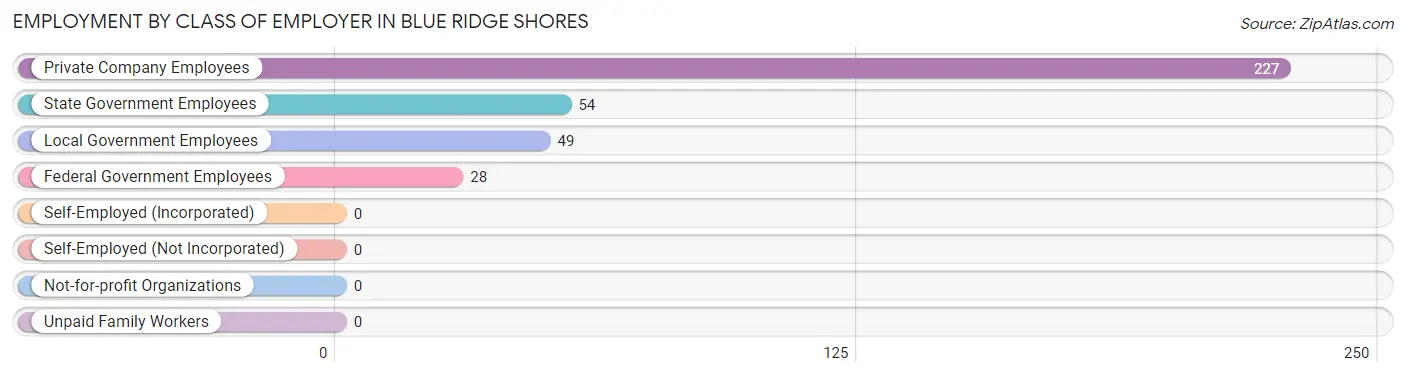
Employment by Class of Employer in Blue Ridge Shores
Among the 358 employed individuals in Blue Ridge Shores, private company employees (227 | 63.4%), state government employees (54 | 15.1%), and local government employees (49 | 13.7%) make up the most common classes of employment.
| Employer Class | # Employees | % Employees |
| Private Company Employees | 227 | 63.4% |
| Self-Employed (Incorporated) | 0 | 0.0% |
| Self-Employed (Not Incorporated) | 0 | 0.0% |
| Not-for-profit Organizations | 0 | 0.0% |
| Local Government Employees | 49 | 13.7% |
| State Government Employees | 54 | 15.1% |
| Federal Government Employees | 28 | 7.8% |
| Unpaid Family Workers | 0 | 0.0% |
| Total | 358 | 100.0% |
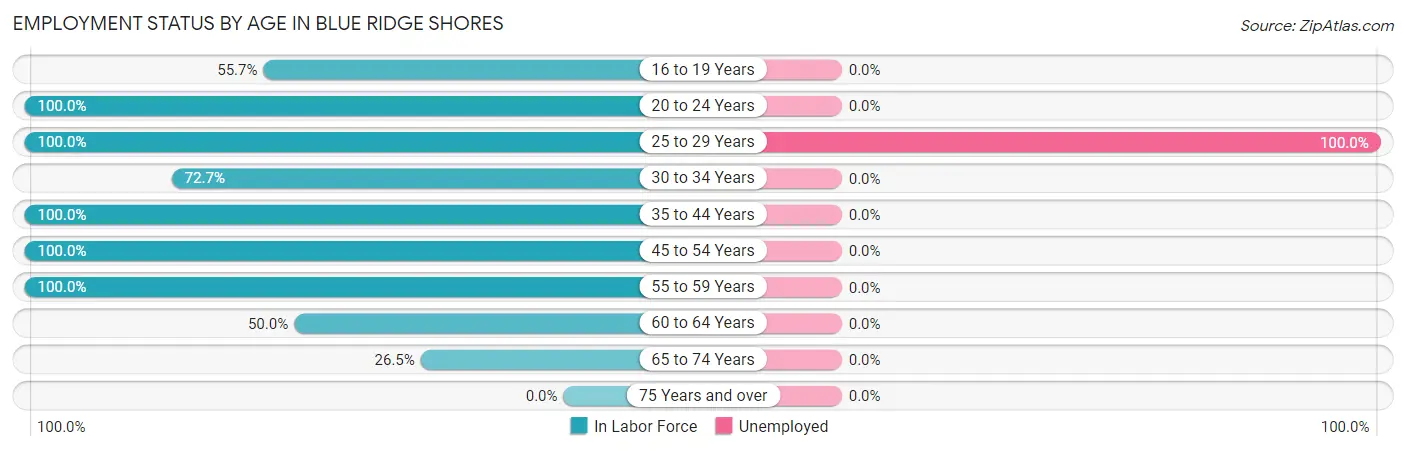
Employment Status by Age in Blue Ridge Shores
According to the labor force statistics for Blue Ridge Shores, out of the total population over 16 years of age (529), 72.0% or 381 individuals are in the labor force, with 6.0% or 23 of them unemployed. The age group with the highest labor force participation rate is 20 to 24 years, with 100.0% or 36 individuals in the labor force. Within the labor force, the 25 to 29 years age range has the highest percentage of unemployed individuals, with 100.0% or 23 of them being unemployed.
| Age Bracket | In Labor Force | Unemployed |
| 16 to 19 Years | 34 (55.7%) | 0 (0.0%) |
| 20 to 24 Years | 36 (100.0%) | 0 (0.0%) |
| 25 to 29 Years | 23 (100.0%) | 23 (100.0%) |
| 30 to 34 Years | 56 (72.7%) | 0 (0.0%) |
| 35 to 44 Years | 66 (100.0%) | 0 (0.0%) |
| 45 to 54 Years | 93 (100.0%) | 0 (0.0%) |
| 55 to 59 Years | 28 (100.0%) | 0 (0.0%) |
| 60 to 64 Years | 27 (50.0%) | 0 (0.0%) |
| 65 to 74 Years | 18 (26.5%) | 0 (0.0%) |
| 75 Years and over | 0 (0.0%) | 0 (0.0%) |
| Total | 381 (72.0%) | 23 (6.0%) |
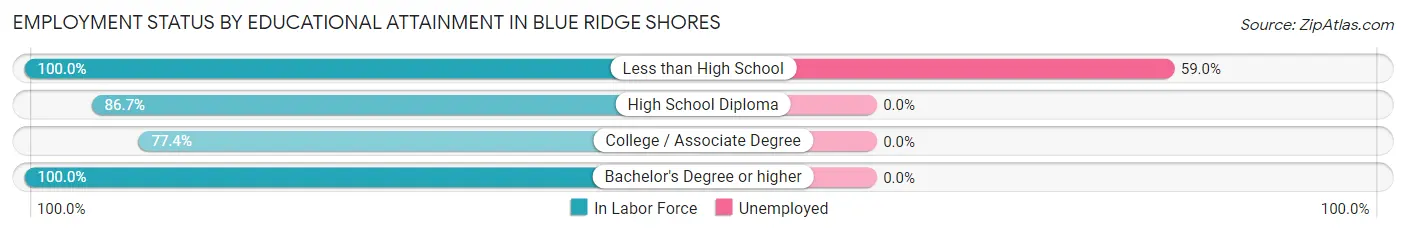
Employment Status by Educational Attainment in Blue Ridge Shores
According to labor force statistics for Blue Ridge Shores, 85.9% of individuals (293) out of the total population between 25 and 64 years of age (341) are in the labor force, with 7.8% or 23 of them being unemployed. The group with the highest labor force participation rate are those with the educational attainment of less than high school, with 100.0% or 39 individuals in the labor force. Within the labor force, individuals with less than high school education have the highest percentage of unemployment, with 59.0% or 23 of them being unemployed.
| Educational Attainment | In Labor Force | Unemployed |
| Less than High School | 39 (100.0%) | 23 (59.0%) |
| High School Diploma | 85 (86.7%) | 0 (0.0%) |
| College / Associate Degree | 120 (77.4%) | 0 (0.0%) |
| Bachelor's Degree or higher | 49 (100.0%) | 0 (0.0%) |
| Total | 293 (85.9%) | 27 (7.8%) |
Employment Occupations by Sex in Blue Ridge Shores
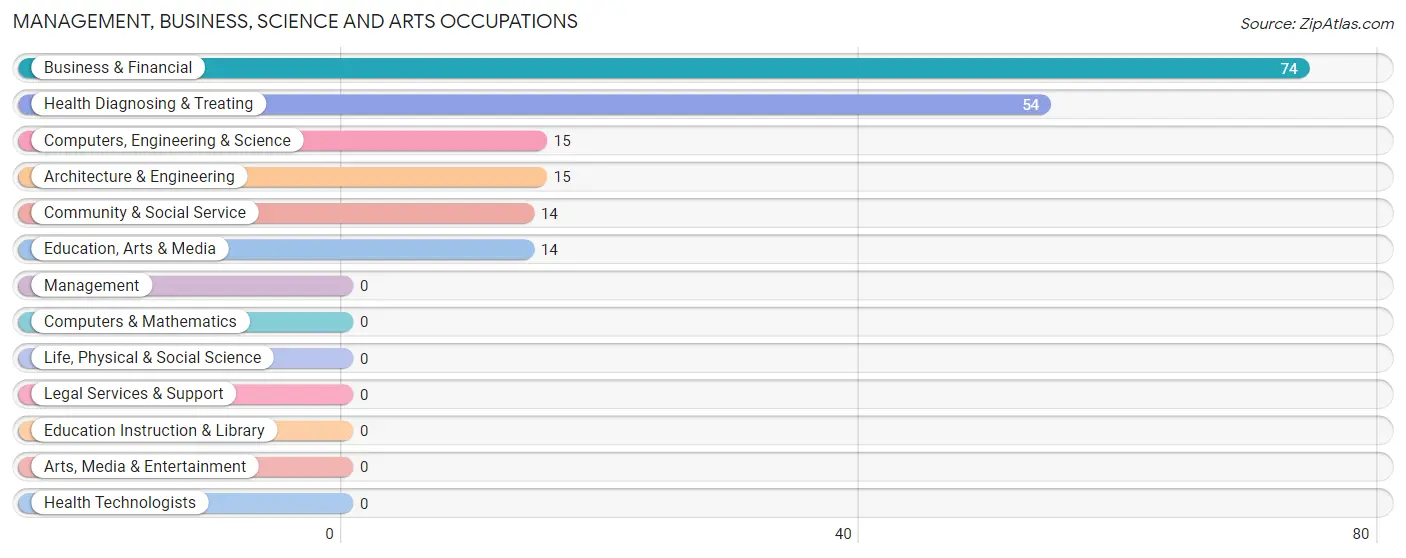
Management, Business, Science and Arts Occupations
The most common Management, Business, Science and Arts occupations in Blue Ridge Shores are Business & Financial (74 | 20.7%), Health Diagnosing & Treating (54 | 15.1%), Computers, Engineering & Science (15 | 4.2%), Architecture & Engineering (15 | 4.2%), and Community & Social Service (14 | 3.9%).
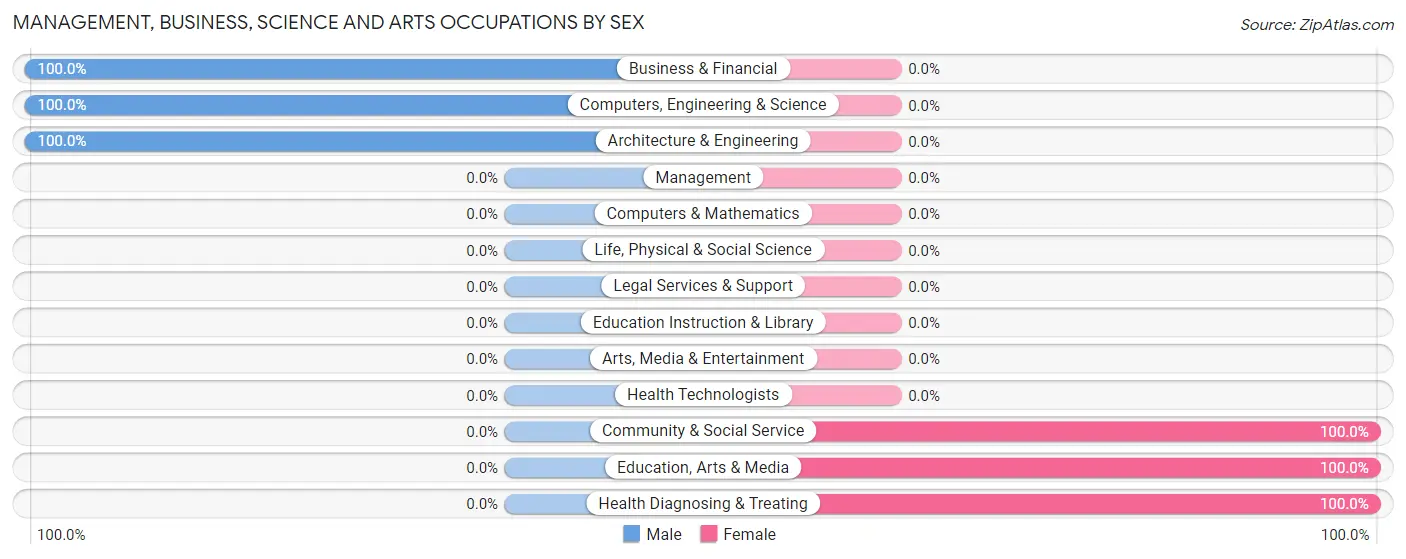
Management, Business, Science and Arts Occupations by Sex
Within the Management, Business, Science and Arts occupations in Blue Ridge Shores, the most male-oriented occupations are Business & Financial (100.0%), Computers, Engineering & Science (100.0%), and Architecture & Engineering (100.0%), while the most female-oriented occupations are Community & Social Service (100.0%), Education, Arts & Media (100.0%), and Health Diagnosing & Treating (100.0%).
| Occupation | Male | Female |
| Management | 0 (0.0%) | 0 (0.0%) |
| Business & Financial | 74 (100.0%) | 0 (0.0%) |
| Computers, Engineering & Science | 15 (100.0%) | 0 (0.0%) |
| Computers & Mathematics | 0 (0.0%) | 0 (0.0%) |
| Architecture & Engineering | 15 (100.0%) | 0 (0.0%) |
| Life, Physical & Social Science | 0 (0.0%) | 0 (0.0%) |
| Community & Social Service | 0 (0.0%) | 14 (100.0%) |
| Education, Arts & Media | 0 (0.0%) | 14 (100.0%) |
| Legal Services & Support | 0 (0.0%) | 0 (0.0%) |
| Education Instruction & Library | 0 (0.0%) | 0 (0.0%) |
| Arts, Media & Entertainment | 0 (0.0%) | 0 (0.0%) |
| Health Diagnosing & Treating | 0 (0.0%) | 54 (100.0%) |
| Health Technologists | 0 (0.0%) | 0 (0.0%) |
| Total (Category) | 89 (56.7%) | 68 (43.3%) |
| Total (Overall) | 206 (57.5%) | 152 (42.5%) |
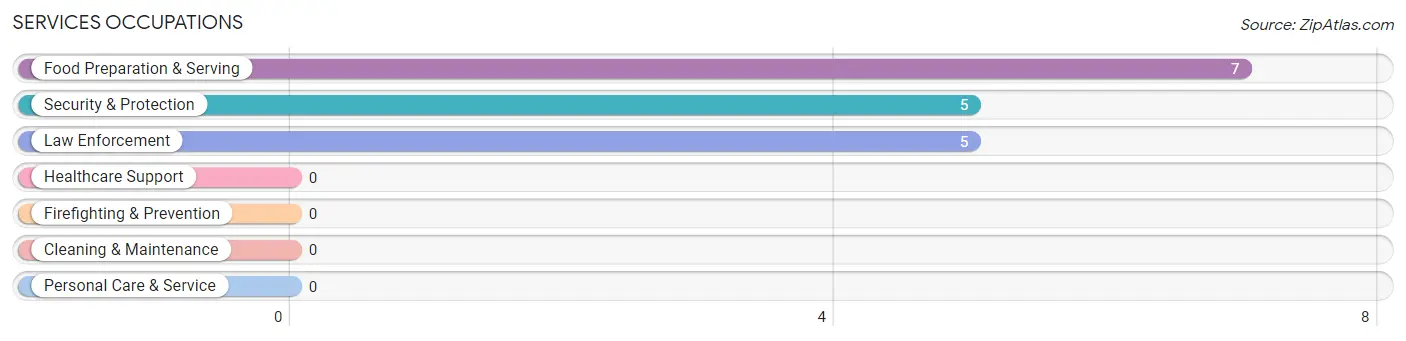
Services Occupations
The most common Services occupations in Blue Ridge Shores are Food Preparation & Serving (7 | 2.0%), Security & Protection (5 | 1.4%), and Law Enforcement (5 | 1.4%).
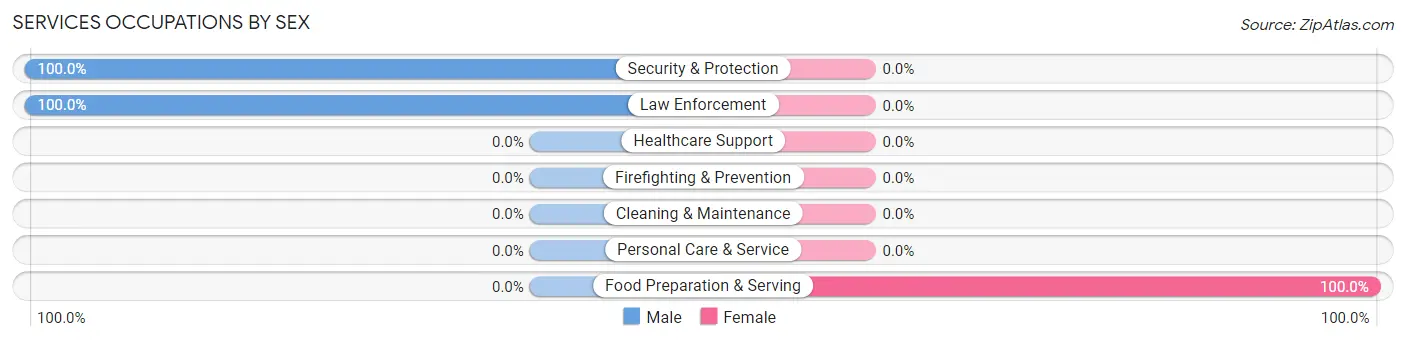
Services Occupations by Sex
| Occupation | Male | Female |
| Healthcare Support | 0 (0.0%) | 0 (0.0%) |
| Security & Protection | 5 (100.0%) | 0 (0.0%) |
| Firefighting & Prevention | 0 (0.0%) | 0 (0.0%) |
| Law Enforcement | 5 (100.0%) | 0 (0.0%) |
| Food Preparation & Serving | 0 (0.0%) | 7 (100.0%) |
| Cleaning & Maintenance | 0 (0.0%) | 0 (0.0%) |
| Personal Care & Service | 0 (0.0%) | 0 (0.0%) |
| Total (Category) | 5 (41.7%) | 7 (58.3%) |
| Total (Overall) | 206 (57.5%) | 152 (42.5%) |
Sales and Office Occupations
The most common Sales and Office occupations in Blue Ridge Shores are Office & Administration (76 | 21.2%), and Sales & Related (34 | 9.5%).
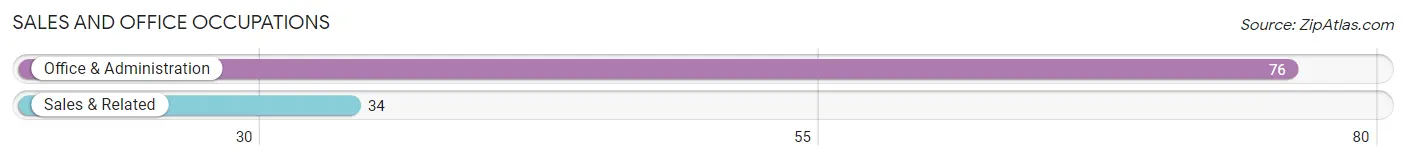
Sales and Office Occupations by Sex

| Occupation | Male | Female |
| Sales & Related | 34 (100.0%) | 0 (0.0%) |
| Office & Administration | 12 (15.8%) | 64 (84.2%) |
| Total (Category) | 46 (41.8%) | 64 (58.2%) |
| Total (Overall) | 206 (57.5%) | 152 (42.5%) |
Natural Resources, Construction and Maintenance Occupations
The most common Natural Resources, Construction and Maintenance occupations in Blue Ridge Shores are , and Construction & Extraction (16 | 4.5%).
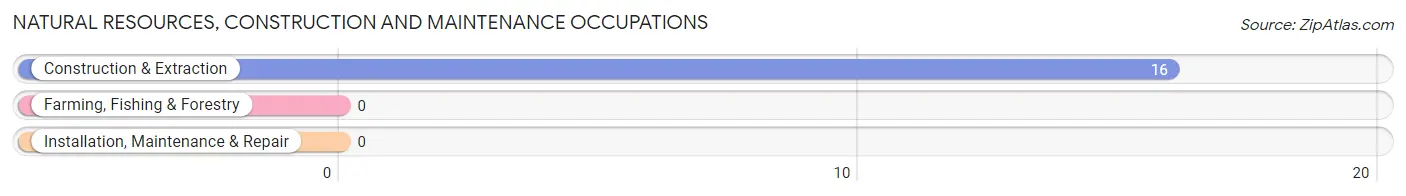
Natural Resources, Construction and Maintenance Occupations by Sex

| Occupation | Male | Female |
| Farming, Fishing & Forestry | 0 (0.0%) | 0 (0.0%) |
| Construction & Extraction | 16 (100.0%) | 0 (0.0%) |
| Installation, Maintenance & Repair | 0 (0.0%) | 0 (0.0%) |
| Total (Category) | 16 (100.0%) | 0 (0.0%) |
| Total (Overall) | 206 (57.5%) | 152 (42.5%) |
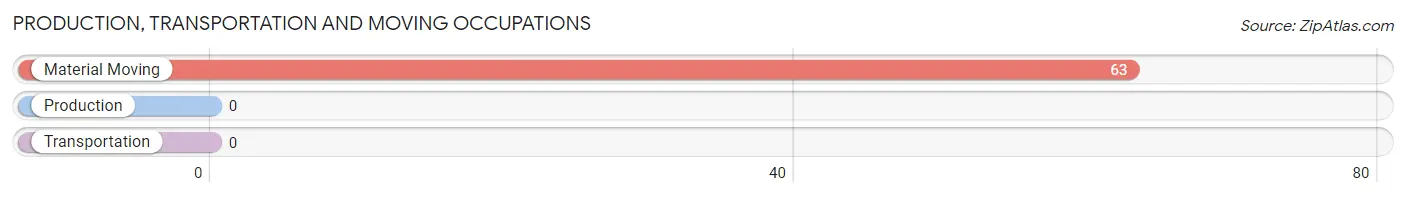
Production, Transportation and Moving Occupations
The most common Production, Transportation and Moving occupations in Blue Ridge Shores are , and Material Moving (63 | 17.6%).
Production, Transportation and Moving Occupations by Sex
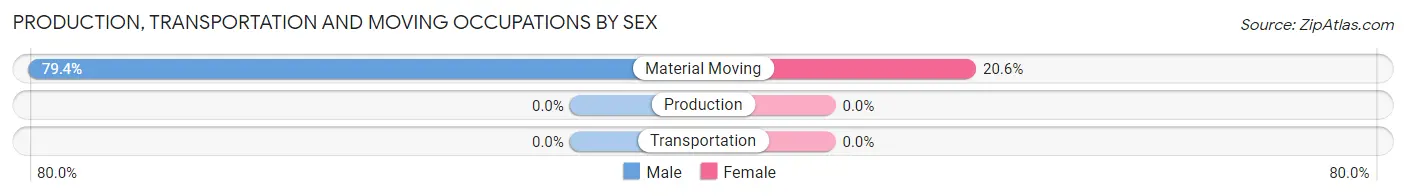
| Occupation | Male | Female |
| Production | 0 (0.0%) | 0 (0.0%) |
| Transportation | 0 (0.0%) | 0 (0.0%) |
| Material Moving | 50 (79.4%) | 13 (20.6%) |
| Total (Category) | 50 (79.4%) | 13 (20.6%) |
| Total (Overall) | 206 (57.5%) | 152 (42.5%) |
Employment Industries by Sex in Blue Ridge Shores
Employment Industries in Blue Ridge Shores
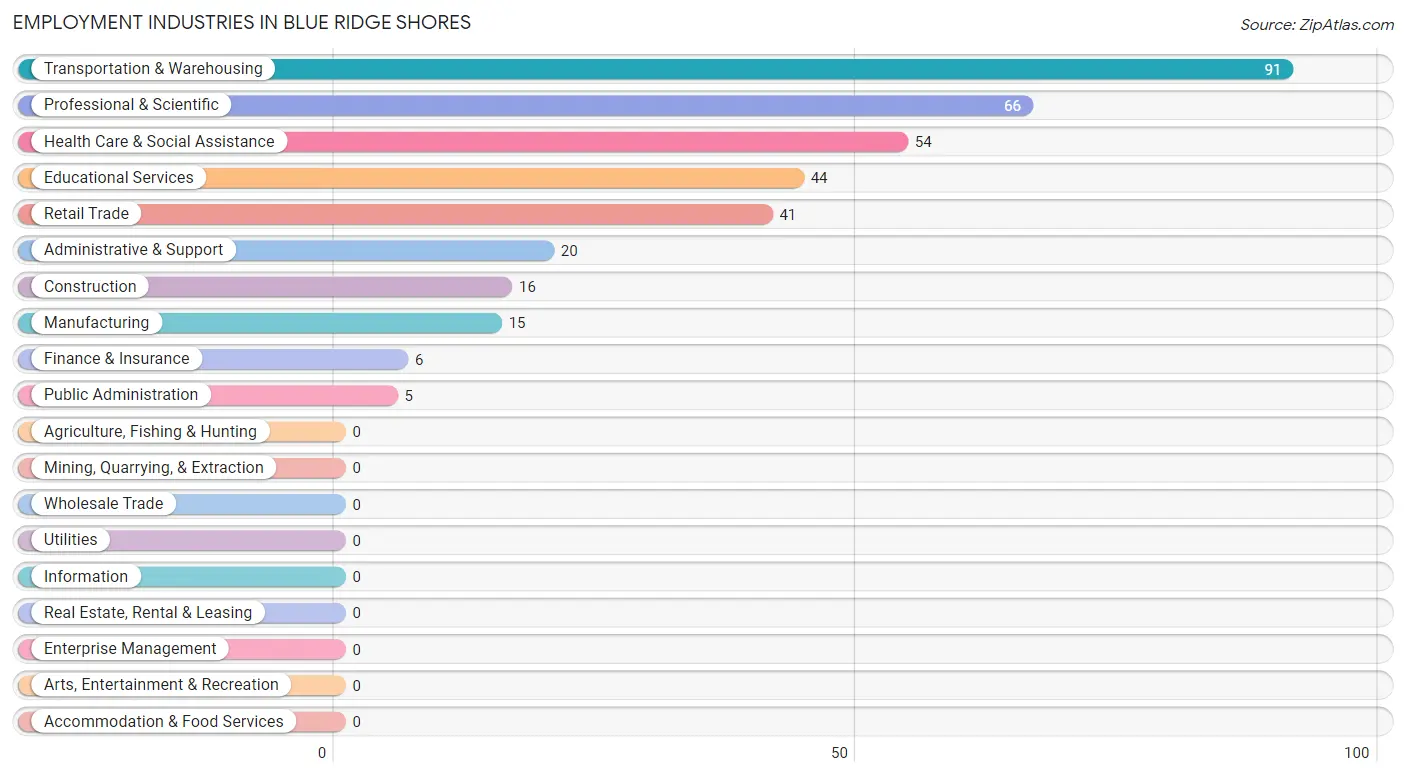
The major employment industries in Blue Ridge Shores include Transportation & Warehousing (91 | 25.4%), Professional & Scientific (66 | 18.4%), Health Care & Social Assistance (54 | 15.1%), Educational Services (44 | 12.3%), and Retail Trade (41 | 11.5%).
Employment Industries by Sex in Blue Ridge Shores
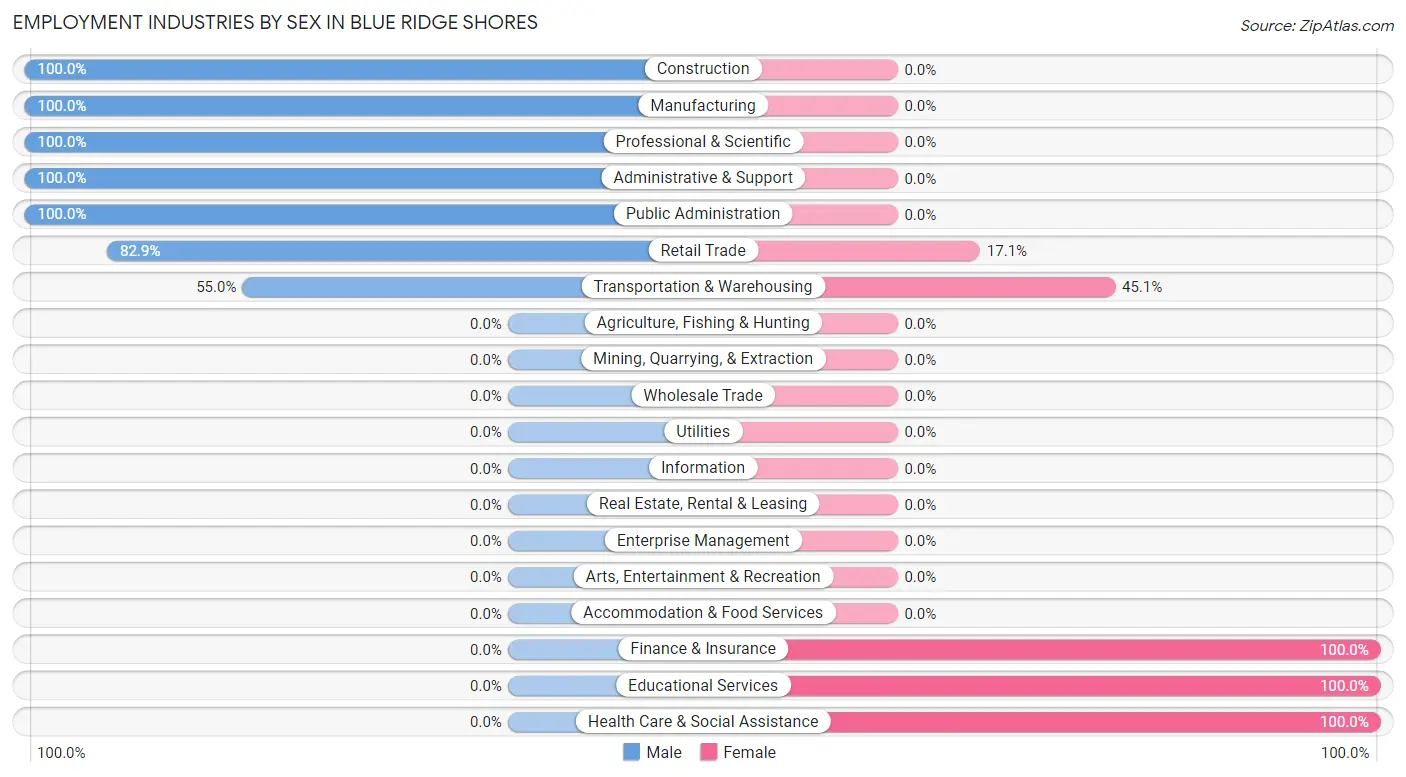
The Blue Ridge Shores industries that see more men than women are Construction (100.0%), Manufacturing (100.0%), and Professional & Scientific (100.0%), whereas the industries that tend to have a higher number of women are Finance & Insurance (100.0%), Educational Services (100.0%), and Health Care & Social Assistance (100.0%).
| Industry | Male | Female |
| Agriculture, Fishing & Hunting | 0 (0.0%) | 0 (0.0%) |
| Mining, Quarrying, & Extraction | 0 (0.0%) | 0 (0.0%) |
| Construction | 16 (100.0%) | 0 (0.0%) |
| Manufacturing | 15 (100.0%) | 0 (0.0%) |
| Wholesale Trade | 0 (0.0%) | 0 (0.0%) |
| Retail Trade | 34 (82.9%) | 7 (17.1%) |
| Transportation & Warehousing | 50 (54.9%) | 41 (45.1%) |
| Utilities | 0 (0.0%) | 0 (0.0%) |
| Information | 0 (0.0%) | 0 (0.0%) |
| Finance & Insurance | 0 (0.0%) | 6 (100.0%) |
| Real Estate, Rental & Leasing | 0 (0.0%) | 0 (0.0%) |
| Professional & Scientific | 66 (100.0%) | 0 (0.0%) |
| Enterprise Management | 0 (0.0%) | 0 (0.0%) |
| Administrative & Support | 20 (100.0%) | 0 (0.0%) |
| Educational Services | 0 (0.0%) | 44 (100.0%) |
| Health Care & Social Assistance | 0 (0.0%) | 54 (100.0%) |
| Arts, Entertainment & Recreation | 0 (0.0%) | 0 (0.0%) |
| Accommodation & Food Services | 0 (0.0%) | 0 (0.0%) |
| Public Administration | 5 (100.0%) | 0 (0.0%) |
| Total | 206 (57.5%) | 152 (42.5%) |
Education in Blue Ridge Shores
School Enrollment in Blue Ridge Shores
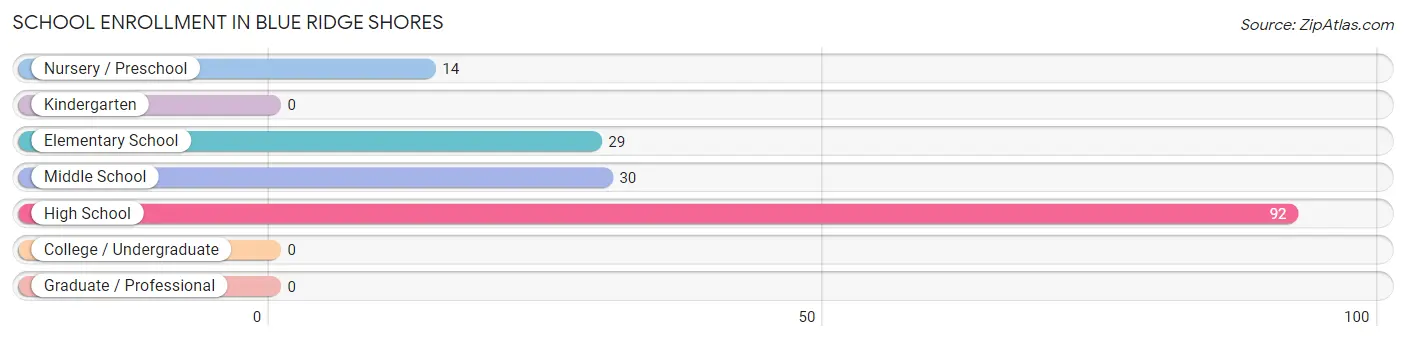
The most common levels of schooling among the 165 students in Blue Ridge Shores are high school (92 | 55.8%), middle school (30 | 18.2%), and elementary school (29 | 17.6%).
| School Level | # Students | % Students |
| Nursery / Preschool | 14 | 8.5% |
| Kindergarten | 0 | 0.0% |
| Elementary School | 29 | 17.6% |
| Middle School | 30 | 18.2% |
| High School | 92 | 55.8% |
| College / Undergraduate | 0 | 0.0% |
| Graduate / Professional | 0 | 0.0% |
| Total | 165 | 100.0% |
School Enrollment by Age by Funding Source in Blue Ridge Shores
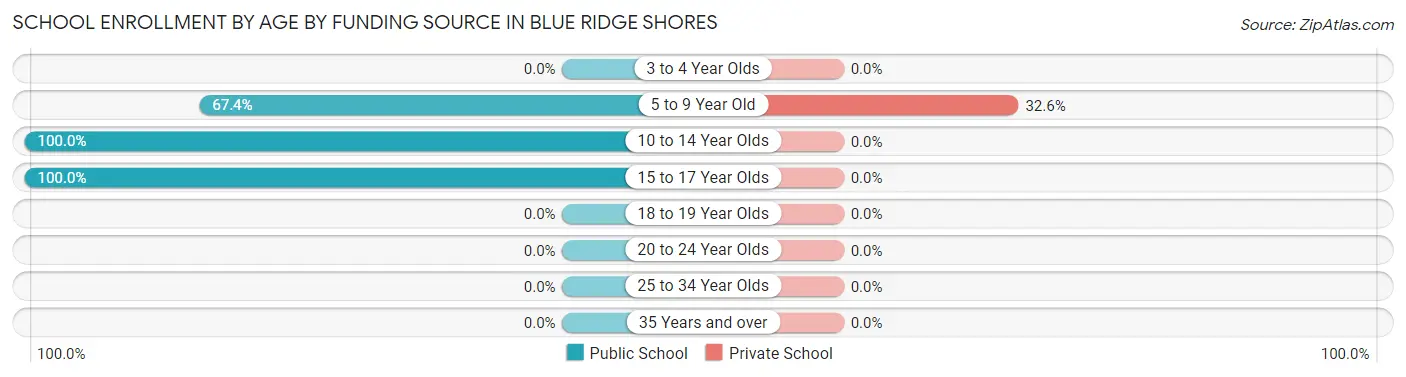
Out of a total of 165 students who are enrolled in schools in Blue Ridge Shores, 14 (8.5%) attend a private institution, while the remaining 151 (91.5%) are enrolled in public schools. The age group of 5 to 9 year old has the highest likelihood of being enrolled in private schools, with 14 (32.6% in the age bracket) enrolled. Conversely, the age group of 10 to 14 year olds has the lowest likelihood of being enrolled in a private school, with 30 (100.0% in the age bracket) attending a public institution.
| Age Bracket | Public School | Private School |
| 3 to 4 Year Olds | 0 (0.0%) | 0 (0.0%) |
| 5 to 9 Year Old | 29 (67.4%) | 14 (32.6%) |
| 10 to 14 Year Olds | 30 (100.0%) | 0 (0.0%) |
| 15 to 17 Year Olds | 92 (100.0%) | 0 (0.0%) |
| 18 to 19 Year Olds | 0 (0.0%) | 0 (0.0%) |
| 20 to 24 Year Olds | 0 (0.0%) | 0 (0.0%) |
| 25 to 34 Year Olds | 0 (0.0%) | 0 (0.0%) |
| 35 Years and over | 0 (0.0%) | 0 (0.0%) |
| Total | 151 (91.5%) | 14 (8.5%) |
Educational Attainment by Field of Study in Blue Ridge Shores
Business (35 | 47.3%), psychology (24 | 32.4%), and engineering (15 | 20.3%) are the most common fields of study among 74 individuals in Blue Ridge Shores who have obtained a bachelor's degree or higher.
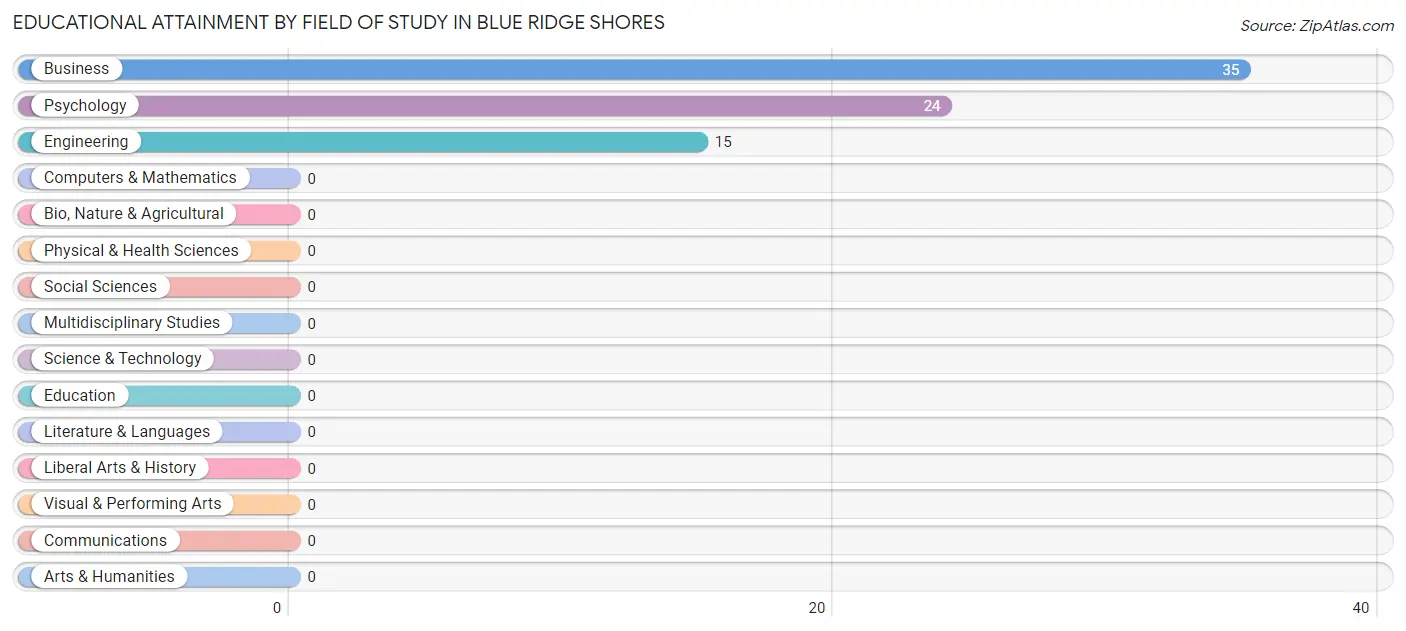
| Field of Study | # Graduates | % Graduates |
| Computers & Mathematics | 0 | 0.0% |
| Bio, Nature & Agricultural | 0 | 0.0% |
| Physical & Health Sciences | 0 | 0.0% |
| Psychology | 24 | 32.4% |
| Social Sciences | 0 | 0.0% |
| Engineering | 15 | 20.3% |
| Multidisciplinary Studies | 0 | 0.0% |
| Science & Technology | 0 | 0.0% |
| Business | 35 | 47.3% |
| Education | 0 | 0.0% |
| Literature & Languages | 0 | 0.0% |
| Liberal Arts & History | 0 | 0.0% |
| Visual & Performing Arts | 0 | 0.0% |
| Communications | 0 | 0.0% |
| Arts & Humanities | 0 | 0.0% |
| Total | 74 | 100.0% |
Transportation & Commute in Blue Ridge Shores
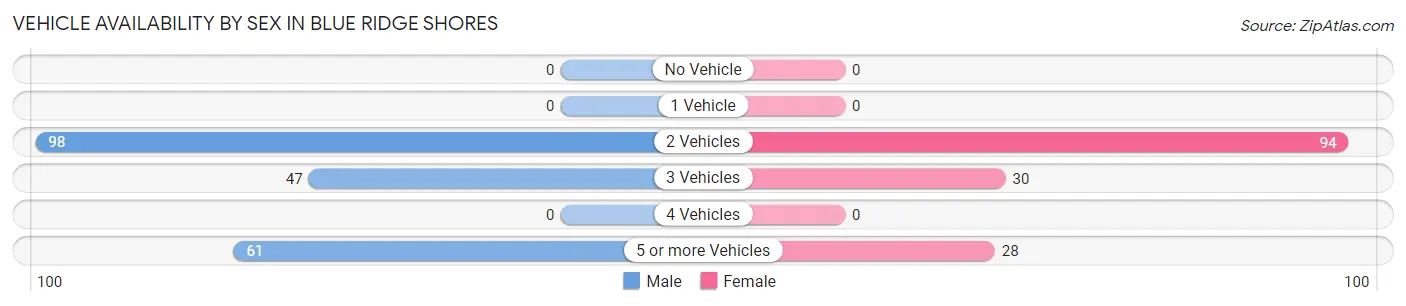
Vehicle Availability by Sex in Blue Ridge Shores
The most prevalent vehicle ownership categories in Blue Ridge Shores are males with 2 vehicles (98, accounting for 47.6%) and females with 2 vehicles (94, making up 64.5%).
| Vehicles Available | Male | Female |
| No Vehicle | 0 (0.0%) | 0 (0.0%) |
| 1 Vehicle | 0 (0.0%) | 0 (0.0%) |
| 2 Vehicles | 98 (47.6%) | 94 (61.8%) |
| 3 Vehicles | 47 (22.8%) | 30 (19.7%) |
| 4 Vehicles | 0 (0.0%) | 0 (0.0%) |
| 5 or more Vehicles | 61 (29.6%) | 28 (18.4%) |
| Total | 206 (100.0%) | 152 (100.0%) |
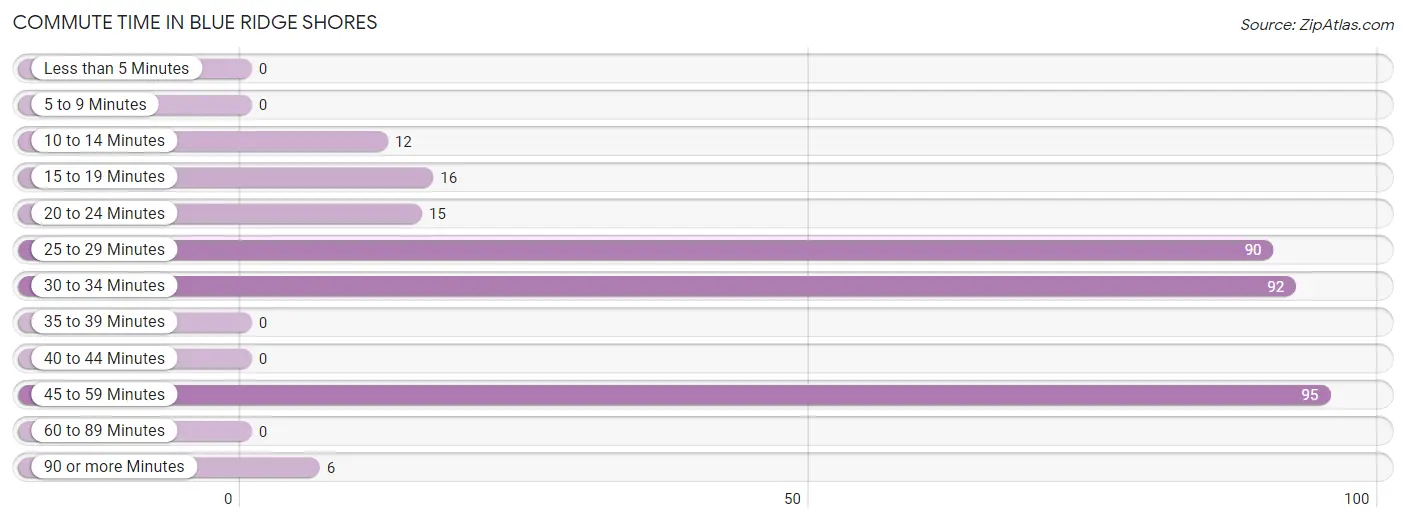
Commute Time in Blue Ridge Shores
The most frequently occuring commute durations in Blue Ridge Shores are 45 to 59 minutes (95 commuters, 29.1%), 30 to 34 minutes (92 commuters, 28.2%), and 25 to 29 minutes (90 commuters, 27.6%).
| Commute Time | # Commuters | % Commuters |
| Less than 5 Minutes | 0 | 0.0% |
| 5 to 9 Minutes | 0 | 0.0% |
| 10 to 14 Minutes | 12 | 3.7% |
| 15 to 19 Minutes | 16 | 4.9% |
| 20 to 24 Minutes | 15 | 4.6% |
| 25 to 29 Minutes | 90 | 27.6% |
| 30 to 34 Minutes | 92 | 28.2% |
| 35 to 39 Minutes | 0 | 0.0% |
| 40 to 44 Minutes | 0 | 0.0% |
| 45 to 59 Minutes | 95 | 29.1% |
| 60 to 89 Minutes | 0 | 0.0% |
| 90 or more Minutes | 6 | 1.8% |
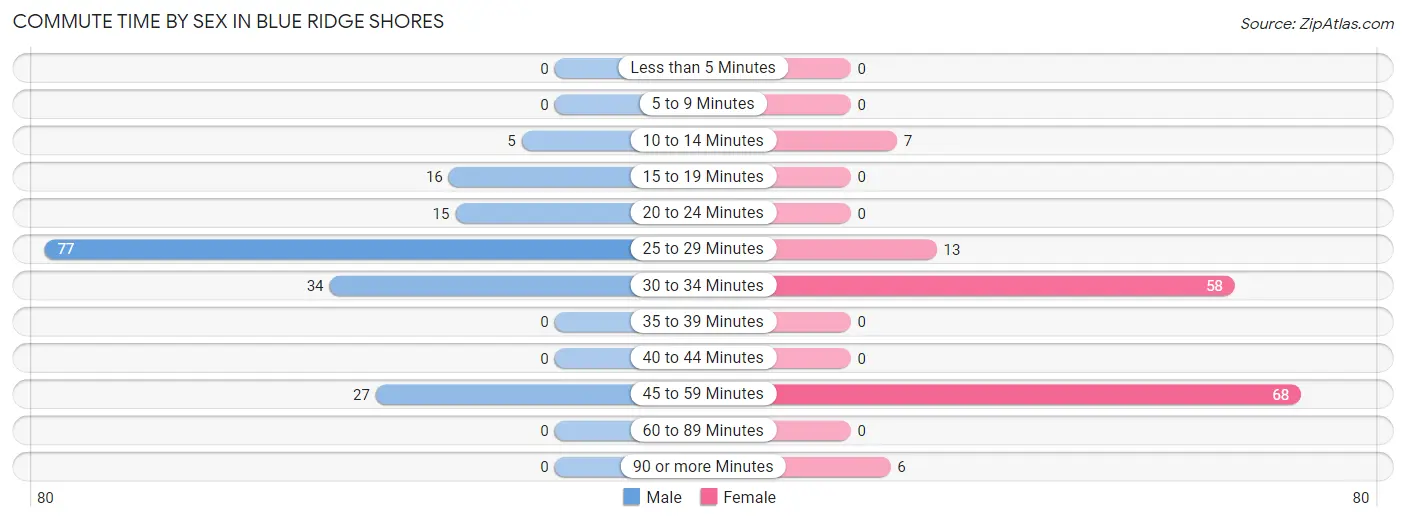
Commute Time by Sex in Blue Ridge Shores
The most common commute times in Blue Ridge Shores are 25 to 29 minutes (77 commuters, 44.3%) for males and 45 to 59 minutes (68 commuters, 44.7%) for females.
| Commute Time | Male | Female |
| Less than 5 Minutes | 0 (0.0%) | 0 (0.0%) |
| 5 to 9 Minutes | 0 (0.0%) | 0 (0.0%) |
| 10 to 14 Minutes | 5 (2.9%) | 7 (4.6%) |
| 15 to 19 Minutes | 16 (9.2%) | 0 (0.0%) |
| 20 to 24 Minutes | 15 (8.6%) | 0 (0.0%) |
| 25 to 29 Minutes | 77 (44.3%) | 13 (8.6%) |
| 30 to 34 Minutes | 34 (19.5%) | 58 (38.2%) |
| 35 to 39 Minutes | 0 (0.0%) | 0 (0.0%) |
| 40 to 44 Minutes | 0 (0.0%) | 0 (0.0%) |
| 45 to 59 Minutes | 27 (15.5%) | 68 (44.7%) |
| 60 to 89 Minutes | 0 (0.0%) | 0 (0.0%) |
| 90 or more Minutes | 0 (0.0%) | 6 (4.0%) |
Time of Departure to Work by Sex in Blue Ridge Shores
The most frequent times of departure to work in Blue Ridge Shores are 4:00 PM to 11:59 PM (84, 48.3%) for males and 5:30 AM to 5:59 AM (54, 35.5%) for females.
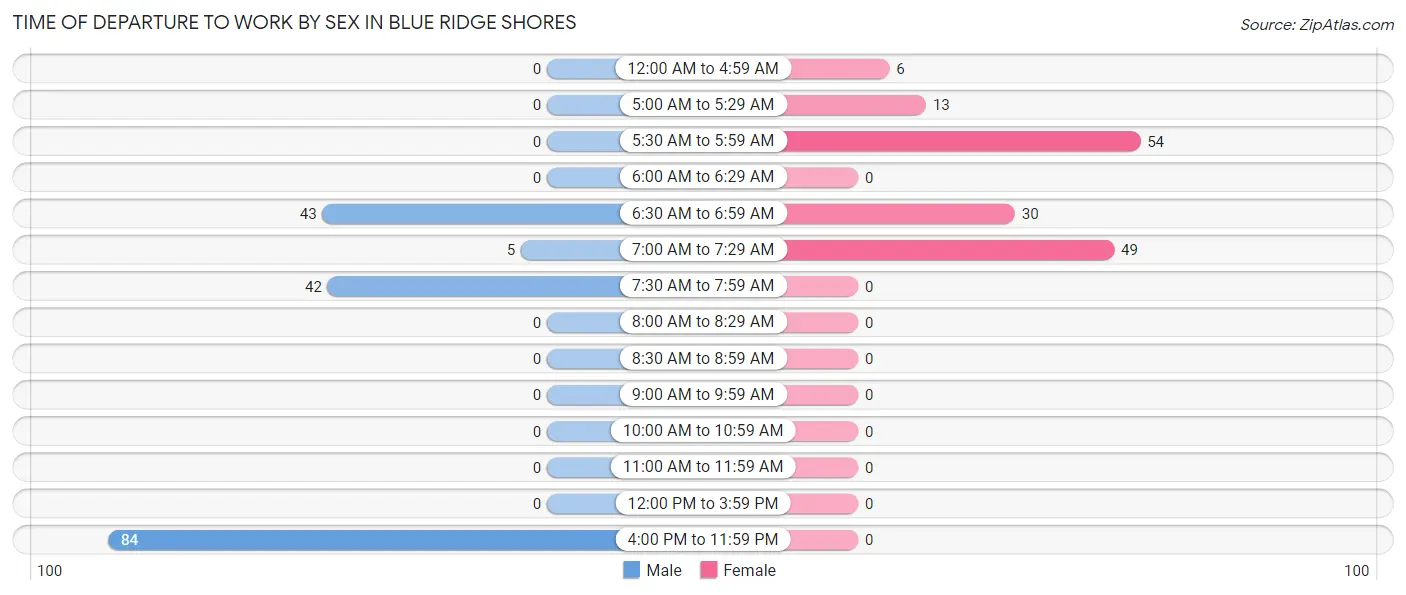
| Time of Departure | Male | Female |
| 12:00 AM to 4:59 AM | 0 (0.0%) | 6 (4.0%) |
| 5:00 AM to 5:29 AM | 0 (0.0%) | 13 (8.6%) |
| 5:30 AM to 5:59 AM | 0 (0.0%) | 54 (35.5%) |
| 6:00 AM to 6:29 AM | 0 (0.0%) | 0 (0.0%) |
| 6:30 AM to 6:59 AM | 43 (24.7%) | 30 (19.7%) |
| 7:00 AM to 7:29 AM | 5 (2.9%) | 49 (32.2%) |
| 7:30 AM to 7:59 AM | 42 (24.1%) | 0 (0.0%) |
| 8:00 AM to 8:29 AM | 0 (0.0%) | 0 (0.0%) |
| 8:30 AM to 8:59 AM | 0 (0.0%) | 0 (0.0%) |
| 9:00 AM to 9:59 AM | 0 (0.0%) | 0 (0.0%) |
| 10:00 AM to 10:59 AM | 0 (0.0%) | 0 (0.0%) |
| 11:00 AM to 11:59 AM | 0 (0.0%) | 0 (0.0%) |
| 12:00 PM to 3:59 PM | 0 (0.0%) | 0 (0.0%) |
| 4:00 PM to 11:59 PM | 84 (48.3%) | 0 (0.0%) |
| Total | 174 (100.0%) | 152 (100.0%) |
Housing Occupancy in Blue Ridge Shores
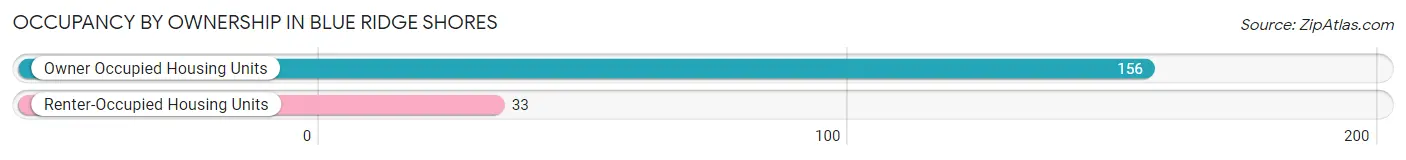
Occupancy by Ownership in Blue Ridge Shores
Of the total 189 dwellings in Blue Ridge Shores, owner-occupied units account for 156 (82.5%), while renter-occupied units make up 33 (17.5%).
| Occupancy | # Housing Units | % Housing Units |
| Owner Occupied Housing Units | 156 | 82.5% |
| Renter-Occupied Housing Units | 33 | 17.5% |
| Total Occupied Housing Units | 189 | 100.0% |
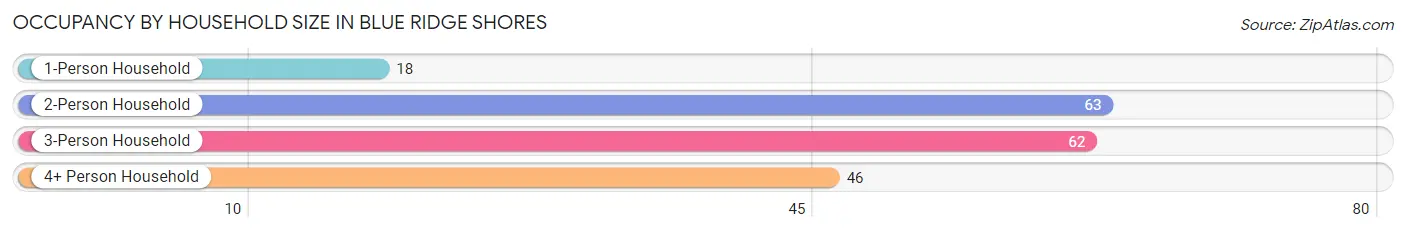
Occupancy by Household Size in Blue Ridge Shores
| Household Size | # Housing Units | % Housing Units |
| 1-Person Household | 18 | 9.5% |
| 2-Person Household | 63 | 33.3% |
| 3-Person Household | 62 | 32.8% |
| 4+ Person Household | 46 | 24.3% |
| Total Housing Units | 189 | 100.0% |
Occupancy by Ownership by Household Size in Blue Ridge Shores
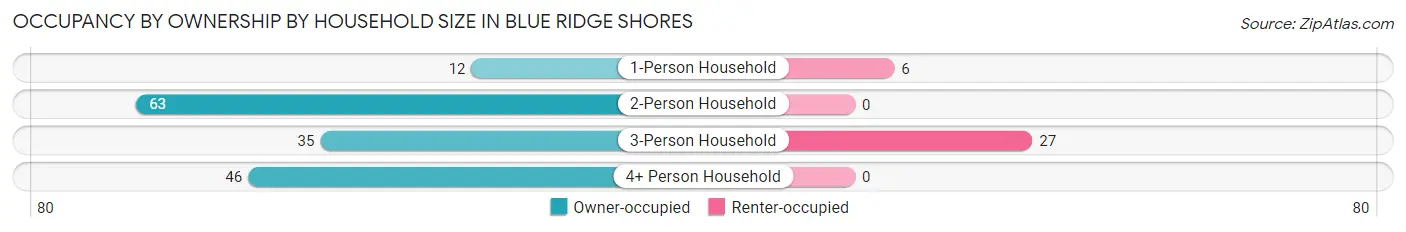
| Household Size | Owner-occupied | Renter-occupied |
| 1-Person Household | 12 (66.7%) | 6 (33.3%) |
| 2-Person Household | 63 (100.0%) | 0 (0.0%) |
| 3-Person Household | 35 (56.5%) | 27 (43.5%) |
| 4+ Person Household | 46 (100.0%) | 0 (0.0%) |
| Total Housing Units | 156 (82.5%) | 33 (17.5%) |
Occupancy by Educational Attainment in Blue Ridge Shores
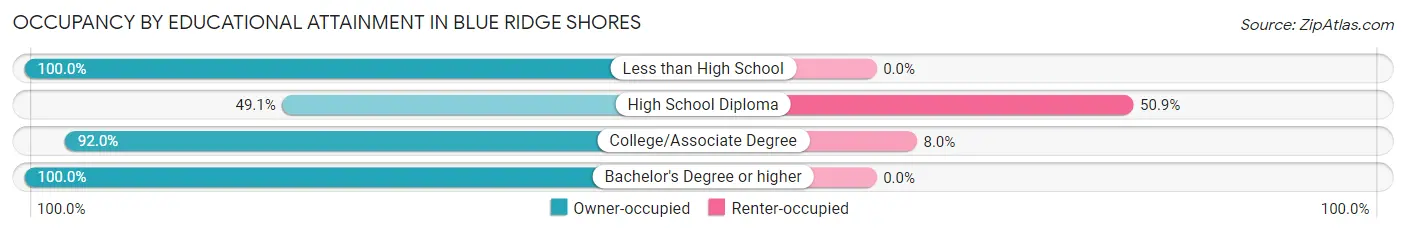
| Household Size | Owner-occupied | Renter-occupied |
| Less than High School | 16 (100.0%) | 0 (0.0%) |
| High School Diploma | 26 (49.1%) | 27 (50.9%) |
| College/Associate Degree | 69 (92.0%) | 6 (8.0%) |
| Bachelor's Degree or higher | 45 (100.0%) | 0 (0.0%) |
Occupancy by Age of Householder in Blue Ridge Shores
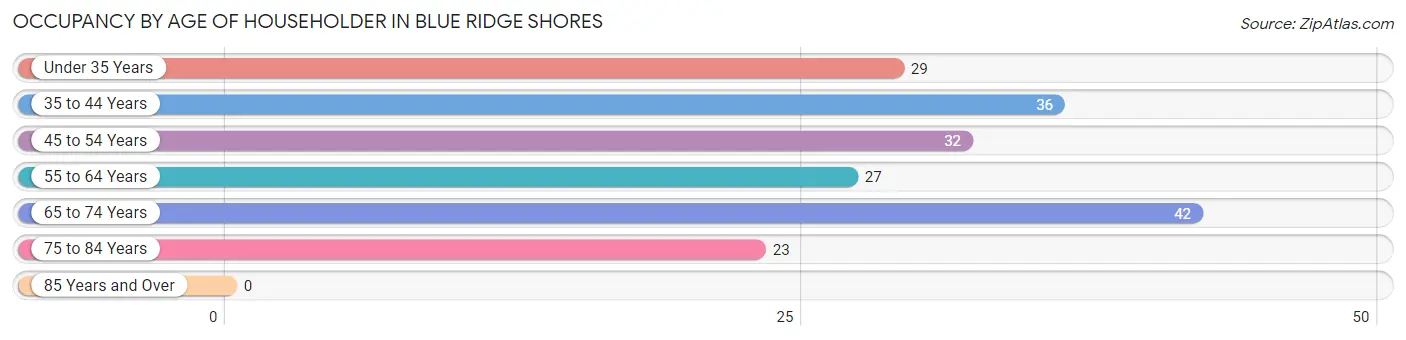
| Age Bracket | # Households | % Households |
| Under 35 Years | 29 | 15.3% |
| 35 to 44 Years | 36 | 19.1% |
| 45 to 54 Years | 32 | 16.9% |
| 55 to 64 Years | 27 | 14.3% |
| 65 to 74 Years | 42 | 22.2% |
| 75 to 84 Years | 23 | 12.2% |
| 85 Years and Over | 0 | 0.0% |
| Total | 189 | 100.0% |
Housing Finances in Blue Ridge Shores
Median Income by Occupancy in Blue Ridge Shores
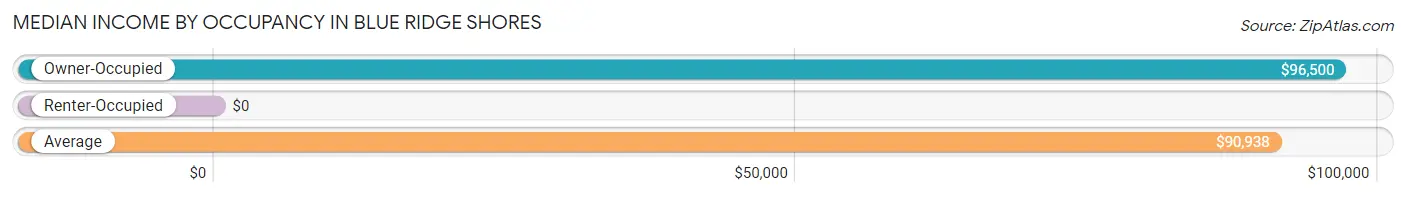
| Occupancy Type | # Households | Median Income |
| Owner-Occupied | 156 (82.5%) | $96,500 |
| Renter-Occupied | 33 (17.5%) | $0 |
| Average | 189 (100.0%) | $90,938 |
Occupancy by Householder Income Bracket in Blue Ridge Shores
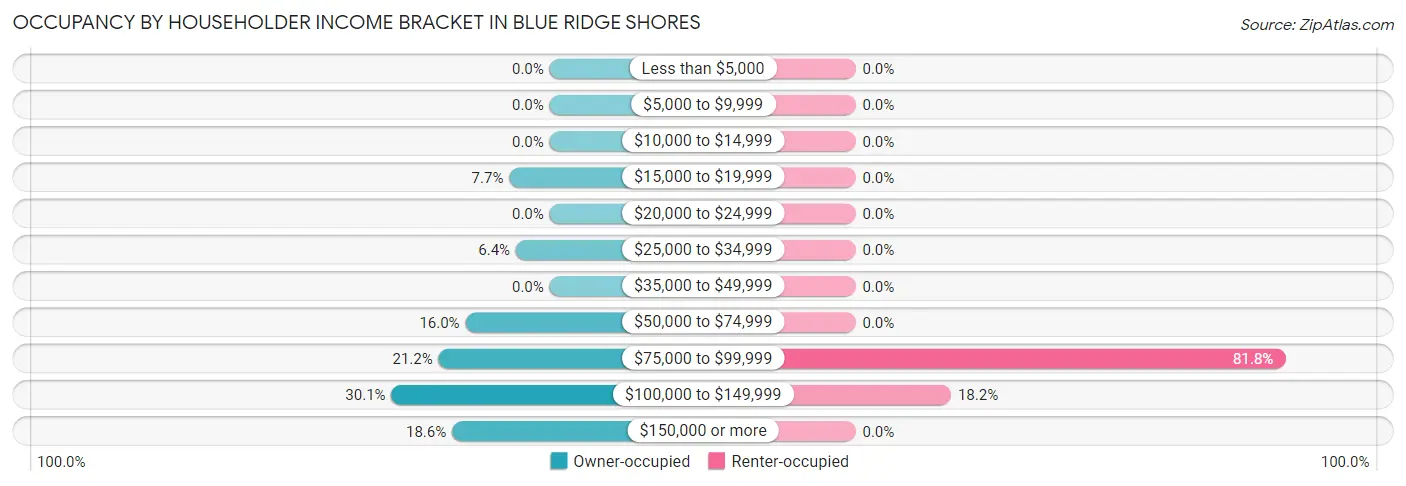
| Income Bracket | Owner-occupied | Renter-occupied |
| Less than $5,000 | 0 (0.0%) | 0 (0.0%) |
| $5,000 to $9,999 | 0 (0.0%) | 0 (0.0%) |
| $10,000 to $14,999 | 0 (0.0%) | 0 (0.0%) |
| $15,000 to $19,999 | 12 (7.7%) | 0 (0.0%) |
| $20,000 to $24,999 | 0 (0.0%) | 0 (0.0%) |
| $25,000 to $34,999 | 10 (6.4%) | 0 (0.0%) |
| $35,000 to $49,999 | 0 (0.0%) | 0 (0.0%) |
| $50,000 to $74,999 | 25 (16.0%) | 0 (0.0%) |
| $75,000 to $99,999 | 33 (21.1%) | 27 (81.8%) |
| $100,000 to $149,999 | 47 (30.1%) | 6 (18.2%) |
| $150,000 or more | 29 (18.6%) | 0 (0.0%) |
| Total | 156 (100.0%) | 33 (100.0%) |
Monthly Housing Cost Tiers in Blue Ridge Shores
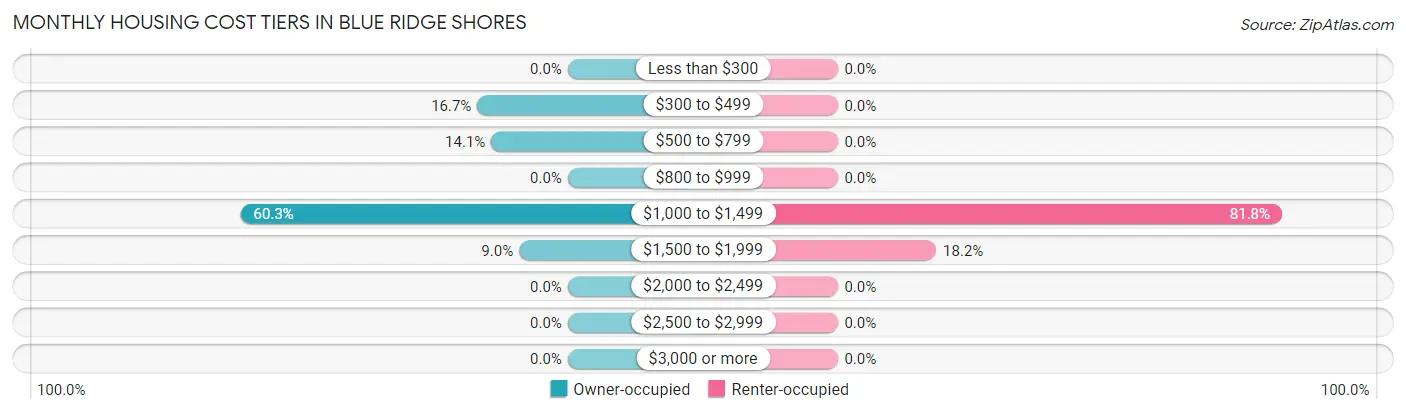
| Monthly Cost | Owner-occupied | Renter-occupied |
| Less than $300 | 0 (0.0%) | 0 (0.0%) |
| $300 to $499 | 26 (16.7%) | 0 (0.0%) |
| $500 to $799 | 22 (14.1%) | 0 (0.0%) |
| $800 to $999 | 0 (0.0%) | 0 (0.0%) |
| $1,000 to $1,499 | 94 (60.3%) | 27 (81.8%) |
| $1,500 to $1,999 | 14 (9.0%) | 6 (18.2%) |
| $2,000 to $2,499 | 0 (0.0%) | 0 (0.0%) |
| $2,500 to $2,999 | 0 (0.0%) | 0 (0.0%) |
| $3,000 or more | 0 (0.0%) | 0 (0.0%) |
| Total | 156 (100.0%) | 33 (100.0%) |
Physical Housing Characteristics in Blue Ridge Shores
Housing Structures in Blue Ridge Shores
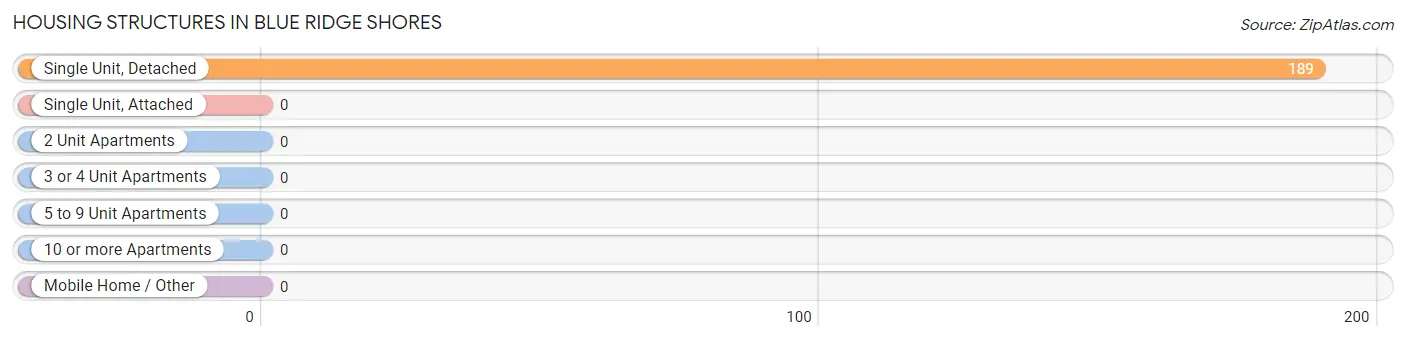
| Structure Type | # Housing Units | % Housing Units |
| Single Unit, Detached | 189 | 100.0% |
| Single Unit, Attached | 0 | 0.0% |
| 2 Unit Apartments | 0 | 0.0% |
| 3 or 4 Unit Apartments | 0 | 0.0% |
| 5 to 9 Unit Apartments | 0 | 0.0% |
| 10 or more Apartments | 0 | 0.0% |
| Mobile Home / Other | 0 | 0.0% |
| Total | 189 | 100.0% |
Housing Structures by Occupancy in Blue Ridge Shores
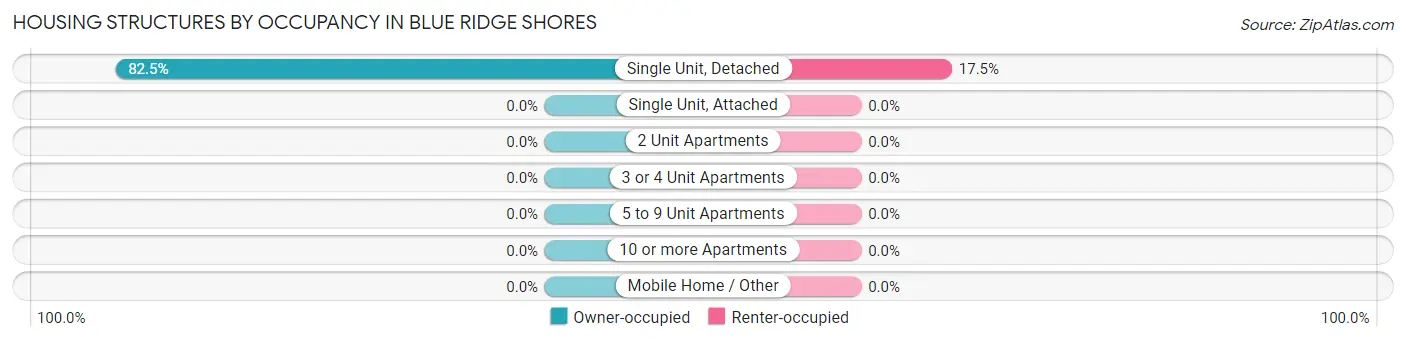
| Structure Type | Owner-occupied | Renter-occupied |
| Single Unit, Detached | 156 (82.5%) | 33 (17.5%) |
| Single Unit, Attached | 0 (0.0%) | 0 (0.0%) |
| 2 Unit Apartments | 0 (0.0%) | 0 (0.0%) |
| 3 or 4 Unit Apartments | 0 (0.0%) | 0 (0.0%) |
| 5 to 9 Unit Apartments | 0 (0.0%) | 0 (0.0%) |
| 10 or more Apartments | 0 (0.0%) | 0 (0.0%) |
| Mobile Home / Other | 0 (0.0%) | 0 (0.0%) |
| Total | 156 (82.5%) | 33 (17.5%) |
Housing Structures by Number of Rooms in Blue Ridge Shores
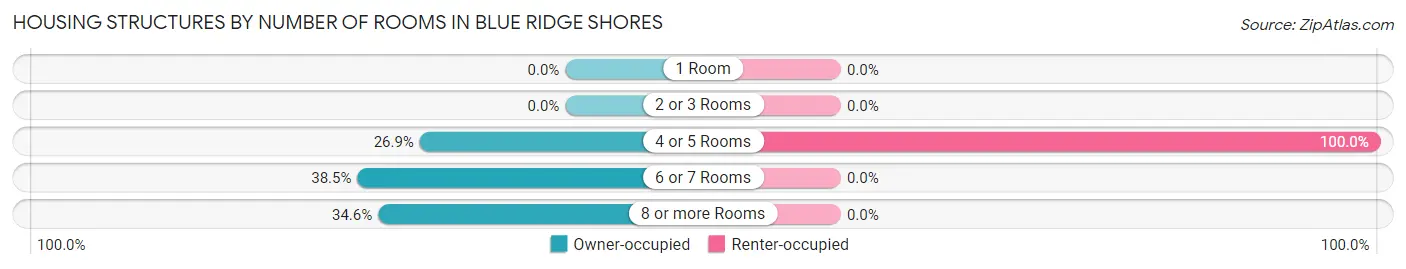
| Number of Rooms | Owner-occupied | Renter-occupied |
| 1 Room | 0 (0.0%) | 0 (0.0%) |
| 2 or 3 Rooms | 0 (0.0%) | 0 (0.0%) |
| 4 or 5 Rooms | 42 (26.9%) | 33 (100.0%) |
| 6 or 7 Rooms | 60 (38.5%) | 0 (0.0%) |
| 8 or more Rooms | 54 (34.6%) | 0 (0.0%) |
| Total | 156 (100.0%) | 33 (100.0%) |
Housing Structure by Heating Type in Blue Ridge Shores
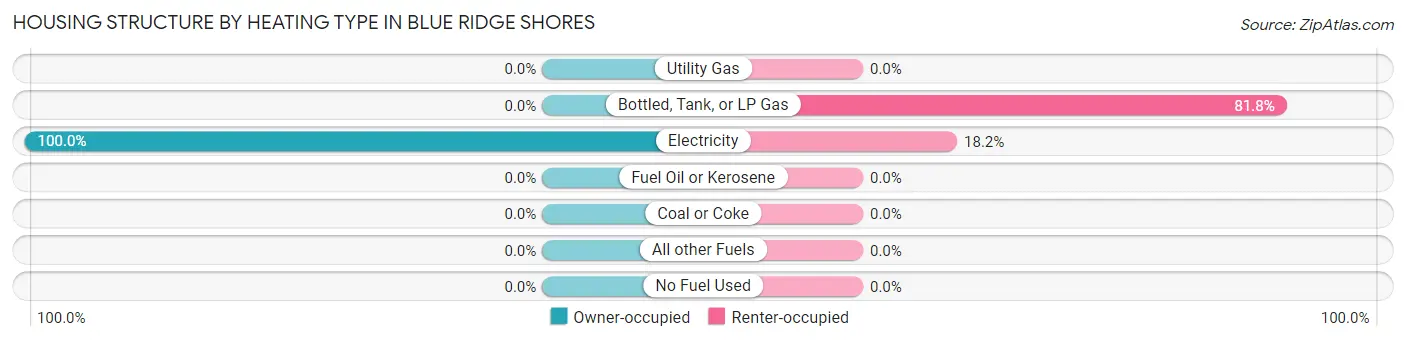
| Heating Type | Owner-occupied | Renter-occupied |
| Utility Gas | 0 (0.0%) | 0 (0.0%) |
| Bottled, Tank, or LP Gas | 0 (0.0%) | 27 (81.8%) |
| Electricity | 156 (100.0%) | 6 (18.2%) |
| Fuel Oil or Kerosene | 0 (0.0%) | 0 (0.0%) |
| Coal or Coke | 0 (0.0%) | 0 (0.0%) |
| All other Fuels | 0 (0.0%) | 0 (0.0%) |
| No Fuel Used | 0 (0.0%) | 0 (0.0%) |
| Total | 156 (100.0%) | 33 (100.0%) |
Household Vehicle Usage in Blue Ridge Shores
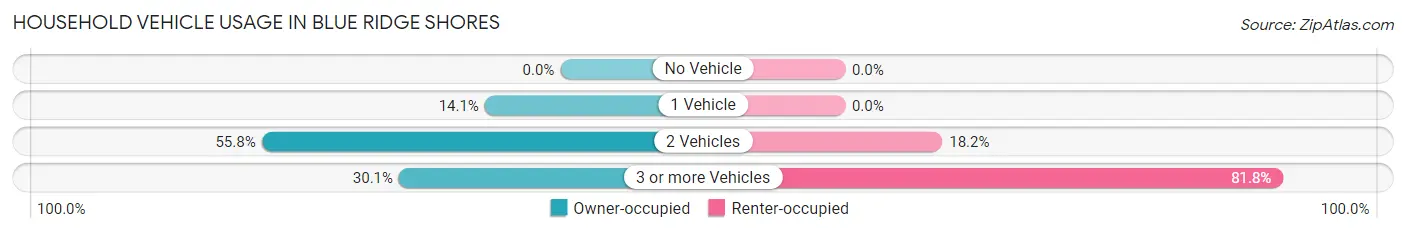
| Vehicles per Household | Owner-occupied | Renter-occupied |
| No Vehicle | 0 (0.0%) | 0 (0.0%) |
| 1 Vehicle | 22 (14.1%) | 0 (0.0%) |
| 2 Vehicles | 87 (55.8%) | 6 (18.2%) |
| 3 or more Vehicles | 47 (30.1%) | 27 (81.8%) |
| Total | 156 (100.0%) | 33 (100.0%) |
Real Estate & Mortgages in Blue Ridge Shores
Real Estate and Mortgage Overview in Blue Ridge Shores
| Characteristic | Without Mortgage | With Mortgage |
| Housing Units | 26 | 130 |
| Median Property Value | - | - |
| Median Household Income | - | - |
| Monthly Housing Costs | - | - |
| Real Estate Taxes | - | - |
Property Value by Mortgage Status in Blue Ridge Shores
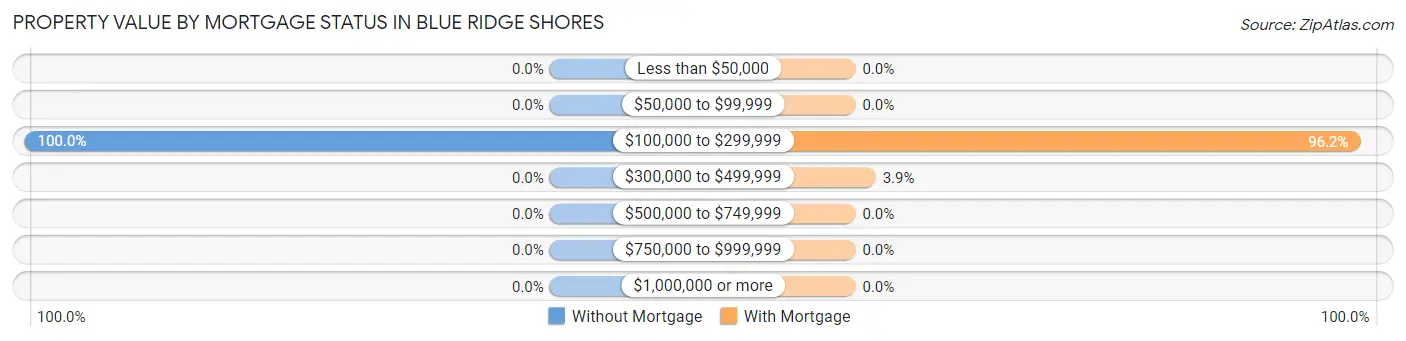
| Property Value | Without Mortgage | With Mortgage |
| Less than $50,000 | 0 (0.0%) | 0 (0.0%) |
| $50,000 to $99,999 | 0 (0.0%) | 0 (0.0%) |
| $100,000 to $299,999 | 26 (100.0%) | 125 (96.2%) |
| $300,000 to $499,999 | 0 (0.0%) | 5 (3.8%) |
| $500,000 to $749,999 | 0 (0.0%) | 0 (0.0%) |
| $750,000 to $999,999 | 0 (0.0%) | 0 (0.0%) |
| $1,000,000 or more | 0 (0.0%) | 0 (0.0%) |
| Total | 26 (100.0%) | 130 (100.0%) |
Household Income by Mortgage Status in Blue Ridge Shores
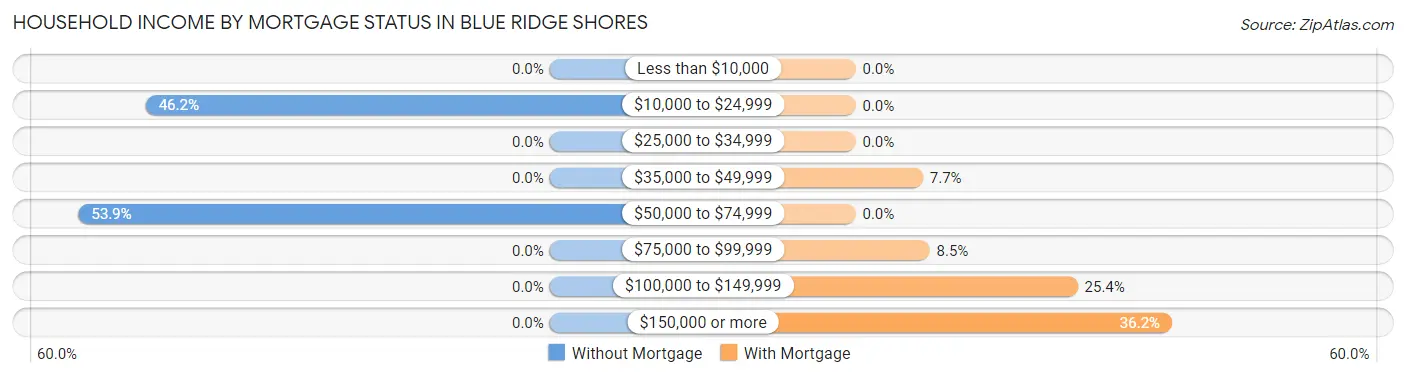
| Household Income | Without Mortgage | With Mortgage |
| Less than $10,000 | 0 (0.0%) | 0 (0.0%) |
| $10,000 to $24,999 | 12 (46.2%) | 0 (0.0%) |
| $25,000 to $34,999 | 0 (0.0%) | 0 (0.0%) |
| $35,000 to $49,999 | 0 (0.0%) | 10 (7.7%) |
| $50,000 to $74,999 | 14 (53.8%) | 0 (0.0%) |
| $75,000 to $99,999 | 0 (0.0%) | 11 (8.5%) |
| $100,000 to $149,999 | 0 (0.0%) | 33 (25.4%) |
| $150,000 or more | 0 (0.0%) | 47 (36.1%) |
| Total | 26 (100.0%) | 130 (100.0%) |
Property Value to Household Income Ratio in Blue Ridge Shores
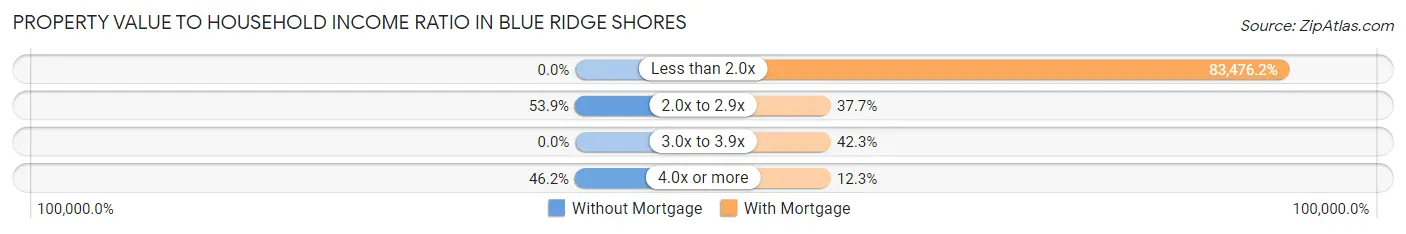
| Value-to-Income Ratio | Without Mortgage | With Mortgage |
| Less than 2.0x | 0 (0.0%) | 108,519 (83,476.1%) |
| 2.0x to 2.9x | 14 (53.8%) | 49 (37.7%) |
| 3.0x to 3.9x | 0 (0.0%) | 55 (42.3%) |
| 4.0x or more | 12 (46.2%) | 16 (12.3%) |
| Total | 26 (100.0%) | 130 (100.0%) |
Real Estate Taxes by Mortgage Status in Blue Ridge Shores
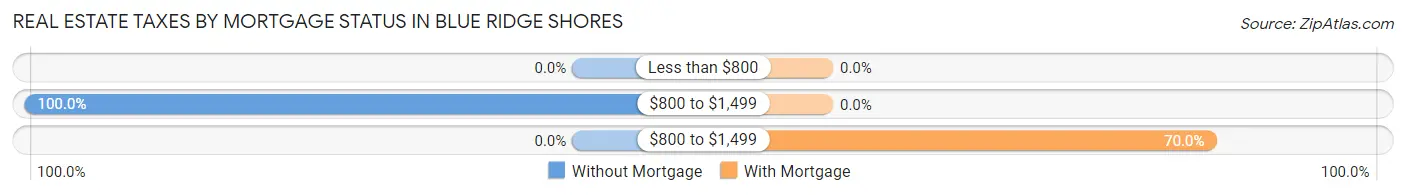
| Property Taxes | Without Mortgage | With Mortgage |
| Less than $800 | 0 (0.0%) | 0 (0.0%) |
| $800 to $1,499 | 26 (100.0%) | 0 (0.0%) |
| $800 to $1,499 | 0 (0.0%) | 91 (70.0%) |
| Total | 26 (100.0%) | 130 (100.0%) |
Health & Disability in Blue Ridge Shores
Health Insurance Coverage by Age in Blue Ridge Shores
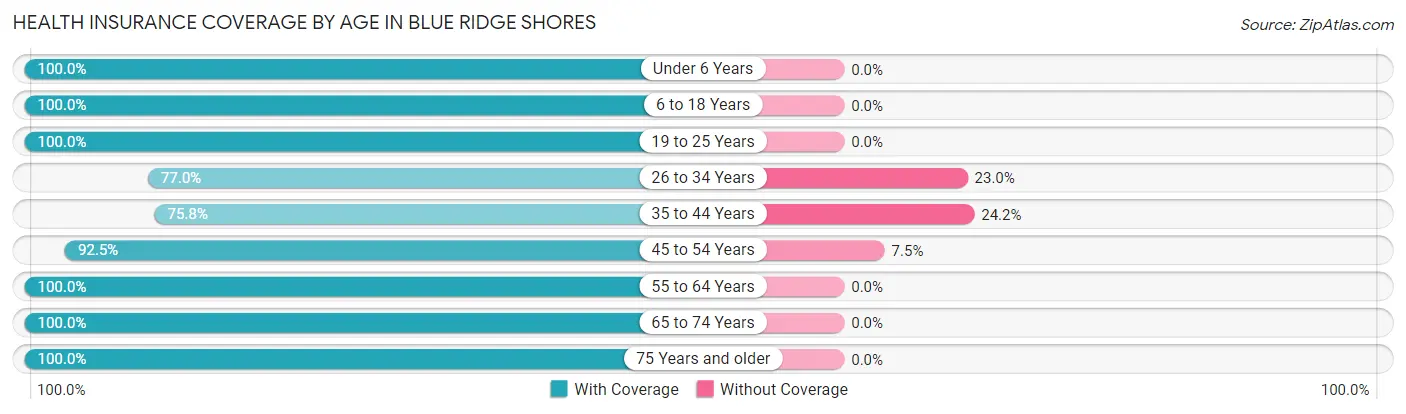
| Age Bracket | With Coverage | Without Coverage |
| Under 6 Years | 47 (100.0%) | 0 (0.0%) |
| 6 to 18 Years | 151 (100.0%) | 0 (0.0%) |
| 19 to 25 Years | 36 (100.0%) | 0 (0.0%) |
| 26 to 34 Years | 77 (77.0%) | 23 (23.0%) |
| 35 to 44 Years | 50 (75.8%) | 16 (24.2%) |
| 45 to 54 Years | 86 (92.5%) | 7 (7.5%) |
| 55 to 64 Years | 82 (100.0%) | 0 (0.0%) |
| 65 to 74 Years | 68 (100.0%) | 0 (0.0%) |
| 75 Years and older | 23 (100.0%) | 0 (0.0%) |
| Total | 620 (93.1%) | 46 (6.9%) |
Health Insurance Coverage by Citizenship Status in Blue Ridge Shores
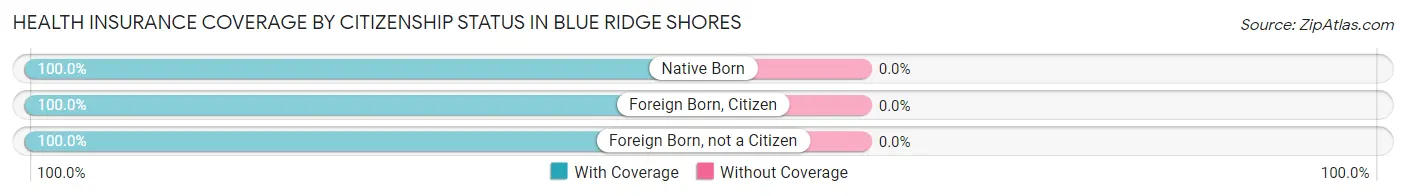
| Citizenship Status | With Coverage | Without Coverage |
| Native Born | 47 (100.0%) | 0 (0.0%) |
| Foreign Born, Citizen | 151 (100.0%) | 0 (0.0%) |
| Foreign Born, not a Citizen | 36 (100.0%) | 0 (0.0%) |
Health Insurance Coverage by Household Income in Blue Ridge Shores
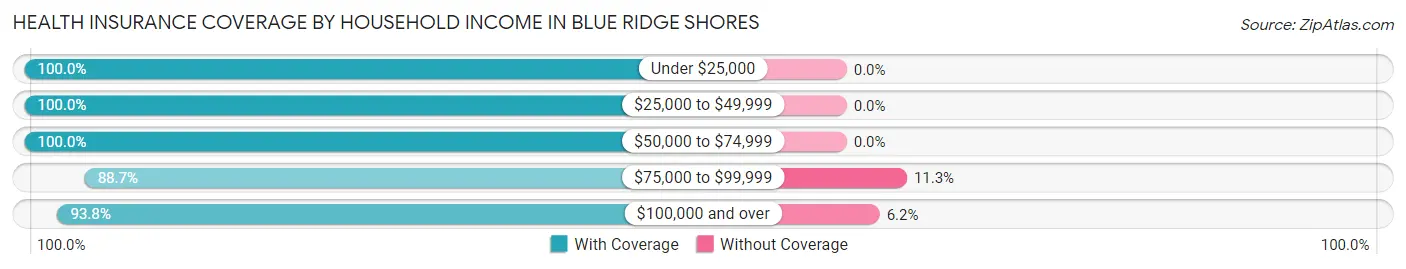
| Household Income | With Coverage | Without Coverage |
| Under $25,000 | 12 (100.0%) | 0 (0.0%) |
| $25,000 to $49,999 | 24 (100.0%) | 0 (0.0%) |
| $50,000 to $74,999 | 53 (100.0%) | 0 (0.0%) |
| $75,000 to $99,999 | 181 (88.7%) | 23 (11.3%) |
| $100,000 and over | 350 (93.8%) | 23 (6.2%) |
Public vs Private Health Insurance Coverage by Age in Blue Ridge Shores
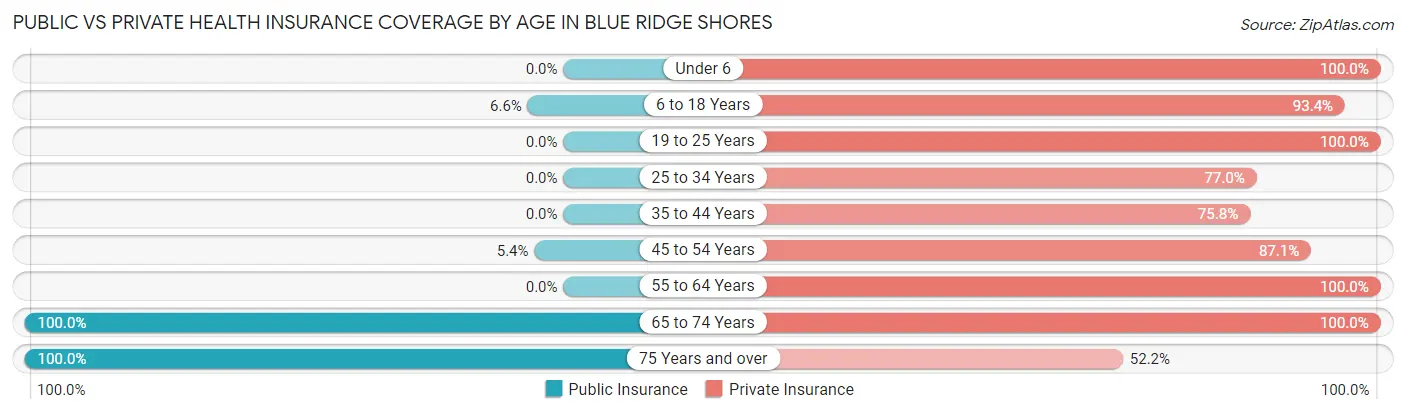
| Age Bracket | Public Insurance | Private Insurance |
| Under 6 | 0 (0.0%) | 47 (100.0%) |
| 6 to 18 Years | 10 (6.6%) | 141 (93.4%) |
| 19 to 25 Years | 0 (0.0%) | 36 (100.0%) |
| 25 to 34 Years | 0 (0.0%) | 77 (77.0%) |
| 35 to 44 Years | 0 (0.0%) | 50 (75.8%) |
| 45 to 54 Years | 5 (5.4%) | 81 (87.1%) |
| 55 to 64 Years | 0 (0.0%) | 82 (100.0%) |
| 65 to 74 Years | 68 (100.0%) | 68 (100.0%) |
| 75 Years and over | 23 (100.0%) | 12 (52.2%) |
| Total | 106 (15.9%) | 594 (89.2%) |
Disability Status by Sex by Age in Blue Ridge Shores
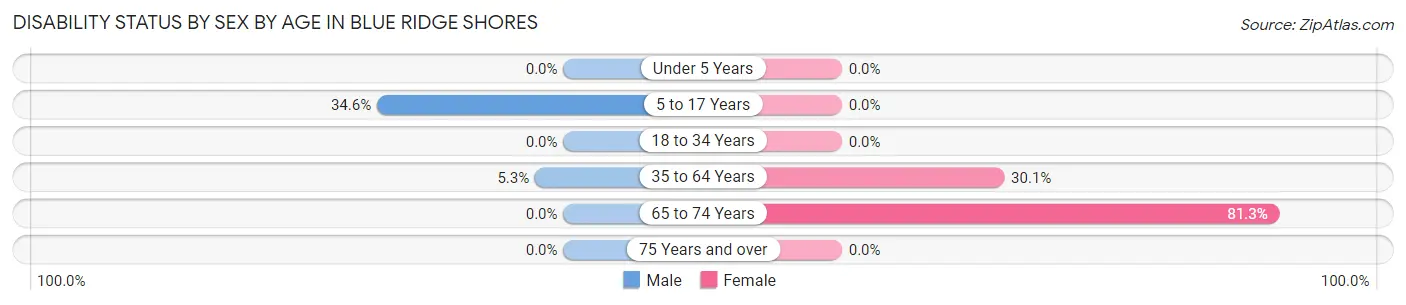
| Age Bracket | Male | Female |
| Under 5 Years | 0 (0.0%) | 0 (0.0%) |
| 5 to 17 Years | 46 (34.6%) | 0 (0.0%) |
| 18 to 34 Years | 0 (0.0%) | 0 (0.0%) |
| 35 to 64 Years | 5 (5.3%) | 44 (30.1%) |
| 65 to 74 Years | 0 (0.0%) | 26 (81.2%) |
| 75 Years and over | 0 (0.0%) | 0 (0.0%) |
Disability Class by Sex by Age in Blue Ridge Shores
Disability Class: Hearing Difficulty
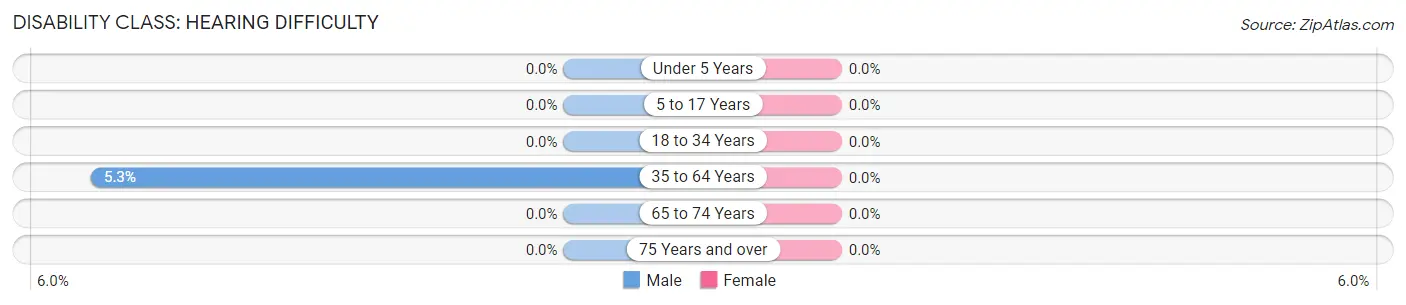
| Age Bracket | Male | Female |
| Under 5 Years | 0 (0.0%) | 0 (0.0%) |
| 5 to 17 Years | 0 (0.0%) | 0 (0.0%) |
| 18 to 34 Years | 0 (0.0%) | 0 (0.0%) |
| 35 to 64 Years | 5 (5.3%) | 0 (0.0%) |
| 65 to 74 Years | 0 (0.0%) | 0 (0.0%) |
| 75 Years and over | 0 (0.0%) | 0 (0.0%) |
Disability Class: Vision Difficulty
| Age Bracket | Male | Female |
| Under 5 Years | 0 (0.0%) | 0 (0.0%) |
| 5 to 17 Years | 0 (0.0%) | 0 (0.0%) |
| 18 to 34 Years | 0 (0.0%) | 0 (0.0%) |
| 35 to 64 Years | 0 (0.0%) | 0 (0.0%) |
| 65 to 74 Years | 0 (0.0%) | 0 (0.0%) |
| 75 Years and over | 0 (0.0%) | 0 (0.0%) |
Disability Class: Cognitive Difficulty
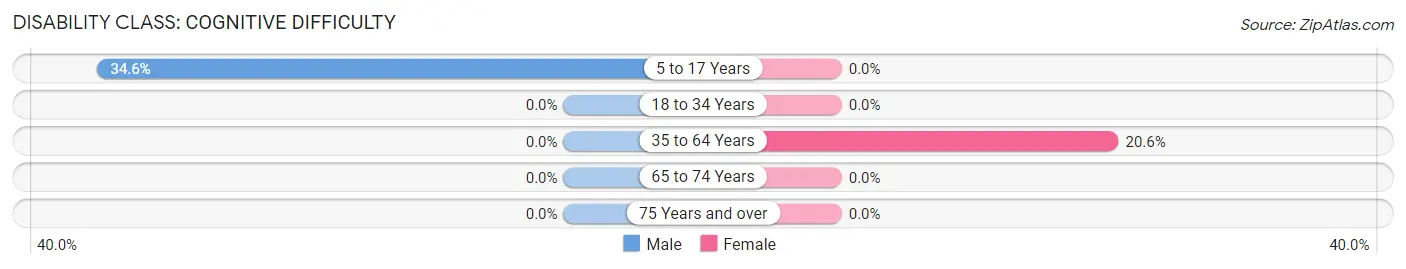
| Age Bracket | Male | Female |
| 5 to 17 Years | 46 (34.6%) | 0 (0.0%) |
| 18 to 34 Years | 0 (0.0%) | 0 (0.0%) |
| 35 to 64 Years | 0 (0.0%) | 30 (20.5%) |
| 65 to 74 Years | 0 (0.0%) | 0 (0.0%) |
| 75 Years and over | 0 (0.0%) | 0 (0.0%) |
Disability Class: Ambulatory Difficulty
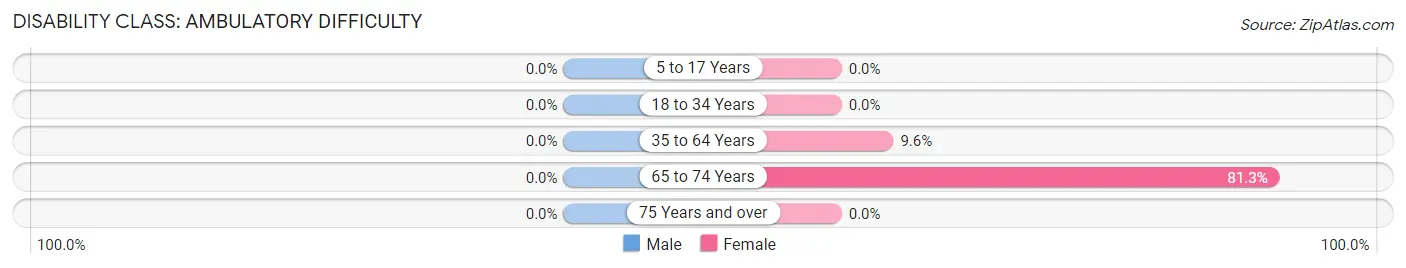
| Age Bracket | Male | Female |
| 5 to 17 Years | 0 (0.0%) | 0 (0.0%) |
| 18 to 34 Years | 0 (0.0%) | 0 (0.0%) |
| 35 to 64 Years | 0 (0.0%) | 14 (9.6%) |
| 65 to 74 Years | 0 (0.0%) | 26 (81.2%) |
| 75 Years and over | 0 (0.0%) | 0 (0.0%) |
Disability Class: Self-Care Difficulty
| Age Bracket | Male | Female |
| 5 to 17 Years | 0 (0.0%) | 0 (0.0%) |
| 18 to 34 Years | 0 (0.0%) | 0 (0.0%) |
| 35 to 64 Years | 0 (0.0%) | 0 (0.0%) |
| 65 to 74 Years | 0 (0.0%) | 0 (0.0%) |
| 75 Years and over | 0 (0.0%) | 0 (0.0%) |
Technology Access in Blue Ridge Shores
Computing Device Access in Blue Ridge Shores
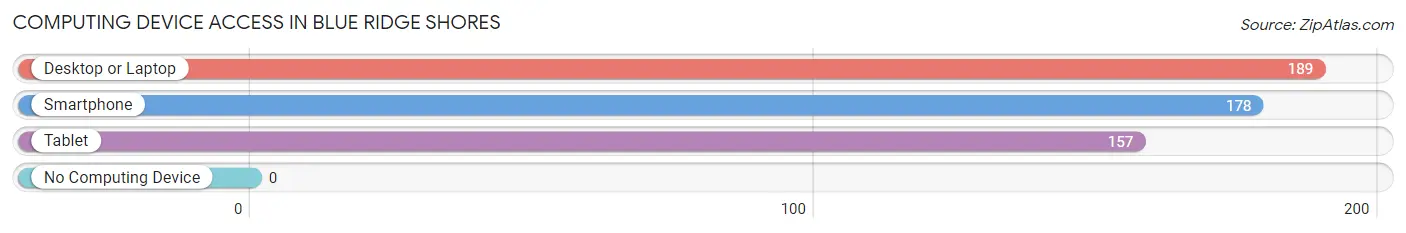
| Device Type | # Households | % Households |
| Desktop or Laptop | 189 | 100.0% |
| Smartphone | 178 | 94.2% |
| Tablet | 157 | 83.1% |
| No Computing Device | 0 | 0.0% |
| Total | 189 | 100.0% |
Internet Access in Blue Ridge Shores
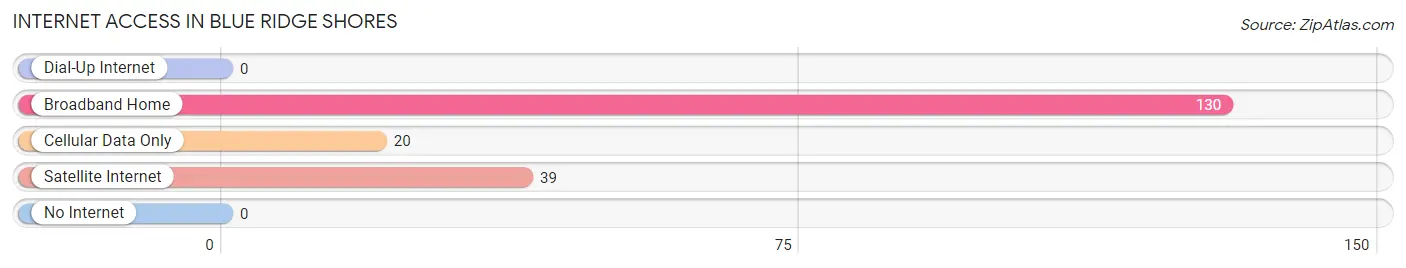
| Internet Type | # Households | % Households |
| Dial-Up Internet | 0 | 0.0% |
| Broadband Home | 130 | 68.8% |
| Cellular Data Only | 20 | 10.6% |
| Satellite Internet | 39 | 20.6% |
| No Internet | 0 | 0.0% |
| Total | 189 | 100.0% |
Blue Ridge Shores Summary
Introduction
Blue Ridge Shores is a census-designated place (CDP) located in the western part of Loudoun County, Virginia. It is situated on the eastern shore of Lake Anna, a 13,000-acre reservoir created in 1972. The CDP is located approximately 50 miles west of Washington, D.C. and is part of the Washington metropolitan area. Blue Ridge Shores is a popular destination for outdoor recreation, including fishing, boating, and camping.
History
The area that is now Blue Ridge Shores was originally inhabited by Native American tribes, including the Monacan and the Iroquois. The first European settlers arrived in the area in the late 1700s. The area was part of the original Fairfax Grant, a land grant given to Thomas Fairfax, 6th Lord Fairfax of Cameron, in 1745. The area was primarily used for farming and timber production until the mid-1900s.
In 1972, the Virginia Electric and Power Company (VEPCO) created Lake Anna, a 13,000-acre reservoir, by damming the North Anna River. The lake was created to provide cooling water for the North Anna Nuclear Generating Station, which was built nearby. The creation of the lake transformed the area, and the Blue Ridge Shores CDP was established in 1980.
Geography
Blue Ridge Shores is located in western Loudoun County, Virginia. It is situated on the eastern shore of Lake Anna, a 13,000-acre reservoir created in 1972. The CDP has a total area of 8.3 square miles, of which 8.2 square miles is land and 0.1 square miles is water. The terrain is mostly flat, with some rolling hills. The area is heavily forested, with a mix of deciduous and coniferous trees.
Economy
The economy of Blue Ridge Shores is largely driven by tourism and recreation. The area is a popular destination for outdoor recreation, including fishing, boating, and camping. There are several marinas and boat launches located on the lake, as well as several campgrounds. The area is also home to several wineries and vineyards, which attract visitors from around the region.
In addition to tourism and recreation, the area is also home to several businesses, including a grocery store, a hardware store, and a gas station. The area is also home to several small farms, which produce a variety of crops, including corn, soybeans, and hay.
Demographics
As of the 2010 census, the population of Blue Ridge Shores was 1,845. The population is primarily white (93.3%), with a small percentage of African Americans (3.2%) and Hispanics (2.2%). The median household income is $76,250, and the median age is 44. The area is largely rural, with most of the population living in single-family homes.
Conclusion
Blue Ridge Shores is a census-designated place located in western Loudoun County, Virginia. It is situated on the eastern shore of Lake Anna, a 13,000-acre reservoir created in 1972. The area is a popular destination for outdoor recreation, including fishing, boating, and camping. The economy of Blue Ridge Shores is largely driven by tourism and recreation, as well as several small businesses and farms. The population of Blue Ridge Shores is primarily white, with a median household income of $76,250 and a median age of 44.
Common Questions
What is Per Capita Income in Blue Ridge Shores?
Per Capita income in Blue Ridge Shores is $30,140.
What is the Median Family Income in Blue Ridge Shores?
Median Family Income in Blue Ridge Shores is $91,458.
What is the Median Household income in Blue Ridge Shores?
Median Household Income in Blue Ridge Shores is $90,938.
What is Income or Wage Gap in Blue Ridge Shores?
Income or Wage Gap in Blue Ridge Shores is 1.1%.
Women in Blue Ridge Shores earn 98.9 cents for every dollar earned by a man.
What is Inequality or Gini Index in Blue Ridge Shores?
Inequality or Gini Index in Blue Ridge Shores is 0.24.
What is the Total Population of Blue Ridge Shores?
Total Population of Blue Ridge Shores is 666.
What is the Total Male Population of Blue Ridge Shores?
Total Male Population of Blue Ridge Shores is 352.
What is the Total Female Population of Blue Ridge Shores?
Total Female Population of Blue Ridge Shores is 314.
What is the Ratio of Males per 100 Females in Blue Ridge Shores?
There are 112.10 Males per 100 Females in Blue Ridge Shores.
What is the Ratio of Females per 100 Males in Blue Ridge Shores?
There are 89.20 Females per 100 Males in Blue Ridge Shores.
What is the Median Population Age in Blue Ridge Shores?
Median Population Age in Blue Ridge Shores is 34.9 Years.
What is the Average Family Size in Blue Ridge Shores
Average Family Size in Blue Ridge Shores is 3.3 People.
What is the Average Household Size in Blue Ridge Shores
Average Household Size in Blue Ridge Shores is 3.5 People.
How Large is the Labor Force in Blue Ridge Shores?
There are 381 People in the Labor Forcein in Blue Ridge Shores.
What is the Percentage of People in the Labor Force in Blue Ridge Shores?
72.0% of People are in the Labor Force in Blue Ridge Shores.
What is the Unemployment Rate in Blue Ridge Shores?
Unemployment Rate in Blue Ridge Shores is 6.0%.