Zip Codes with the Highest Percentage of Population Employed in Architecture & Engineering in Henrico, VA
RELATED REPORTS & OPTIONS
Architecture & Engineering
Henrico
Compare Zip Codes
Map of Zip Codes with the Highest Percentage of Population Employed in Architecture & Engineering in Henrico
0.30%
3.2%
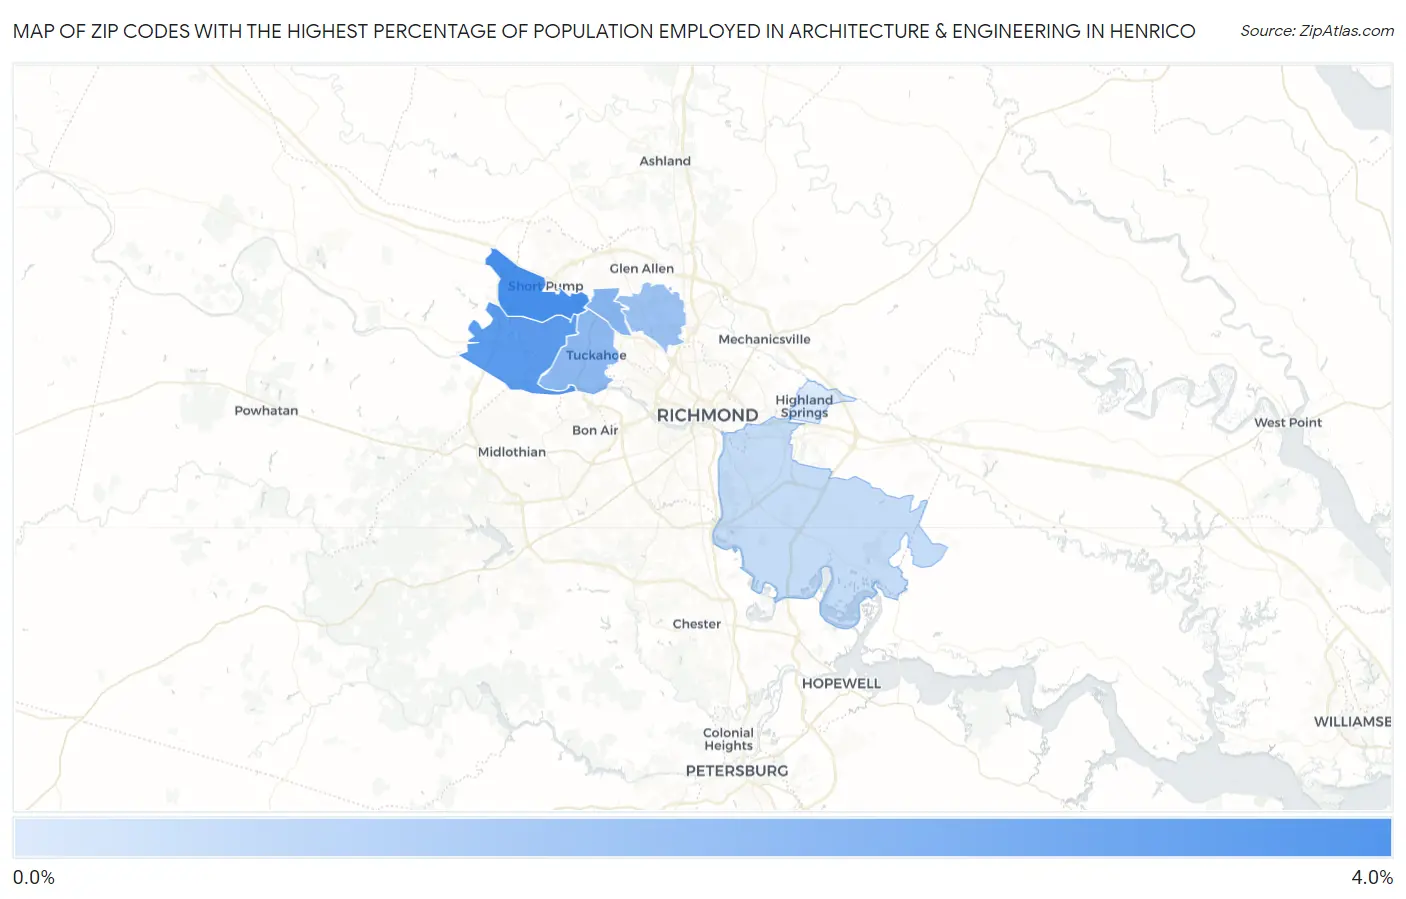
Zip Codes with the Highest Percentage of Population Employed in Architecture & Engineering in Henrico, VA
| Zip Code | % Employed | vs State | vs National | |
| 1. | 23233 | 3.2% | 2.3% (+0.920)#138 | 2.1% (+1.08)#4,402 |
| 2. | 23238 | 2.8% | 2.3% (+0.523)#168 | 2.1% (+0.679)#5,675 |
| 3. | 23294 | 1.9% | 2.3% (-0.370)#292 | 2.1% (-0.215)#10,022 |
| 4. | 23229 | 1.8% | 2.3% (-0.476)#307 | 2.1% (-0.321)#10,671 |
| 5. | 23228 | 1.6% | 2.3% (-0.721)#344 | 2.1% (-0.565)#12,283 |
| 6. | 23231 | 0.75% | 2.3% (-1.55)#496 | 2.1% (-1.40)#18,515 |
| 7. | 23075 | 0.30% | 2.3% (-2.00)#543 | 2.1% (-1.85)#21,540 |
1
Common Questions
What are the Top 5 Zip Codes with the Highest Percentage of Population Employed in Architecture & Engineering in Henrico, VA?
Top 5 Zip Codes with the Highest Percentage of Population Employed in Architecture & Engineering in Henrico, VA are:
What zip code has the Highest Percentage of Population Employed in Architecture & Engineering in Henrico, VA?
23233 has the Highest Percentage of Population Employed in Architecture & Engineering in Henrico, VA with 3.2%.
What is the Percentage of Population Employed in Architecture & Engineering in Virginia?
Percentage of Population Employed in Architecture & Engineering in Virginia is 2.3%.
What is the Percentage of Population Employed in Architecture & Engineering in the United States?
Percentage of Population Employed in Architecture & Engineering in the United States is 2.1%.