Woodlake, VA Map & Demographics
Woodlake Map
Woodlake Overview
$51,853
PER CAPITA INCOME
$130,962
AVG FAMILY INCOME
$128,065
AVG HOUSEHOLD INCOME
21.9%
WAGE / INCOME GAP [ % ]
78.1¢/ $1
WAGE / INCOME GAP [ $ ]
0.35
INEQUALITY / GINI INDEX
7,566
TOTAL POPULATION
3,722
MALE POPULATION
3,844
FEMALE POPULATION
96.83
MALES / 100 FEMALES
103.28
FEMALES / 100 MALES
40.8
MEDIAN AGE
3.1
AVG FAMILY SIZE
2.8
AVG HOUSEHOLD SIZE
4,358
LABOR FORCE [ PEOPLE ]
73.7%
PERCENT IN LABOR FORCE
5.3%
UNEMPLOYMENT RATE
Income in Woodlake
Income Overview in Woodlake
Per Capita Income in Woodlake is $51,853, while median incomes of families and households are $130,962 and $128,065 respectively.
| Characteristic | Number | Measure |
| Per Capita Income | 7,566 | $51,853 |
| Median Family Income | 2,102 | $130,962 |
| Mean Family Income | 2,102 | $153,620 |
| Median Household Income | 2,717 | $128,065 |
| Mean Household Income | 2,717 | $146,786 |
| Income Deficit | 2,102 | $0 |
| Wage / Income Gap (%) | 7,566 | 21.92% |
| Wage / Income Gap ($) | 7,566 | 78.08¢ per $1 |
| Gini / Inequality Index | 7,566 | 0.35 |
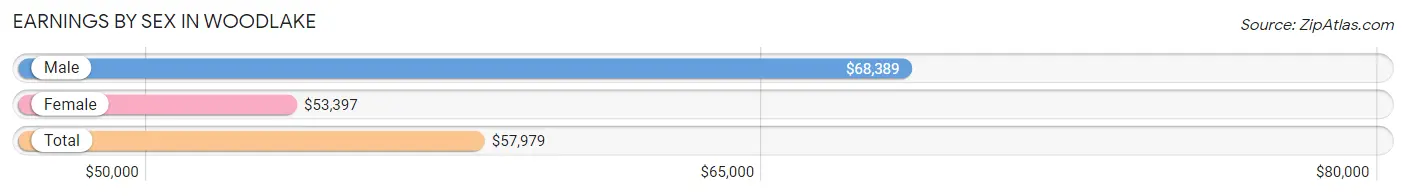
Earnings by Sex in Woodlake
Average Earnings in Woodlake are $57,979, $68,389 for men and $53,397 for women, a difference of 21.9%.
| Sex | Number | Average Earnings |
| Male | 2,474 (55.3%) | $68,389 |
| Female | 1,999 (44.7%) | $53,397 |
| Total | 4,473 (100.0%) | $57,979 |
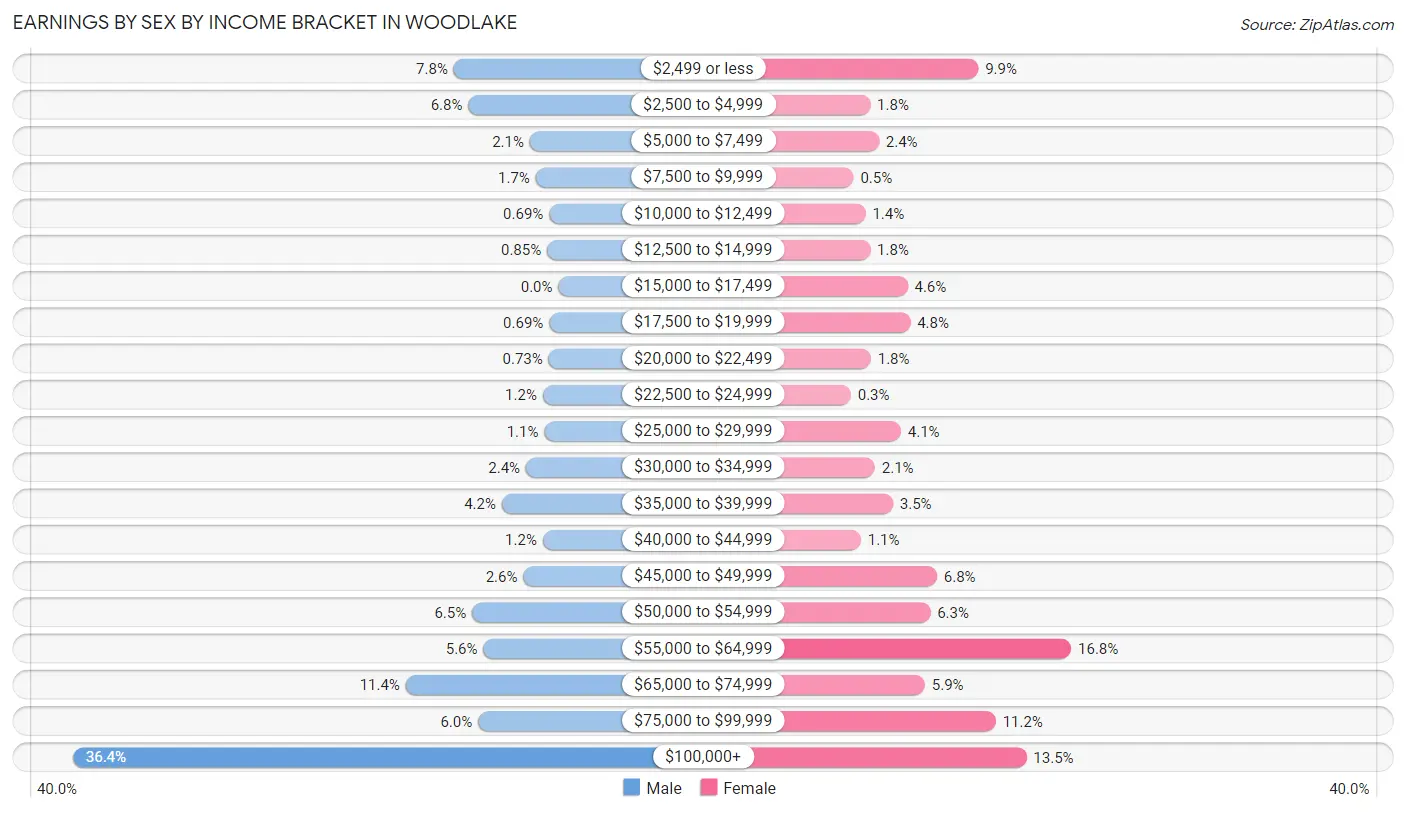
Earnings by Sex by Income Bracket in Woodlake
The most common earnings brackets in Woodlake are $100,000+ for men (900 | 36.4%) and $55,000 to $64,999 for women (336 | 16.8%).
| Income | Male | Female |
| $2,499 or less | 194 (7.8%) | 197 (9.9%) |
| $2,500 to $4,999 | 167 (6.8%) | 35 (1.8%) |
| $5,000 to $7,499 | 53 (2.1%) | 48 (2.4%) |
| $7,500 to $9,999 | 42 (1.7%) | 10 (0.5%) |
| $10,000 to $12,499 | 17 (0.7%) | 28 (1.4%) |
| $12,500 to $14,999 | 21 (0.9%) | 35 (1.8%) |
| $15,000 to $17,499 | 0 (0.0%) | 91 (4.5%) |
| $17,500 to $19,999 | 17 (0.7%) | 95 (4.8%) |
| $20,000 to $22,499 | 18 (0.7%) | 36 (1.8%) |
| $22,500 to $24,999 | 29 (1.2%) | 6 (0.3%) |
| $25,000 to $29,999 | 26 (1.1%) | 81 (4.1%) |
| $30,000 to $34,999 | 60 (2.4%) | 42 (2.1%) |
| $35,000 to $39,999 | 105 (4.2%) | 69 (3.5%) |
| $40,000 to $44,999 | 29 (1.2%) | 21 (1.1%) |
| $45,000 to $49,999 | 65 (2.6%) | 135 (6.8%) |
| $50,000 to $54,999 | 160 (6.5%) | 125 (6.2%) |
| $55,000 to $64,999 | 139 (5.6%) | 336 (16.8%) |
| $65,000 to $74,999 | 283 (11.4%) | 117 (5.9%) |
| $75,000 to $99,999 | 149 (6.0%) | 223 (11.2%) |
| $100,000+ | 900 (36.4%) | 269 (13.5%) |
| Total | 2,474 (100.0%) | 1,999 (100.0%) |
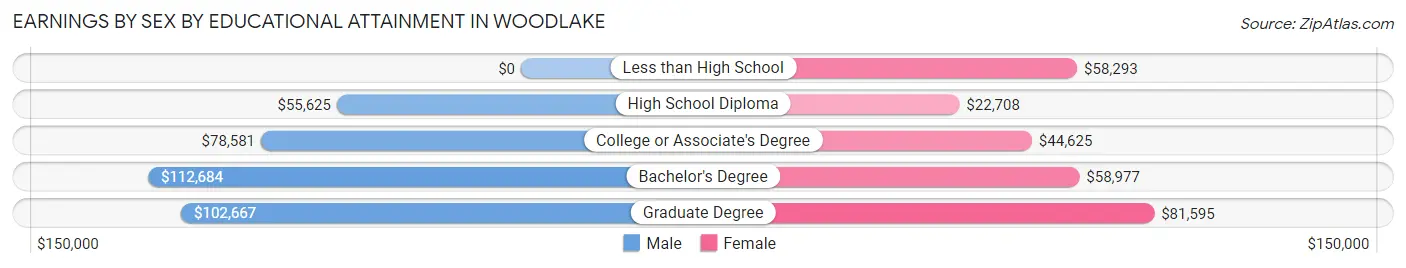
Earnings by Sex by Educational Attainment in Woodlake
Average earnings in Woodlake are $82,083 for men and $58,036 for women, a difference of 29.3%. Men with an educational attainment of bachelor's degree enjoy the highest average annual earnings of $112,684, while those with high school diploma education earn the least with $55,625. Women with an educational attainment of graduate degree earn the most with the average annual earnings of $81,595, while those with high school diploma education have the smallest earnings of $22,708.
| Educational Attainment | Male Income | Female Income |
| Less than High School | - | - |
| High School Diploma | $55,625 | $22,708 |
| College or Associate's Degree | $78,581 | $44,625 |
| Bachelor's Degree | $112,684 | $58,977 |
| Graduate Degree | $102,667 | $81,595 |
| Total | $82,083 | $58,036 |
Family Income in Woodlake
Family Income Brackets in Woodlake
According to the Woodlake family income data, there are 647 families falling into the $100,000 to $149,999 income range, which is the most common income bracket and makes up 30.8% of all families.
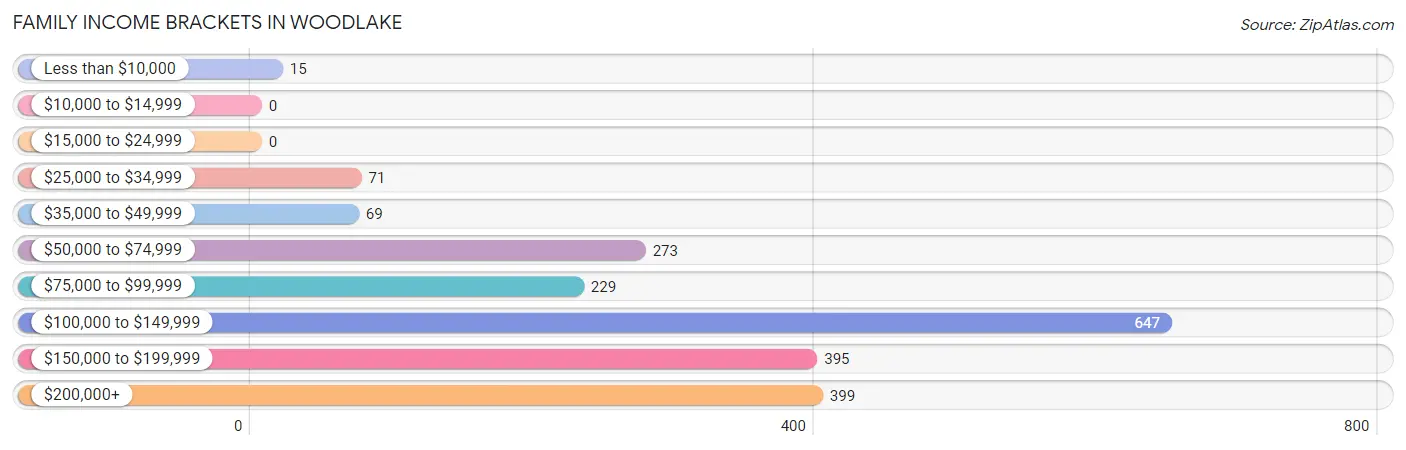
| Income Bracket | # Families | % Families |
| Less than $10,000 | 15 | 0.7% |
| $10,000 to $14,999 | 0 | 0.0% |
| $15,000 to $24,999 | 0 | 0.0% |
| $25,000 to $34,999 | 71 | 3.4% |
| $35,000 to $49,999 | 69 | 3.3% |
| $50,000 to $74,999 | 273 | 13.0% |
| $75,000 to $99,999 | 229 | 10.9% |
| $100,000 to $149,999 | 647 | 30.8% |
| $150,000 to $199,999 | 395 | 18.8% |
| $200,000+ | 399 | 19.0% |
Family Income by Famaliy Size in Woodlake
4-person families (554 | 26.4%) account for the highest median family income in Woodlake with $148,070 per family, while 2-person families (837 | 39.8%) have the highest median income of $59,125 per family member.
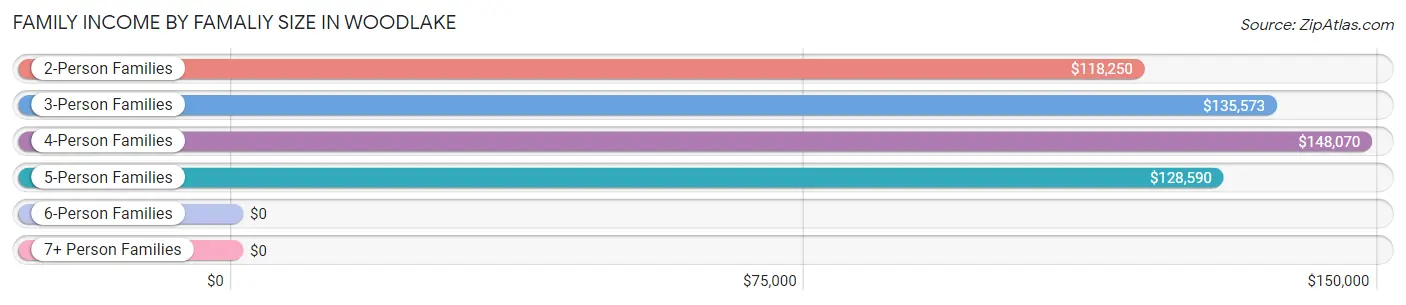
| Income Bracket | # Families | Median Income |
| 2-Person Families | 837 (39.8%) | $118,250 |
| 3-Person Families | 471 (22.4%) | $135,573 |
| 4-Person Families | 554 (26.4%) | $148,070 |
| 5-Person Families | 208 (9.9%) | $128,590 |
| 6-Person Families | 18 (0.9%) | $0 |
| 7+ Person Families | 14 (0.7%) | $0 |
| Total | 2,102 (100.0%) | $130,962 |
Family Income by Number of Earners in Woodlake
The median family income in Woodlake is $130,962, with families comprising 2 earners (970) having the highest median family income of $150,068, while families with no earners (285) have the lowest median family income of $84,732, accounting for 46.2% and 13.6% of families, respectively.
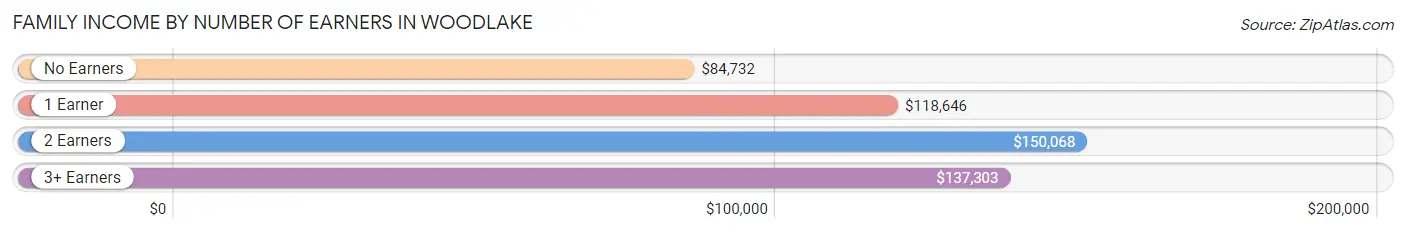
| Number of Earners | # Families | Median Income |
| No Earners | 285 (13.6%) | $84,732 |
| 1 Earner | 484 (23.0%) | $118,646 |
| 2 Earners | 970 (46.2%) | $150,068 |
| 3+ Earners | 363 (17.3%) | $137,303 |
| Total | 2,102 (100.0%) | $130,962 |
Household Income in Woodlake
Household Income Brackets in Woodlake
With 867 households falling in the category, the $100,000 to $149,999 income range is the most frequent in Woodlake, accounting for 31.9% of all households.
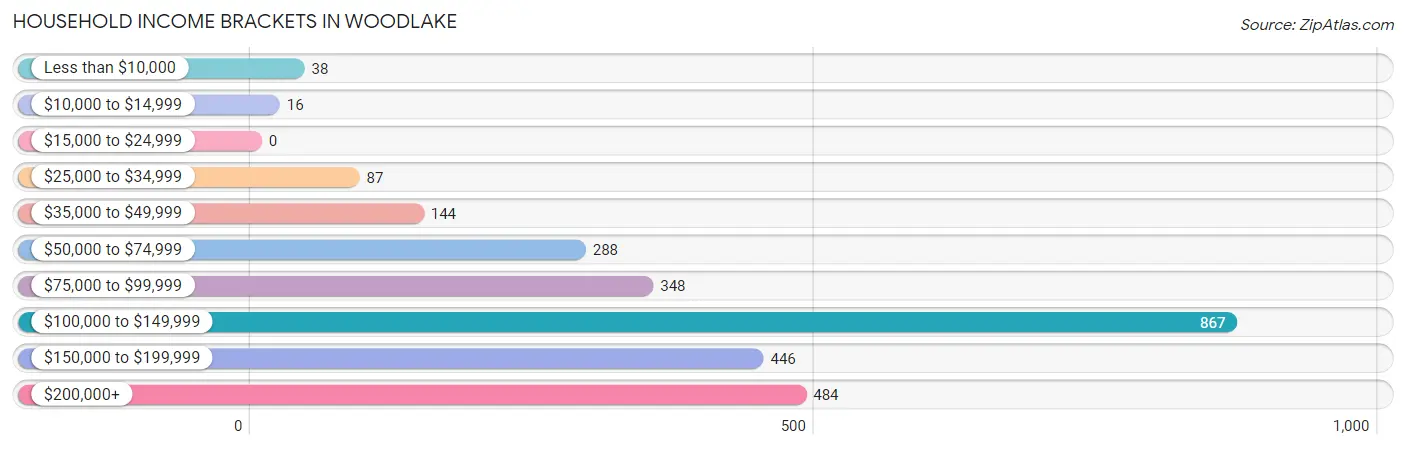
| Income Bracket | # Households | % Households |
| Less than $10,000 | 38 | 1.4% |
| $10,000 to $14,999 | 16 | 0.6% |
| $15,000 to $24,999 | 0 | 0.0% |
| $25,000 to $34,999 | 87 | 3.2% |
| $35,000 to $49,999 | 144 | 5.3% |
| $50,000 to $74,999 | 288 | 10.6% |
| $75,000 to $99,999 | 348 | 12.8% |
| $100,000 to $149,999 | 867 | 31.9% |
| $150,000 to $199,999 | 446 | 16.4% |
| $200,000+ | 484 | 17.8% |
Household Income by Householder Age in Woodlake
The median household income in Woodlake is $128,065, with the highest median household income of $136,979 found in the 25 to 44 years age bracket for the primary householder. A total of 944 households (34.7%) fall into this category. Meanwhile, the 15 to 24 years age bracket for the primary householder has the lowest median household income of $69,716, with 51 households (1.9%) in this group.
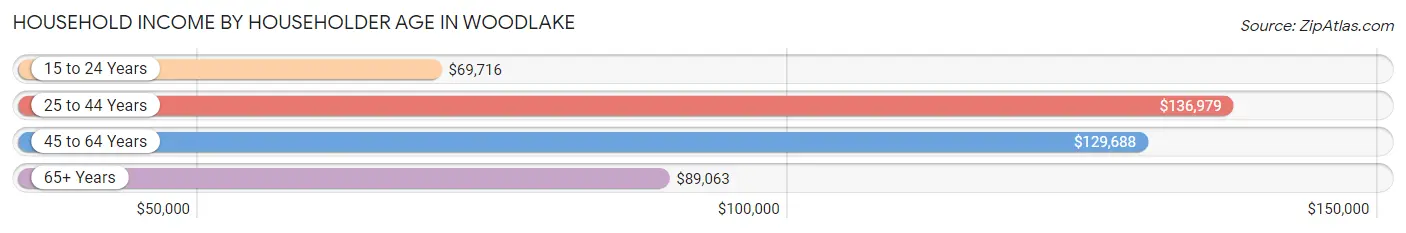
| Income Bracket | # Households | Median Income |
| 15 to 24 Years | 51 (1.9%) | $69,716 |
| 25 to 44 Years | 944 (34.7%) | $136,979 |
| 45 to 64 Years | 1,093 (40.2%) | $129,688 |
| 65+ Years | 629 (23.2%) | $89,063 |
| Total | 2,717 (100.0%) | $128,065 |
Poverty in Woodlake
Income Below Poverty by Sex and Age in Woodlake
With 3.1% poverty level for males and 3.1% for females among the residents of Woodlake, 55 to 64 year old males and 18 to 24 year old females are the most vulnerable to poverty, with 49 males (9.9%) and 55 females (19.6%) in their respective age groups living below the poverty level.
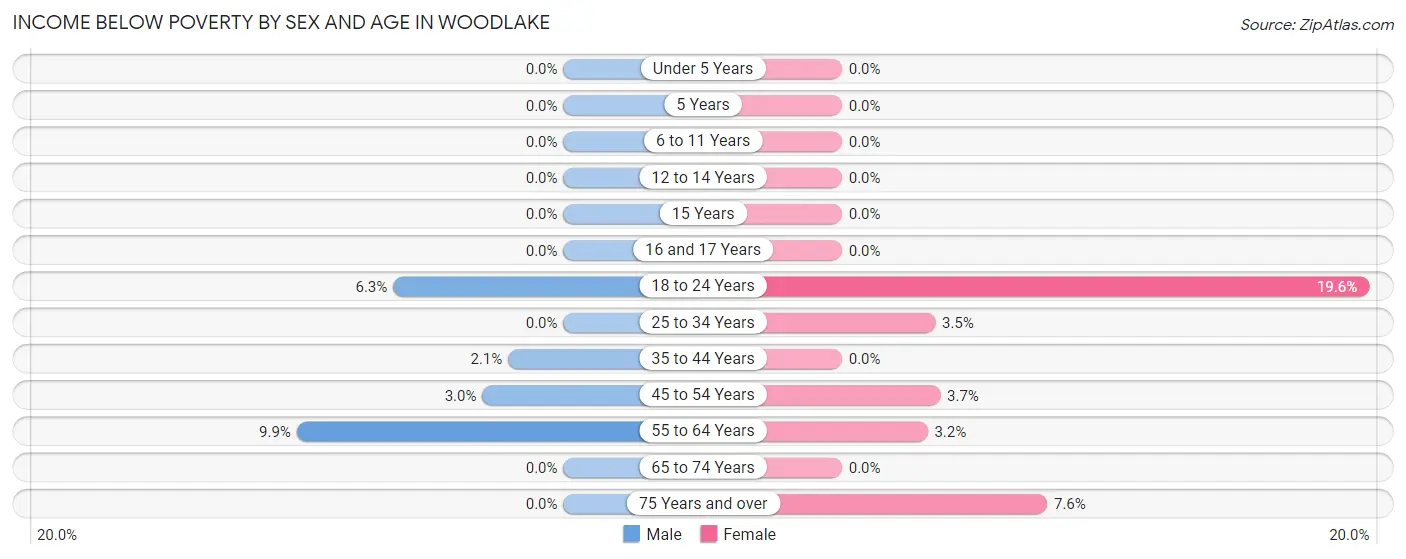
| Age Bracket | Male | Female |
| Under 5 Years | 0 (0.0%) | 0 (0.0%) |
| 5 Years | 0 (0.0%) | 0 (0.0%) |
| 6 to 11 Years | 0 (0.0%) | 0 (0.0%) |
| 12 to 14 Years | 0 (0.0%) | 0 (0.0%) |
| 15 Years | 0 (0.0%) | 0 (0.0%) |
| 16 and 17 Years | 0 (0.0%) | 0 (0.0%) |
| 18 to 24 Years | 38 (6.3%) | 55 (19.6%) |
| 25 to 34 Years | 0 (0.0%) | 9 (3.5%) |
| 35 to 44 Years | 17 (2.1%) | 0 (0.0%) |
| 45 to 54 Years | 12 (3.0%) | 23 (3.6%) |
| 55 to 64 Years | 49 (9.9%) | 13 (3.2%) |
| 65 to 74 Years | 0 (0.0%) | 0 (0.0%) |
| 75 Years and over | 0 (0.0%) | 17 (7.6%) |
| Total | 116 (3.1%) | 117 (3.1%) |
Income Above Poverty by Sex and Age in Woodlake
According to the poverty statistics in Woodlake, males aged under 5 years and females aged under 5 years are the age groups that are most secure financially, with 100.0% of males and 100.0% of females in these age groups living above the poverty line.
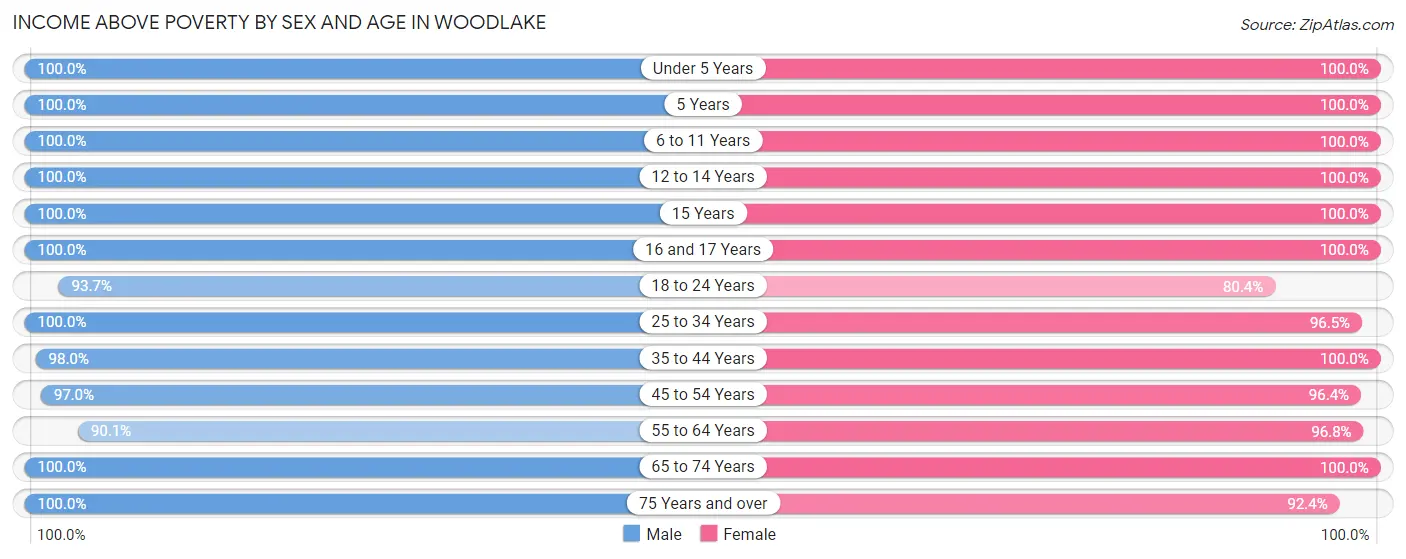
| Age Bracket | Male | Female |
| Under 5 Years | 118 (100.0%) | 127 (100.0%) |
| 5 Years | 59 (100.0%) | 58 (100.0%) |
| 6 to 11 Years | 366 (100.0%) | 358 (100.0%) |
| 12 to 14 Years | 93 (100.0%) | 213 (100.0%) |
| 15 Years | 35 (100.0%) | 175 (100.0%) |
| 16 and 17 Years | 69 (100.0%) | 62 (100.0%) |
| 18 to 24 Years | 563 (93.7%) | 226 (80.4%) |
| 25 to 34 Years | 140 (100.0%) | 251 (96.5%) |
| 35 to 44 Years | 814 (98.0%) | 589 (100.0%) |
| 45 to 54 Years | 387 (97.0%) | 607 (96.4%) |
| 55 to 64 Years | 446 (90.1%) | 396 (96.8%) |
| 65 to 74 Years | 345 (100.0%) | 426 (100.0%) |
| 75 Years and over | 153 (100.0%) | 206 (92.4%) |
| Total | 3,588 (96.9%) | 3,694 (96.9%) |
Income Below Poverty Among Married-Couple Families in Woodlake
The poverty statistics for married-couple families in Woodlake show that 0.8% or 14 of the total 1,843 families live below the poverty line. Families with no children have the highest poverty rate of 1.3%, comprising of 14 families. On the other hand, families with 1 or 2 children have the lowest poverty rate of 0.0%, which includes 0 families.
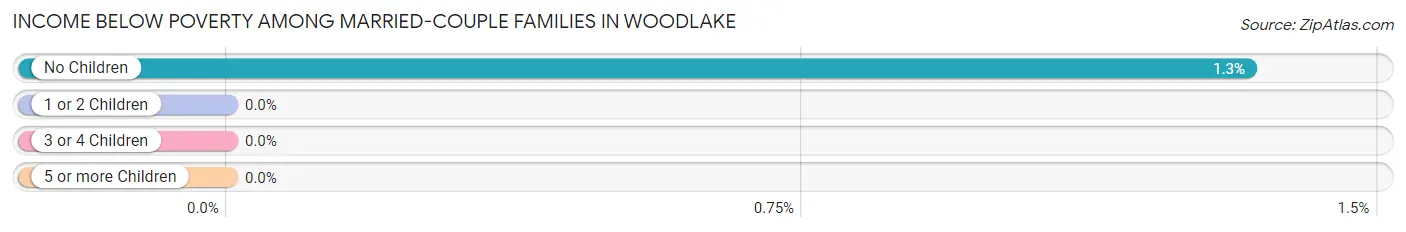
| Children | Above Poverty | Below Poverty |
| No Children | 1,036 (98.7%) | 14 (1.3%) |
| 1 or 2 Children | 671 (100.0%) | 0 (0.0%) |
| 3 or 4 Children | 108 (100.0%) | 0 (0.0%) |
| 5 or more Children | 14 (100.0%) | 0 (0.0%) |
| Total | 1,829 (99.2%) | 14 (0.8%) |
Income Below Poverty Among Single-Parent Households in Woodlake
| Children | Single Father | Single Mother |
| No Children | 0 (0.0%) | 0 (0.0%) |
| 1 or 2 Children | 0 (0.0%) | 0 (0.0%) |
| 3 or 4 Children | 0 (0.0%) | 0 (0.0%) |
| 5 or more Children | 0 (0.0%) | 0 (0.0%) |
| Total | 0 (0.0%) | 0 (0.0%) |
Income Below Poverty Among Married-Couple vs Single-Parent Households in Woodlake
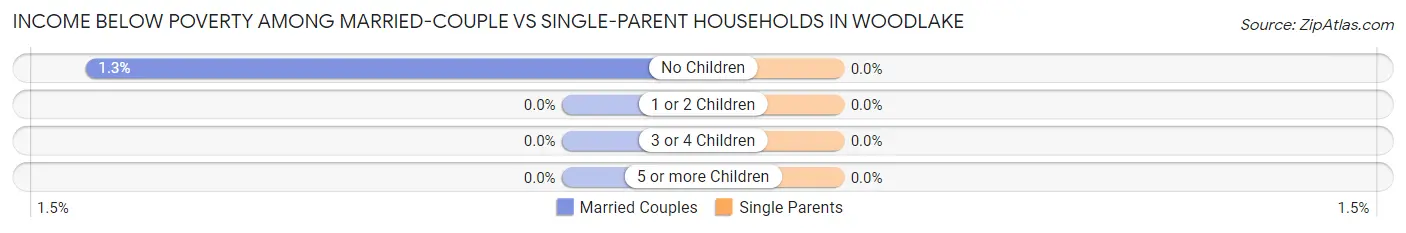
| Children | Married-Couple Families | Single-Parent Households |
| No Children | 14 (1.3%) | 0 (0.0%) |
| 1 or 2 Children | 0 (0.0%) | 0 (0.0%) |
| 3 or 4 Children | 0 (0.0%) | 0 (0.0%) |
| 5 or more Children | 0 (0.0%) | 0 (0.0%) |
| Total | 14 (0.8%) | 0 (0.0%) |
Race in Woodlake
The most populous races in Woodlake are White / Caucasian (6,252 | 82.6%), Black / African American (415 | 5.5%), and Asian (410 | 5.4%).
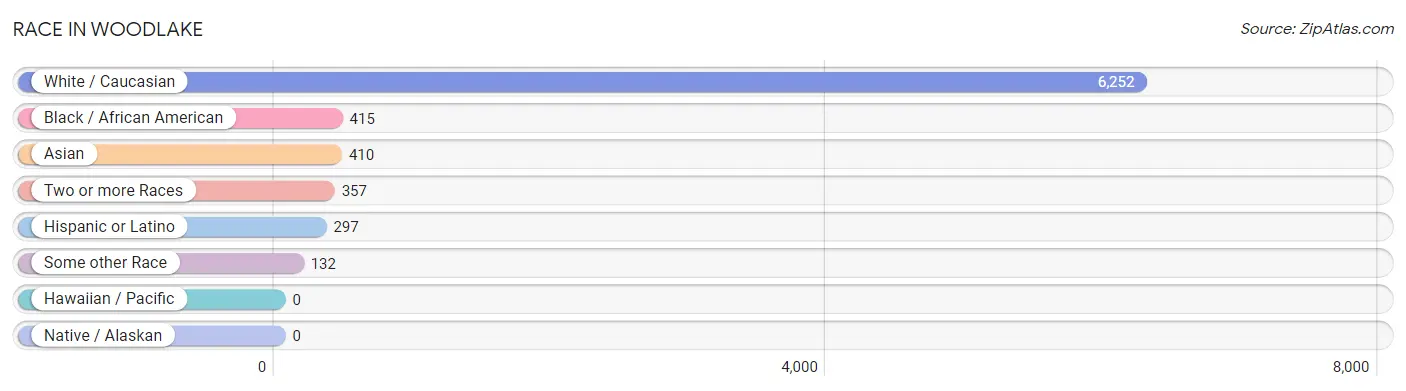
| Race | # Population | % Population |
| Asian | 410 | 5.4% |
| Black / African American | 415 | 5.5% |
| Hawaiian / Pacific | 0 | 0.0% |
| Hispanic or Latino | 297 | 3.9% |
| Native / Alaskan | 0 | 0.0% |
| White / Caucasian | 6,252 | 82.6% |
| Two or more Races | 357 | 4.7% |
| Some other Race | 132 | 1.7% |
| Total | 7,566 | 100.0% |
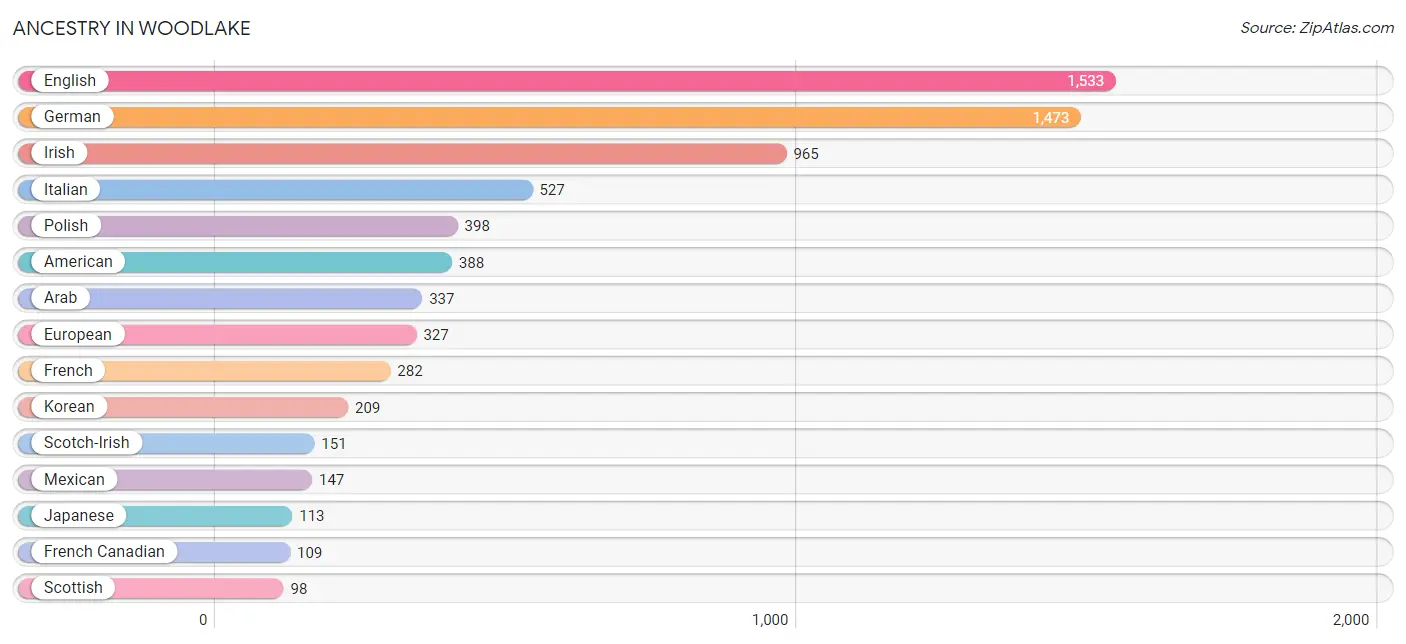
Ancestry in Woodlake
The most populous ancestries reported in Woodlake are English (1,533 | 20.3%), German (1,473 | 19.5%), Irish (965 | 12.8%), Italian (527 | 7.0%), and Polish (398 | 5.3%), together accounting for 64.7% of all Woodlake residents.
| Ancestry | # Population | % Population |
| American | 388 | 5.1% |
| Arab | 337 | 4.4% |
| Austrian | 49 | 0.6% |
| Belizean | 10 | 0.1% |
| Bhutanese | 64 | 0.9% |
| British | 37 | 0.5% |
| Burmese | 74 | 1.0% |
| Canadian | 67 | 0.9% |
| Cuban | 43 | 0.6% |
| Czech | 14 | 0.2% |
| Dutch | 40 | 0.5% |
| Egyptian | 42 | 0.6% |
| English | 1,533 | 20.3% |
| European | 327 | 4.3% |
| Finnish | 6 | 0.1% |
| French | 282 | 3.7% |
| French Canadian | 109 | 1.4% |
| German | 1,473 | 19.5% |
| Hungarian | 63 | 0.8% |
| Indian (Asian) | 17 | 0.2% |
| Irish | 965 | 12.8% |
| Italian | 527 | 7.0% |
| Japanese | 113 | 1.5% |
| Korean | 209 | 2.8% |
| Lebanese | 10 | 0.1% |
| Lithuanian | 49 | 0.6% |
| Mexican | 147 | 1.9% |
| Mexican American Indian | 15 | 0.2% |
| Norwegian | 23 | 0.3% |
| Polish | 398 | 5.3% |
| Portuguese | 6 | 0.1% |
| Puerto Rican | 62 | 0.8% |
| Romanian | 17 | 0.2% |
| Russian | 47 | 0.6% |
| Scandinavian | 14 | 0.2% |
| Scotch-Irish | 151 | 2.0% |
| Scottish | 98 | 1.3% |
| Slovene | 17 | 0.2% |
| Spanish | 45 | 0.6% |
| Swedish | 69 | 0.9% |
| Swiss | 17 | 0.2% |
| Thai | 57 | 0.7% |
| Ukrainian | 38 | 0.5% |
| Welsh | 41 | 0.5% | View All 44 Rows |
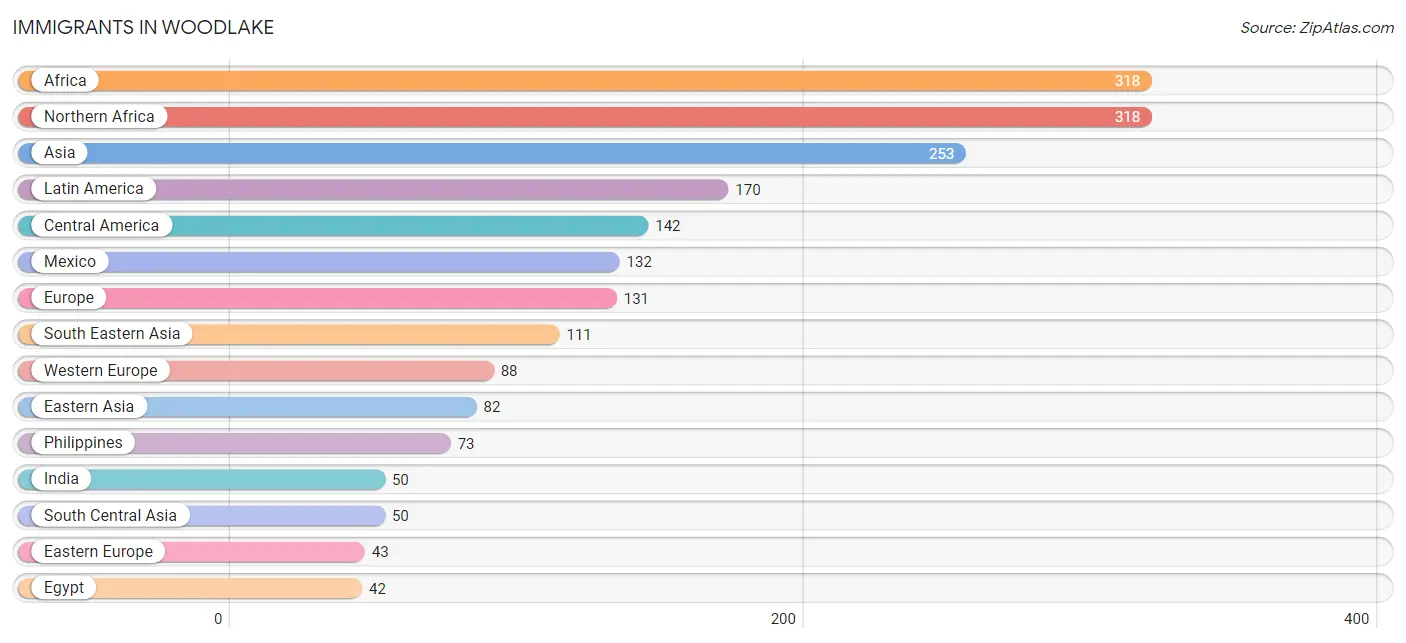
Immigrants in Woodlake
The most numerous immigrant groups reported in Woodlake came from Africa (318 | 4.2%), Northern Africa (318 | 4.2%), Asia (253 | 3.3%), Latin America (170 | 2.2%), and Central America (142 | 1.9%), together accounting for 15.9% of all Woodlake residents.
| Immigration Origin | # Population | % Population |
| Africa | 318 | 4.2% |
| Asia | 253 | 3.3% |
| Belize | 10 | 0.1% |
| Cambodia | 38 | 0.5% |
| Canada | 12 | 0.2% |
| Caribbean | 28 | 0.4% |
| Central America | 142 | 1.9% |
| China | 17 | 0.2% |
| Eastern Asia | 82 | 1.1% |
| Eastern Europe | 43 | 0.6% |
| Egypt | 42 | 0.6% |
| Europe | 131 | 1.7% |
| France | 37 | 0.5% |
| Germany | 19 | 0.3% |
| Haiti | 28 | 0.4% |
| Hungary | 24 | 0.3% |
| India | 50 | 0.7% |
| Japan | 30 | 0.4% |
| Korea | 35 | 0.5% |
| Latin America | 170 | 2.2% |
| Lebanon | 10 | 0.1% |
| Mexico | 132 | 1.7% |
| Netherlands | 15 | 0.2% |
| Northern Africa | 318 | 4.2% |
| Philippines | 73 | 1.0% |
| Russia | 19 | 0.3% |
| South Central Asia | 50 | 0.7% |
| South Eastern Asia | 111 | 1.5% |
| Switzerland | 17 | 0.2% |
| Taiwan | 17 | 0.2% |
| Western Asia | 10 | 0.1% |
| Western Europe | 88 | 1.2% | View All 32 Rows |
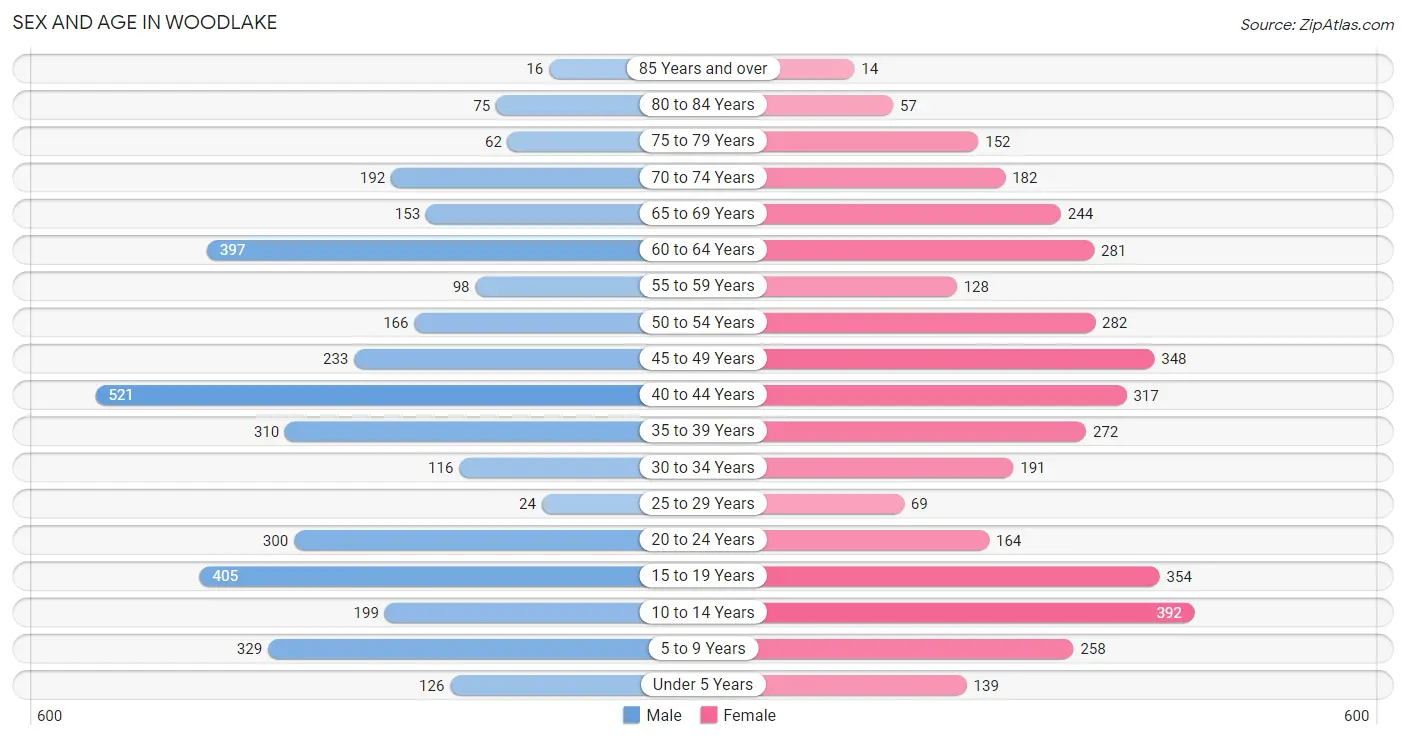
Sex and Age in Woodlake
Sex and Age in Woodlake
The most populous age groups in Woodlake are 40 to 44 Years (521 | 14.0%) for men and 10 to 14 Years (392 | 10.2%) for women.
| Age Bracket | Male | Female |
| Under 5 Years | 126 (3.4%) | 139 (3.6%) |
| 5 to 9 Years | 329 (8.8%) | 258 (6.7%) |
| 10 to 14 Years | 199 (5.3%) | 392 (10.2%) |
| 15 to 19 Years | 405 (10.9%) | 354 (9.2%) |
| 20 to 24 Years | 300 (8.1%) | 164 (4.3%) |
| 25 to 29 Years | 24 (0.6%) | 69 (1.8%) |
| 30 to 34 Years | 116 (3.1%) | 191 (5.0%) |
| 35 to 39 Years | 310 (8.3%) | 272 (7.1%) |
| 40 to 44 Years | 521 (14.0%) | 317 (8.3%) |
| 45 to 49 Years | 233 (6.3%) | 348 (9.0%) |
| 50 to 54 Years | 166 (4.5%) | 282 (7.3%) |
| 55 to 59 Years | 98 (2.6%) | 128 (3.3%) |
| 60 to 64 Years | 397 (10.7%) | 281 (7.3%) |
| 65 to 69 Years | 153 (4.1%) | 244 (6.4%) |
| 70 to 74 Years | 192 (5.2%) | 182 (4.7%) |
| 75 to 79 Years | 62 (1.7%) | 152 (4.0%) |
| 80 to 84 Years | 75 (2.0%) | 57 (1.5%) |
| 85 Years and over | 16 (0.4%) | 14 (0.4%) |
| Total | 3,722 (100.0%) | 3,844 (100.0%) |
Families and Households in Woodlake
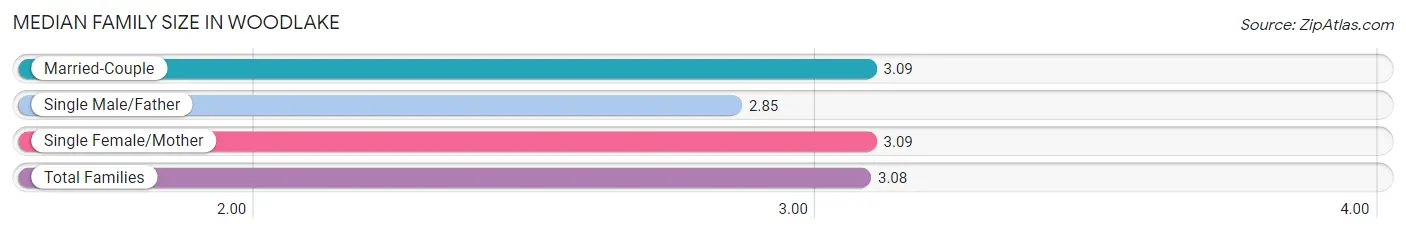
Median Family Size in Woodlake
The median family size in Woodlake is 3.08 persons per family, with married-couple families (1,843 | 87.7%) accounting for the largest median family size of 3.09 persons per family. On the other hand, single male/father families (86 | 4.1%) represent the smallest median family size with 2.85 persons per family.
| Family Type | # Families | Family Size |
| Married-Couple | 1,843 (87.7%) | 3.09 |
| Single Male/Father | 86 (4.1%) | 2.85 |
| Single Female/Mother | 173 (8.2%) | 3.09 |
| Total Families | 2,102 (100.0%) | 3.08 |
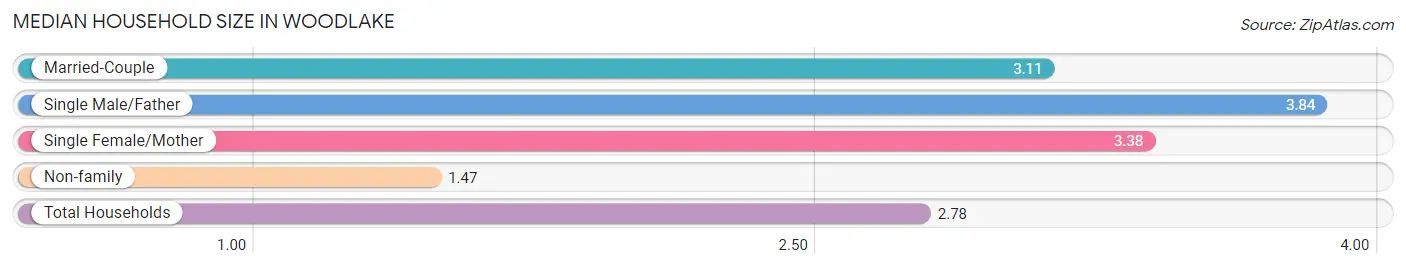
Median Household Size in Woodlake
The median household size in Woodlake is 2.78 persons per household, with single male/father households (86 | 3.2%) accounting for the largest median household size of 3.84 persons per household. non-family households (615 | 22.6%) represent the smallest median household size with 1.47 persons per household.
| Household Type | # Households | Household Size |
| Married-Couple | 1,843 (67.8%) | 3.11 |
| Single Male/Father | 86 (3.2%) | 3.84 |
| Single Female/Mother | 173 (6.4%) | 3.38 |
| Non-family | 615 (22.6%) | 1.47 |
| Total Households | 2,717 (100.0%) | 2.78 |
Household Size by Marriage Status in Woodlake
Out of a total of 2,717 households in Woodlake, 2,102 (77.4%) are family households, while 615 (22.6%) are nonfamily households. The most numerous type of family households are 2-person households, comprising 814, and the most common type of nonfamily households are 1-person households, comprising 442.
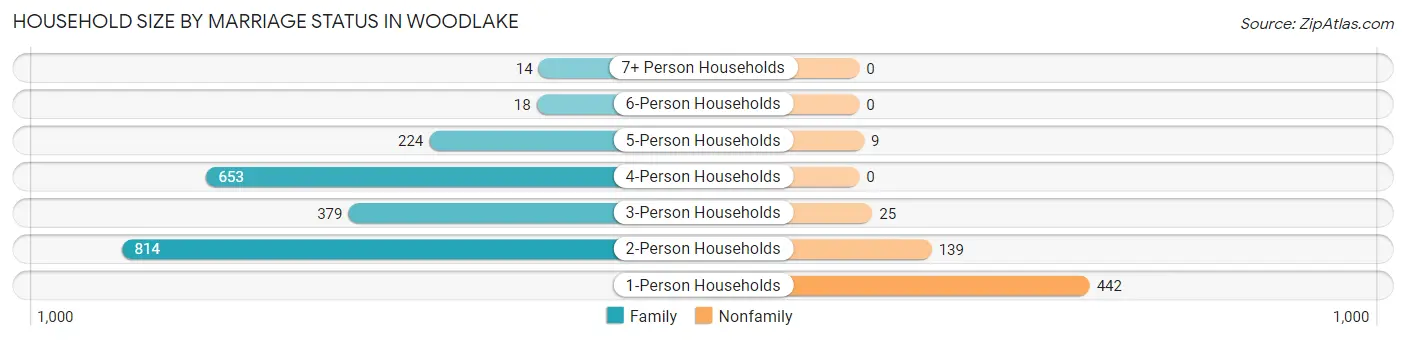
| Household Size | Family Households | Nonfamily Households |
| 1-Person Households | - | 442 (16.3%) |
| 2-Person Households | 814 (30.0%) | 139 (5.1%) |
| 3-Person Households | 379 (14.0%) | 25 (0.9%) |
| 4-Person Households | 653 (24.0%) | 0 (0.0%) |
| 5-Person Households | 224 (8.2%) | 9 (0.3%) |
| 6-Person Households | 18 (0.7%) | 0 (0.0%) |
| 7+ Person Households | 14 (0.5%) | 0 (0.0%) |
| Total | 2,102 (77.4%) | 615 (22.6%) |
Female Fertility in Woodlake
Fertility by Age in Woodlake
Average fertility rate in Woodlake is 8.0 births per 1,000 women. Women in the age bracket of 20 to 34 years have the highest fertility rate with 12.0 births per 1,000 women. Women in the age bracket of 35 to 50 years acount for 61.5% of all women with births.
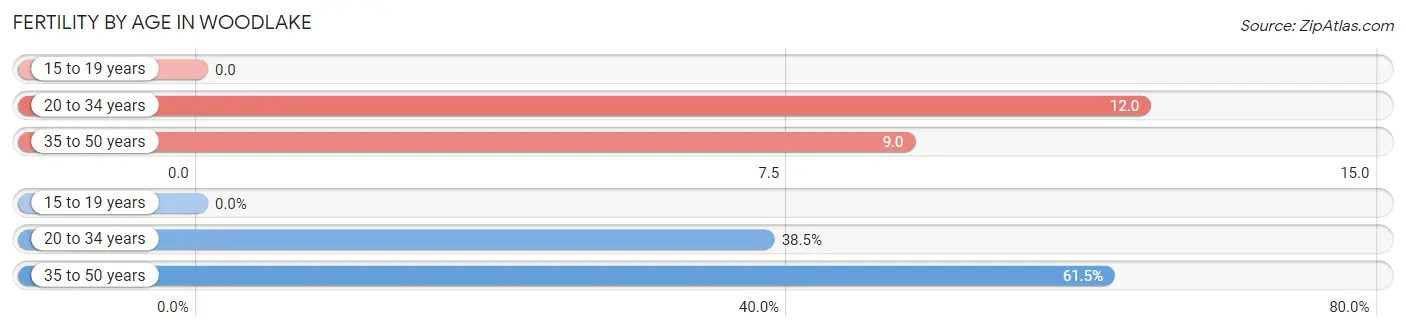
| Age Bracket | Women with Births | Births / 1,000 Women |
| 15 to 19 years | 0 (0.0%) | 0.0 |
| 20 to 34 years | 5 (38.5%) | 12.0 |
| 35 to 50 years | 8 (61.5%) | 9.0 |
| Total | 13 (100.0%) | 8.0 |
Fertility by Age by Marriage Status in Woodlake
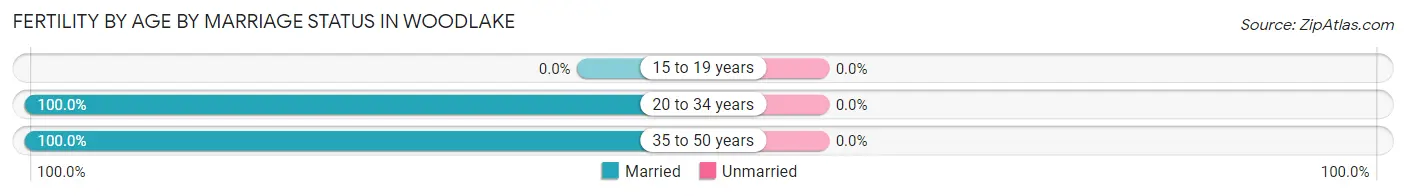
| Age Bracket | Married | Unmarried |
| 15 to 19 years | 0 (0.0%) | 0 (0.0%) |
| 20 to 34 years | 5 (100.0%) | 0 (0.0%) |
| 35 to 50 years | 8 (100.0%) | 0 (0.0%) |
| Total | 13 (100.0%) | 0 (0.0%) |
Fertility by Education in Woodlake
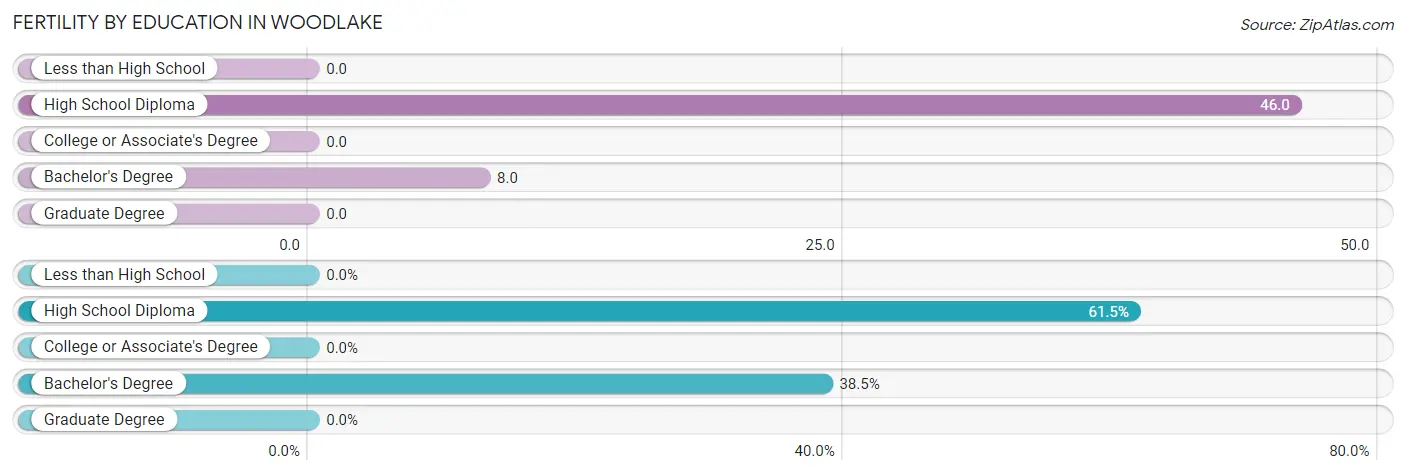
| Educational Attainment | Women with Births | Births / 1,000 Women |
| Less than High School | 0 (0.0%) | 0.0 |
| High School Diploma | 8 (61.5%) | 46.0 |
| College or Associate's Degree | 0 (0.0%) | 0.0 |
| Bachelor's Degree | 5 (38.5%) | 8.0 |
| Graduate Degree | 0 (0.0%) | 0.0 |
| Total | 13 (100.0%) | 8.0 |
Fertility by Education by Marriage Status in Woodlake
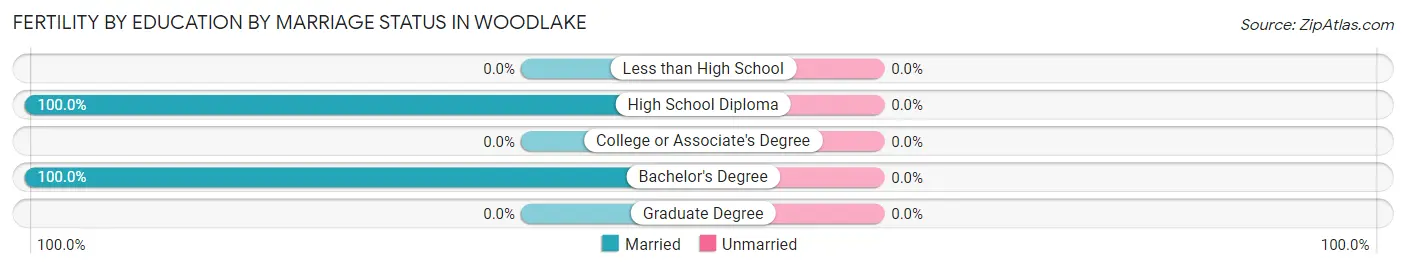
| Educational Attainment | Married | Unmarried |
| Less than High School | 0 (0.0%) | 0 (0.0%) |
| High School Diploma | 8 (100.0%) | 0 (0.0%) |
| College or Associate's Degree | 0 (0.0%) | 0 (0.0%) |
| Bachelor's Degree | 5 (100.0%) | 0 (0.0%) |
| Graduate Degree | 0 (0.0%) | 0 (0.0%) |
| Total | 13 (100.0%) | 0 (0.0%) |
Employment Characteristics in Woodlake
Employment by Class of Employer in Woodlake
Among the 3,966 employed individuals in Woodlake, private company employees (2,575 | 64.9%), local government employees (407 | 10.3%), and not-for-profit organizations (331 | 8.4%) make up the most common classes of employment.
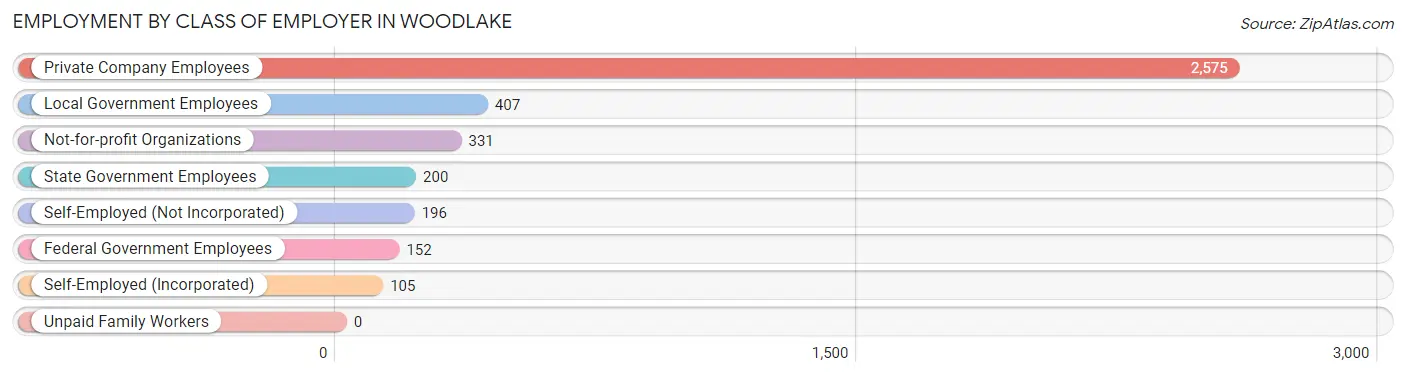
| Employer Class | # Employees | % Employees |
| Private Company Employees | 2,575 | 64.9% |
| Self-Employed (Incorporated) | 105 | 2.6% |
| Self-Employed (Not Incorporated) | 196 | 4.9% |
| Not-for-profit Organizations | 331 | 8.4% |
| Local Government Employees | 407 | 10.3% |
| State Government Employees | 200 | 5.0% |
| Federal Government Employees | 152 | 3.8% |
| Unpaid Family Workers | 0 | 0.0% |
| Total | 3,966 | 100.0% |
Employment Status by Age in Woodlake
According to the labor force statistics for Woodlake, out of the total population over 16 years of age (5,913), 73.7% or 4,358 individuals are in the labor force, with 5.3% or 231 of them unemployed. The age group with the highest labor force participation rate is 35 to 44 years, with 92.3% or 1,311 individuals in the labor force. Within the labor force, the 16 to 19 years age range has the highest percentage of unemployed individuals, with 10.8% or 37 of them being unemployed.
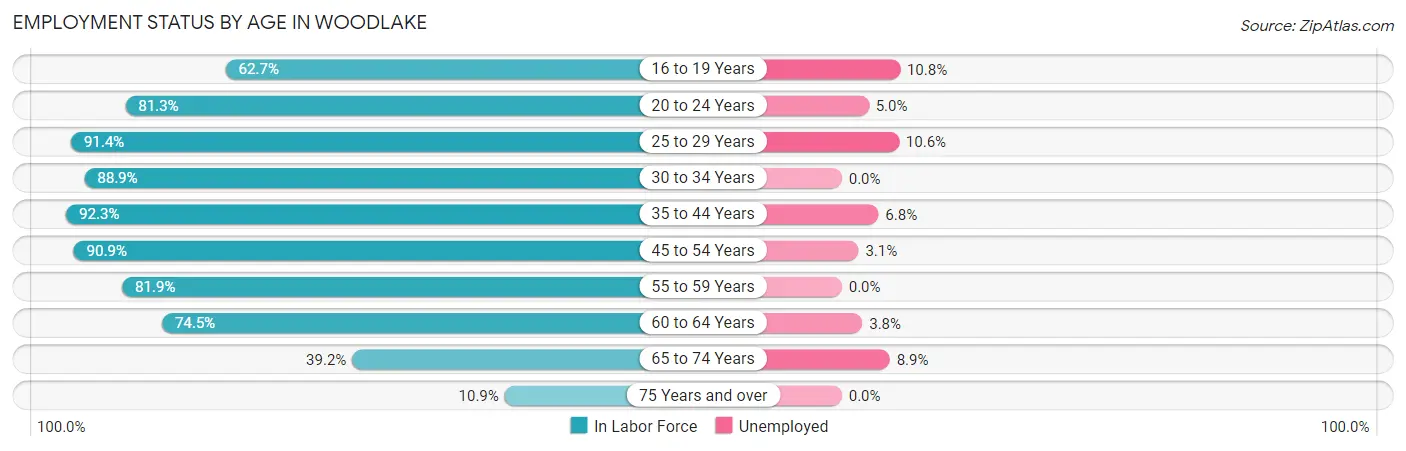
| Age Bracket | In Labor Force | Unemployed |
| 16 to 19 Years | 344 (62.7%) | 37 (10.8%) |
| 20 to 24 Years | 377 (81.3%) | 19 (5.0%) |
| 25 to 29 Years | 85 (91.4%) | 9 (10.6%) |
| 30 to 34 Years | 273 (88.9%) | 0 (0.0%) |
| 35 to 44 Years | 1,311 (92.3%) | 89 (6.8%) |
| 45 to 54 Years | 935 (90.9%) | 29 (3.1%) |
| 55 to 59 Years | 185 (81.9%) | 0 (0.0%) |
| 60 to 64 Years | 505 (74.5%) | 19 (3.8%) |
| 65 to 74 Years | 302 (39.2%) | 27 (8.9%) |
| 75 Years and over | 41 (10.9%) | 0 (0.0%) |
| Total | 4,358 (73.7%) | 231 (5.3%) |
Employment Status by Educational Attainment in Woodlake
According to labor force statistics for Woodlake, 87.7% of individuals (3,291) out of the total population between 25 and 64 years of age (3,753) are in the labor force, with 4.4% or 145 of them being unemployed. The group with the highest labor force participation rate are those with the educational attainment of bachelor's degree or higher, with 91.5% or 2,146 individuals in the labor force. Within the labor force, individuals with high school diploma education have the highest percentage of unemployment, with 10.2% or 30 of them being unemployed.
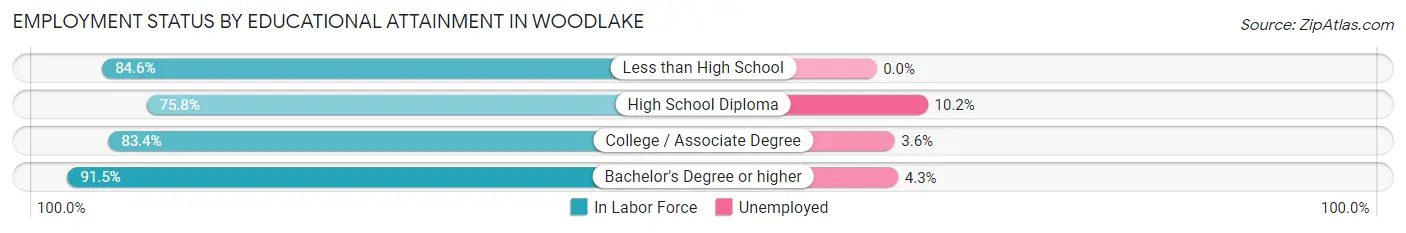
| Educational Attainment | In Labor Force | Unemployed |
| Less than High School | 181 (84.6%) | 0 (0.0%) |
| High School Diploma | 295 (75.8%) | 40 (10.2%) |
| College / Associate Degree | 671 (83.4%) | 29 (3.6%) |
| Bachelor's Degree or higher | 2,146 (91.5%) | 101 (4.3%) |
| Total | 3,291 (87.7%) | 165 (4.4%) |
Employment Occupations by Sex in Woodlake
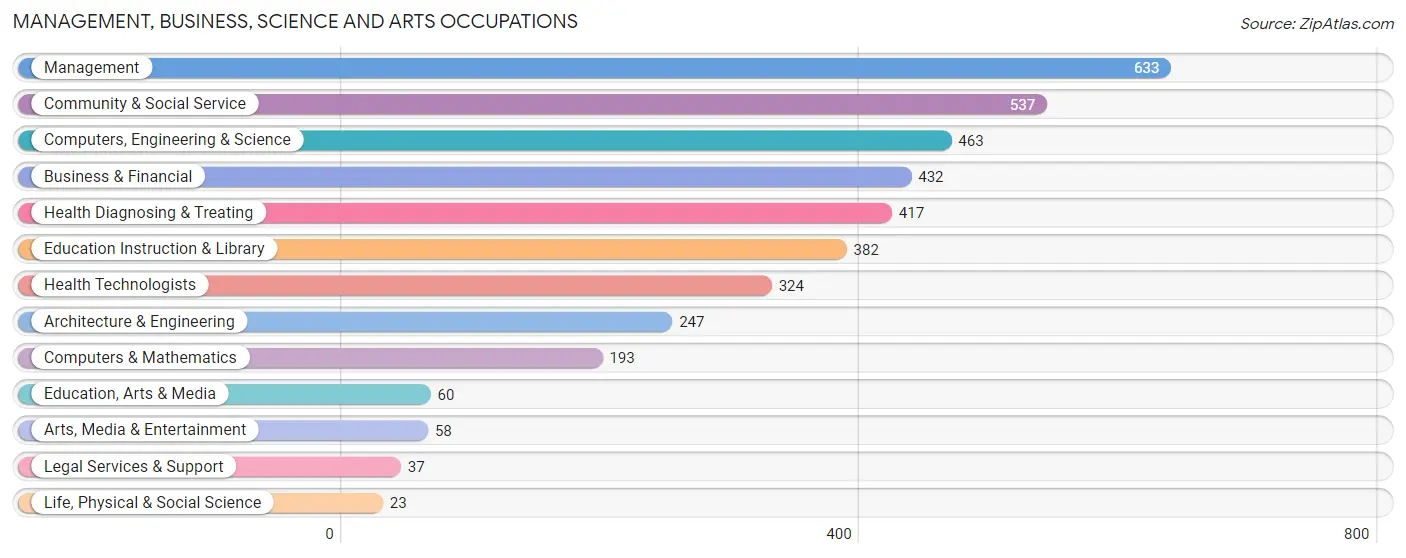
Management, Business, Science and Arts Occupations
The most common Management, Business, Science and Arts occupations in Woodlake are Management (633 | 15.4%), Community & Social Service (537 | 13.1%), Computers, Engineering & Science (463 | 11.3%), Business & Financial (432 | 10.5%), and Health Diagnosing & Treating (417 | 10.2%).
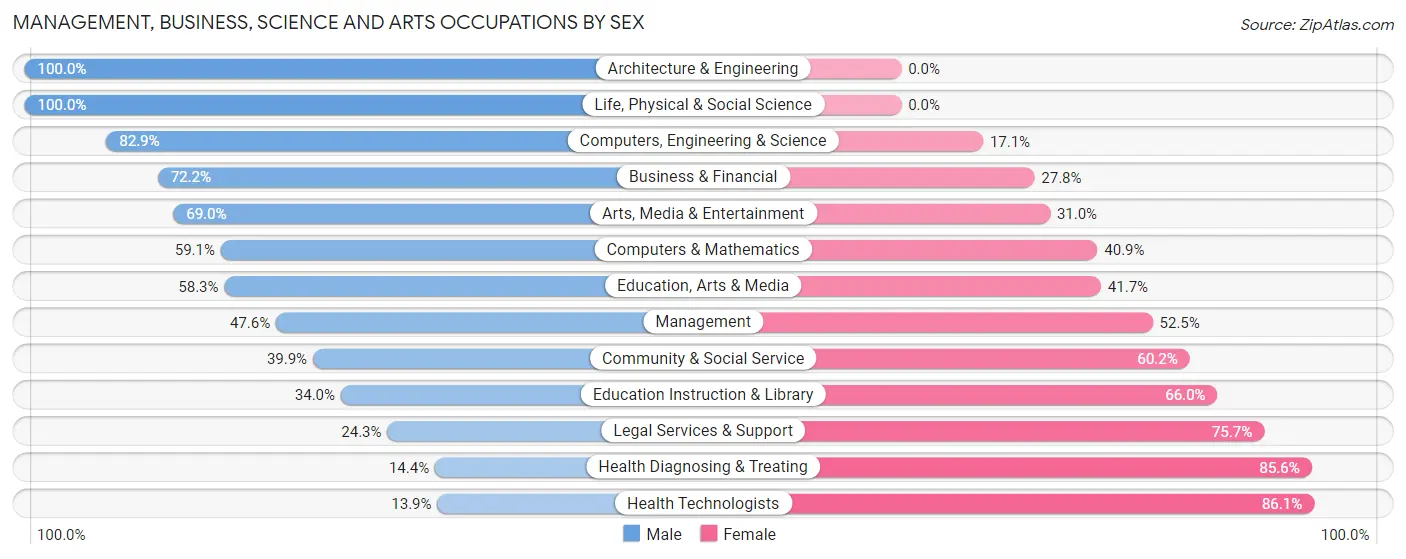
Management, Business, Science and Arts Occupations by Sex
Within the Management, Business, Science and Arts occupations in Woodlake, the most male-oriented occupations are Architecture & Engineering (100.0%), Life, Physical & Social Science (100.0%), and Computers, Engineering & Science (82.9%), while the most female-oriented occupations are Health Technologists (86.1%), Health Diagnosing & Treating (85.6%), and Legal Services & Support (75.7%).
| Occupation | Male | Female |
| Management | 301 (47.5%) | 332 (52.4%) |
| Business & Financial | 312 (72.2%) | 120 (27.8%) |
| Computers, Engineering & Science | 384 (82.9%) | 79 (17.1%) |
| Computers & Mathematics | 114 (59.1%) | 79 (40.9%) |
| Architecture & Engineering | 247 (100.0%) | 0 (0.0%) |
| Life, Physical & Social Science | 23 (100.0%) | 0 (0.0%) |
| Community & Social Service | 214 (39.9%) | 323 (60.2%) |
| Education, Arts & Media | 35 (58.3%) | 25 (41.7%) |
| Legal Services & Support | 9 (24.3%) | 28 (75.7%) |
| Education Instruction & Library | 130 (34.0%) | 252 (66.0%) |
| Arts, Media & Entertainment | 40 (69.0%) | 18 (31.0%) |
| Health Diagnosing & Treating | 60 (14.4%) | 357 (85.6%) |
| Health Technologists | 45 (13.9%) | 279 (86.1%) |
| Total (Category) | 1,271 (51.2%) | 1,211 (48.8%) |
| Total (Overall) | 2,298 (55.9%) | 1,810 (44.1%) |
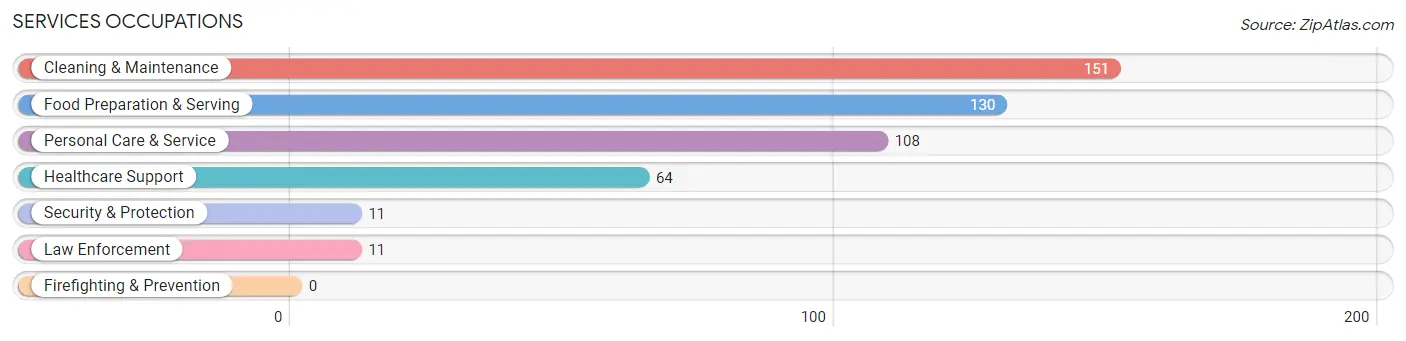
Services Occupations
The most common Services occupations in Woodlake are Cleaning & Maintenance (151 | 3.7%), Food Preparation & Serving (130 | 3.2%), Personal Care & Service (108 | 2.6%), Healthcare Support (64 | 1.6%), and Security & Protection (11 | 0.3%).
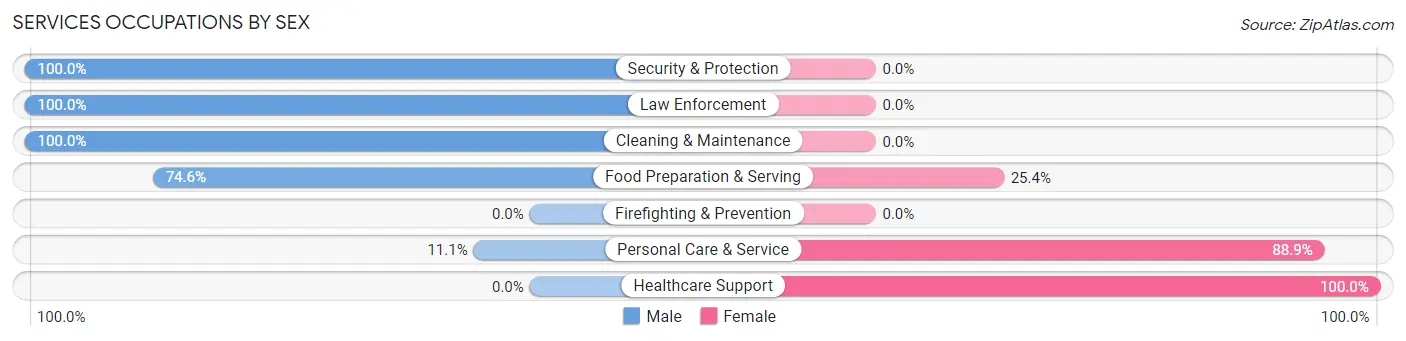
Services Occupations by Sex
Within the Services occupations in Woodlake, the most male-oriented occupations are Security & Protection (100.0%), Law Enforcement (100.0%), and Cleaning & Maintenance (100.0%), while the most female-oriented occupations are Healthcare Support (100.0%), Personal Care & Service (88.9%), and Food Preparation & Serving (25.4%).
| Occupation | Male | Female |
| Healthcare Support | 0 (0.0%) | 64 (100.0%) |
| Security & Protection | 11 (100.0%) | 0 (0.0%) |
| Firefighting & Prevention | 0 (0.0%) | 0 (0.0%) |
| Law Enforcement | 11 (100.0%) | 0 (0.0%) |
| Food Preparation & Serving | 97 (74.6%) | 33 (25.4%) |
| Cleaning & Maintenance | 151 (100.0%) | 0 (0.0%) |
| Personal Care & Service | 12 (11.1%) | 96 (88.9%) |
| Total (Category) | 271 (58.4%) | 193 (41.6%) |
| Total (Overall) | 2,298 (55.9%) | 1,810 (44.1%) |
Sales and Office Occupations
The most common Sales and Office occupations in Woodlake are Sales & Related (374 | 9.1%), and Office & Administration (300 | 7.3%).
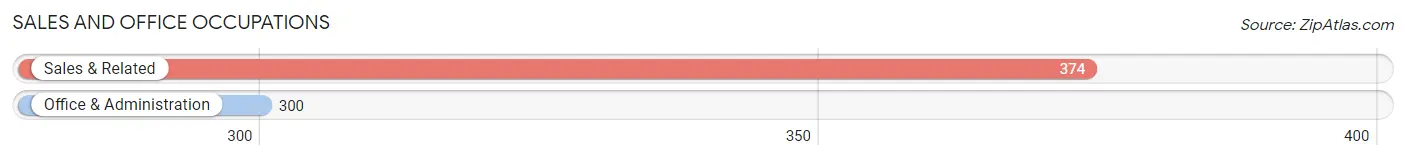
Sales and Office Occupations by Sex
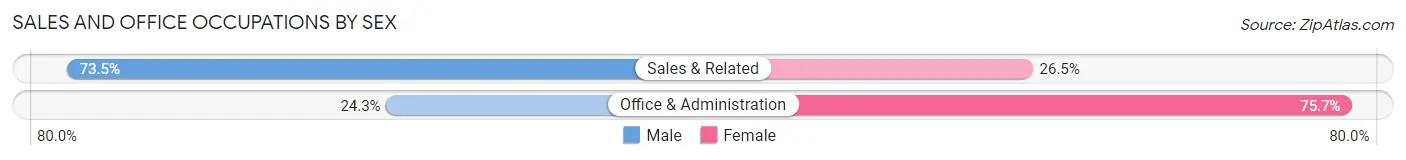
| Occupation | Male | Female |
| Sales & Related | 275 (73.5%) | 99 (26.5%) |
| Office & Administration | 73 (24.3%) | 227 (75.7%) |
| Total (Category) | 348 (51.6%) | 326 (48.4%) |
| Total (Overall) | 2,298 (55.9%) | 1,810 (44.1%) |
Natural Resources, Construction and Maintenance Occupations
The most common Natural Resources, Construction and Maintenance occupations in Woodlake are Construction & Extraction (172 | 4.2%), and Installation, Maintenance & Repair (57 | 1.4%).
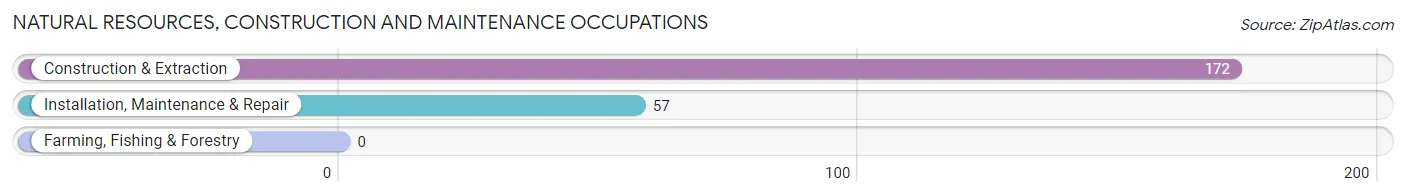
Natural Resources, Construction and Maintenance Occupations by Sex
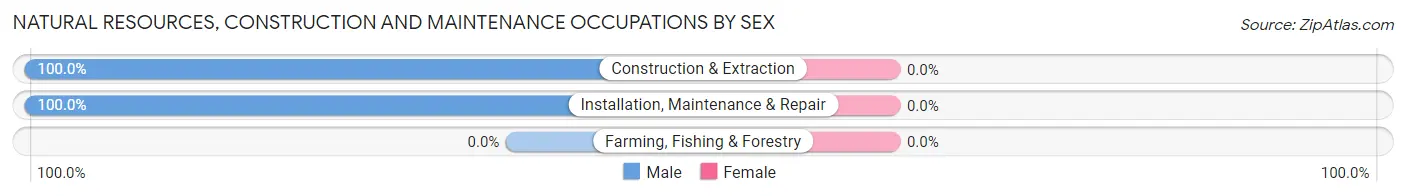
| Occupation | Male | Female |
| Farming, Fishing & Forestry | 0 (0.0%) | 0 (0.0%) |
| Construction & Extraction | 172 (100.0%) | 0 (0.0%) |
| Installation, Maintenance & Repair | 57 (100.0%) | 0 (0.0%) |
| Total (Category) | 229 (100.0%) | 0 (0.0%) |
| Total (Overall) | 2,298 (55.9%) | 1,810 (44.1%) |
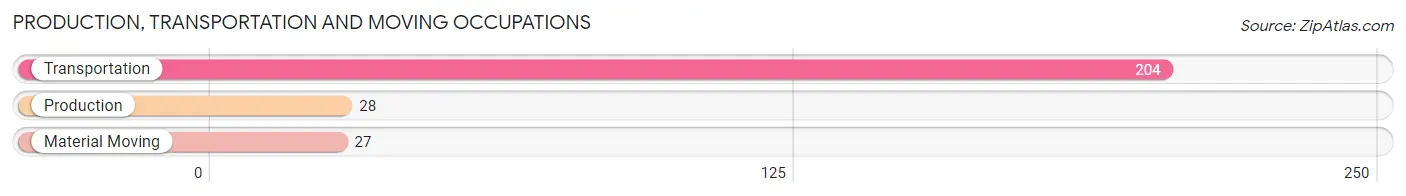
Production, Transportation and Moving Occupations
The most common Production, Transportation and Moving occupations in Woodlake are Transportation (204 | 5.0%), Production (28 | 0.7%), and Material Moving (27 | 0.7%).
Production, Transportation and Moving Occupations by Sex
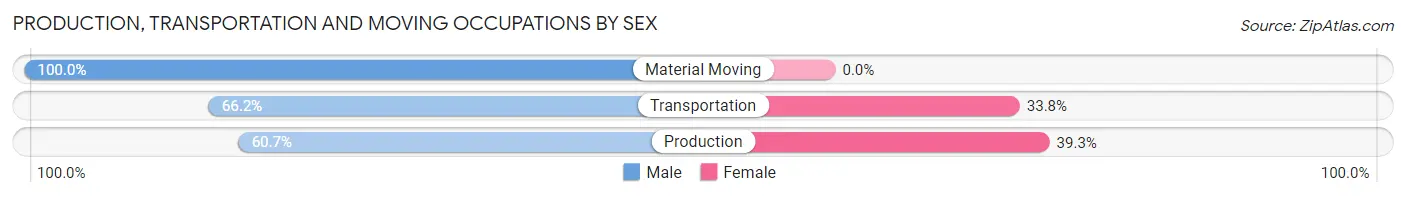
| Occupation | Male | Female |
| Production | 17 (60.7%) | 11 (39.3%) |
| Transportation | 135 (66.2%) | 69 (33.8%) |
| Material Moving | 27 (100.0%) | 0 (0.0%) |
| Total (Category) | 179 (69.1%) | 80 (30.9%) |
| Total (Overall) | 2,298 (55.9%) | 1,810 (44.1%) |
Employment Industries by Sex in Woodlake
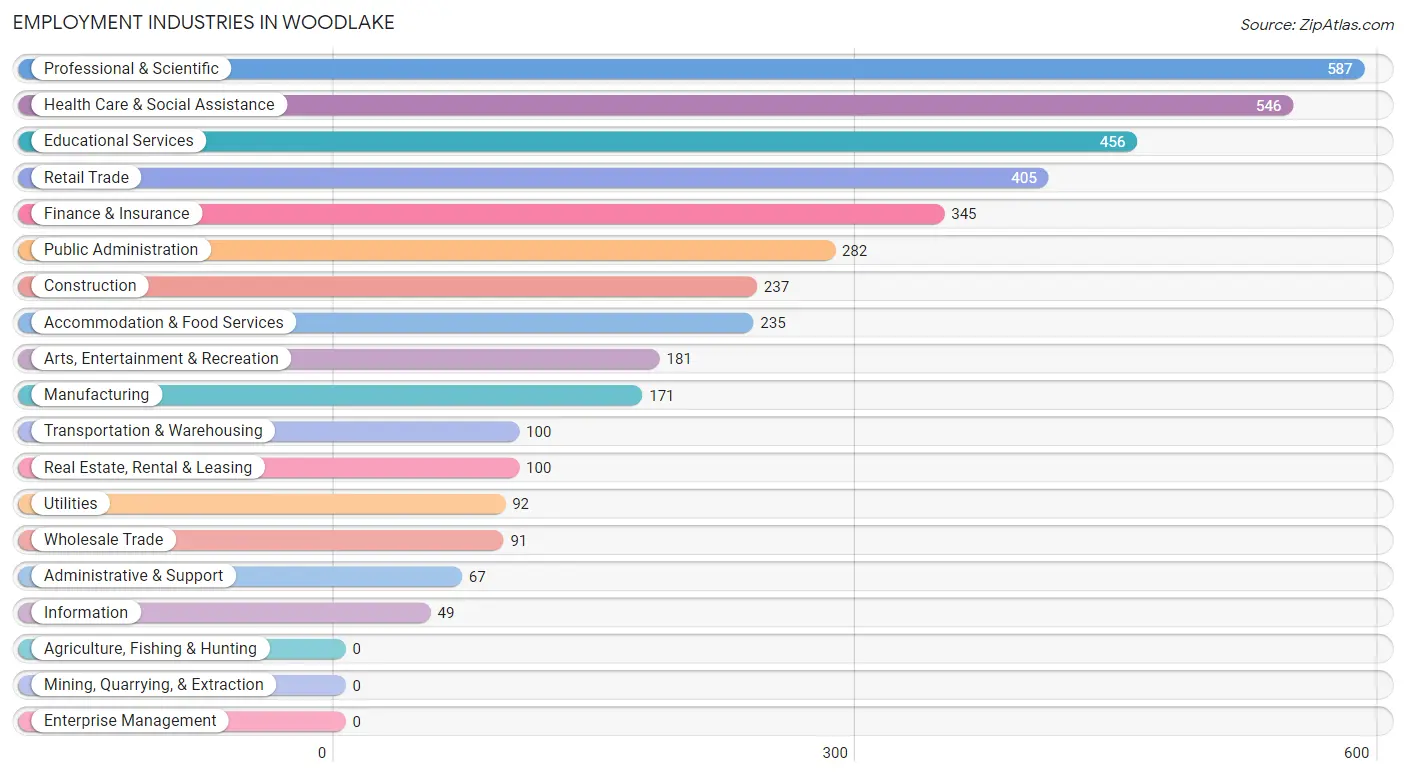
Employment Industries in Woodlake
The major employment industries in Woodlake include Professional & Scientific (587 | 14.3%), Health Care & Social Assistance (546 | 13.3%), Educational Services (456 | 11.1%), Retail Trade (405 | 9.9%), and Finance & Insurance (345 | 8.4%).
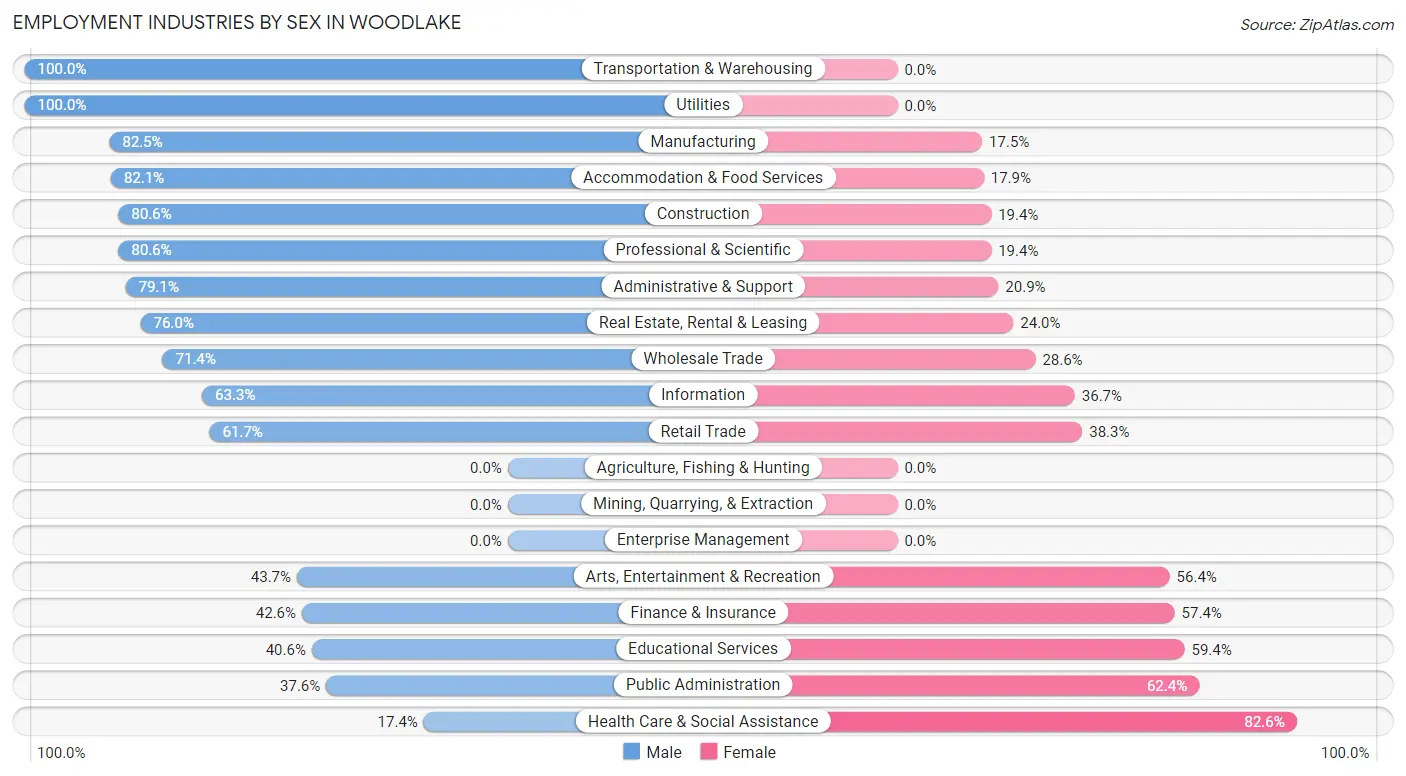
Employment Industries by Sex in Woodlake
The Woodlake industries that see more men than women are Transportation & Warehousing (100.0%), Utilities (100.0%), and Manufacturing (82.5%), whereas the industries that tend to have a higher number of women are Health Care & Social Assistance (82.6%), Public Administration (62.4%), and Educational Services (59.4%).
| Industry | Male | Female |
| Agriculture, Fishing & Hunting | 0 (0.0%) | 0 (0.0%) |
| Mining, Quarrying, & Extraction | 0 (0.0%) | 0 (0.0%) |
| Construction | 191 (80.6%) | 46 (19.4%) |
| Manufacturing | 141 (82.5%) | 30 (17.5%) |
| Wholesale Trade | 65 (71.4%) | 26 (28.6%) |
| Retail Trade | 250 (61.7%) | 155 (38.3%) |
| Transportation & Warehousing | 100 (100.0%) | 0 (0.0%) |
| Utilities | 92 (100.0%) | 0 (0.0%) |
| Information | 31 (63.3%) | 18 (36.7%) |
| Finance & Insurance | 147 (42.6%) | 198 (57.4%) |
| Real Estate, Rental & Leasing | 76 (76.0%) | 24 (24.0%) |
| Professional & Scientific | 473 (80.6%) | 114 (19.4%) |
| Enterprise Management | 0 (0.0%) | 0 (0.0%) |
| Administrative & Support | 53 (79.1%) | 14 (20.9%) |
| Educational Services | 185 (40.6%) | 271 (59.4%) |
| Health Care & Social Assistance | 95 (17.4%) | 451 (82.6%) |
| Arts, Entertainment & Recreation | 79 (43.6%) | 102 (56.4%) |
| Accommodation & Food Services | 193 (82.1%) | 42 (17.9%) |
| Public Administration | 106 (37.6%) | 176 (62.4%) |
| Total | 2,298 (55.9%) | 1,810 (44.1%) |
Education in Woodlake
School Enrollment in Woodlake
The most common levels of schooling among the 2,134 students in Woodlake are high school (685 | 32.1%), middle school (508 | 23.8%), and elementary school (465 | 21.8%).
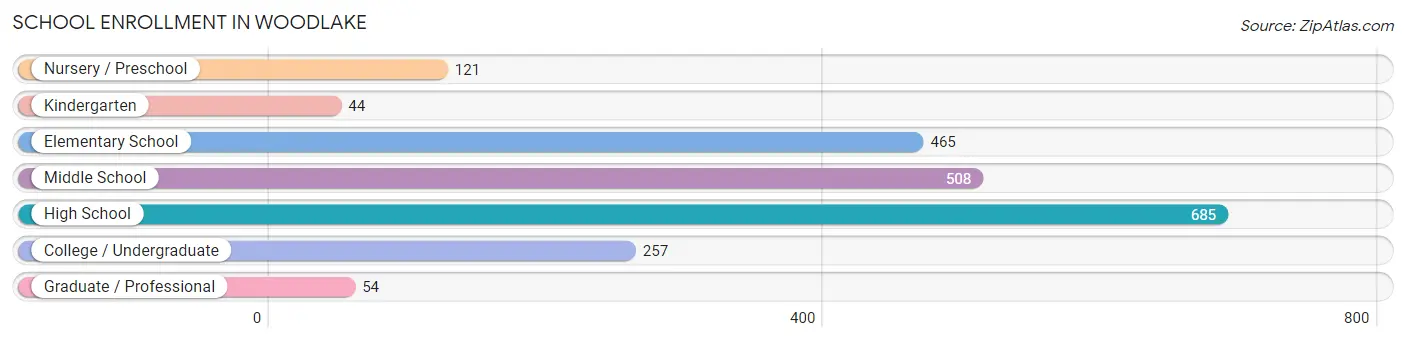
| School Level | # Students | % Students |
| Nursery / Preschool | 121 | 5.7% |
| Kindergarten | 44 | 2.1% |
| Elementary School | 465 | 21.8% |
| Middle School | 508 | 23.8% |
| High School | 685 | 32.1% |
| College / Undergraduate | 257 | 12.0% |
| Graduate / Professional | 54 | 2.5% |
| Total | 2,134 | 100.0% |
School Enrollment by Age by Funding Source in Woodlake
Out of a total of 2,134 students who are enrolled in schools in Woodlake, 262 (12.3%) attend a private institution, while the remaining 1,872 (87.7%) are enrolled in public schools. The age group of 3 to 4 year olds has the highest likelihood of being enrolled in private schools, with 74 (84.1% in the age bracket) enrolled. Conversely, the age group of 15 to 17 year olds has the lowest likelihood of being enrolled in a private school, with 341 (100.0% in the age bracket) attending a public institution.
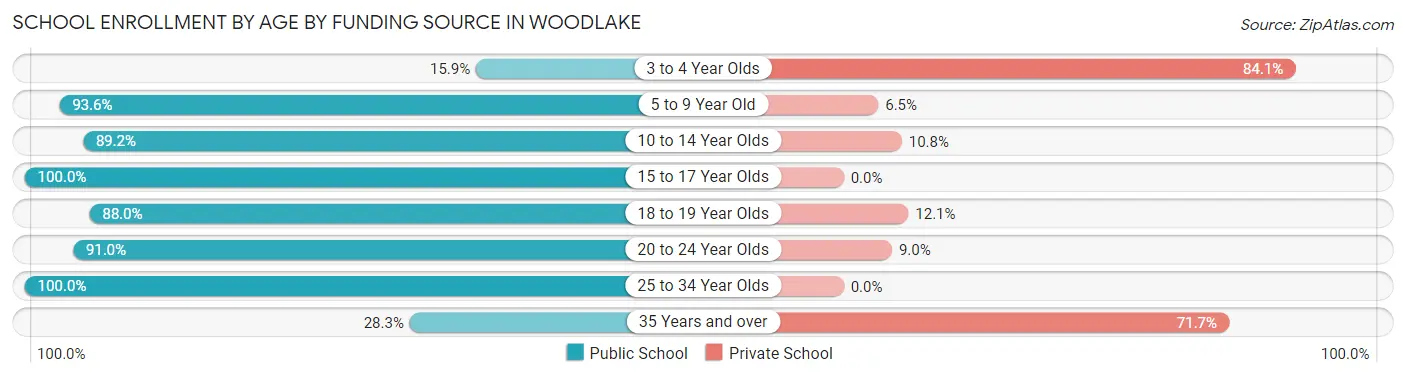
| Age Bracket | Public School | Private School |
| 3 to 4 Year Olds | 14 (15.9%) | 74 (84.1%) |
| 5 to 9 Year Old | 479 (93.5%) | 33 (6.5%) |
| 10 to 14 Year Olds | 527 (89.2%) | 64 (10.8%) |
| 15 to 17 Year Olds | 341 (100.0%) | 0 (0.0%) |
| 18 to 19 Year Olds | 292 (87.9%) | 40 (12.0%) |
| 20 to 24 Year Olds | 182 (91.0%) | 18 (9.0%) |
| 25 to 34 Year Olds | 24 (100.0%) | 0 (0.0%) |
| 35 Years and over | 13 (28.3%) | 33 (71.7%) |
| Total | 1,872 (87.7%) | 262 (12.3%) |
Educational Attainment by Field of Study in Woodlake
Business (511 | 16.0%), education (404 | 12.7%), bio, nature & agricultural (342 | 10.7%), psychology (296 | 9.3%), and engineering (271 | 8.5%) are the most common fields of study among 3,191 individuals in Woodlake who have obtained a bachelor's degree or higher.
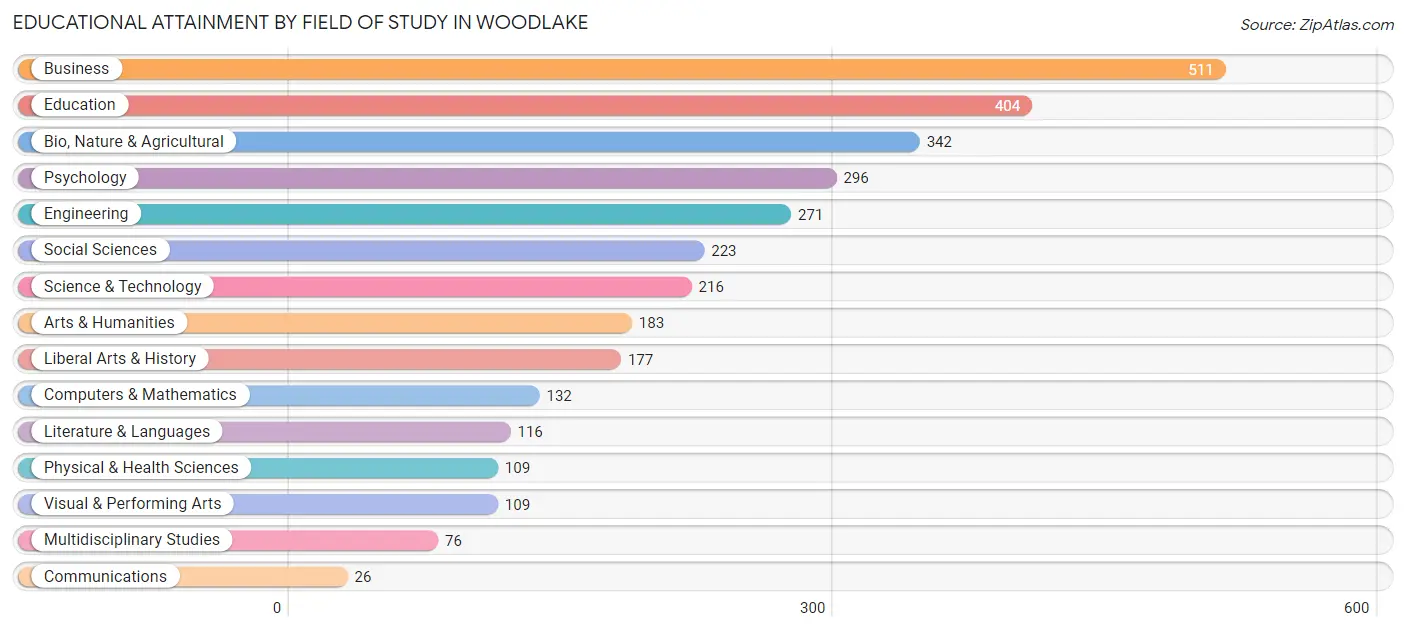
| Field of Study | # Graduates | % Graduates |
| Computers & Mathematics | 132 | 4.1% |
| Bio, Nature & Agricultural | 342 | 10.7% |
| Physical & Health Sciences | 109 | 3.4% |
| Psychology | 296 | 9.3% |
| Social Sciences | 223 | 7.0% |
| Engineering | 271 | 8.5% |
| Multidisciplinary Studies | 76 | 2.4% |
| Science & Technology | 216 | 6.8% |
| Business | 511 | 16.0% |
| Education | 404 | 12.7% |
| Literature & Languages | 116 | 3.6% |
| Liberal Arts & History | 177 | 5.6% |
| Visual & Performing Arts | 109 | 3.4% |
| Communications | 26 | 0.8% |
| Arts & Humanities | 183 | 5.7% |
| Total | 3,191 | 100.0% |
Transportation & Commute in Woodlake
Vehicle Availability by Sex in Woodlake
The most prevalent vehicle ownership categories in Woodlake are males with 2 vehicles (842, accounting for 38.0%) and females with 2 vehicles (620, making up 48.4%).
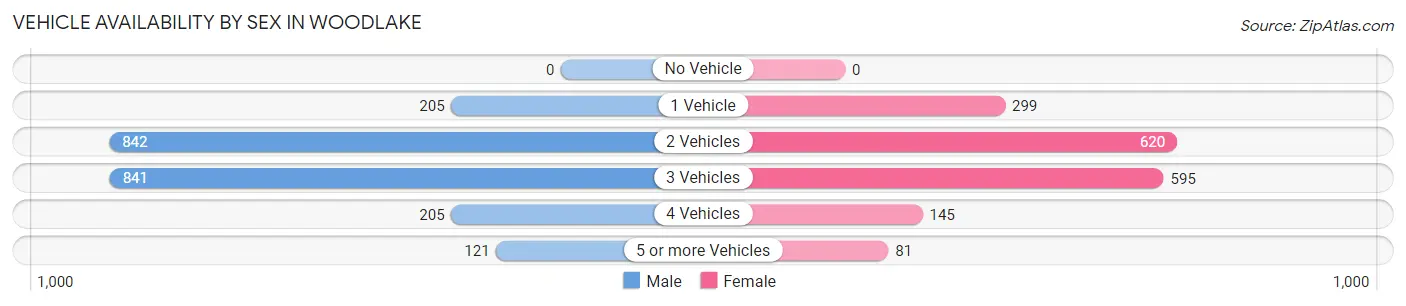
| Vehicles Available | Male | Female |
| No Vehicle | 0 (0.0%) | 0 (0.0%) |
| 1 Vehicle | 205 (9.3%) | 299 (17.2%) |
| 2 Vehicles | 842 (38.0%) | 620 (35.6%) |
| 3 Vehicles | 841 (38.0%) | 595 (34.2%) |
| 4 Vehicles | 205 (9.3%) | 145 (8.3%) |
| 5 or more Vehicles | 121 (5.5%) | 81 (4.7%) |
| Total | 2,214 (100.0%) | 1,740 (100.0%) |
Commute Time in Woodlake
The most frequently occuring commute durations in Woodlake are 30 to 34 minutes (755 commuters, 22.2%), 20 to 24 minutes (688 commuters, 20.3%), and 25 to 29 minutes (409 commuters, 12.0%).
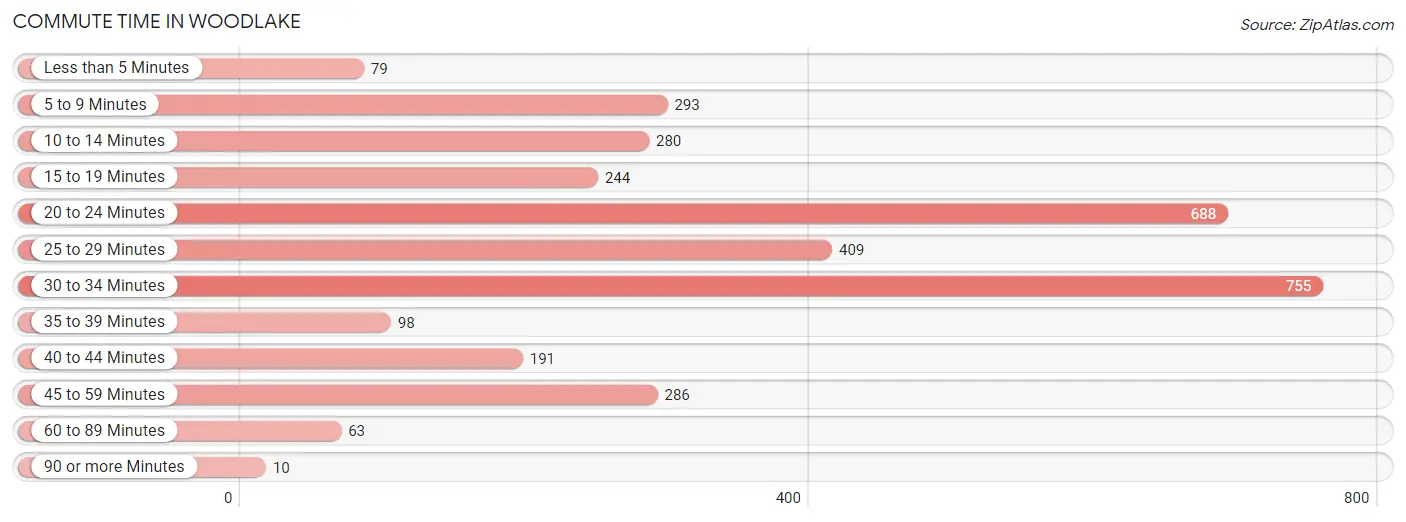
| Commute Time | # Commuters | % Commuters |
| Less than 5 Minutes | 79 | 2.3% |
| 5 to 9 Minutes | 293 | 8.6% |
| 10 to 14 Minutes | 280 | 8.2% |
| 15 to 19 Minutes | 244 | 7.2% |
| 20 to 24 Minutes | 688 | 20.3% |
| 25 to 29 Minutes | 409 | 12.0% |
| 30 to 34 Minutes | 755 | 22.2% |
| 35 to 39 Minutes | 98 | 2.9% |
| 40 to 44 Minutes | 191 | 5.6% |
| 45 to 59 Minutes | 286 | 8.4% |
| 60 to 89 Minutes | 63 | 1.9% |
| 90 or more Minutes | 10 | 0.3% |
Commute Time by Sex in Woodlake
The most common commute times in Woodlake are 20 to 24 minutes (488 commuters, 25.8%) for males and 30 to 34 minutes (401 commuters, 26.6%) for females.
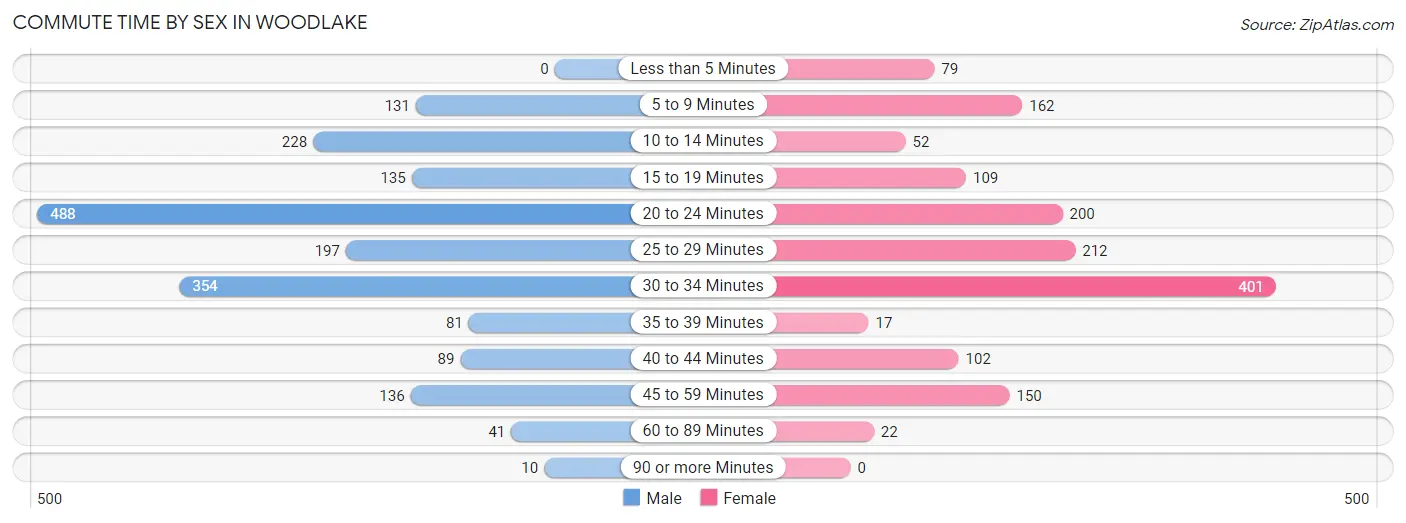
| Commute Time | Male | Female |
| Less than 5 Minutes | 0 (0.0%) | 79 (5.2%) |
| 5 to 9 Minutes | 131 (6.9%) | 162 (10.8%) |
| 10 to 14 Minutes | 228 (12.1%) | 52 (3.5%) |
| 15 to 19 Minutes | 135 (7.1%) | 109 (7.2%) |
| 20 to 24 Minutes | 488 (25.8%) | 200 (13.3%) |
| 25 to 29 Minutes | 197 (10.4%) | 212 (14.1%) |
| 30 to 34 Minutes | 354 (18.7%) | 401 (26.6%) |
| 35 to 39 Minutes | 81 (4.3%) | 17 (1.1%) |
| 40 to 44 Minutes | 89 (4.7%) | 102 (6.8%) |
| 45 to 59 Minutes | 136 (7.2%) | 150 (10.0%) |
| 60 to 89 Minutes | 41 (2.2%) | 22 (1.5%) |
| 90 or more Minutes | 10 (0.5%) | 0 (0.0%) |
Time of Departure to Work by Sex in Woodlake
The most frequent times of departure to work in Woodlake are 7:00 AM to 7:29 AM (411, 21.7%) for males and 7:30 AM to 7:59 AM (247, 16.4%) for females.
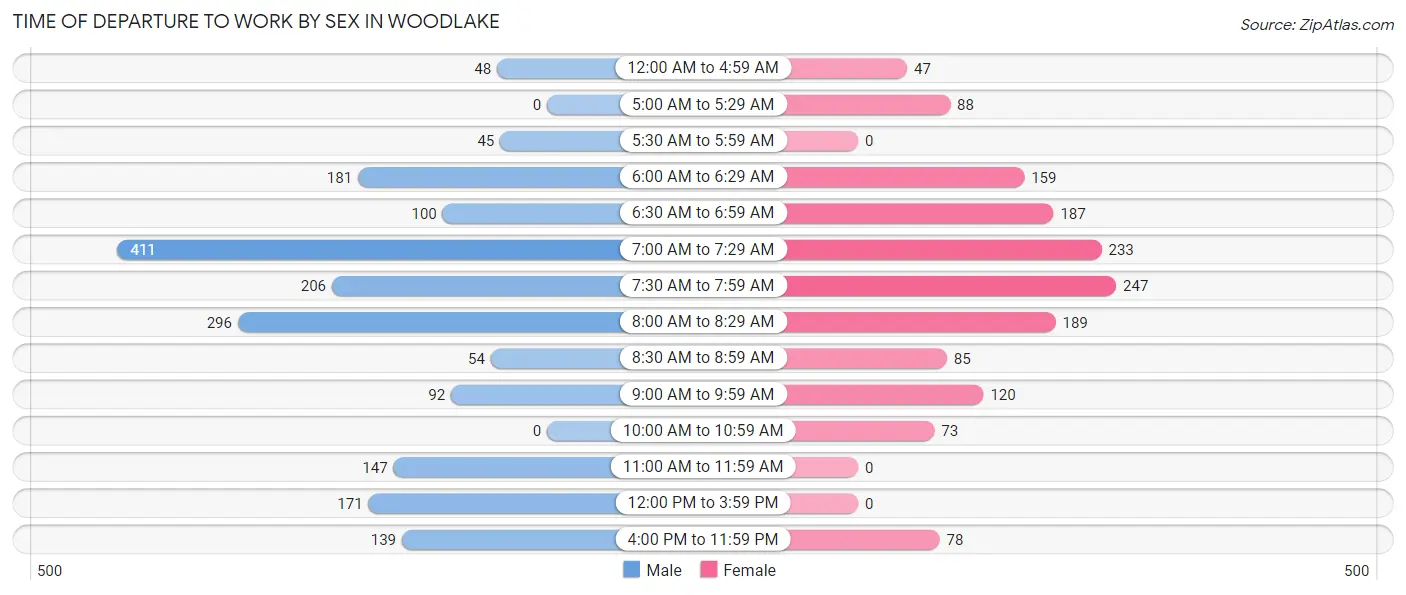
| Time of Departure | Male | Female |
| 12:00 AM to 4:59 AM | 48 (2.5%) | 47 (3.1%) |
| 5:00 AM to 5:29 AM | 0 (0.0%) | 88 (5.8%) |
| 5:30 AM to 5:59 AM | 45 (2.4%) | 0 (0.0%) |
| 6:00 AM to 6:29 AM | 181 (9.6%) | 159 (10.6%) |
| 6:30 AM to 6:59 AM | 100 (5.3%) | 187 (12.4%) |
| 7:00 AM to 7:29 AM | 411 (21.7%) | 233 (15.5%) |
| 7:30 AM to 7:59 AM | 206 (10.9%) | 247 (16.4%) |
| 8:00 AM to 8:29 AM | 296 (15.7%) | 189 (12.6%) |
| 8:30 AM to 8:59 AM | 54 (2.9%) | 85 (5.6%) |
| 9:00 AM to 9:59 AM | 92 (4.9%) | 120 (8.0%) |
| 10:00 AM to 10:59 AM | 0 (0.0%) | 73 (4.9%) |
| 11:00 AM to 11:59 AM | 147 (7.8%) | 0 (0.0%) |
| 12:00 PM to 3:59 PM | 171 (9.0%) | 0 (0.0%) |
| 4:00 PM to 11:59 PM | 139 (7.3%) | 78 (5.2%) |
| Total | 1,890 (100.0%) | 1,506 (100.0%) |
Housing Occupancy in Woodlake
Occupancy by Ownership in Woodlake
Of the total 2,717 dwellings in Woodlake, owner-occupied units account for 2,234 (82.2%), while renter-occupied units make up 483 (17.8%).
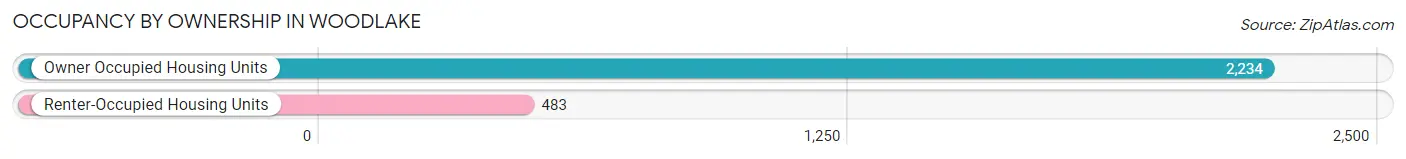
| Occupancy | # Housing Units | % Housing Units |
| Owner Occupied Housing Units | 2,234 | 82.2% |
| Renter-Occupied Housing Units | 483 | 17.8% |
| Total Occupied Housing Units | 2,717 | 100.0% |
Occupancy by Household Size in Woodlake
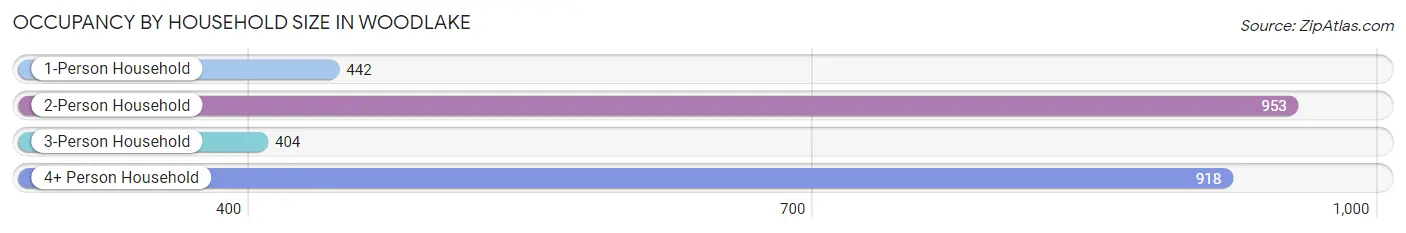
| Household Size | # Housing Units | % Housing Units |
| 1-Person Household | 442 | 16.3% |
| 2-Person Household | 953 | 35.1% |
| 3-Person Household | 404 | 14.9% |
| 4+ Person Household | 918 | 33.8% |
| Total Housing Units | 2,717 | 100.0% |
Occupancy by Ownership by Household Size in Woodlake
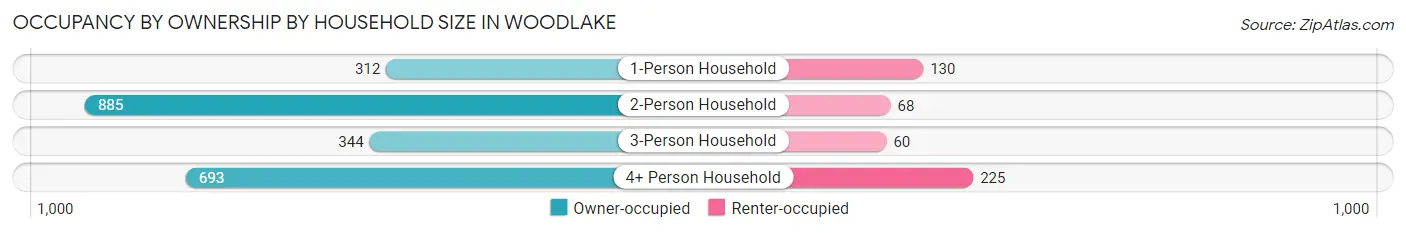
| Household Size | Owner-occupied | Renter-occupied |
| 1-Person Household | 312 (70.6%) | 130 (29.4%) |
| 2-Person Household | 885 (92.9%) | 68 (7.1%) |
| 3-Person Household | 344 (85.2%) | 60 (14.8%) |
| 4+ Person Household | 693 (75.5%) | 225 (24.5%) |
| Total Housing Units | 2,234 (82.2%) | 483 (17.8%) |
Occupancy by Educational Attainment in Woodlake
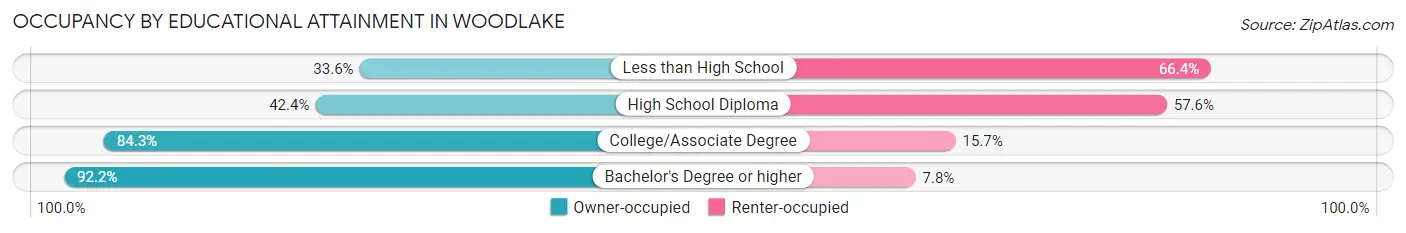
| Household Size | Owner-occupied | Renter-occupied |
| Less than High School | 39 (33.6%) | 77 (66.4%) |
| High School Diploma | 139 (42.4%) | 189 (57.6%) |
| College/Associate Degree | 418 (84.3%) | 78 (15.7%) |
| Bachelor's Degree or higher | 1,638 (92.2%) | 139 (7.8%) |
Occupancy by Age of Householder in Woodlake
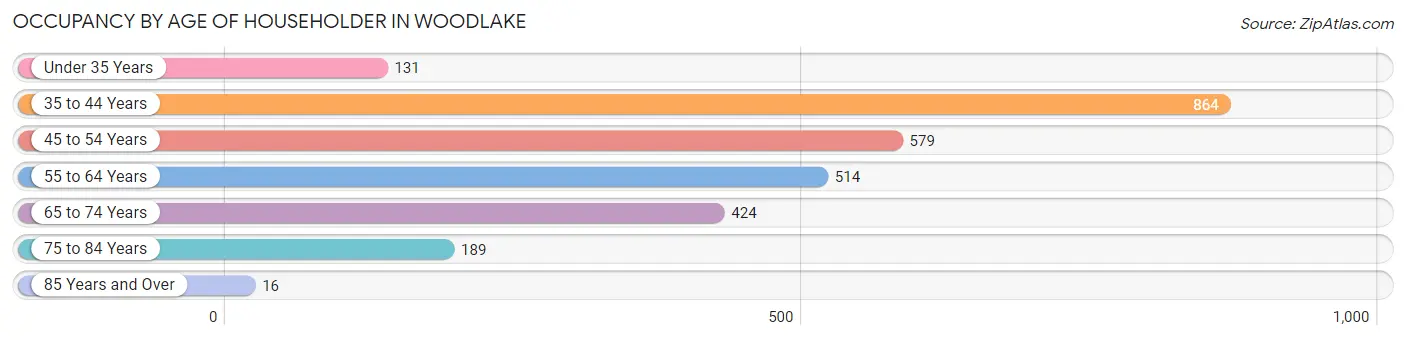
| Age Bracket | # Households | % Households |
| Under 35 Years | 131 | 4.8% |
| 35 to 44 Years | 864 | 31.8% |
| 45 to 54 Years | 579 | 21.3% |
| 55 to 64 Years | 514 | 18.9% |
| 65 to 74 Years | 424 | 15.6% |
| 75 to 84 Years | 189 | 7.0% |
| 85 Years and Over | 16 | 0.6% |
| Total | 2,717 | 100.0% |
Housing Finances in Woodlake
Median Income by Occupancy in Woodlake
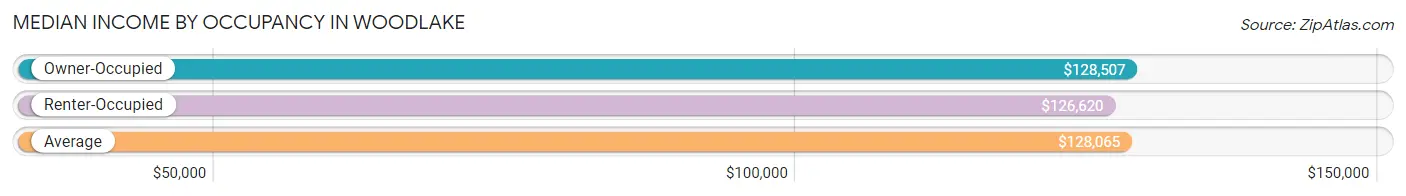
| Occupancy Type | # Households | Median Income |
| Owner-Occupied | 2,234 (82.2%) | $128,507 |
| Renter-Occupied | 483 (17.8%) | $126,620 |
| Average | 2,717 (100.0%) | $128,065 |
Occupancy by Householder Income Bracket in Woodlake
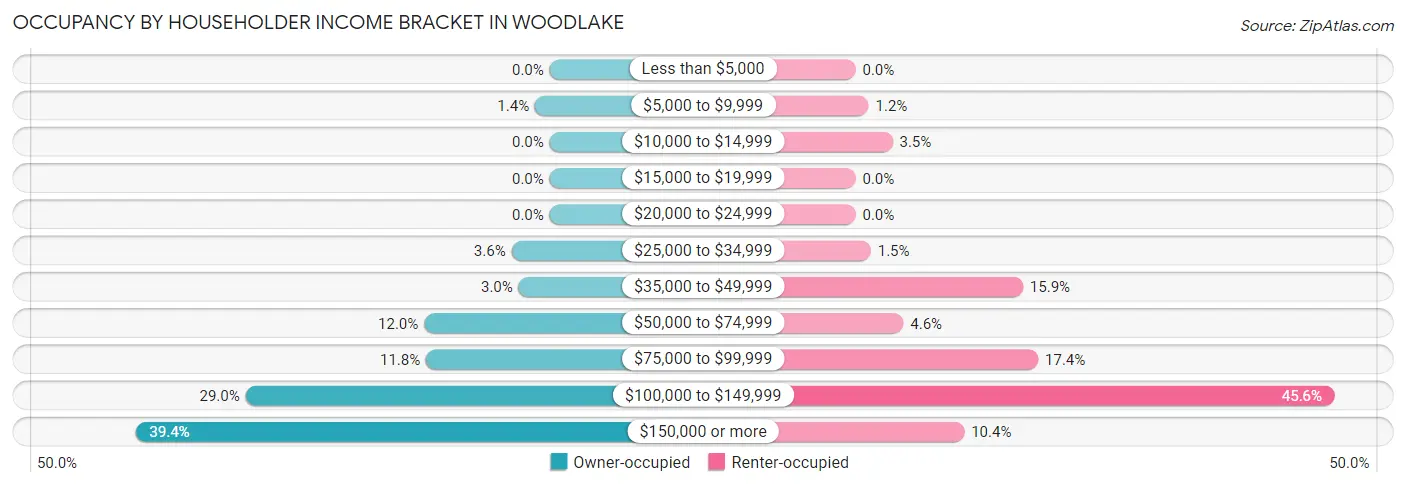
| Income Bracket | Owner-occupied | Renter-occupied |
| Less than $5,000 | 0 (0.0%) | 0 (0.0%) |
| $5,000 to $9,999 | 31 (1.4%) | 6 (1.2%) |
| $10,000 to $14,999 | 0 (0.0%) | 17 (3.5%) |
| $15,000 to $19,999 | 0 (0.0%) | 0 (0.0%) |
| $20,000 to $24,999 | 0 (0.0%) | 0 (0.0%) |
| $25,000 to $34,999 | 81 (3.6%) | 7 (1.5%) |
| $35,000 to $49,999 | 66 (2.9%) | 77 (15.9%) |
| $50,000 to $74,999 | 267 (11.9%) | 22 (4.5%) |
| $75,000 to $99,999 | 263 (11.8%) | 84 (17.4%) |
| $100,000 to $149,999 | 647 (29.0%) | 220 (45.6%) |
| $150,000 or more | 879 (39.4%) | 50 (10.3%) |
| Total | 2,234 (100.0%) | 483 (100.0%) |
Monthly Housing Cost Tiers in Woodlake
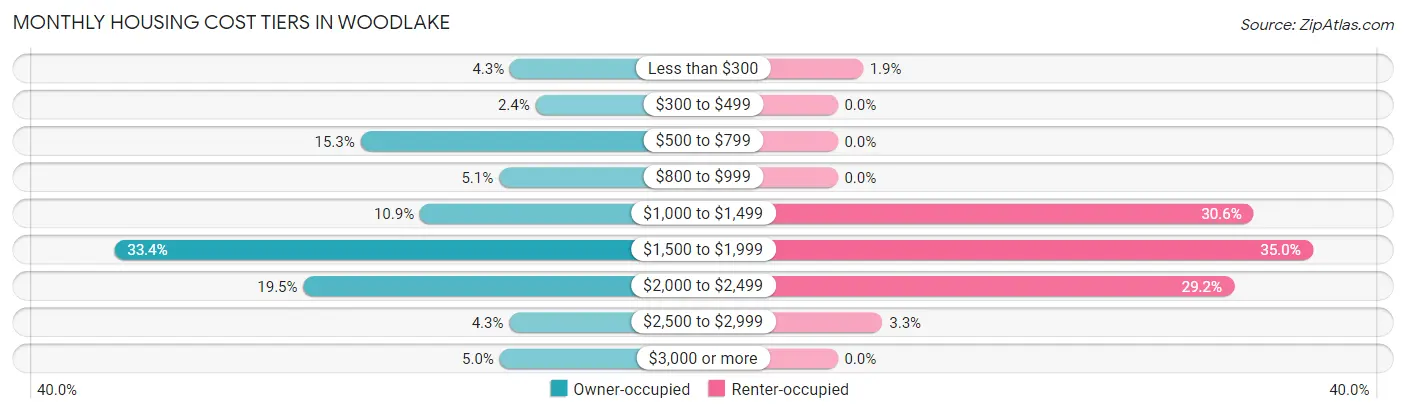
| Monthly Cost | Owner-occupied | Renter-occupied |
| Less than $300 | 95 (4.3%) | 9 (1.9%) |
| $300 to $499 | 53 (2.4%) | 0 (0.0%) |
| $500 to $799 | 341 (15.3%) | 0 (0.0%) |
| $800 to $999 | 113 (5.1%) | 0 (0.0%) |
| $1,000 to $1,499 | 243 (10.9%) | 148 (30.6%) |
| $1,500 to $1,999 | 746 (33.4%) | 169 (35.0%) |
| $2,000 to $2,499 | 435 (19.5%) | 141 (29.2%) |
| $2,500 to $2,999 | 96 (4.3%) | 16 (3.3%) |
| $3,000 or more | 112 (5.0%) | 0 (0.0%) |
| Total | 2,234 (100.0%) | 483 (100.0%) |
Physical Housing Characteristics in Woodlake
Housing Structures in Woodlake
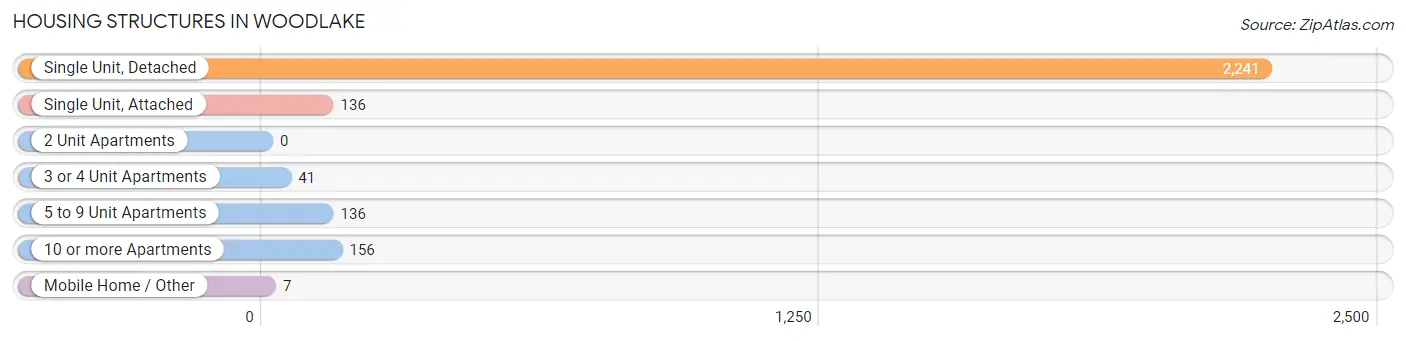
| Structure Type | # Housing Units | % Housing Units |
| Single Unit, Detached | 2,241 | 82.5% |
| Single Unit, Attached | 136 | 5.0% |
| 2 Unit Apartments | 0 | 0.0% |
| 3 or 4 Unit Apartments | 41 | 1.5% |
| 5 to 9 Unit Apartments | 136 | 5.0% |
| 10 or more Apartments | 156 | 5.7% |
| Mobile Home / Other | 7 | 0.3% |
| Total | 2,717 | 100.0% |
Housing Structures by Occupancy in Woodlake
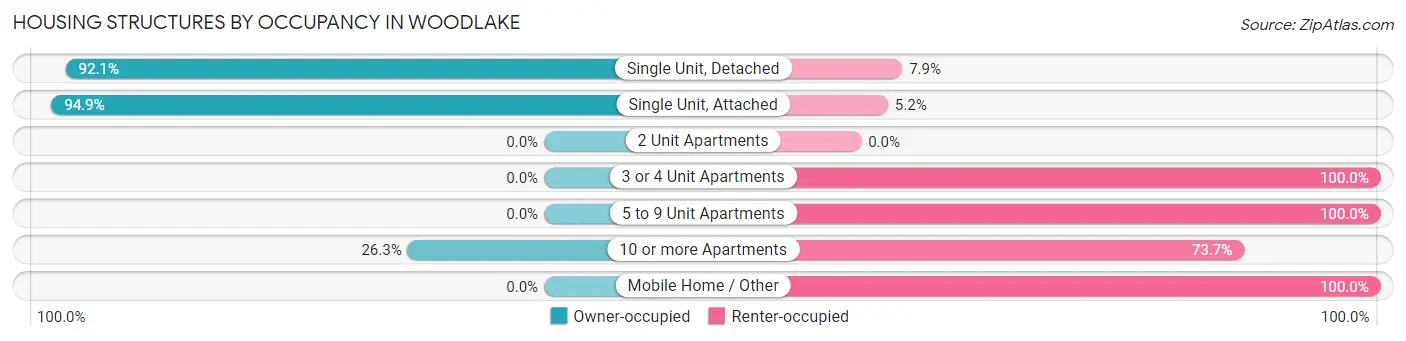
| Structure Type | Owner-occupied | Renter-occupied |
| Single Unit, Detached | 2,064 (92.1%) | 177 (7.9%) |
| Single Unit, Attached | 129 (94.9%) | 7 (5.1%) |
| 2 Unit Apartments | 0 (0.0%) | 0 (0.0%) |
| 3 or 4 Unit Apartments | 0 (0.0%) | 41 (100.0%) |
| 5 to 9 Unit Apartments | 0 (0.0%) | 136 (100.0%) |
| 10 or more Apartments | 41 (26.3%) | 115 (73.7%) |
| Mobile Home / Other | 0 (0.0%) | 7 (100.0%) |
| Total | 2,234 (82.2%) | 483 (17.8%) |
Housing Structures by Number of Rooms in Woodlake
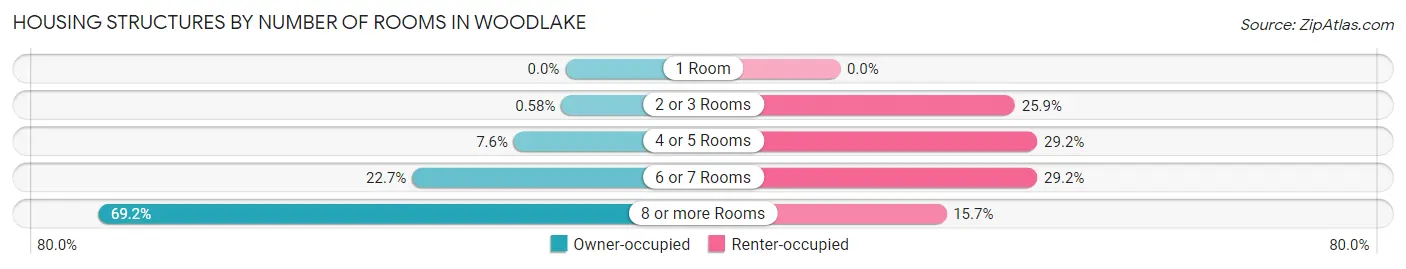
| Number of Rooms | Owner-occupied | Renter-occupied |
| 1 Room | 0 (0.0%) | 0 (0.0%) |
| 2 or 3 Rooms | 13 (0.6%) | 125 (25.9%) |
| 4 or 5 Rooms | 170 (7.6%) | 141 (29.2%) |
| 6 or 7 Rooms | 506 (22.7%) | 141 (29.2%) |
| 8 or more Rooms | 1,545 (69.2%) | 76 (15.7%) |
| Total | 2,234 (100.0%) | 483 (100.0%) |
Housing Structure by Heating Type in Woodlake
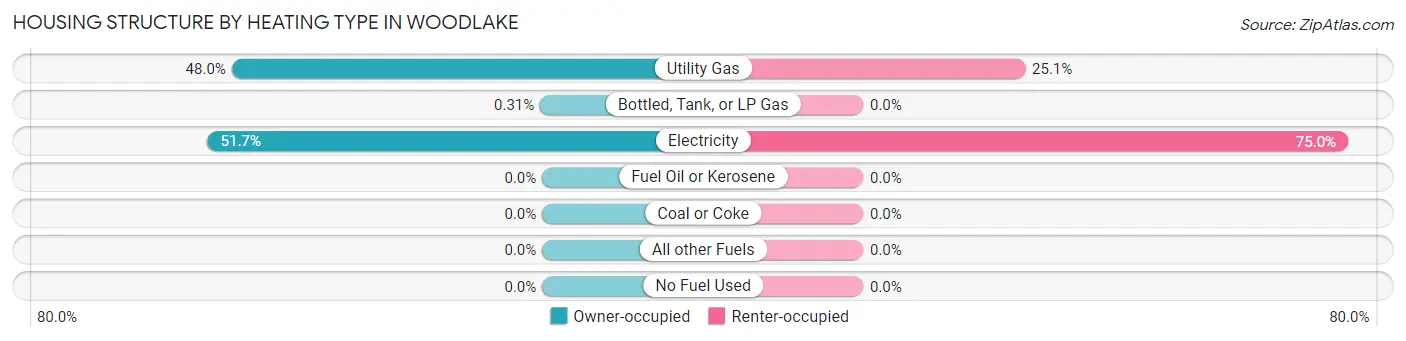
| Heating Type | Owner-occupied | Renter-occupied |
| Utility Gas | 1,072 (48.0%) | 121 (25.1%) |
| Bottled, Tank, or LP Gas | 7 (0.3%) | 0 (0.0%) |
| Electricity | 1,155 (51.7%) | 362 (75.0%) |
| Fuel Oil or Kerosene | 0 (0.0%) | 0 (0.0%) |
| Coal or Coke | 0 (0.0%) | 0 (0.0%) |
| All other Fuels | 0 (0.0%) | 0 (0.0%) |
| No Fuel Used | 0 (0.0%) | 0 (0.0%) |
| Total | 2,234 (100.0%) | 483 (100.0%) |
Household Vehicle Usage in Woodlake
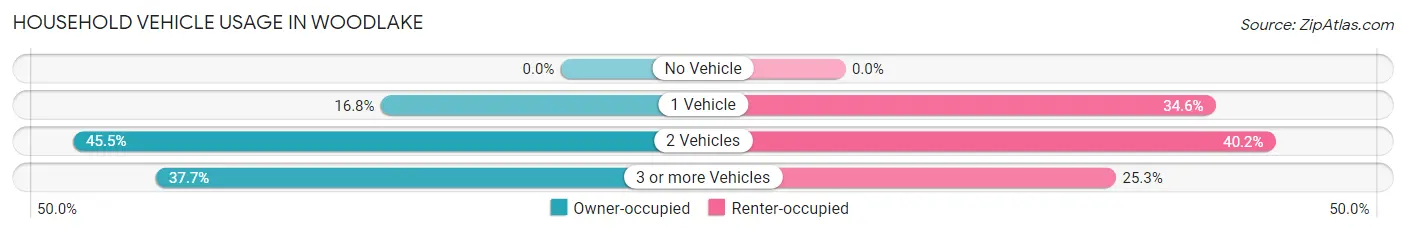
| Vehicles per Household | Owner-occupied | Renter-occupied |
| No Vehicle | 0 (0.0%) | 0 (0.0%) |
| 1 Vehicle | 375 (16.8%) | 167 (34.6%) |
| 2 Vehicles | 1,016 (45.5%) | 194 (40.2%) |
| 3 or more Vehicles | 843 (37.7%) | 122 (25.3%) |
| Total | 2,234 (100.0%) | 483 (100.0%) |
Real Estate & Mortgages in Woodlake
Real Estate and Mortgage Overview in Woodlake
| Characteristic | Without Mortgage | With Mortgage |
| Housing Units | 580 | 1,654 |
| Median Property Value | $380,200 | $348,100 |
| Median Household Income | $129,038 | $603 |
| Monthly Housing Costs | $693 | $112 |
| Real Estate Taxes | $3,544 | $105 |
Property Value by Mortgage Status in Woodlake
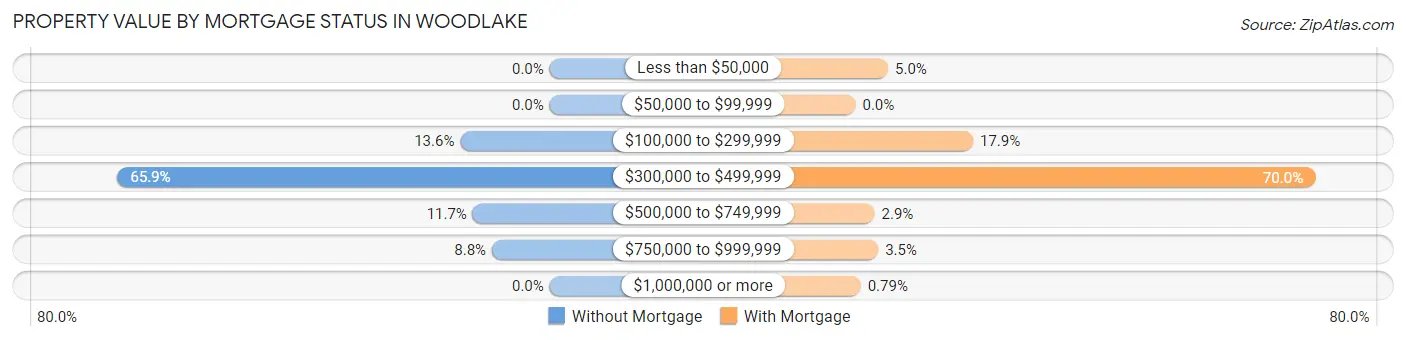
| Property Value | Without Mortgage | With Mortgage |
| Less than $50,000 | 0 (0.0%) | 82 (5.0%) |
| $50,000 to $99,999 | 0 (0.0%) | 0 (0.0%) |
| $100,000 to $299,999 | 79 (13.6%) | 296 (17.9%) |
| $300,000 to $499,999 | 382 (65.9%) | 1,158 (70.0%) |
| $500,000 to $749,999 | 68 (11.7%) | 48 (2.9%) |
| $750,000 to $999,999 | 51 (8.8%) | 57 (3.5%) |
| $1,000,000 or more | 0 (0.0%) | 13 (0.8%) |
| Total | 580 (100.0%) | 1,654 (100.0%) |
Household Income by Mortgage Status in Woodlake
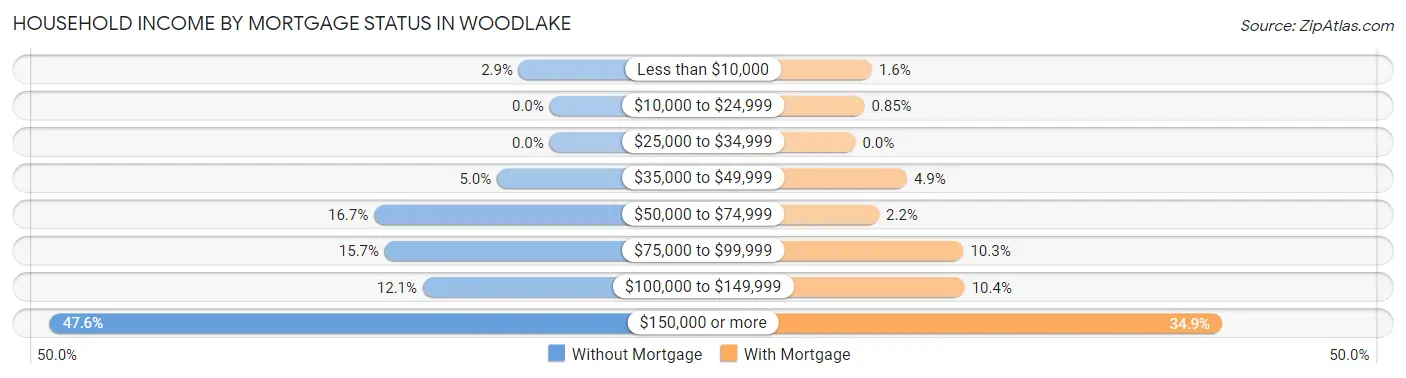
| Household Income | Without Mortgage | With Mortgage |
| Less than $10,000 | 17 (2.9%) | 26 (1.6%) |
| $10,000 to $24,999 | 0 (0.0%) | 14 (0.9%) |
| $25,000 to $34,999 | 0 (0.0%) | 0 (0.0%) |
| $35,000 to $49,999 | 29 (5.0%) | 81 (4.9%) |
| $50,000 to $74,999 | 97 (16.7%) | 37 (2.2%) |
| $75,000 to $99,999 | 91 (15.7%) | 170 (10.3%) |
| $100,000 to $149,999 | 70 (12.1%) | 172 (10.4%) |
| $150,000 or more | 276 (47.6%) | 577 (34.9%) |
| Total | 580 (100.0%) | 1,654 (100.0%) |
Property Value to Household Income Ratio in Woodlake
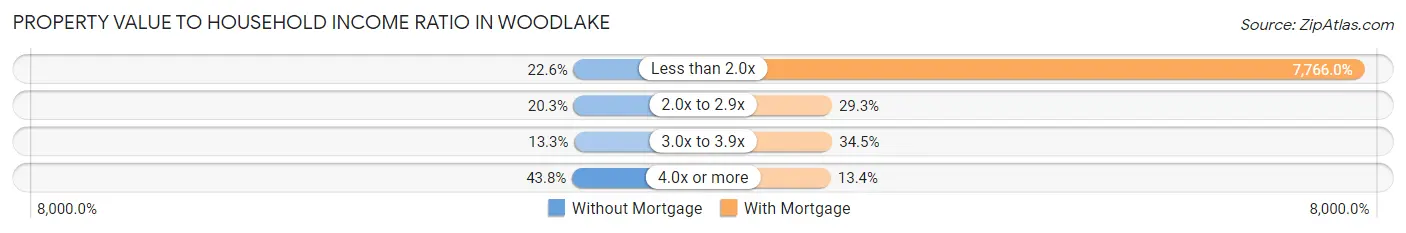
| Value-to-Income Ratio | Without Mortgage | With Mortgage |
| Less than 2.0x | 131 (22.6%) | 128,450 (7,766.0%) |
| 2.0x to 2.9x | 118 (20.3%) | 485 (29.3%) |
| 3.0x to 3.9x | 77 (13.3%) | 571 (34.5%) |
| 4.0x or more | 254 (43.8%) | 222 (13.4%) |
| Total | 580 (100.0%) | 1,654 (100.0%) |
Real Estate Taxes by Mortgage Status in Woodlake
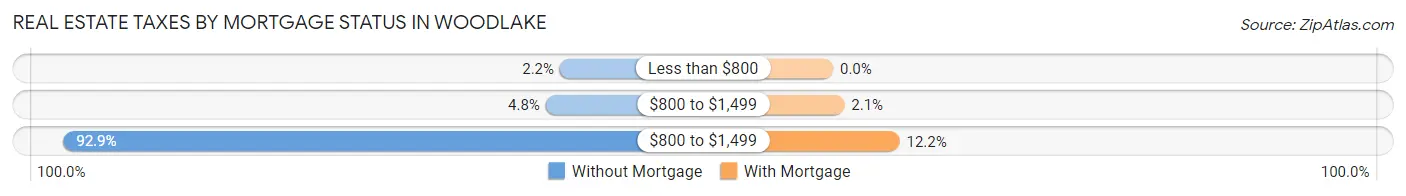
| Property Taxes | Without Mortgage | With Mortgage |
| Less than $800 | 13 (2.2%) | 0 (0.0%) |
| $800 to $1,499 | 28 (4.8%) | 34 (2.1%) |
| $800 to $1,499 | 539 (92.9%) | 201 (12.1%) |
| Total | 580 (100.0%) | 1,654 (100.0%) |
Health & Disability in Woodlake
Health Insurance Coverage by Age in Woodlake
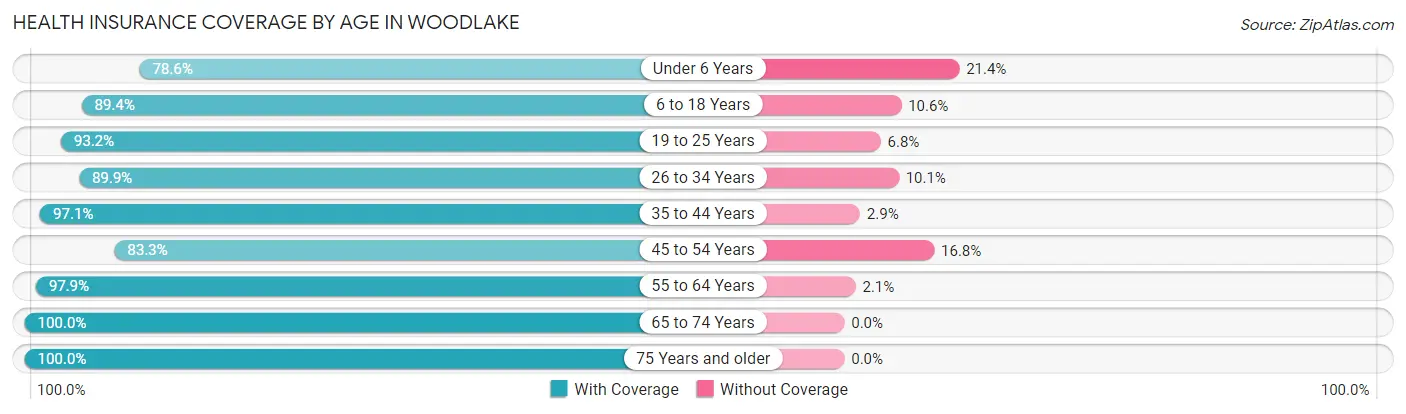
| Age Bracket | With Coverage | Without Coverage |
| Under 6 Years | 308 (78.6%) | 84 (21.4%) |
| 6 to 18 Years | 1,558 (89.4%) | 185 (10.6%) |
| 19 to 25 Years | 537 (93.2%) | 39 (6.8%) |
| 26 to 34 Years | 319 (89.9%) | 36 (10.1%) |
| 35 to 44 Years | 1,366 (97.1%) | 41 (2.9%) |
| 45 to 54 Years | 850 (83.3%) | 171 (16.8%) |
| 55 to 64 Years | 885 (97.9%) | 19 (2.1%) |
| 65 to 74 Years | 771 (100.0%) | 0 (0.0%) |
| 75 Years and older | 376 (100.0%) | 0 (0.0%) |
| Total | 6,970 (92.4%) | 575 (7.6%) |
Health Insurance Coverage by Citizenship Status in Woodlake
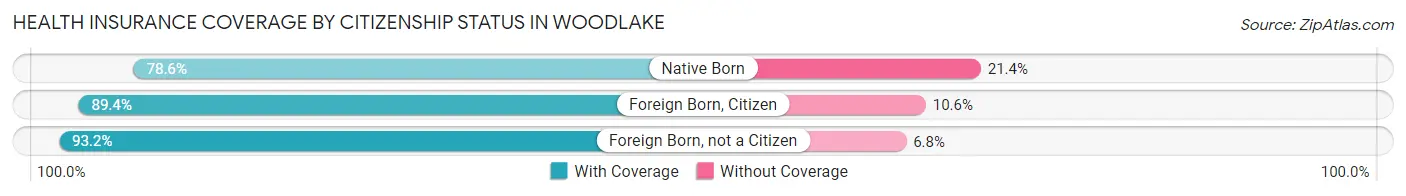
| Citizenship Status | With Coverage | Without Coverage |
| Native Born | 308 (78.6%) | 84 (21.4%) |
| Foreign Born, Citizen | 1,558 (89.4%) | 185 (10.6%) |
| Foreign Born, not a Citizen | 537 (93.2%) | 39 (6.8%) |
Health Insurance Coverage by Household Income in Woodlake
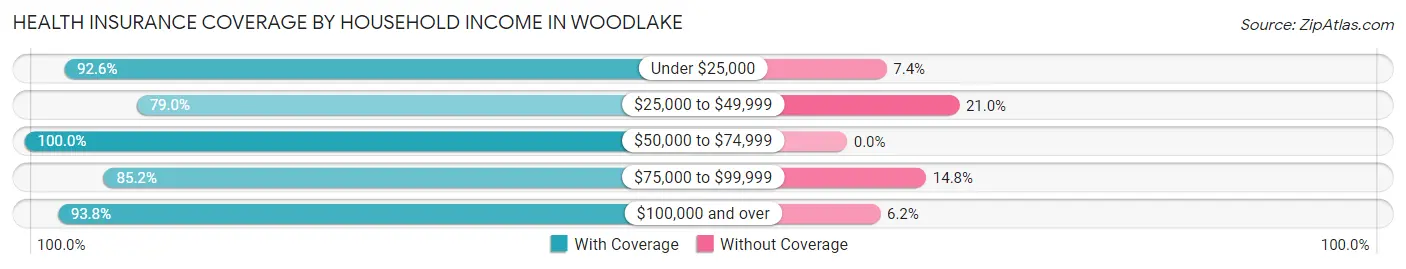
| Household Income | With Coverage | Without Coverage |
| Under $25,000 | 75 (92.6%) | 6 (7.4%) |
| $25,000 to $49,999 | 470 (79.0%) | 125 (21.0%) |
| $50,000 to $74,999 | 761 (100.0%) | 0 (0.0%) |
| $75,000 to $99,999 | 644 (85.2%) | 112 (14.8%) |
| $100,000 and over | 4,996 (93.8%) | 332 (6.2%) |
Public vs Private Health Insurance Coverage by Age in Woodlake
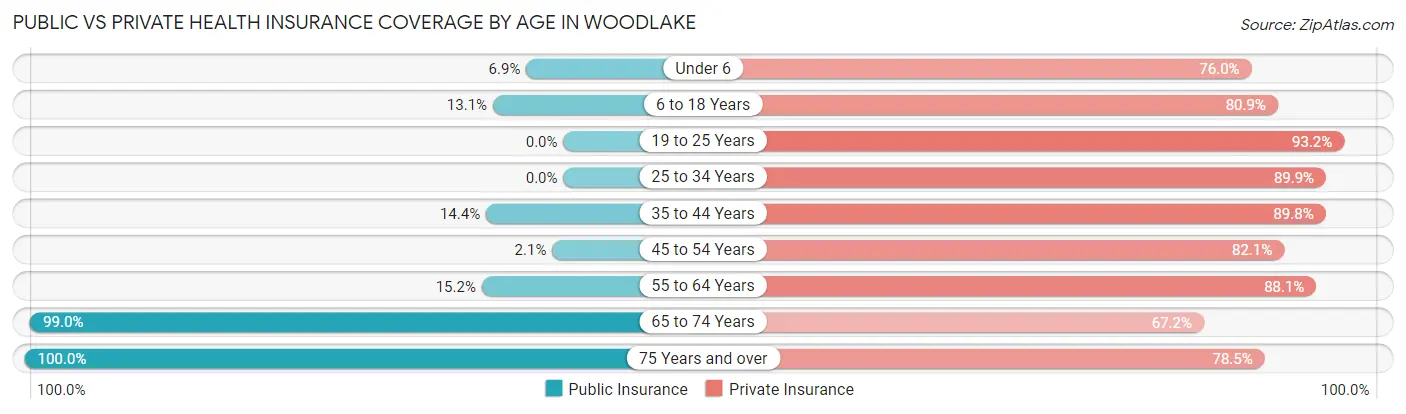
| Age Bracket | Public Insurance | Private Insurance |
| Under 6 | 27 (6.9%) | 298 (76.0%) |
| 6 to 18 Years | 228 (13.1%) | 1,410 (80.9%) |
| 19 to 25 Years | 0 (0.0%) | 537 (93.2%) |
| 25 to 34 Years | 0 (0.0%) | 319 (89.9%) |
| 35 to 44 Years | 202 (14.4%) | 1,263 (89.8%) |
| 45 to 54 Years | 21 (2.1%) | 838 (82.1%) |
| 55 to 64 Years | 137 (15.1%) | 796 (88.0%) |
| 65 to 74 Years | 763 (99.0%) | 518 (67.2%) |
| 75 Years and over | 376 (100.0%) | 295 (78.5%) |
| Total | 1,754 (23.3%) | 6,274 (83.2%) |
Disability Status by Sex by Age in Woodlake
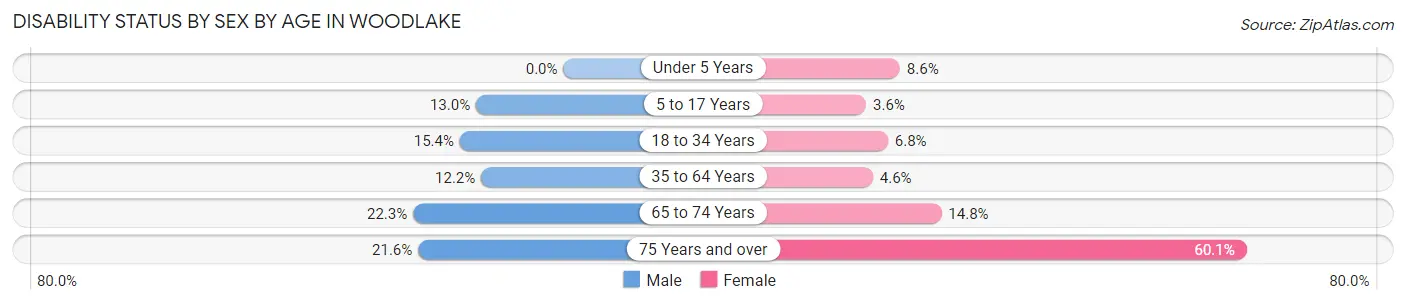
| Age Bracket | Male | Female |
| Under 5 Years | 0 (0.0%) | 12 (8.6%) |
| 5 to 17 Years | 82 (13.0%) | 32 (3.6%) |
| 18 to 34 Years | 114 (15.4%) | 37 (6.8%) |
| 35 to 64 Years | 208 (12.2%) | 75 (4.6%) |
| 65 to 74 Years | 77 (22.3%) | 63 (14.8%) |
| 75 Years and over | 33 (21.6%) | 134 (60.1%) |
Disability Class by Sex by Age in Woodlake
Disability Class: Hearing Difficulty
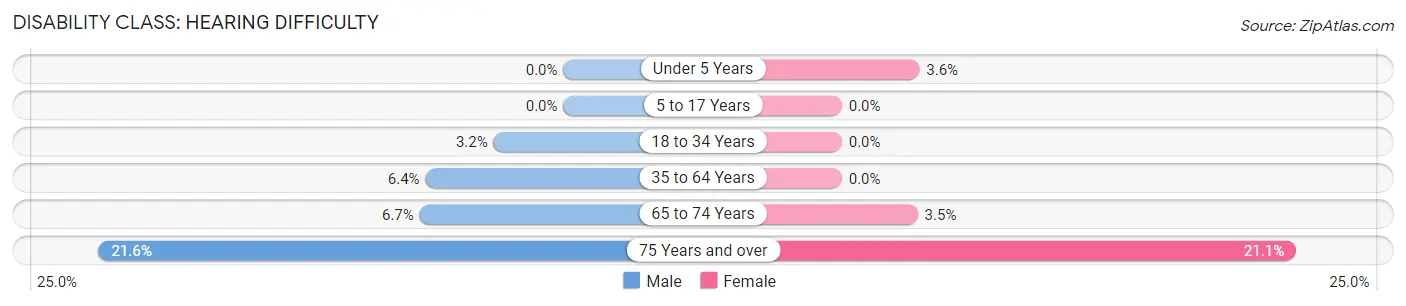
| Age Bracket | Male | Female |
| Under 5 Years | 0 (0.0%) | 5 (3.6%) |
| 5 to 17 Years | 0 (0.0%) | 0 (0.0%) |
| 18 to 34 Years | 24 (3.2%) | 0 (0.0%) |
| 35 to 64 Years | 109 (6.4%) | 0 (0.0%) |
| 65 to 74 Years | 23 (6.7%) | 15 (3.5%) |
| 75 Years and over | 33 (21.6%) | 47 (21.1%) |
Disability Class: Vision Difficulty
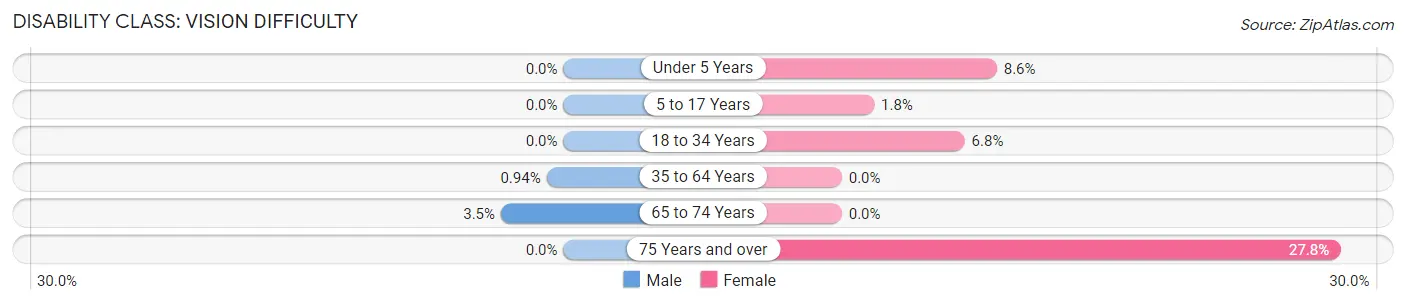
| Age Bracket | Male | Female |
| Under 5 Years | 0 (0.0%) | 12 (8.6%) |
| 5 to 17 Years | 0 (0.0%) | 16 (1.8%) |
| 18 to 34 Years | 0 (0.0%) | 37 (6.8%) |
| 35 to 64 Years | 16 (0.9%) | 0 (0.0%) |
| 65 to 74 Years | 12 (3.5%) | 0 (0.0%) |
| 75 Years and over | 0 (0.0%) | 62 (27.8%) |
Disability Class: Cognitive Difficulty
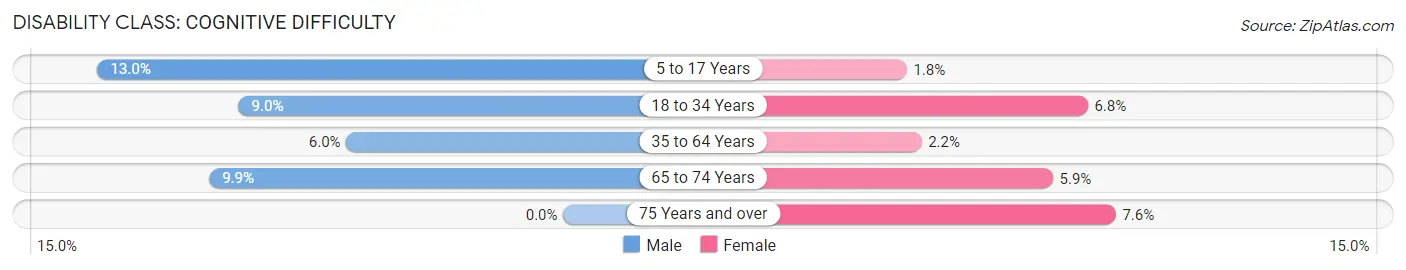
| Age Bracket | Male | Female |
| 5 to 17 Years | 82 (13.0%) | 16 (1.8%) |
| 18 to 34 Years | 67 (9.0%) | 37 (6.8%) |
| 35 to 64 Years | 103 (6.0%) | 36 (2.2%) |
| 65 to 74 Years | 34 (9.9%) | 25 (5.9%) |
| 75 Years and over | 0 (0.0%) | 17 (7.6%) |
Disability Class: Ambulatory Difficulty
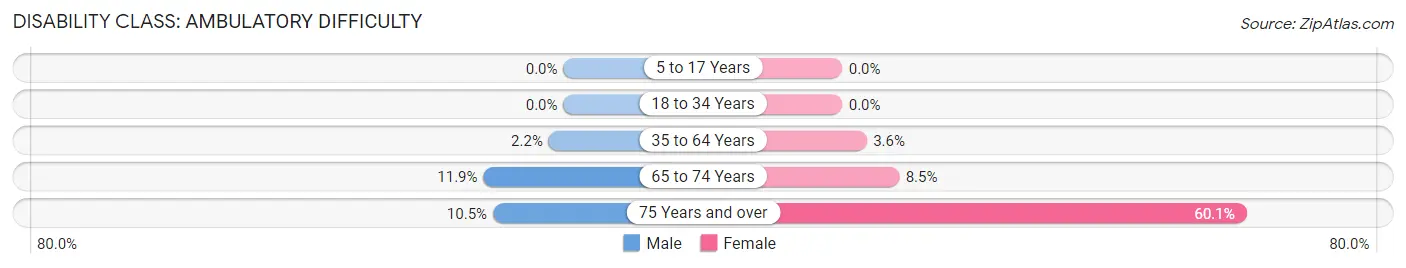
| Age Bracket | Male | Female |
| 5 to 17 Years | 0 (0.0%) | 0 (0.0%) |
| 18 to 34 Years | 0 (0.0%) | 0 (0.0%) |
| 35 to 64 Years | 37 (2.2%) | 59 (3.6%) |
| 65 to 74 Years | 41 (11.9%) | 36 (8.5%) |
| 75 Years and over | 16 (10.5%) | 134 (60.1%) |
Disability Class: Self-Care Difficulty
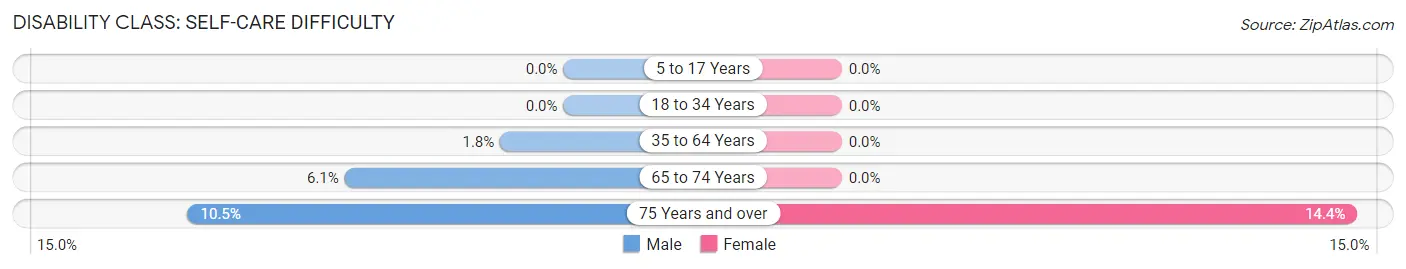
| Age Bracket | Male | Female |
| 5 to 17 Years | 0 (0.0%) | 0 (0.0%) |
| 18 to 34 Years | 0 (0.0%) | 0 (0.0%) |
| 35 to 64 Years | 30 (1.8%) | 0 (0.0%) |
| 65 to 74 Years | 21 (6.1%) | 0 (0.0%) |
| 75 Years and over | 16 (10.5%) | 32 (14.3%) |
Technology Access in Woodlake
Computing Device Access in Woodlake
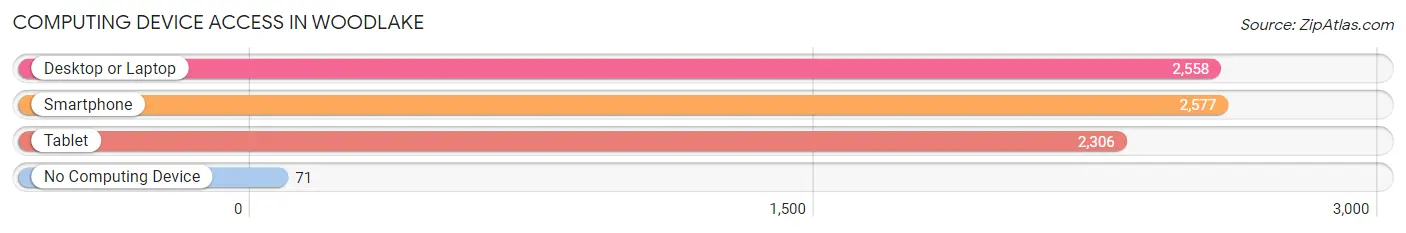
| Device Type | # Households | % Households |
| Desktop or Laptop | 2,558 | 94.2% |
| Smartphone | 2,577 | 94.9% |
| Tablet | 2,306 | 84.9% |
| No Computing Device | 71 | 2.6% |
| Total | 2,717 | 100.0% |
Internet Access in Woodlake
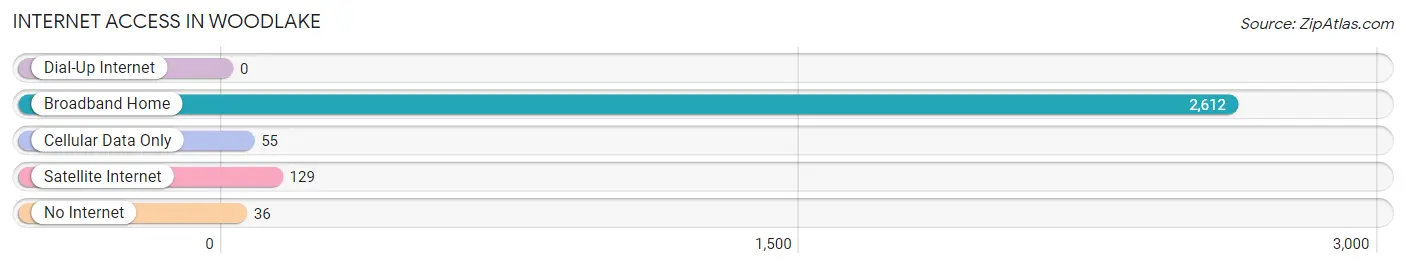
| Internet Type | # Households | % Households |
| Dial-Up Internet | 0 | 0.0% |
| Broadband Home | 2,612 | 96.1% |
| Cellular Data Only | 55 | 2.0% |
| Satellite Internet | 129 | 4.8% |
| No Internet | 36 | 1.3% |
| Total | 2,717 | 100.0% |
Woodlake Summary
Woodlake is a census-designated place (CDP) located in Chesterfield County, Virginia. It is situated in the Richmond metropolitan area and is part of the Greater Richmond Region. The population of Woodlake was 4,845 at the 2010 census.
History
Woodlake was first settled in the early 1700s by English settlers. The area was originally known as “Woods Lake” and was part of the vast land grant given to William Byrd II in 1710. The area was primarily used for farming and timber production until the mid-1800s when the Richmond and Danville Railroad was built through the area. This allowed for the development of a small village, which was named Woodlake in 1872.
The village grew slowly over the next few decades, but the population began to increase in the early 1900s. The area was primarily rural until the 1950s when suburban development began to take hold. The population of Woodlake increased significantly during this time, and the area was eventually incorporated as a town in 1972.
Geography
Woodlake is located in the western part of Chesterfield County, Virginia. It is situated in the Richmond metropolitan area and is part of the Greater Richmond Region. The CDP has a total area of 4.3 square miles, all of which is land.
The terrain of Woodlake is mostly flat, with some rolling hills in the northern part of the CDP. The area is drained by the Swift Creek, which flows through the northern part of the CDP. The climate of Woodlake is humid subtropical, with hot, humid summers and mild winters.
Economy
The economy of Woodlake is primarily based on retail and services. The area is home to several shopping centers, restaurants, and other businesses. The largest employer in the area is the Chesterfield County Public Schools, which employs over 1,000 people. Other major employers include the Chesterfield County government, Bon Secours Richmond Health System, and the University of Richmond.
Demographics
As of the 2010 census, there were 4,845 people, 1,845 households, and 1,323 families residing in the CDP. The population density was 1,125.3 people per square mile. The racial makeup of the CDP was 79.2% White, 14.2% African American, 0.3% Native American, 2.2% Asian, 0.1% Pacific Islander, 1.7% from other races, and 2.3% from two or more races. Hispanic or Latino of any race were 4.2% of the population.
The median income for a household in the CDP was $63,958, and the median income for a family was $76,944. The per capita income for the CDP was $30,945. About 4.2% of families and 5.7% of the population were below the poverty line, including 6.3% of those under age 18 and 4.2% of those age 65 or over.
Common Questions
What is Per Capita Income in Woodlake?
Per Capita income in Woodlake is $51,853.
What is the Median Family Income in Woodlake?
Median Family Income in Woodlake is $130,962.
What is the Median Household income in Woodlake?
Median Household Income in Woodlake is $128,065.
What is Income or Wage Gap in Woodlake?
Income or Wage Gap in Woodlake is 21.9%.
Women in Woodlake earn 78.1 cents for every dollar earned by a man.
What is Inequality or Gini Index in Woodlake?
Inequality or Gini Index in Woodlake is 0.35.
What is the Total Population of Woodlake?
Total Population of Woodlake is 7,566.
What is the Total Male Population of Woodlake?
Total Male Population of Woodlake is 3,722.
What is the Total Female Population of Woodlake?
Total Female Population of Woodlake is 3,844.
What is the Ratio of Males per 100 Females in Woodlake?
There are 96.83 Males per 100 Females in Woodlake.
What is the Ratio of Females per 100 Males in Woodlake?
There are 103.28 Females per 100 Males in Woodlake.
What is the Median Population Age in Woodlake?
Median Population Age in Woodlake is 40.8 Years.
What is the Average Family Size in Woodlake
Average Family Size in Woodlake is 3.1 People.
What is the Average Household Size in Woodlake
Average Household Size in Woodlake is 2.8 People.
How Large is the Labor Force in Woodlake?
There are 4,358 People in the Labor Forcein in Woodlake.
What is the Percentage of People in the Labor Force in Woodlake?
73.7% of People are in the Labor Force in Woodlake.
What is the Unemployment Rate in Woodlake?
Unemployment Rate in Woodlake is 5.3%.