Belspring, VA Map & Demographics
Belspring Map
Belspring Overview
$28,044
PER CAPITA INCOME
0.39
INEQUALITY / GINI INDEX
170
TOTAL POPULATION
52
MALE POPULATION
118
FEMALE POPULATION
44.07
MALES / 100 FEMALES
226.92
FEMALES / 100 MALES
42.7
MEDIAN AGE
3.1
AVG FAMILY SIZE
2.7
AVG HOUSEHOLD SIZE
96
LABOR FORCE [ PEOPLE ]
56.5%
PERCENT IN LABOR FORCE
Belspring Zip Codes
Belspring Area Codes
Income in Belspring
Income Overview in Belspring
| Characteristic | Number | Measure |
| Per Capita Income | 170 | $28,044 |
| Median Family Income | 52 | $0 |
| Mean Family Income | 52 | $0 |
| Median Household Income | 63 | $0 |
| Mean Household Income | 63 | $72,414 |
| Income Deficit | 52 | $0 |
| Wage / Income Gap (%) | 170 | 0.00% |
| Wage / Income Gap ($) | 170 | 100.00¢ per $1 |
| Gini / Inequality Index | 170 | 0.39 |
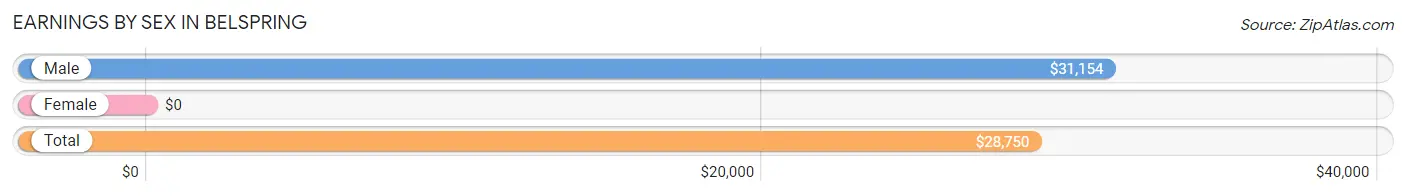
Earnings by Sex in Belspring
| Sex | Number | Average Earnings |
| Male | 40 (41.7%) | $31,154 |
| Female | 56 (58.3%) | $0 |
| Total | 96 (100.0%) | $28,750 |
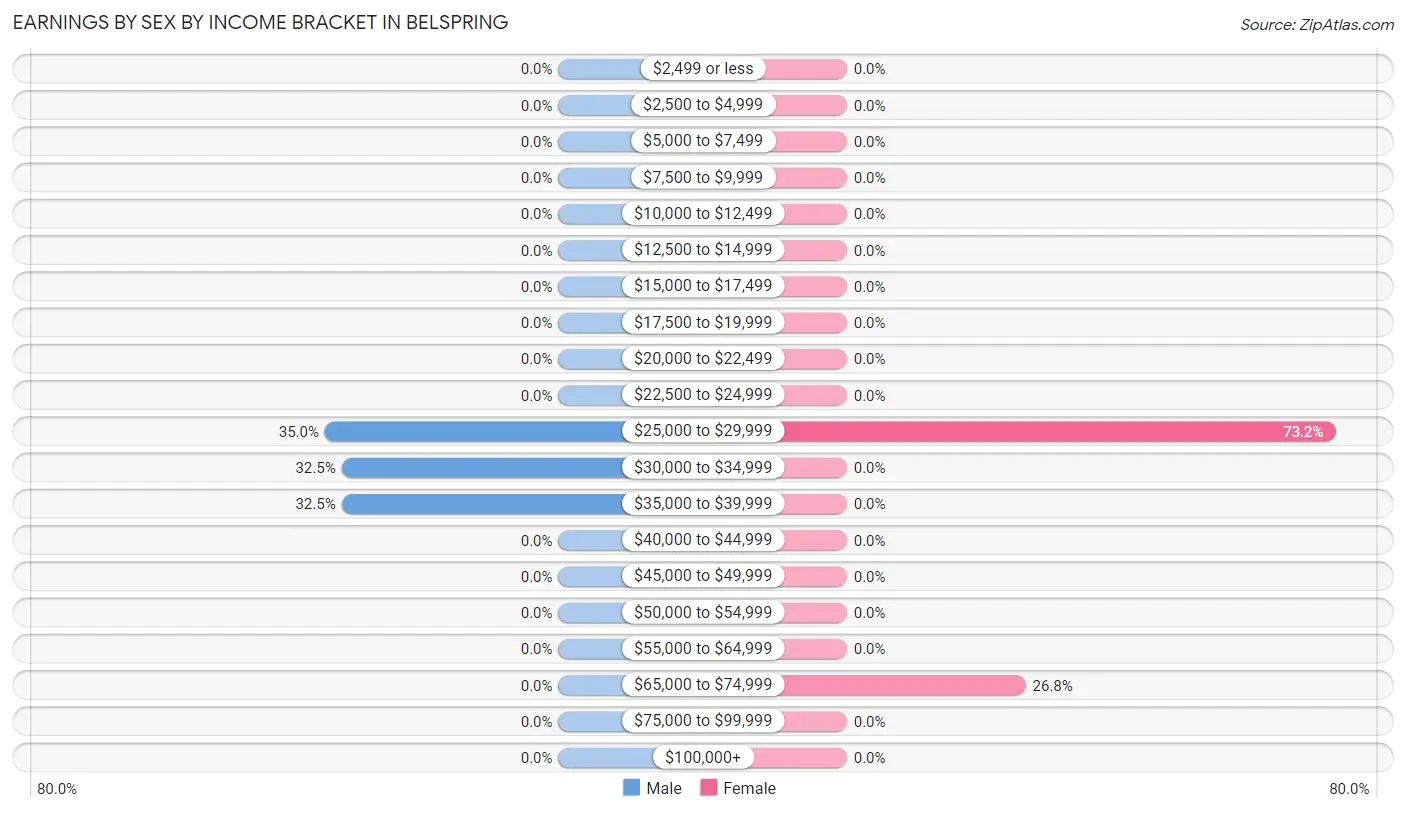
Earnings by Sex by Income Bracket in Belspring
The most common earnings brackets in Belspring are $25,000 to $29,999 for men (14 | 35.0%) and $25,000 to $29,999 for women (41 | 73.2%).
| Income | Male | Female |
| $2,499 or less | 0 (0.0%) | 0 (0.0%) |
| $2,500 to $4,999 | 0 (0.0%) | 0 (0.0%) |
| $5,000 to $7,499 | 0 (0.0%) | 0 (0.0%) |
| $7,500 to $9,999 | 0 (0.0%) | 0 (0.0%) |
| $10,000 to $12,499 | 0 (0.0%) | 0 (0.0%) |
| $12,500 to $14,999 | 0 (0.0%) | 0 (0.0%) |
| $15,000 to $17,499 | 0 (0.0%) | 0 (0.0%) |
| $17,500 to $19,999 | 0 (0.0%) | 0 (0.0%) |
| $20,000 to $22,499 | 0 (0.0%) | 0 (0.0%) |
| $22,500 to $24,999 | 0 (0.0%) | 0 (0.0%) |
| $25,000 to $29,999 | 14 (35.0%) | 41 (73.2%) |
| $30,000 to $34,999 | 13 (32.5%) | 0 (0.0%) |
| $35,000 to $39,999 | 13 (32.5%) | 0 (0.0%) |
| $40,000 to $44,999 | 0 (0.0%) | 0 (0.0%) |
| $45,000 to $49,999 | 0 (0.0%) | 0 (0.0%) |
| $50,000 to $54,999 | 0 (0.0%) | 0 (0.0%) |
| $55,000 to $64,999 | 0 (0.0%) | 0 (0.0%) |
| $65,000 to $74,999 | 0 (0.0%) | 15 (26.8%) |
| $75,000 to $99,999 | 0 (0.0%) | 0 (0.0%) |
| $100,000+ | 0 (0.0%) | 0 (0.0%) |
| Total | 40 (100.0%) | 56 (100.0%) |
Earnings by Sex by Educational Attainment in Belspring
| Educational Attainment | Male Income | Female Income |
| Less than High School | - | - |
| High School Diploma | - | - |
| College or Associate's Degree | - | - |
| Bachelor's Degree | - | - |
| Graduate Degree | - | - |
| Total | - | - |
Family Income in Belspring
Family Income Brackets in Belspring
According to the Belspring family income data, there are 39 families falling into the $50,000 to $74,999 income range, which is the most common income bracket and makes up 75.0% of all families.
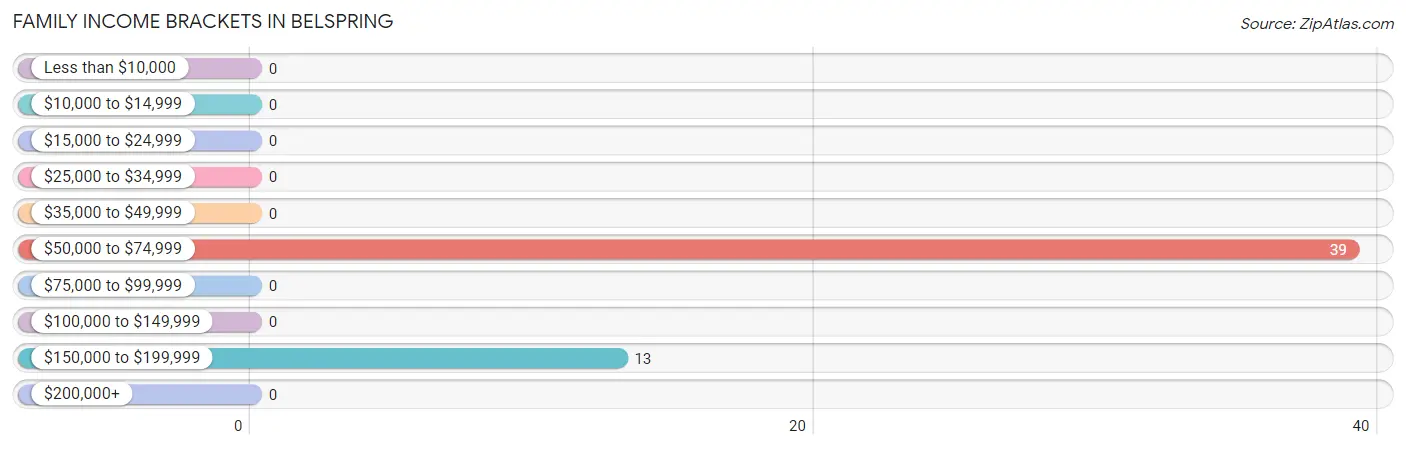
| Income Bracket | # Families | % Families |
| Less than $10,000 | 0 | 0.0% |
| $10,000 to $14,999 | 0 | 0.0% |
| $15,000 to $24,999 | 0 | 0.0% |
| $25,000 to $34,999 | 0 | 0.0% |
| $35,000 to $49,999 | 0 | 0.0% |
| $50,000 to $74,999 | 39 | 75.0% |
| $75,000 to $99,999 | 0 | 0.0% |
| $100,000 to $149,999 | 0 | 0.0% |
| $150,000 to $199,999 | 13 | 25.0% |
| $200,000+ | 0 | 0.0% |
Family Income by Famaliy Size in Belspring
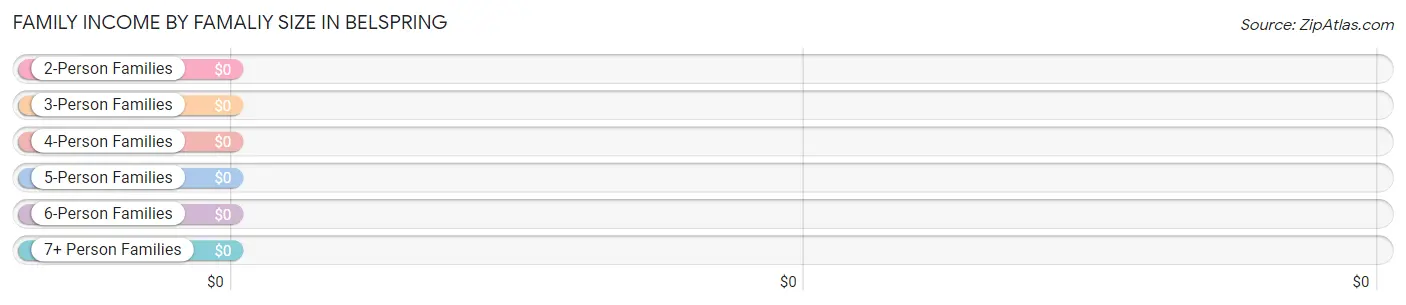
| Income Bracket | # Families | Median Income |
| 2-Person Families | 39 (75.0%) | $0 |
| 3-Person Families | 0 (0.0%) | $0 |
| 4-Person Families | 0 (0.0%) | $0 |
| 5-Person Families | 0 (0.0%) | $0 |
| 6-Person Families | 13 (25.0%) | $0 |
| 7+ Person Families | 0 (0.0%) | $0 |
| Total | 52 (100.0%) | $0 |
Family Income by Number of Earners in Belspring
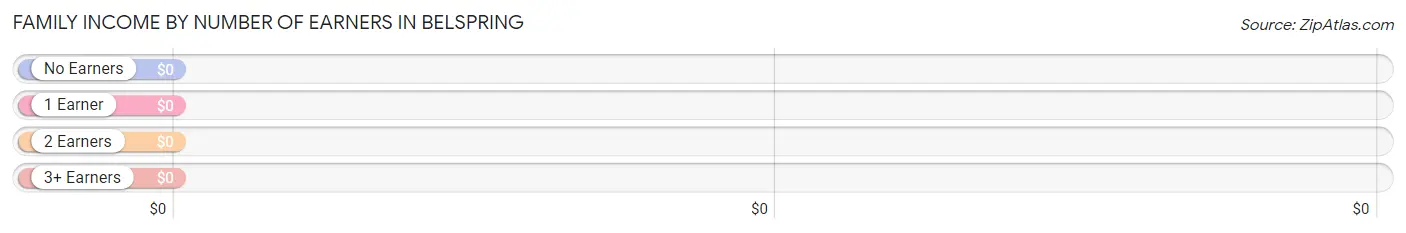
| Number of Earners | # Families | Median Income |
| No Earners | 0 (0.0%) | $0 |
| 1 Earner | 39 (75.0%) | $0 |
| 2 Earners | 0 (0.0%) | $0 |
| 3+ Earners | 13 (25.0%) | $0 |
| Total | 52 (100.0%) | $0 |
Household Income in Belspring
Household Income Brackets in Belspring
With 39 households falling in the category, the $50,000 to $74,999 income range is the most frequent in Belspring, accounting for 61.9% of all households.
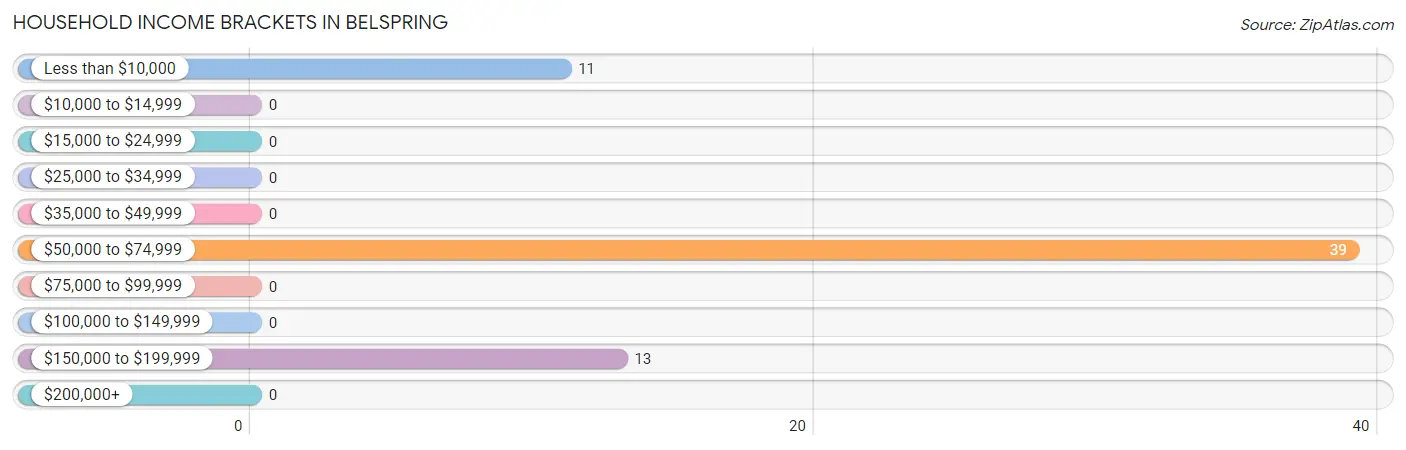
| Income Bracket | # Households | % Households |
| Less than $10,000 | 11 | 17.5% |
| $10,000 to $14,999 | 0 | 0.0% |
| $15,000 to $24,999 | 0 | 0.0% |
| $25,000 to $34,999 | 0 | 0.0% |
| $35,000 to $49,999 | 0 | 0.0% |
| $50,000 to $74,999 | 39 | 61.9% |
| $75,000 to $99,999 | 0 | 0.0% |
| $100,000 to $149,999 | 0 | 0.0% |
| $150,000 to $199,999 | 13 | 20.6% |
| $200,000+ | 0 | 0.0% |
Household Income by Householder Age in Belspring
| Income Bracket | # Households | Median Income |
| 15 to 24 Years | 0 (0.0%) | $0 |
| 25 to 44 Years | 0 (0.0%) | $0 |
| 45 to 64 Years | 13 (20.6%) | $0 |
| 65+ Years | 50 (79.4%) | $0 |
| Total | 63 (100.0%) | $0 |
Poverty in Belspring
Income Below Poverty by Sex and Age in Belspring
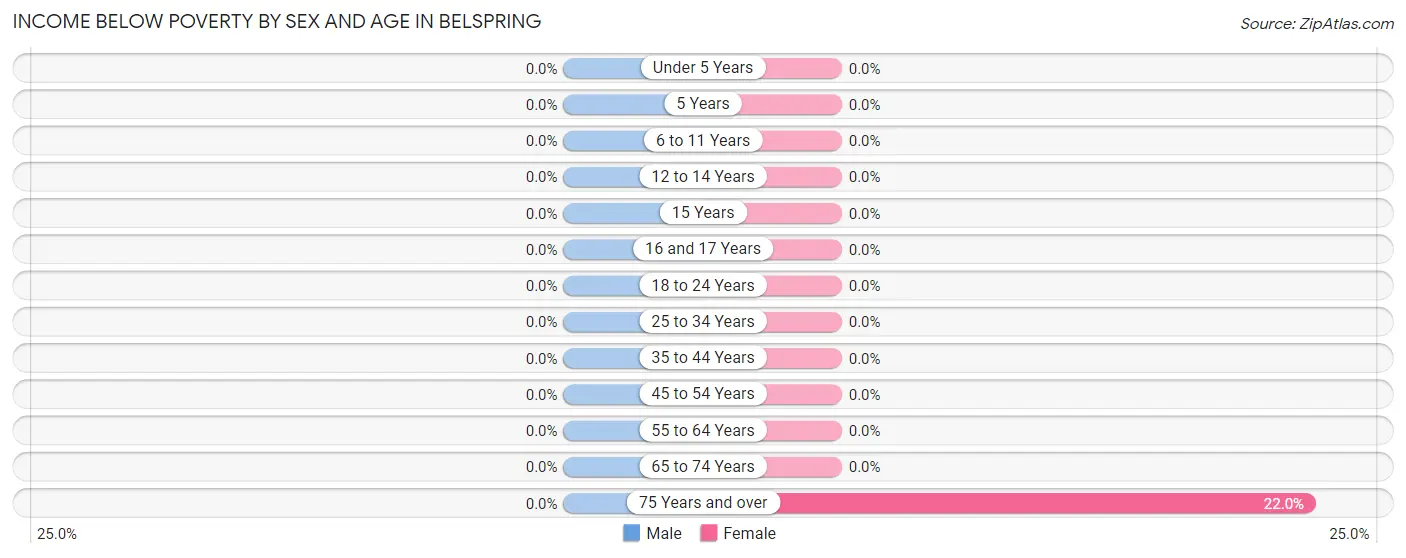
| Age Bracket | Male | Female |
| Under 5 Years | 0 (0.0%) | 0 (0.0%) |
| 5 Years | 0 (0.0%) | 0 (0.0%) |
| 6 to 11 Years | 0 (0.0%) | 0 (0.0%) |
| 12 to 14 Years | 0 (0.0%) | 0 (0.0%) |
| 15 Years | 0 (0.0%) | 0 (0.0%) |
| 16 and 17 Years | 0 (0.0%) | 0 (0.0%) |
| 18 to 24 Years | 0 (0.0%) | 0 (0.0%) |
| 25 to 34 Years | 0 (0.0%) | 0 (0.0%) |
| 35 to 44 Years | 0 (0.0%) | 0 (0.0%) |
| 45 to 54 Years | 0 (0.0%) | 0 (0.0%) |
| 55 to 64 Years | 0 (0.0%) | 0 (0.0%) |
| 65 to 74 Years | 0 (0.0%) | 0 (0.0%) |
| 75 Years and over | 0 (0.0%) | 11 (22.0%) |
| Total | 0 (0.0%) | 11 (9.3%) |
Income Above Poverty by Sex and Age in Belspring
According to the poverty statistics in Belspring, males aged 16 and 17 years and females aged 25 to 34 years are the age groups that are most secure financially, with 100.0% of males and 100.0% of females in these age groups living above the poverty line.
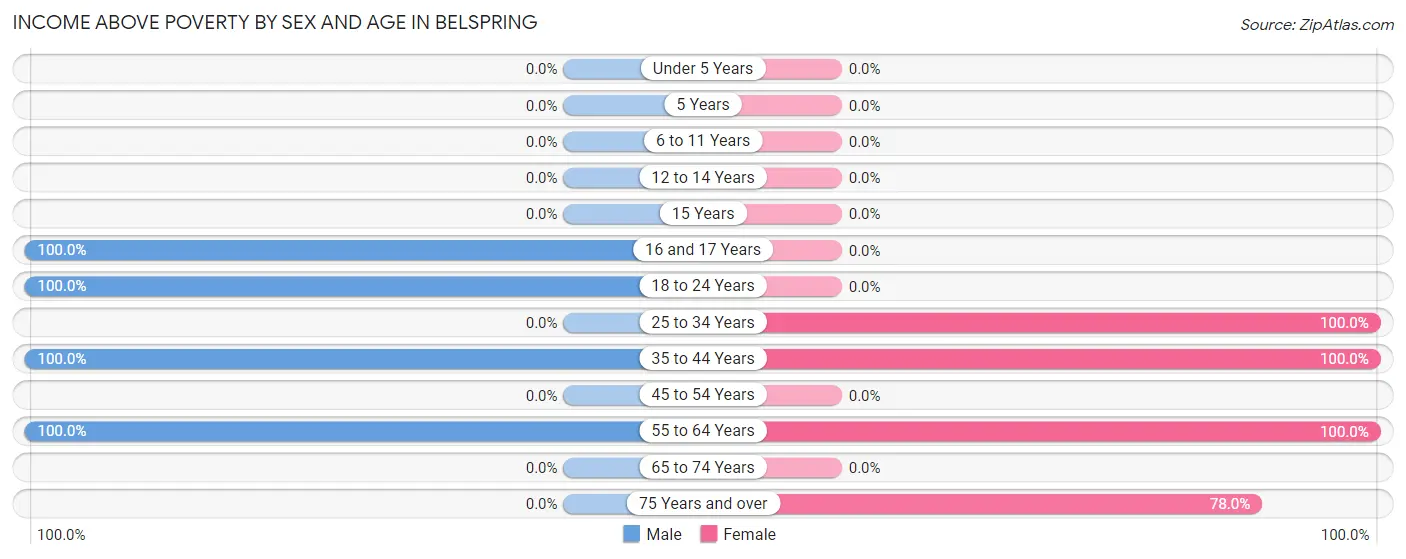
| Age Bracket | Male | Female |
| Under 5 Years | 0 (0.0%) | 0 (0.0%) |
| 5 Years | 0 (0.0%) | 0 (0.0%) |
| 6 to 11 Years | 0 (0.0%) | 0 (0.0%) |
| 12 to 14 Years | 0 (0.0%) | 0 (0.0%) |
| 15 Years | 0 (0.0%) | 0 (0.0%) |
| 16 and 17 Years | 12 (100.0%) | 0 (0.0%) |
| 18 to 24 Years | 13 (100.0%) | 0 (0.0%) |
| 25 to 34 Years | 0 (0.0%) | 41 (100.0%) |
| 35 to 44 Years | 14 (100.0%) | 15 (100.0%) |
| 45 to 54 Years | 0 (0.0%) | 0 (0.0%) |
| 55 to 64 Years | 13 (100.0%) | 12 (100.0%) |
| 65 to 74 Years | 0 (0.0%) | 0 (0.0%) |
| 75 Years and over | 0 (0.0%) | 39 (78.0%) |
| Total | 52 (100.0%) | 107 (90.7%) |
Income Below Poverty Among Married-Couple Families in Belspring
| Children | Above Poverty | Below Poverty |
| No Children | 0 (0.0%) | 0 (0.0%) |
| 1 or 2 Children | 13 (100.0%) | 0 (0.0%) |
| 3 or 4 Children | 0 (0.0%) | 0 (0.0%) |
| 5 or more Children | 0 (0.0%) | 0 (0.0%) |
| Total | 13 (100.0%) | 0 (0.0%) |
Income Below Poverty Among Single-Parent Households in Belspring
| Children | Single Father | Single Mother |
| No Children | 0 (0.0%) | 0 (0.0%) |
| 1 or 2 Children | 0 (0.0%) | 0 (0.0%) |
| 3 or 4 Children | 0 (0.0%) | 0 (0.0%) |
| 5 or more Children | 0 (0.0%) | 0 (0.0%) |
| Total | 0 (0.0%) | 0 (0.0%) |
Income Below Poverty Among Married-Couple vs Single-Parent Households in Belspring
| Children | Married-Couple Families | Single-Parent Households |
| No Children | 0 (0.0%) | 0 (0.0%) |
| 1 or 2 Children | 0 (0.0%) | 0 (0.0%) |
| 3 or 4 Children | 0 (0.0%) | 0 (0.0%) |
| 5 or more Children | 0 (0.0%) | 0 (0.0%) |
| Total | 0 (0.0%) | 0 (0.0%) |
Race in Belspring
The most populous races in Belspring are , and White / Caucasian (170 | 100.0%).
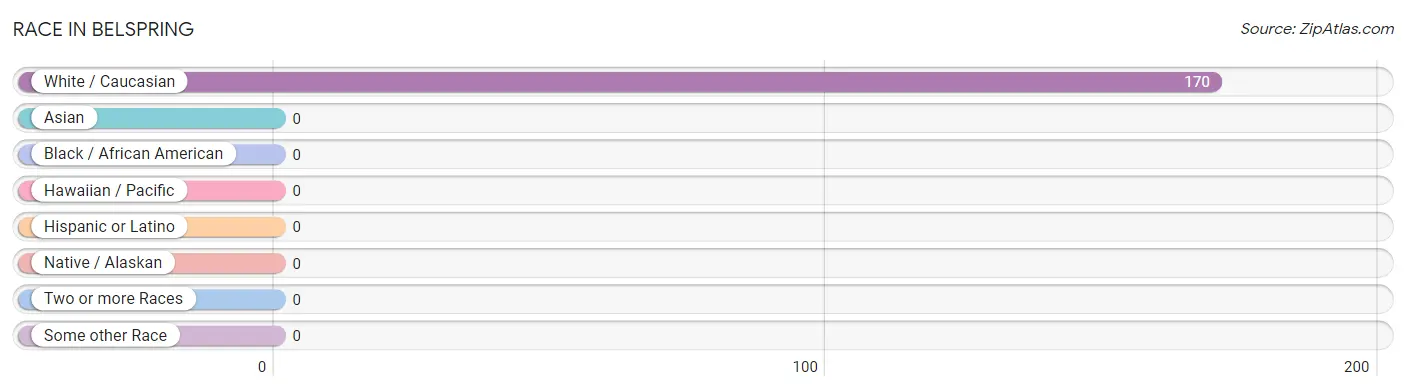
| Race | # Population | % Population |
| Asian | 0 | 0.0% |
| Black / African American | 0 | 0.0% |
| Hawaiian / Pacific | 0 | 0.0% |
| Hispanic or Latino | 0 | 0.0% |
| Native / Alaskan | 0 | 0.0% |
| White / Caucasian | 170 | 100.0% |
| Two or more Races | 0 | 0.0% |
| Some other Race | 0 | 0.0% |
| Total | 170 | 100.0% |
Ancestry in Belspring
The most populous ancestries reported in Belspring are American (80 | 47.1%), and English (64 | 37.7%), together accounting for 84.7% of all Belspring residents.
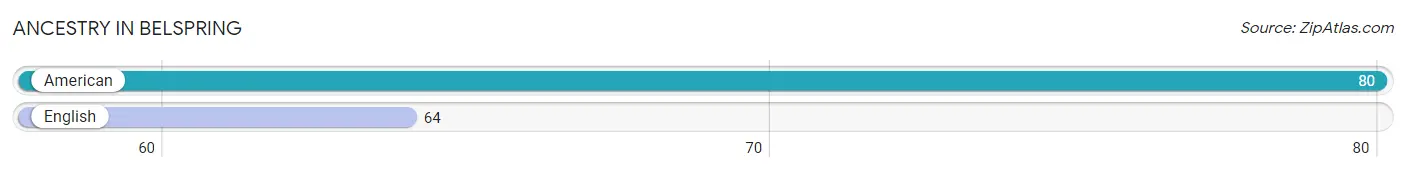
| Ancestry | # Population | % Population |
| American | 80 | 47.1% |
| English | 64 | 37.7% | View All 2 Rows |
Immigrants in Belspring

| Immigration Origin | # Population | % Population | View All 0 Rows |
Sex and Age in Belspring
Sex and Age in Belspring
The most populous age groups in Belspring are 15 to 19 Years (25 | 48.1%) for men and 30 to 34 Years (41 | 34.7%) for women.
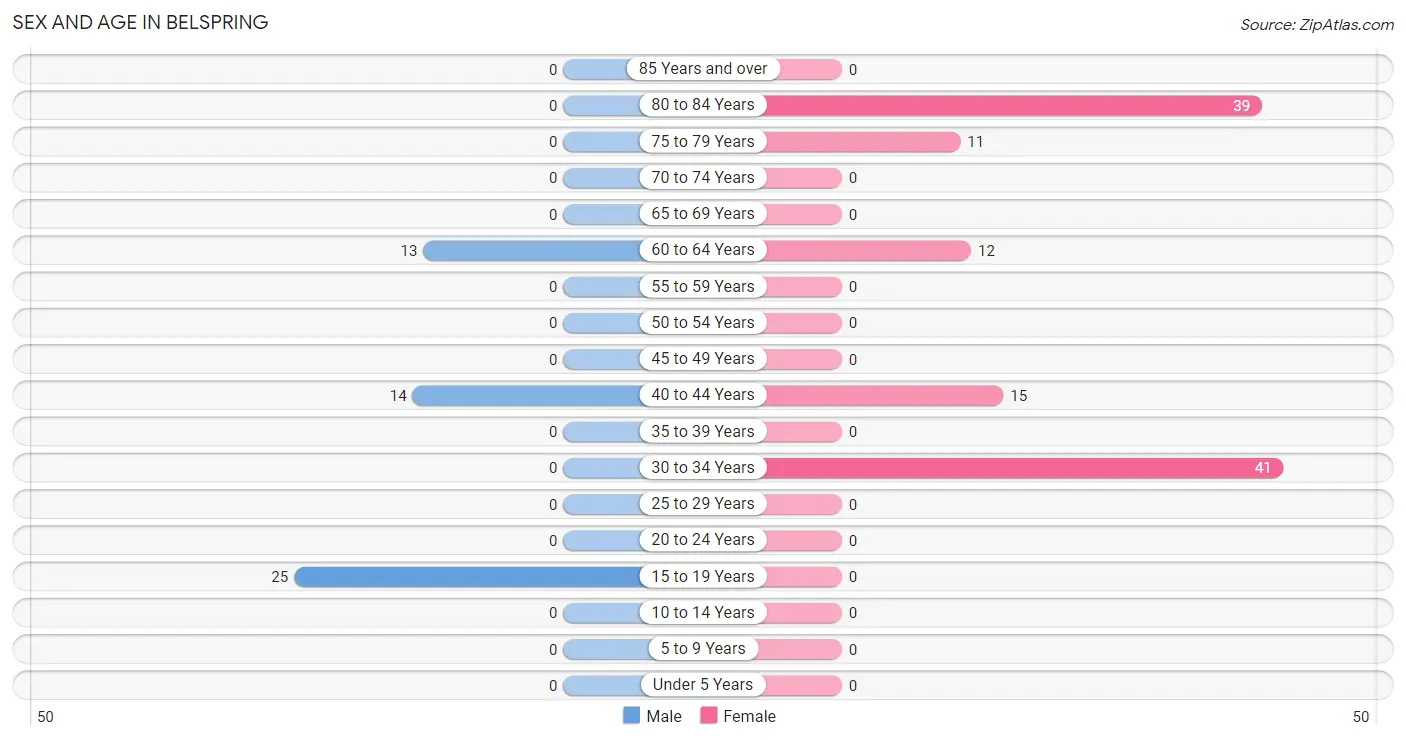
| Age Bracket | Male | Female |
| Under 5 Years | 0 (0.0%) | 0 (0.0%) |
| 5 to 9 Years | 0 (0.0%) | 0 (0.0%) |
| 10 to 14 Years | 0 (0.0%) | 0 (0.0%) |
| 15 to 19 Years | 25 (48.1%) | 0 (0.0%) |
| 20 to 24 Years | 0 (0.0%) | 0 (0.0%) |
| 25 to 29 Years | 0 (0.0%) | 0 (0.0%) |
| 30 to 34 Years | 0 (0.0%) | 41 (34.7%) |
| 35 to 39 Years | 0 (0.0%) | 0 (0.0%) |
| 40 to 44 Years | 14 (26.9%) | 15 (12.7%) |
| 45 to 49 Years | 0 (0.0%) | 0 (0.0%) |
| 50 to 54 Years | 0 (0.0%) | 0 (0.0%) |
| 55 to 59 Years | 0 (0.0%) | 0 (0.0%) |
| 60 to 64 Years | 13 (25.0%) | 12 (10.2%) |
| 65 to 69 Years | 0 (0.0%) | 0 (0.0%) |
| 70 to 74 Years | 0 (0.0%) | 0 (0.0%) |
| 75 to 79 Years | 0 (0.0%) | 11 (9.3%) |
| 80 to 84 Years | 0 (0.0%) | 39 (33.1%) |
| 85 Years and over | 0 (0.0%) | 0 (0.0%) |
| Total | 52 (100.0%) | 118 (100.0%) |
Families and Households in Belspring
Median Family Size in Belspring
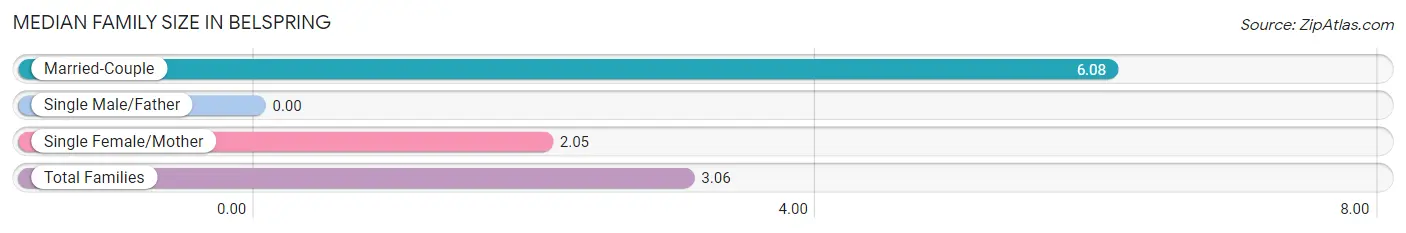
| Family Type | # Families | Family Size |
| Married-Couple | 13 (25.0%) | 6.08 |
| Single Male/Father | 0 (0.0%) | - |
| Single Female/Mother | 39 (75.0%) | 2.05 |
| Total Families | 52 (100.0%) | 3.06 |
Median Household Size in Belspring
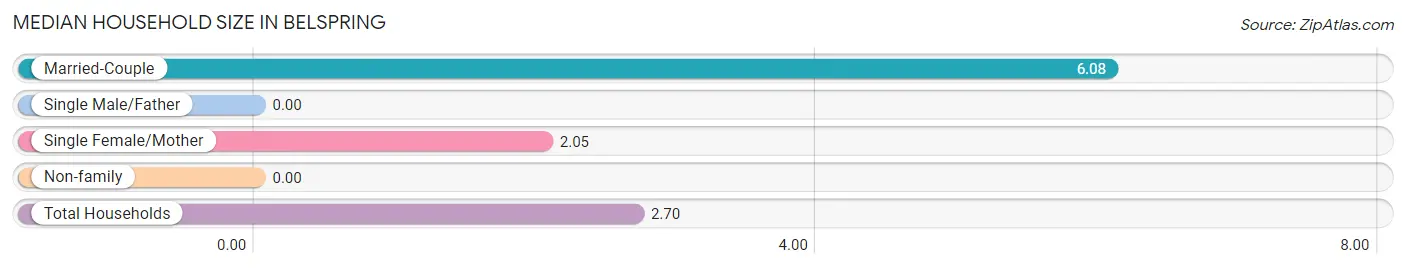
| Household Type | # Households | Household Size |
| Married-Couple | 13 (20.6%) | 6.08 |
| Single Male/Father | 0 (0.0%) | - |
| Single Female/Mother | 39 (61.9%) | 2.05 |
| Non-family | 11 (17.5%) | - |
| Total Households | 63 (100.0%) | 2.70 |
Household Size by Marriage Status in Belspring
Out of a total of 63 households in Belspring, 52 (82.5%) are family households, while 11 (17.5%) are nonfamily households. The most numerous type of family households are 2-person households, comprising 39, and the most common type of nonfamily households are 1-person households, comprising 11.
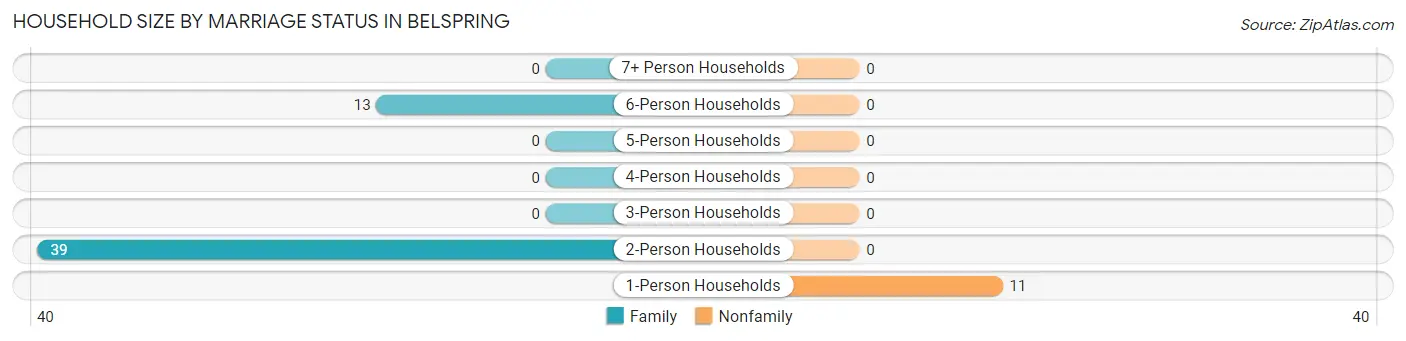
| Household Size | Family Households | Nonfamily Households |
| 1-Person Households | - | 11 (17.5%) |
| 2-Person Households | 39 (61.9%) | 0 (0.0%) |
| 3-Person Households | 0 (0.0%) | 0 (0.0%) |
| 4-Person Households | 0 (0.0%) | 0 (0.0%) |
| 5-Person Households | 0 (0.0%) | 0 (0.0%) |
| 6-Person Households | 13 (20.6%) | 0 (0.0%) |
| 7+ Person Households | 0 (0.0%) | 0 (0.0%) |
| Total | 52 (82.5%) | 11 (17.5%) |
Female Fertility in Belspring
Fertility by Age in Belspring
| Age Bracket | Women with Births | Births / 1,000 Women |
| 15 to 19 years | 0 (0.0%) | 0.0 |
| 20 to 34 years | 0 (0.0%) | 0.0 |
| 35 to 50 years | 0 (0.0%) | 0.0 |
| Total | 0 (0.0%) | 0.0 |
Fertility by Age by Marriage Status in Belspring
| Age Bracket | Married | Unmarried |
| 15 to 19 years | 0 (0.0%) | 0 (0.0%) |
| 20 to 34 years | 0 (0.0%) | 0 (0.0%) |
| 35 to 50 years | 0 (0.0%) | 0 (0.0%) |
| Total | 0 (0.0%) | 0 (0.0%) |
Fertility by Education in Belspring
| Educational Attainment | Women with Births | Births / 1,000 Women |
| Less than High School | 0 (0.0%) | 0.0 |
| High School Diploma | 0 (0.0%) | 0.0 |
| College or Associate's Degree | 0 (0.0%) | 0.0 |
| Bachelor's Degree | 0 (0.0%) | 0.0 |
| Graduate Degree | 0 (0.0%) | 0.0 |
| Total | 0 (0.0%) | 0.0 |
Fertility by Education by Marriage Status in Belspring
| Educational Attainment | Married | Unmarried |
| Less than High School | 0 (0.0%) | 0 (0.0%) |
| High School Diploma | 0 (0.0%) | 0 (0.0%) |
| College or Associate's Degree | 0 (0.0%) | 0 (0.0%) |
| Bachelor's Degree | 0 (0.0%) | 0 (0.0%) |
| Graduate Degree | 0 (0.0%) | 0 (0.0%) |
| Total | 0 (0.0%) | 0 (0.0%) |
Employment Characteristics in Belspring
Employment by Class of Employer in Belspring
Among the 96 employed individuals in Belspring, private company employees (68 | 70.8%), state government employees (15 | 15.6%), and local government employees (13 | 13.5%) make up the most common classes of employment.
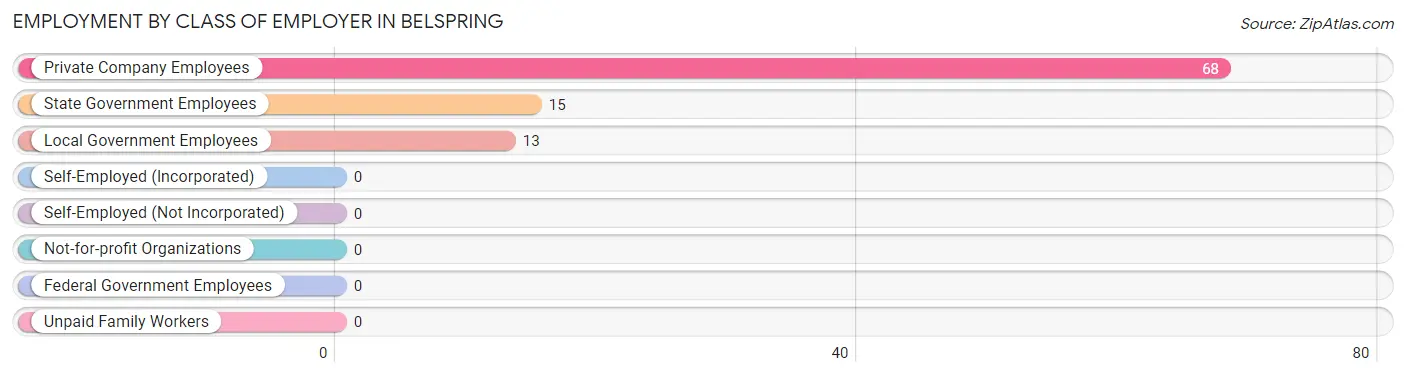
| Employer Class | # Employees | % Employees |
| Private Company Employees | 68 | 70.8% |
| Self-Employed (Incorporated) | 0 | 0.0% |
| Self-Employed (Not Incorporated) | 0 | 0.0% |
| Not-for-profit Organizations | 0 | 0.0% |
| Local Government Employees | 13 | 13.5% |
| State Government Employees | 15 | 15.6% |
| Federal Government Employees | 0 | 0.0% |
| Unpaid Family Workers | 0 | 0.0% |
| Total | 96 | 100.0% |
Employment Status by Age in Belspring
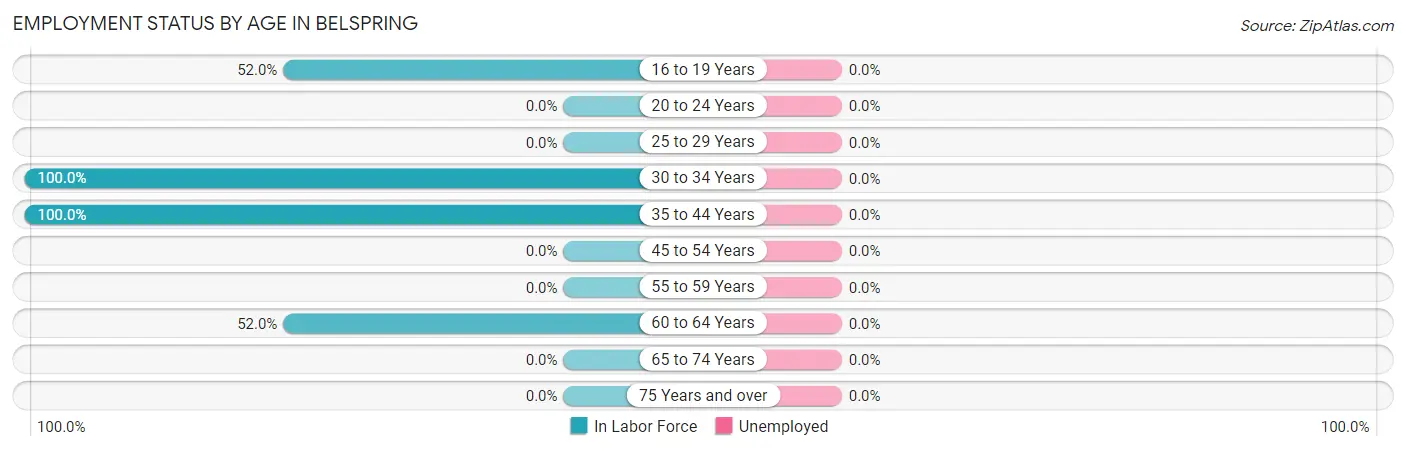
| Age Bracket | In Labor Force | Unemployed |
| 16 to 19 Years | 13 (52.0%) | 0 (0.0%) |
| 20 to 24 Years | 0 (0.0%) | 0 (0.0%) |
| 25 to 29 Years | 0 (0.0%) | 0 (0.0%) |
| 30 to 34 Years | 41 (100.0%) | 0 (0.0%) |
| 35 to 44 Years | 29 (100.0%) | 0 (0.0%) |
| 45 to 54 Years | 0 (0.0%) | 0 (0.0%) |
| 55 to 59 Years | 0 (0.0%) | 0 (0.0%) |
| 60 to 64 Years | 13 (52.0%) | 0 (0.0%) |
| 65 to 74 Years | 0 (0.0%) | 0 (0.0%) |
| 75 Years and over | 0 (0.0%) | 0 (0.0%) |
| Total | 96 (56.5%) | 0 (0.0%) |
Employment Status by Educational Attainment in Belspring
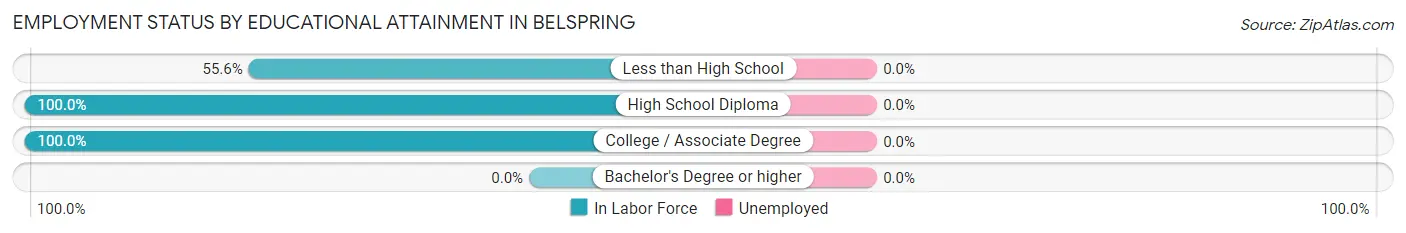
| Educational Attainment | In Labor Force | Unemployed |
| Less than High School | 15 (55.6%) | 0 (0.0%) |
| High School Diploma | 27 (100.0%) | 0 (0.0%) |
| College / Associate Degree | 41 (100.0%) | 0 (0.0%) |
| Bachelor's Degree or higher | 0 (0.0%) | 0 (0.0%) |
| Total | 83 (87.4%) | 0 (0.0%) |
Employment Occupations by Sex in Belspring
Management, Business, Science and Arts Occupations
The most common Management, Business, Science and Arts occupations in Belspring are Computers, Engineering & Science (15 | 15.6%), and Architecture & Engineering (15 | 15.6%).
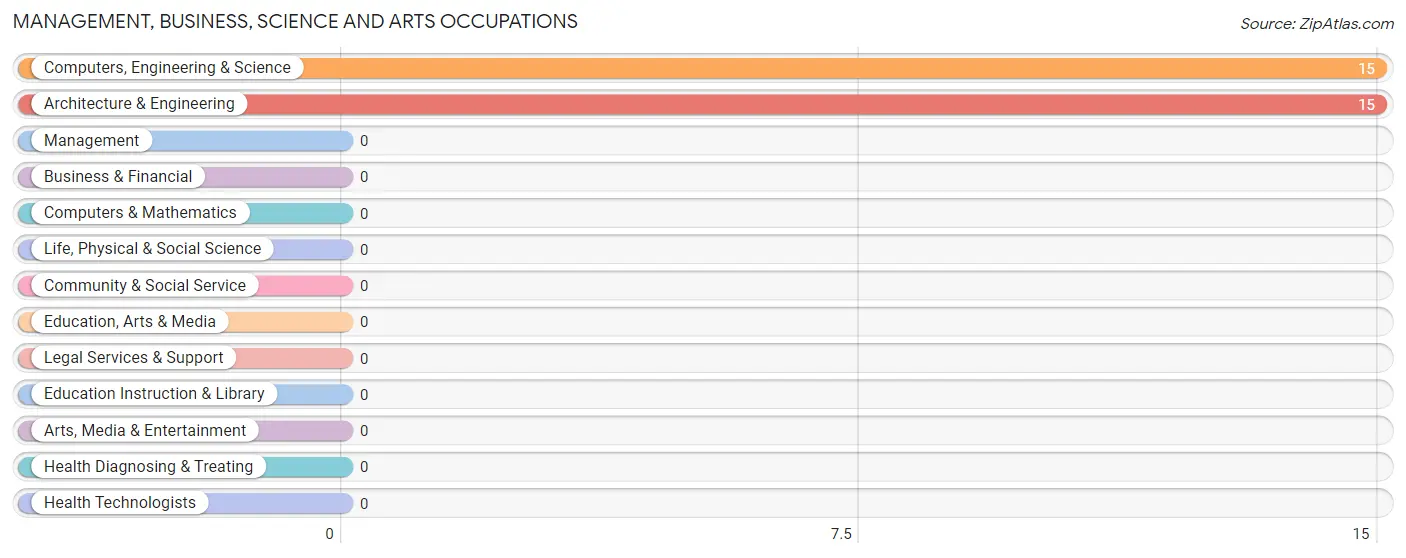
Management, Business, Science and Arts Occupations by Sex
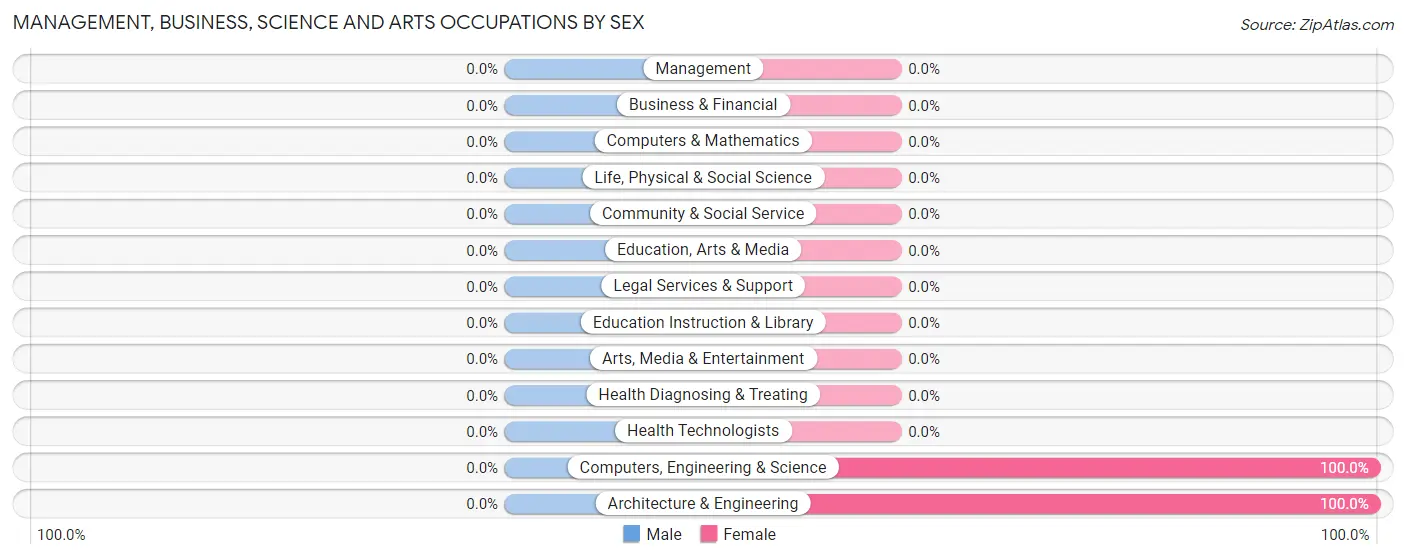
| Occupation | Male | Female |
| Management | 0 (0.0%) | 0 (0.0%) |
| Business & Financial | 0 (0.0%) | 0 (0.0%) |
| Computers, Engineering & Science | 0 (0.0%) | 15 (100.0%) |
| Computers & Mathematics | 0 (0.0%) | 0 (0.0%) |
| Architecture & Engineering | 0 (0.0%) | 15 (100.0%) |
| Life, Physical & Social Science | 0 (0.0%) | 0 (0.0%) |
| Community & Social Service | 0 (0.0%) | 0 (0.0%) |
| Education, Arts & Media | 0 (0.0%) | 0 (0.0%) |
| Legal Services & Support | 0 (0.0%) | 0 (0.0%) |
| Education Instruction & Library | 0 (0.0%) | 0 (0.0%) |
| Arts, Media & Entertainment | 0 (0.0%) | 0 (0.0%) |
| Health Diagnosing & Treating | 0 (0.0%) | 0 (0.0%) |
| Health Technologists | 0 (0.0%) | 0 (0.0%) |
| Total (Category) | 0 (0.0%) | 15 (100.0%) |
| Total (Overall) | 40 (41.7%) | 56 (58.3%) |
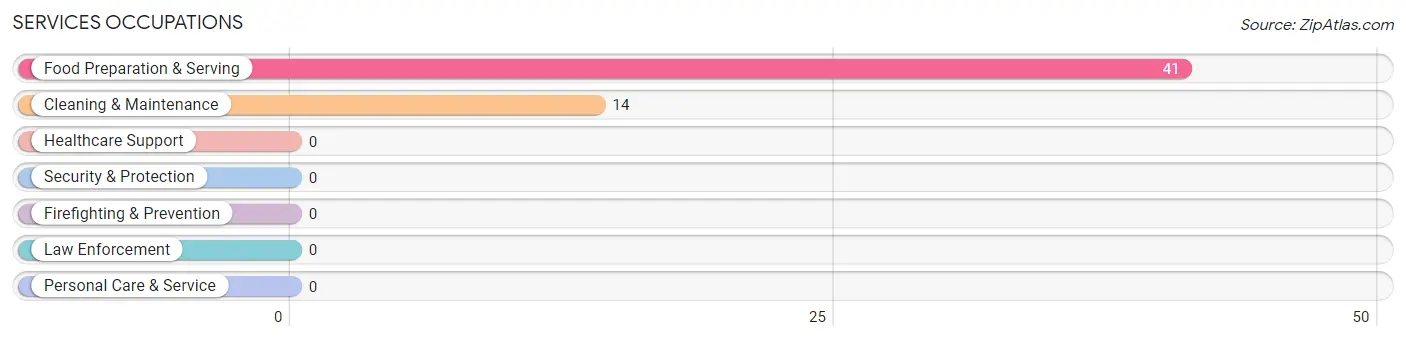
Services Occupations
The most common Services occupations in Belspring are Food Preparation & Serving (41 | 42.7%), and Cleaning & Maintenance (14 | 14.6%).
Services Occupations by Sex
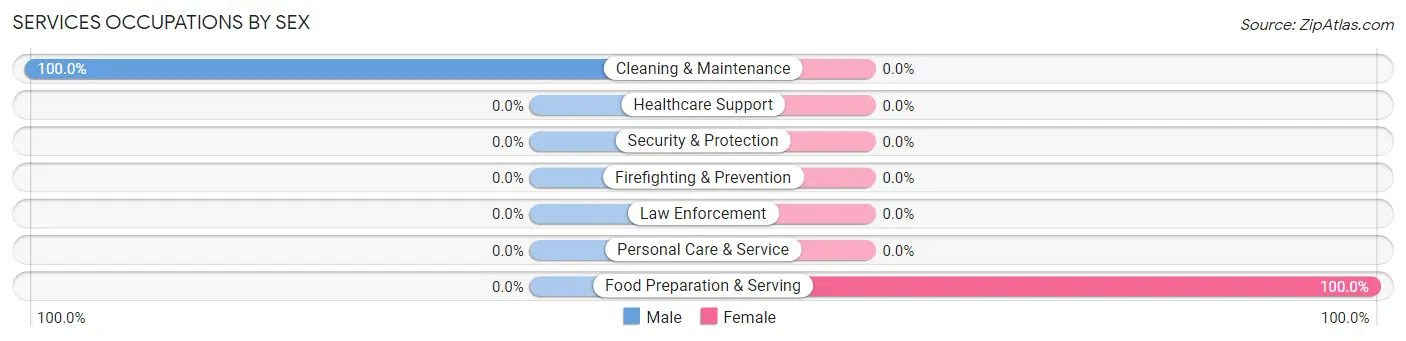
| Occupation | Male | Female |
| Healthcare Support | 0 (0.0%) | 0 (0.0%) |
| Security & Protection | 0 (0.0%) | 0 (0.0%) |
| Firefighting & Prevention | 0 (0.0%) | 0 (0.0%) |
| Law Enforcement | 0 (0.0%) | 0 (0.0%) |
| Food Preparation & Serving | 0 (0.0%) | 41 (100.0%) |
| Cleaning & Maintenance | 14 (100.0%) | 0 (0.0%) |
| Personal Care & Service | 0 (0.0%) | 0 (0.0%) |
| Total (Category) | 14 (25.5%) | 41 (74.6%) |
| Total (Overall) | 40 (41.7%) | 56 (58.3%) |
Sales and Office Occupations
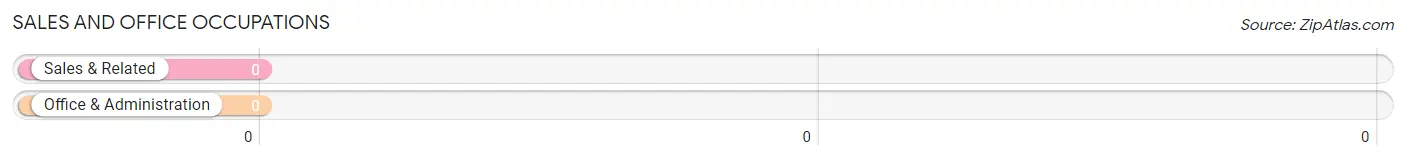
Sales and Office Occupations by Sex
| Occupation | Male | Female |
| Sales & Related | 0 (0.0%) | 0 (0.0%) |
| Office & Administration | 0 (0.0%) | 0 (0.0%) |
| Total (Category) | 0 (0.0%) | 0 (0.0%) |
| Total (Overall) | 40 (41.7%) | 56 (58.3%) |
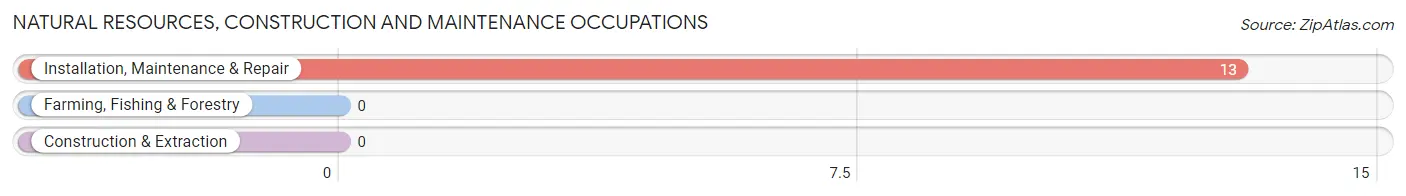
Natural Resources, Construction and Maintenance Occupations
The most common Natural Resources, Construction and Maintenance occupations in Belspring are , and Installation, Maintenance & Repair (13 | 13.5%).
Natural Resources, Construction and Maintenance Occupations by Sex
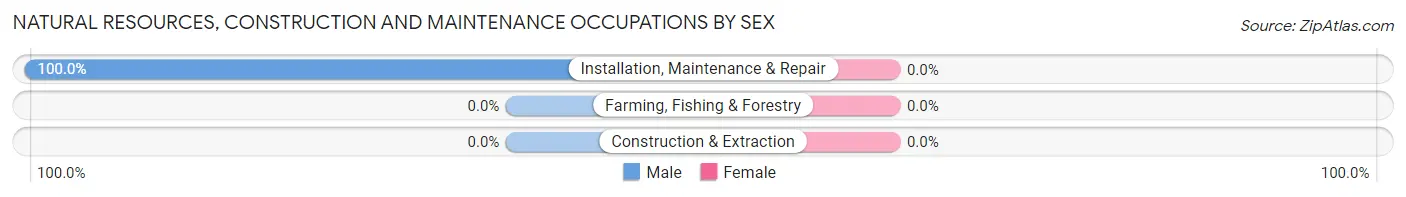
| Occupation | Male | Female |
| Farming, Fishing & Forestry | 0 (0.0%) | 0 (0.0%) |
| Construction & Extraction | 0 (0.0%) | 0 (0.0%) |
| Installation, Maintenance & Repair | 13 (100.0%) | 0 (0.0%) |
| Total (Category) | 13 (100.0%) | 0 (0.0%) |
| Total (Overall) | 40 (41.7%) | 56 (58.3%) |
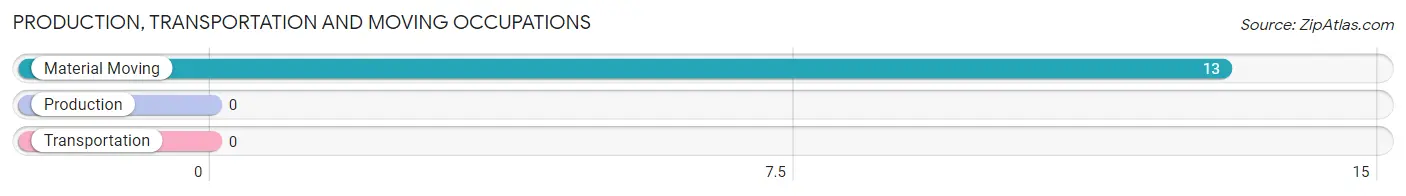
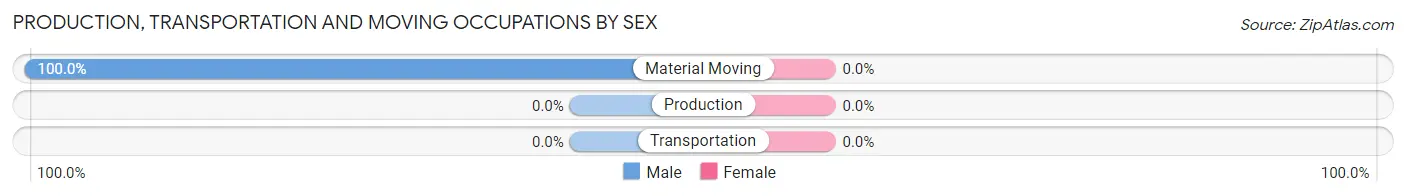
Production, Transportation and Moving Occupations
The most common Production, Transportation and Moving occupations in Belspring are , and Material Moving (13 | 13.5%).
Production, Transportation and Moving Occupations by Sex
| Occupation | Male | Female |
| Production | 0 (0.0%) | 0 (0.0%) |
| Transportation | 0 (0.0%) | 0 (0.0%) |
| Material Moving | 13 (100.0%) | 0 (0.0%) |
| Total (Category) | 13 (100.0%) | 0 (0.0%) |
| Total (Overall) | 40 (41.7%) | 56 (58.3%) |
Employment Industries by Sex in Belspring
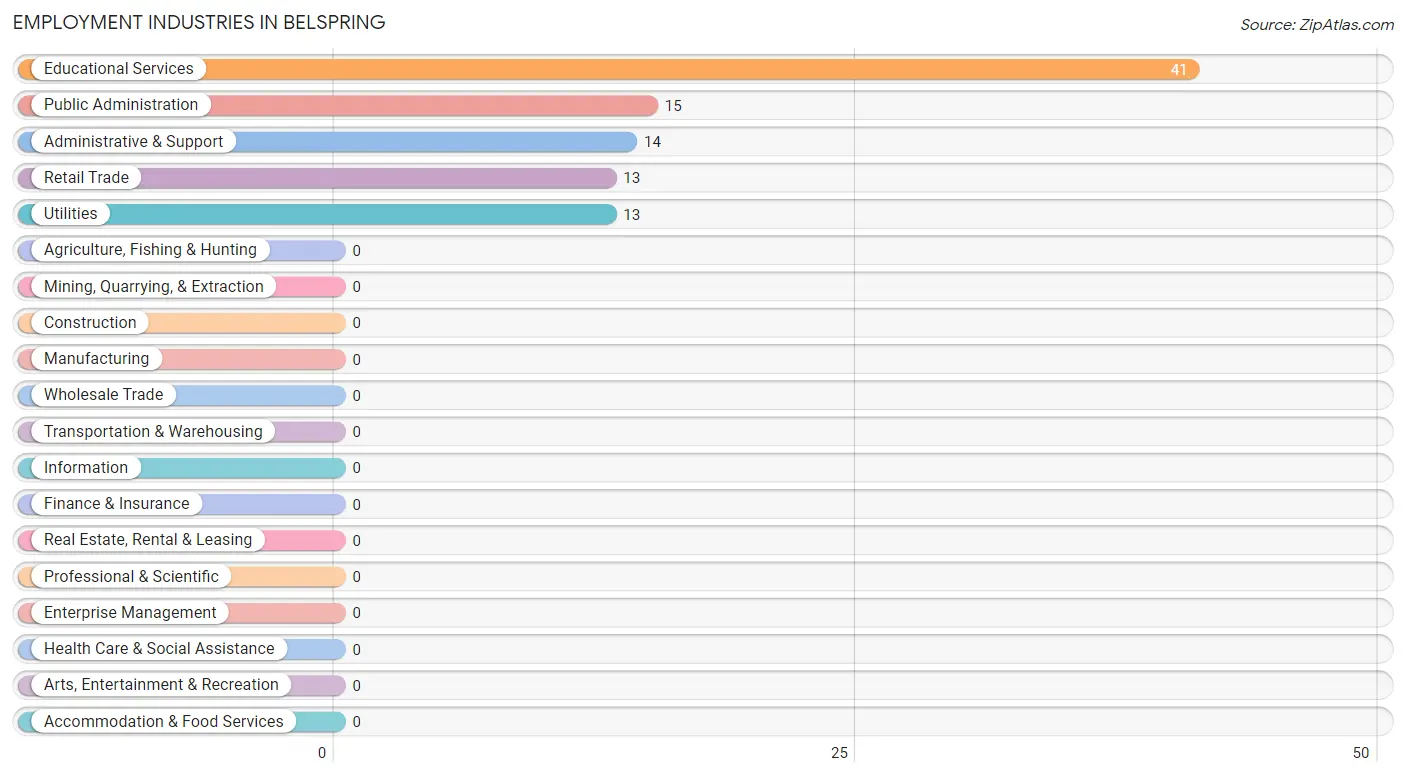
Employment Industries in Belspring
The major employment industries in Belspring include Educational Services (41 | 42.7%), Public Administration (15 | 15.6%), Administrative & Support (14 | 14.6%), Retail Trade (13 | 13.5%), and Utilities (13 | 13.5%).
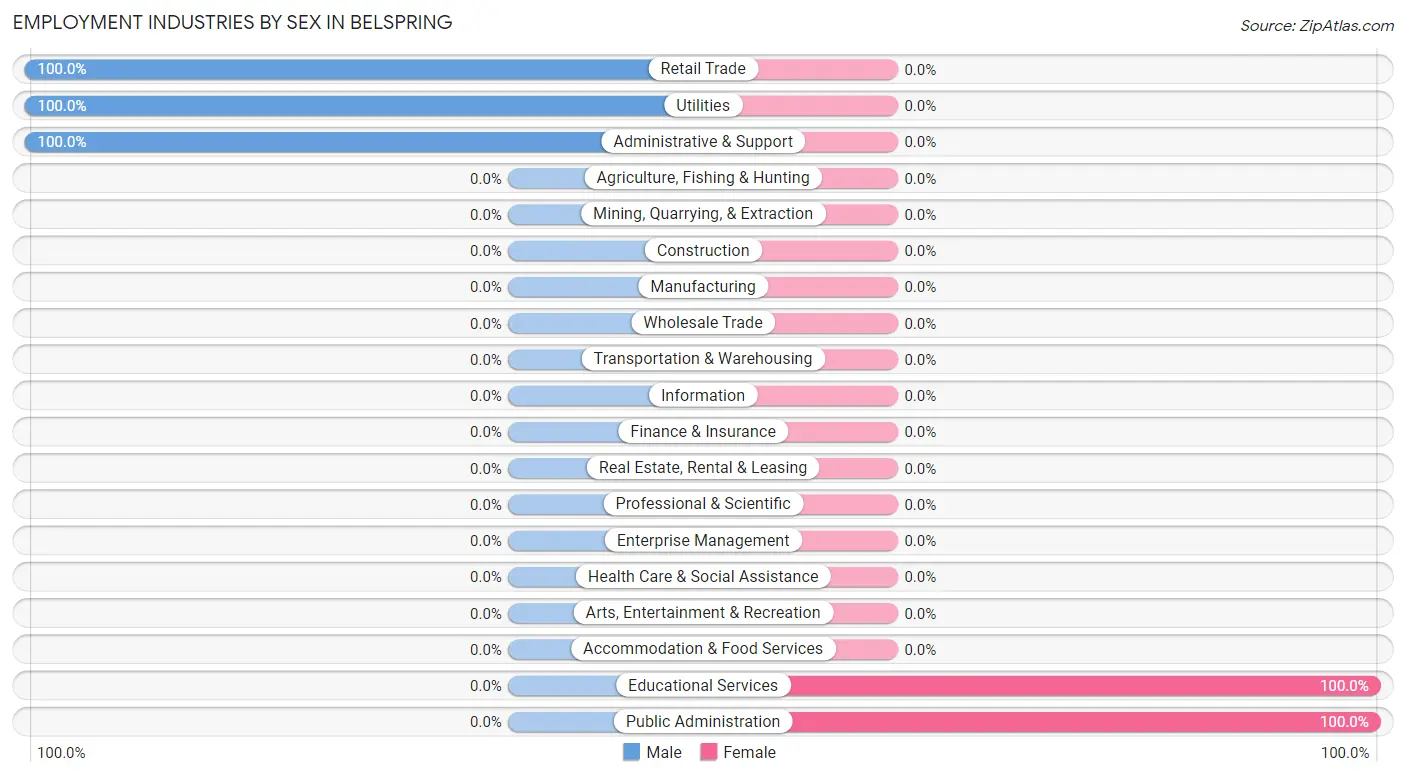
Employment Industries by Sex in Belspring
The Belspring industries that see more men than women are Retail Trade (100.0%), Utilities (100.0%), and Administrative & Support (100.0%), whereas the industries that tend to have a higher number of women are Educational Services (100.0%), and Public Administration (100.0%).
| Industry | Male | Female |
| Agriculture, Fishing & Hunting | 0 (0.0%) | 0 (0.0%) |
| Mining, Quarrying, & Extraction | 0 (0.0%) | 0 (0.0%) |
| Construction | 0 (0.0%) | 0 (0.0%) |
| Manufacturing | 0 (0.0%) | 0 (0.0%) |
| Wholesale Trade | 0 (0.0%) | 0 (0.0%) |
| Retail Trade | 13 (100.0%) | 0 (0.0%) |
| Transportation & Warehousing | 0 (0.0%) | 0 (0.0%) |
| Utilities | 13 (100.0%) | 0 (0.0%) |
| Information | 0 (0.0%) | 0 (0.0%) |
| Finance & Insurance | 0 (0.0%) | 0 (0.0%) |
| Real Estate, Rental & Leasing | 0 (0.0%) | 0 (0.0%) |
| Professional & Scientific | 0 (0.0%) | 0 (0.0%) |
| Enterprise Management | 0 (0.0%) | 0 (0.0%) |
| Administrative & Support | 14 (100.0%) | 0 (0.0%) |
| Educational Services | 0 (0.0%) | 41 (100.0%) |
| Health Care & Social Assistance | 0 (0.0%) | 0 (0.0%) |
| Arts, Entertainment & Recreation | 0 (0.0%) | 0 (0.0%) |
| Accommodation & Food Services | 0 (0.0%) | 0 (0.0%) |
| Public Administration | 0 (0.0%) | 15 (100.0%) |
| Total | 40 (41.7%) | 56 (58.3%) |
Education in Belspring
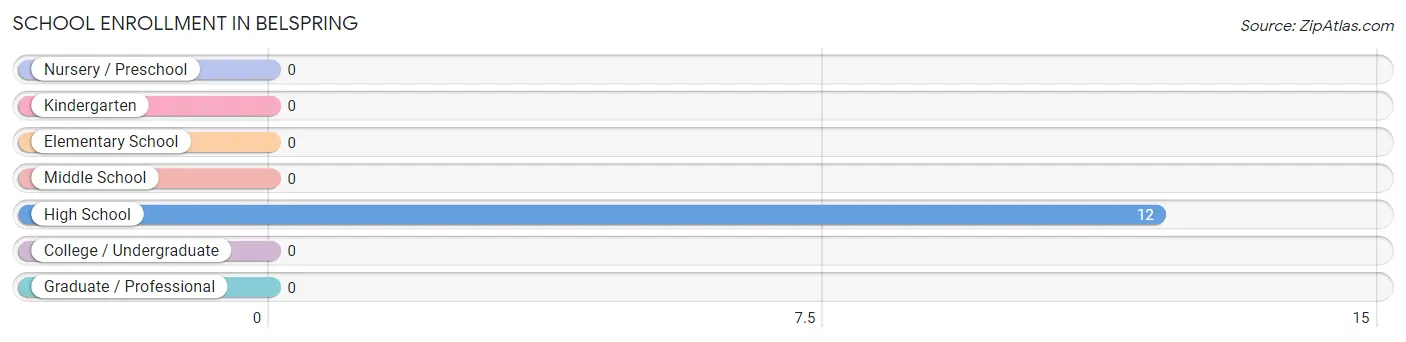
School Enrollment in Belspring
| School Level | # Students | % Students |
| Nursery / Preschool | 0 | 0.0% |
| Kindergarten | 0 | 0.0% |
| Elementary School | 0 | 0.0% |
| Middle School | 0 | 0.0% |
| High School | 12 | 100.0% |
| College / Undergraduate | 0 | 0.0% |
| Graduate / Professional | 0 | 0.0% |
| Total | 12 | 100.0% |
School Enrollment by Age by Funding Source in Belspring
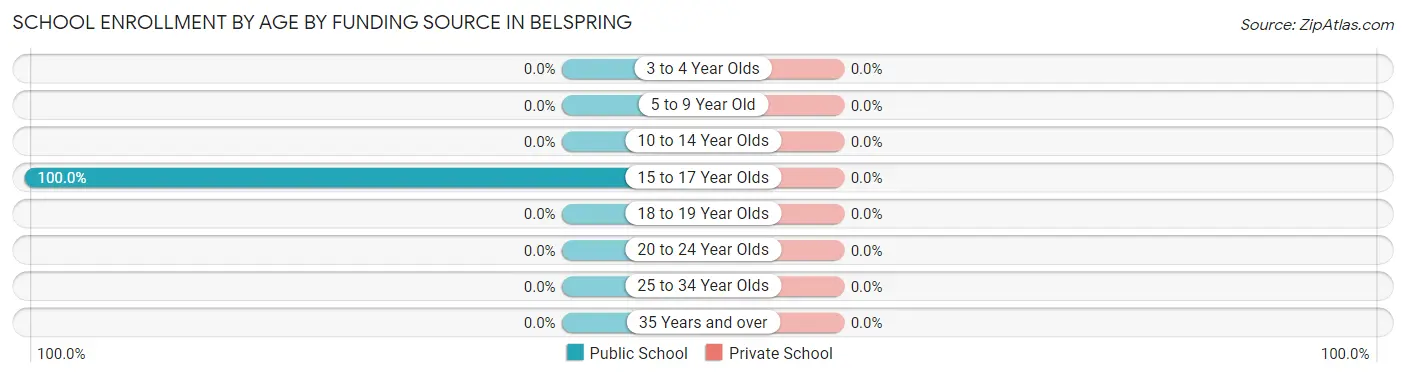
| Age Bracket | Public School | Private School |
| 3 to 4 Year Olds | 0 (0.0%) | 0 (0.0%) |
| 5 to 9 Year Old | 0 (0.0%) | 0 (0.0%) |
| 10 to 14 Year Olds | 0 (0.0%) | 0 (0.0%) |
| 15 to 17 Year Olds | 12 (100.0%) | 0 (0.0%) |
| 18 to 19 Year Olds | 0 (0.0%) | 0 (0.0%) |
| 20 to 24 Year Olds | 0 (0.0%) | 0 (0.0%) |
| 25 to 34 Year Olds | 0 (0.0%) | 0 (0.0%) |
| 35 Years and over | 0 (0.0%) | 0 (0.0%) |
| Total | 12 (100.0%) | 0 (0.0%) |
Educational Attainment by Field of Study in Belspring
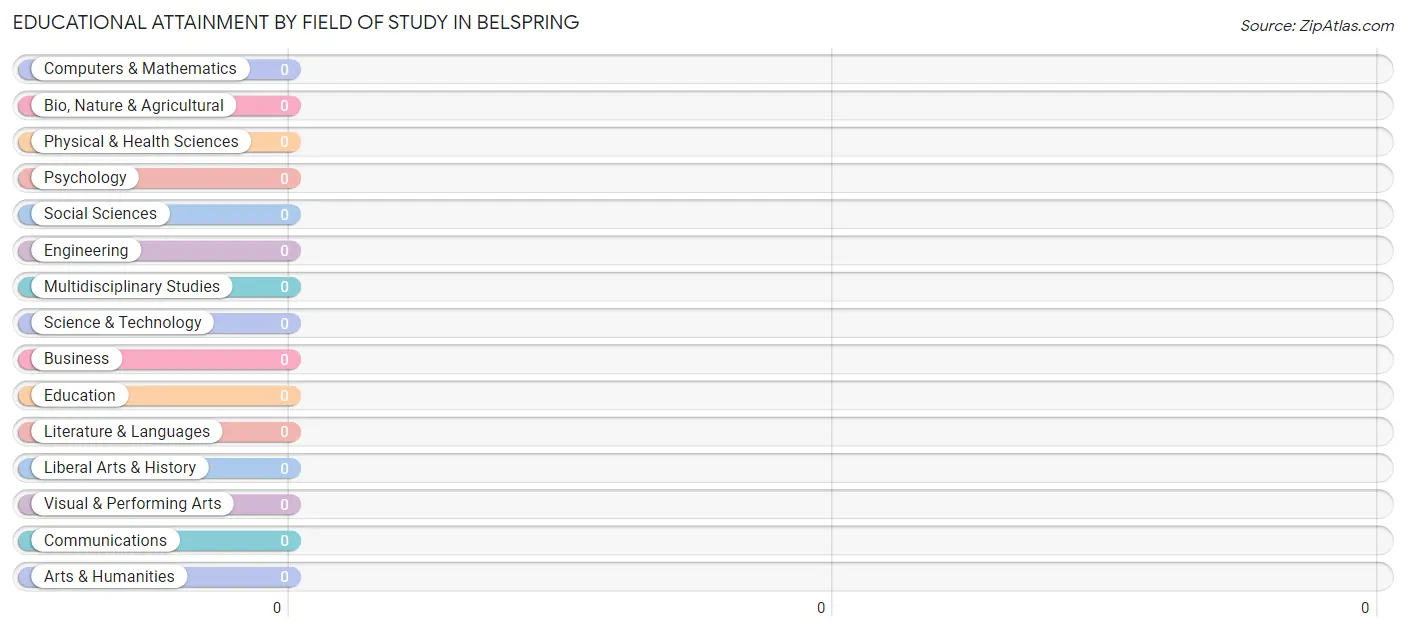
| Field of Study | # Graduates | % Graduates |
| Computers & Mathematics | 0 | 0.0% |
| Bio, Nature & Agricultural | 0 | 0.0% |
| Physical & Health Sciences | 0 | 0.0% |
| Psychology | 0 | 0.0% |
| Social Sciences | 0 | 0.0% |
| Engineering | 0 | 0.0% |
| Multidisciplinary Studies | 0 | 0.0% |
| Science & Technology | 0 | 0.0% |
| Business | 0 | 0.0% |
| Education | 0 | 0.0% |
| Literature & Languages | 0 | 0.0% |
| Liberal Arts & History | 0 | 0.0% |
| Visual & Performing Arts | 0 | 0.0% |
| Communications | 0 | 0.0% |
| Arts & Humanities | 0 | 0.0% |
| Total | 0 | 0.0% |
Transportation & Commute in Belspring
Vehicle Availability by Sex in Belspring
The most prevalent vehicle ownership categories in Belspring are males with 4 vehicles (40, accounting for 100.0%) and females with 4 vehicles (15, making up 71.4%).
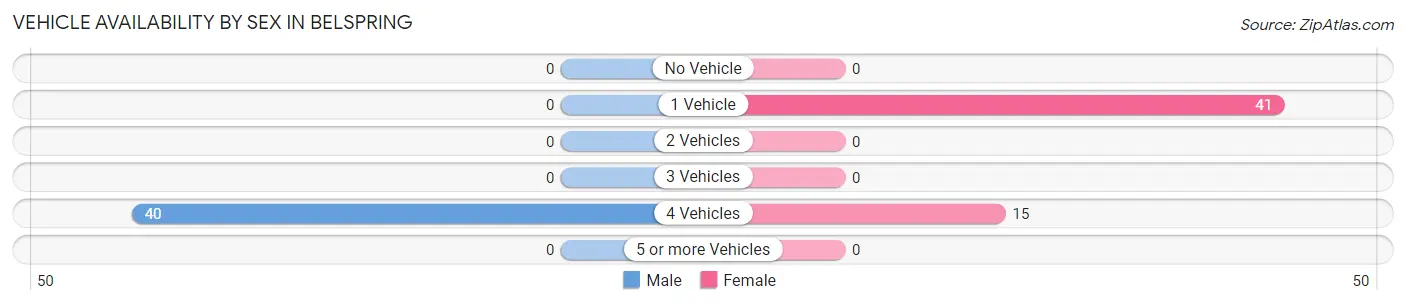
| Vehicles Available | Male | Female |
| No Vehicle | 0 (0.0%) | 0 (0.0%) |
| 1 Vehicle | 0 (0.0%) | 41 (73.2%) |
| 2 Vehicles | 0 (0.0%) | 0 (0.0%) |
| 3 Vehicles | 0 (0.0%) | 0 (0.0%) |
| 4 Vehicles | 40 (100.0%) | 15 (26.8%) |
| 5 or more Vehicles | 0 (0.0%) | 0 (0.0%) |
| Total | 40 (100.0%) | 56 (100.0%) |
Commute Time in Belspring
The most frequently occuring commute durations in Belspring are 90 or more minutes (55 commuters, 57.3%), 20 to 24 minutes (41 commuters, 42.7%), and less than 5 minutes (0 commuters, 0.0%).
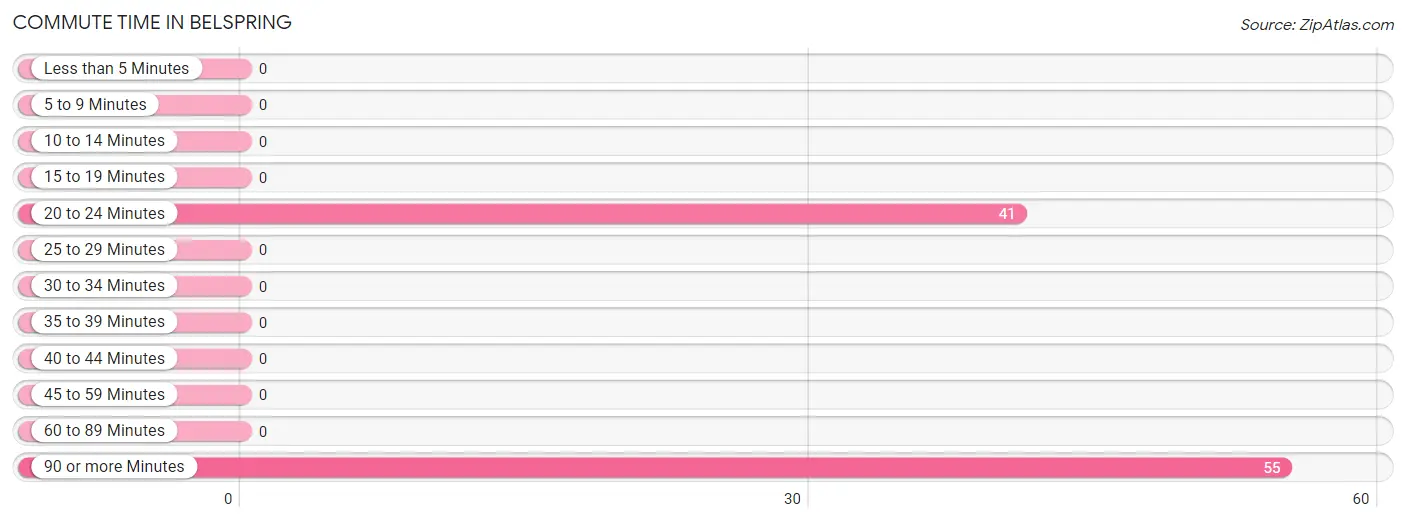
| Commute Time | # Commuters | % Commuters |
| Less than 5 Minutes | 0 | 0.0% |
| 5 to 9 Minutes | 0 | 0.0% |
| 10 to 14 Minutes | 0 | 0.0% |
| 15 to 19 Minutes | 0 | 0.0% |
| 20 to 24 Minutes | 41 | 42.7% |
| 25 to 29 Minutes | 0 | 0.0% |
| 30 to 34 Minutes | 0 | 0.0% |
| 35 to 39 Minutes | 0 | 0.0% |
| 40 to 44 Minutes | 0 | 0.0% |
| 45 to 59 Minutes | 0 | 0.0% |
| 60 to 89 Minutes | 0 | 0.0% |
| 90 or more Minutes | 55 | 57.3% |
Commute Time by Sex in Belspring
The most common commute times in Belspring are 90 or more minutes (40 commuters, 100.0%) for males and 20 to 24 minutes (41 commuters, 73.2%) for females.
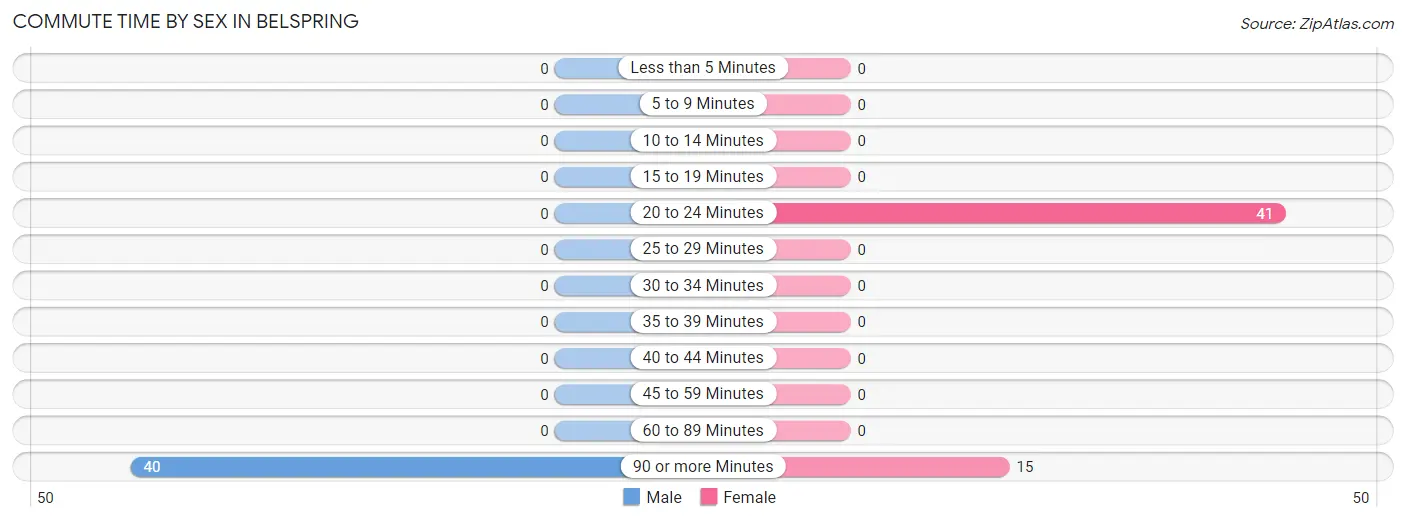
| Commute Time | Male | Female |
| Less than 5 Minutes | 0 (0.0%) | 0 (0.0%) |
| 5 to 9 Minutes | 0 (0.0%) | 0 (0.0%) |
| 10 to 14 Minutes | 0 (0.0%) | 0 (0.0%) |
| 15 to 19 Minutes | 0 (0.0%) | 0 (0.0%) |
| 20 to 24 Minutes | 0 (0.0%) | 41 (73.2%) |
| 25 to 29 Minutes | 0 (0.0%) | 0 (0.0%) |
| 30 to 34 Minutes | 0 (0.0%) | 0 (0.0%) |
| 35 to 39 Minutes | 0 (0.0%) | 0 (0.0%) |
| 40 to 44 Minutes | 0 (0.0%) | 0 (0.0%) |
| 45 to 59 Minutes | 0 (0.0%) | 0 (0.0%) |
| 60 to 89 Minutes | 0 (0.0%) | 0 (0.0%) |
| 90 or more Minutes | 40 (100.0%) | 15 (26.8%) |
Time of Departure to Work by Sex in Belspring
The most frequent times of departure to work in Belspring are 7:30 AM to 7:59 AM (14, 35.0%) for males and 12:00 PM to 3:59 PM (41, 73.2%) for females.
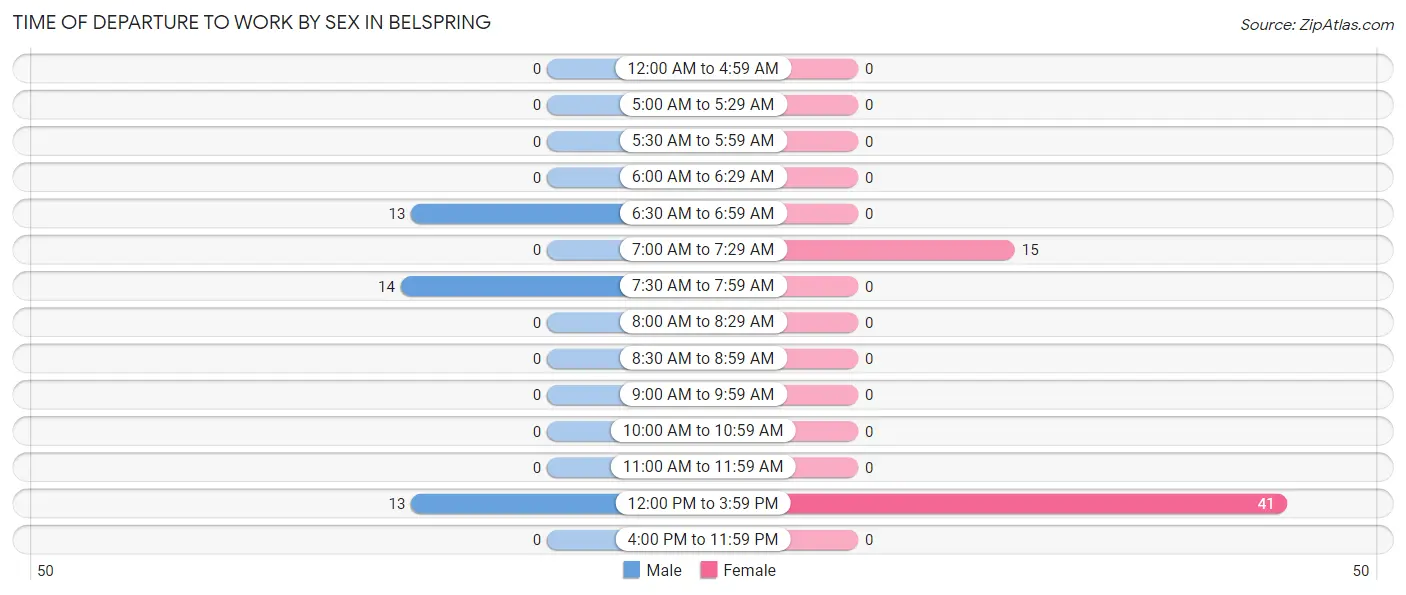
| Time of Departure | Male | Female |
| 12:00 AM to 4:59 AM | 0 (0.0%) | 0 (0.0%) |
| 5:00 AM to 5:29 AM | 0 (0.0%) | 0 (0.0%) |
| 5:30 AM to 5:59 AM | 0 (0.0%) | 0 (0.0%) |
| 6:00 AM to 6:29 AM | 0 (0.0%) | 0 (0.0%) |
| 6:30 AM to 6:59 AM | 13 (32.5%) | 0 (0.0%) |
| 7:00 AM to 7:29 AM | 0 (0.0%) | 15 (26.8%) |
| 7:30 AM to 7:59 AM | 14 (35.0%) | 0 (0.0%) |
| 8:00 AM to 8:29 AM | 0 (0.0%) | 0 (0.0%) |
| 8:30 AM to 8:59 AM | 0 (0.0%) | 0 (0.0%) |
| 9:00 AM to 9:59 AM | 0 (0.0%) | 0 (0.0%) |
| 10:00 AM to 10:59 AM | 0 (0.0%) | 0 (0.0%) |
| 11:00 AM to 11:59 AM | 0 (0.0%) | 0 (0.0%) |
| 12:00 PM to 3:59 PM | 13 (32.5%) | 41 (73.2%) |
| 4:00 PM to 11:59 PM | 0 (0.0%) | 0 (0.0%) |
| Total | 40 (100.0%) | 56 (100.0%) |
Housing Occupancy in Belspring
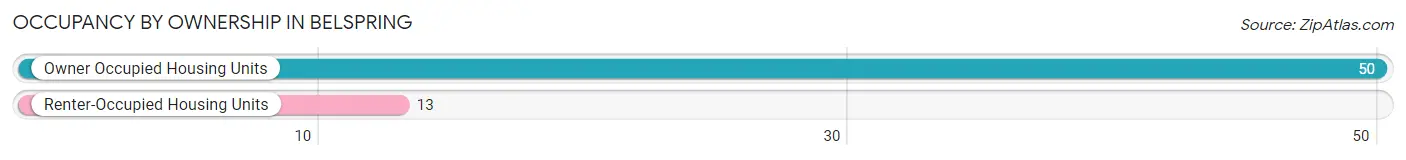
Occupancy by Ownership in Belspring
Of the total 63 dwellings in Belspring, owner-occupied units account for 50 (79.4%), while renter-occupied units make up 13 (20.6%).
| Occupancy | # Housing Units | % Housing Units |
| Owner Occupied Housing Units | 50 | 79.4% |
| Renter-Occupied Housing Units | 13 | 20.6% |
| Total Occupied Housing Units | 63 | 100.0% |
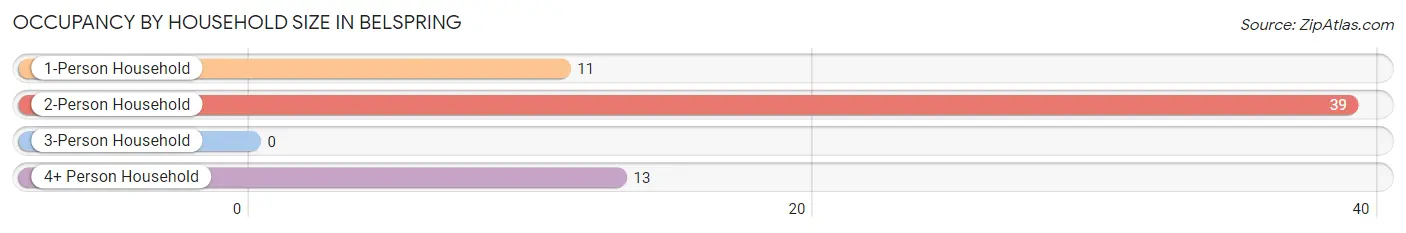
Occupancy by Household Size in Belspring
| Household Size | # Housing Units | % Housing Units |
| 1-Person Household | 11 | 17.5% |
| 2-Person Household | 39 | 61.9% |
| 3-Person Household | 0 | 0.0% |
| 4+ Person Household | 13 | 20.6% |
| Total Housing Units | 63 | 100.0% |
Occupancy by Ownership by Household Size in Belspring
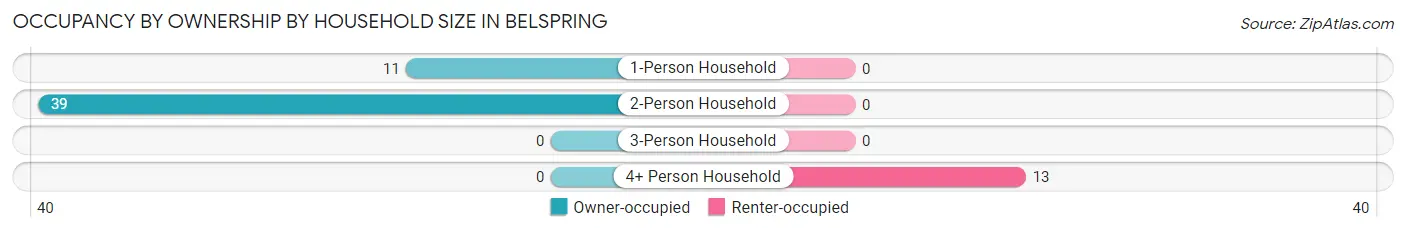
| Household Size | Owner-occupied | Renter-occupied |
| 1-Person Household | 11 (100.0%) | 0 (0.0%) |
| 2-Person Household | 39 (100.0%) | 0 (0.0%) |
| 3-Person Household | 0 (0.0%) | 0 (0.0%) |
| 4+ Person Household | 0 (0.0%) | 13 (100.0%) |
| Total Housing Units | 50 (79.4%) | 13 (20.6%) |
Occupancy by Educational Attainment in Belspring
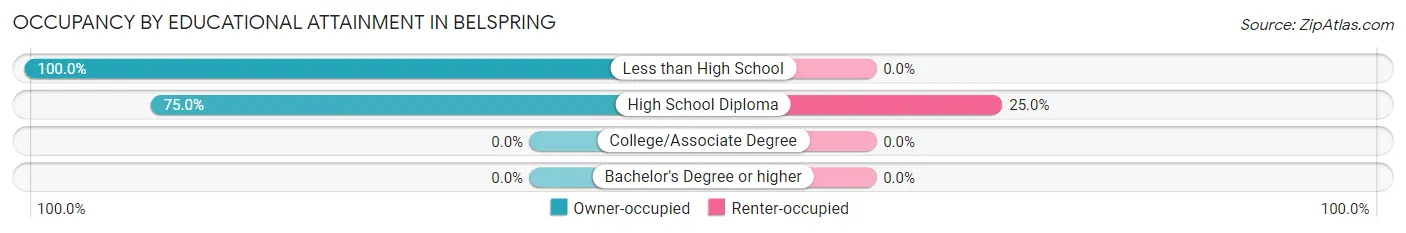
| Household Size | Owner-occupied | Renter-occupied |
| Less than High School | 11 (100.0%) | 0 (0.0%) |
| High School Diploma | 39 (75.0%) | 13 (25.0%) |
| College/Associate Degree | 0 (0.0%) | 0 (0.0%) |
| Bachelor's Degree or higher | 0 (0.0%) | 0 (0.0%) |
Occupancy by Age of Householder in Belspring
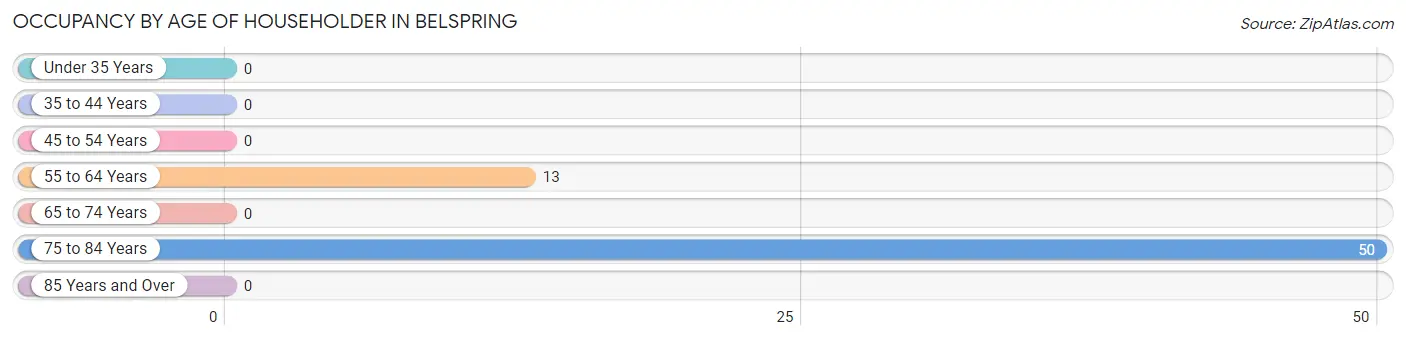
| Age Bracket | # Households | % Households |
| Under 35 Years | 0 | 0.0% |
| 35 to 44 Years | 0 | 0.0% |
| 45 to 54 Years | 0 | 0.0% |
| 55 to 64 Years | 13 | 20.6% |
| 65 to 74 Years | 0 | 0.0% |
| 75 to 84 Years | 50 | 79.4% |
| 85 Years and Over | 0 | 0.0% |
| Total | 63 | 100.0% |
Housing Finances in Belspring
Median Income by Occupancy in Belspring
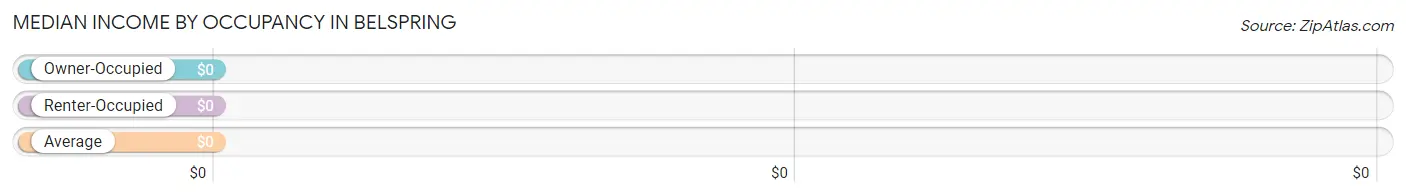
| Occupancy Type | # Households | Median Income |
| Owner-Occupied | 50 (79.4%) | $0 |
| Renter-Occupied | 13 (20.6%) | $0 |
| Average | 63 (100.0%) | $0 |
Occupancy by Householder Income Bracket in Belspring
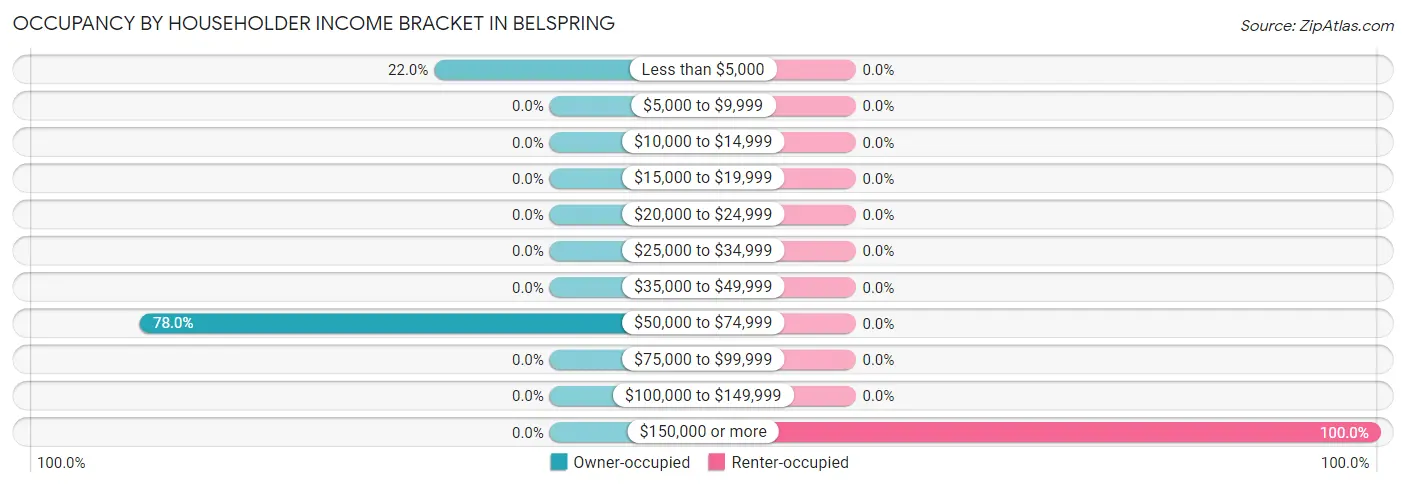
| Income Bracket | Owner-occupied | Renter-occupied |
| Less than $5,000 | 11 (22.0%) | 0 (0.0%) |
| $5,000 to $9,999 | 0 (0.0%) | 0 (0.0%) |
| $10,000 to $14,999 | 0 (0.0%) | 0 (0.0%) |
| $15,000 to $19,999 | 0 (0.0%) | 0 (0.0%) |
| $20,000 to $24,999 | 0 (0.0%) | 0 (0.0%) |
| $25,000 to $34,999 | 0 (0.0%) | 0 (0.0%) |
| $35,000 to $49,999 | 0 (0.0%) | 0 (0.0%) |
| $50,000 to $74,999 | 39 (78.0%) | 0 (0.0%) |
| $75,000 to $99,999 | 0 (0.0%) | 0 (0.0%) |
| $100,000 to $149,999 | 0 (0.0%) | 0 (0.0%) |
| $150,000 or more | 0 (0.0%) | 13 (100.0%) |
| Total | 50 (100.0%) | 13 (100.0%) |
Monthly Housing Cost Tiers in Belspring
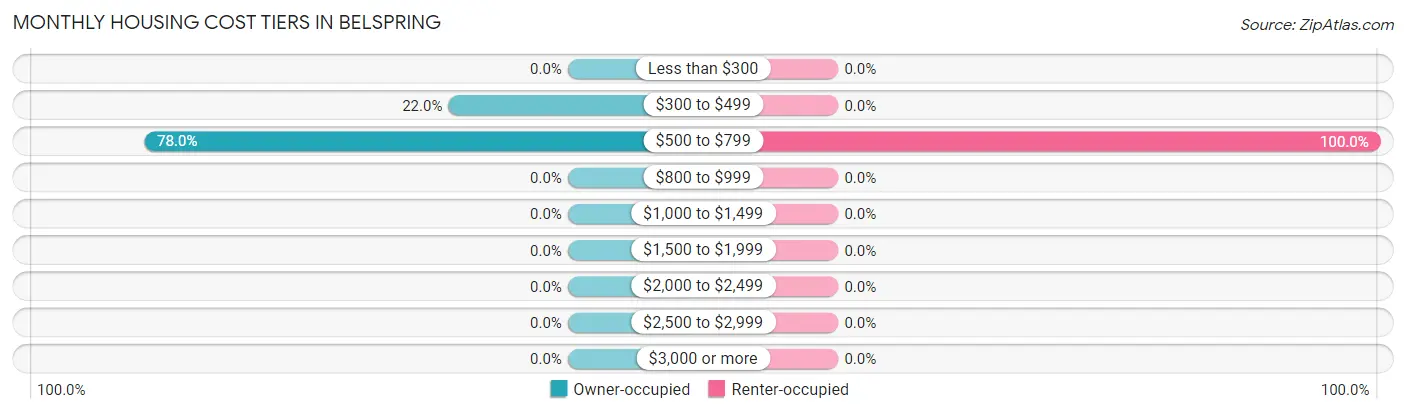
| Monthly Cost | Owner-occupied | Renter-occupied |
| Less than $300 | 0 (0.0%) | 0 (0.0%) |
| $300 to $499 | 11 (22.0%) | 0 (0.0%) |
| $500 to $799 | 39 (78.0%) | 13 (100.0%) |
| $800 to $999 | 0 (0.0%) | 0 (0.0%) |
| $1,000 to $1,499 | 0 (0.0%) | 0 (0.0%) |
| $1,500 to $1,999 | 0 (0.0%) | 0 (0.0%) |
| $2,000 to $2,499 | 0 (0.0%) | 0 (0.0%) |
| $2,500 to $2,999 | 0 (0.0%) | 0 (0.0%) |
| $3,000 or more | 0 (0.0%) | 0 (0.0%) |
| Total | 50 (100.0%) | 13 (100.0%) |
Physical Housing Characteristics in Belspring
Housing Structures in Belspring
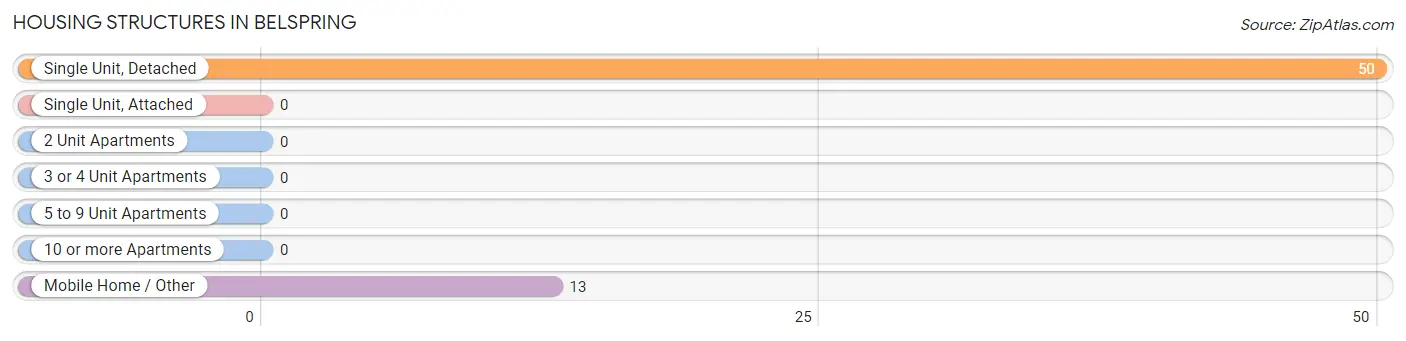
| Structure Type | # Housing Units | % Housing Units |
| Single Unit, Detached | 50 | 79.4% |
| Single Unit, Attached | 0 | 0.0% |
| 2 Unit Apartments | 0 | 0.0% |
| 3 or 4 Unit Apartments | 0 | 0.0% |
| 5 to 9 Unit Apartments | 0 | 0.0% |
| 10 or more Apartments | 0 | 0.0% |
| Mobile Home / Other | 13 | 20.6% |
| Total | 63 | 100.0% |
Housing Structures by Occupancy in Belspring
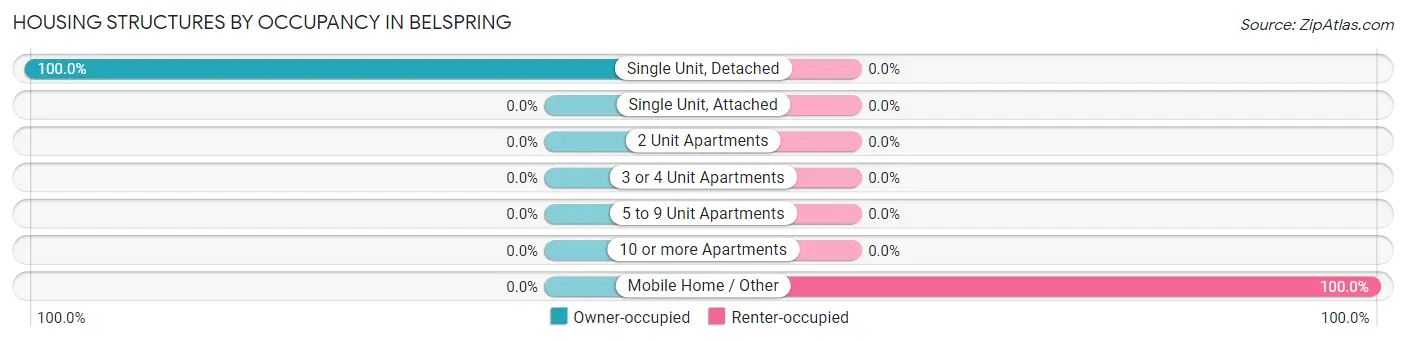
| Structure Type | Owner-occupied | Renter-occupied |
| Single Unit, Detached | 50 (100.0%) | 0 (0.0%) |
| Single Unit, Attached | 0 (0.0%) | 0 (0.0%) |
| 2 Unit Apartments | 0 (0.0%) | 0 (0.0%) |
| 3 or 4 Unit Apartments | 0 (0.0%) | 0 (0.0%) |
| 5 to 9 Unit Apartments | 0 (0.0%) | 0 (0.0%) |
| 10 or more Apartments | 0 (0.0%) | 0 (0.0%) |
| Mobile Home / Other | 0 (0.0%) | 13 (100.0%) |
| Total | 50 (79.4%) | 13 (20.6%) |
Housing Structures by Number of Rooms in Belspring
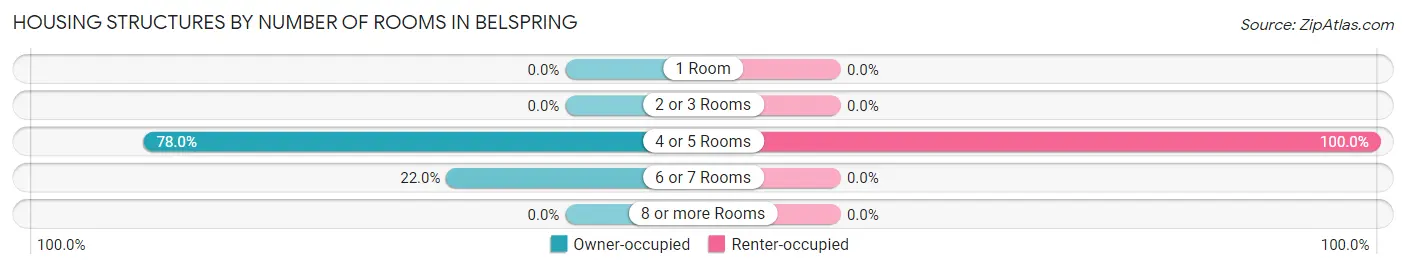
| Number of Rooms | Owner-occupied | Renter-occupied |
| 1 Room | 0 (0.0%) | 0 (0.0%) |
| 2 or 3 Rooms | 0 (0.0%) | 0 (0.0%) |
| 4 or 5 Rooms | 39 (78.0%) | 13 (100.0%) |
| 6 or 7 Rooms | 11 (22.0%) | 0 (0.0%) |
| 8 or more Rooms | 0 (0.0%) | 0 (0.0%) |
| Total | 50 (100.0%) | 13 (100.0%) |
Housing Structure by Heating Type in Belspring
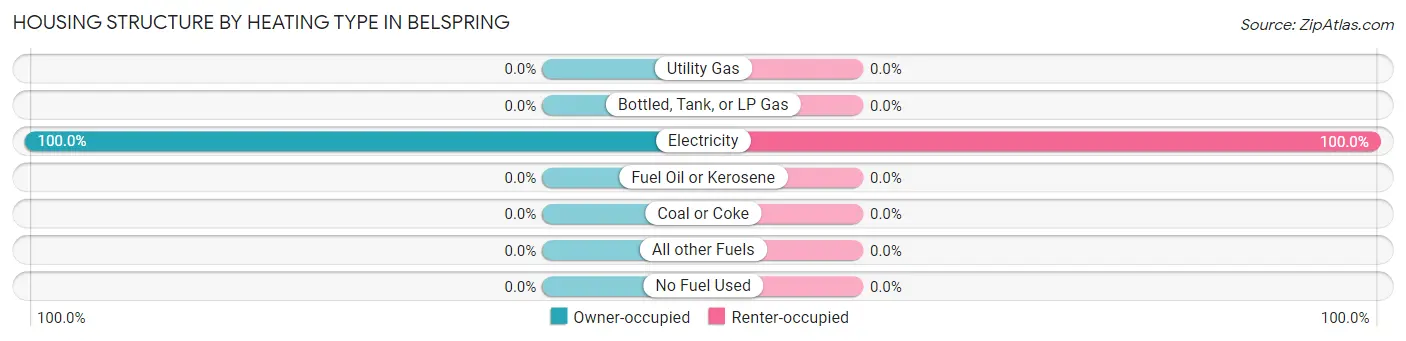
| Heating Type | Owner-occupied | Renter-occupied |
| Utility Gas | 0 (0.0%) | 0 (0.0%) |
| Bottled, Tank, or LP Gas | 0 (0.0%) | 0 (0.0%) |
| Electricity | 50 (100.0%) | 13 (100.0%) |
| Fuel Oil or Kerosene | 0 (0.0%) | 0 (0.0%) |
| Coal or Coke | 0 (0.0%) | 0 (0.0%) |
| All other Fuels | 0 (0.0%) | 0 (0.0%) |
| No Fuel Used | 0 (0.0%) | 0 (0.0%) |
| Total | 50 (100.0%) | 13 (100.0%) |
Household Vehicle Usage in Belspring
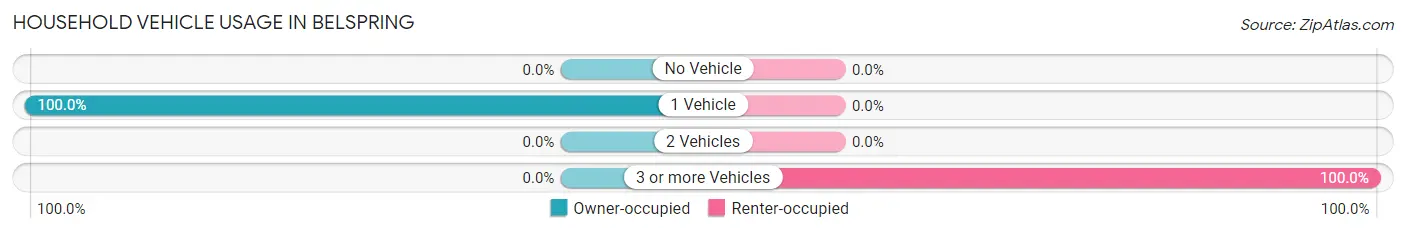
| Vehicles per Household | Owner-occupied | Renter-occupied |
| No Vehicle | 0 (0.0%) | 0 (0.0%) |
| 1 Vehicle | 50 (100.0%) | 0 (0.0%) |
| 2 Vehicles | 0 (0.0%) | 0 (0.0%) |
| 3 or more Vehicles | 0 (0.0%) | 13 (100.0%) |
| Total | 50 (100.0%) | 13 (100.0%) |
Real Estate & Mortgages in Belspring
Real Estate and Mortgage Overview in Belspring
| Characteristic | Without Mortgage | With Mortgage |
| Housing Units | 50 | 0 |
| Median Property Value | - | - |
| Median Household Income | - | - |
| Monthly Housing Costs | - | - |
| Real Estate Taxes | - | - |
Property Value by Mortgage Status in Belspring
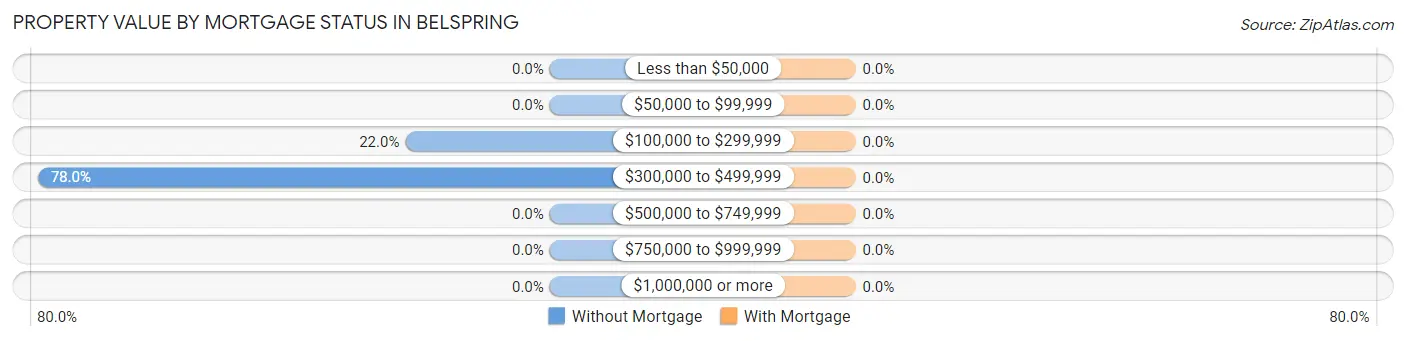
| Property Value | Without Mortgage | With Mortgage |
| Less than $50,000 | 0 (0.0%) | 0 (0.0%) |
| $50,000 to $99,999 | 0 (0.0%) | 0 (0.0%) |
| $100,000 to $299,999 | 11 (22.0%) | 0 (0.0%) |
| $300,000 to $499,999 | 39 (78.0%) | 0 (0.0%) |
| $500,000 to $749,999 | 0 (0.0%) | 0 (0.0%) |
| $750,000 to $999,999 | 0 (0.0%) | 0 (0.0%) |
| $1,000,000 or more | 0 (0.0%) | 0 (0.0%) |
| Total | 50 (100.0%) | 0 (0.0%) |
Household Income by Mortgage Status in Belspring
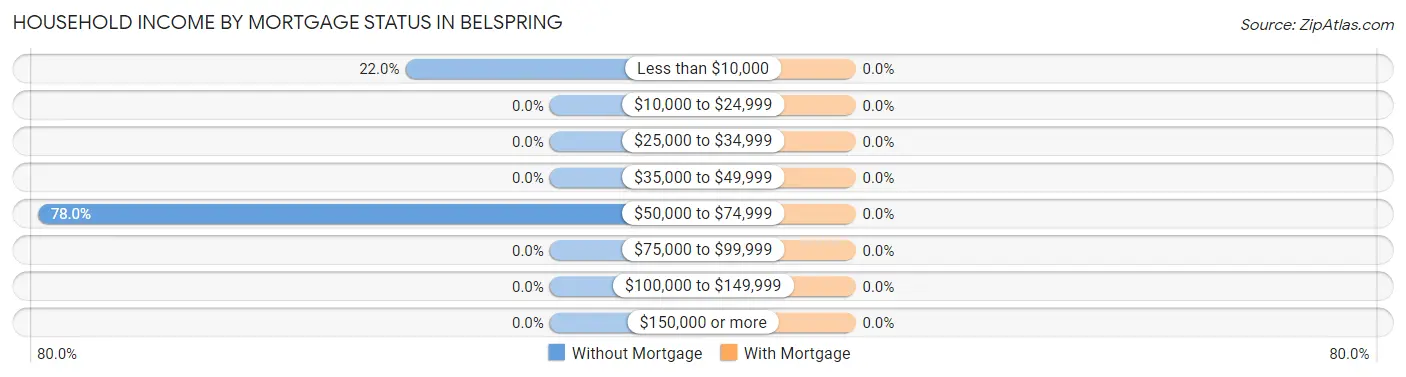
| Household Income | Without Mortgage | With Mortgage |
| Less than $10,000 | 11 (22.0%) | 0 (0.0%) |
| $10,000 to $24,999 | 0 (0.0%) | 0 (0.0%) |
| $25,000 to $34,999 | 0 (0.0%) | 0 (0.0%) |
| $35,000 to $49,999 | 0 (0.0%) | 0 (0.0%) |
| $50,000 to $74,999 | 39 (78.0%) | 0 (0.0%) |
| $75,000 to $99,999 | 0 (0.0%) | 0 (0.0%) |
| $100,000 to $149,999 | 0 (0.0%) | 0 (0.0%) |
| $150,000 or more | 0 (0.0%) | 0 (0.0%) |
| Total | 50 (100.0%) | 0 (0.0%) |
Property Value to Household Income Ratio in Belspring
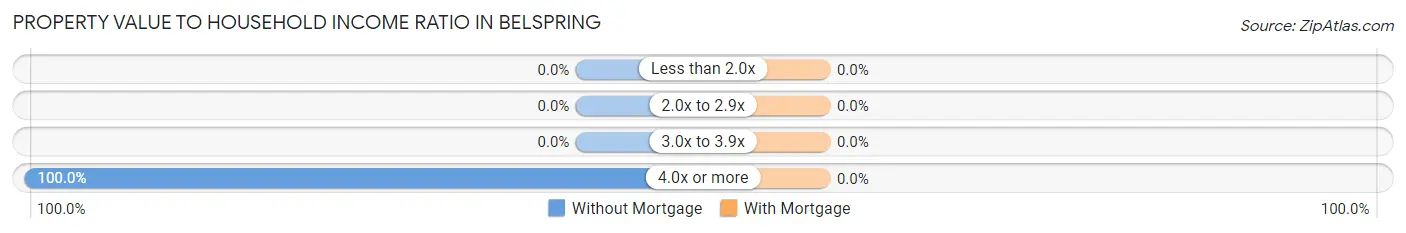
| Value-to-Income Ratio | Without Mortgage | With Mortgage |
| Less than 2.0x | 0 (0.0%) | 0 (0.0%) |
| 2.0x to 2.9x | 0 (0.0%) | 0 (0.0%) |
| 3.0x to 3.9x | 0 (0.0%) | 0 (0.0%) |
| 4.0x or more | 50 (100.0%) | 0 (0.0%) |
| Total | 50 (100.0%) | 0 (0.0%) |
Real Estate Taxes by Mortgage Status in Belspring
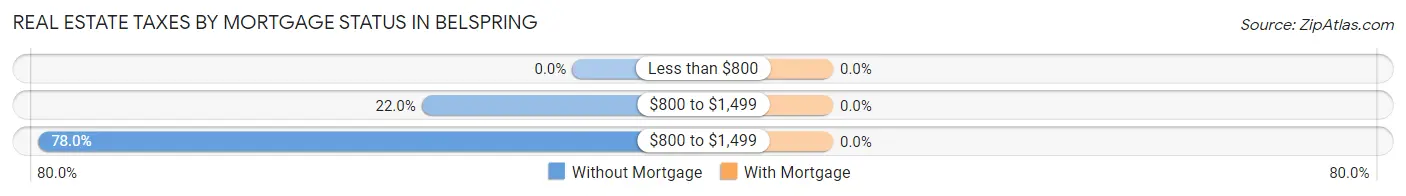
| Property Taxes | Without Mortgage | With Mortgage |
| Less than $800 | 0 (0.0%) | 0 (0.0%) |
| $800 to $1,499 | 11 (22.0%) | 0 (0.0%) |
| $800 to $1,499 | 39 (78.0%) | 0 (0.0%) |
| Total | 50 (100.0%) | 0 (0.0%) |
Health & Disability in Belspring
Health Insurance Coverage by Age in Belspring
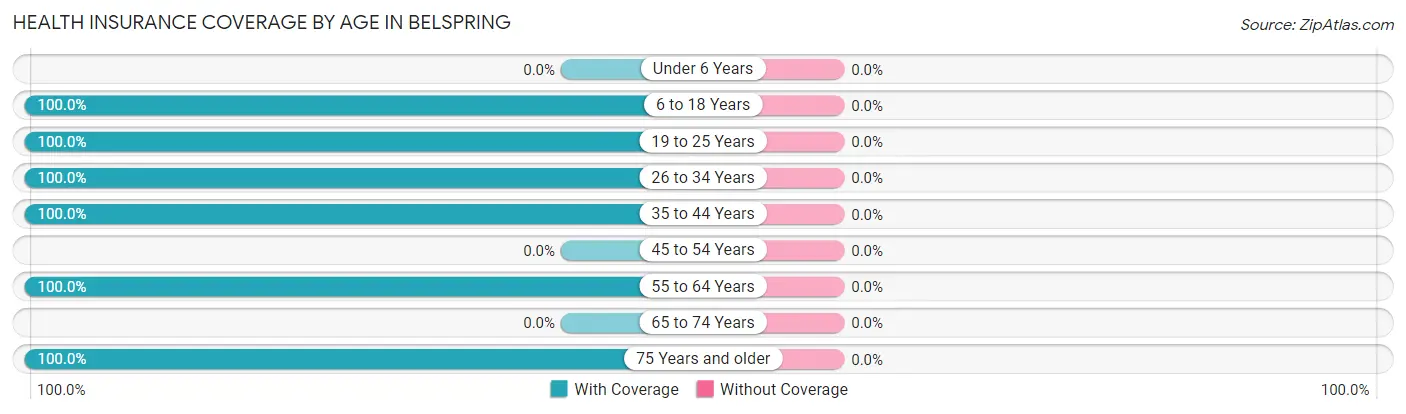
| Age Bracket | With Coverage | Without Coverage |
| Under 6 Years | 0 (0.0%) | 0 (0.0%) |
| 6 to 18 Years | 12 (100.0%) | 0 (0.0%) |
| 19 to 25 Years | 13 (100.0%) | 0 (0.0%) |
| 26 to 34 Years | 41 (100.0%) | 0 (0.0%) |
| 35 to 44 Years | 29 (100.0%) | 0 (0.0%) |
| 45 to 54 Years | 0 (0.0%) | 0 (0.0%) |
| 55 to 64 Years | 25 (100.0%) | 0 (0.0%) |
| 65 to 74 Years | 0 (0.0%) | 0 (0.0%) |
| 75 Years and older | 50 (100.0%) | 0 (0.0%) |
| Total | 170 (100.0%) | 0 (0.0%) |
Health Insurance Coverage by Citizenship Status in Belspring
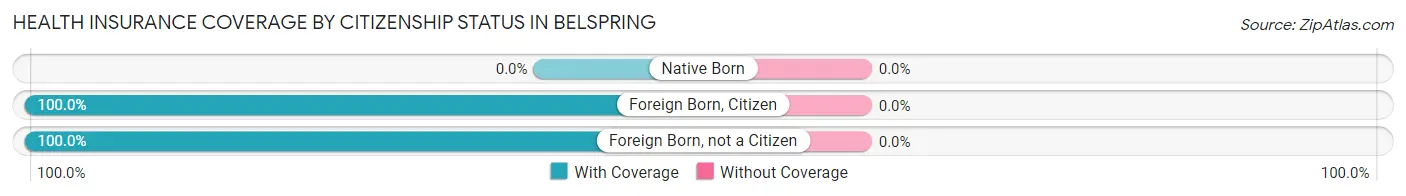
| Citizenship Status | With Coverage | Without Coverage |
| Native Born | 0 (0.0%) | 0 (0.0%) |
| Foreign Born, Citizen | 12 (100.0%) | 0 (0.0%) |
| Foreign Born, not a Citizen | 13 (100.0%) | 0 (0.0%) |
Health Insurance Coverage by Household Income in Belspring
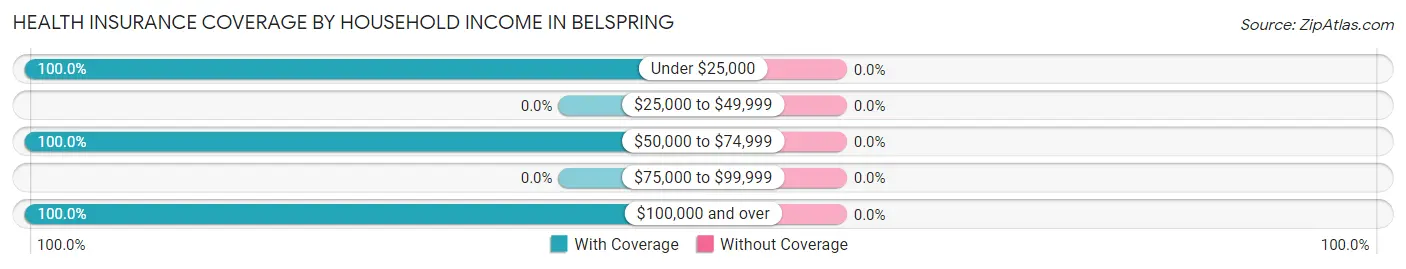
| Household Income | With Coverage | Without Coverage |
| Under $25,000 | 11 (100.0%) | 0 (0.0%) |
| $25,000 to $49,999 | 0 (0.0%) | 0 (0.0%) |
| $50,000 to $74,999 | 80 (100.0%) | 0 (0.0%) |
| $75,000 to $99,999 | 0 (0.0%) | 0 (0.0%) |
| $100,000 and over | 79 (100.0%) | 0 (0.0%) |
Public vs Private Health Insurance Coverage by Age in Belspring
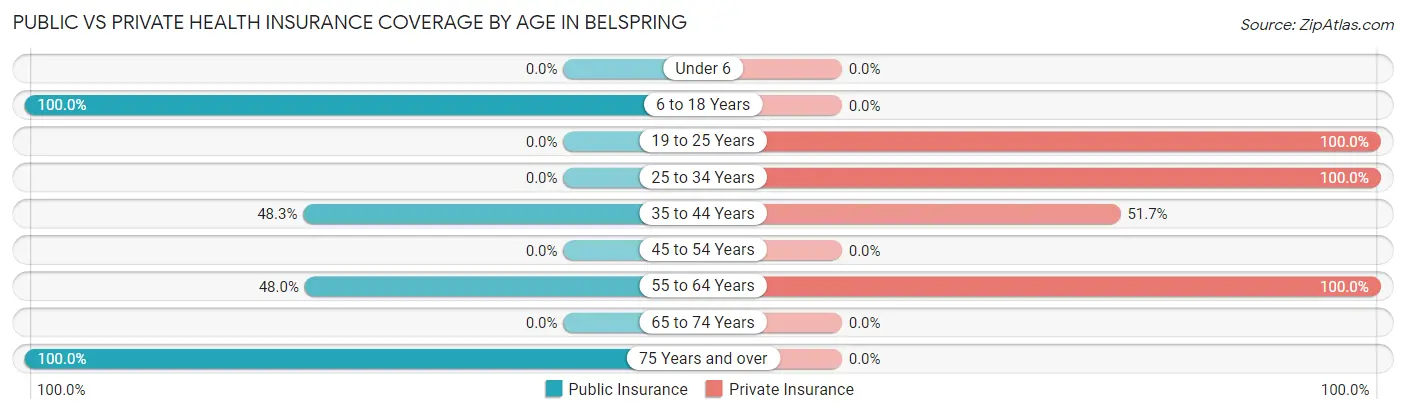
| Age Bracket | Public Insurance | Private Insurance |
| Under 6 | 0 (0.0%) | 0 (0.0%) |
| 6 to 18 Years | 12 (100.0%) | 0 (0.0%) |
| 19 to 25 Years | 0 (0.0%) | 13 (100.0%) |
| 25 to 34 Years | 0 (0.0%) | 41 (100.0%) |
| 35 to 44 Years | 14 (48.3%) | 15 (51.7%) |
| 45 to 54 Years | 0 (0.0%) | 0 (0.0%) |
| 55 to 64 Years | 12 (48.0%) | 25 (100.0%) |
| 65 to 74 Years | 0 (0.0%) | 0 (0.0%) |
| 75 Years and over | 50 (100.0%) | 0 (0.0%) |
| Total | 88 (51.8%) | 94 (55.3%) |
Disability Status by Sex by Age in Belspring
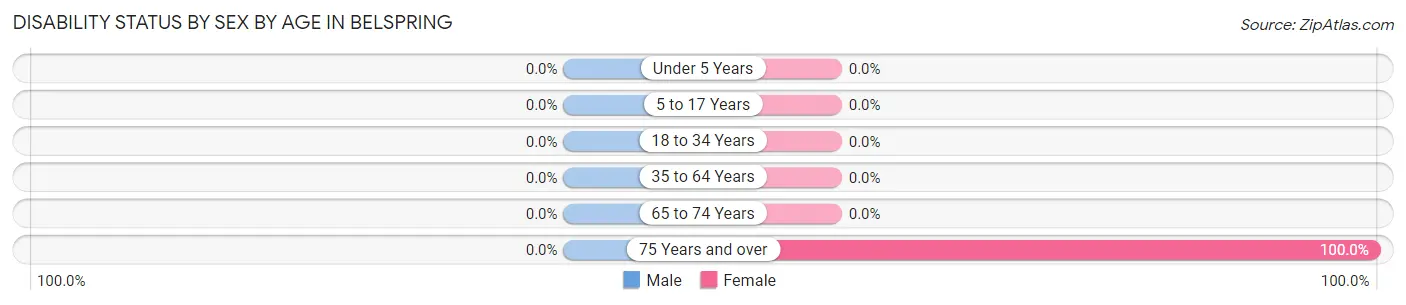
| Age Bracket | Male | Female |
| Under 5 Years | 0 (0.0%) | 0 (0.0%) |
| 5 to 17 Years | 0 (0.0%) | 0 (0.0%) |
| 18 to 34 Years | 0 (0.0%) | 0 (0.0%) |
| 35 to 64 Years | 0 (0.0%) | 0 (0.0%) |
| 65 to 74 Years | 0 (0.0%) | 0 (0.0%) |
| 75 Years and over | 0 (0.0%) | 50 (100.0%) |
Disability Class by Sex by Age in Belspring
Disability Class: Hearing Difficulty
| Age Bracket | Male | Female |
| Under 5 Years | 0 (0.0%) | 0 (0.0%) |
| 5 to 17 Years | 0 (0.0%) | 0 (0.0%) |
| 18 to 34 Years | 0 (0.0%) | 0 (0.0%) |
| 35 to 64 Years | 0 (0.0%) | 0 (0.0%) |
| 65 to 74 Years | 0 (0.0%) | 0 (0.0%) |
| 75 Years and over | 0 (0.0%) | 0 (0.0%) |
Disability Class: Vision Difficulty
| Age Bracket | Male | Female |
| Under 5 Years | 0 (0.0%) | 0 (0.0%) |
| 5 to 17 Years | 0 (0.0%) | 0 (0.0%) |
| 18 to 34 Years | 0 (0.0%) | 0 (0.0%) |
| 35 to 64 Years | 0 (0.0%) | 0 (0.0%) |
| 65 to 74 Years | 0 (0.0%) | 0 (0.0%) |
| 75 Years and over | 0 (0.0%) | 0 (0.0%) |
Disability Class: Cognitive Difficulty
| Age Bracket | Male | Female |
| 5 to 17 Years | 0 (0.0%) | 0 (0.0%) |
| 18 to 34 Years | 0 (0.0%) | 0 (0.0%) |
| 35 to 64 Years | 0 (0.0%) | 0 (0.0%) |
| 65 to 74 Years | 0 (0.0%) | 0 (0.0%) |
| 75 Years and over | 0 (0.0%) | 0 (0.0%) |
Disability Class: Ambulatory Difficulty
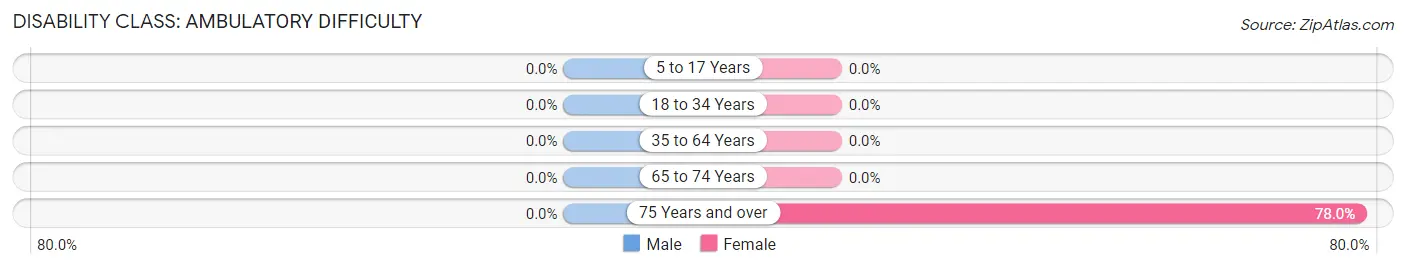
| Age Bracket | Male | Female |
| 5 to 17 Years | 0 (0.0%) | 0 (0.0%) |
| 18 to 34 Years | 0 (0.0%) | 0 (0.0%) |
| 35 to 64 Years | 0 (0.0%) | 0 (0.0%) |
| 65 to 74 Years | 0 (0.0%) | 0 (0.0%) |
| 75 Years and over | 0 (0.0%) | 39 (78.0%) |
Disability Class: Self-Care Difficulty
| Age Bracket | Male | Female |
| 5 to 17 Years | 0 (0.0%) | 0 (0.0%) |
| 18 to 34 Years | 0 (0.0%) | 0 (0.0%) |
| 35 to 64 Years | 0 (0.0%) | 0 (0.0%) |
| 65 to 74 Years | 0 (0.0%) | 0 (0.0%) |
| 75 Years and over | 0 (0.0%) | 0 (0.0%) |
Technology Access in Belspring
Computing Device Access in Belspring
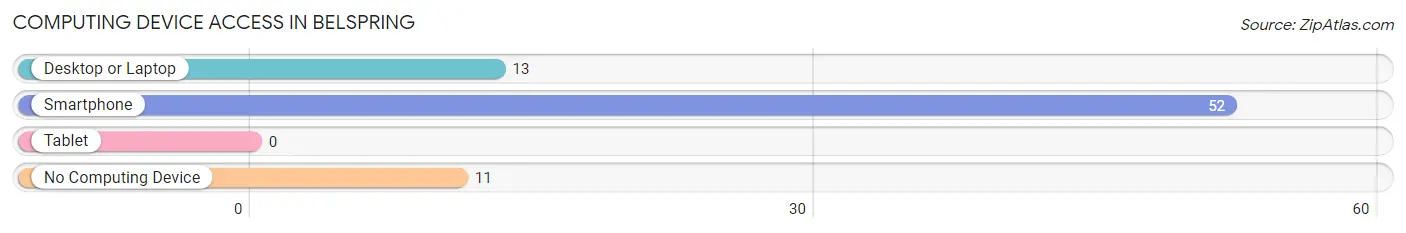
| Device Type | # Households | % Households |
| Desktop or Laptop | 13 | 20.6% |
| Smartphone | 52 | 82.5% |
| Tablet | 0 | 0.0% |
| No Computing Device | 11 | 17.5% |
| Total | 63 | 100.0% |
Internet Access in Belspring
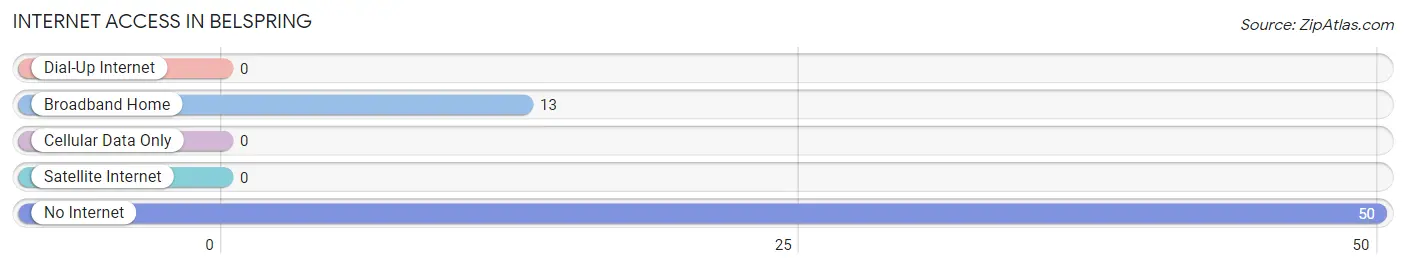
| Internet Type | # Households | % Households |
| Dial-Up Internet | 0 | 0.0% |
| Broadband Home | 13 | 20.6% |
| Cellular Data Only | 0 | 0.0% |
| Satellite Internet | 0 | 0.0% |
| No Internet | 50 | 79.4% |
| Total | 63 | 100.0% |
Belspring Summary
Belspring is an unincorporated community located in Pulaski County, Virginia. It is situated in the New River Valley, along the banks of the New River. The community is located approximately 10 miles south of the town of Pulaski and is part of the Blacksburg-Christiansburg-Radford Metropolitan Statistical Area.
History
The area that is now Belspring was first settled in the late 1700s by the family of William Bell. The Bells were among the first settlers in the area and established a small farmstead in the area. The community was originally known as Bells Spring, named after the family. The name was eventually shortened to Belspring.
In the early 1800s, the community began to grow and develop. A post office was established in 1837 and a school was built in 1845. The community also had a general store, a blacksmith shop, and a grist mill.
In the late 1800s, the railroad came to the area and the community began to grow and prosper. The railroad brought new businesses and industries to the area, including a sawmill, a brickyard, and a canning factory.
Geography
Belspring is located in the New River Valley of southwestern Virginia. The community is situated along the banks of the New River, approximately 10 miles south of the town of Pulaski. The area is characterized by rolling hills and valleys, with the New River providing a scenic backdrop.
The climate in Belspring is temperate, with hot summers and cold winters. The average annual temperature is around 55 degrees Fahrenheit. The average annual precipitation is around 40 inches.
Economy
The economy of Belspring is largely based on agriculture and tourism. The area is home to several farms, which produce a variety of crops, including corn, soybeans, wheat, and hay. The area is also home to several wineries, which produce a variety of wines.
Tourism is also an important part of the local economy. The area is home to several attractions, including the New River Trail State Park, Claytor Lake State Park, and the New River Valley Fairgrounds.
Demographics
As of the 2010 census, the population of Belspring was 1,093. The racial makeup of the community was 97.3% White, 0.9% African American, 0.3% Native American, 0.2% Asian, and 0.3% from other races. The median household income was $37,917, and the median family income was $45,000.
The population of Belspring is largely rural, with most of the population living in small towns and rural areas. The area is home to several churches, including the Belspring United Methodist Church, the Belspring Baptist Church, and the Belspring Presbyterian Church.
Conclusion
Belspring is a small, rural community located in Pulaski County, Virginia. The area is characterized by rolling hills and valleys, with the New River providing a scenic backdrop. The economy of the area is largely based on agriculture and tourism, and the population is largely rural. The area is home to several attractions, including the New River Trail State Park, Claytor Lake State Park, and the New River Valley Fairgrounds.
Common Questions
What is Per Capita Income in Belspring?
Per Capita income in Belspring is $28,044.
What is Inequality or Gini Index in Belspring?
Inequality or Gini Index in Belspring is 0.39.
What is the Total Population of Belspring?
Total Population of Belspring is 170.
What is the Total Male Population of Belspring?
Total Male Population of Belspring is 52.
What is the Total Female Population of Belspring?
Total Female Population of Belspring is 118.
What is the Ratio of Males per 100 Females in Belspring?
There are 44.07 Males per 100 Females in Belspring.
What is the Ratio of Females per 100 Males in Belspring?
There are 226.92 Females per 100 Males in Belspring.
What is the Median Population Age in Belspring?
Median Population Age in Belspring is 42.7 Years.
What is the Average Family Size in Belspring
Average Family Size in Belspring is 3.1 People.
What is the Average Household Size in Belspring
Average Household Size in Belspring is 2.7 People.
How Large is the Labor Force in Belspring?
There are 96 People in the Labor Forcein in Belspring.
What is the Percentage of People in the Labor Force in Belspring?
56.5% of People are in the Labor Force in Belspring.