Blue Ridge, VA Map & Demographics
Blue Ridge Map
Blue Ridge Overview
$34,450
PER CAPITA INCOME
$90,000
AVG FAMILY INCOME
$84,766
AVG HOUSEHOLD INCOME
16.0%
WAGE / INCOME GAP [ % ]
84.0¢/ $1
WAGE / INCOME GAP [ $ ]
0.33
INEQUALITY / GINI INDEX
2,994
TOTAL POPULATION
1,363
MALE POPULATION
1,631
FEMALE POPULATION
83.57
MALES / 100 FEMALES
119.66
FEMALES / 100 MALES
42.6
MEDIAN AGE
3.1
AVG FAMILY SIZE
2.7
AVG HOUSEHOLD SIZE
1,554
LABOR FORCE [ PEOPLE ]
64.4%
PERCENT IN LABOR FORCE
4.5%
UNEMPLOYMENT RATE
Blue Ridge Zip Codes
Income in Blue Ridge
Income Overview in Blue Ridge
Per Capita Income in Blue Ridge is $34,450, while median incomes of families and households are $90,000 and $84,766 respectively.
| Characteristic | Number | Measure |
| Per Capita Income | 2,994 | $34,450 |
| Median Family Income | 876 | $90,000 |
| Mean Family Income | 876 | $97,480 |
| Median Household Income | 1,111 | $84,766 |
| Mean Household Income | 1,111 | $90,811 |
| Income Deficit | 876 | $0 |
| Wage / Income Gap (%) | 2,994 | 16.00% |
| Wage / Income Gap ($) | 2,994 | 84.00¢ per $1 |
| Gini / Inequality Index | 2,994 | 0.33 |
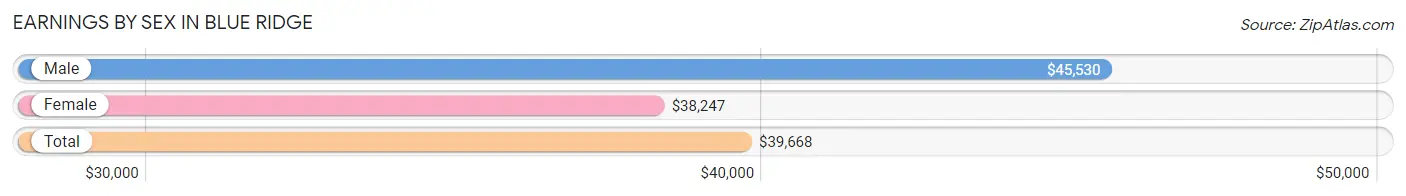
Earnings by Sex in Blue Ridge
Average Earnings in Blue Ridge are $39,668, $45,530 for men and $38,247 for women, a difference of 16.0%.
| Sex | Number | Average Earnings |
| Male | 818 (51.8%) | $45,530 |
| Female | 760 (48.2%) | $38,247 |
| Total | 1,578 (100.0%) | $39,668 |
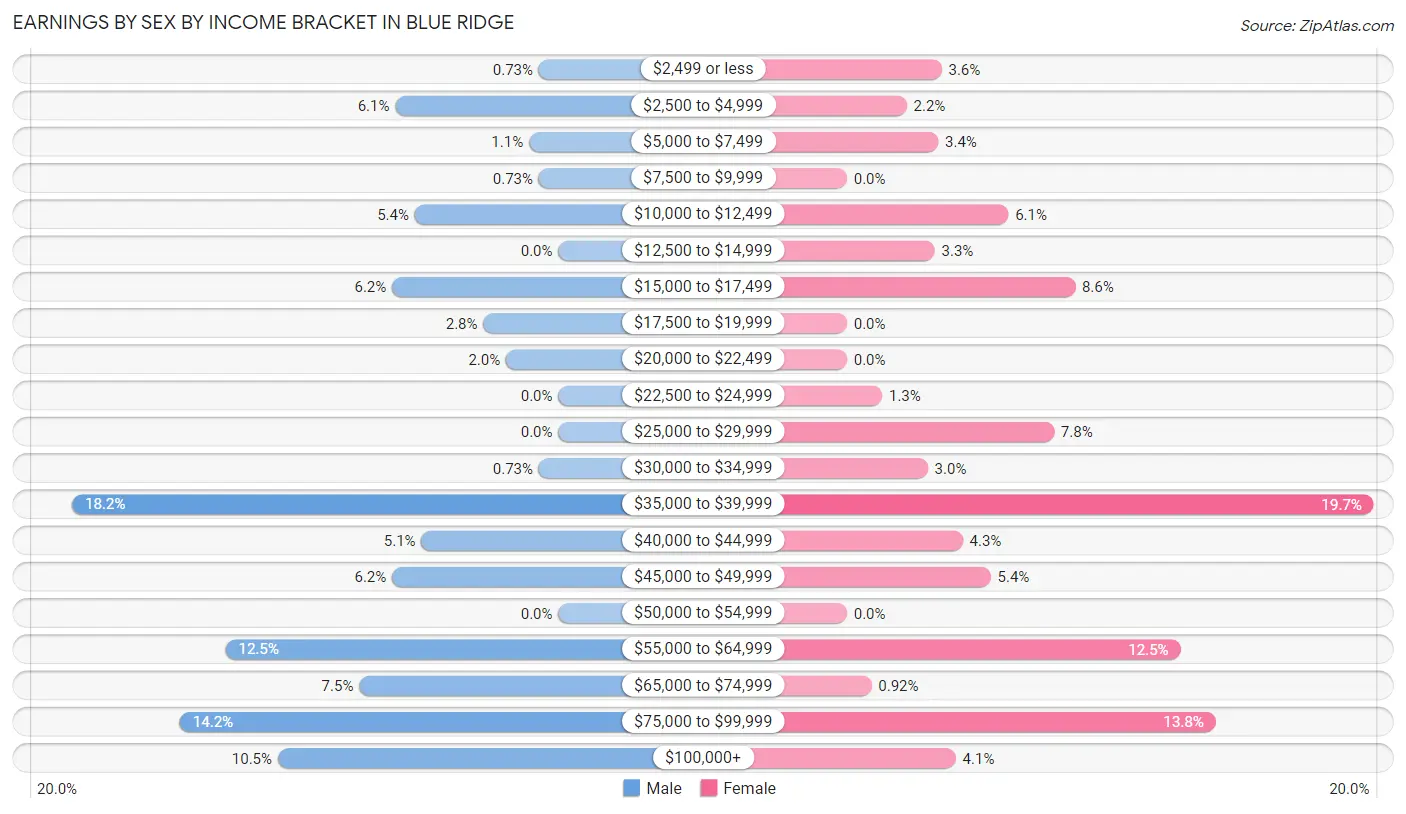
Earnings by Sex by Income Bracket in Blue Ridge
The most common earnings brackets in Blue Ridge are $35,000 to $39,999 for men (149 | 18.2%) and $35,000 to $39,999 for women (150 | 19.7%).
| Income | Male | Female |
| $2,499 or less | 6 (0.7%) | 27 (3.5%) |
| $2,500 to $4,999 | 50 (6.1%) | 17 (2.2%) |
| $5,000 to $7,499 | 9 (1.1%) | 26 (3.4%) |
| $7,500 to $9,999 | 6 (0.7%) | 0 (0.0%) |
| $10,000 to $12,499 | 44 (5.4%) | 46 (6.0%) |
| $12,500 to $14,999 | 0 (0.0%) | 25 (3.3%) |
| $15,000 to $17,499 | 51 (6.2%) | 65 (8.6%) |
| $17,500 to $19,999 | 23 (2.8%) | 0 (0.0%) |
| $20,000 to $22,499 | 16 (2.0%) | 0 (0.0%) |
| $22,500 to $24,999 | 0 (0.0%) | 10 (1.3%) |
| $25,000 to $29,999 | 0 (0.0%) | 59 (7.8%) |
| $30,000 to $34,999 | 6 (0.7%) | 23 (3.0%) |
| $35,000 to $39,999 | 149 (18.2%) | 150 (19.7%) |
| $40,000 to $44,999 | 42 (5.1%) | 33 (4.3%) |
| $45,000 to $49,999 | 51 (6.2%) | 41 (5.4%) |
| $50,000 to $54,999 | 0 (0.0%) | 0 (0.0%) |
| $55,000 to $64,999 | 102 (12.5%) | 95 (12.5%) |
| $65,000 to $74,999 | 61 (7.5%) | 7 (0.9%) |
| $75,000 to $99,999 | 116 (14.2%) | 105 (13.8%) |
| $100,000+ | 86 (10.5%) | 31 (4.1%) |
| Total | 818 (100.0%) | 760 (100.0%) |
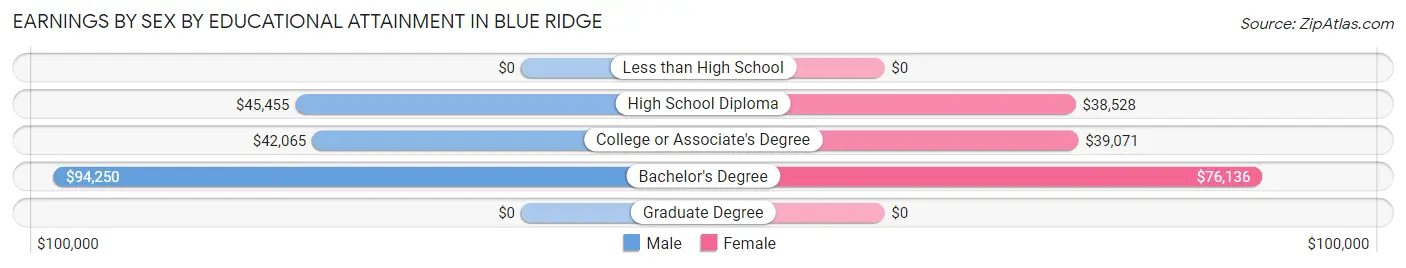
Earnings by Sex by Educational Attainment in Blue Ridge
Average earnings in Blue Ridge are $49,306 for men and $39,201 for women, a difference of 20.5%. Men with an educational attainment of bachelor's degree enjoy the highest average annual earnings of $94,250, while those with college or associate's degree education earn the least with $42,065. Women with an educational attainment of bachelor's degree earn the most with the average annual earnings of $76,136, while those with high school diploma education have the smallest earnings of $38,528.
| Educational Attainment | Male Income | Female Income |
| Less than High School | - | - |
| High School Diploma | $45,455 | $38,528 |
| College or Associate's Degree | $42,065 | $39,071 |
| Bachelor's Degree | $94,250 | $76,136 |
| Graduate Degree | - | - |
| Total | $49,306 | $39,201 |
Family Income in Blue Ridge
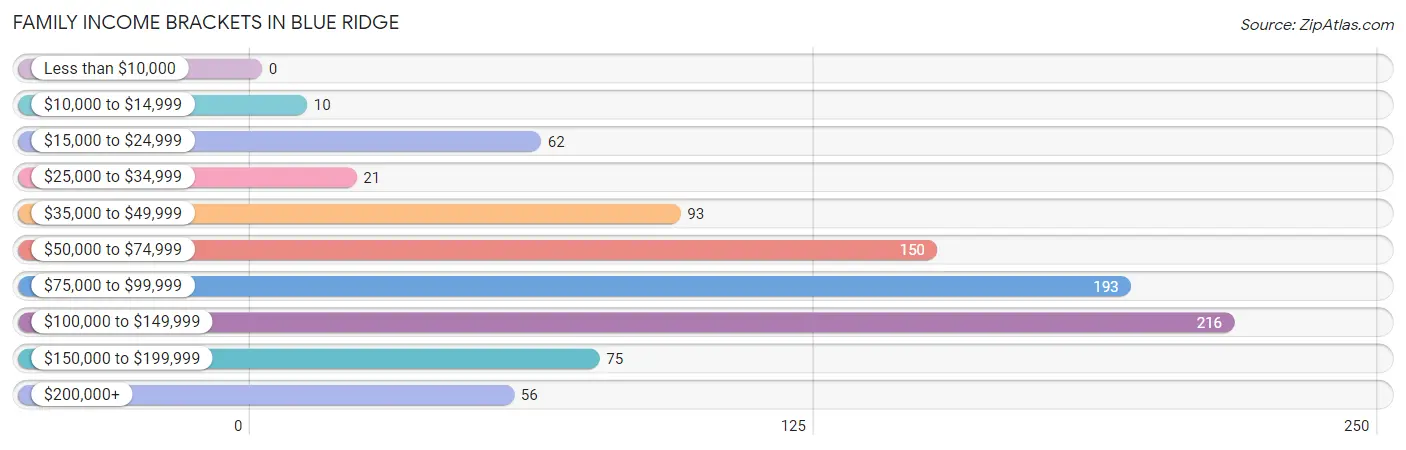
Family Income Brackets in Blue Ridge
According to the Blue Ridge family income data, there are 216 families falling into the $100,000 to $149,999 income range, which is the most common income bracket and makes up 24.7% of all families.
| Income Bracket | # Families | % Families |
| Less than $10,000 | 0 | 0.0% |
| $10,000 to $14,999 | 10 | 1.1% |
| $15,000 to $24,999 | 62 | 7.1% |
| $25,000 to $34,999 | 21 | 2.4% |
| $35,000 to $49,999 | 93 | 10.6% |
| $50,000 to $74,999 | 150 | 17.1% |
| $75,000 to $99,999 | 193 | 22.0% |
| $100,000 to $149,999 | 216 | 24.7% |
| $150,000 to $199,999 | 75 | 8.6% |
| $200,000+ | 56 | 6.4% |
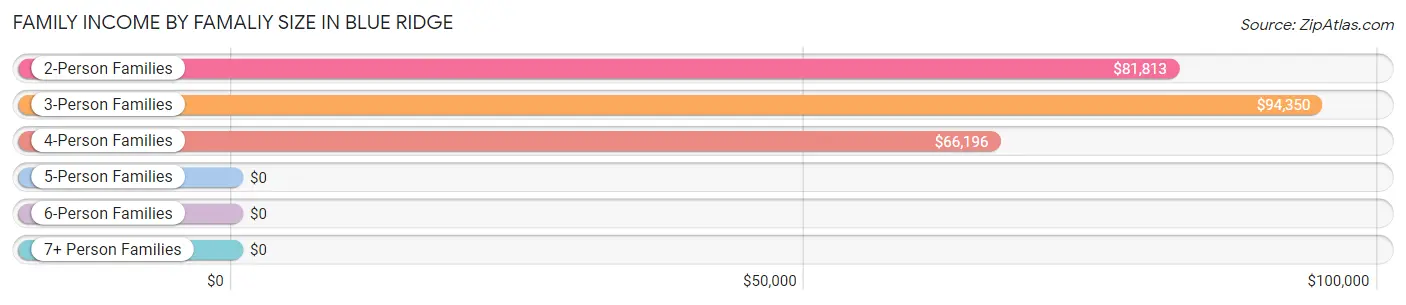
Family Income by Famaliy Size in Blue Ridge
3-person families (182 | 20.8%) account for the highest median family income in Blue Ridge with $94,350 per family, while 2-person families (428 | 48.9%) have the highest median income of $40,906 per family member.
| Income Bracket | # Families | Median Income |
| 2-Person Families | 428 (48.9%) | $81,813 |
| 3-Person Families | 182 (20.8%) | $94,350 |
| 4-Person Families | 172 (19.6%) | $66,196 |
| 5-Person Families | 65 (7.4%) | $0 |
| 6-Person Families | 29 (3.3%) | $0 |
| 7+ Person Families | 0 (0.0%) | $0 |
| Total | 876 (100.0%) | $90,000 |
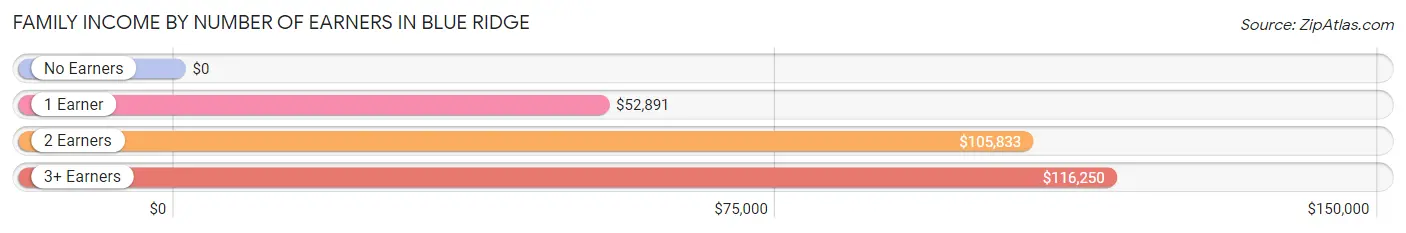
Family Income by Number of Earners in Blue Ridge
| Number of Earners | # Families | Median Income |
| No Earners | 128 (14.6%) | $0 |
| 1 Earner | 244 (27.9%) | $52,891 |
| 2 Earners | 378 (43.1%) | $105,833 |
| 3+ Earners | 126 (14.4%) | $116,250 |
| Total | 876 (100.0%) | $90,000 |
Household Income in Blue Ridge
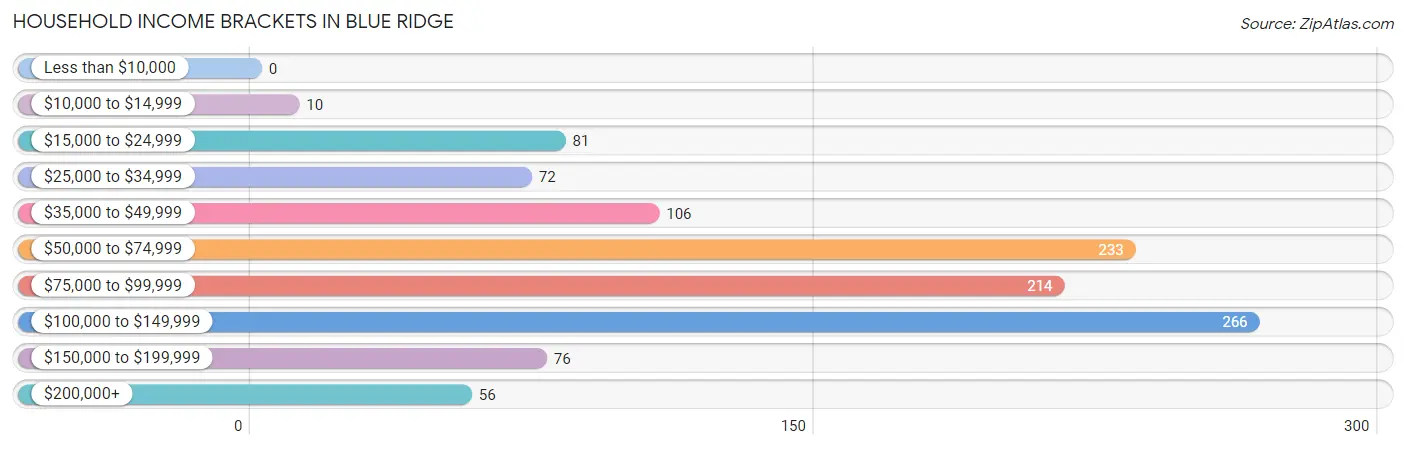
Household Income Brackets in Blue Ridge
With 266 households falling in the category, the $100,000 to $149,999 income range is the most frequent in Blue Ridge, accounting for 23.9% of all households.
| Income Bracket | # Households | % Households |
| Less than $10,000 | 0 | 0.0% |
| $10,000 to $14,999 | 10 | 0.9% |
| $15,000 to $24,999 | 81 | 7.3% |
| $25,000 to $34,999 | 72 | 6.5% |
| $35,000 to $49,999 | 106 | 9.5% |
| $50,000 to $74,999 | 233 | 21.0% |
| $75,000 to $99,999 | 214 | 19.3% |
| $100,000 to $149,999 | 266 | 23.9% |
| $150,000 to $199,999 | 76 | 6.8% |
| $200,000+ | 56 | 5.0% |
Household Income by Householder Age in Blue Ridge
The median household income in Blue Ridge is $84,766, with the highest median household income of $93,205 found in the 45 to 64 years age bracket for the primary householder. A total of 524 households (47.2%) fall into this category.
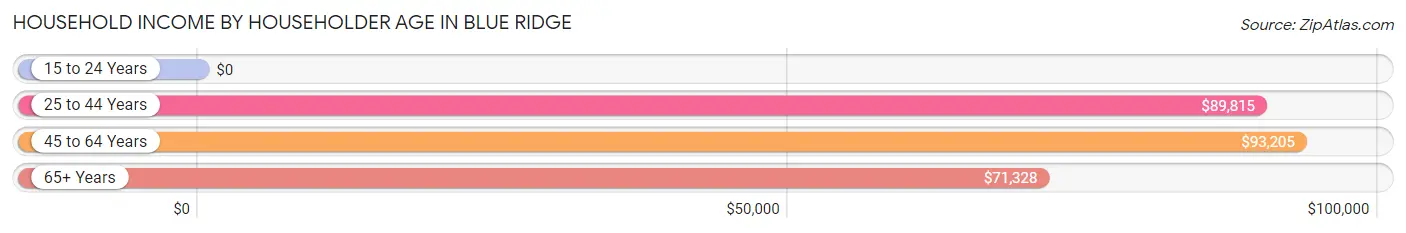
| Income Bracket | # Households | Median Income |
| 15 to 24 Years | 0 (0.0%) | $0 |
| 25 to 44 Years | 280 (25.2%) | $89,815 |
| 45 to 64 Years | 524 (47.2%) | $93,205 |
| 65+ Years | 307 (27.6%) | $71,328 |
| Total | 1,111 (100.0%) | $84,766 |
Poverty in Blue Ridge
Income Below Poverty by Sex and Age in Blue Ridge
With 4.1% poverty level for males and 4.0% for females among the residents of Blue Ridge, 18 to 24 year old males and 45 to 54 year old females are the most vulnerable to poverty, with 22 males (20.6%) and 47 females (24.3%) in their respective age groups living below the poverty level.
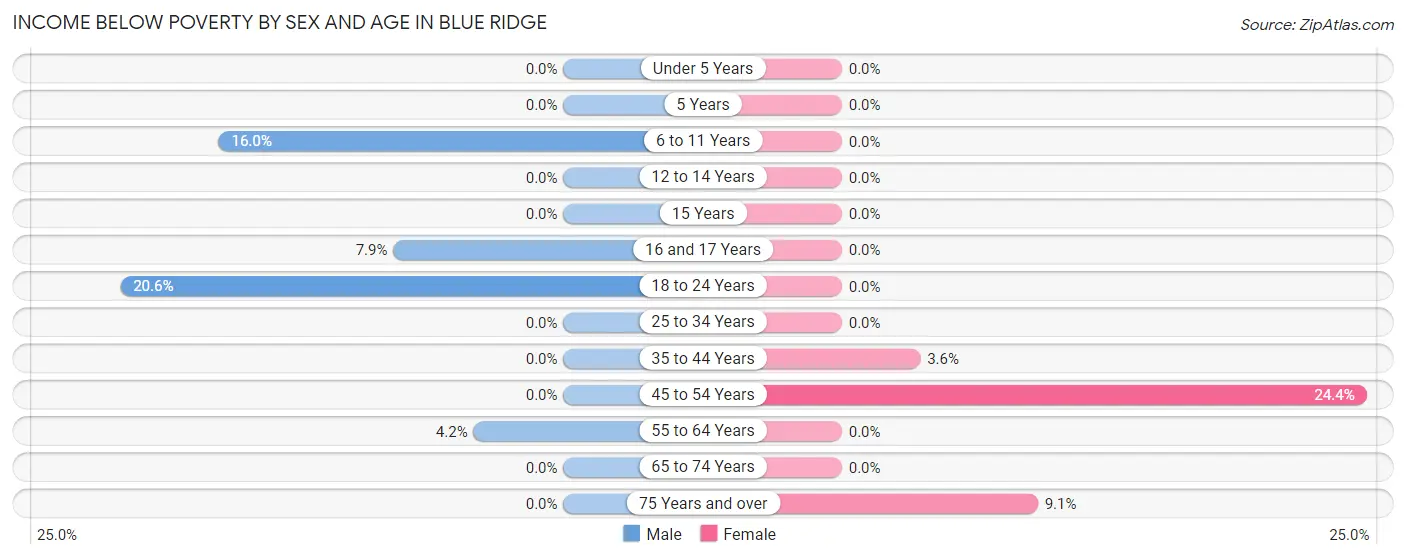
| Age Bracket | Male | Female |
| Under 5 Years | 0 (0.0%) | 0 (0.0%) |
| 5 Years | 0 (0.0%) | 0 (0.0%) |
| 6 to 11 Years | 12 (16.0%) | 0 (0.0%) |
| 12 to 14 Years | 0 (0.0%) | 0 (0.0%) |
| 15 Years | 0 (0.0%) | 0 (0.0%) |
| 16 and 17 Years | 6 (7.9%) | 0 (0.0%) |
| 18 to 24 Years | 22 (20.6%) | 0 (0.0%) |
| 25 to 34 Years | 0 (0.0%) | 0 (0.0%) |
| 35 to 44 Years | 0 (0.0%) | 6 (3.6%) |
| 45 to 54 Years | 0 (0.0%) | 47 (24.3%) |
| 55 to 64 Years | 16 (4.2%) | 0 (0.0%) |
| 65 to 74 Years | 0 (0.0%) | 0 (0.0%) |
| 75 Years and over | 0 (0.0%) | 12 (9.1%) |
| Total | 56 (4.1%) | 65 (4.0%) |
Income Above Poverty by Sex and Age in Blue Ridge
According to the poverty statistics in Blue Ridge, males aged under 5 years and females aged under 5 years are the age groups that are most secure financially, with 100.0% of males and 100.0% of females in these age groups living above the poverty line.
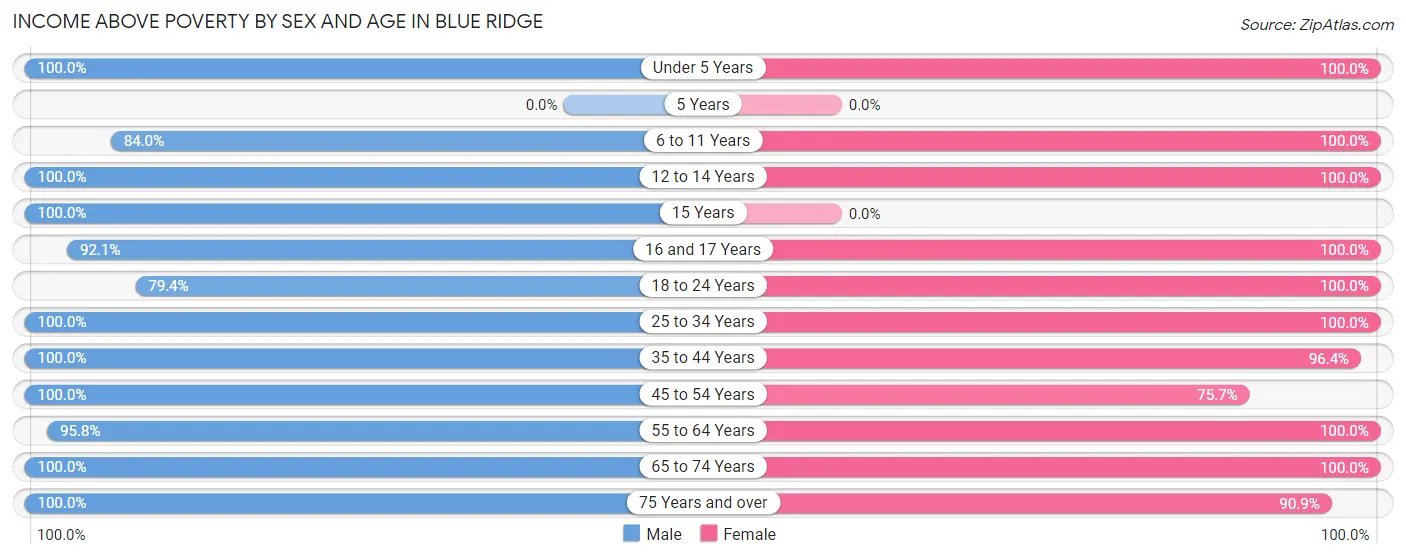
| Age Bracket | Male | Female |
| Under 5 Years | 59 (100.0%) | 79 (100.0%) |
| 5 Years | 0 (0.0%) | 0 (0.0%) |
| 6 to 11 Years | 63 (84.0%) | 223 (100.0%) |
| 12 to 14 Years | 65 (100.0%) | 62 (100.0%) |
| 15 Years | 18 (100.0%) | 0 (0.0%) |
| 16 and 17 Years | 70 (92.1%) | 15 (100.0%) |
| 18 to 24 Years | 85 (79.4%) | 134 (100.0%) |
| 25 to 34 Years | 115 (100.0%) | 207 (100.0%) |
| 35 to 44 Years | 174 (100.0%) | 159 (96.4%) |
| 45 to 54 Years | 92 (100.0%) | 146 (75.6%) |
| 55 to 64 Years | 368 (95.8%) | 273 (100.0%) |
| 65 to 74 Years | 150 (100.0%) | 148 (100.0%) |
| 75 Years and over | 48 (100.0%) | 120 (90.9%) |
| Total | 1,307 (95.9%) | 1,566 (96.0%) |
Income Below Poverty Among Married-Couple Families in Blue Ridge
The poverty statistics for married-couple families in Blue Ridge show that 2.0% or 16 of the total 783 families live below the poverty line. Families with no children have the highest poverty rate of 3.0%, comprising of 16 families. On the other hand, families with 1 or 2 children have the lowest poverty rate of 0.0%, which includes 0 families.
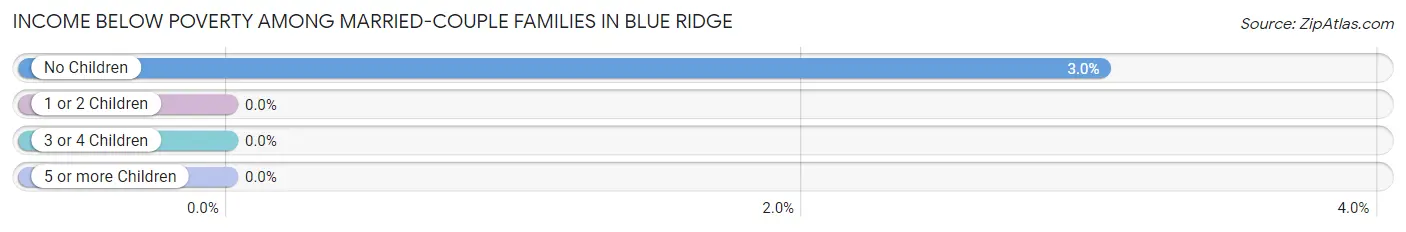
| Children | Above Poverty | Below Poverty |
| No Children | 510 (97.0%) | 16 (3.0%) |
| 1 or 2 Children | 206 (100.0%) | 0 (0.0%) |
| 3 or 4 Children | 51 (100.0%) | 0 (0.0%) |
| 5 or more Children | 0 (0.0%) | 0 (0.0%) |
| Total | 767 (98.0%) | 16 (2.0%) |
Income Below Poverty Among Single-Parent Households in Blue Ridge
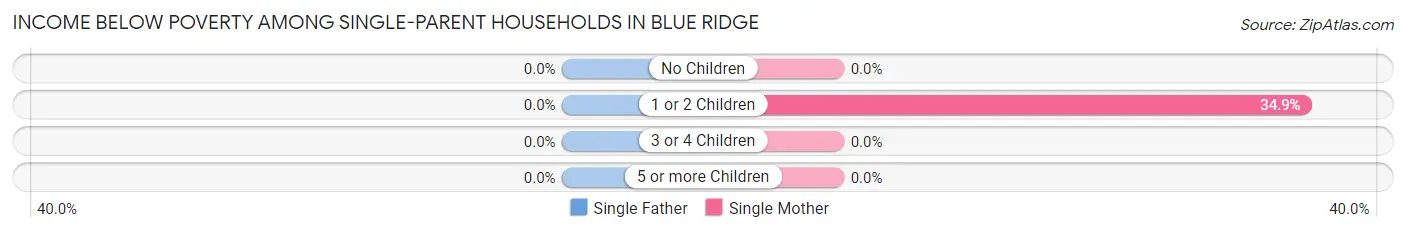
| Children | Single Father | Single Mother |
| No Children | 0 (0.0%) | 0 (0.0%) |
| 1 or 2 Children | 0 (0.0%) | 22 (34.9%) |
| 3 or 4 Children | 0 (0.0%) | 0 (0.0%) |
| 5 or more Children | 0 (0.0%) | 0 (0.0%) |
| Total | 0 (0.0%) | 22 (29.7%) |
Income Below Poverty Among Married-Couple vs Single-Parent Households in Blue Ridge
The poverty data for Blue Ridge shows that 16 of the married-couple family households (2.0%) and 22 of the single-parent households (23.7%) are living below the poverty level. Within the married-couple family households, those with no children have the highest poverty rate, with 16 households (3.0%) falling below the poverty line. Among the single-parent households, those with 1 or 2 children have the highest poverty rate, with 22 household (26.8%) living below poverty.
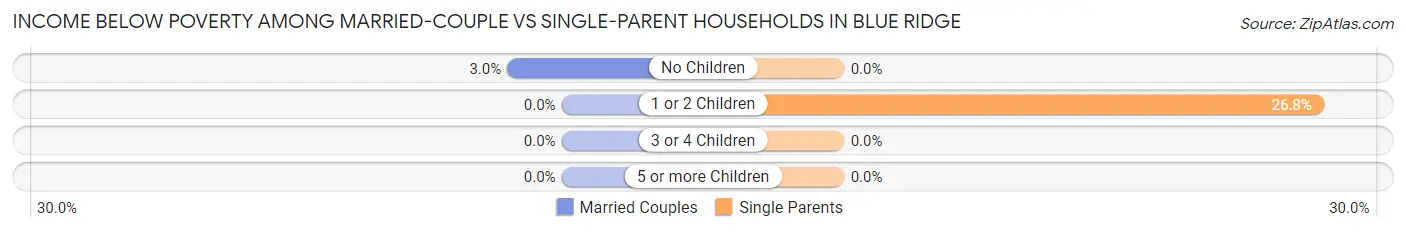
| Children | Married-Couple Families | Single-Parent Households |
| No Children | 16 (3.0%) | 0 (0.0%) |
| 1 or 2 Children | 0 (0.0%) | 22 (26.8%) |
| 3 or 4 Children | 0 (0.0%) | 0 (0.0%) |
| 5 or more Children | 0 (0.0%) | 0 (0.0%) |
| Total | 16 (2.0%) | 22 (23.7%) |
Race in Blue Ridge
The most populous races in Blue Ridge are White / Caucasian (2,547 | 85.1%), Two or more Races (290 | 9.7%), and Black / African American (102 | 3.4%).
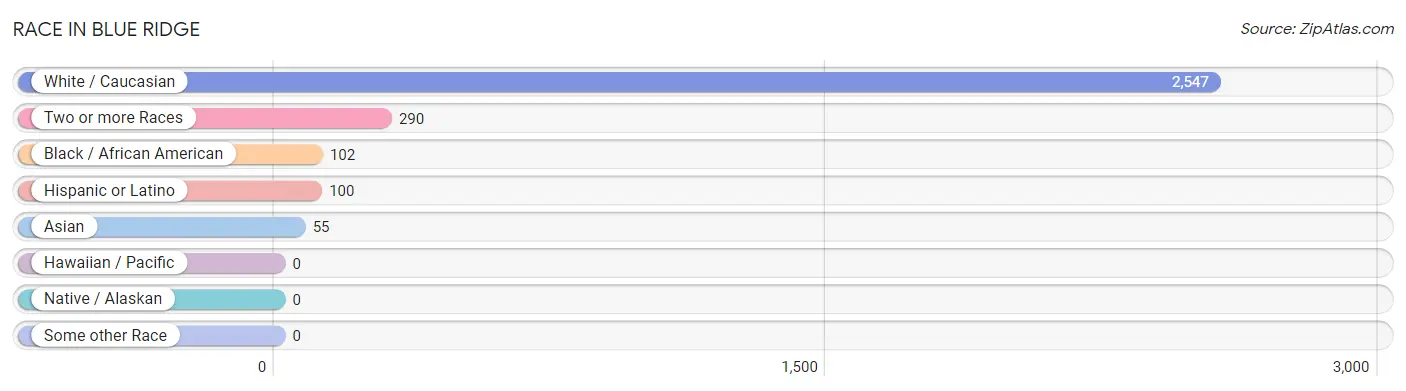
| Race | # Population | % Population |
| Asian | 55 | 1.8% |
| Black / African American | 102 | 3.4% |
| Hawaiian / Pacific | 0 | 0.0% |
| Hispanic or Latino | 100 | 3.3% |
| Native / Alaskan | 0 | 0.0% |
| White / Caucasian | 2,547 | 85.1% |
| Two or more Races | 290 | 9.7% |
| Some other Race | 0 | 0.0% |
| Total | 2,994 | 100.0% |
Ancestry in Blue Ridge
The most populous ancestries reported in Blue Ridge are American (462 | 15.4%), Irish (441 | 14.7%), German (382 | 12.8%), English (353 | 11.8%), and Polish (116 | 3.9%), together accounting for 58.6% of all Blue Ridge residents.
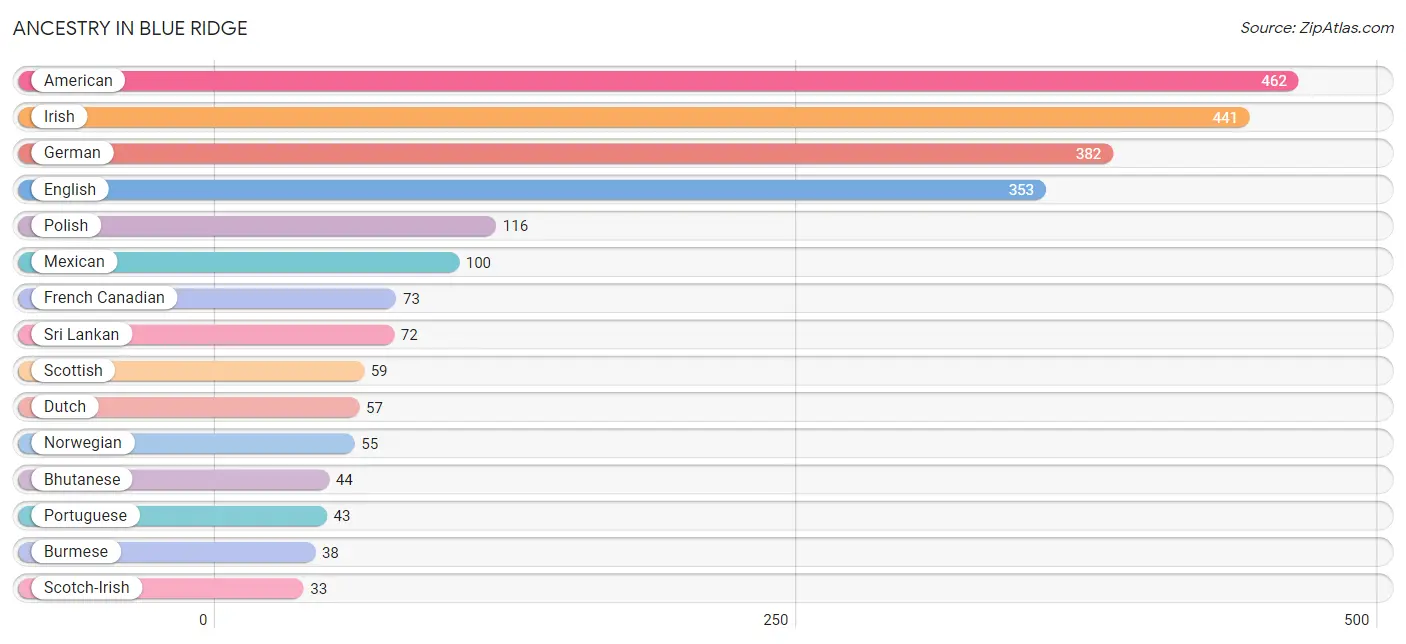
| Ancestry | # Population | % Population |
| American | 462 | 15.4% |
| Bhutanese | 44 | 1.5% |
| British | 6 | 0.2% |
| Burmese | 38 | 1.3% |
| Dutch | 57 | 1.9% |
| English | 353 | 11.8% |
| European | 22 | 0.7% |
| Finnish | 14 | 0.5% |
| French | 15 | 0.5% |
| French Canadian | 73 | 2.4% |
| German | 382 | 12.8% |
| Irish | 441 | 14.7% |
| Mexican | 100 | 3.3% |
| Norwegian | 55 | 1.8% |
| Polish | 116 | 3.9% |
| Portuguese | 43 | 1.4% |
| Scotch-Irish | 33 | 1.1% |
| Scottish | 59 | 2.0% |
| Sri Lankan | 72 | 2.4% |
| Swedish | 23 | 0.8% |
| Welsh | 14 | 0.5% | View All 21 Rows |
Immigrants in Blue Ridge
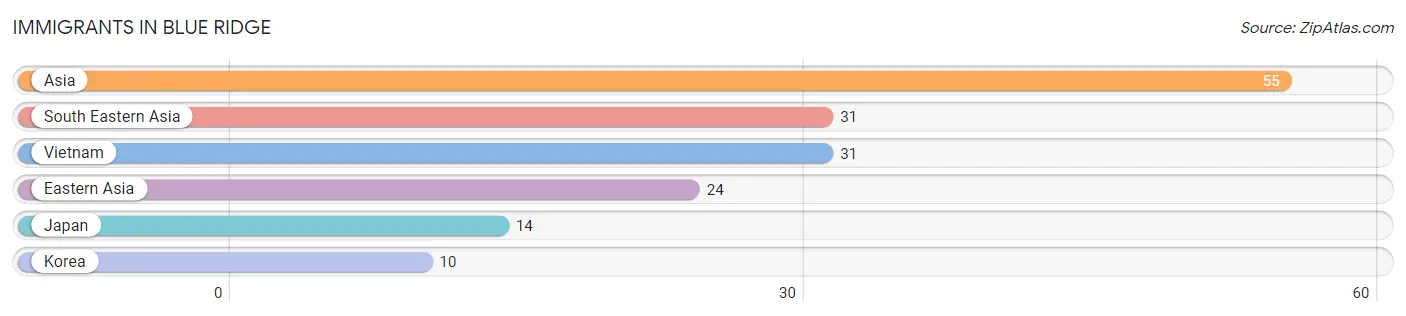
The most numerous immigrant groups reported in Blue Ridge came from Asia (55 | 1.8%), South Eastern Asia (31 | 1.0%), Vietnam (31 | 1.0%), Eastern Asia (24 | 0.8%), and Japan (14 | 0.5%), together accounting for 5.2% of all Blue Ridge residents.
| Immigration Origin | # Population | % Population |
| Asia | 55 | 1.8% |
| Eastern Asia | 24 | 0.8% |
| Japan | 14 | 0.5% |
| Korea | 10 | 0.3% |
| South Eastern Asia | 31 | 1.0% |
| Vietnam | 31 | 1.0% | View All 6 Rows |
Sex and Age in Blue Ridge
Sex and Age in Blue Ridge
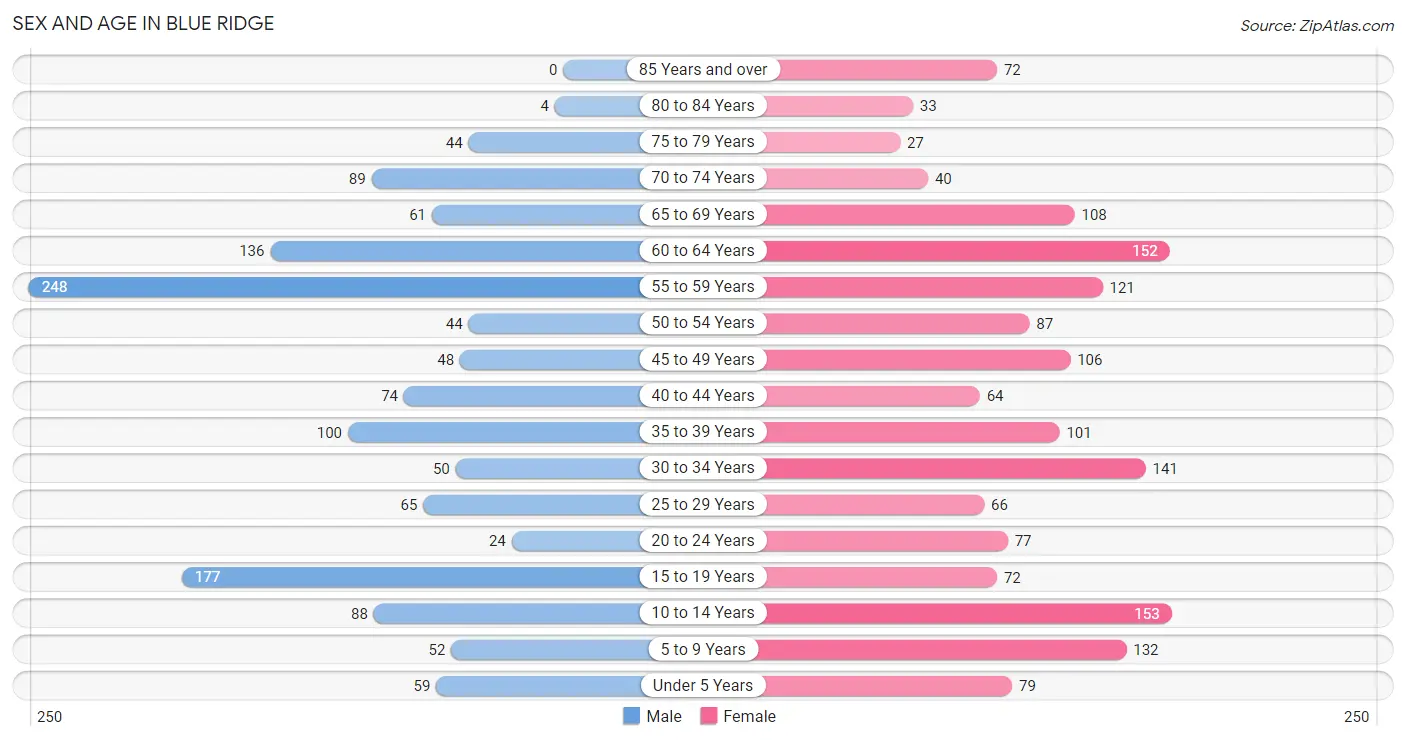
The most populous age groups in Blue Ridge are 55 to 59 Years (248 | 18.2%) for men and 10 to 14 Years (153 | 9.4%) for women.
| Age Bracket | Male | Female |
| Under 5 Years | 59 (4.3%) | 79 (4.8%) |
| 5 to 9 Years | 52 (3.8%) | 132 (8.1%) |
| 10 to 14 Years | 88 (6.5%) | 153 (9.4%) |
| 15 to 19 Years | 177 (13.0%) | 72 (4.4%) |
| 20 to 24 Years | 24 (1.8%) | 77 (4.7%) |
| 25 to 29 Years | 65 (4.8%) | 66 (4.1%) |
| 30 to 34 Years | 50 (3.7%) | 141 (8.6%) |
| 35 to 39 Years | 100 (7.3%) | 101 (6.2%) |
| 40 to 44 Years | 74 (5.4%) | 64 (3.9%) |
| 45 to 49 Years | 48 (3.5%) | 106 (6.5%) |
| 50 to 54 Years | 44 (3.2%) | 87 (5.3%) |
| 55 to 59 Years | 248 (18.2%) | 121 (7.4%) |
| 60 to 64 Years | 136 (10.0%) | 152 (9.3%) |
| 65 to 69 Years | 61 (4.5%) | 108 (6.6%) |
| 70 to 74 Years | 89 (6.5%) | 40 (2.5%) |
| 75 to 79 Years | 44 (3.2%) | 27 (1.7%) |
| 80 to 84 Years | 4 (0.3%) | 33 (2.0%) |
| 85 Years and over | 0 (0.0%) | 72 (4.4%) |
| Total | 1,363 (100.0%) | 1,631 (100.0%) |
Families and Households in Blue Ridge
Median Family Size in Blue Ridge
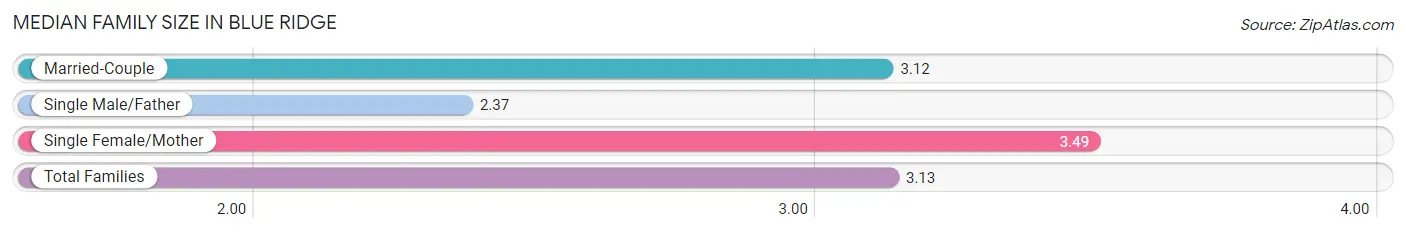
The median family size in Blue Ridge is 3.13 persons per family, with single female/mother families (74 | 8.5%) accounting for the largest median family size of 3.49 persons per family. On the other hand, single male/father families (19 | 2.2%) represent the smallest median family size with 2.37 persons per family.
| Family Type | # Families | Family Size |
| Married-Couple | 783 (89.4%) | 3.12 |
| Single Male/Father | 19 (2.2%) | 2.37 |
| Single Female/Mother | 74 (8.5%) | 3.49 |
| Total Families | 876 (100.0%) | 3.13 |
Median Household Size in Blue Ridge
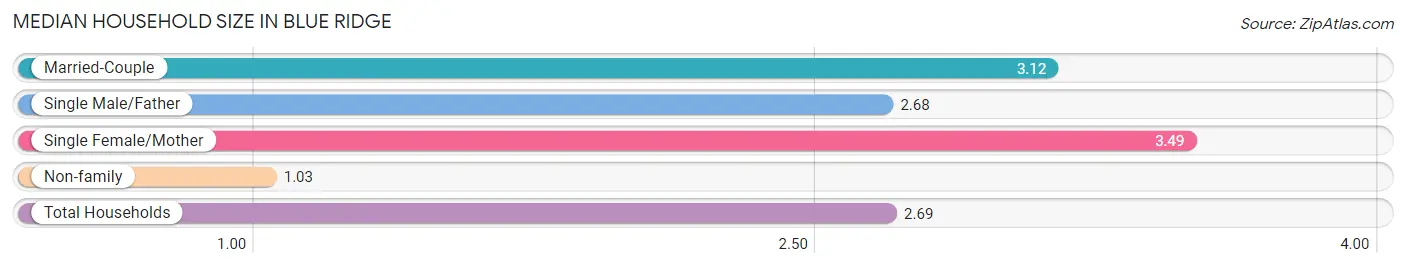
The median household size in Blue Ridge is 2.69 persons per household, with single female/mother households (74 | 6.7%) accounting for the largest median household size of 3.49 persons per household. non-family households (235 | 21.1%) represent the smallest median household size with 1.03 persons per household.
| Household Type | # Households | Household Size |
| Married-Couple | 783 (70.5%) | 3.12 |
| Single Male/Father | 19 (1.7%) | 2.68 |
| Single Female/Mother | 74 (6.7%) | 3.49 |
| Non-family | 235 (21.1%) | 1.03 |
| Total Households | 1,111 (100.0%) | 2.69 |
Household Size by Marriage Status in Blue Ridge
Out of a total of 1,111 households in Blue Ridge, 876 (78.8%) are family households, while 235 (21.1%) are nonfamily households. The most numerous type of family households are 2-person households, comprising 422, and the most common type of nonfamily households are 1-person households, comprising 226.
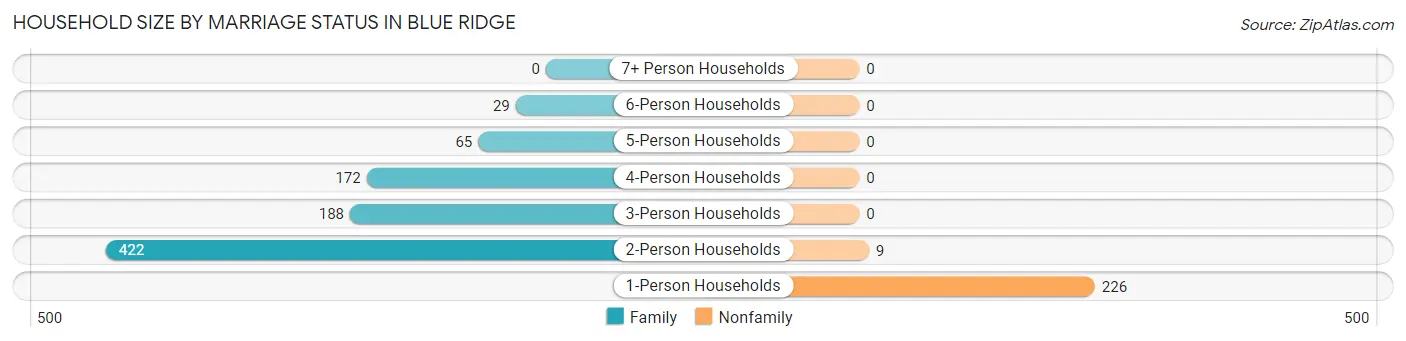
| Household Size | Family Households | Nonfamily Households |
| 1-Person Households | - | 226 (20.3%) |
| 2-Person Households | 422 (38.0%) | 9 (0.8%) |
| 3-Person Households | 188 (16.9%) | 0 (0.0%) |
| 4-Person Households | 172 (15.5%) | 0 (0.0%) |
| 5-Person Households | 65 (5.9%) | 0 (0.0%) |
| 6-Person Households | 29 (2.6%) | 0 (0.0%) |
| 7+ Person Households | 0 (0.0%) | 0 (0.0%) |
| Total | 876 (78.8%) | 235 (21.1%) |
Female Fertility in Blue Ridge
Fertility by Age in Blue Ridge
Average fertility rate in Blue Ridge is 30.0 births per 1,000 women. Women in the age bracket of 35 to 50 years have the highest fertility rate with 49.0 births per 1,000 women. Women in the age bracket of 35 to 50 years acount for 75.0% of all women with births.
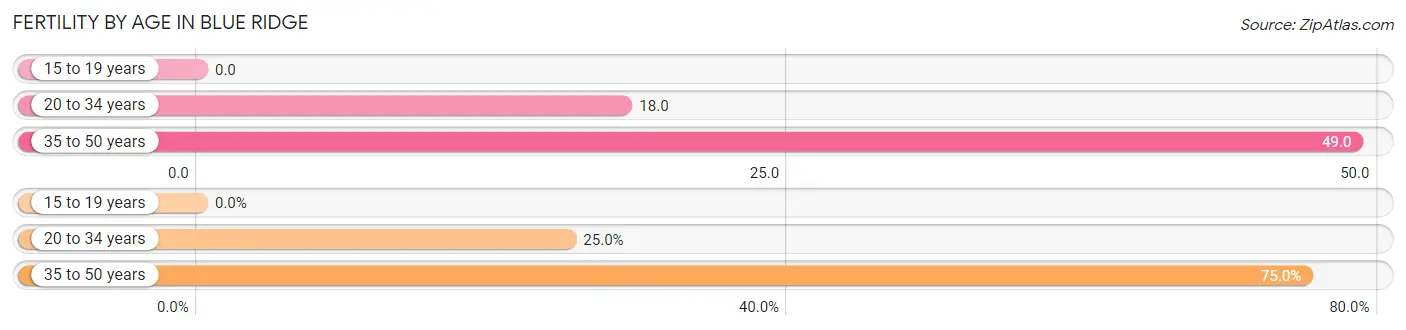
| Age Bracket | Women with Births | Births / 1,000 Women |
| 15 to 19 years | 0 (0.0%) | 0.0 |
| 20 to 34 years | 5 (25.0%) | 18.0 |
| 35 to 50 years | 15 (75.0%) | 49.0 |
| Total | 20 (100.0%) | 30.0 |
Fertility by Age by Marriage Status in Blue Ridge
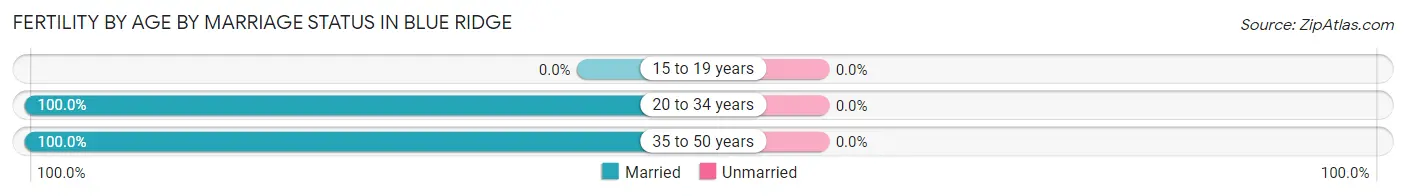
| Age Bracket | Married | Unmarried |
| 15 to 19 years | 0 (0.0%) | 0 (0.0%) |
| 20 to 34 years | 5 (100.0%) | 0 (0.0%) |
| 35 to 50 years | 15 (100.0%) | 0 (0.0%) |
| Total | 20 (100.0%) | 0 (0.0%) |
Fertility by Education in Blue Ridge
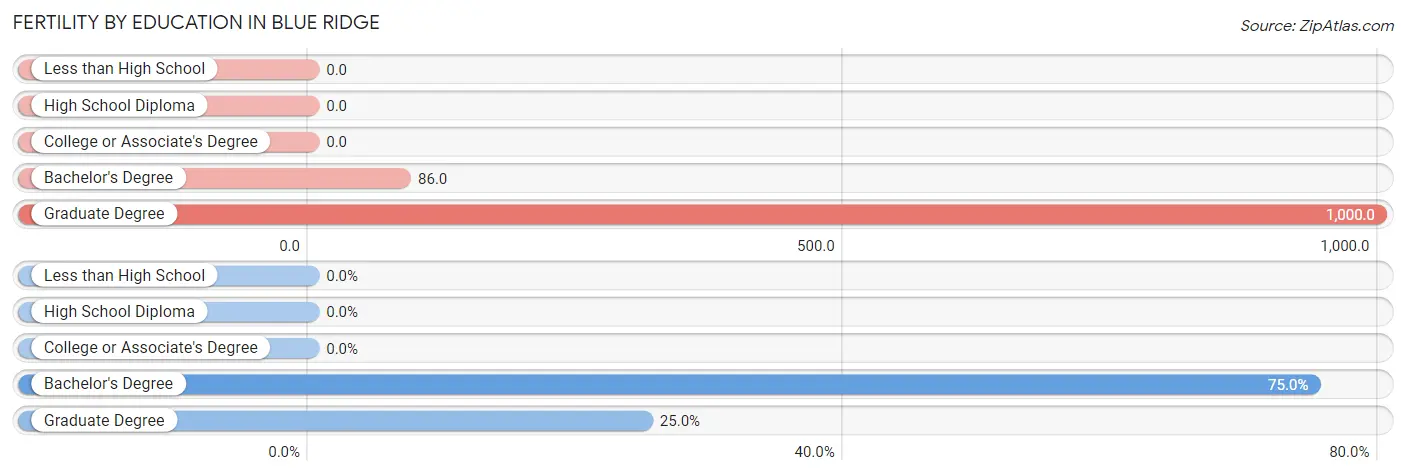
| Educational Attainment | Women with Births | Births / 1,000 Women |
| Less than High School | 0 (0.0%) | 0.0 |
| High School Diploma | 0 (0.0%) | 0.0 |
| College or Associate's Degree | 0 (0.0%) | 0.0 |
| Bachelor's Degree | 15 (75.0%) | 86.0 |
| Graduate Degree | 5 (25.0%) | 1,000.0 |
| Total | 20 (100.0%) | 30.0 |
Fertility by Education by Marriage Status in Blue Ridge
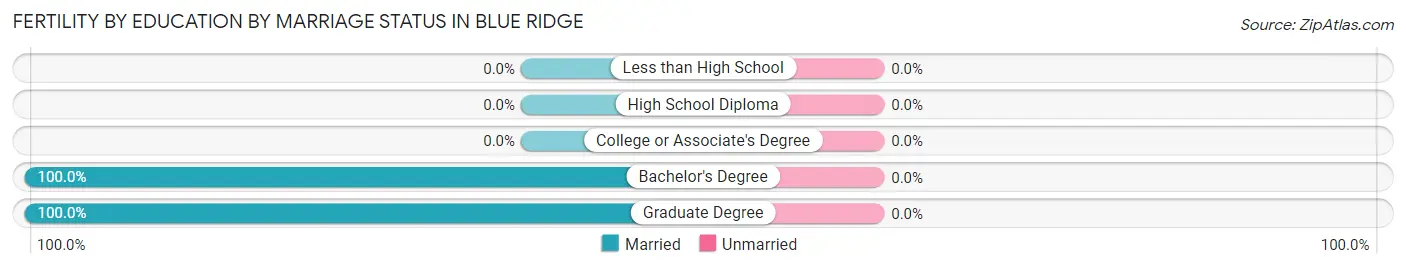
| Educational Attainment | Married | Unmarried |
| Less than High School | 0 (0.0%) | 0 (0.0%) |
| High School Diploma | 0 (0.0%) | 0 (0.0%) |
| College or Associate's Degree | 0 (0.0%) | 0 (0.0%) |
| Bachelor's Degree | 15 (100.0%) | 0 (0.0%) |
| Graduate Degree | 5 (100.0%) | 0 (0.0%) |
| Total | 20 (100.0%) | 0 (0.0%) |
Employment Characteristics in Blue Ridge
Employment by Class of Employer in Blue Ridge
Among the 1,475 employed individuals in Blue Ridge, private company employees (1,133 | 76.8%), not-for-profit organizations (127 | 8.6%), and local government employees (78 | 5.3%) make up the most common classes of employment.
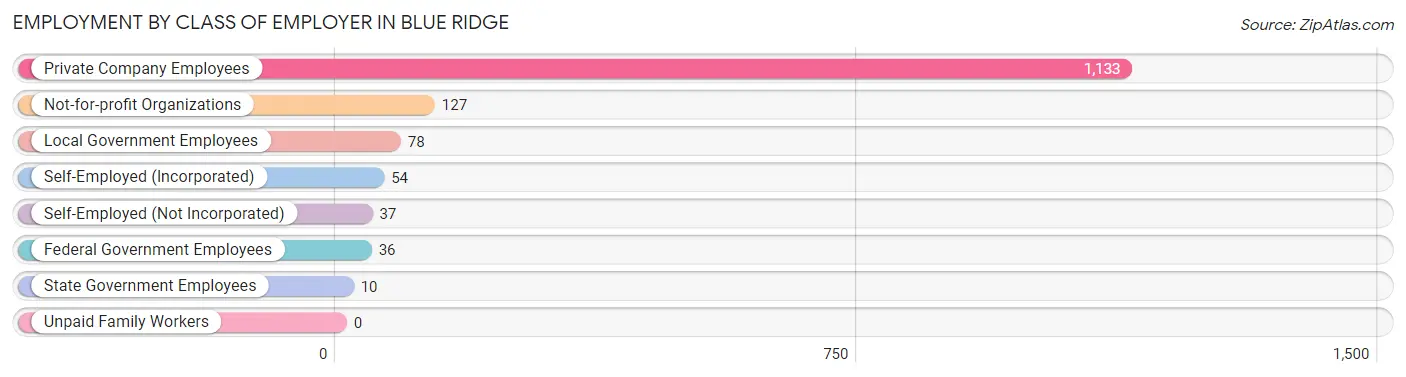
| Employer Class | # Employees | % Employees |
| Private Company Employees | 1,133 | 76.8% |
| Self-Employed (Incorporated) | 54 | 3.7% |
| Self-Employed (Not Incorporated) | 37 | 2.5% |
| Not-for-profit Organizations | 127 | 8.6% |
| Local Government Employees | 78 | 5.3% |
| State Government Employees | 10 | 0.7% |
| Federal Government Employees | 36 | 2.4% |
| Unpaid Family Workers | 0 | 0.0% |
| Total | 1,475 | 100.0% |
Employment Status by Age in Blue Ridge
According to the labor force statistics for Blue Ridge, out of the total population over 16 years of age (2,413), 64.4% or 1,554 individuals are in the labor force, with 4.5% or 70 of them unemployed. The age group with the highest labor force participation rate is 25 to 29 years, with 97.7% or 128 individuals in the labor force. Within the labor force, the 45 to 54 years age range has the highest percentage of unemployed individuals, with 14.7% or 33 of them being unemployed.
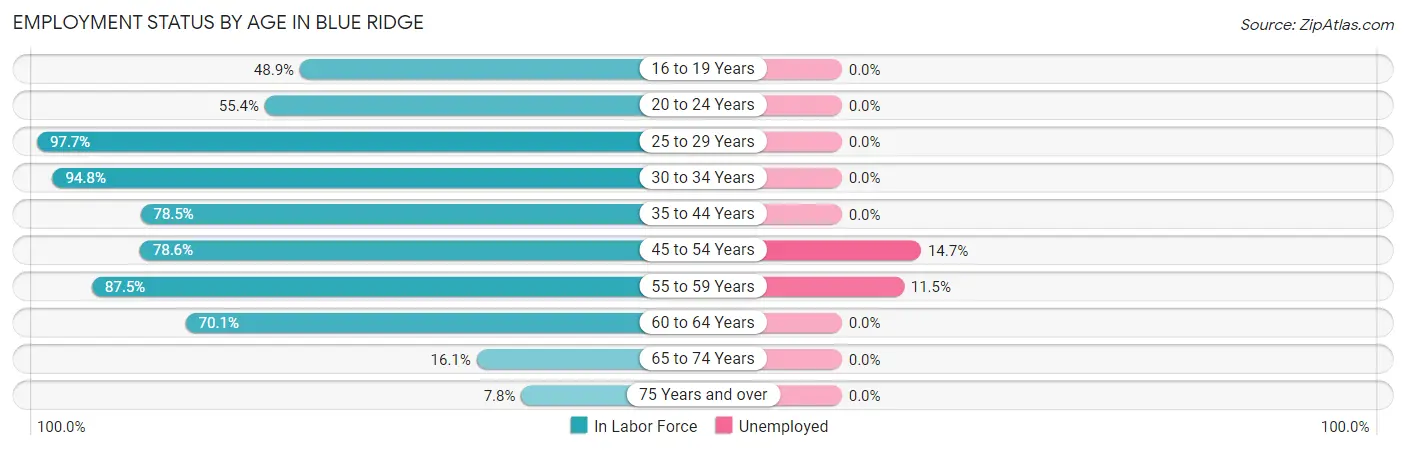
| Age Bracket | In Labor Force | Unemployed |
| 16 to 19 Years | 113 (48.9%) | 0 (0.0%) |
| 20 to 24 Years | 56 (55.4%) | 0 (0.0%) |
| 25 to 29 Years | 128 (97.7%) | 0 (0.0%) |
| 30 to 34 Years | 181 (94.8%) | 0 (0.0%) |
| 35 to 44 Years | 266 (78.5%) | 0 (0.0%) |
| 45 to 54 Years | 224 (78.6%) | 33 (14.7%) |
| 55 to 59 Years | 323 (87.5%) | 37 (11.5%) |
| 60 to 64 Years | 202 (70.1%) | 0 (0.0%) |
| 65 to 74 Years | 48 (16.1%) | 0 (0.0%) |
| 75 Years and over | 14 (7.8%) | 0 (0.0%) |
| Total | 1,554 (64.4%) | 70 (4.5%) |
Employment Status by Educational Attainment in Blue Ridge
According to labor force statistics for Blue Ridge, 82.6% of individuals (1,324) out of the total population between 25 and 64 years of age (1,603) are in the labor force, with 5.3% or 70 of them being unemployed. The group with the highest labor force participation rate are those with the educational attainment of bachelor's degree or higher, with 89.3% or 260 individuals in the labor force. Within the labor force, individuals with college / associate degree education have the highest percentage of unemployment, with 7.1% or 37 of them being unemployed.
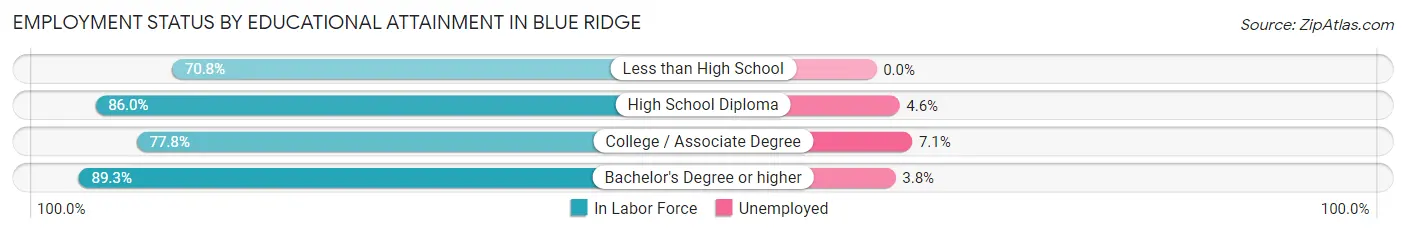
| Educational Attainment | In Labor Force | Unemployed |
| Less than High School | 46 (70.8%) | 0 (0.0%) |
| High School Diploma | 498 (86.0%) | 27 (4.6%) |
| College / Associate Degree | 520 (77.8%) | 47 (7.1%) |
| Bachelor's Degree or higher | 260 (89.3%) | 11 (3.8%) |
| Total | 1,324 (82.6%) | 85 (5.3%) |
Employment Occupations by Sex in Blue Ridge
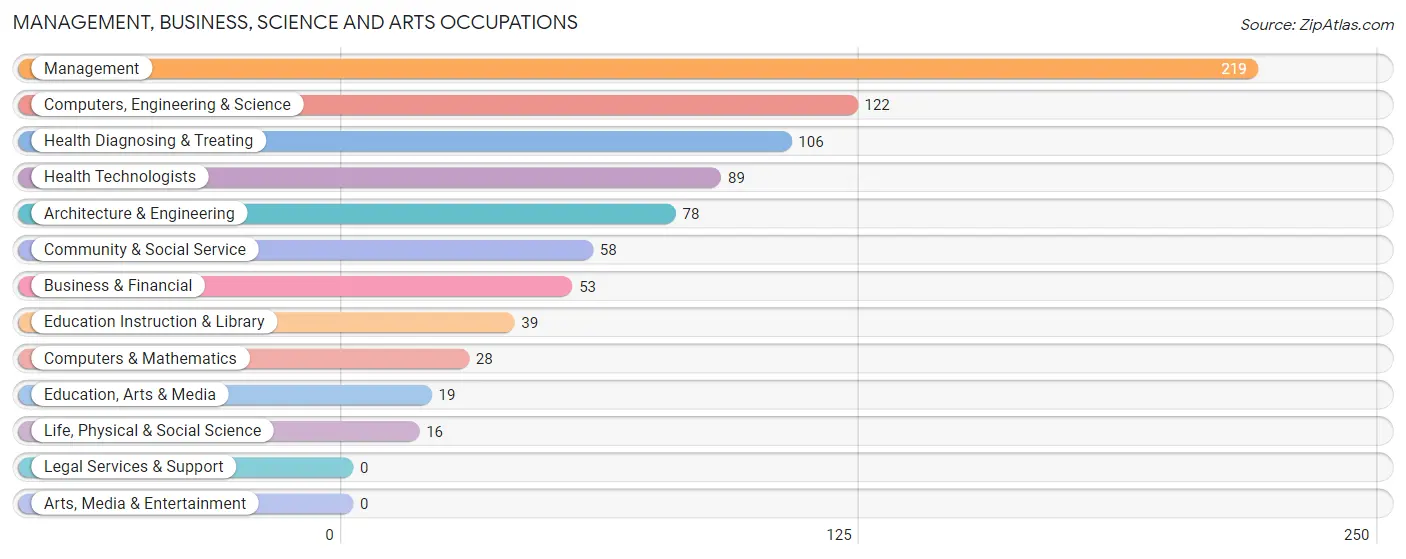
Management, Business, Science and Arts Occupations
The most common Management, Business, Science and Arts occupations in Blue Ridge are Management (219 | 14.7%), Computers, Engineering & Science (122 | 8.2%), Health Diagnosing & Treating (106 | 7.1%), Health Technologists (89 | 6.0%), and Architecture & Engineering (78 | 5.2%).
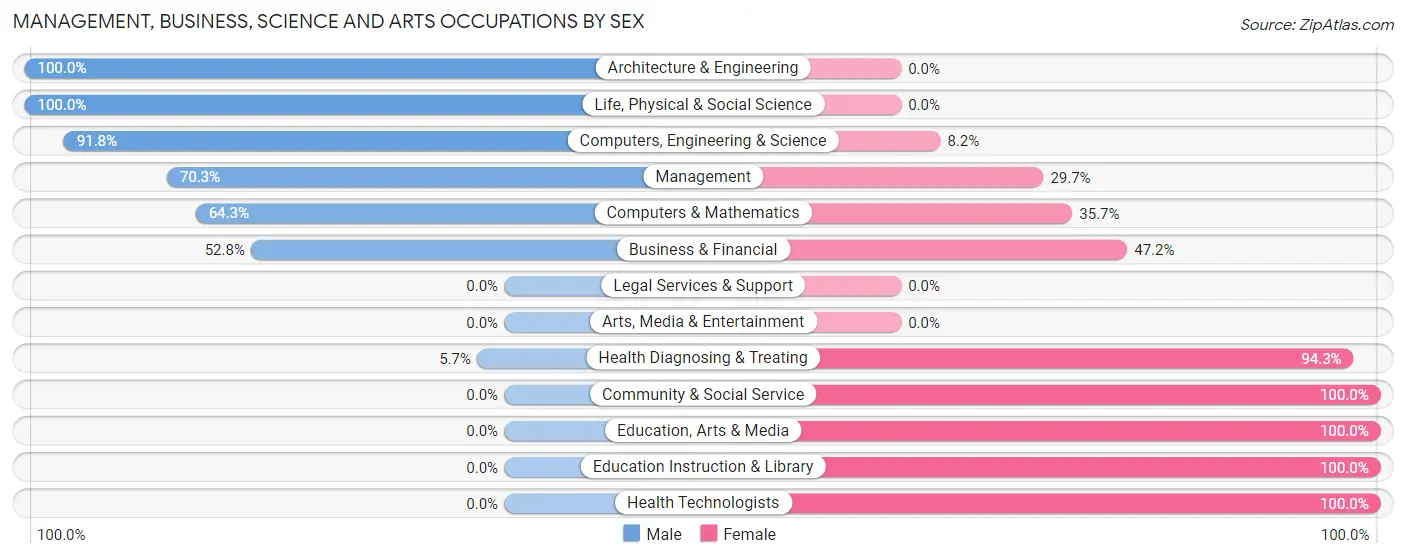
Management, Business, Science and Arts Occupations by Sex
Within the Management, Business, Science and Arts occupations in Blue Ridge, the most male-oriented occupations are Architecture & Engineering (100.0%), Life, Physical & Social Science (100.0%), and Computers, Engineering & Science (91.8%), while the most female-oriented occupations are Community & Social Service (100.0%), Education, Arts & Media (100.0%), and Education Instruction & Library (100.0%).
| Occupation | Male | Female |
| Management | 154 (70.3%) | 65 (29.7%) |
| Business & Financial | 28 (52.8%) | 25 (47.2%) |
| Computers, Engineering & Science | 112 (91.8%) | 10 (8.2%) |
| Computers & Mathematics | 18 (64.3%) | 10 (35.7%) |
| Architecture & Engineering | 78 (100.0%) | 0 (0.0%) |
| Life, Physical & Social Science | 16 (100.0%) | 0 (0.0%) |
| Community & Social Service | 0 (0.0%) | 58 (100.0%) |
| Education, Arts & Media | 0 (0.0%) | 19 (100.0%) |
| Legal Services & Support | 0 (0.0%) | 0 (0.0%) |
| Education Instruction & Library | 0 (0.0%) | 39 (100.0%) |
| Arts, Media & Entertainment | 0 (0.0%) | 0 (0.0%) |
| Health Diagnosing & Treating | 6 (5.7%) | 100 (94.3%) |
| Health Technologists | 0 (0.0%) | 89 (100.0%) |
| Total (Category) | 300 (53.8%) | 258 (46.2%) |
| Total (Overall) | 750 (50.5%) | 735 (49.5%) |
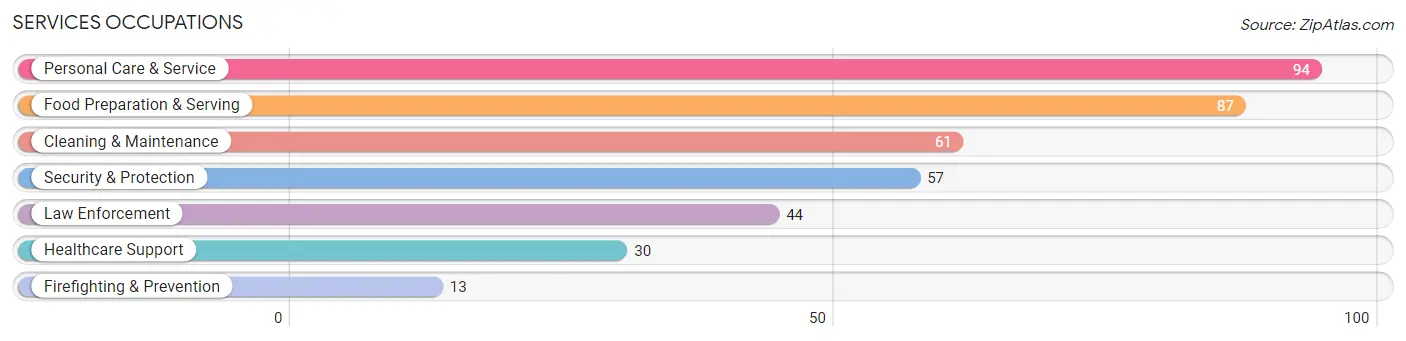
Services Occupations
The most common Services occupations in Blue Ridge are Personal Care & Service (94 | 6.3%), Food Preparation & Serving (87 | 5.9%), Cleaning & Maintenance (61 | 4.1%), Security & Protection (57 | 3.8%), and Law Enforcement (44 | 3.0%).
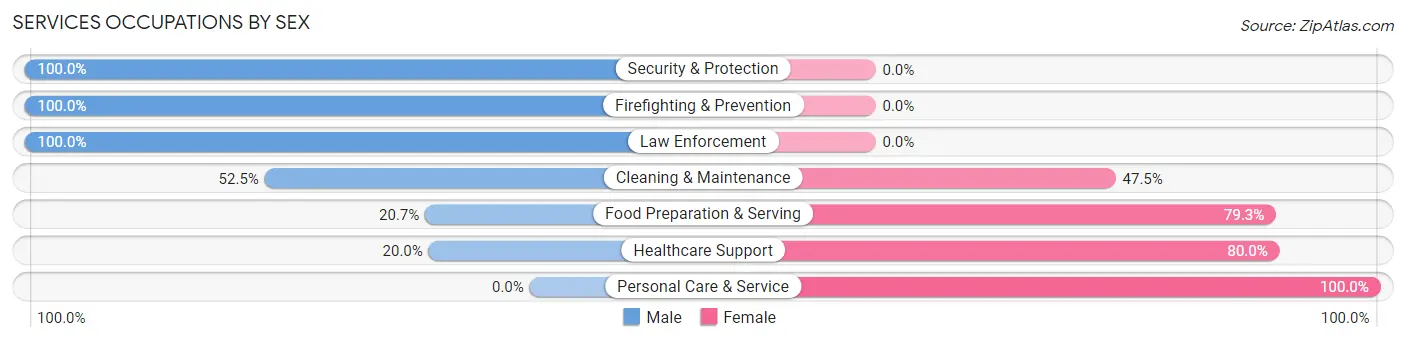
Services Occupations by Sex
Within the Services occupations in Blue Ridge, the most male-oriented occupations are Security & Protection (100.0%), Firefighting & Prevention (100.0%), and Law Enforcement (100.0%), while the most female-oriented occupations are Personal Care & Service (100.0%), Healthcare Support (80.0%), and Food Preparation & Serving (79.3%).
| Occupation | Male | Female |
| Healthcare Support | 6 (20.0%) | 24 (80.0%) |
| Security & Protection | 57 (100.0%) | 0 (0.0%) |
| Firefighting & Prevention | 13 (100.0%) | 0 (0.0%) |
| Law Enforcement | 44 (100.0%) | 0 (0.0%) |
| Food Preparation & Serving | 18 (20.7%) | 69 (79.3%) |
| Cleaning & Maintenance | 32 (52.5%) | 29 (47.5%) |
| Personal Care & Service | 0 (0.0%) | 94 (100.0%) |
| Total (Category) | 113 (34.4%) | 216 (65.6%) |
| Total (Overall) | 750 (50.5%) | 735 (49.5%) |
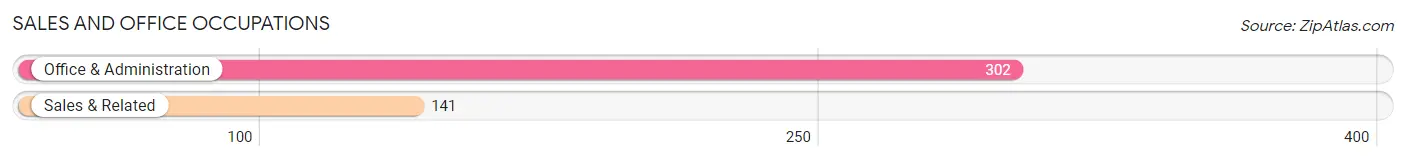
Sales and Office Occupations
The most common Sales and Office occupations in Blue Ridge are Office & Administration (302 | 20.3%), and Sales & Related (141 | 9.5%).
Sales and Office Occupations by Sex
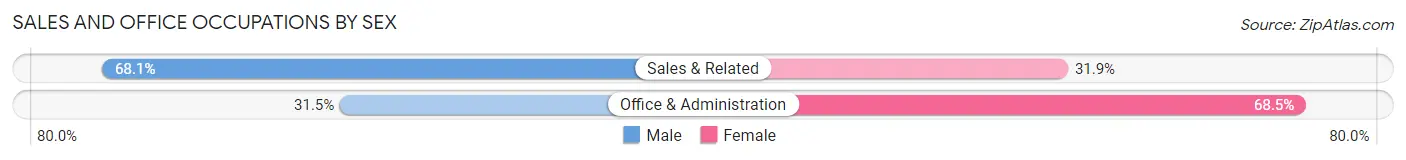
| Occupation | Male | Female |
| Sales & Related | 96 (68.1%) | 45 (31.9%) |
| Office & Administration | 95 (31.5%) | 207 (68.5%) |
| Total (Category) | 191 (43.1%) | 252 (56.9%) |
| Total (Overall) | 750 (50.5%) | 735 (49.5%) |
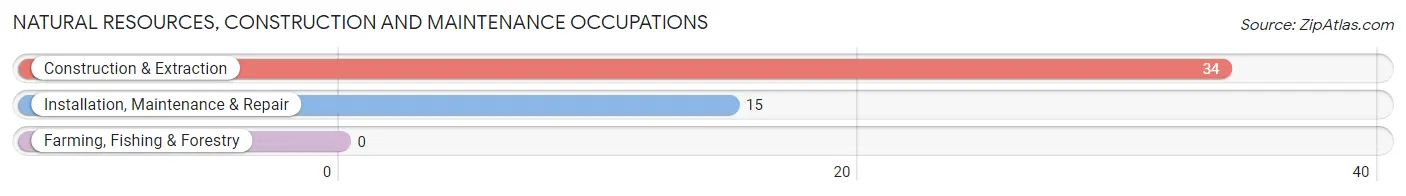
Natural Resources, Construction and Maintenance Occupations
The most common Natural Resources, Construction and Maintenance occupations in Blue Ridge are Construction & Extraction (34 | 2.3%), and Installation, Maintenance & Repair (15 | 1.0%).
Natural Resources, Construction and Maintenance Occupations by Sex
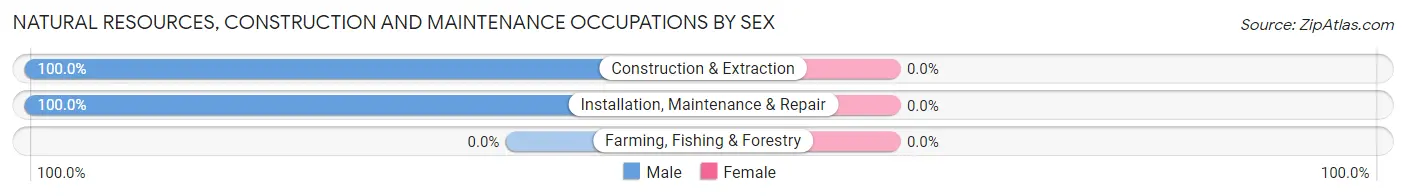
| Occupation | Male | Female |
| Farming, Fishing & Forestry | 0 (0.0%) | 0 (0.0%) |
| Construction & Extraction | 34 (100.0%) | 0 (0.0%) |
| Installation, Maintenance & Repair | 15 (100.0%) | 0 (0.0%) |
| Total (Category) | 49 (100.0%) | 0 (0.0%) |
| Total (Overall) | 750 (50.5%) | 735 (49.5%) |
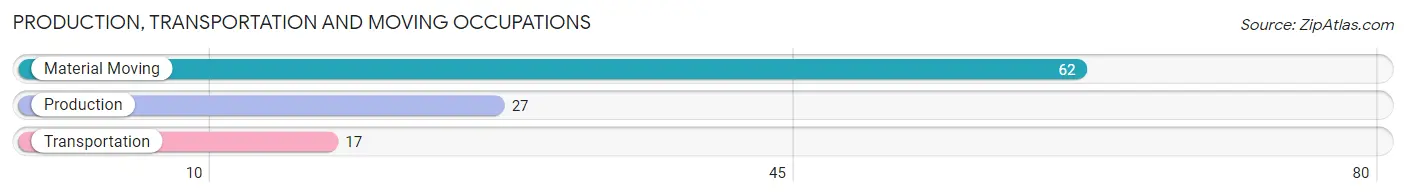
Production, Transportation and Moving Occupations
The most common Production, Transportation and Moving occupations in Blue Ridge are Material Moving (62 | 4.2%), Production (27 | 1.8%), and Transportation (17 | 1.1%).
Production, Transportation and Moving Occupations by Sex
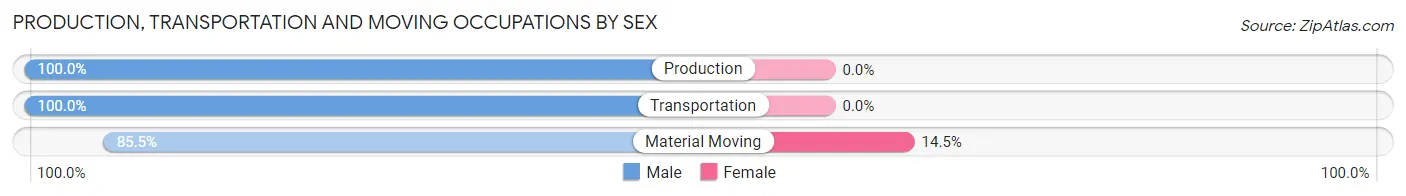
| Occupation | Male | Female |
| Production | 27 (100.0%) | 0 (0.0%) |
| Transportation | 17 (100.0%) | 0 (0.0%) |
| Material Moving | 53 (85.5%) | 9 (14.5%) |
| Total (Category) | 97 (91.5%) | 9 (8.5%) |
| Total (Overall) | 750 (50.5%) | 735 (49.5%) |
Employment Industries by Sex in Blue Ridge
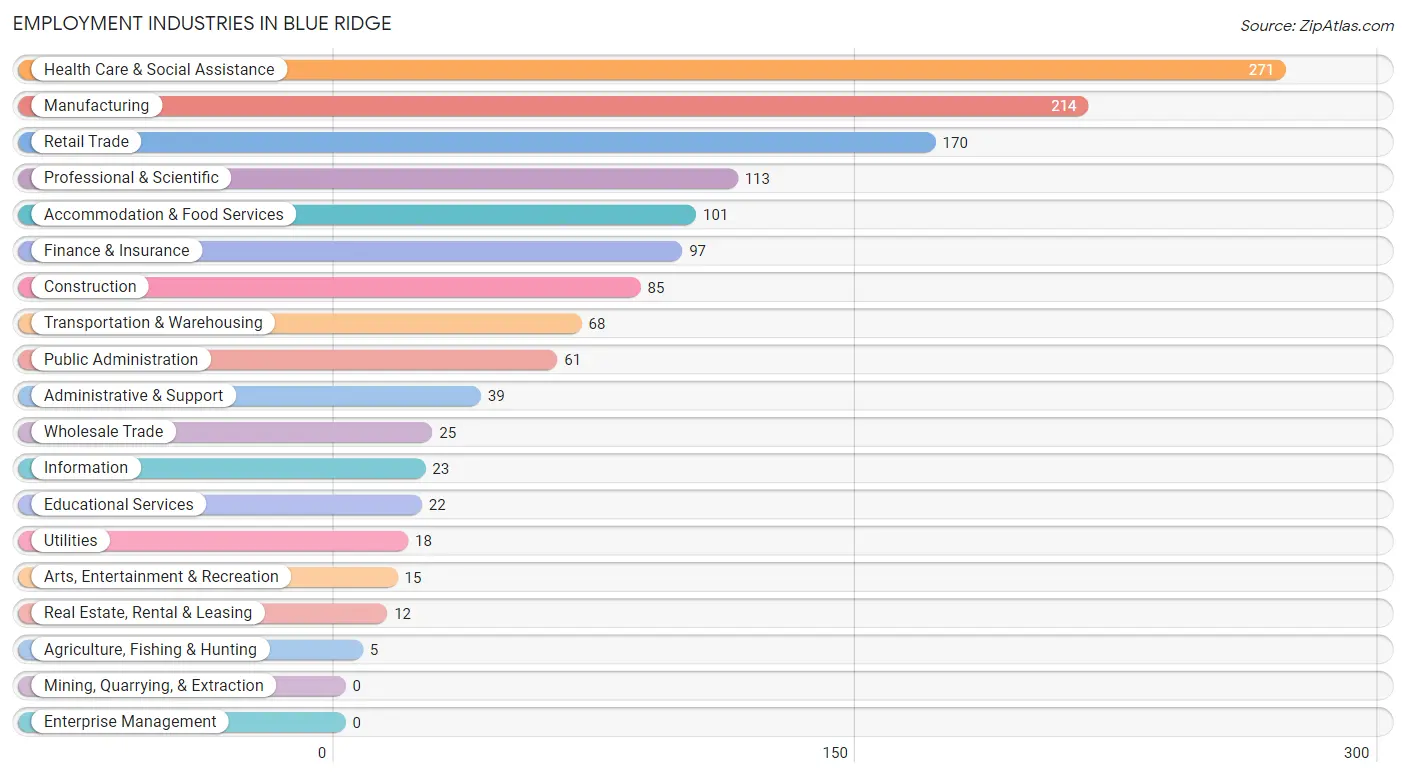
Employment Industries in Blue Ridge
The major employment industries in Blue Ridge include Health Care & Social Assistance (271 | 18.2%), Manufacturing (214 | 14.4%), Retail Trade (170 | 11.5%), Professional & Scientific (113 | 7.6%), and Accommodation & Food Services (101 | 6.8%).
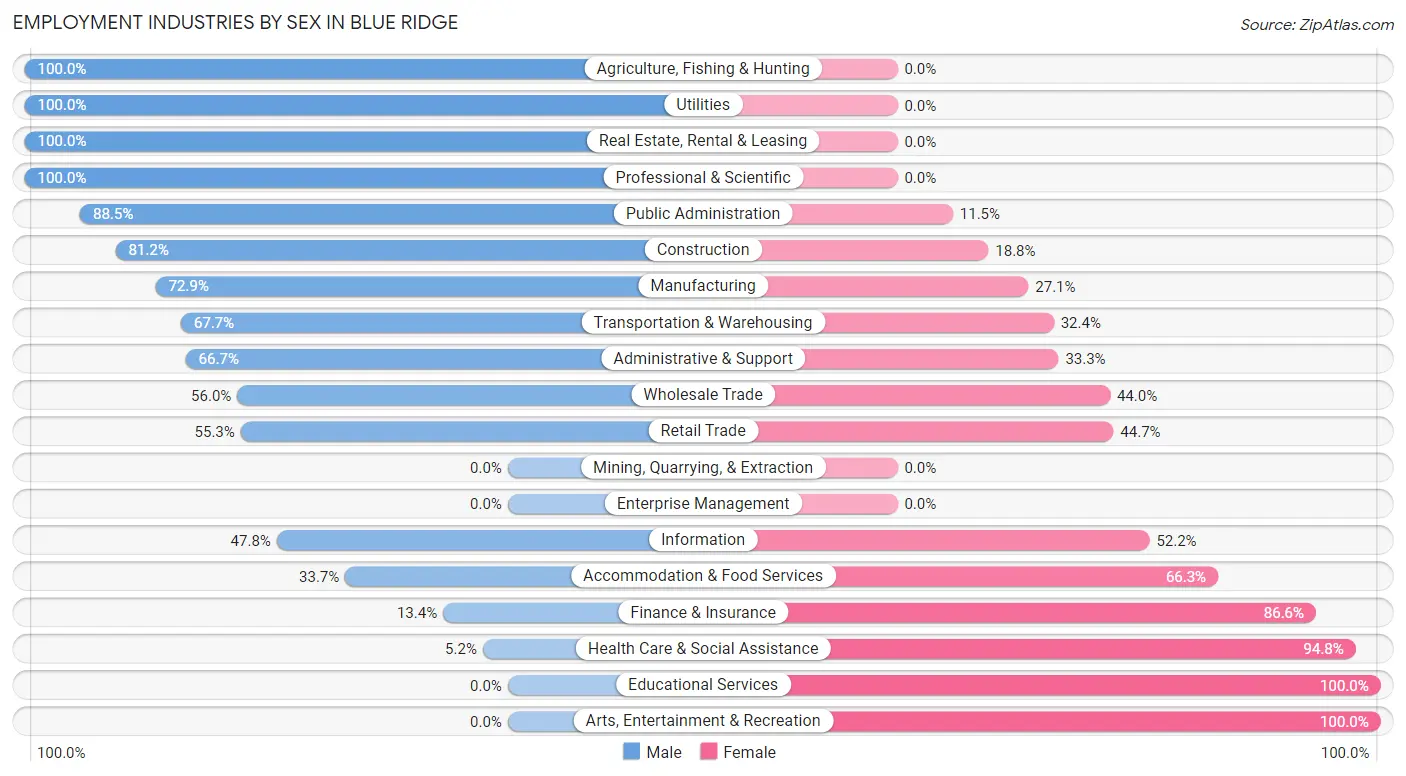
Employment Industries by Sex in Blue Ridge
The Blue Ridge industries that see more men than women are Agriculture, Fishing & Hunting (100.0%), Utilities (100.0%), and Real Estate, Rental & Leasing (100.0%), whereas the industries that tend to have a higher number of women are Educational Services (100.0%), Arts, Entertainment & Recreation (100.0%), and Health Care & Social Assistance (94.8%).
| Industry | Male | Female |
| Agriculture, Fishing & Hunting | 5 (100.0%) | 0 (0.0%) |
| Mining, Quarrying, & Extraction | 0 (0.0%) | 0 (0.0%) |
| Construction | 69 (81.2%) | 16 (18.8%) |
| Manufacturing | 156 (72.9%) | 58 (27.1%) |
| Wholesale Trade | 14 (56.0%) | 11 (44.0%) |
| Retail Trade | 94 (55.3%) | 76 (44.7%) |
| Transportation & Warehousing | 46 (67.6%) | 22 (32.4%) |
| Utilities | 18 (100.0%) | 0 (0.0%) |
| Information | 11 (47.8%) | 12 (52.2%) |
| Finance & Insurance | 13 (13.4%) | 84 (86.6%) |
| Real Estate, Rental & Leasing | 12 (100.0%) | 0 (0.0%) |
| Professional & Scientific | 113 (100.0%) | 0 (0.0%) |
| Enterprise Management | 0 (0.0%) | 0 (0.0%) |
| Administrative & Support | 26 (66.7%) | 13 (33.3%) |
| Educational Services | 0 (0.0%) | 22 (100.0%) |
| Health Care & Social Assistance | 14 (5.2%) | 257 (94.8%) |
| Arts, Entertainment & Recreation | 0 (0.0%) | 15 (100.0%) |
| Accommodation & Food Services | 34 (33.7%) | 67 (66.3%) |
| Public Administration | 54 (88.5%) | 7 (11.5%) |
| Total | 750 (50.5%) | 735 (49.5%) |
Education in Blue Ridge
School Enrollment in Blue Ridge
The most common levels of schooling among the 666 students in Blue Ridge are middle school (221 | 33.2%), high school (125 | 18.8%), and elementary school (119 | 17.9%).
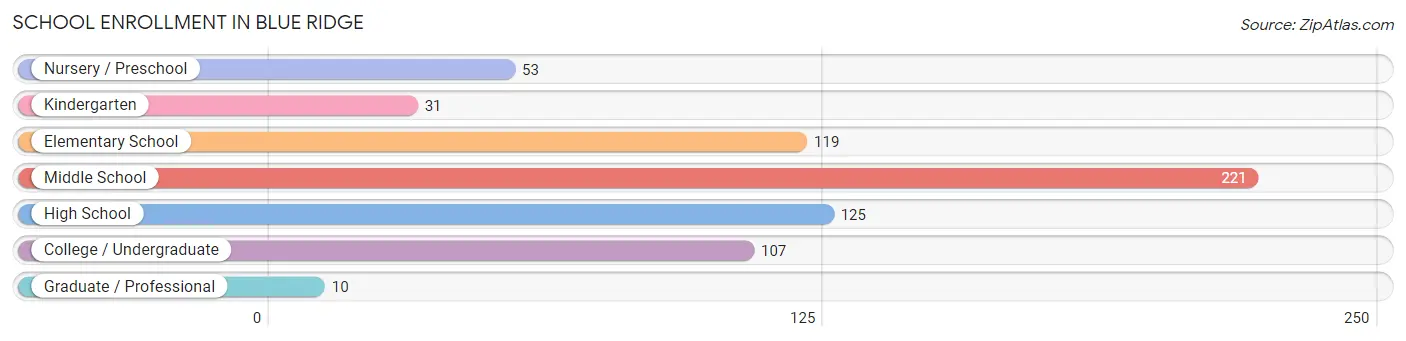
| School Level | # Students | % Students |
| Nursery / Preschool | 53 | 8.0% |
| Kindergarten | 31 | 4.6% |
| Elementary School | 119 | 17.9% |
| Middle School | 221 | 33.2% |
| High School | 125 | 18.8% |
| College / Undergraduate | 107 | 16.1% |
| Graduate / Professional | 10 | 1.5% |
| Total | 666 | 100.0% |
School Enrollment by Age by Funding Source in Blue Ridge
Out of a total of 666 students who are enrolled in schools in Blue Ridge, 147 (22.1%) attend a private institution, while the remaining 519 (77.9%) are enrolled in public schools. The age group of 20 to 24 year olds has the highest likelihood of being enrolled in private schools, with 30 (66.7% in the age bracket) enrolled. Conversely, the age group of 5 to 9 year old has the lowest likelihood of being enrolled in a private school, with 130 (100.0% in the age bracket) attending a public institution.
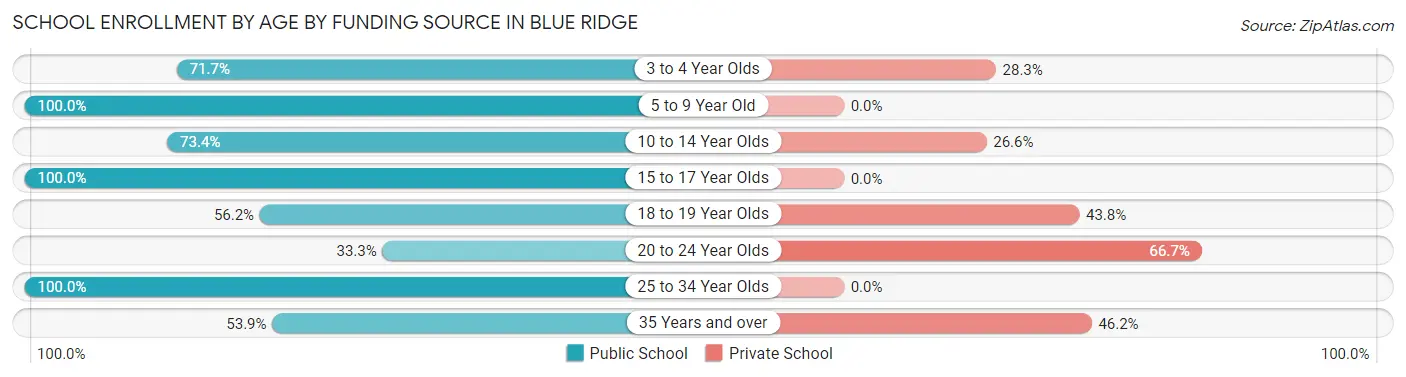
| Age Bracket | Public School | Private School |
| 3 to 4 Year Olds | 38 (71.7%) | 15 (28.3%) |
| 5 to 9 Year Old | 130 (100.0%) | 0 (0.0%) |
| 10 to 14 Year Olds | 177 (73.4%) | 64 (26.6%) |
| 15 to 17 Year Olds | 52 (100.0%) | 0 (0.0%) |
| 18 to 19 Year Olds | 41 (56.2%) | 32 (43.8%) |
| 20 to 24 Year Olds | 15 (33.3%) | 30 (66.7%) |
| 25 to 34 Year Olds | 59 (100.0%) | 0 (0.0%) |
| 35 Years and over | 7 (53.8%) | 6 (46.2%) |
| Total | 519 (77.9%) | 147 (22.1%) |
Educational Attainment by Field of Study in Blue Ridge
Business (93 | 19.7%), science & technology (65 | 13.7%), bio, nature & agricultural (55 | 11.6%), computers & mathematics (47 | 9.9%), and education (47 | 9.9%) are the most common fields of study among 473 individuals in Blue Ridge who have obtained a bachelor's degree or higher.
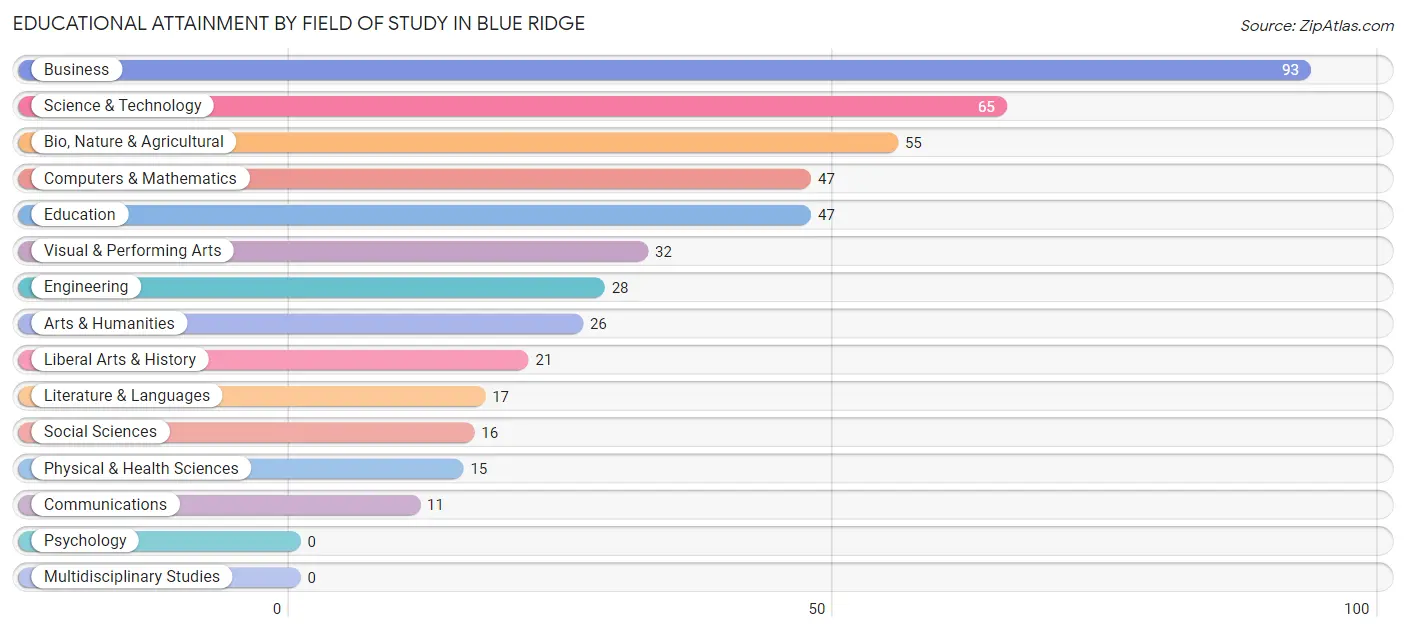
| Field of Study | # Graduates | % Graduates |
| Computers & Mathematics | 47 | 9.9% |
| Bio, Nature & Agricultural | 55 | 11.6% |
| Physical & Health Sciences | 15 | 3.2% |
| Psychology | 0 | 0.0% |
| Social Sciences | 16 | 3.4% |
| Engineering | 28 | 5.9% |
| Multidisciplinary Studies | 0 | 0.0% |
| Science & Technology | 65 | 13.7% |
| Business | 93 | 19.7% |
| Education | 47 | 9.9% |
| Literature & Languages | 17 | 3.6% |
| Liberal Arts & History | 21 | 4.4% |
| Visual & Performing Arts | 32 | 6.8% |
| Communications | 11 | 2.3% |
| Arts & Humanities | 26 | 5.5% |
| Total | 473 | 100.0% |
Transportation & Commute in Blue Ridge
Vehicle Availability by Sex in Blue Ridge
The most prevalent vehicle ownership categories in Blue Ridge are males with 2 vehicles (297, accounting for 40.1%) and females with 2 vehicles (220, making up 40.4%).
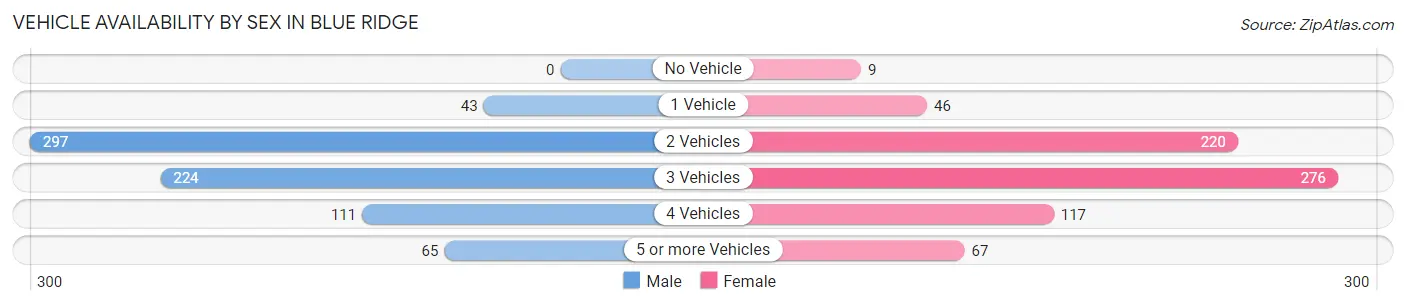
| Vehicles Available | Male | Female |
| No Vehicle | 0 (0.0%) | 9 (1.2%) |
| 1 Vehicle | 43 (5.8%) | 46 (6.3%) |
| 2 Vehicles | 297 (40.1%) | 220 (29.9%) |
| 3 Vehicles | 224 (30.3%) | 276 (37.6%) |
| 4 Vehicles | 111 (15.0%) | 117 (15.9%) |
| 5 or more Vehicles | 65 (8.8%) | 67 (9.1%) |
| Total | 740 (100.0%) | 735 (100.0%) |
Commute Time in Blue Ridge
The most frequently occuring commute durations in Blue Ridge are 20 to 24 minutes (258 commuters, 20.2%), 15 to 19 minutes (197 commuters, 15.4%), and 25 to 29 minutes (197 commuters, 15.4%).
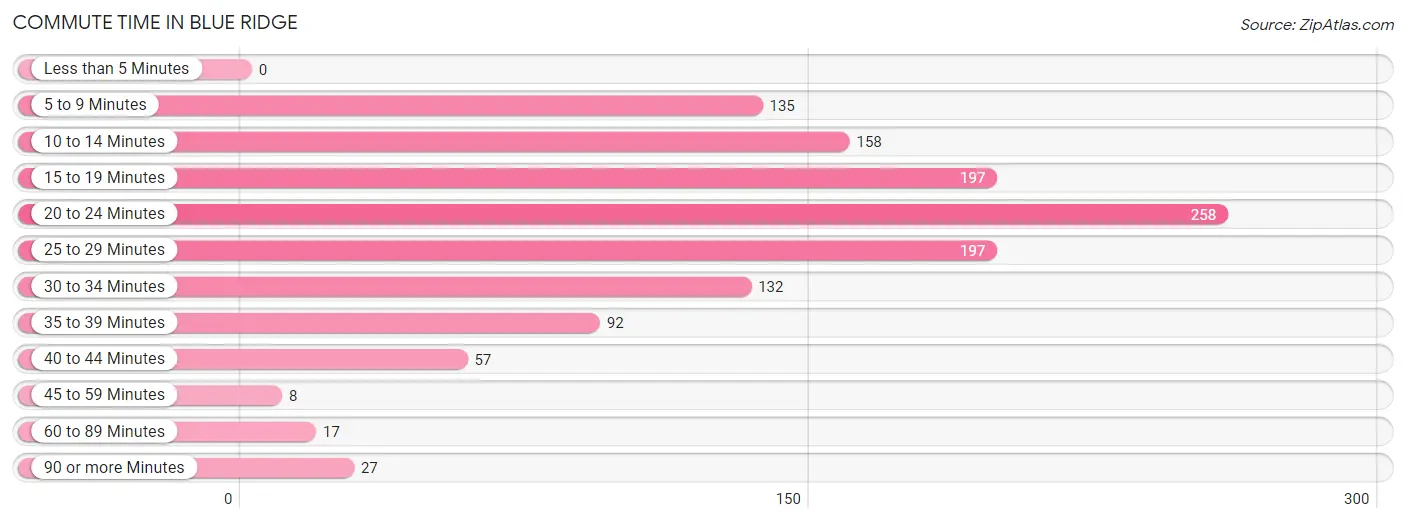
| Commute Time | # Commuters | % Commuters |
| Less than 5 Minutes | 0 | 0.0% |
| 5 to 9 Minutes | 135 | 10.6% |
| 10 to 14 Minutes | 158 | 12.4% |
| 15 to 19 Minutes | 197 | 15.4% |
| 20 to 24 Minutes | 258 | 20.2% |
| 25 to 29 Minutes | 197 | 15.4% |
| 30 to 34 Minutes | 132 | 10.3% |
| 35 to 39 Minutes | 92 | 7.2% |
| 40 to 44 Minutes | 57 | 4.5% |
| 45 to 59 Minutes | 8 | 0.6% |
| 60 to 89 Minutes | 17 | 1.3% |
| 90 or more Minutes | 27 | 2.1% |
Commute Time by Sex in Blue Ridge
The most common commute times in Blue Ridge are 15 to 19 minutes (131 commuters, 20.8%) for males and 20 to 24 minutes (141 commuters, 21.8%) for females.
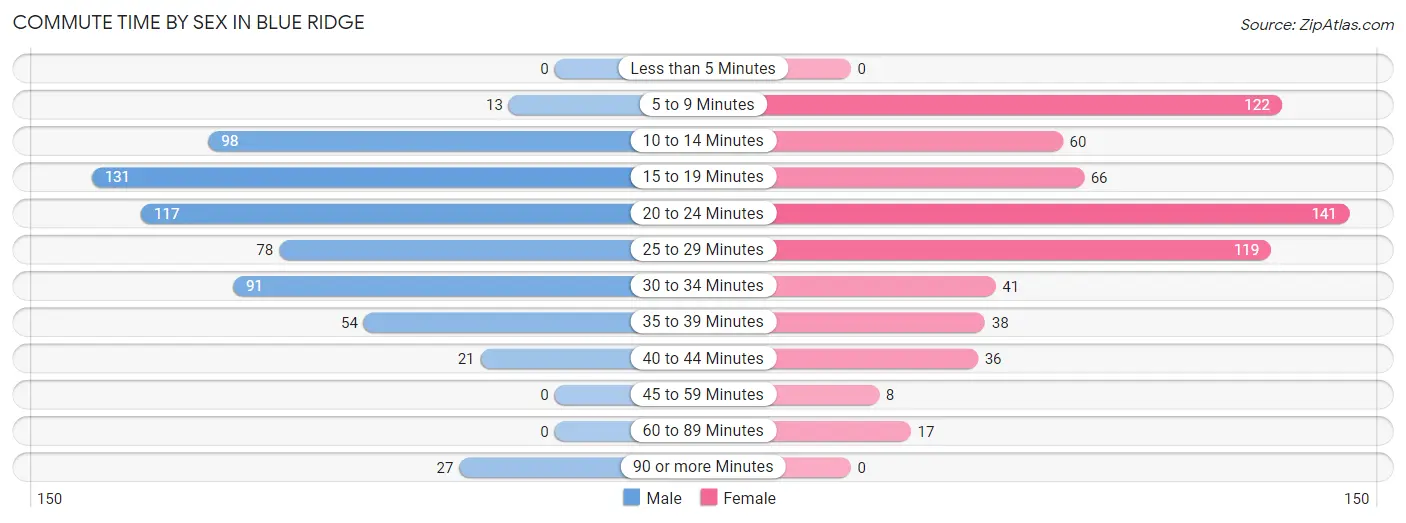
| Commute Time | Male | Female |
| Less than 5 Minutes | 0 (0.0%) | 0 (0.0%) |
| 5 to 9 Minutes | 13 (2.1%) | 122 (18.8%) |
| 10 to 14 Minutes | 98 (15.6%) | 60 (9.3%) |
| 15 to 19 Minutes | 131 (20.8%) | 66 (10.2%) |
| 20 to 24 Minutes | 117 (18.6%) | 141 (21.8%) |
| 25 to 29 Minutes | 78 (12.4%) | 119 (18.4%) |
| 30 to 34 Minutes | 91 (14.4%) | 41 (6.3%) |
| 35 to 39 Minutes | 54 (8.6%) | 38 (5.9%) |
| 40 to 44 Minutes | 21 (3.3%) | 36 (5.6%) |
| 45 to 59 Minutes | 0 (0.0%) | 8 (1.2%) |
| 60 to 89 Minutes | 0 (0.0%) | 17 (2.6%) |
| 90 or more Minutes | 27 (4.3%) | 0 (0.0%) |
Time of Departure to Work by Sex in Blue Ridge
The most frequent times of departure to work in Blue Ridge are 8:00 AM to 8:29 AM (106, 16.8%) for males and 7:30 AM to 7:59 AM (185, 28.5%) for females.
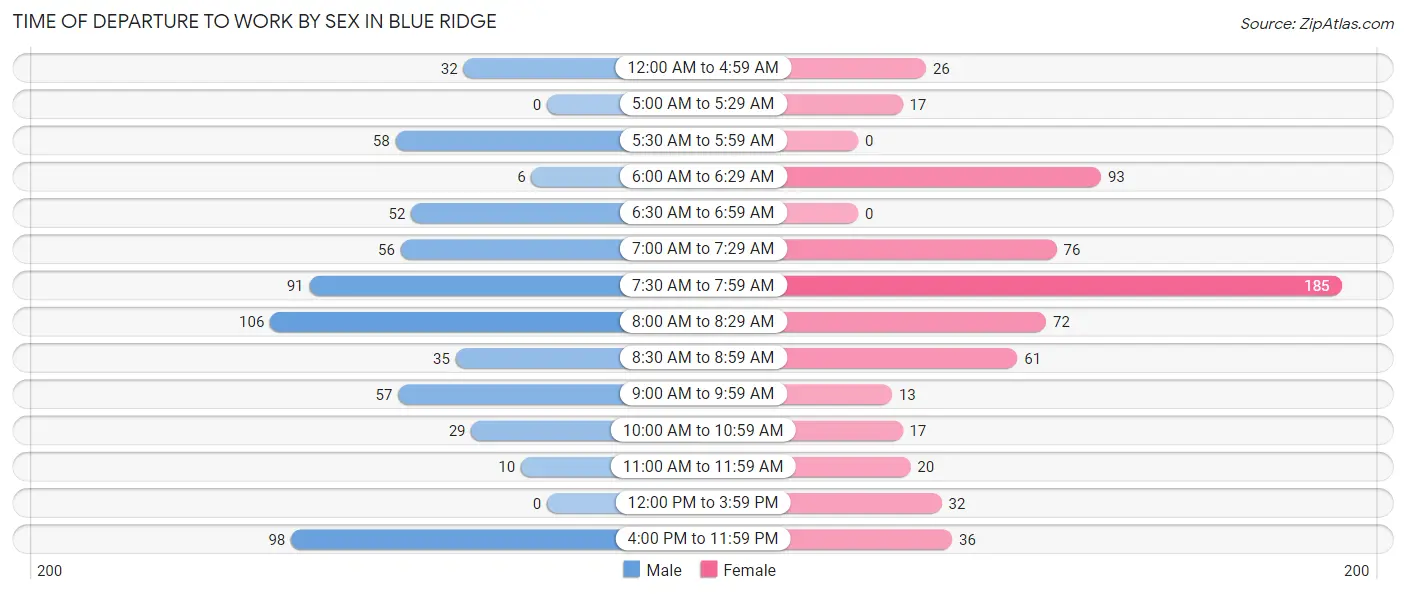
| Time of Departure | Male | Female |
| 12:00 AM to 4:59 AM | 32 (5.1%) | 26 (4.0%) |
| 5:00 AM to 5:29 AM | 0 (0.0%) | 17 (2.6%) |
| 5:30 AM to 5:59 AM | 58 (9.2%) | 0 (0.0%) |
| 6:00 AM to 6:29 AM | 6 (0.9%) | 93 (14.3%) |
| 6:30 AM to 6:59 AM | 52 (8.3%) | 0 (0.0%) |
| 7:00 AM to 7:29 AM | 56 (8.9%) | 76 (11.7%) |
| 7:30 AM to 7:59 AM | 91 (14.4%) | 185 (28.5%) |
| 8:00 AM to 8:29 AM | 106 (16.8%) | 72 (11.1%) |
| 8:30 AM to 8:59 AM | 35 (5.6%) | 61 (9.4%) |
| 9:00 AM to 9:59 AM | 57 (9.0%) | 13 (2.0%) |
| 10:00 AM to 10:59 AM | 29 (4.6%) | 17 (2.6%) |
| 11:00 AM to 11:59 AM | 10 (1.6%) | 20 (3.1%) |
| 12:00 PM to 3:59 PM | 0 (0.0%) | 32 (4.9%) |
| 4:00 PM to 11:59 PM | 98 (15.6%) | 36 (5.6%) |
| Total | 630 (100.0%) | 648 (100.0%) |
Housing Occupancy in Blue Ridge
Occupancy by Ownership in Blue Ridge
Of the total 1,111 dwellings in Blue Ridge, owner-occupied units account for 1,051 (94.6%), while renter-occupied units make up 60 (5.4%).
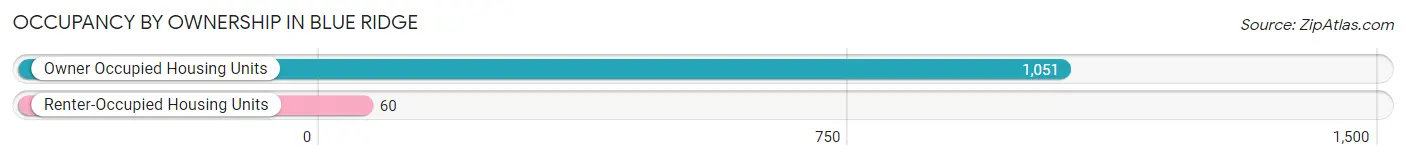
| Occupancy | # Housing Units | % Housing Units |
| Owner Occupied Housing Units | 1,051 | 94.6% |
| Renter-Occupied Housing Units | 60 | 5.4% |
| Total Occupied Housing Units | 1,111 | 100.0% |
Occupancy by Household Size in Blue Ridge
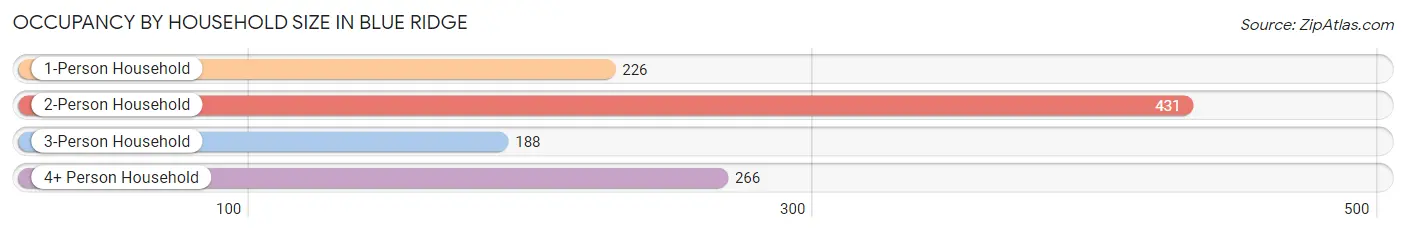
| Household Size | # Housing Units | % Housing Units |
| 1-Person Household | 226 | 20.3% |
| 2-Person Household | 431 | 38.8% |
| 3-Person Household | 188 | 16.9% |
| 4+ Person Household | 266 | 23.9% |
| Total Housing Units | 1,111 | 100.0% |
Occupancy by Ownership by Household Size in Blue Ridge
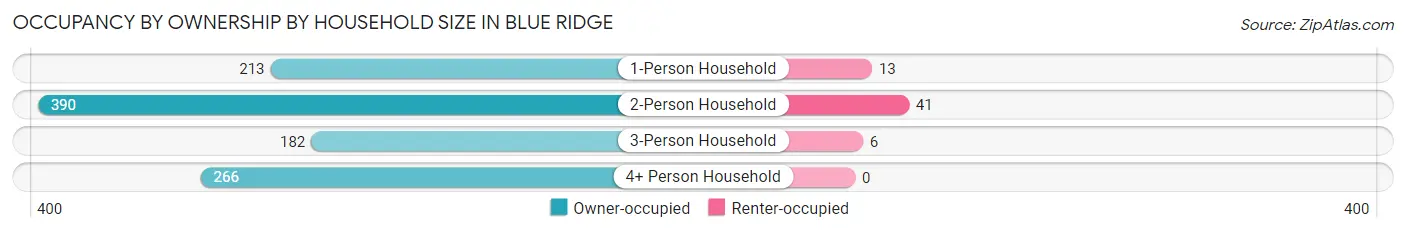
| Household Size | Owner-occupied | Renter-occupied |
| 1-Person Household | 213 (94.3%) | 13 (5.8%) |
| 2-Person Household | 390 (90.5%) | 41 (9.5%) |
| 3-Person Household | 182 (96.8%) | 6 (3.2%) |
| 4+ Person Household | 266 (100.0%) | 0 (0.0%) |
| Total Housing Units | 1,051 (94.6%) | 60 (5.4%) |
Occupancy by Educational Attainment in Blue Ridge
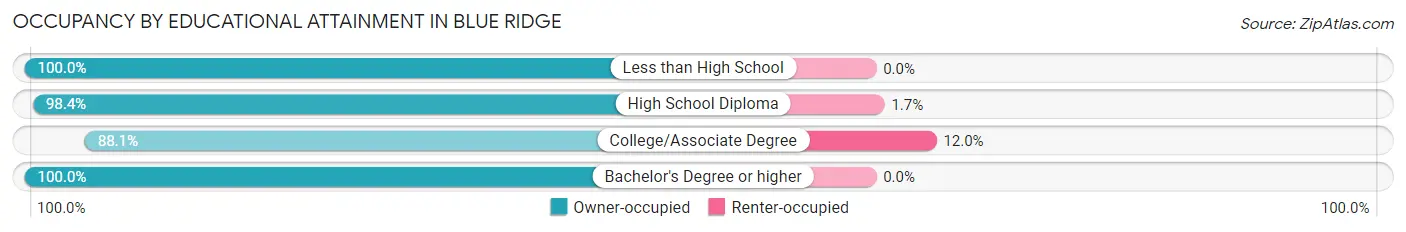
| Household Size | Owner-occupied | Renter-occupied |
| Less than High School | 25 (100.0%) | 0 (0.0%) |
| High School Diploma | 357 (98.4%) | 6 (1.7%) |
| College/Associate Degree | 398 (88.0%) | 54 (11.9%) |
| Bachelor's Degree or higher | 271 (100.0%) | 0 (0.0%) |
Occupancy by Age of Householder in Blue Ridge
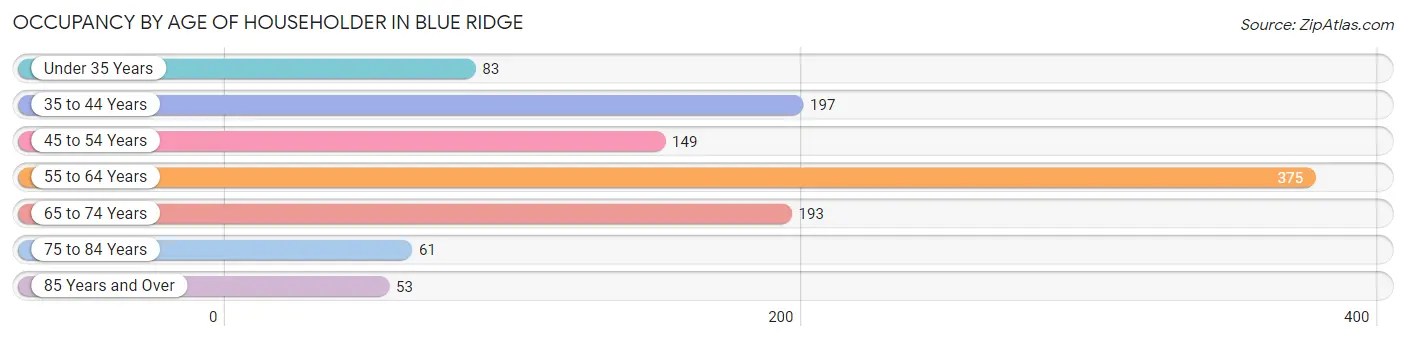
| Age Bracket | # Households | % Households |
| Under 35 Years | 83 | 7.5% |
| 35 to 44 Years | 197 | 17.7% |
| 45 to 54 Years | 149 | 13.4% |
| 55 to 64 Years | 375 | 33.8% |
| 65 to 74 Years | 193 | 17.4% |
| 75 to 84 Years | 61 | 5.5% |
| 85 Years and Over | 53 | 4.8% |
| Total | 1,111 | 100.0% |
Housing Finances in Blue Ridge
Median Income by Occupancy in Blue Ridge
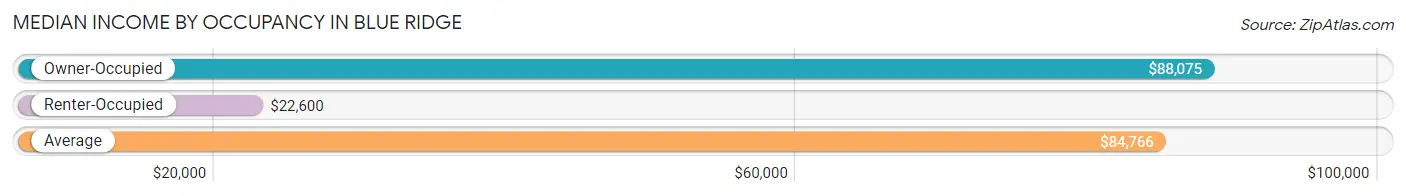
| Occupancy Type | # Households | Median Income |
| Owner-Occupied | 1,051 (94.6%) | $88,075 |
| Renter-Occupied | 60 (5.4%) | $22,600 |
| Average | 1,111 (100.0%) | $84,766 |
Occupancy by Householder Income Bracket in Blue Ridge
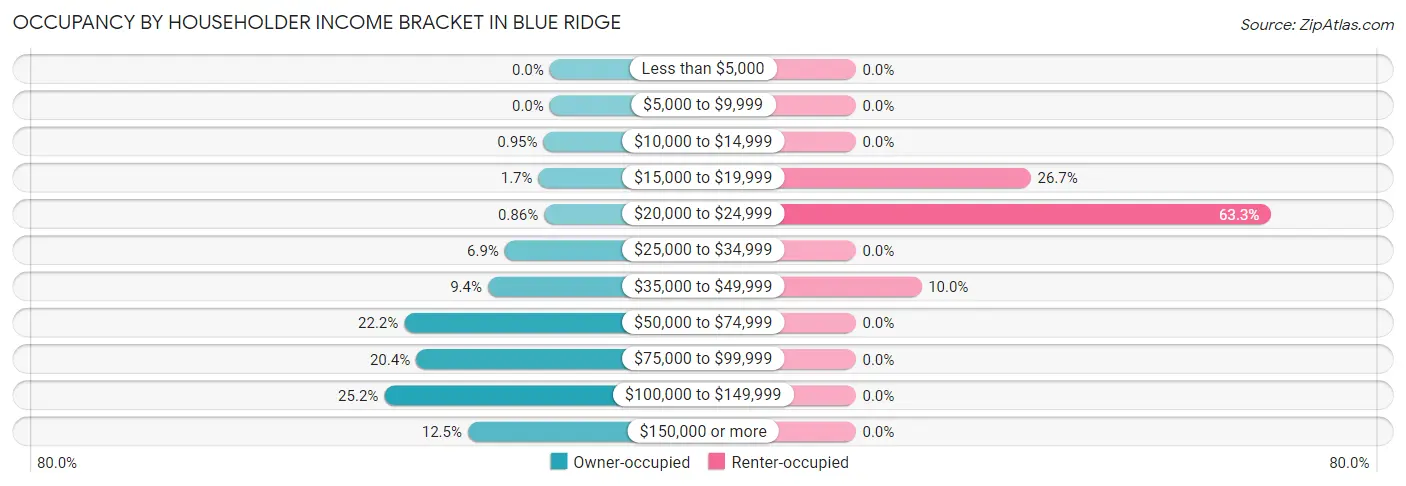
| Income Bracket | Owner-occupied | Renter-occupied |
| Less than $5,000 | 0 (0.0%) | 0 (0.0%) |
| $5,000 to $9,999 | 0 (0.0%) | 0 (0.0%) |
| $10,000 to $14,999 | 10 (0.9%) | 0 (0.0%) |
| $15,000 to $19,999 | 18 (1.7%) | 16 (26.7%) |
| $20,000 to $24,999 | 9 (0.9%) | 38 (63.3%) |
| $25,000 to $34,999 | 72 (6.9%) | 0 (0.0%) |
| $35,000 to $49,999 | 99 (9.4%) | 6 (10.0%) |
| $50,000 to $74,999 | 233 (22.2%) | 0 (0.0%) |
| $75,000 to $99,999 | 214 (20.4%) | 0 (0.0%) |
| $100,000 to $149,999 | 265 (25.2%) | 0 (0.0%) |
| $150,000 or more | 131 (12.5%) | 0 (0.0%) |
| Total | 1,051 (100.0%) | 60 (100.0%) |
Monthly Housing Cost Tiers in Blue Ridge
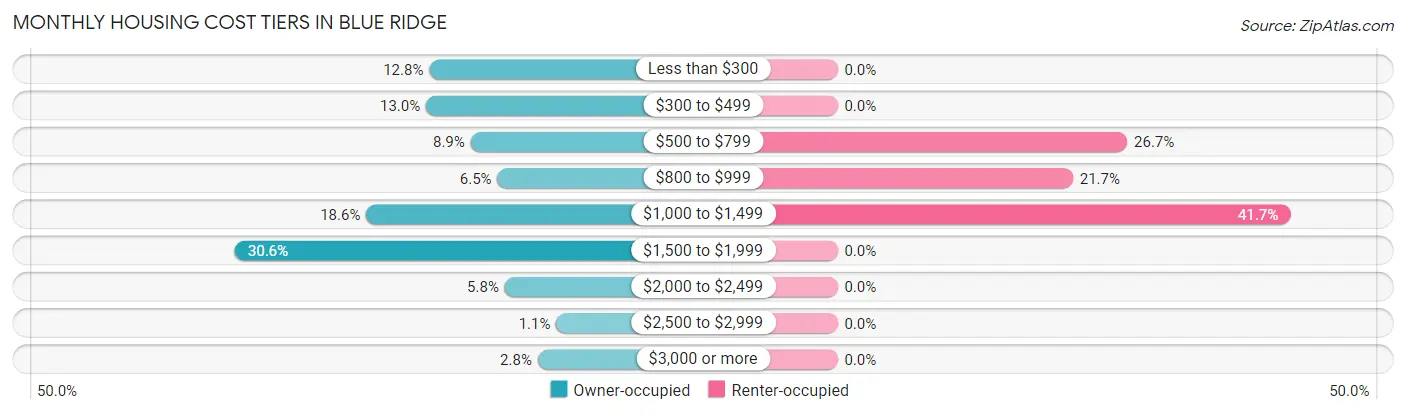
| Monthly Cost | Owner-occupied | Renter-occupied |
| Less than $300 | 134 (12.8%) | 0 (0.0%) |
| $300 to $499 | 137 (13.0%) | 0 (0.0%) |
| $500 to $799 | 94 (8.9%) | 16 (26.7%) |
| $800 to $999 | 68 (6.5%) | 13 (21.7%) |
| $1,000 to $1,499 | 195 (18.5%) | 25 (41.7%) |
| $1,500 to $1,999 | 322 (30.6%) | 0 (0.0%) |
| $2,000 to $2,499 | 61 (5.8%) | 0 (0.0%) |
| $2,500 to $2,999 | 11 (1.1%) | 0 (0.0%) |
| $3,000 or more | 29 (2.8%) | 0 (0.0%) |
| Total | 1,051 (100.0%) | 60 (100.0%) |
Physical Housing Characteristics in Blue Ridge
Housing Structures in Blue Ridge
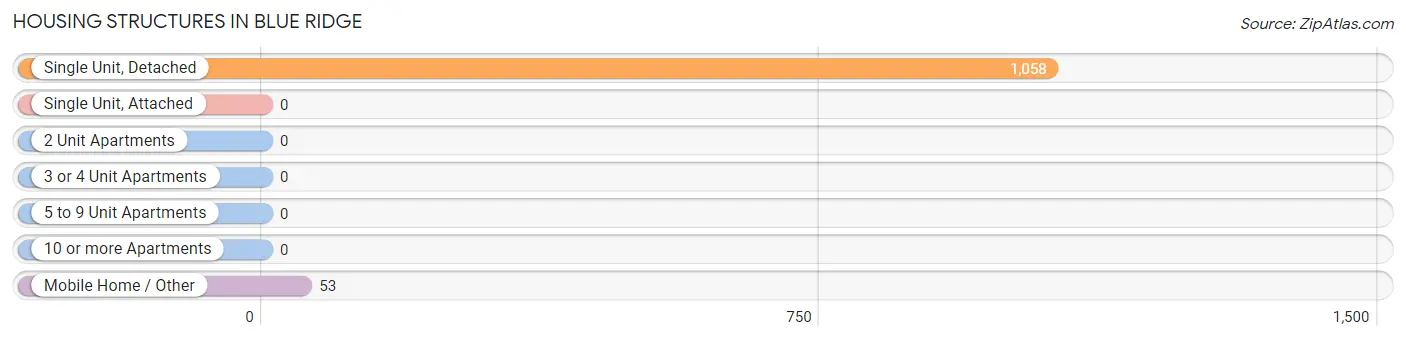
| Structure Type | # Housing Units | % Housing Units |
| Single Unit, Detached | 1,058 | 95.2% |
| Single Unit, Attached | 0 | 0.0% |
| 2 Unit Apartments | 0 | 0.0% |
| 3 or 4 Unit Apartments | 0 | 0.0% |
| 5 to 9 Unit Apartments | 0 | 0.0% |
| 10 or more Apartments | 0 | 0.0% |
| Mobile Home / Other | 53 | 4.8% |
| Total | 1,111 | 100.0% |
Housing Structures by Occupancy in Blue Ridge
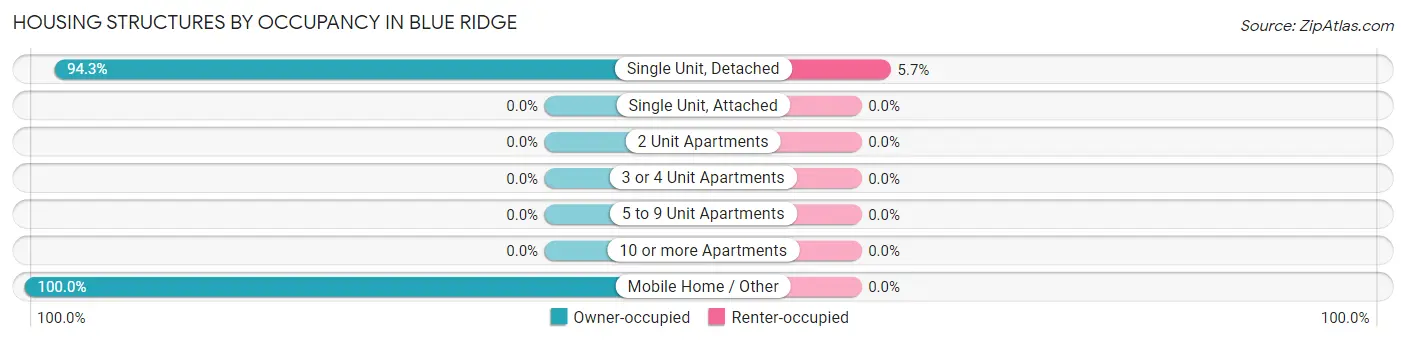
| Structure Type | Owner-occupied | Renter-occupied |
| Single Unit, Detached | 998 (94.3%) | 60 (5.7%) |
| Single Unit, Attached | 0 (0.0%) | 0 (0.0%) |
| 2 Unit Apartments | 0 (0.0%) | 0 (0.0%) |
| 3 or 4 Unit Apartments | 0 (0.0%) | 0 (0.0%) |
| 5 to 9 Unit Apartments | 0 (0.0%) | 0 (0.0%) |
| 10 or more Apartments | 0 (0.0%) | 0 (0.0%) |
| Mobile Home / Other | 53 (100.0%) | 0 (0.0%) |
| Total | 1,051 (94.6%) | 60 (5.4%) |
Housing Structures by Number of Rooms in Blue Ridge
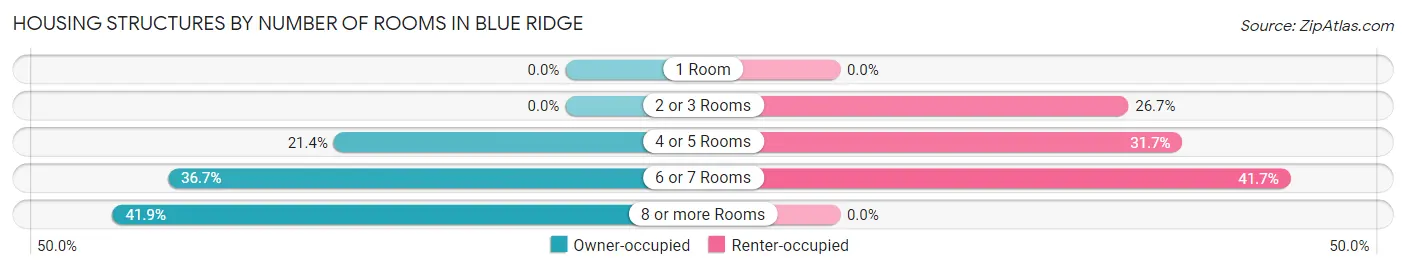
| Number of Rooms | Owner-occupied | Renter-occupied |
| 1 Room | 0 (0.0%) | 0 (0.0%) |
| 2 or 3 Rooms | 0 (0.0%) | 16 (26.7%) |
| 4 or 5 Rooms | 225 (21.4%) | 19 (31.7%) |
| 6 or 7 Rooms | 386 (36.7%) | 25 (41.7%) |
| 8 or more Rooms | 440 (41.9%) | 0 (0.0%) |
| Total | 1,051 (100.0%) | 60 (100.0%) |
Housing Structure by Heating Type in Blue Ridge
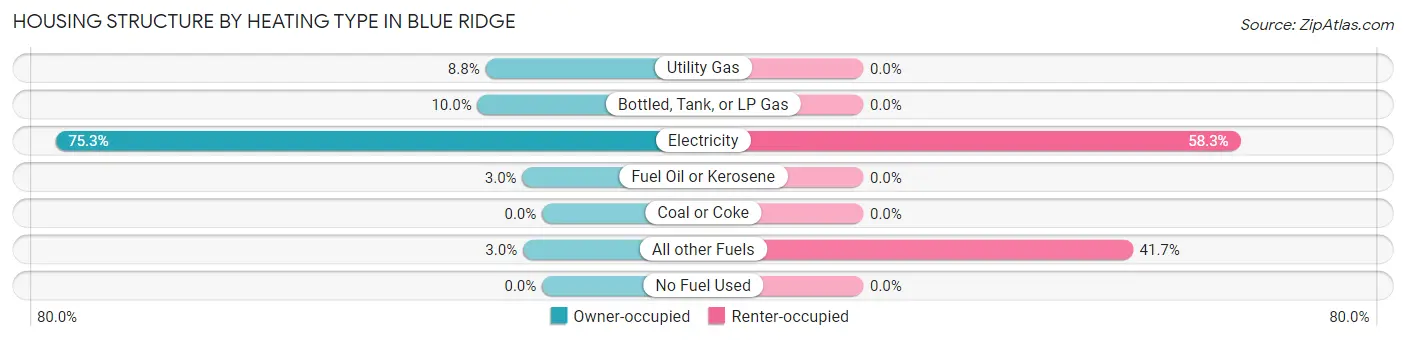
| Heating Type | Owner-occupied | Renter-occupied |
| Utility Gas | 92 (8.7%) | 0 (0.0%) |
| Bottled, Tank, or LP Gas | 105 (10.0%) | 0 (0.0%) |
| Electricity | 791 (75.3%) | 35 (58.3%) |
| Fuel Oil or Kerosene | 32 (3.0%) | 0 (0.0%) |
| Coal or Coke | 0 (0.0%) | 0 (0.0%) |
| All other Fuels | 31 (2.9%) | 25 (41.7%) |
| No Fuel Used | 0 (0.0%) | 0 (0.0%) |
| Total | 1,051 (100.0%) | 60 (100.0%) |
Household Vehicle Usage in Blue Ridge
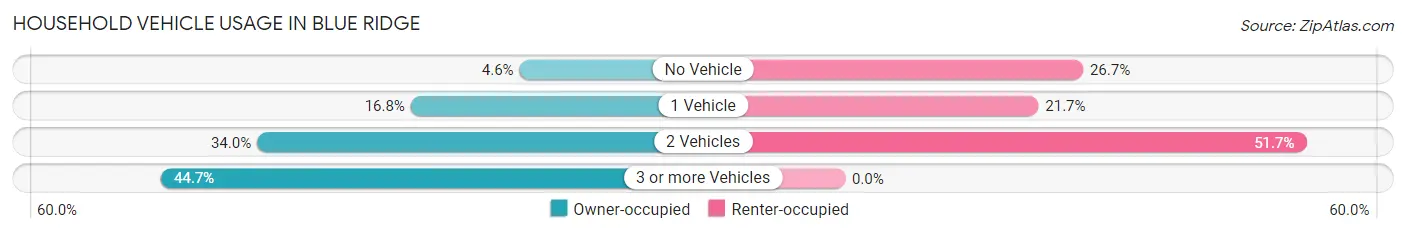
| Vehicles per Household | Owner-occupied | Renter-occupied |
| No Vehicle | 48 (4.6%) | 16 (26.7%) |
| 1 Vehicle | 176 (16.8%) | 13 (21.7%) |
| 2 Vehicles | 357 (34.0%) | 31 (51.7%) |
| 3 or more Vehicles | 470 (44.7%) | 0 (0.0%) |
| Total | 1,051 (100.0%) | 60 (100.0%) |
Real Estate & Mortgages in Blue Ridge
Real Estate and Mortgage Overview in Blue Ridge
| Characteristic | Without Mortgage | With Mortgage |
| Housing Units | 376 | 675 |
| Median Property Value | $214,600 | $247,500 |
| Median Household Income | $57,857 | $98 |
| Monthly Housing Costs | $368 | $29 |
| Real Estate Taxes | $1,489 | $12 |
Property Value by Mortgage Status in Blue Ridge
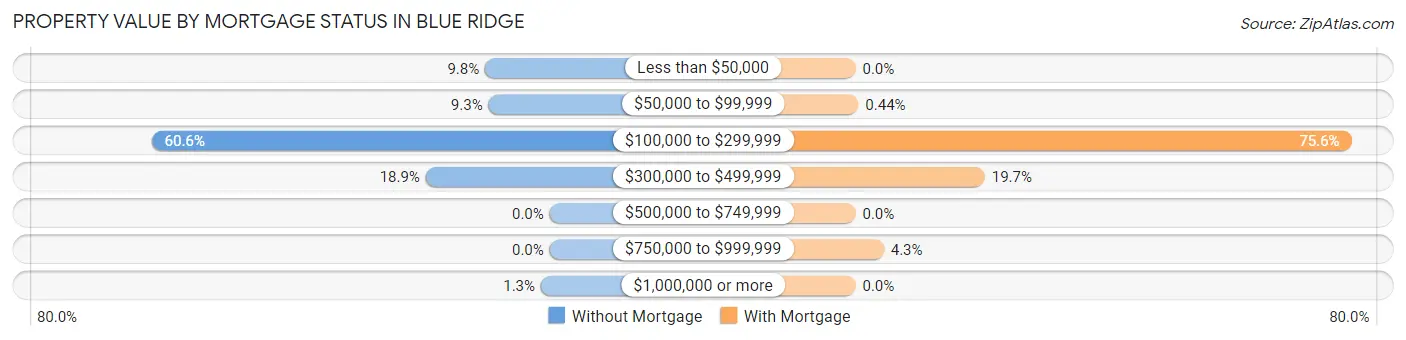
| Property Value | Without Mortgage | With Mortgage |
| Less than $50,000 | 37 (9.8%) | 0 (0.0%) |
| $50,000 to $99,999 | 35 (9.3%) | 3 (0.4%) |
| $100,000 to $299,999 | 228 (60.6%) | 510 (75.6%) |
| $300,000 to $499,999 | 71 (18.9%) | 133 (19.7%) |
| $500,000 to $749,999 | 0 (0.0%) | 0 (0.0%) |
| $750,000 to $999,999 | 0 (0.0%) | 29 (4.3%) |
| $1,000,000 or more | 5 (1.3%) | 0 (0.0%) |
| Total | 376 (100.0%) | 675 (100.0%) |
Household Income by Mortgage Status in Blue Ridge
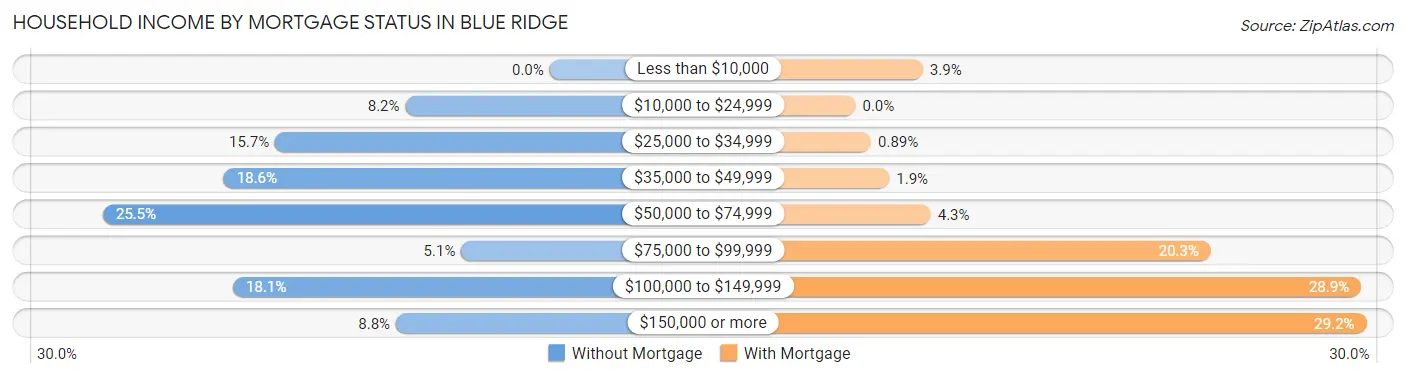
| Household Income | Without Mortgage | With Mortgage |
| Less than $10,000 | 0 (0.0%) | 26 (3.8%) |
| $10,000 to $24,999 | 31 (8.2%) | 0 (0.0%) |
| $25,000 to $34,999 | 59 (15.7%) | 6 (0.9%) |
| $35,000 to $49,999 | 70 (18.6%) | 13 (1.9%) |
| $50,000 to $74,999 | 96 (25.5%) | 29 (4.3%) |
| $75,000 to $99,999 | 19 (5.1%) | 137 (20.3%) |
| $100,000 to $149,999 | 68 (18.1%) | 195 (28.9%) |
| $150,000 or more | 33 (8.8%) | 197 (29.2%) |
| Total | 376 (100.0%) | 675 (100.0%) |
Property Value to Household Income Ratio in Blue Ridge
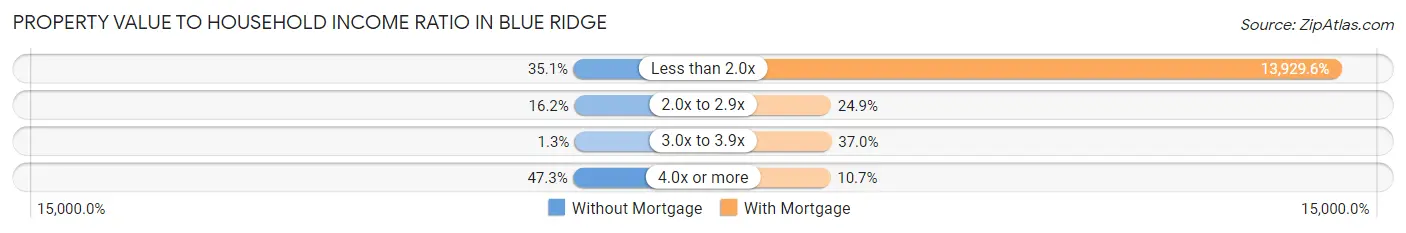
| Value-to-Income Ratio | Without Mortgage | With Mortgage |
| Less than 2.0x | 132 (35.1%) | 94,025 (13,929.6%) |
| 2.0x to 2.9x | 61 (16.2%) | 168 (24.9%) |
| 3.0x to 3.9x | 5 (1.3%) | 250 (37.0%) |
| 4.0x or more | 178 (47.3%) | 72 (10.7%) |
| Total | 376 (100.0%) | 675 (100.0%) |
Real Estate Taxes by Mortgage Status in Blue Ridge
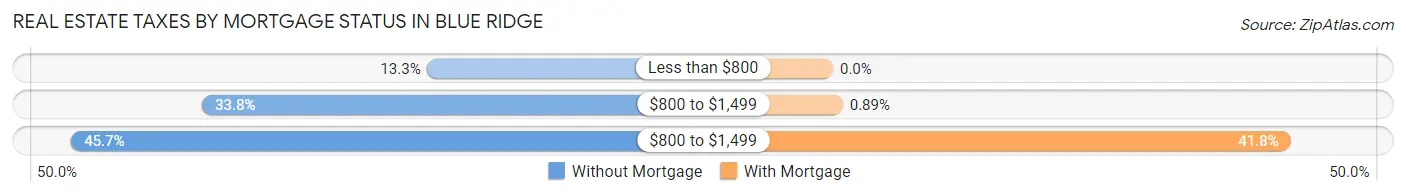
| Property Taxes | Without Mortgage | With Mortgage |
| Less than $800 | 50 (13.3%) | 0 (0.0%) |
| $800 to $1,499 | 127 (33.8%) | 6 (0.9%) |
| $800 to $1,499 | 172 (45.7%) | 282 (41.8%) |
| Total | 376 (100.0%) | 675 (100.0%) |
Health & Disability in Blue Ridge
Health Insurance Coverage by Age in Blue Ridge
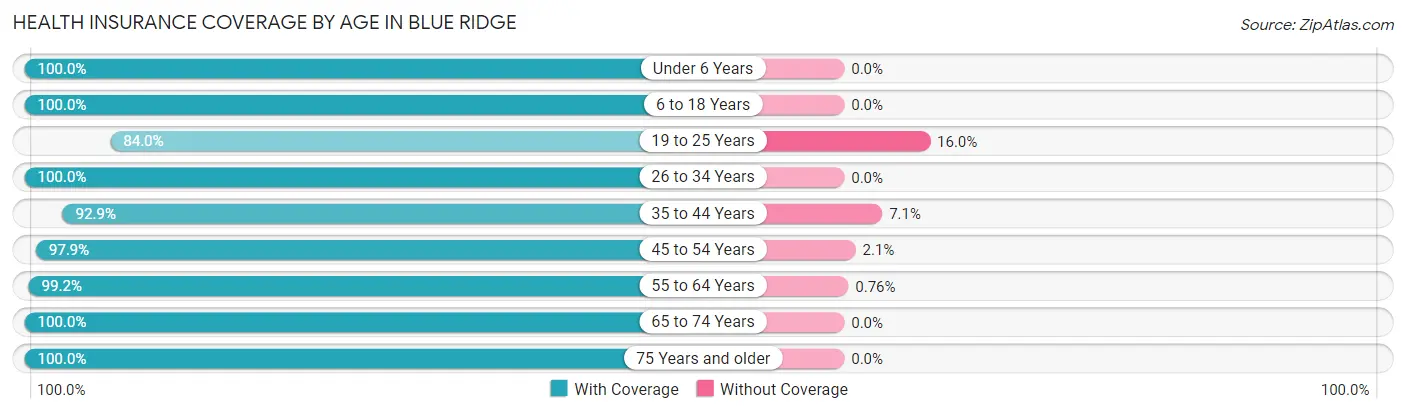
| Age Bracket | With Coverage | Without Coverage |
| Under 6 Years | 138 (100.0%) | 0 (0.0%) |
| 6 to 18 Years | 658 (100.0%) | 0 (0.0%) |
| 19 to 25 Years | 126 (84.0%) | 24 (16.0%) |
| 26 to 34 Years | 289 (100.0%) | 0 (0.0%) |
| 35 to 44 Years | 315 (92.9%) | 24 (7.1%) |
| 45 to 54 Years | 279 (97.9%) | 6 (2.1%) |
| 55 to 64 Years | 652 (99.2%) | 5 (0.8%) |
| 65 to 74 Years | 298 (100.0%) | 0 (0.0%) |
| 75 Years and older | 180 (100.0%) | 0 (0.0%) |
| Total | 2,935 (98.0%) | 59 (2.0%) |
Health Insurance Coverage by Citizenship Status in Blue Ridge
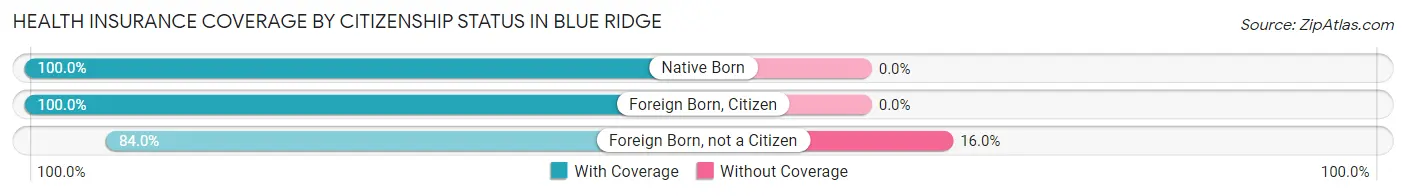
| Citizenship Status | With Coverage | Without Coverage |
| Native Born | 138 (100.0%) | 0 (0.0%) |
| Foreign Born, Citizen | 658 (100.0%) | 0 (0.0%) |
| Foreign Born, not a Citizen | 126 (84.0%) | 24 (16.0%) |
Health Insurance Coverage by Household Income in Blue Ridge
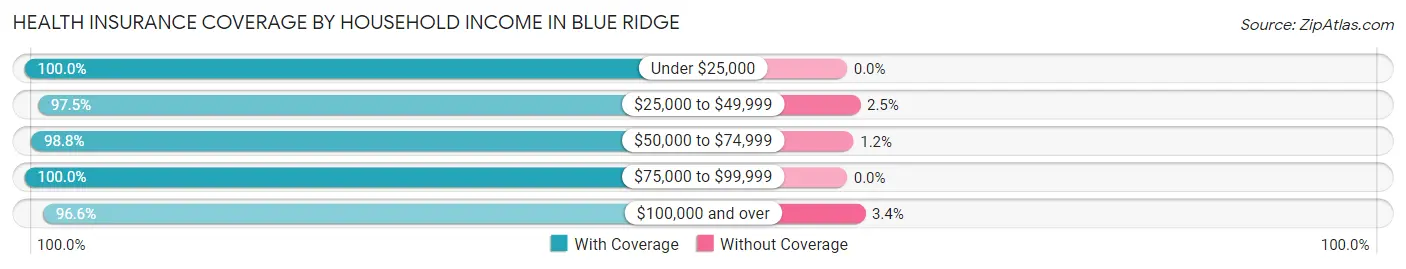
| Household Income | With Coverage | Without Coverage |
| Under $25,000 | 215 (100.0%) | 0 (0.0%) |
| $25,000 to $49,999 | 472 (97.5%) | 12 (2.5%) |
| $50,000 to $74,999 | 404 (98.8%) | 5 (1.2%) |
| $75,000 to $99,999 | 656 (100.0%) | 0 (0.0%) |
| $100,000 and over | 1,188 (96.6%) | 42 (3.4%) |
Public vs Private Health Insurance Coverage by Age in Blue Ridge
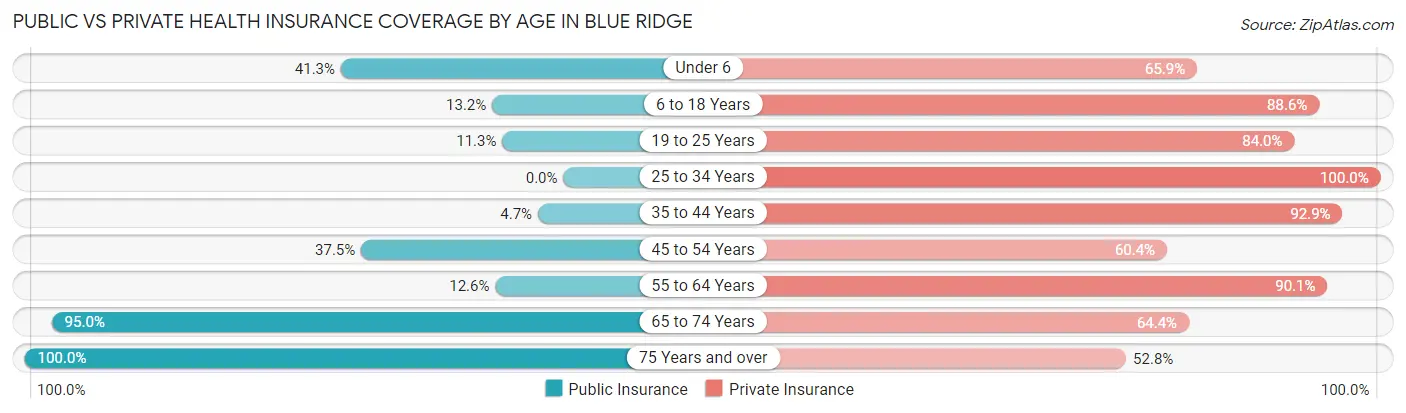
| Age Bracket | Public Insurance | Private Insurance |
| Under 6 | 57 (41.3%) | 91 (65.9%) |
| 6 to 18 Years | 87 (13.2%) | 583 (88.6%) |
| 19 to 25 Years | 17 (11.3%) | 126 (84.0%) |
| 25 to 34 Years | 0 (0.0%) | 289 (100.0%) |
| 35 to 44 Years | 16 (4.7%) | 315 (92.9%) |
| 45 to 54 Years | 107 (37.5%) | 172 (60.4%) |
| 55 to 64 Years | 83 (12.6%) | 592 (90.1%) |
| 65 to 74 Years | 283 (95.0%) | 192 (64.4%) |
| 75 Years and over | 180 (100.0%) | 95 (52.8%) |
| Total | 830 (27.7%) | 2,455 (82.0%) |
Disability Status by Sex by Age in Blue Ridge
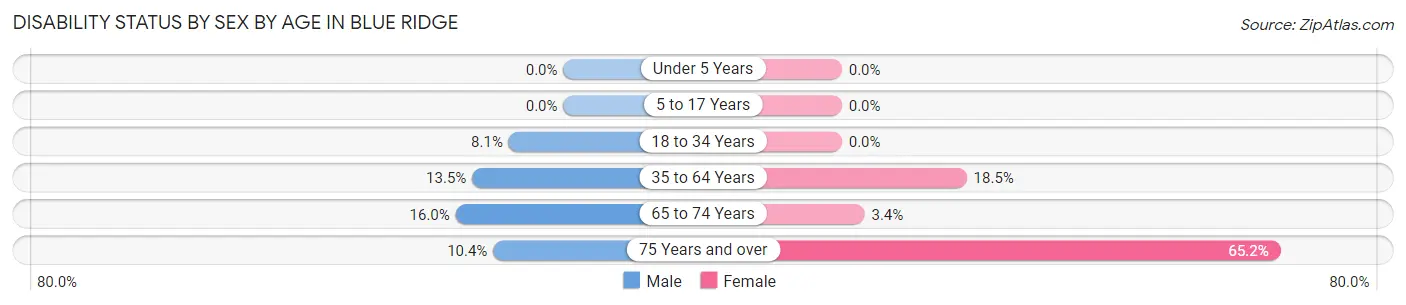
| Age Bracket | Male | Female |
| Under 5 Years | 0 (0.0%) | 0 (0.0%) |
| 5 to 17 Years | 0 (0.0%) | 0 (0.0%) |
| 18 to 34 Years | 18 (8.1%) | 0 (0.0%) |
| 35 to 64 Years | 88 (13.5%) | 117 (18.5%) |
| 65 to 74 Years | 24 (16.0%) | 5 (3.4%) |
| 75 Years and over | 5 (10.4%) | 86 (65.1%) |
Disability Class by Sex by Age in Blue Ridge
Disability Class: Hearing Difficulty
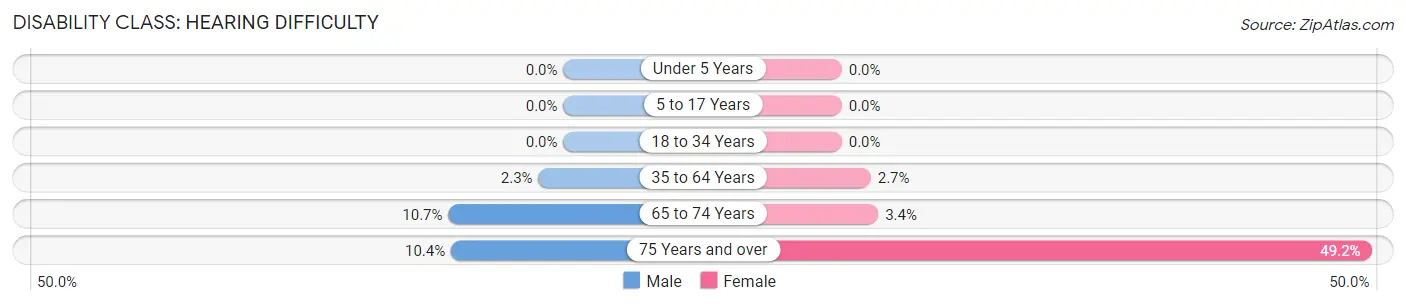
| Age Bracket | Male | Female |
| Under 5 Years | 0 (0.0%) | 0 (0.0%) |
| 5 to 17 Years | 0 (0.0%) | 0 (0.0%) |
| 18 to 34 Years | 0 (0.0%) | 0 (0.0%) |
| 35 to 64 Years | 15 (2.3%) | 17 (2.7%) |
| 65 to 74 Years | 16 (10.7%) | 5 (3.4%) |
| 75 Years and over | 5 (10.4%) | 65 (49.2%) |
Disability Class: Vision Difficulty
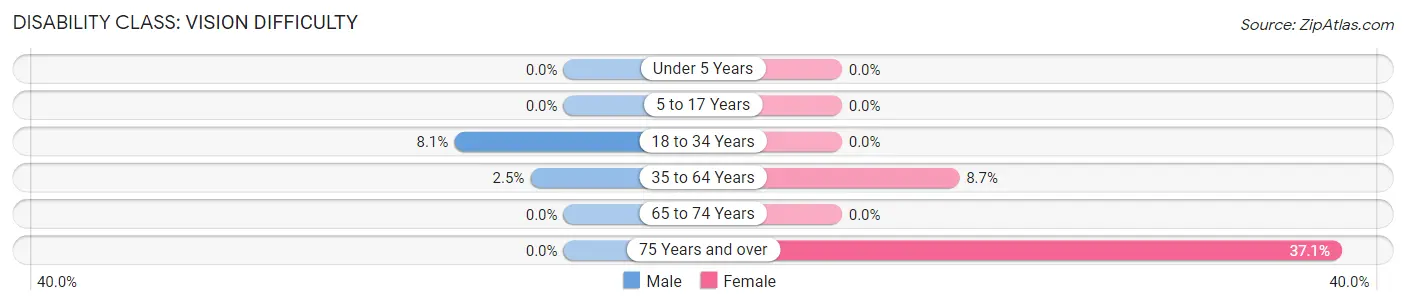
| Age Bracket | Male | Female |
| Under 5 Years | 0 (0.0%) | 0 (0.0%) |
| 5 to 17 Years | 0 (0.0%) | 0 (0.0%) |
| 18 to 34 Years | 18 (8.1%) | 0 (0.0%) |
| 35 to 64 Years | 16 (2.5%) | 55 (8.7%) |
| 65 to 74 Years | 0 (0.0%) | 0 (0.0%) |
| 75 Years and over | 0 (0.0%) | 49 (37.1%) |
Disability Class: Cognitive Difficulty
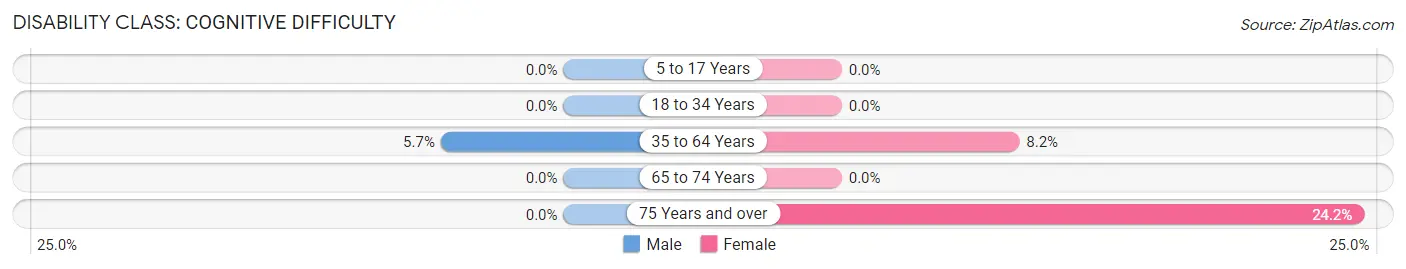
| Age Bracket | Male | Female |
| 5 to 17 Years | 0 (0.0%) | 0 (0.0%) |
| 18 to 34 Years | 0 (0.0%) | 0 (0.0%) |
| 35 to 64 Years | 37 (5.7%) | 52 (8.2%) |
| 65 to 74 Years | 0 (0.0%) | 0 (0.0%) |
| 75 Years and over | 0 (0.0%) | 32 (24.2%) |
Disability Class: Ambulatory Difficulty
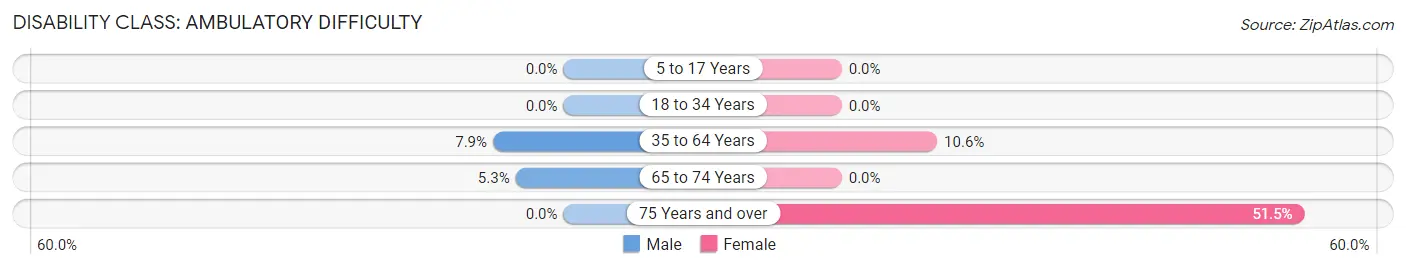
| Age Bracket | Male | Female |
| 5 to 17 Years | 0 (0.0%) | 0 (0.0%) |
| 18 to 34 Years | 0 (0.0%) | 0 (0.0%) |
| 35 to 64 Years | 51 (7.9%) | 67 (10.6%) |
| 65 to 74 Years | 8 (5.3%) | 0 (0.0%) |
| 75 Years and over | 0 (0.0%) | 68 (51.5%) |
Disability Class: Self-Care Difficulty
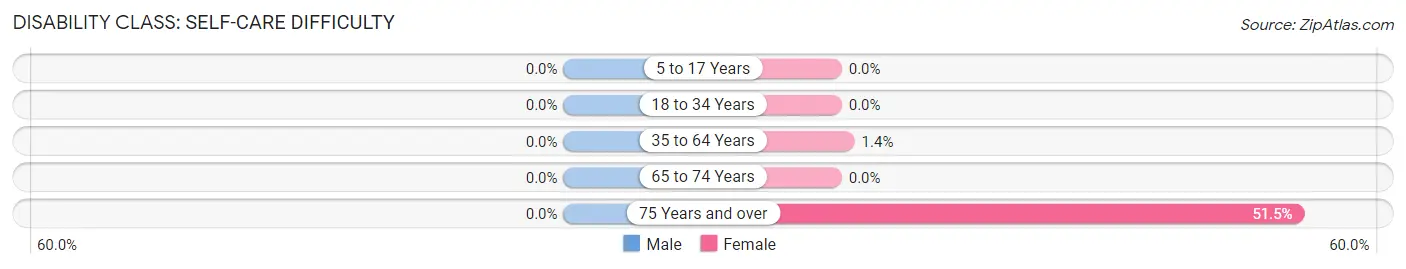
| Age Bracket | Male | Female |
| 5 to 17 Years | 0 (0.0%) | 0 (0.0%) |
| 18 to 34 Years | 0 (0.0%) | 0 (0.0%) |
| 35 to 64 Years | 0 (0.0%) | 9 (1.4%) |
| 65 to 74 Years | 0 (0.0%) | 0 (0.0%) |
| 75 Years and over | 0 (0.0%) | 68 (51.5%) |
Technology Access in Blue Ridge
Computing Device Access in Blue Ridge
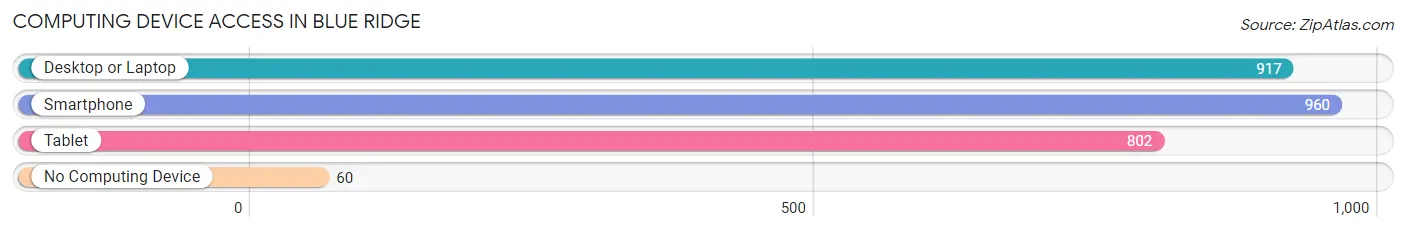
| Device Type | # Households | % Households |
| Desktop or Laptop | 917 | 82.5% |
| Smartphone | 960 | 86.4% |
| Tablet | 802 | 72.2% |
| No Computing Device | 60 | 5.4% |
| Total | 1,111 | 100.0% |
Internet Access in Blue Ridge
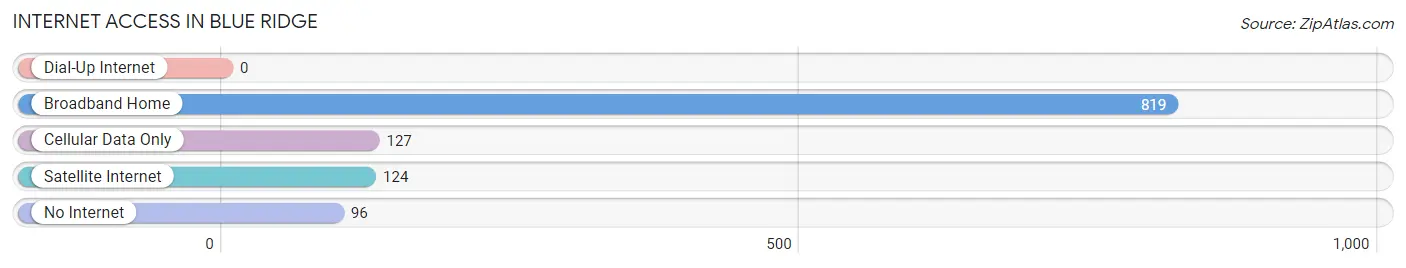
| Internet Type | # Households | % Households |
| Dial-Up Internet | 0 | 0.0% |
| Broadband Home | 819 | 73.7% |
| Cellular Data Only | 127 | 11.4% |
| Satellite Internet | 124 | 11.2% |
| No Internet | 96 | 8.6% |
| Total | 1,111 | 100.0% |
Blue Ridge Summary
Blue Ridge, Virginia is a small town located in the Blue Ridge Mountains of Virginia. It is situated in the Shenandoah Valley, and is part of the larger Roanoke Metropolitan Statistical Area. The town has a population of approximately 1,500 people, and is known for its scenic beauty and outdoor recreation opportunities.
History
Blue Ridge was first settled in the late 1700s by settlers from Pennsylvania and Virginia. The town was originally known as “Blue Ridge Station”, and was a stop on the stagecoach line that ran between Staunton and Lynchburg. The town was officially incorporated in 1891, and was named after the nearby Blue Ridge Mountains.
In the early 1900s, the town was a popular tourist destination, and was home to several resorts and hotels. The town was also home to a number of small businesses, including a general store, a blacksmith shop, and a sawmill.
Geography
Blue Ridge is located in the Blue Ridge Mountains of Virginia, in the Shenandoah Valley. The town is situated at an elevation of 1,400 feet, and is surrounded by the George Washington National Forest. The town is located approximately 30 miles from Roanoke, and is accessible via Interstate 81.
The town is located in a rural area, and is surrounded by rolling hills and forests. The town is also home to several small lakes, including Lake Moomaw and Lake Monocan.
Economy
The economy of Blue Ridge is largely based on tourism and outdoor recreation. The town is home to several resorts and hotels, as well as a number of restaurants and shops. The town is also home to a number of small businesses, including a general store, a blacksmith shop, and a sawmill.
The town is also home to a number of outdoor recreation opportunities, including hiking, camping, fishing, and hunting. The town is also home to a number of wineries, and is a popular destination for wine tasting.
Demographics
As of the 2010 census, the population of Blue Ridge was 1,500 people. The racial makeup of the town was 95.3% White, 1.3% African American, 0.7% Native American, 0.3% Asian, and 2.3% from other races. The median household income was $37,500, and the median age was 44.
Blue Ridge is a small town with a rich history and a vibrant economy. The town is home to a number of outdoor recreation opportunities, and is a popular destination for tourists and outdoor enthusiasts. The town is also home to a number of small businesses, and is a great place to live and work.
Common Questions
What is Per Capita Income in Blue Ridge?
Per Capita income in Blue Ridge is $34,450.
What is the Median Family Income in Blue Ridge?
Median Family Income in Blue Ridge is $90,000.
What is the Median Household income in Blue Ridge?
Median Household Income in Blue Ridge is $84,766.
What is Income or Wage Gap in Blue Ridge?
Income or Wage Gap in Blue Ridge is 16.0%.
Women in Blue Ridge earn 84.0 cents for every dollar earned by a man.
What is Inequality or Gini Index in Blue Ridge?
Inequality or Gini Index in Blue Ridge is 0.33.
What is the Total Population of Blue Ridge?
Total Population of Blue Ridge is 2,994.
What is the Total Male Population of Blue Ridge?
Total Male Population of Blue Ridge is 1,363.
What is the Total Female Population of Blue Ridge?
Total Female Population of Blue Ridge is 1,631.
What is the Ratio of Males per 100 Females in Blue Ridge?
There are 83.57 Males per 100 Females in Blue Ridge.
What is the Ratio of Females per 100 Males in Blue Ridge?
There are 119.66 Females per 100 Males in Blue Ridge.
What is the Median Population Age in Blue Ridge?
Median Population Age in Blue Ridge is 42.6 Years.
What is the Average Family Size in Blue Ridge
Average Family Size in Blue Ridge is 3.1 People.
What is the Average Household Size in Blue Ridge
Average Household Size in Blue Ridge is 2.7 People.
How Large is the Labor Force in Blue Ridge?
There are 1,554 People in the Labor Forcein in Blue Ridge.
What is the Percentage of People in the Labor Force in Blue Ridge?
64.4% of People are in the Labor Force in Blue Ridge.
What is the Unemployment Rate in Blue Ridge?
Unemployment Rate in Blue Ridge is 4.5%.