Cities with the Highest Percentage of Swedish Population in Virginia
RELATED REPORTS & OPTIONS
Swedish
Virginia
Compare Cities
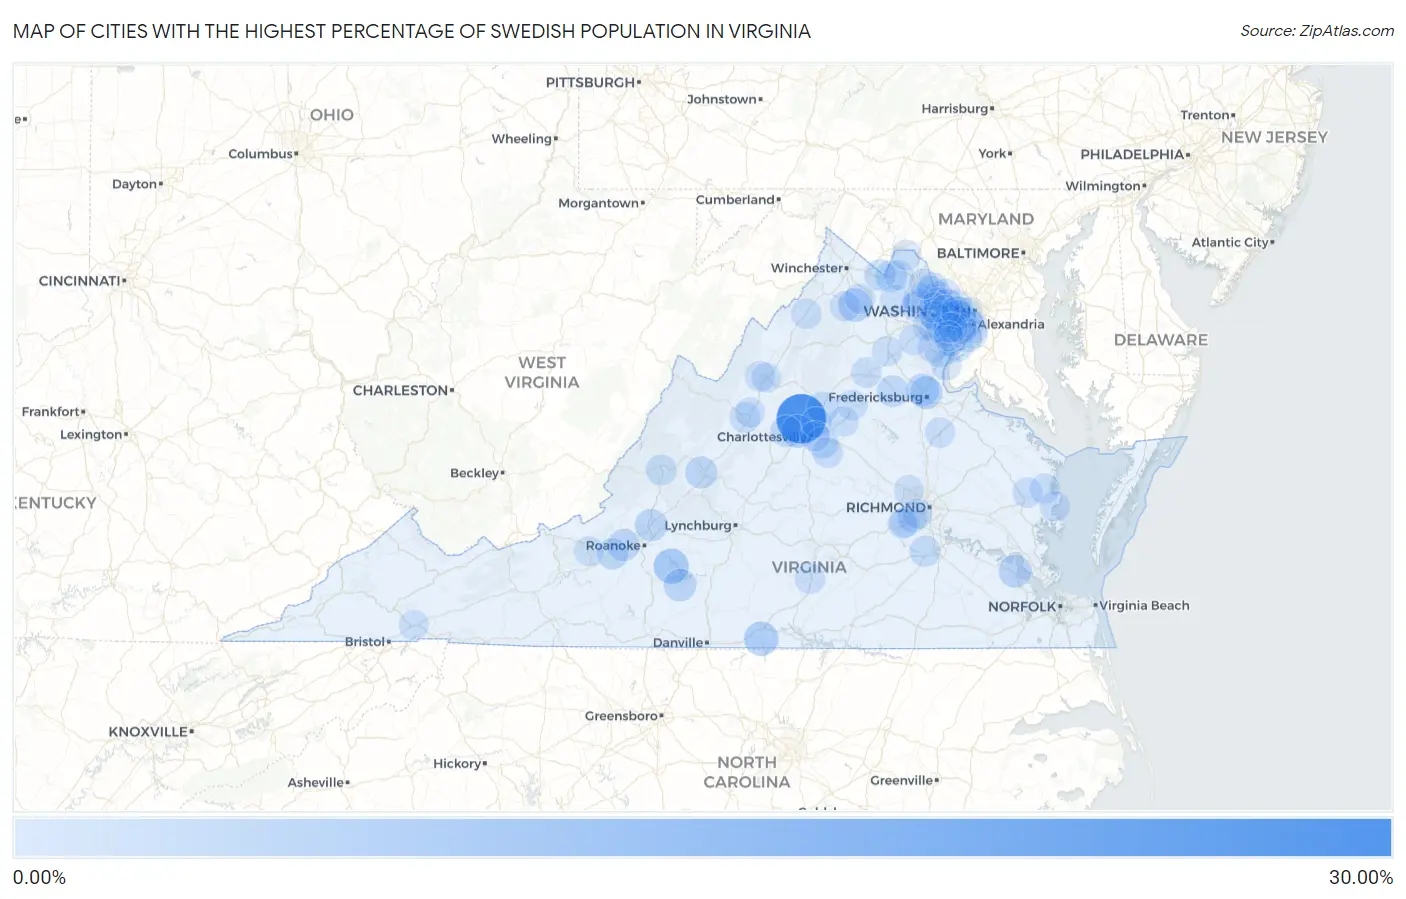
Map of Cities with the Highest Percentage of Swedish Population in Virginia
0.00%
30.00%
Cities with the Highest Percentage of Swedish Population in Virginia
| City | Swedish | vs State | vs National | |
| 1. | Free Union | 25.95% | 0.62%(+25.3)#1 | 1.05%(+24.9)#97 |
| 2. | Westlake Corner | 7.05% | 0.62%(+6.43)#2 | 1.05%(+6.00)#1,196 |
| 3. | Cluster Springs | 5.98% | 0.62%(+5.36)#3 | 1.05%(+4.93)#1,556 |
| 4. | Skyland Estates | 4.80% | 0.62%(+4.18)#4 | 1.05%(+3.76)#2,115 |
| 5. | Ivy | 4.40% | 0.62%(+3.78)#5 | 1.05%(+3.35)#2,372 |
| 6. | Rushmere | 4.13% | 0.62%(+3.51)#6 | 1.05%(+3.08)#2,563 |
| 7. | Rio | 4.02% | 0.62%(+3.40)#7 | 1.05%(+2.98)#2,632 |
| 8. | Southern Gateway | 4.00% | 0.62%(+3.38)#8 | 1.05%(+2.95)#2,657 |
| 9. | Falmouth | 3.99% | 0.62%(+3.37)#9 | 1.05%(+2.94)#2,669 |
| 10. | Penhook | 3.96% | 0.62%(+3.34)#10 | 1.05%(+2.91)#2,695 |
| 11. | Troutville | 3.64% | 0.62%(+3.02)#11 | 1.05%(+2.59)#3,013 |
| 12. | Lexington | 3.48% | 0.62%(+2.87)#12 | 1.05%(+2.44)#3,181 |
| 13. | Fairfax Station | 3.36% | 0.62%(+2.74)#13 | 1.05%(+2.32)#3,331 |
| 14. | Glenvar | 3.33% | 0.62%(+2.71)#14 | 1.05%(+2.28)#3,372 |
| 15. | Crozet | 2.96% | 0.62%(+2.34)#15 | 1.05%(+1.91)#3,877 |
| 16. | Lake Of The Woods | 2.84% | 0.62%(+2.22)#16 | 1.05%(+1.79)#4,067 |
| 17. | Ruckersville | 2.75% | 0.62%(+2.13)#17 | 1.05%(+1.70)#4,212 |
| 18. | Rivanna | 2.73% | 0.62%(+2.11)#18 | 1.05%(+1.68)#4,236 |
| 19. | Mantua | 2.71% | 0.62%(+2.09)#19 | 1.05%(+1.66)#4,270 |
| 20. | Round Hill | 2.69% | 0.62%(+2.07)#20 | 1.05%(+1.65)#4,295 |
| 21. | Shenandoah Retreat | 2.57% | 0.62%(+1.95)#21 | 1.05%(+1.52)#4,513 |
| 22. | Elliston | 2.47% | 0.62%(+1.85)#22 | 1.05%(+1.42)#4,724 |
| 23. | Matoaca | 2.32% | 0.62%(+1.70)#23 | 1.05%(+1.27)#5,019 |
| 24. | Mason Neck | 2.17% | 0.62%(+1.55)#24 | 1.05%(+1.13)#5,346 |
| 25. | Falls Church | 2.06% | 0.62%(+1.44)#25 | 1.05%(+1.01)#5,610 |
| 26. | Staunton | 1.90% | 0.62%(+1.28)#26 | 1.05%(+0.851)#6,099 |
| 27. | Kings Park West | 1.89% | 0.62%(+1.27)#27 | 1.05%(+0.845)#6,116 |
| 28. | Belle Haven | 1.87% | 0.62%(+1.25)#28 | 1.05%(+0.823)#6,196 |
| 29. | Iron Gate | 1.76% | 0.62%(+1.14)#29 | 1.05%(+0.715)#6,509 |
| 30. | Brambleton | 1.76% | 0.62%(+1.14)#30 | 1.05%(+0.711)#6,522 |
| 31. | Lake Monticello | 1.70% | 0.62%(+1.08)#31 | 1.05%(+0.650)#6,697 |
| 32. | Hollymead | 1.69% | 0.62%(+1.07)#32 | 1.05%(+0.645)#6,717 |
| 33. | Earlysville | 1.52% | 0.62%(+0.903)#33 | 1.05%(+0.474)#7,311 |
| 34. | Belmont Estates | 1.51% | 0.62%(+0.890)#34 | 1.05%(+0.462)#7,367 |
| 35. | Lake Barcroft | 1.49% | 0.62%(+0.872)#35 | 1.05%(+0.443)#7,441 |
| 36. | Midlothian | 1.49% | 0.62%(+0.871)#36 | 1.05%(+0.442)#7,444 |
| 37. | Mclean | 1.49% | 0.62%(+0.870)#37 | 1.05%(+0.442)#7,445 |
| 38. | Stone Ridge | 1.41% | 0.62%(+0.788)#38 | 1.05%(+0.360)#7,751 |
| 39. | Dranesville | 1.41% | 0.62%(+0.787)#39 | 1.05%(+0.359)#7,759 |
| 40. | Arcola | 1.40% | 0.62%(+0.775)#40 | 1.05%(+0.347)#7,826 |
| 41. | Countryside | 1.39% | 0.62%(+0.769)#41 | 1.05%(+0.341)#7,846 |
| 42. | Woodburn | 1.39% | 0.62%(+0.766)#42 | 1.05%(+0.337)#7,868 |
| 43. | Pantops | 1.38% | 0.62%(+0.765)#43 | 1.05%(+0.336)#7,873 |
| 44. | Great Falls Crossing | 1.37% | 0.62%(+0.748)#44 | 1.05%(+0.320)#7,943 |
| 45. | One Loudoun | 1.37% | 0.62%(+0.748)#45 | 1.05%(+0.319)#7,946 |
| 46. | Orange | 1.36% | 0.62%(+0.742)#46 | 1.05%(+0.314)#7,972 |
| 47. | Culpeper | 1.33% | 0.62%(+0.713)#47 | 1.05%(+0.285)#8,102 |
| 48. | Woodstock | 1.33% | 0.62%(+0.708)#48 | 1.05%(+0.280)#8,120 |
| 49. | Rockwood | 1.32% | 0.62%(+0.705)#49 | 1.05%(+0.277)#8,139 |
| 50. | Greenbriar | 1.32% | 0.62%(+0.702)#50 | 1.05%(+0.273)#8,153 |
| 51. | Independent Hill | 1.32% | 0.62%(+0.699)#51 | 1.05%(+0.270)#8,166 |
| 52. | Keysville | 1.32% | 0.62%(+0.696)#52 | 1.05%(+0.267)#8,182 |
| 53. | Arlington | 1.30% | 0.62%(+0.676)#53 | 1.05%(+0.247)#8,276 |
| 54. | Quantico | 1.29% | 0.62%(+0.669)#54 | 1.05%(+0.241)#8,305 |
| 55. | South Run | 1.28% | 0.62%(+0.663)#55 | 1.05%(+0.234)#8,339 |
| 56. | Merrifield | 1.26% | 0.62%(+0.645)#56 | 1.05%(+0.216)#8,425 |
| 57. | Deltaville | 1.24% | 0.62%(+0.616)#57 | 1.05%(+0.188)#8,540 |
| 58. | Occoquan | 1.21% | 0.62%(+0.593)#58 | 1.05%(+0.164)#8,645 |
| 59. | Dulles Town Center | 1.21% | 0.62%(+0.587)#59 | 1.05%(+0.158)#8,675 |
| 60. | Rose Hill Cdp Fairfax County | 1.20% | 0.62%(+0.578)#60 | 1.05%(+0.150)#8,716 |
| 61. | Opal | 1.19% | 0.62%(+0.571)#61 | 1.05%(+0.142)#8,743 |
| 62. | Great Falls | 1.19% | 0.62%(+0.569)#62 | 1.05%(+0.141)#8,748 |
| 63. | Wolf Trap | 1.18% | 0.62%(+0.558)#63 | 1.05%(+0.129)#8,804 |
| 64. | Bowling Green | 1.17% | 0.62%(+0.551)#64 | 1.05%(+0.122)#8,835 |
| 65. | Irvington | 1.16% | 0.62%(+0.536)#65 | 1.05%(+0.108)#8,899 |
| 66. | Reston | 1.15% | 0.62%(+0.527)#66 | 1.05%(+0.099)#8,952 |
| 67. | Urbanna | 1.14% | 0.62%(+0.524)#67 | 1.05%(+0.096)#8,968 |
| 68. | West Falls Church | 1.14% | 0.62%(+0.524)#68 | 1.05%(+0.096)#8,970 |
| 69. | Brandermill | 1.14% | 0.62%(+0.521)#69 | 1.05%(+0.093)#8,985 |
| 70. | Alexandria | 1.13% | 0.62%(+0.511)#70 | 1.05%(+0.082)#9,044 |
| 71. | Gordonsville | 1.13% | 0.62%(+0.511)#71 | 1.05%(+0.082)#9,045 |
| 72. | Front Royal | 1.12% | 0.62%(+0.502)#72 | 1.05%(+0.073)#9,091 |
| 73. | Shenandoah Farms | 1.12% | 0.62%(+0.501)#73 | 1.05%(+0.072)#9,095 |
| 74. | Clifton | 1.12% | 0.62%(+0.497)#74 | 1.05%(+0.069)#9,110 |
| 75. | Franconia | 1.12% | 0.62%(+0.497)#75 | 1.05%(+0.069)#9,114 |
| 76. | Fort Hunt | 1.11% | 0.62%(+0.492)#76 | 1.05%(+0.063)#9,135 |
| 77. | Middleburg | 1.09% | 0.62%(+0.469)#77 | 1.05%(+0.040)#9,264 |
| 78. | Lovettsville | 1.09% | 0.62%(+0.468)#78 | 1.05%(+0.039)#9,271 |
| 79. | Fair Lakes | 1.09% | 0.62%(+0.468)#79 | 1.05%(+0.039)#9,273 |
| 80. | Purcellville | 1.08% | 0.62%(+0.455)#80 | 1.05%(+0.027)#9,332 |
| 81. | Mount Vernon | 1.06% | 0.62%(+0.440)#81 | 1.05%(+0.012)#9,427 |
| 82. | Montclair | 1.06% | 0.62%(+0.440)#82 | 1.05%(+0.011)#9,429 |
| 83. | Franklin Farm | 1.05% | 0.62%(+0.433)#83 | 1.05%(+0.004)#9,465 |
| 84. | Yorkshire | 1.05% | 0.62%(+0.431)#84 | 1.05%(+0.002)#9,479 |
| 85. | Difficult Run | 1.04% | 0.62%(+0.415)#85 | 1.05%(-0.013)#9,560 |
| 86. | Nokesville | 1.03% | 0.62%(+0.413)#86 | 1.05%(-0.015)#9,577 |
| 87. | Manchester | 1.03% | 0.62%(+0.411)#87 | 1.05%(-0.017)#9,587 |
| 88. | Navy | 1.02% | 0.62%(+0.397)#88 | 1.05%(-0.031)#9,661 |
| 89. | Short Pump | 1.00% | 0.62%(+0.380)#89 | 1.05%(-0.048)#9,757 |
| 90. | Burke | 1.00% | 0.62%(+0.377)#90 | 1.05%(-0.051)#9,778 |
| 91. | Oakton | 1.00% | 0.62%(+0.377)#91 | 1.05%(-0.052)#9,783 |
| 92. | Abingdon | 0.98% | 0.62%(+0.363)#92 | 1.05%(-0.066)#9,857 |
| 93. | Idylwood | 0.96% | 0.62%(+0.336)#93 | 1.05%(-0.093)#10,005 |
| 94. | West Springfield | 0.95% | 0.62%(+0.334)#94 | 1.05%(-0.094)#10,010 |
| 95. | Harrisonburg | 0.95% | 0.62%(+0.328)#95 | 1.05%(-0.100)#10,043 |
| 96. | Lansdowne | 0.94% | 0.62%(+0.323)#96 | 1.05%(-0.106)#10,082 |
| 97. | Blacksburg | 0.93% | 0.62%(+0.310)#97 | 1.05%(-0.118)#10,156 |
| 98. | Verona | 0.92% | 0.62%(+0.297)#98 | 1.05%(-0.132)#10,211 |
| 99. | Woodlake | 0.91% | 0.62%(+0.292)#99 | 1.05%(-0.136)#10,240 |
| 100. | Crosspointe | 0.90% | 0.62%(+0.285)#100 | 1.05%(-0.144)#10,284 |
Common Questions
What are the Top 10 Cities with the Highest Percentage of Swedish Population in Virginia?
Top 10 Cities with the Highest Percentage of Swedish Population in Virginia are:
#1
25.95%
#2
7.05%
#3
5.98%
#4
4.80%
#5
4.40%
#6
4.13%
#7
4.00%
#8
3.99%
#9
3.96%
#10
3.64%
What city has the Highest Percentage of Swedish Population in Virginia?
Free Union has the Highest Percentage of Swedish Population in Virginia with 25.95%.
What is the Percentage of Swedish Population in the State of Virginia?
Percentage of Swedish Population in Virginia is 0.62%.
What is the Percentage of Swedish Population in the United States?
Percentage of Swedish Population in the United States is 1.05%.