McMullin, VA Map & Demographics
McMullin Map
McMullin Overview
$34,901
PER CAPITA INCOME
$89,500
AVG FAMILY INCOME
$38,250
AVG HOUSEHOLD INCOME
2.8%
WAGE / INCOME GAP [ % ]
97.2¢/ $1
WAGE / INCOME GAP [ $ ]
0.43
INEQUALITY / GINI INDEX
240
TOTAL POPULATION
117
MALE POPULATION
123
FEMALE POPULATION
95.12
MALES / 100 FEMALES
105.13
FEMALES / 100 MALES
56.6
MEDIAN AGE
2.6
AVG FAMILY SIZE
1.8
AVG HOUSEHOLD SIZE
148
LABOR FORCE [ PEOPLE ]
64.3%
PERCENT IN LABOR FORCE
Income in McMullin
Income Overview in McMullin
Per Capita Income in McMullin is $34,901, while median incomes of families and households are $89,500 and $38,250 respectively.
| Characteristic | Number | Measure |
| Per Capita Income | 240 | $34,901 |
| Median Family Income | 64 | $89,500 |
| Mean Family Income | 64 | $92,025 |
| Median Household Income | 136 | $38,250 |
| Mean Household Income | 136 | $60,370 |
| Income Deficit | 64 | $0 |
| Wage / Income Gap (%) | 240 | 2.82% |
| Wage / Income Gap ($) | 240 | 97.18¢ per $1 |
| Gini / Inequality Index | 240 | 0.43 |
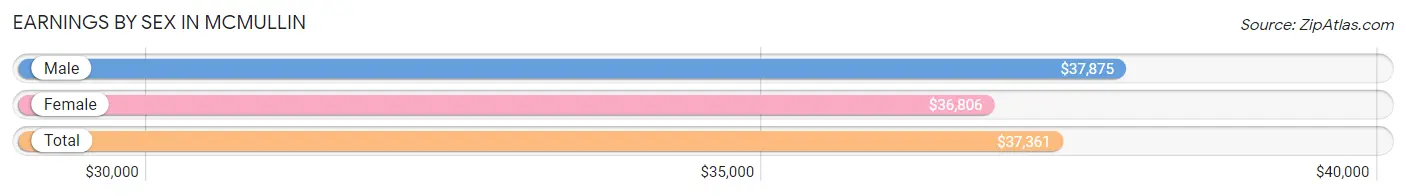
Earnings by Sex in McMullin
Average Earnings in McMullin are $37,361, $37,875 for men and $36,806 for women, a difference of 2.8%.
| Sex | Number | Average Earnings |
| Male | 77 (52.0%) | $37,875 |
| Female | 71 (48.0%) | $36,806 |
| Total | 148 (100.0%) | $37,361 |
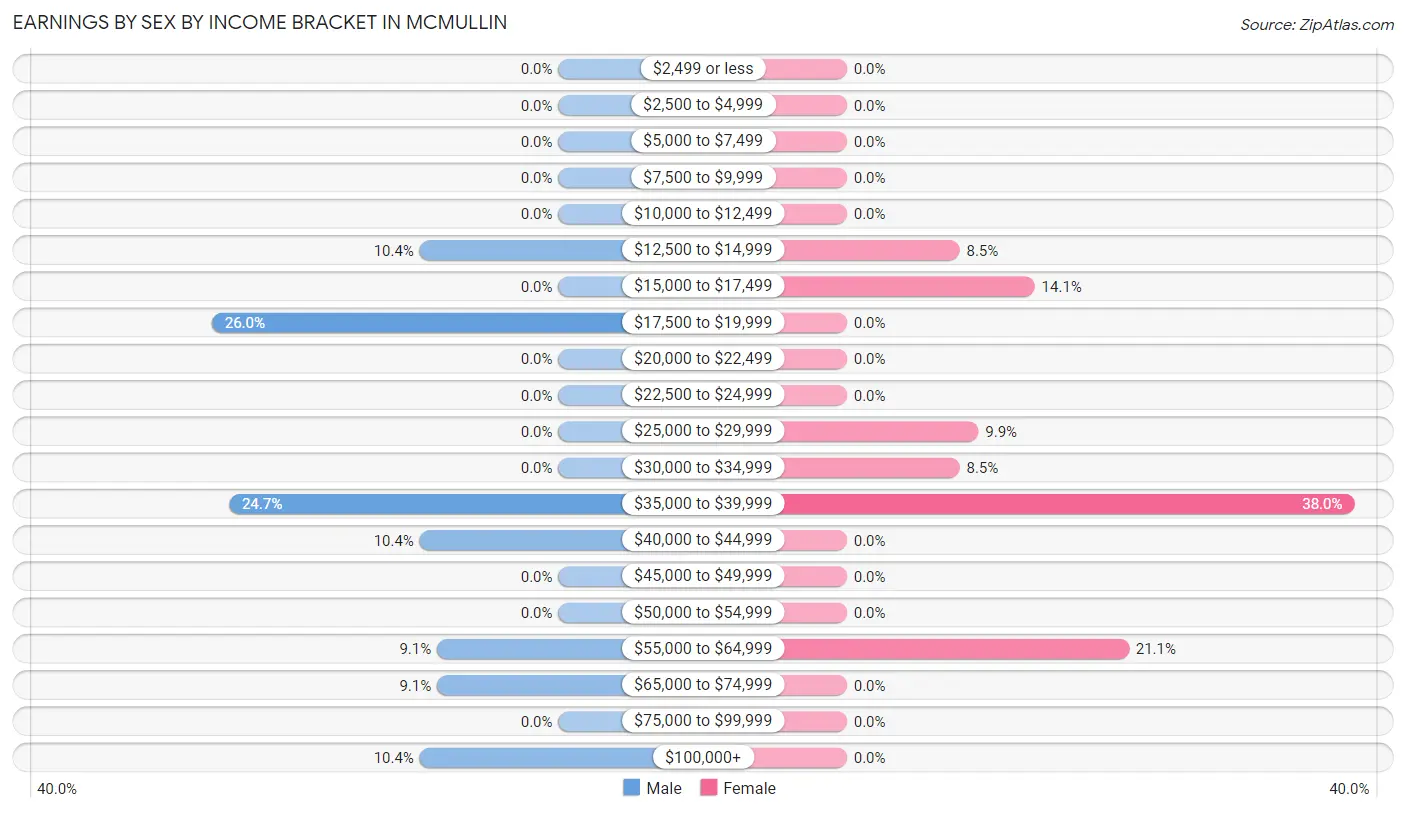
Earnings by Sex by Income Bracket in McMullin
The most common earnings brackets in McMullin are $17,500 to $19,999 for men (20 | 26.0%) and $35,000 to $39,999 for women (27 | 38.0%).
| Income | Male | Female |
| $2,499 or less | 0 (0.0%) | 0 (0.0%) |
| $2,500 to $4,999 | 0 (0.0%) | 0 (0.0%) |
| $5,000 to $7,499 | 0 (0.0%) | 0 (0.0%) |
| $7,500 to $9,999 | 0 (0.0%) | 0 (0.0%) |
| $10,000 to $12,499 | 0 (0.0%) | 0 (0.0%) |
| $12,500 to $14,999 | 8 (10.4%) | 6 (8.5%) |
| $15,000 to $17,499 | 0 (0.0%) | 10 (14.1%) |
| $17,500 to $19,999 | 20 (26.0%) | 0 (0.0%) |
| $20,000 to $22,499 | 0 (0.0%) | 0 (0.0%) |
| $22,500 to $24,999 | 0 (0.0%) | 0 (0.0%) |
| $25,000 to $29,999 | 0 (0.0%) | 7 (9.9%) |
| $30,000 to $34,999 | 0 (0.0%) | 6 (8.5%) |
| $35,000 to $39,999 | 19 (24.7%) | 27 (38.0%) |
| $40,000 to $44,999 | 8 (10.4%) | 0 (0.0%) |
| $45,000 to $49,999 | 0 (0.0%) | 0 (0.0%) |
| $50,000 to $54,999 | 0 (0.0%) | 0 (0.0%) |
| $55,000 to $64,999 | 7 (9.1%) | 15 (21.1%) |
| $65,000 to $74,999 | 7 (9.1%) | 0 (0.0%) |
| $75,000 to $99,999 | 0 (0.0%) | 0 (0.0%) |
| $100,000+ | 8 (10.4%) | 0 (0.0%) |
| Total | 77 (100.0%) | 71 (100.0%) |
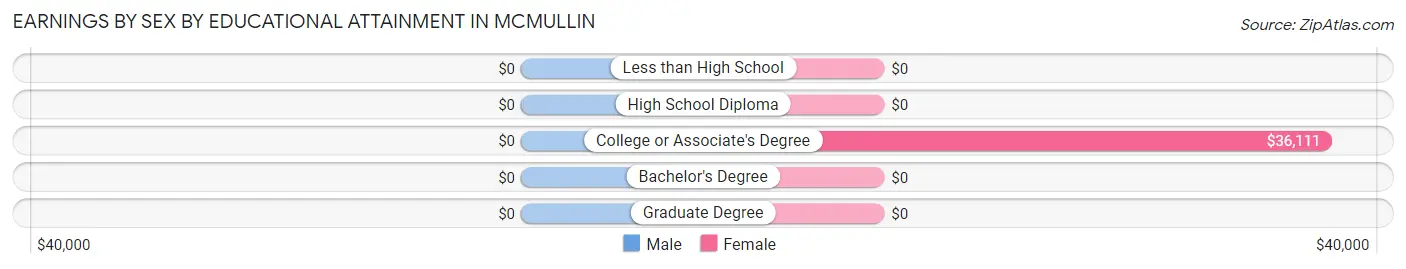
Earnings by Sex by Educational Attainment in McMullin
| Educational Attainment | Male Income | Female Income |
| Less than High School | - | - |
| High School Diploma | - | - |
| College or Associate's Degree | - | - |
| Bachelor's Degree | - | - |
| Graduate Degree | - | - |
| Total | $41,875 | $37,569 |
Family Income in McMullin
Family Income Brackets in McMullin
According to the McMullin family income data, there are 24 families falling into the $100,000 to $149,999 income range, which is the most common income bracket and makes up 37.5% of all families.
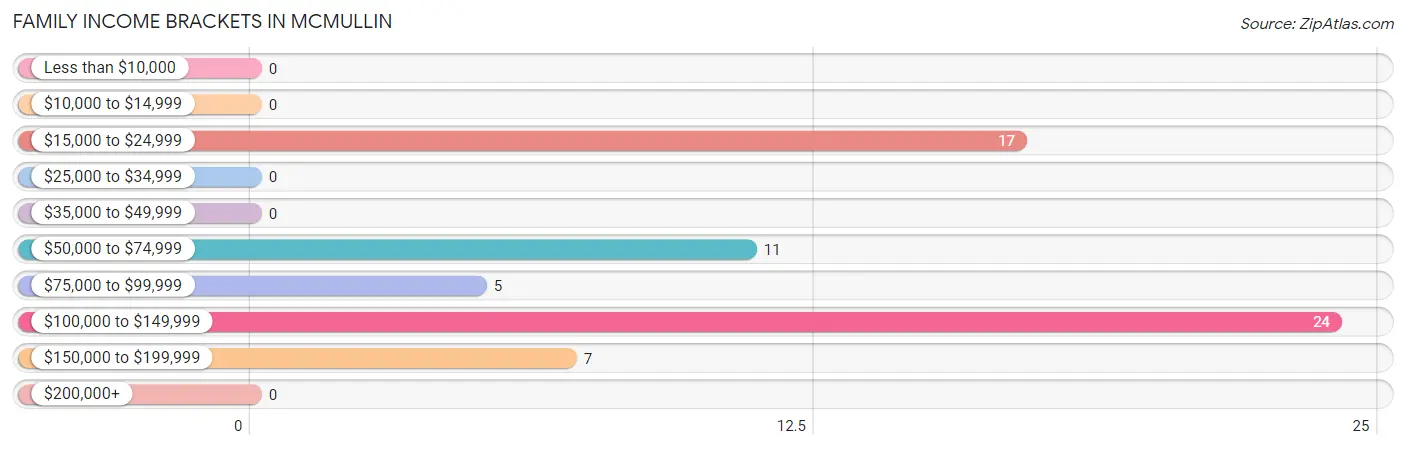
| Income Bracket | # Families | % Families |
| Less than $10,000 | 0 | 0.0% |
| $10,000 to $14,999 | 0 | 0.0% |
| $15,000 to $24,999 | 17 | 26.6% |
| $25,000 to $34,999 | 0 | 0.0% |
| $35,000 to $49,999 | 0 | 0.0% |
| $50,000 to $74,999 | 11 | 17.2% |
| $75,000 to $99,999 | 5 | 7.8% |
| $100,000 to $149,999 | 24 | 37.5% |
| $150,000 to $199,999 | 7 | 10.9% |
| $200,000+ | 0 | 0.0% |
Family Income by Famaliy Size in McMullin
3-person families (21 | 32.8%) account for the highest median family income in McMullin with $111,528 per family, while 3-person families (21 | 32.8%) have the highest median income of $37,176 per family member.
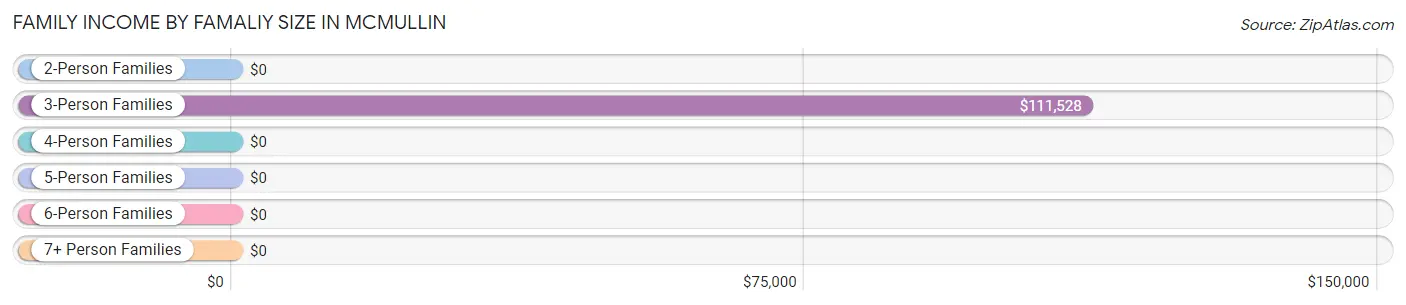
| Income Bracket | # Families | Median Income |
| 2-Person Families | 35 (54.7%) | $0 |
| 3-Person Families | 21 (32.8%) | $111,528 |
| 4-Person Families | 8 (12.5%) | $0 |
| 5-Person Families | 0 (0.0%) | $0 |
| 6-Person Families | 0 (0.0%) | $0 |
| 7+ Person Families | 0 (0.0%) | $0 |
| Total | 64 (100.0%) | $89,500 |
Family Income by Number of Earners in McMullin
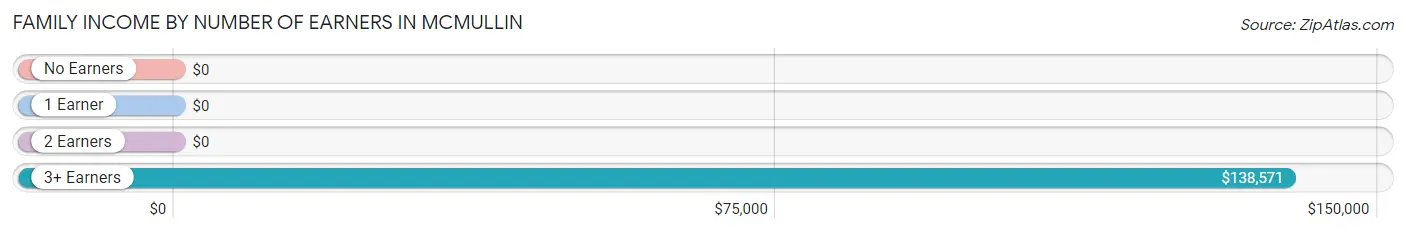
| Number of Earners | # Families | Median Income |
| No Earners | 17 (26.6%) | $0 |
| 1 Earner | 16 (25.0%) | $0 |
| 2 Earners | 7 (10.9%) | $0 |
| 3+ Earners | 24 (37.5%) | $138,571 |
| Total | 64 (100.0%) | $89,500 |
Household Income in McMullin
Household Income Brackets in McMullin
With 25 households falling in the category, the $15,000 to $24,999 income range is the most frequent in McMullin, accounting for 18.4% of all households.
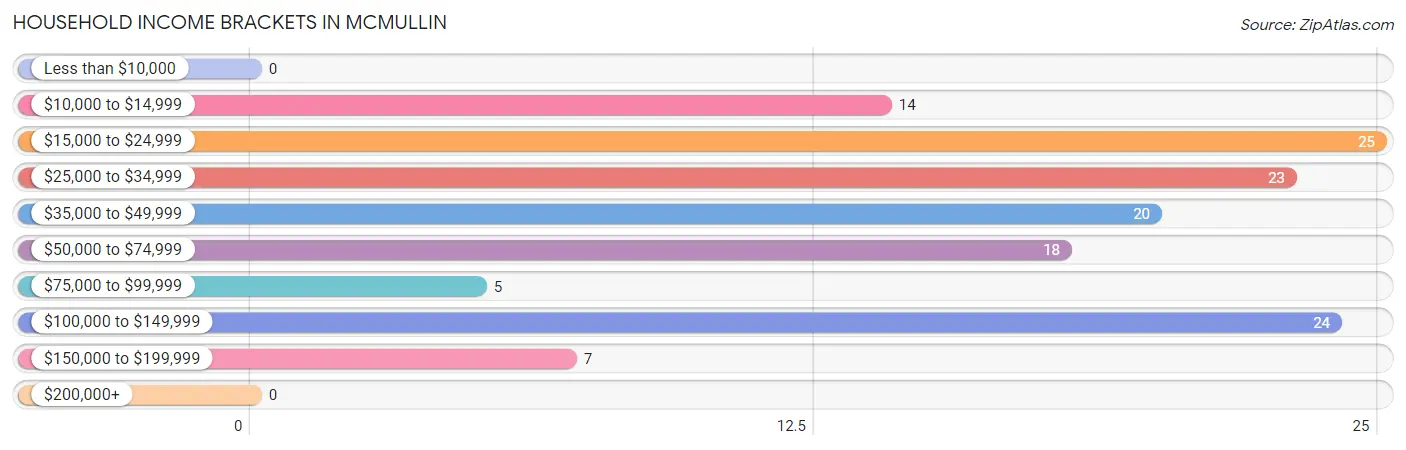
| Income Bracket | # Households | % Households |
| Less than $10,000 | 0 | 0.0% |
| $10,000 to $14,999 | 14 | 10.3% |
| $15,000 to $24,999 | 25 | 18.4% |
| $25,000 to $34,999 | 23 | 16.9% |
| $35,000 to $49,999 | 20 | 14.7% |
| $50,000 to $74,999 | 18 | 13.2% |
| $75,000 to $99,999 | 5 | 3.7% |
| $100,000 to $149,999 | 24 | 17.6% |
| $150,000 to $199,999 | 7 | 5.1% |
| $200,000+ | 0 | 0.0% |
Household Income by Householder Age in McMullin
The median household income in McMullin is $38,250, with the highest median household income of $110,278 found in the 45 to 64 years age bracket for the primary householder. A total of 44 households (32.4%) fall into this category.
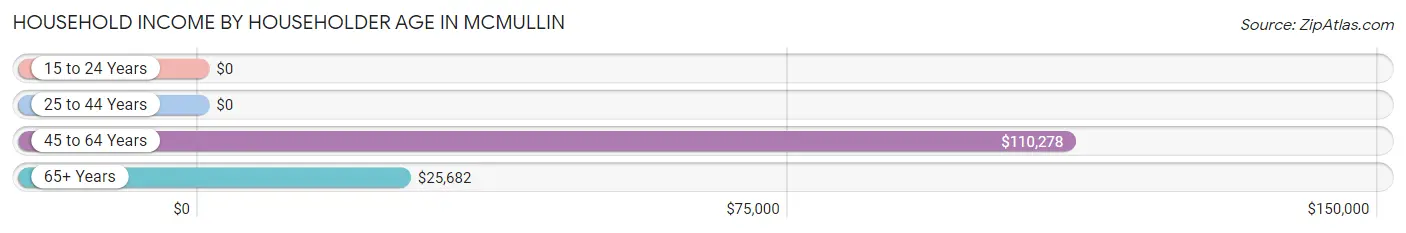
| Income Bracket | # Households | Median Income |
| 15 to 24 Years | 0 (0.0%) | $0 |
| 25 to 44 Years | 28 (20.6%) | $0 |
| 45 to 64 Years | 44 (32.4%) | $110,278 |
| 65+ Years | 64 (47.1%) | $25,682 |
| Total | 136 (100.0%) | $38,250 |
Poverty in McMullin
Income Below Poverty by Sex and Age in McMullin
With 8.6% poverty level for males and 13.0% for females among the residents of McMullin, 6 to 11 year old males and 25 to 34 year old females are the most vulnerable to poverty, with 10 males (100.0%) and 10 females (100.0%) in their respective age groups living below the poverty level.
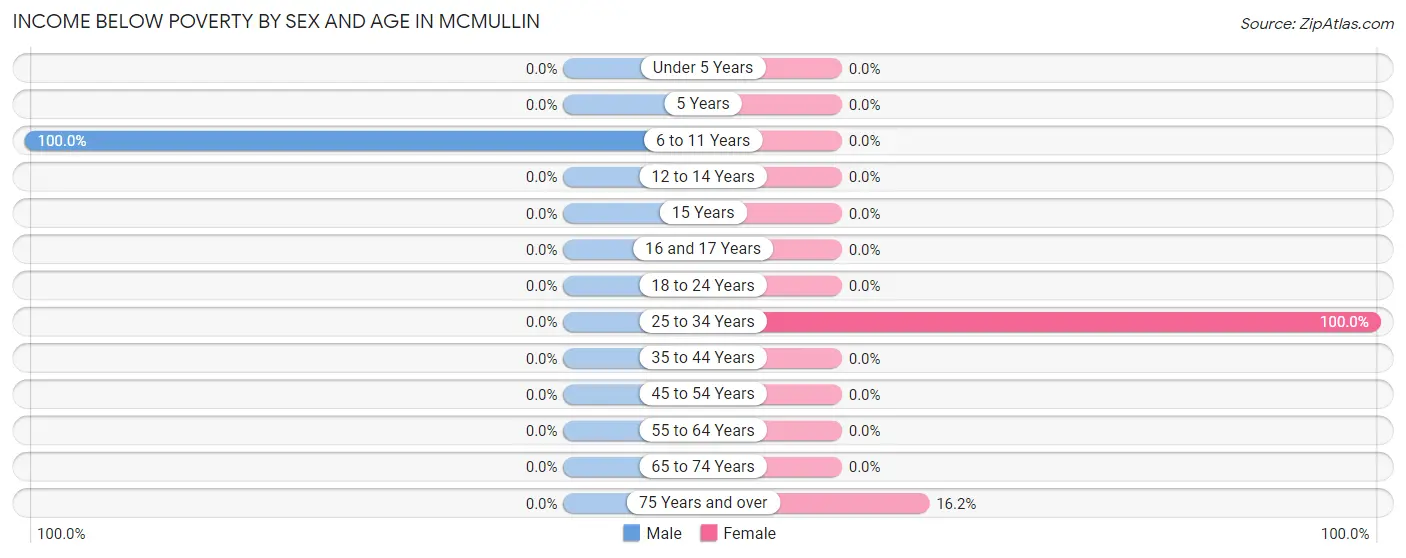
| Age Bracket | Male | Female |
| Under 5 Years | 0 (0.0%) | 0 (0.0%) |
| 5 Years | 0 (0.0%) | 0 (0.0%) |
| 6 to 11 Years | 10 (100.0%) | 0 (0.0%) |
| 12 to 14 Years | 0 (0.0%) | 0 (0.0%) |
| 15 Years | 0 (0.0%) | 0 (0.0%) |
| 16 and 17 Years | 0 (0.0%) | 0 (0.0%) |
| 18 to 24 Years | 0 (0.0%) | 0 (0.0%) |
| 25 to 34 Years | 0 (0.0%) | 10 (100.0%) |
| 35 to 44 Years | 0 (0.0%) | 0 (0.0%) |
| 45 to 54 Years | 0 (0.0%) | 0 (0.0%) |
| 55 to 64 Years | 0 (0.0%) | 0 (0.0%) |
| 65 to 74 Years | 0 (0.0%) | 0 (0.0%) |
| 75 Years and over | 0 (0.0%) | 6 (16.2%) |
| Total | 10 (8.6%) | 16 (13.0%) |
Income Above Poverty by Sex and Age in McMullin
According to the poverty statistics in McMullin, males aged 18 to 24 years and females aged 18 to 24 years are the age groups that are most secure financially, with 100.0% of males and 100.0% of females in these age groups living above the poverty line.
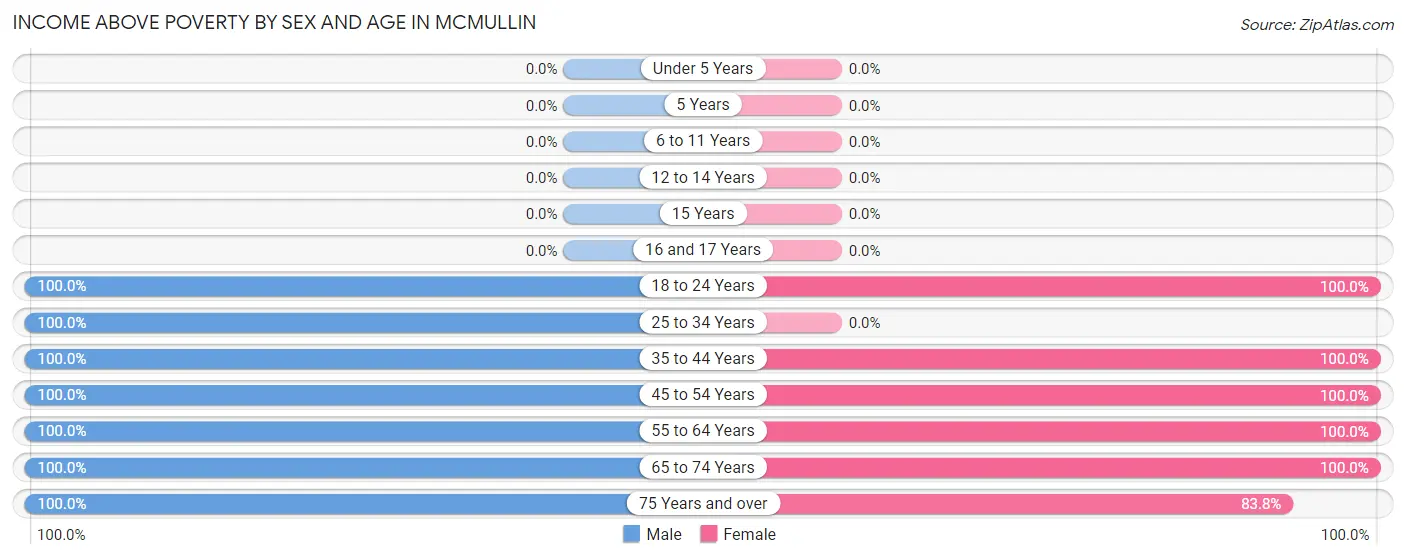
| Age Bracket | Male | Female |
| Under 5 Years | 0 (0.0%) | 0 (0.0%) |
| 5 Years | 0 (0.0%) | 0 (0.0%) |
| 6 to 11 Years | 0 (0.0%) | 0 (0.0%) |
| 12 to 14 Years | 0 (0.0%) | 0 (0.0%) |
| 15 Years | 0 (0.0%) | 0 (0.0%) |
| 16 and 17 Years | 0 (0.0%) | 0 (0.0%) |
| 18 to 24 Years | 29 (100.0%) | 6 (100.0%) |
| 25 to 34 Years | 10 (100.0%) | 0 (0.0%) |
| 35 to 44 Years | 14 (100.0%) | 8 (100.0%) |
| 45 to 54 Years | 7 (100.0%) | 17 (100.0%) |
| 55 to 64 Years | 27 (100.0%) | 28 (100.0%) |
| 65 to 74 Years | 15 (100.0%) | 17 (100.0%) |
| 75 Years and over | 5 (100.0%) | 31 (83.8%) |
| Total | 107 (91.4%) | 107 (87.0%) |
Income Below Poverty Among Married-Couple Families in McMullin
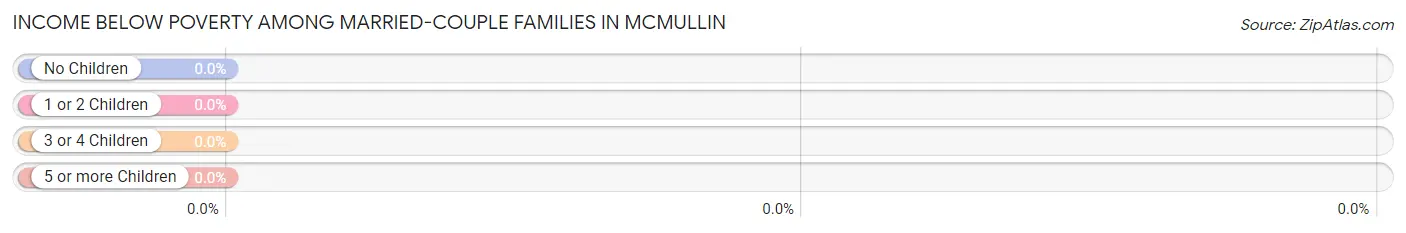
| Children | Above Poverty | Below Poverty |
| No Children | 54 (100.0%) | 0 (0.0%) |
| 1 or 2 Children | 0 (0.0%) | 0 (0.0%) |
| 3 or 4 Children | 0 (0.0%) | 0 (0.0%) |
| 5 or more Children | 0 (0.0%) | 0 (0.0%) |
| Total | 54 (100.0%) | 0 (0.0%) |
Income Below Poverty Among Single-Parent Households in McMullin
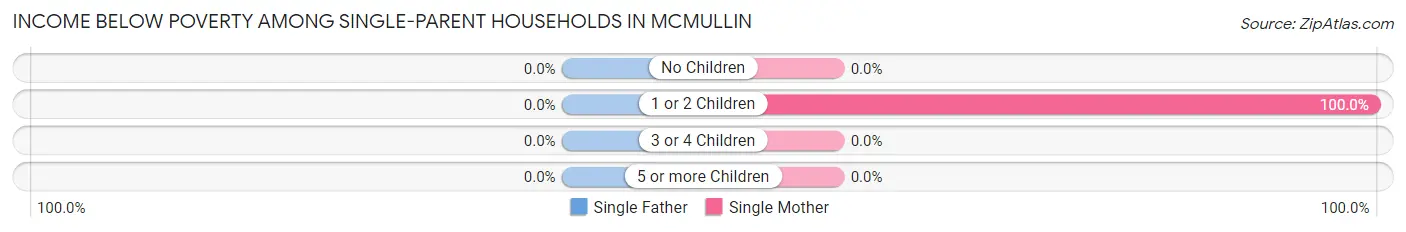
| Children | Single Father | Single Mother |
| No Children | 0 (0.0%) | 0 (0.0%) |
| 1 or 2 Children | 0 (0.0%) | 10 (100.0%) |
| 3 or 4 Children | 0 (0.0%) | 0 (0.0%) |
| 5 or more Children | 0 (0.0%) | 0 (0.0%) |
| Total | 0 (0.0%) | 10 (100.0%) |
Income Below Poverty Among Married-Couple vs Single-Parent Households in McMullin
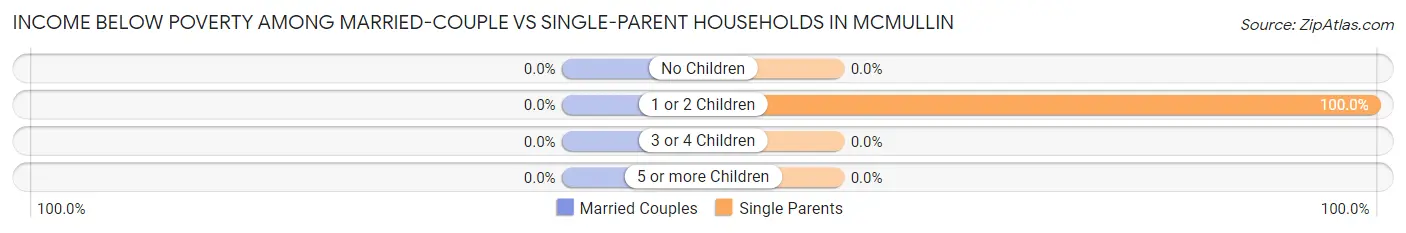
| Children | Married-Couple Families | Single-Parent Households |
| No Children | 0 (0.0%) | 0 (0.0%) |
| 1 or 2 Children | 0 (0.0%) | 10 (100.0%) |
| 3 or 4 Children | 0 (0.0%) | 0 (0.0%) |
| 5 or more Children | 0 (0.0%) | 0 (0.0%) |
| Total | 0 (0.0%) | 10 (100.0%) |
Race in McMullin
The most populous races in McMullin are , and White / Caucasian (240 | 100.0%).
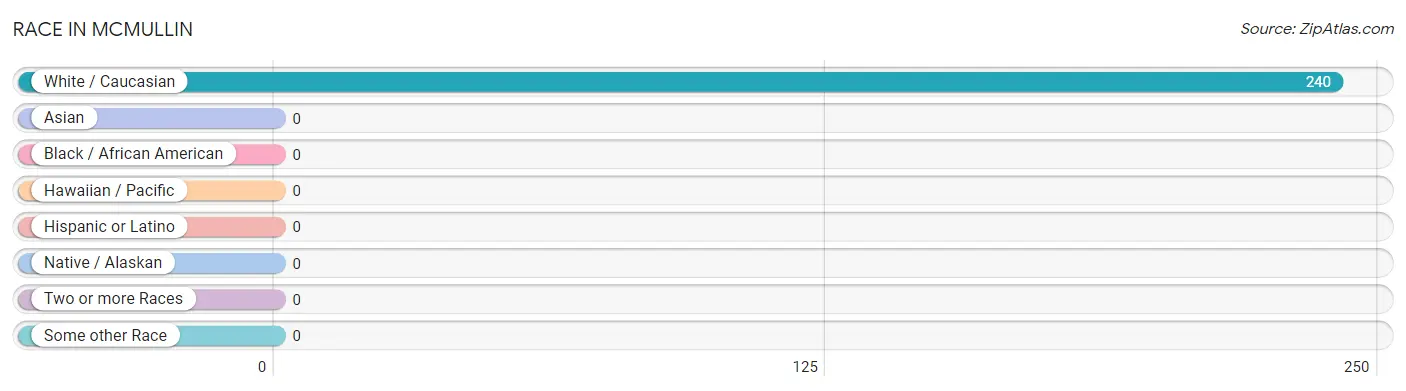
| Race | # Population | % Population |
| Asian | 0 | 0.0% |
| Black / African American | 0 | 0.0% |
| Hawaiian / Pacific | 0 | 0.0% |
| Hispanic or Latino | 0 | 0.0% |
| Native / Alaskan | 0 | 0.0% |
| White / Caucasian | 240 | 100.0% |
| Two or more Races | 0 | 0.0% |
| Some other Race | 0 | 0.0% |
| Total | 240 | 100.0% |
Ancestry in McMullin
The most populous ancestries reported in McMullin are Irish (37 | 15.4%), English (35 | 14.6%), German (32 | 13.3%), French (20 | 8.3%), and American (15 | 6.2%), together accounting for 57.9% of all McMullin residents.
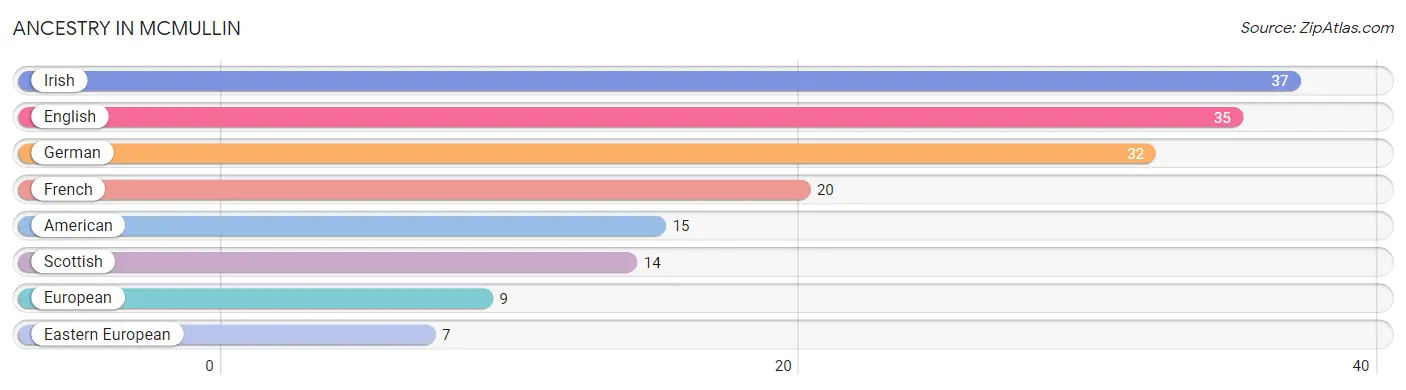
| Ancestry | # Population | % Population |
| American | 15 | 6.2% |
| Eastern European | 7 | 2.9% |
| English | 35 | 14.6% |
| European | 9 | 3.7% |
| French | 20 | 8.3% |
| German | 32 | 13.3% |
| Irish | 37 | 15.4% |
| Scottish | 14 | 5.8% | View All 8 Rows |
Immigrants in McMullin
The most numerous immigrant groups reported in McMullin came from Europe (4 | 1.7%), Germany (4 | 1.7%), and Western Europe (4 | 1.7%), together accounting for 5.0% of all McMullin residents.
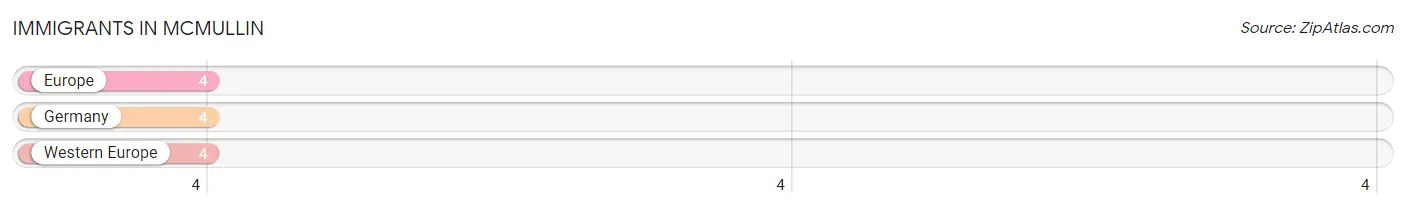
| Immigration Origin | # Population | % Population |
| Europe | 4 | 1.7% |
| Germany | 4 | 1.7% |
| Western Europe | 4 | 1.7% | View All 3 Rows |
Sex and Age in McMullin
Sex and Age in McMullin
The most populous age groups in McMullin are 55 to 59 Years (27 | 23.1%) for men and 85 Years and over (26 | 21.1%) for women.
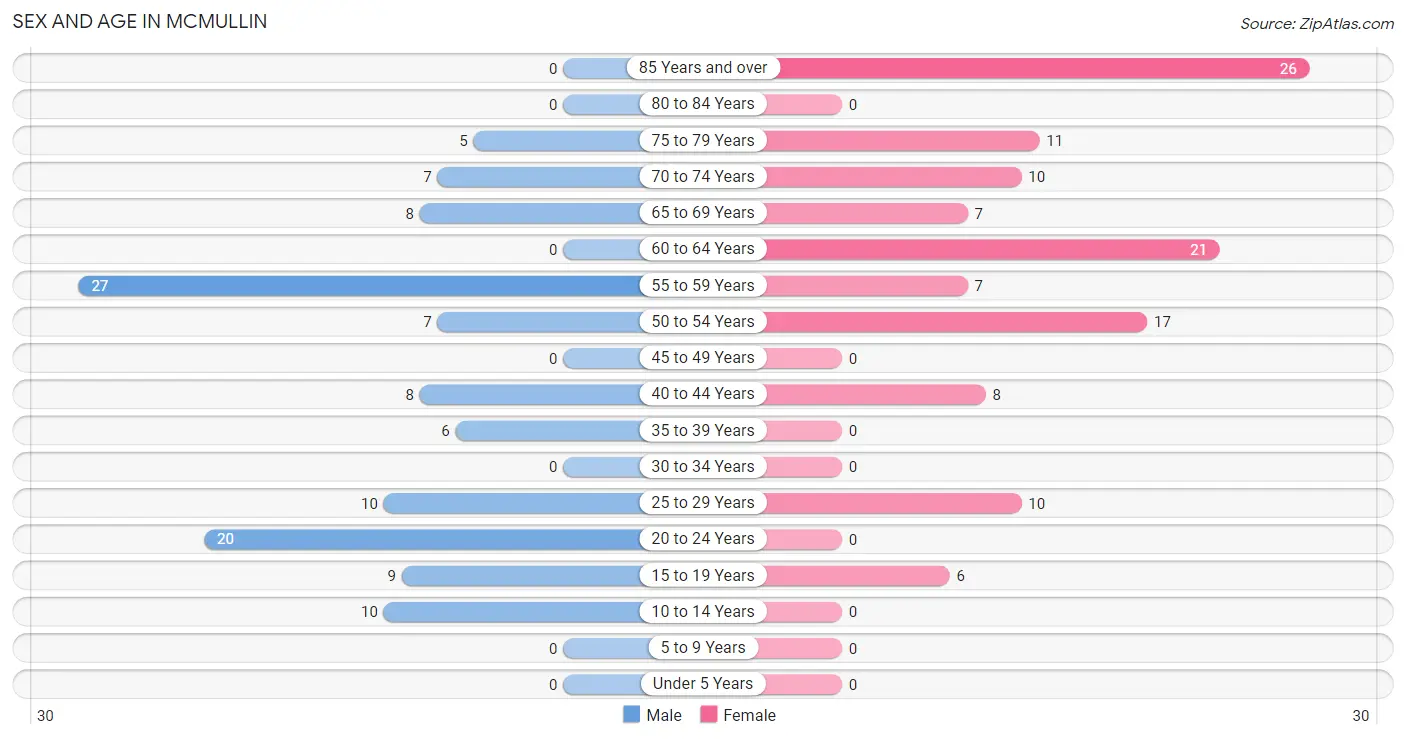
| Age Bracket | Male | Female |
| Under 5 Years | 0 (0.0%) | 0 (0.0%) |
| 5 to 9 Years | 0 (0.0%) | 0 (0.0%) |
| 10 to 14 Years | 10 (8.6%) | 0 (0.0%) |
| 15 to 19 Years | 9 (7.7%) | 6 (4.9%) |
| 20 to 24 Years | 20 (17.1%) | 0 (0.0%) |
| 25 to 29 Years | 10 (8.6%) | 10 (8.1%) |
| 30 to 34 Years | 0 (0.0%) | 0 (0.0%) |
| 35 to 39 Years | 6 (5.1%) | 0 (0.0%) |
| 40 to 44 Years | 8 (6.8%) | 8 (6.5%) |
| 45 to 49 Years | 0 (0.0%) | 0 (0.0%) |
| 50 to 54 Years | 7 (6.0%) | 17 (13.8%) |
| 55 to 59 Years | 27 (23.1%) | 7 (5.7%) |
| 60 to 64 Years | 0 (0.0%) | 21 (17.1%) |
| 65 to 69 Years | 8 (6.8%) | 7 (5.7%) |
| 70 to 74 Years | 7 (6.0%) | 10 (8.1%) |
| 75 to 79 Years | 5 (4.3%) | 11 (8.9%) |
| 80 to 84 Years | 0 (0.0%) | 0 (0.0%) |
| 85 Years and over | 0 (0.0%) | 26 (21.1%) |
| Total | 117 (100.0%) | 123 (100.0%) |
Families and Households in McMullin
Median Family Size in McMullin
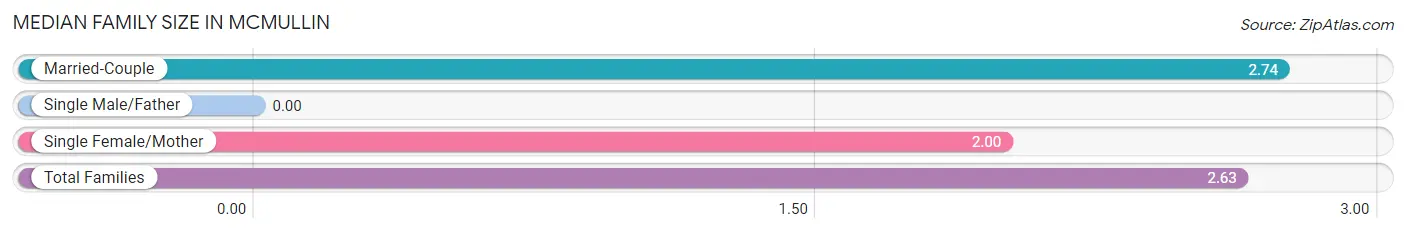
| Family Type | # Families | Family Size |
| Married-Couple | 54 (84.4%) | 2.74 |
| Single Male/Father | 0 (0.0%) | - |
| Single Female/Mother | 10 (15.6%) | 2.00 |
| Total Families | 64 (100.0%) | 2.63 |
Median Household Size in McMullin
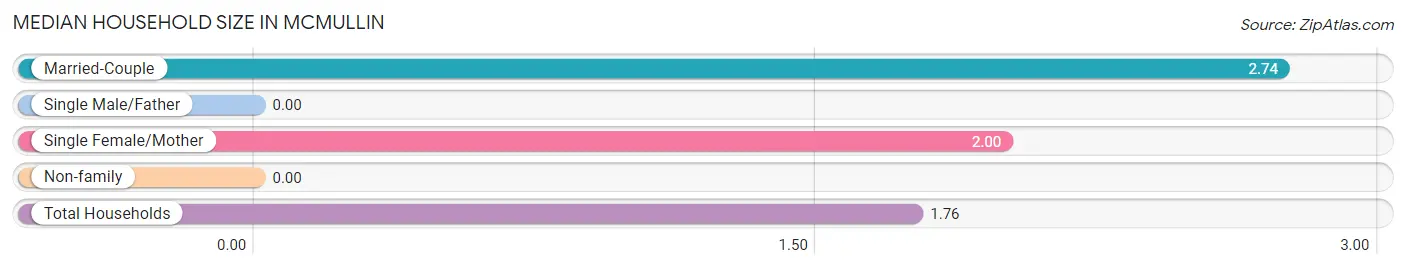
| Household Type | # Households | Household Size |
| Married-Couple | 54 (39.7%) | 2.74 |
| Single Male/Father | 0 (0.0%) | - |
| Single Female/Mother | 10 (7.3%) | 2.00 |
| Non-family | 72 (52.9%) | - |
| Total Households | 136 (100.0%) | 1.76 |
Household Size by Marriage Status in McMullin
Out of a total of 136 households in McMullin, 64 (47.1%) are family households, while 72 (52.9%) are nonfamily households. The most numerous type of family households are 2-person households, comprising 35, and the most common type of nonfamily households are 1-person households, comprising 72.
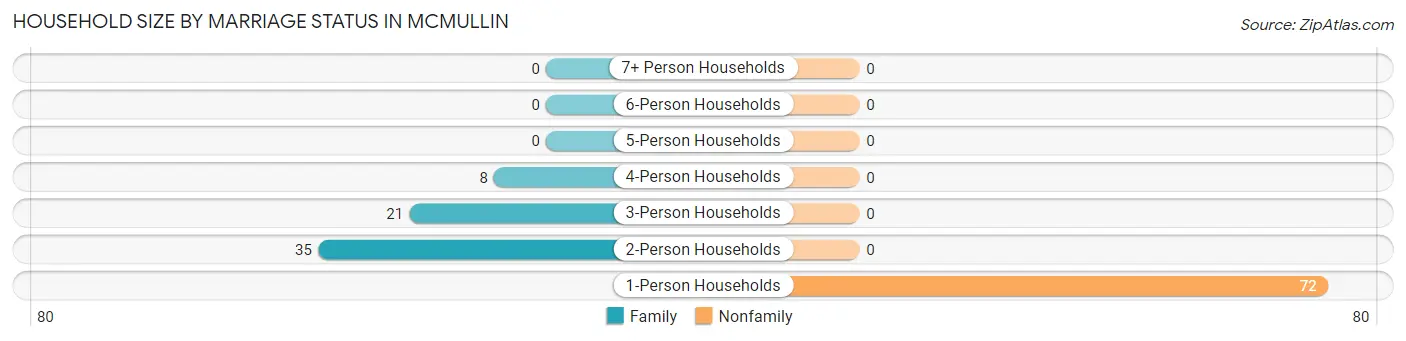
| Household Size | Family Households | Nonfamily Households |
| 1-Person Households | - | 72 (52.9%) |
| 2-Person Households | 35 (25.7%) | 0 (0.0%) |
| 3-Person Households | 21 (15.4%) | 0 (0.0%) |
| 4-Person Households | 8 (5.9%) | 0 (0.0%) |
| 5-Person Households | 0 (0.0%) | 0 (0.0%) |
| 6-Person Households | 0 (0.0%) | 0 (0.0%) |
| 7+ Person Households | 0 (0.0%) | 0 (0.0%) |
| Total | 64 (47.1%) | 72 (52.9%) |
Female Fertility in McMullin
Fertility by Age in McMullin
| Age Bracket | Women with Births | Births / 1,000 Women |
| 15 to 19 years | 0 (0.0%) | 0.0 |
| 20 to 34 years | 0 (0.0%) | 0.0 |
| 35 to 50 years | 0 (0.0%) | 0.0 |
| Total | 0 (0.0%) | 0.0 |
Fertility by Age by Marriage Status in McMullin
| Age Bracket | Married | Unmarried |
| 15 to 19 years | 0 (0.0%) | 0 (0.0%) |
| 20 to 34 years | 0 (0.0%) | 0 (0.0%) |
| 35 to 50 years | 0 (0.0%) | 0 (0.0%) |
| Total | 0 (0.0%) | 0 (0.0%) |
Fertility by Education in McMullin
| Educational Attainment | Women with Births | Births / 1,000 Women |
| Less than High School | 0 (0.0%) | 0.0 |
| High School Diploma | 0 (0.0%) | 0.0 |
| College or Associate's Degree | 0 (0.0%) | 0.0 |
| Bachelor's Degree | 0 (0.0%) | 0.0 |
| Graduate Degree | 0 (0.0%) | 0.0 |
| Total | 0 (0.0%) | 0.0 |
Fertility by Education by Marriage Status in McMullin
| Educational Attainment | Married | Unmarried |
| Less than High School | 0 (0.0%) | 0 (0.0%) |
| High School Diploma | 0 (0.0%) | 0 (0.0%) |
| College or Associate's Degree | 0 (0.0%) | 0 (0.0%) |
| Bachelor's Degree | 0 (0.0%) | 0 (0.0%) |
| Graduate Degree | 0 (0.0%) | 0 (0.0%) |
| Total | 0 (0.0%) | 0 (0.0%) |
Employment Characteristics in McMullin
Employment by Class of Employer in McMullin
Among the 148 employed individuals in McMullin, private company employees (76 | 51.3%), not-for-profit organizations (26 | 17.6%), and local government employees (24 | 16.2%) make up the most common classes of employment.
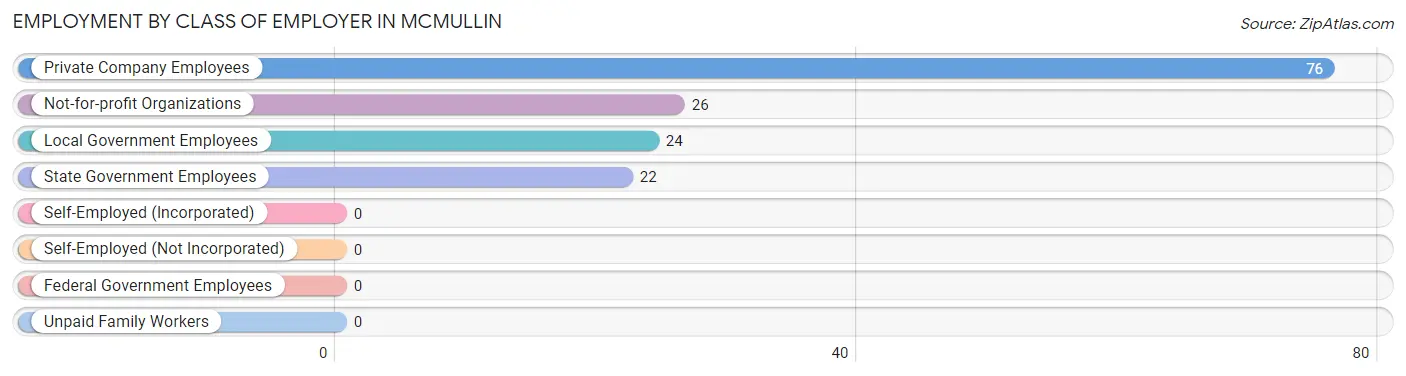
| Employer Class | # Employees | % Employees |
| Private Company Employees | 76 | 51.3% |
| Self-Employed (Incorporated) | 0 | 0.0% |
| Self-Employed (Not Incorporated) | 0 | 0.0% |
| Not-for-profit Organizations | 26 | 17.6% |
| Local Government Employees | 24 | 16.2% |
| State Government Employees | 22 | 14.9% |
| Federal Government Employees | 0 | 0.0% |
| Unpaid Family Workers | 0 | 0.0% |
| Total | 148 | 100.0% |
Employment Status by Age in McMullin
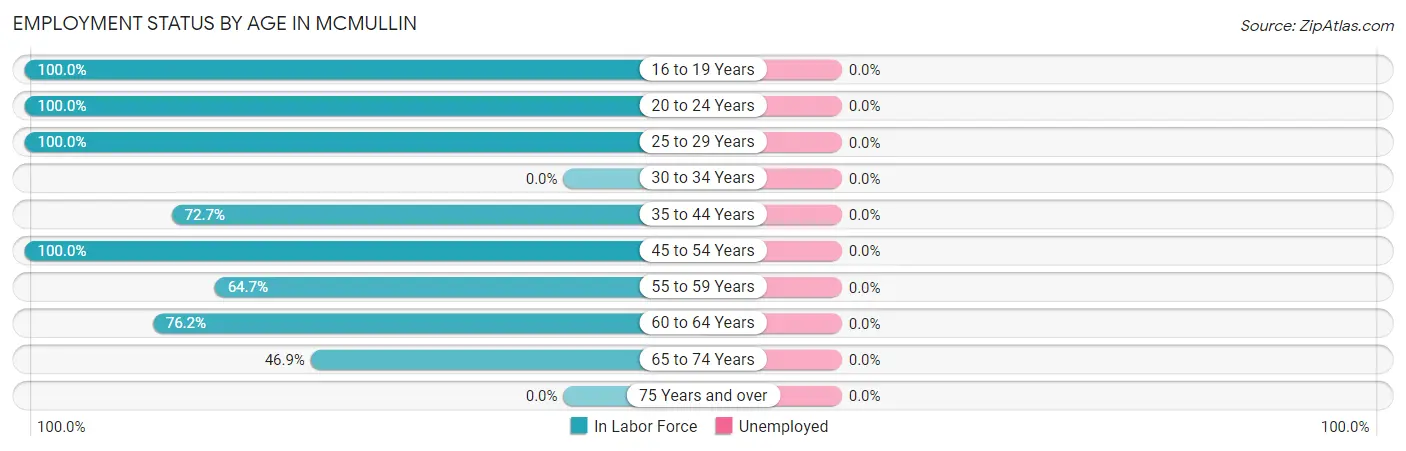
| Age Bracket | In Labor Force | Unemployed |
| 16 to 19 Years | 15 (100.0%) | 0 (0.0%) |
| 20 to 24 Years | 20 (100.0%) | 0 (0.0%) |
| 25 to 29 Years | 20 (100.0%) | 0 (0.0%) |
| 30 to 34 Years | 0 (0.0%) | 0 (0.0%) |
| 35 to 44 Years | 16 (72.7%) | 0 (0.0%) |
| 45 to 54 Years | 24 (100.0%) | 0 (0.0%) |
| 55 to 59 Years | 22 (64.7%) | 0 (0.0%) |
| 60 to 64 Years | 16 (76.2%) | 0 (0.0%) |
| 65 to 74 Years | 15 (46.9%) | 0 (0.0%) |
| 75 Years and over | 0 (0.0%) | 0 (0.0%) |
| Total | 148 (64.3%) | 0 (0.0%) |
Employment Status by Educational Attainment in McMullin
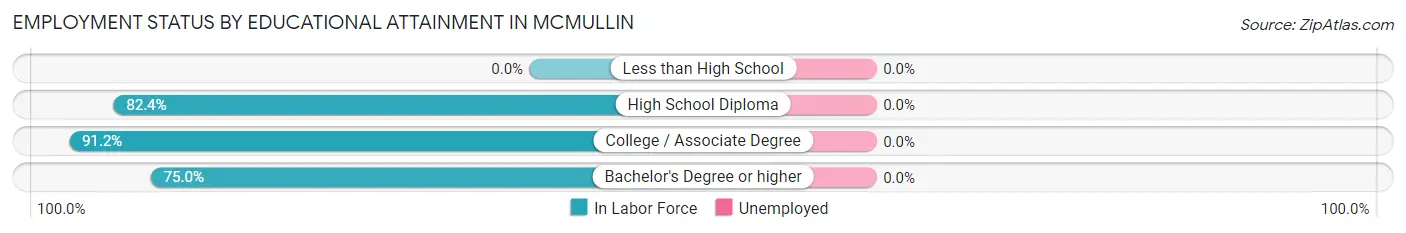
| Educational Attainment | In Labor Force | Unemployed |
| Less than High School | 0 (0.0%) | 0 (0.0%) |
| High School Diploma | 28 (82.4%) | 0 (0.0%) |
| College / Associate Degree | 52 (91.2%) | 0 (0.0%) |
| Bachelor's Degree or higher | 18 (75.0%) | 0 (0.0%) |
| Total | 98 (81.0%) | 0 (0.0%) |
Employment Occupations by Sex in McMullin
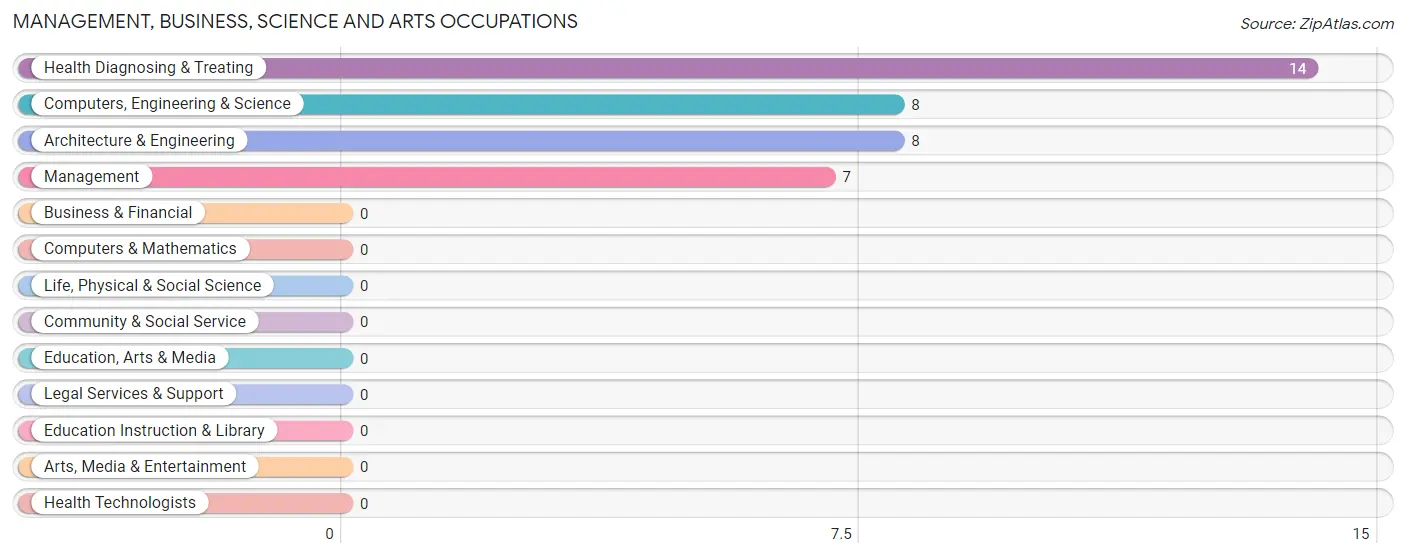
Management, Business, Science and Arts Occupations
The most common Management, Business, Science and Arts occupations in McMullin are Health Diagnosing & Treating (14 | 9.5%), Computers, Engineering & Science (8 | 5.4%), Architecture & Engineering (8 | 5.4%), and Management (7 | 4.7%).
Management, Business, Science and Arts Occupations by Sex
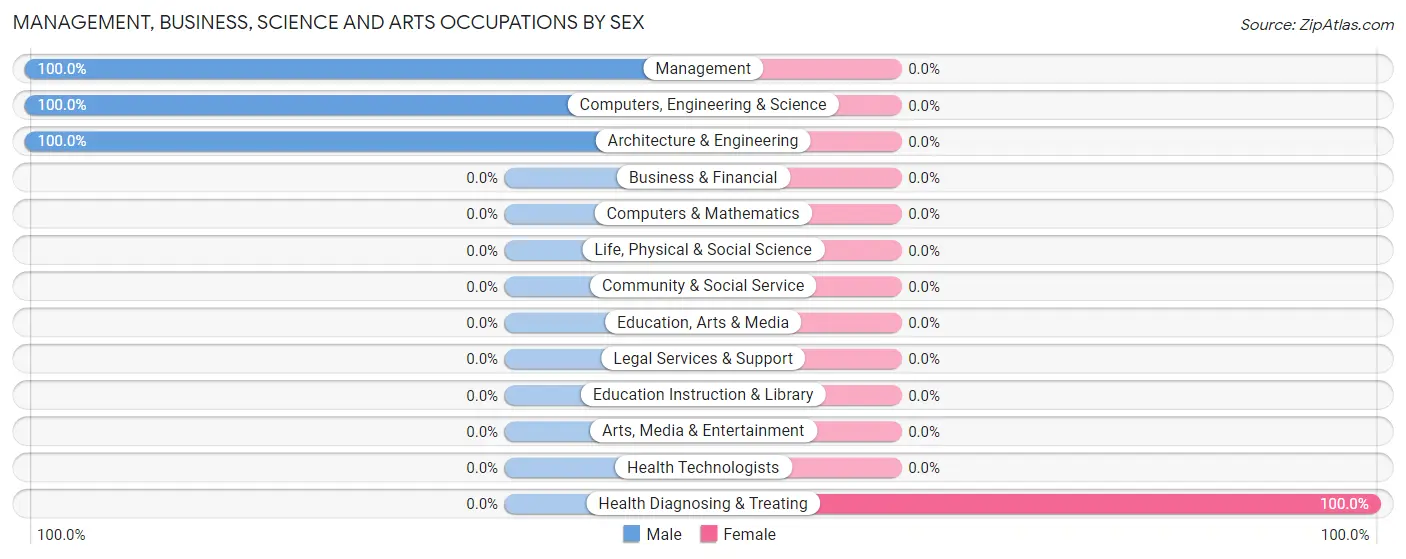
| Occupation | Male | Female |
| Management | 7 (100.0%) | 0 (0.0%) |
| Business & Financial | 0 (0.0%) | 0 (0.0%) |
| Computers, Engineering & Science | 8 (100.0%) | 0 (0.0%) |
| Computers & Mathematics | 0 (0.0%) | 0 (0.0%) |
| Architecture & Engineering | 8 (100.0%) | 0 (0.0%) |
| Life, Physical & Social Science | 0 (0.0%) | 0 (0.0%) |
| Community & Social Service | 0 (0.0%) | 0 (0.0%) |
| Education, Arts & Media | 0 (0.0%) | 0 (0.0%) |
| Legal Services & Support | 0 (0.0%) | 0 (0.0%) |
| Education Instruction & Library | 0 (0.0%) | 0 (0.0%) |
| Arts, Media & Entertainment | 0 (0.0%) | 0 (0.0%) |
| Health Diagnosing & Treating | 0 (0.0%) | 14 (100.0%) |
| Health Technologists | 0 (0.0%) | 0 (0.0%) |
| Total (Category) | 15 (51.7%) | 14 (48.3%) |
| Total (Overall) | 77 (52.0%) | 71 (48.0%) |
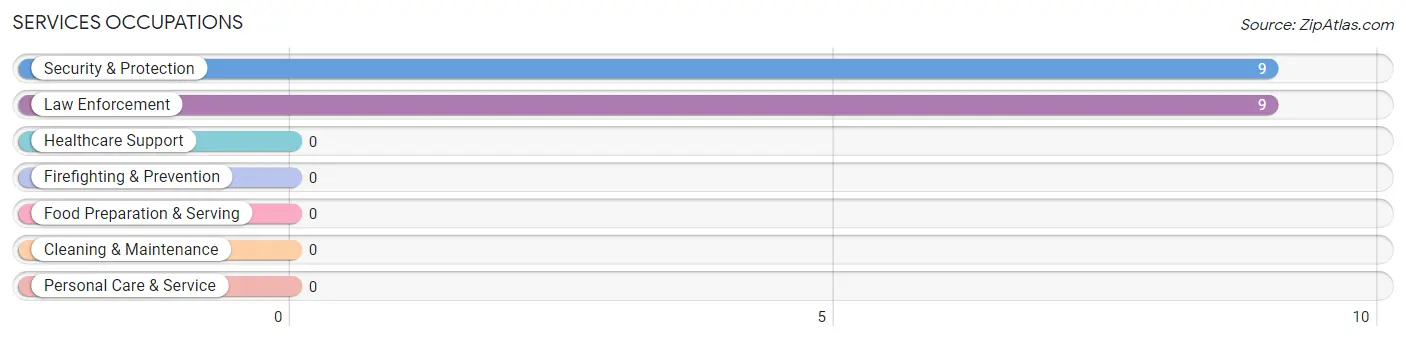
Services Occupations
The most common Services occupations in McMullin are Security & Protection (9 | 6.1%), and Law Enforcement (9 | 6.1%).
Services Occupations by Sex
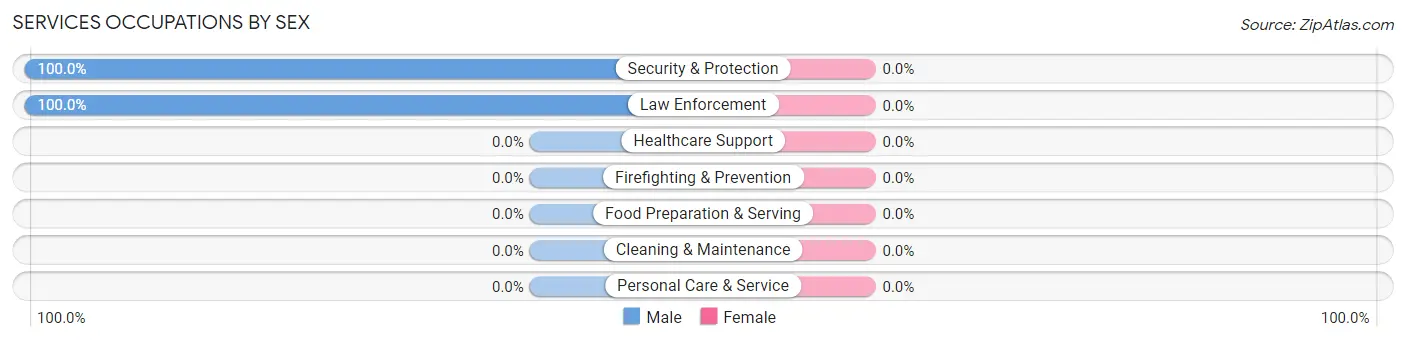
| Occupation | Male | Female |
| Healthcare Support | 0 (0.0%) | 0 (0.0%) |
| Security & Protection | 9 (100.0%) | 0 (0.0%) |
| Firefighting & Prevention | 0 (0.0%) | 0 (0.0%) |
| Law Enforcement | 9 (100.0%) | 0 (0.0%) |
| Food Preparation & Serving | 0 (0.0%) | 0 (0.0%) |
| Cleaning & Maintenance | 0 (0.0%) | 0 (0.0%) |
| Personal Care & Service | 0 (0.0%) | 0 (0.0%) |
| Total (Category) | 9 (100.0%) | 0 (0.0%) |
| Total (Overall) | 77 (52.0%) | 71 (48.0%) |
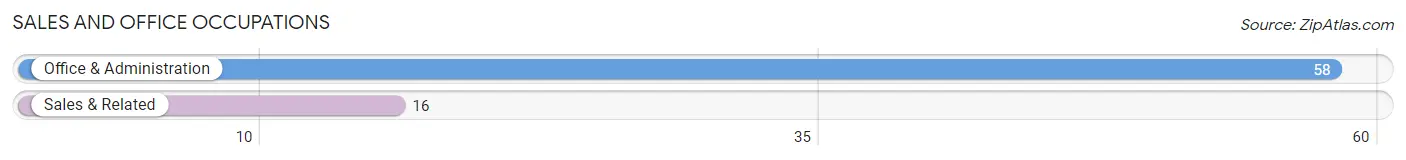
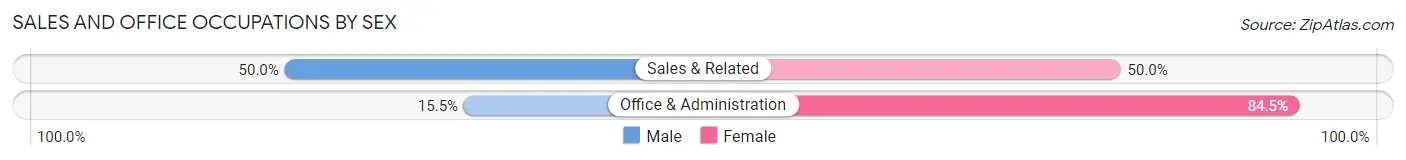
Sales and Office Occupations
The most common Sales and Office occupations in McMullin are Office & Administration (58 | 39.2%), and Sales & Related (16 | 10.8%).
Sales and Office Occupations by Sex
| Occupation | Male | Female |
| Sales & Related | 8 (50.0%) | 8 (50.0%) |
| Office & Administration | 9 (15.5%) | 49 (84.5%) |
| Total (Category) | 17 (23.0%) | 57 (77.0%) |
| Total (Overall) | 77 (52.0%) | 71 (48.0%) |
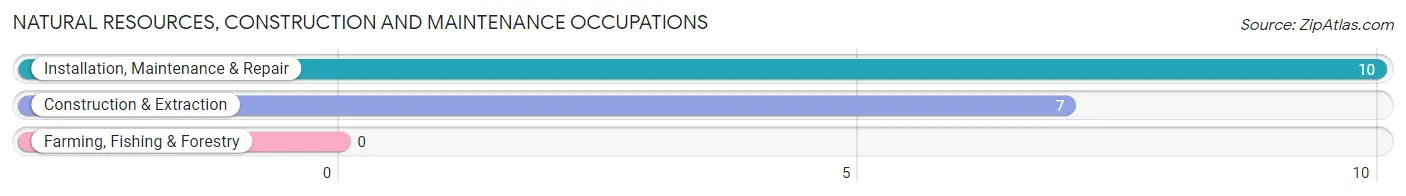
Natural Resources, Construction and Maintenance Occupations
The most common Natural Resources, Construction and Maintenance occupations in McMullin are Installation, Maintenance & Repair (10 | 6.8%), and Construction & Extraction (7 | 4.7%).
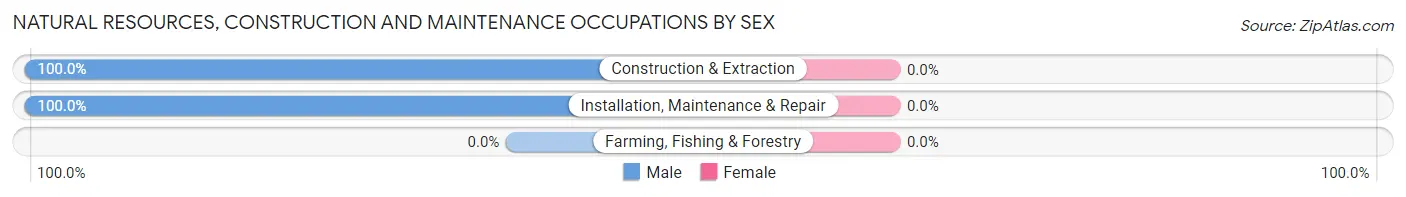
Natural Resources, Construction and Maintenance Occupations by Sex
| Occupation | Male | Female |
| Farming, Fishing & Forestry | 0 (0.0%) | 0 (0.0%) |
| Construction & Extraction | 7 (100.0%) | 0 (0.0%) |
| Installation, Maintenance & Repair | 10 (100.0%) | 0 (0.0%) |
| Total (Category) | 17 (100.0%) | 0 (0.0%) |
| Total (Overall) | 77 (52.0%) | 71 (48.0%) |
Production, Transportation and Moving Occupations
The most common Production, Transportation and Moving occupations in McMullin are , and Transportation (19 | 12.8%).
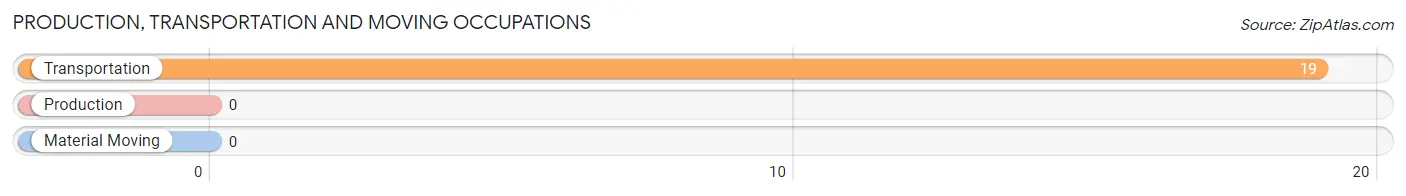
Production, Transportation and Moving Occupations by Sex
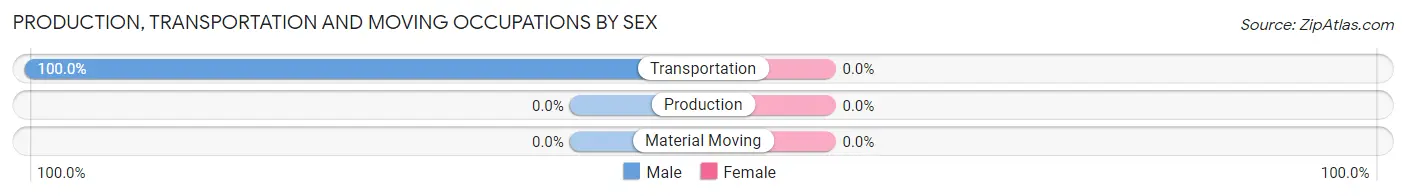
| Occupation | Male | Female |
| Production | 0 (0.0%) | 0 (0.0%) |
| Transportation | 19 (100.0%) | 0 (0.0%) |
| Material Moving | 0 (0.0%) | 0 (0.0%) |
| Total (Category) | 19 (100.0%) | 0 (0.0%) |
| Total (Overall) | 77 (52.0%) | 71 (48.0%) |
Employment Industries by Sex in McMullin
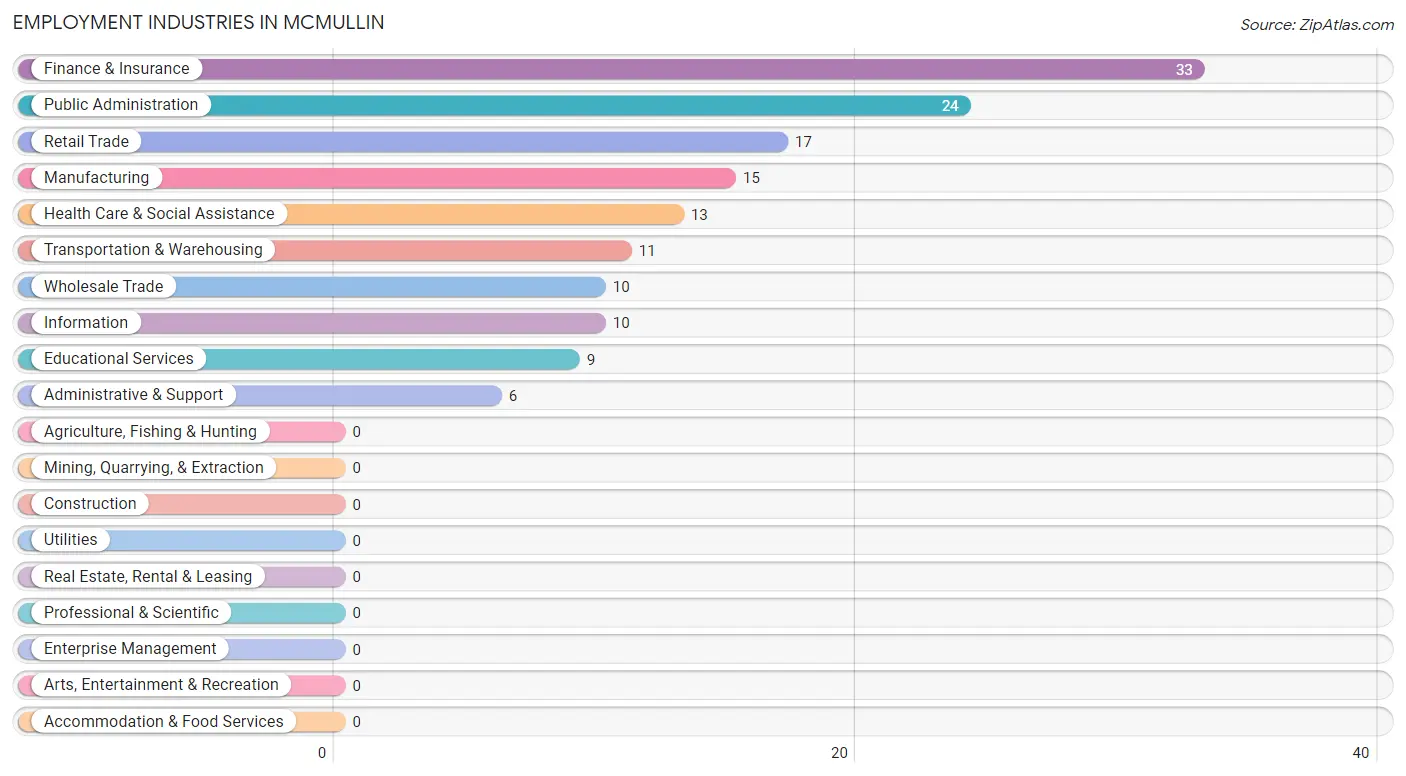
Employment Industries in McMullin
The major employment industries in McMullin include Finance & Insurance (33 | 22.3%), Public Administration (24 | 16.2%), Retail Trade (17 | 11.5%), Manufacturing (15 | 10.1%), and Health Care & Social Assistance (13 | 8.8%).
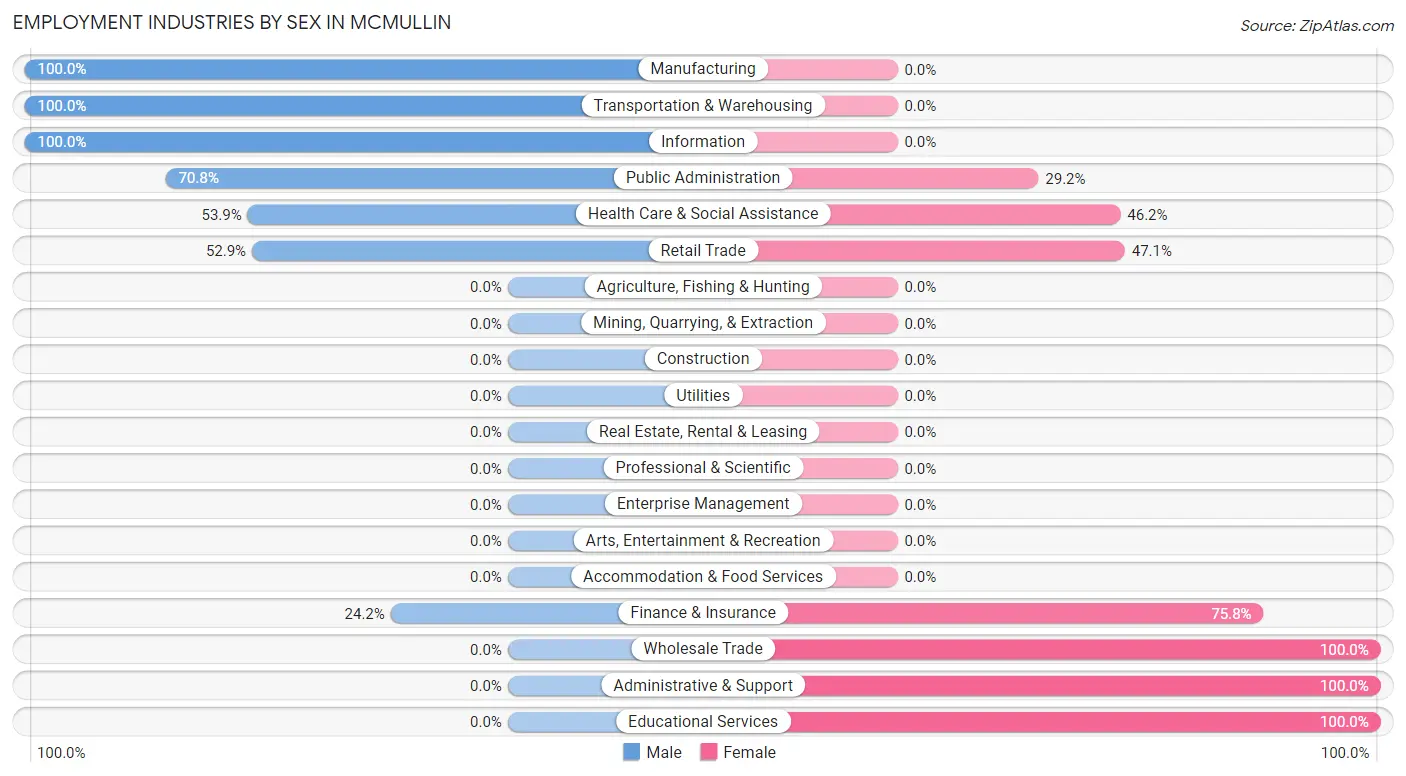
Employment Industries by Sex in McMullin
The McMullin industries that see more men than women are Manufacturing (100.0%), Transportation & Warehousing (100.0%), and Information (100.0%), whereas the industries that tend to have a higher number of women are Wholesale Trade (100.0%), Administrative & Support (100.0%), and Educational Services (100.0%).
| Industry | Male | Female |
| Agriculture, Fishing & Hunting | 0 (0.0%) | 0 (0.0%) |
| Mining, Quarrying, & Extraction | 0 (0.0%) | 0 (0.0%) |
| Construction | 0 (0.0%) | 0 (0.0%) |
| Manufacturing | 15 (100.0%) | 0 (0.0%) |
| Wholesale Trade | 0 (0.0%) | 10 (100.0%) |
| Retail Trade | 9 (52.9%) | 8 (47.1%) |
| Transportation & Warehousing | 11 (100.0%) | 0 (0.0%) |
| Utilities | 0 (0.0%) | 0 (0.0%) |
| Information | 10 (100.0%) | 0 (0.0%) |
| Finance & Insurance | 8 (24.2%) | 25 (75.8%) |
| Real Estate, Rental & Leasing | 0 (0.0%) | 0 (0.0%) |
| Professional & Scientific | 0 (0.0%) | 0 (0.0%) |
| Enterprise Management | 0 (0.0%) | 0 (0.0%) |
| Administrative & Support | 0 (0.0%) | 6 (100.0%) |
| Educational Services | 0 (0.0%) | 9 (100.0%) |
| Health Care & Social Assistance | 7 (53.8%) | 6 (46.2%) |
| Arts, Entertainment & Recreation | 0 (0.0%) | 0 (0.0%) |
| Accommodation & Food Services | 0 (0.0%) | 0 (0.0%) |
| Public Administration | 17 (70.8%) | 7 (29.2%) |
| Total | 77 (52.0%) | 71 (48.0%) |
Education in McMullin
School Enrollment in McMullin
The most common levels of schooling among the 33 students in McMullin are college / undergraduate (23 | 69.7%), and middle school (10 | 30.3%).
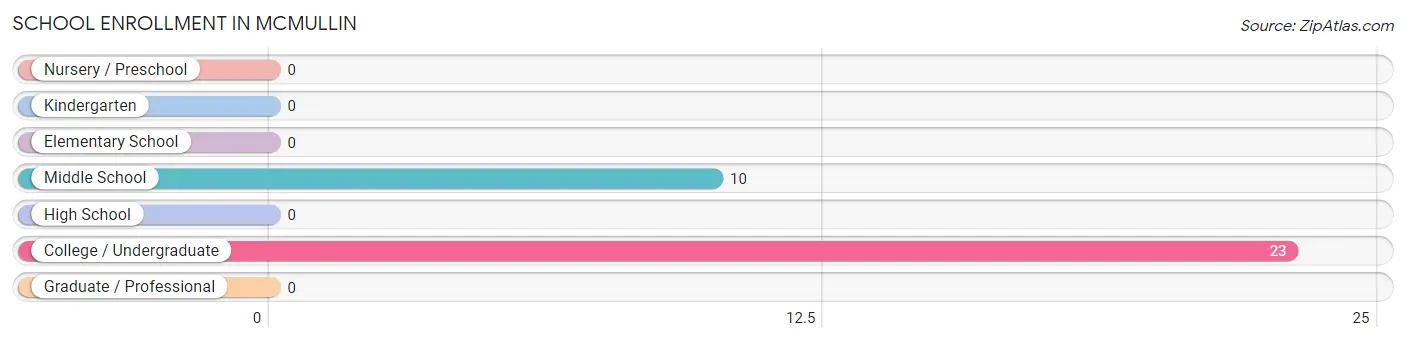
| School Level | # Students | % Students |
| Nursery / Preschool | 0 | 0.0% |
| Kindergarten | 0 | 0.0% |
| Elementary School | 0 | 0.0% |
| Middle School | 10 | 30.3% |
| High School | 0 | 0.0% |
| College / Undergraduate | 23 | 69.7% |
| Graduate / Professional | 0 | 0.0% |
| Total | 33 | 100.0% |
School Enrollment by Age by Funding Source in McMullin
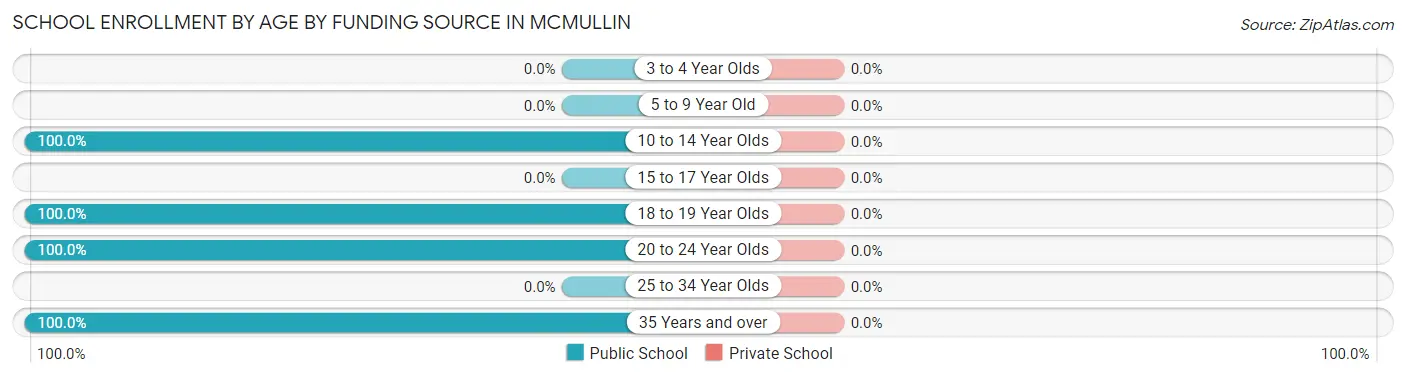
| Age Bracket | Public School | Private School |
| 3 to 4 Year Olds | 0 (0.0%) | 0 (0.0%) |
| 5 to 9 Year Old | 0 (0.0%) | 0 (0.0%) |
| 10 to 14 Year Olds | 10 (100.0%) | 0 (0.0%) |
| 15 to 17 Year Olds | 0 (0.0%) | 0 (0.0%) |
| 18 to 19 Year Olds | 6 (100.0%) | 0 (0.0%) |
| 20 to 24 Year Olds | 11 (100.0%) | 0 (0.0%) |
| 25 to 34 Year Olds | 0 (0.0%) | 0 (0.0%) |
| 35 Years and over | 6 (100.0%) | 0 (0.0%) |
| Total | 33 (100.0%) | 0 (0.0%) |
Educational Attainment by Field of Study in McMullin
Business (10 | 41.7%), arts & humanities (8 | 33.3%), and science & technology (6 | 25.0%) are the most common fields of study among 24 individuals in McMullin who have obtained a bachelor's degree or higher.
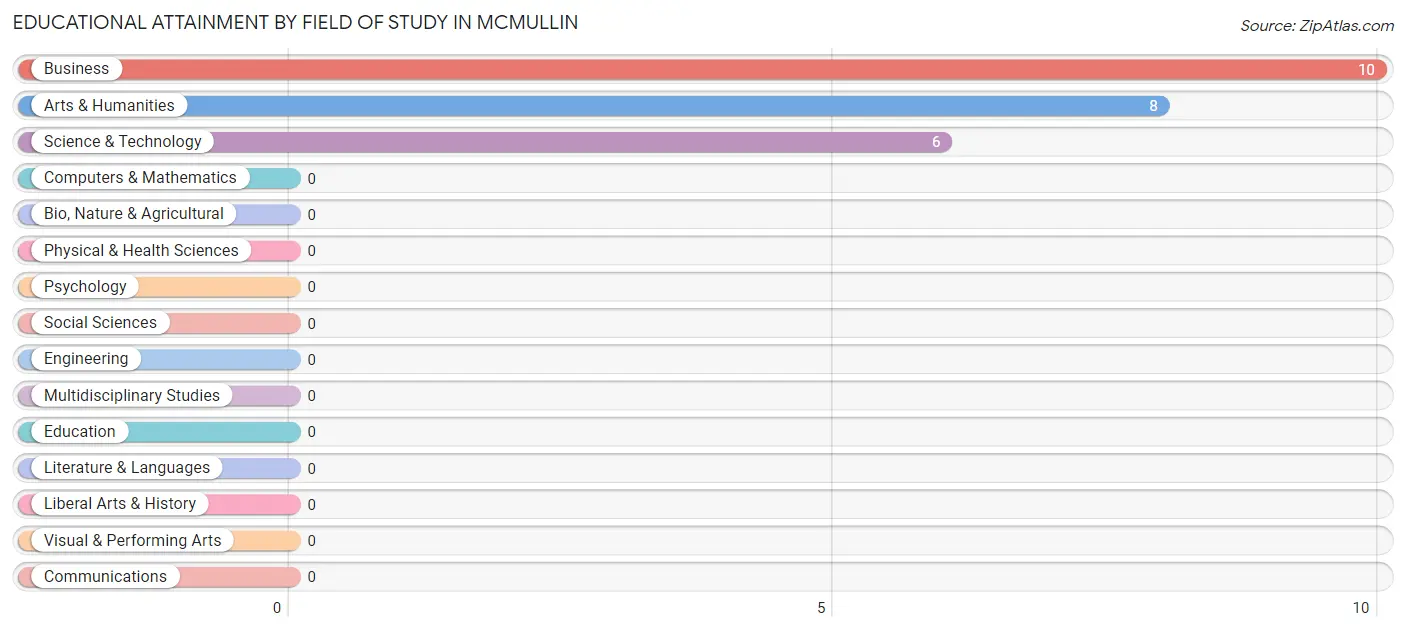
| Field of Study | # Graduates | % Graduates |
| Computers & Mathematics | 0 | 0.0% |
| Bio, Nature & Agricultural | 0 | 0.0% |
| Physical & Health Sciences | 0 | 0.0% |
| Psychology | 0 | 0.0% |
| Social Sciences | 0 | 0.0% |
| Engineering | 0 | 0.0% |
| Multidisciplinary Studies | 0 | 0.0% |
| Science & Technology | 6 | 25.0% |
| Business | 10 | 41.7% |
| Education | 0 | 0.0% |
| Literature & Languages | 0 | 0.0% |
| Liberal Arts & History | 0 | 0.0% |
| Visual & Performing Arts | 0 | 0.0% |
| Communications | 0 | 0.0% |
| Arts & Humanities | 8 | 33.3% |
| Total | 24 | 100.0% |
Transportation & Commute in McMullin
Vehicle Availability by Sex in McMullin
The most prevalent vehicle ownership categories in McMullin are males with 4 vehicles (44, accounting for 57.1%) and females with 4 vehicles (16, making up 62.0%).
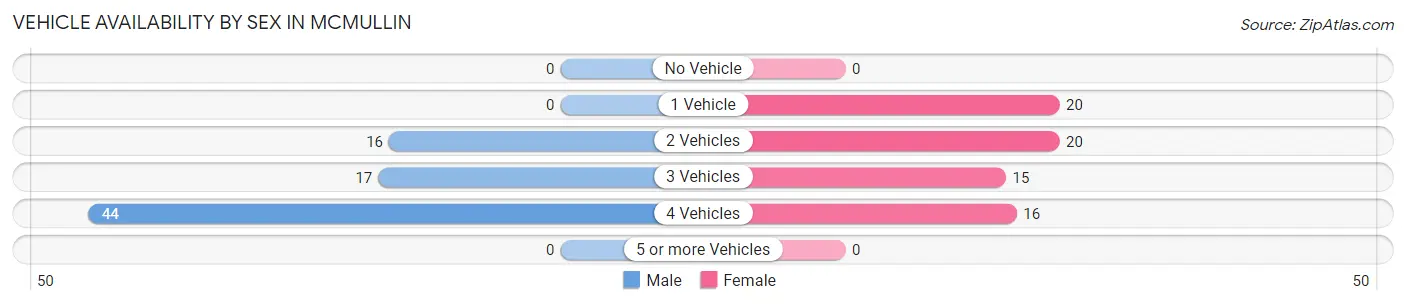
| Vehicles Available | Male | Female |
| No Vehicle | 0 (0.0%) | 0 (0.0%) |
| 1 Vehicle | 0 (0.0%) | 20 (28.2%) |
| 2 Vehicles | 16 (20.8%) | 20 (28.2%) |
| 3 Vehicles | 17 (22.1%) | 15 (21.1%) |
| 4 Vehicles | 44 (57.1%) | 16 (22.5%) |
| 5 or more Vehicles | 0 (0.0%) | 0 (0.0%) |
| Total | 77 (100.0%) | 71 (100.0%) |
Commute Time in McMullin
The most frequently occuring commute durations in McMullin are 5 to 9 minutes (57 commuters, 40.1%), 10 to 14 minutes (26 commuters, 18.3%), and 15 to 19 minutes (22 commuters, 15.5%).
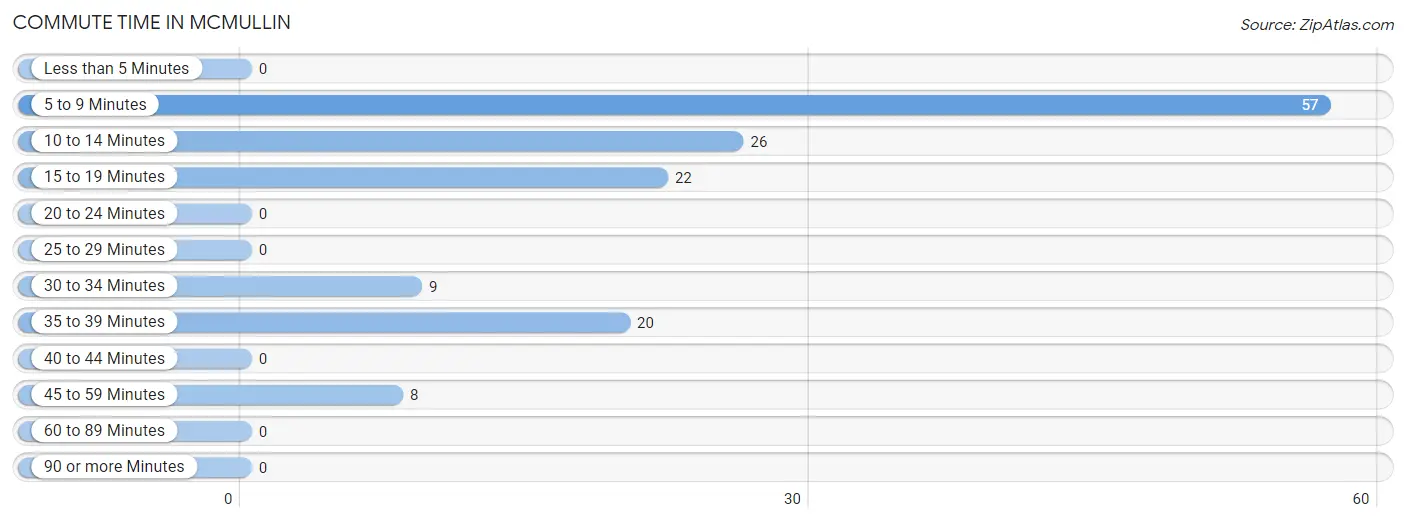
| Commute Time | # Commuters | % Commuters |
| Less than 5 Minutes | 0 | 0.0% |
| 5 to 9 Minutes | 57 | 40.1% |
| 10 to 14 Minutes | 26 | 18.3% |
| 15 to 19 Minutes | 22 | 15.5% |
| 20 to 24 Minutes | 0 | 0.0% |
| 25 to 29 Minutes | 0 | 0.0% |
| 30 to 34 Minutes | 9 | 6.3% |
| 35 to 39 Minutes | 20 | 14.1% |
| 40 to 44 Minutes | 0 | 0.0% |
| 45 to 59 Minutes | 8 | 5.6% |
| 60 to 89 Minutes | 0 | 0.0% |
| 90 or more Minutes | 0 | 0.0% |
Commute Time by Sex in McMullin
The most common commute times in McMullin are 5 to 9 minutes (27 commuters, 35.1%) for males and 5 to 9 minutes (30 commuters, 46.2%) for females.
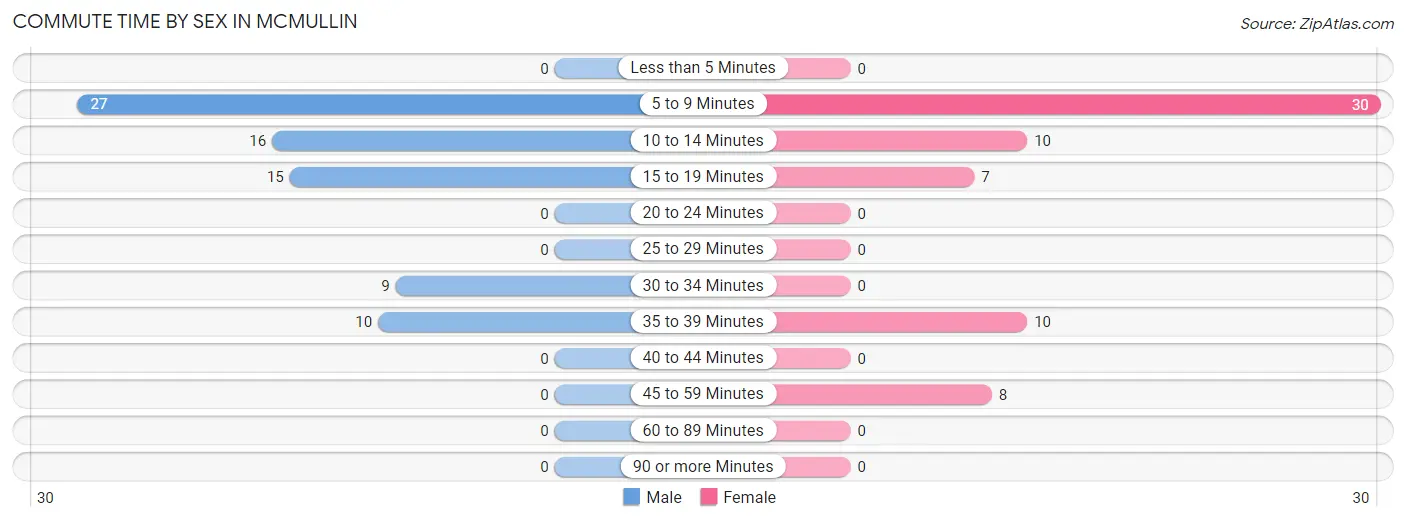
| Commute Time | Male | Female |
| Less than 5 Minutes | 0 (0.0%) | 0 (0.0%) |
| 5 to 9 Minutes | 27 (35.1%) | 30 (46.2%) |
| 10 to 14 Minutes | 16 (20.8%) | 10 (15.4%) |
| 15 to 19 Minutes | 15 (19.5%) | 7 (10.8%) |
| 20 to 24 Minutes | 0 (0.0%) | 0 (0.0%) |
| 25 to 29 Minutes | 0 (0.0%) | 0 (0.0%) |
| 30 to 34 Minutes | 9 (11.7%) | 0 (0.0%) |
| 35 to 39 Minutes | 10 (13.0%) | 10 (15.4%) |
| 40 to 44 Minutes | 0 (0.0%) | 0 (0.0%) |
| 45 to 59 Minutes | 0 (0.0%) | 8 (12.3%) |
| 60 to 89 Minutes | 0 (0.0%) | 0 (0.0%) |
| 90 or more Minutes | 0 (0.0%) | 0 (0.0%) |
Time of Departure to Work by Sex in McMullin
The most frequent times of departure to work in McMullin are 12:00 AM to 4:59 AM (24, 31.2%) for males and 8:00 AM to 8:29 AM (32, 49.2%) for females.
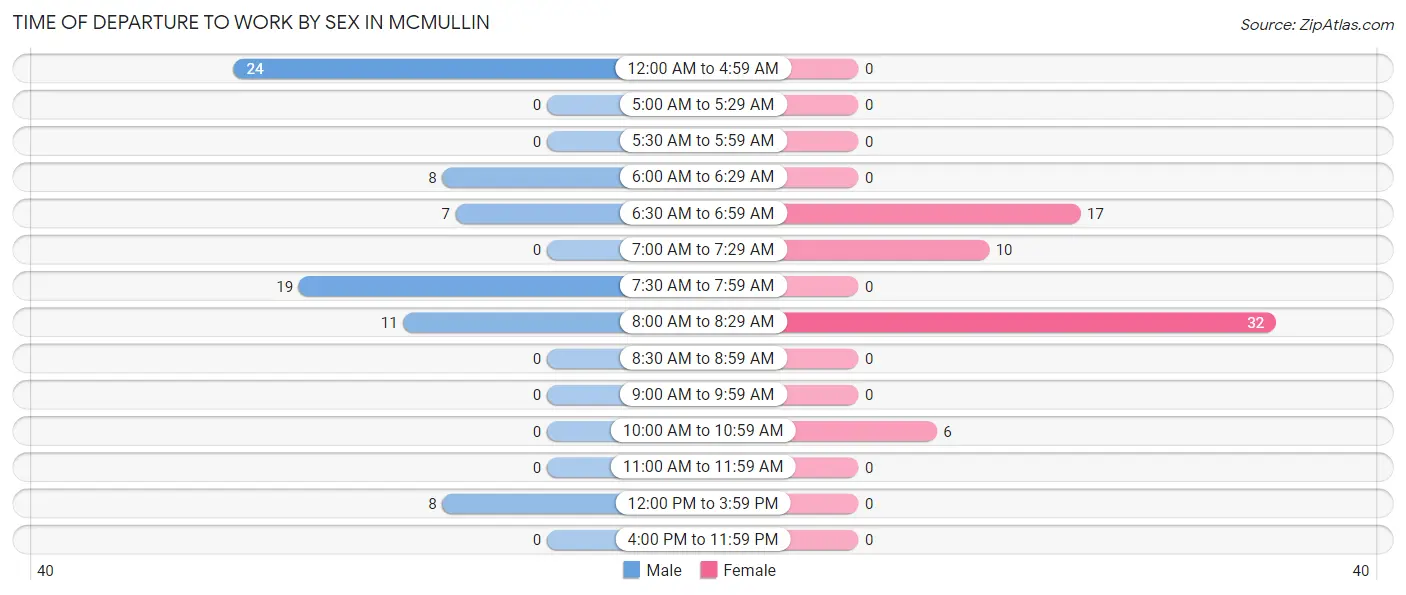
| Time of Departure | Male | Female |
| 12:00 AM to 4:59 AM | 24 (31.2%) | 0 (0.0%) |
| 5:00 AM to 5:29 AM | 0 (0.0%) | 0 (0.0%) |
| 5:30 AM to 5:59 AM | 0 (0.0%) | 0 (0.0%) |
| 6:00 AM to 6:29 AM | 8 (10.4%) | 0 (0.0%) |
| 6:30 AM to 6:59 AM | 7 (9.1%) | 17 (26.2%) |
| 7:00 AM to 7:29 AM | 0 (0.0%) | 10 (15.4%) |
| 7:30 AM to 7:59 AM | 19 (24.7%) | 0 (0.0%) |
| 8:00 AM to 8:29 AM | 11 (14.3%) | 32 (49.2%) |
| 8:30 AM to 8:59 AM | 0 (0.0%) | 0 (0.0%) |
| 9:00 AM to 9:59 AM | 0 (0.0%) | 0 (0.0%) |
| 10:00 AM to 10:59 AM | 0 (0.0%) | 6 (9.2%) |
| 11:00 AM to 11:59 AM | 0 (0.0%) | 0 (0.0%) |
| 12:00 PM to 3:59 PM | 8 (10.4%) | 0 (0.0%) |
| 4:00 PM to 11:59 PM | 0 (0.0%) | 0 (0.0%) |
| Total | 77 (100.0%) | 65 (100.0%) |
Housing Occupancy in McMullin
Occupancy by Ownership in McMullin
Of the total 136 dwellings in McMullin, owner-occupied units account for 114 (83.8%), while renter-occupied units make up 22 (16.2%).
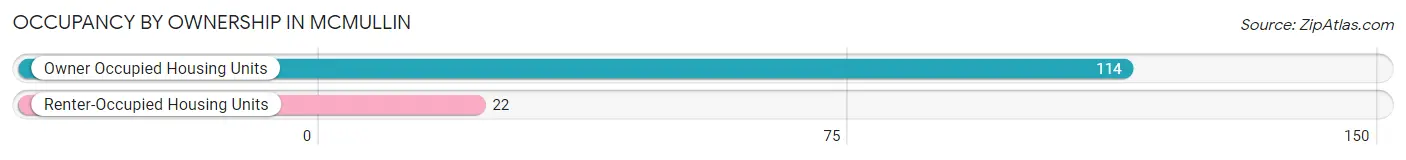
| Occupancy | # Housing Units | % Housing Units |
| Owner Occupied Housing Units | 114 | 83.8% |
| Renter-Occupied Housing Units | 22 | 16.2% |
| Total Occupied Housing Units | 136 | 100.0% |
Occupancy by Household Size in McMullin
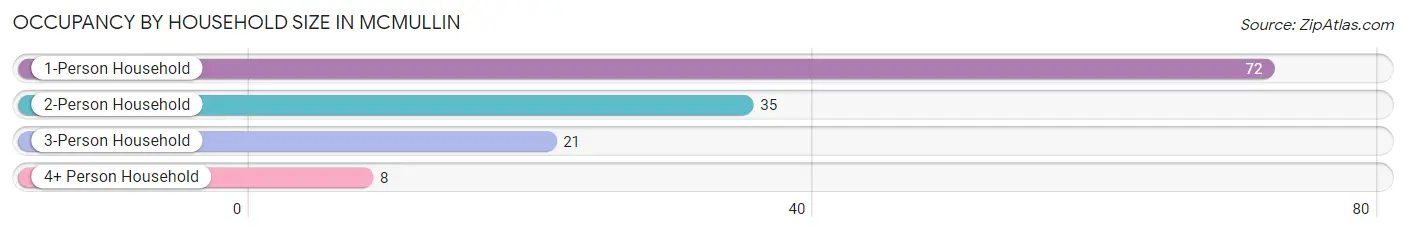
| Household Size | # Housing Units | % Housing Units |
| 1-Person Household | 72 | 52.9% |
| 2-Person Household | 35 | 25.7% |
| 3-Person Household | 21 | 15.4% |
| 4+ Person Household | 8 | 5.9% |
| Total Housing Units | 136 | 100.0% |
Occupancy by Ownership by Household Size in McMullin
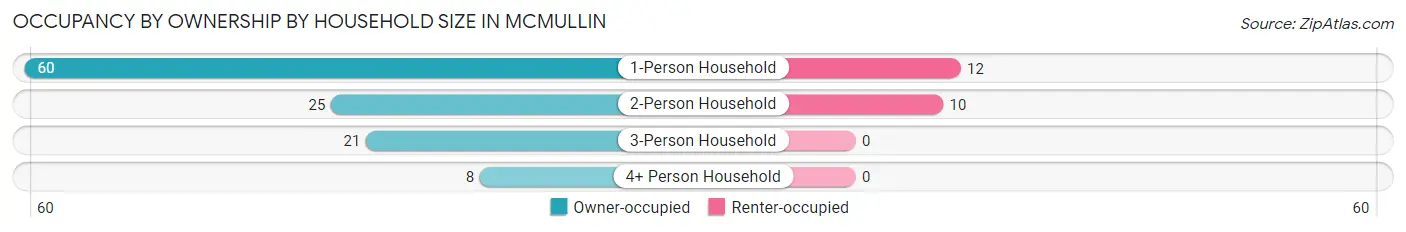
| Household Size | Owner-occupied | Renter-occupied |
| 1-Person Household | 60 (83.3%) | 12 (16.7%) |
| 2-Person Household | 25 (71.4%) | 10 (28.6%) |
| 3-Person Household | 21 (100.0%) | 0 (0.0%) |
| 4+ Person Household | 8 (100.0%) | 0 (0.0%) |
| Total Housing Units | 114 (83.8%) | 22 (16.2%) |
Occupancy by Educational Attainment in McMullin
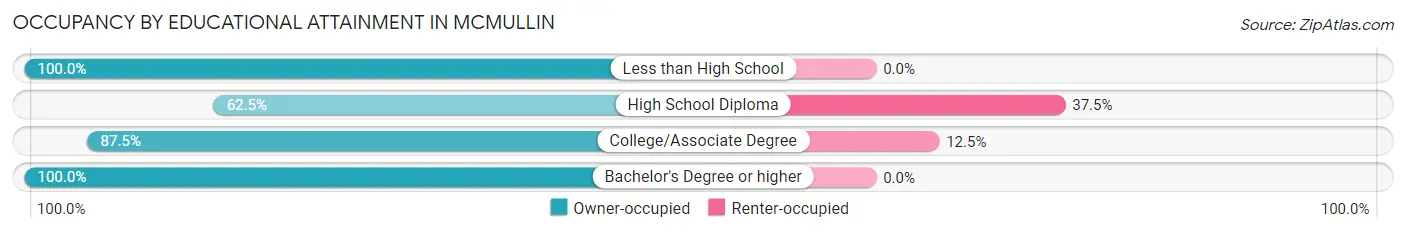
| Household Size | Owner-occupied | Renter-occupied |
| Less than High School | 14 (100.0%) | 0 (0.0%) |
| High School Diploma | 20 (62.5%) | 12 (37.5%) |
| College/Associate Degree | 70 (87.5%) | 10 (12.5%) |
| Bachelor's Degree or higher | 10 (100.0%) | 0 (0.0%) |
Occupancy by Age of Householder in McMullin
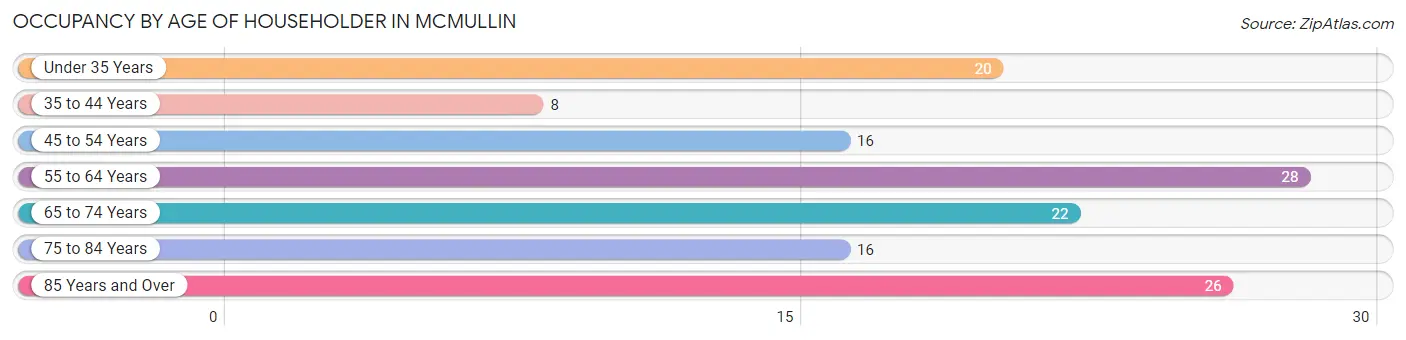
| Age Bracket | # Households | % Households |
| Under 35 Years | 20 | 14.7% |
| 35 to 44 Years | 8 | 5.9% |
| 45 to 54 Years | 16 | 11.8% |
| 55 to 64 Years | 28 | 20.6% |
| 65 to 74 Years | 22 | 16.2% |
| 75 to 84 Years | 16 | 11.8% |
| 85 Years and Over | 26 | 19.1% |
| Total | 136 | 100.0% |
Housing Finances in McMullin
Median Income by Occupancy in McMullin
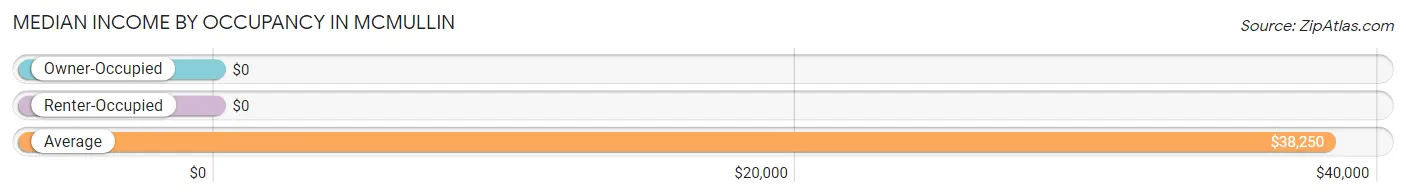
| Occupancy Type | # Households | Median Income |
| Owner-Occupied | 114 (83.8%) | $0 |
| Renter-Occupied | 22 (16.2%) | $0 |
| Average | 136 (100.0%) | $38,250 |
Occupancy by Householder Income Bracket in McMullin
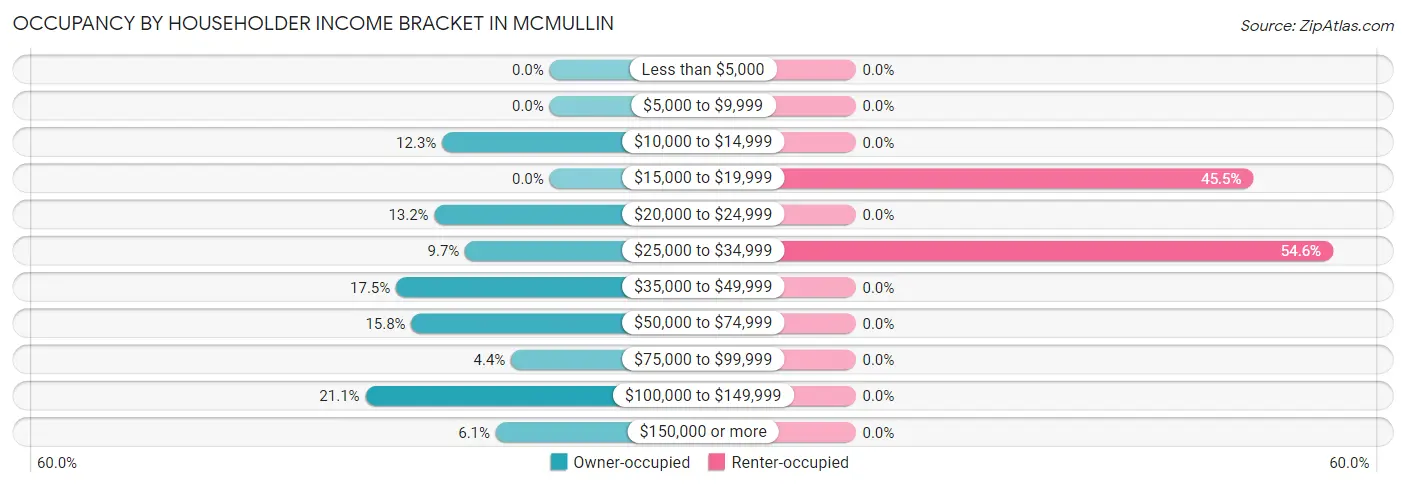
| Income Bracket | Owner-occupied | Renter-occupied |
| Less than $5,000 | 0 (0.0%) | 0 (0.0%) |
| $5,000 to $9,999 | 0 (0.0%) | 0 (0.0%) |
| $10,000 to $14,999 | 14 (12.3%) | 0 (0.0%) |
| $15,000 to $19,999 | 0 (0.0%) | 10 (45.5%) |
| $20,000 to $24,999 | 15 (13.2%) | 0 (0.0%) |
| $25,000 to $34,999 | 11 (9.7%) | 12 (54.5%) |
| $35,000 to $49,999 | 20 (17.5%) | 0 (0.0%) |
| $50,000 to $74,999 | 18 (15.8%) | 0 (0.0%) |
| $75,000 to $99,999 | 5 (4.4%) | 0 (0.0%) |
| $100,000 to $149,999 | 24 (21.0%) | 0 (0.0%) |
| $150,000 or more | 7 (6.1%) | 0 (0.0%) |
| Total | 114 (100.0%) | 22 (100.0%) |
Monthly Housing Cost Tiers in McMullin
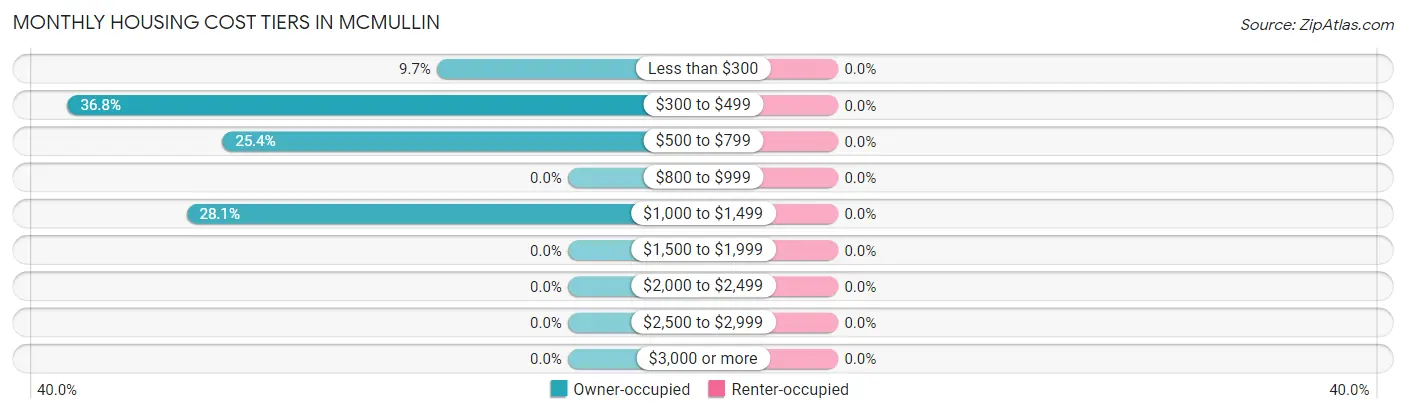
| Monthly Cost | Owner-occupied | Renter-occupied |
| Less than $300 | 11 (9.7%) | 0 (0.0%) |
| $300 to $499 | 42 (36.8%) | 0 (0.0%) |
| $500 to $799 | 29 (25.4%) | 0 (0.0%) |
| $800 to $999 | 0 (0.0%) | 0 (0.0%) |
| $1,000 to $1,499 | 32 (28.1%) | 0 (0.0%) |
| $1,500 to $1,999 | 0 (0.0%) | 0 (0.0%) |
| $2,000 to $2,499 | 0 (0.0%) | 0 (0.0%) |
| $2,500 to $2,999 | 0 (0.0%) | 0 (0.0%) |
| $3,000 or more | 0 (0.0%) | 0 (0.0%) |
| Total | 114 (100.0%) | 22 (100.0%) |
Physical Housing Characteristics in McMullin
Housing Structures in McMullin
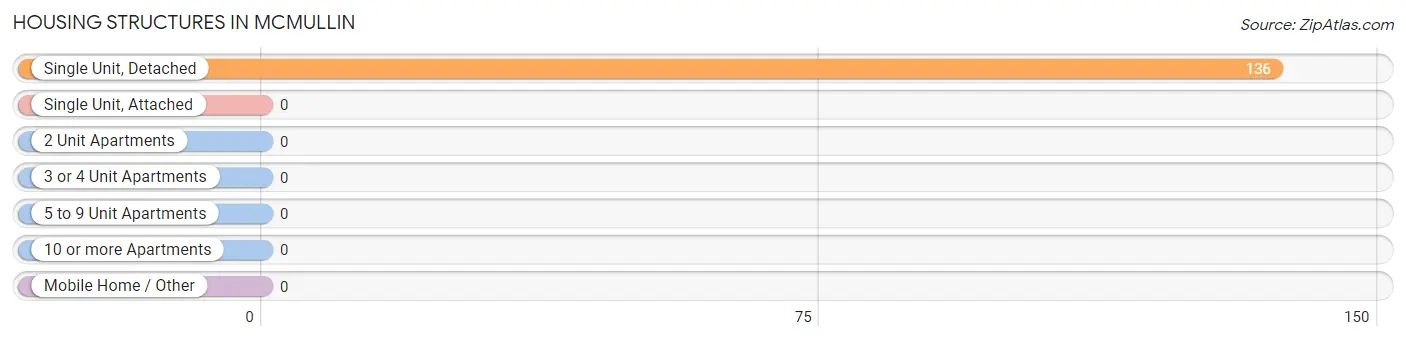
| Structure Type | # Housing Units | % Housing Units |
| Single Unit, Detached | 136 | 100.0% |
| Single Unit, Attached | 0 | 0.0% |
| 2 Unit Apartments | 0 | 0.0% |
| 3 or 4 Unit Apartments | 0 | 0.0% |
| 5 to 9 Unit Apartments | 0 | 0.0% |
| 10 or more Apartments | 0 | 0.0% |
| Mobile Home / Other | 0 | 0.0% |
| Total | 136 | 100.0% |
Housing Structures by Occupancy in McMullin
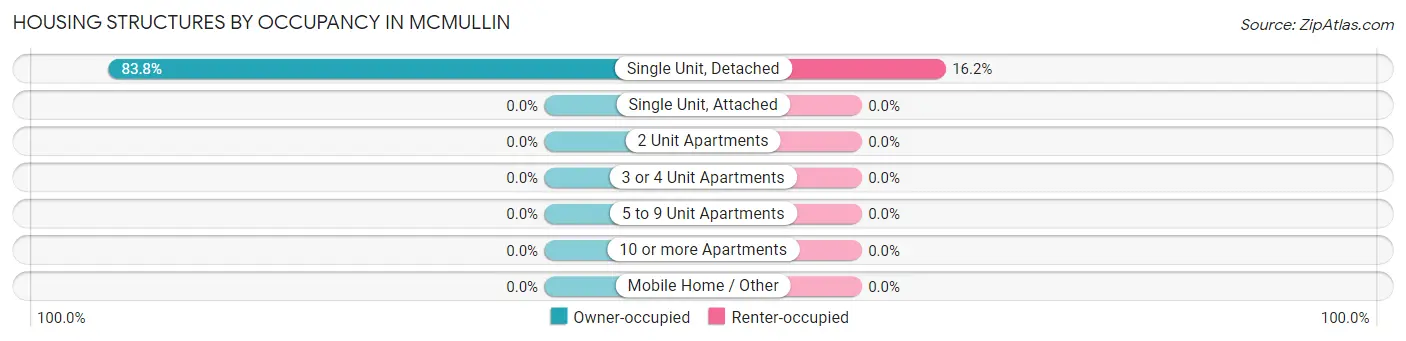
| Structure Type | Owner-occupied | Renter-occupied |
| Single Unit, Detached | 114 (83.8%) | 22 (16.2%) |
| Single Unit, Attached | 0 (0.0%) | 0 (0.0%) |
| 2 Unit Apartments | 0 (0.0%) | 0 (0.0%) |
| 3 or 4 Unit Apartments | 0 (0.0%) | 0 (0.0%) |
| 5 to 9 Unit Apartments | 0 (0.0%) | 0 (0.0%) |
| 10 or more Apartments | 0 (0.0%) | 0 (0.0%) |
| Mobile Home / Other | 0 (0.0%) | 0 (0.0%) |
| Total | 114 (83.8%) | 22 (16.2%) |
Housing Structures by Number of Rooms in McMullin
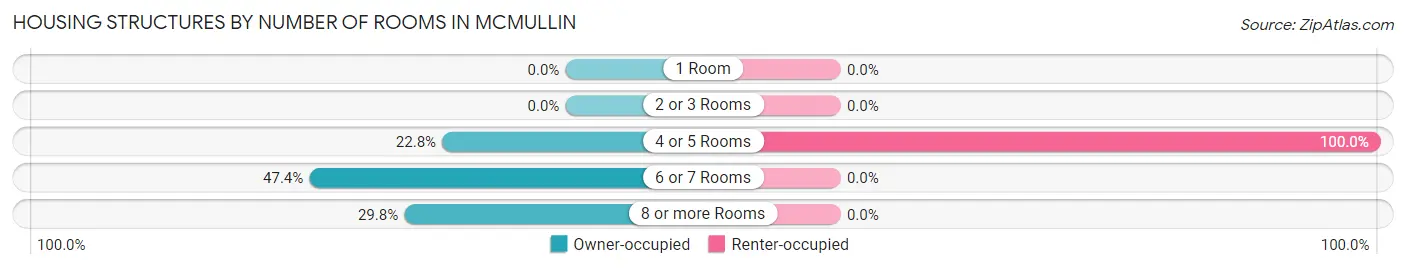
| Number of Rooms | Owner-occupied | Renter-occupied |
| 1 Room | 0 (0.0%) | 0 (0.0%) |
| 2 or 3 Rooms | 0 (0.0%) | 0 (0.0%) |
| 4 or 5 Rooms | 26 (22.8%) | 22 (100.0%) |
| 6 or 7 Rooms | 54 (47.4%) | 0 (0.0%) |
| 8 or more Rooms | 34 (29.8%) | 0 (0.0%) |
| Total | 114 (100.0%) | 22 (100.0%) |
Housing Structure by Heating Type in McMullin
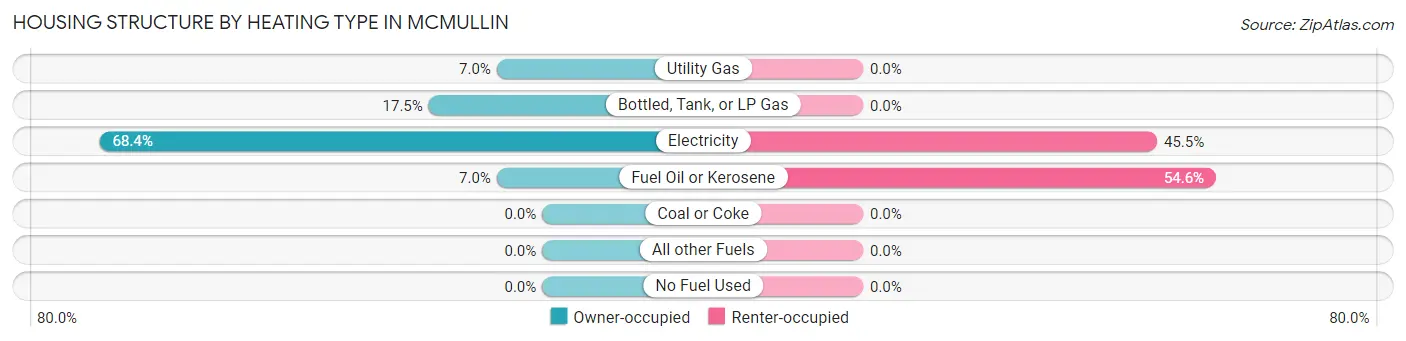
| Heating Type | Owner-occupied | Renter-occupied |
| Utility Gas | 8 (7.0%) | 0 (0.0%) |
| Bottled, Tank, or LP Gas | 20 (17.5%) | 0 (0.0%) |
| Electricity | 78 (68.4%) | 10 (45.5%) |
| Fuel Oil or Kerosene | 8 (7.0%) | 12 (54.5%) |
| Coal or Coke | 0 (0.0%) | 0 (0.0%) |
| All other Fuels | 0 (0.0%) | 0 (0.0%) |
| No Fuel Used | 0 (0.0%) | 0 (0.0%) |
| Total | 114 (100.0%) | 22 (100.0%) |
Household Vehicle Usage in McMullin
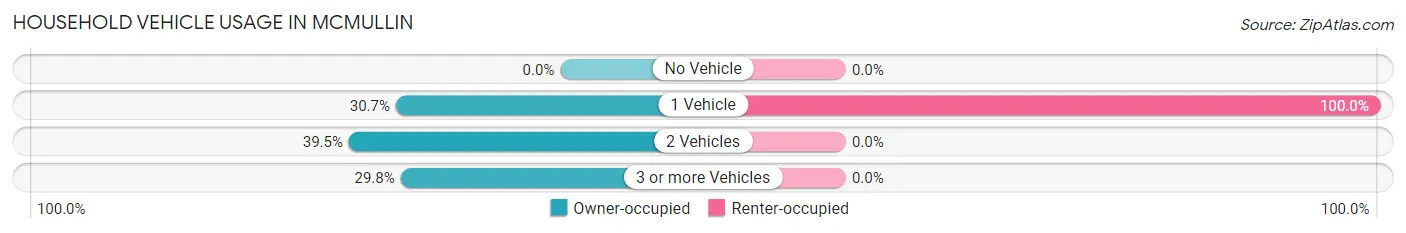
| Vehicles per Household | Owner-occupied | Renter-occupied |
| No Vehicle | 0 (0.0%) | 0 (0.0%) |
| 1 Vehicle | 35 (30.7%) | 22 (100.0%) |
| 2 Vehicles | 45 (39.5%) | 0 (0.0%) |
| 3 or more Vehicles | 34 (29.8%) | 0 (0.0%) |
| Total | 114 (100.0%) | 22 (100.0%) |
Real Estate & Mortgages in McMullin
Real Estate and Mortgage Overview in McMullin
| Characteristic | Without Mortgage | With Mortgage |
| Housing Units | 49 | 65 |
| Median Property Value | $117,200 | $139,900 |
| Median Household Income | $25,568 | $7 |
| Monthly Housing Costs | $454 | $0 |
| Real Estate Taxes | $710 | $10 |
Property Value by Mortgage Status in McMullin
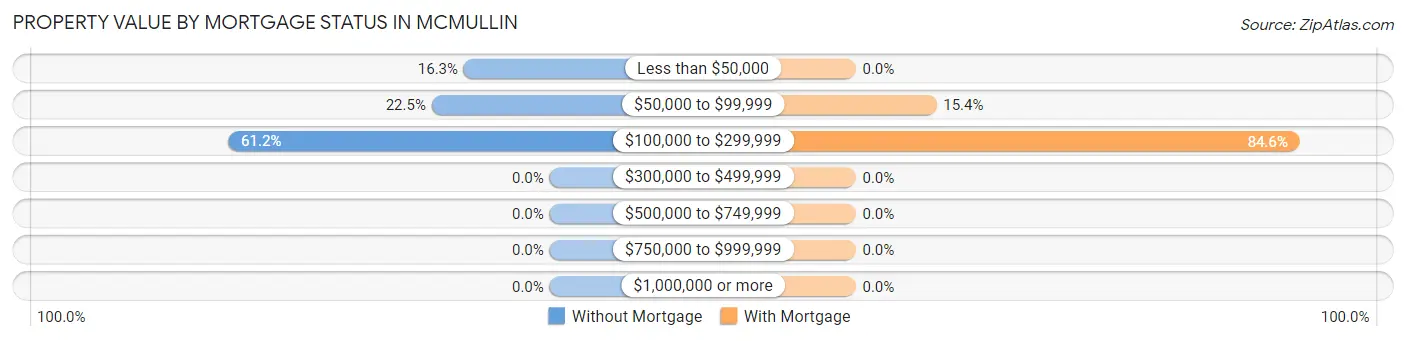
| Property Value | Without Mortgage | With Mortgage |
| Less than $50,000 | 8 (16.3%) | 0 (0.0%) |
| $50,000 to $99,999 | 11 (22.5%) | 10 (15.4%) |
| $100,000 to $299,999 | 30 (61.2%) | 55 (84.6%) |
| $300,000 to $499,999 | 0 (0.0%) | 0 (0.0%) |
| $500,000 to $749,999 | 0 (0.0%) | 0 (0.0%) |
| $750,000 to $999,999 | 0 (0.0%) | 0 (0.0%) |
| $1,000,000 or more | 0 (0.0%) | 0 (0.0%) |
| Total | 49 (100.0%) | 65 (100.0%) |
Household Income by Mortgage Status in McMullin
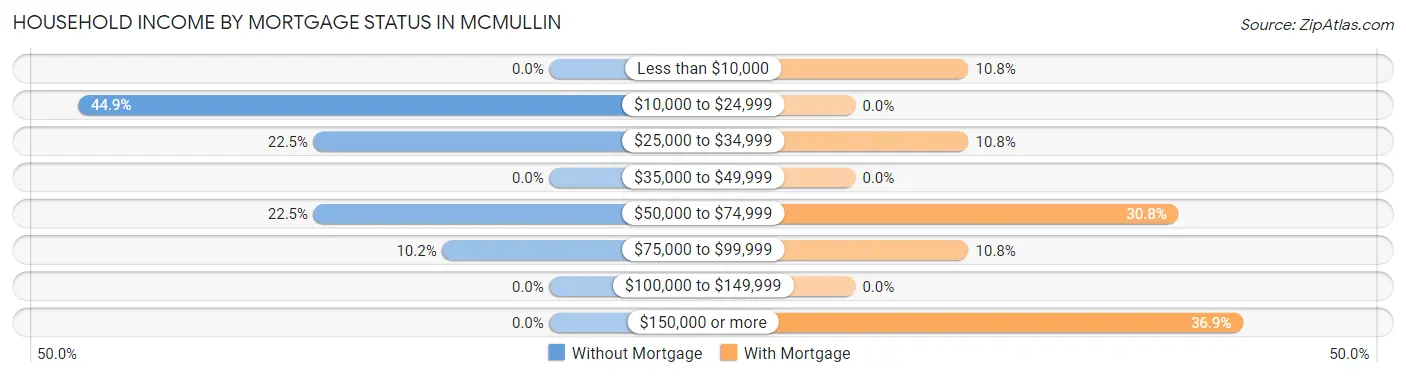
| Household Income | Without Mortgage | With Mortgage |
| Less than $10,000 | 0 (0.0%) | 7 (10.8%) |
| $10,000 to $24,999 | 22 (44.9%) | 0 (0.0%) |
| $25,000 to $34,999 | 11 (22.5%) | 7 (10.8%) |
| $35,000 to $49,999 | 0 (0.0%) | 0 (0.0%) |
| $50,000 to $74,999 | 11 (22.5%) | 20 (30.8%) |
| $75,000 to $99,999 | 5 (10.2%) | 7 (10.8%) |
| $100,000 to $149,999 | 0 (0.0%) | 0 (0.0%) |
| $150,000 or more | 0 (0.0%) | 24 (36.9%) |
| Total | 49 (100.0%) | 65 (100.0%) |
Property Value to Household Income Ratio in McMullin
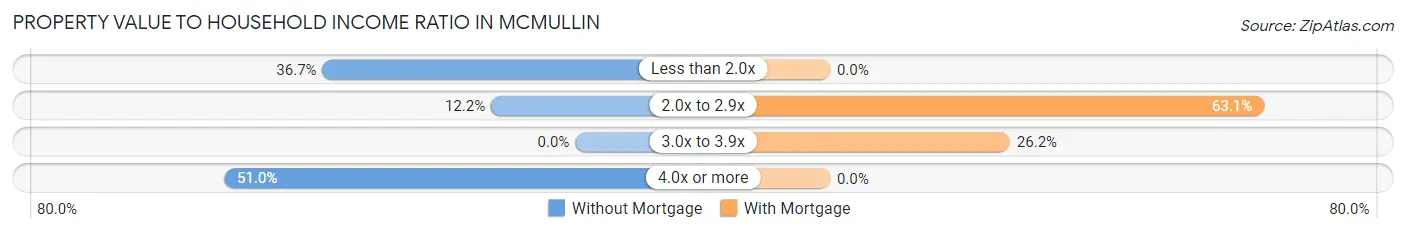
| Value-to-Income Ratio | Without Mortgage | With Mortgage |
| Less than 2.0x | 18 (36.7%) | 0 (0.0%) |
| 2.0x to 2.9x | 6 (12.2%) | 41 (63.1%) |
| 3.0x to 3.9x | 0 (0.0%) | 17 (26.2%) |
| 4.0x or more | 25 (51.0%) | 0 (0.0%) |
| Total | 49 (100.0%) | 65 (100.0%) |
Real Estate Taxes by Mortgage Status in McMullin
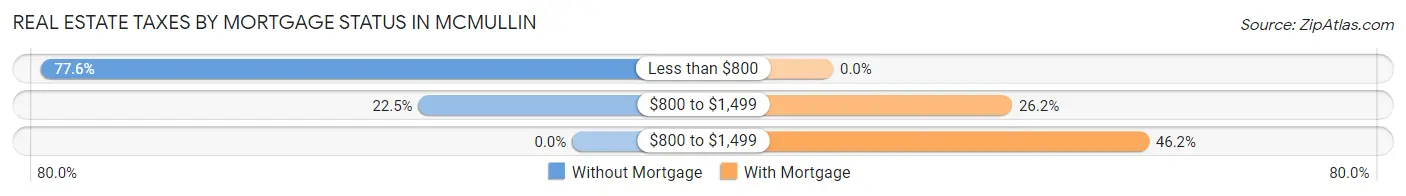
| Property Taxes | Without Mortgage | With Mortgage |
| Less than $800 | 38 (77.5%) | 0 (0.0%) |
| $800 to $1,499 | 11 (22.5%) | 17 (26.2%) |
| $800 to $1,499 | 0 (0.0%) | 30 (46.2%) |
| Total | 49 (100.0%) | 65 (100.0%) |
Health & Disability in McMullin
Health Insurance Coverage by Age in McMullin
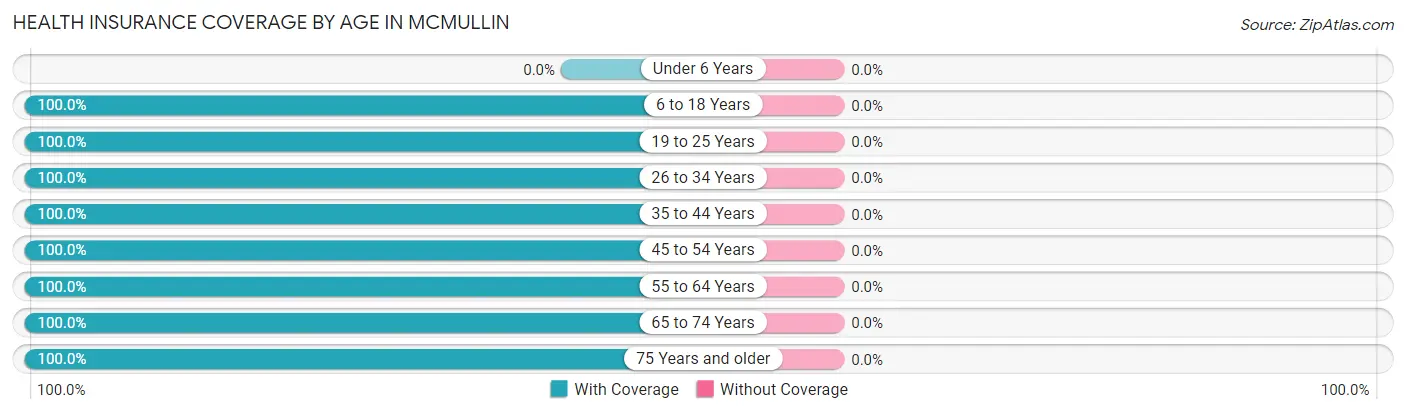
| Age Bracket | With Coverage | Without Coverage |
| Under 6 Years | 0 (0.0%) | 0 (0.0%) |
| 6 to 18 Years | 10 (100.0%) | 0 (0.0%) |
| 19 to 25 Years | 45 (100.0%) | 0 (0.0%) |
| 26 to 34 Years | 10 (100.0%) | 0 (0.0%) |
| 35 to 44 Years | 22 (100.0%) | 0 (0.0%) |
| 45 to 54 Years | 24 (100.0%) | 0 (0.0%) |
| 55 to 64 Years | 55 (100.0%) | 0 (0.0%) |
| 65 to 74 Years | 32 (100.0%) | 0 (0.0%) |
| 75 Years and older | 42 (100.0%) | 0 (0.0%) |
| Total | 240 (100.0%) | 0 (0.0%) |
Health Insurance Coverage by Citizenship Status in McMullin
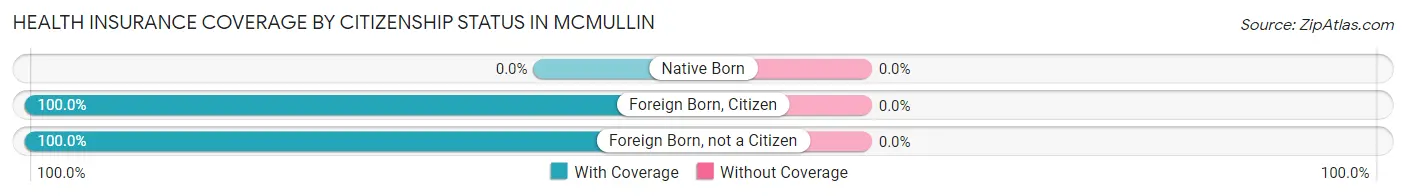
| Citizenship Status | With Coverage | Without Coverage |
| Native Born | 0 (0.0%) | 0 (0.0%) |
| Foreign Born, Citizen | 10 (100.0%) | 0 (0.0%) |
| Foreign Born, not a Citizen | 45 (100.0%) | 0 (0.0%) |
Health Insurance Coverage by Household Income in McMullin
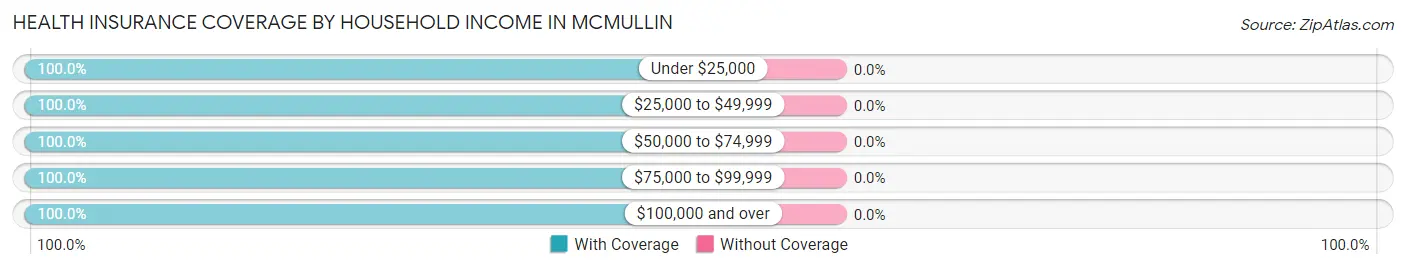
| Household Income | With Coverage | Without Coverage |
| Under $25,000 | 55 (100.0%) | 0 (0.0%) |
| $25,000 to $49,999 | 43 (100.0%) | 0 (0.0%) |
| $50,000 to $74,999 | 28 (100.0%) | 0 (0.0%) |
| $75,000 to $99,999 | 17 (100.0%) | 0 (0.0%) |
| $100,000 and over | 97 (100.0%) | 0 (0.0%) |
Public vs Private Health Insurance Coverage by Age in McMullin
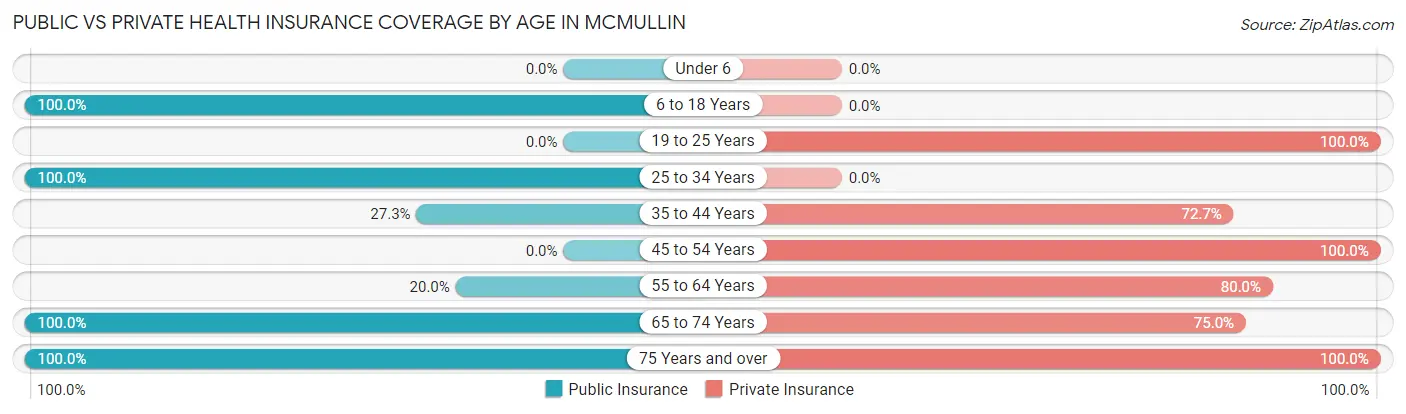
| Age Bracket | Public Insurance | Private Insurance |
| Under 6 | 0 (0.0%) | 0 (0.0%) |
| 6 to 18 Years | 10 (100.0%) | 0 (0.0%) |
| 19 to 25 Years | 0 (0.0%) | 45 (100.0%) |
| 25 to 34 Years | 10 (100.0%) | 0 (0.0%) |
| 35 to 44 Years | 6 (27.3%) | 16 (72.7%) |
| 45 to 54 Years | 0 (0.0%) | 24 (100.0%) |
| 55 to 64 Years | 11 (20.0%) | 44 (80.0%) |
| 65 to 74 Years | 32 (100.0%) | 24 (75.0%) |
| 75 Years and over | 42 (100.0%) | 42 (100.0%) |
| Total | 111 (46.3%) | 195 (81.2%) |
Disability Status by Sex by Age in McMullin
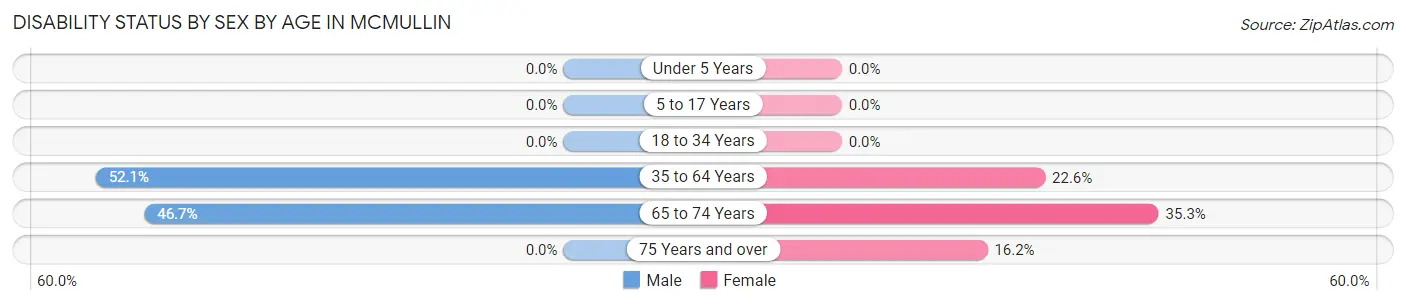
| Age Bracket | Male | Female |
| Under 5 Years | 0 (0.0%) | 0 (0.0%) |
| 5 to 17 Years | 0 (0.0%) | 0 (0.0%) |
| 18 to 34 Years | 0 (0.0%) | 0 (0.0%) |
| 35 to 64 Years | 25 (52.1%) | 12 (22.6%) |
| 65 to 74 Years | 7 (46.7%) | 6 (35.3%) |
| 75 Years and over | 0 (0.0%) | 6 (16.2%) |
Disability Class by Sex by Age in McMullin
Disability Class: Hearing Difficulty
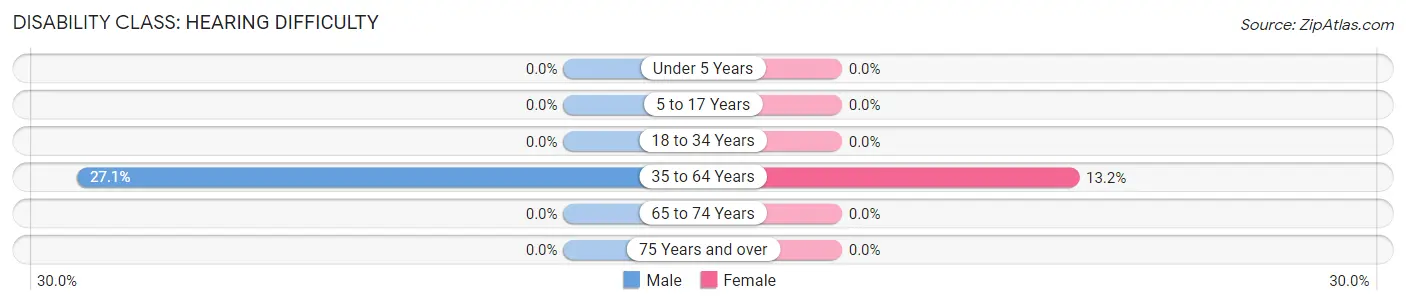
| Age Bracket | Male | Female |
| Under 5 Years | 0 (0.0%) | 0 (0.0%) |
| 5 to 17 Years | 0 (0.0%) | 0 (0.0%) |
| 18 to 34 Years | 0 (0.0%) | 0 (0.0%) |
| 35 to 64 Years | 13 (27.1%) | 7 (13.2%) |
| 65 to 74 Years | 0 (0.0%) | 0 (0.0%) |
| 75 Years and over | 0 (0.0%) | 0 (0.0%) |
Disability Class: Vision Difficulty
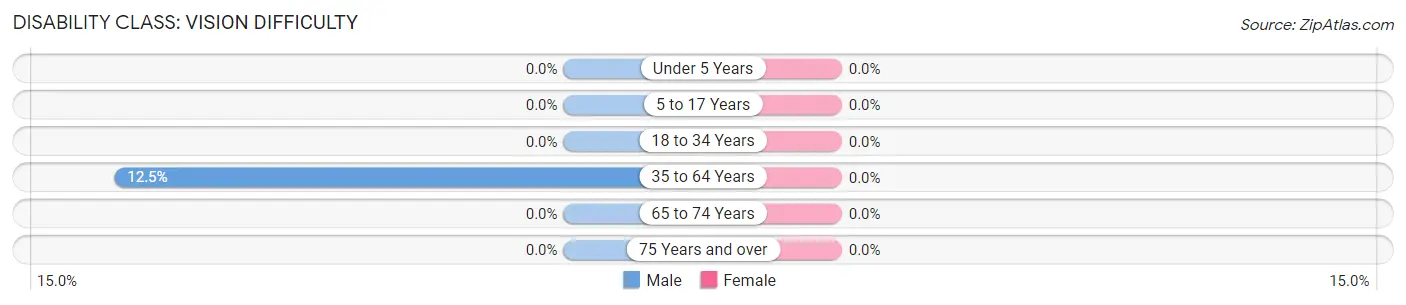
| Age Bracket | Male | Female |
| Under 5 Years | 0 (0.0%) | 0 (0.0%) |
| 5 to 17 Years | 0 (0.0%) | 0 (0.0%) |
| 18 to 34 Years | 0 (0.0%) | 0 (0.0%) |
| 35 to 64 Years | 6 (12.5%) | 0 (0.0%) |
| 65 to 74 Years | 0 (0.0%) | 0 (0.0%) |
| 75 Years and over | 0 (0.0%) | 0 (0.0%) |
Disability Class: Cognitive Difficulty
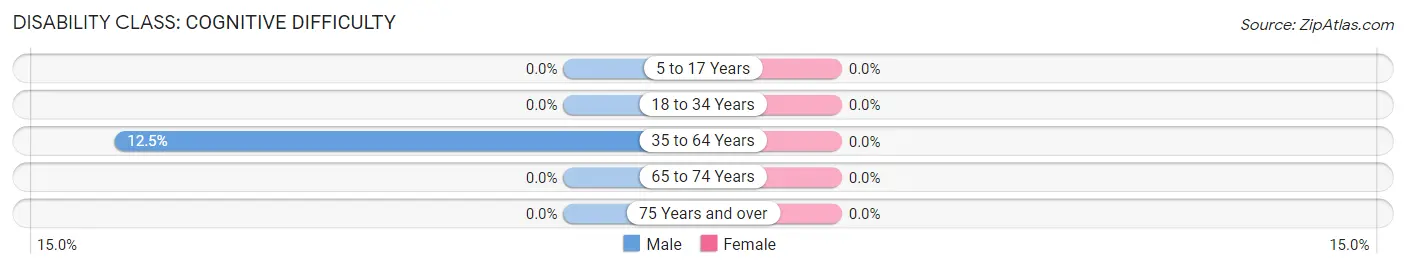
| Age Bracket | Male | Female |
| 5 to 17 Years | 0 (0.0%) | 0 (0.0%) |
| 18 to 34 Years | 0 (0.0%) | 0 (0.0%) |
| 35 to 64 Years | 6 (12.5%) | 0 (0.0%) |
| 65 to 74 Years | 0 (0.0%) | 0 (0.0%) |
| 75 Years and over | 0 (0.0%) | 0 (0.0%) |
Disability Class: Ambulatory Difficulty
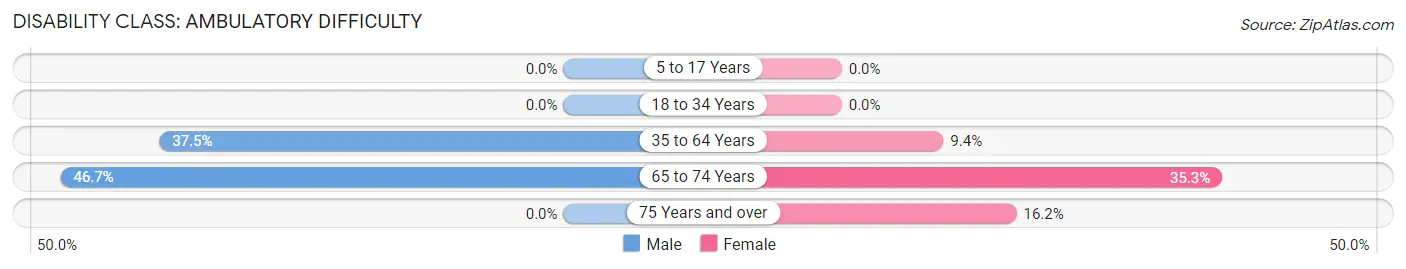
| Age Bracket | Male | Female |
| 5 to 17 Years | 0 (0.0%) | 0 (0.0%) |
| 18 to 34 Years | 0 (0.0%) | 0 (0.0%) |
| 35 to 64 Years | 18 (37.5%) | 5 (9.4%) |
| 65 to 74 Years | 7 (46.7%) | 6 (35.3%) |
| 75 Years and over | 0 (0.0%) | 6 (16.2%) |
Disability Class: Self-Care Difficulty
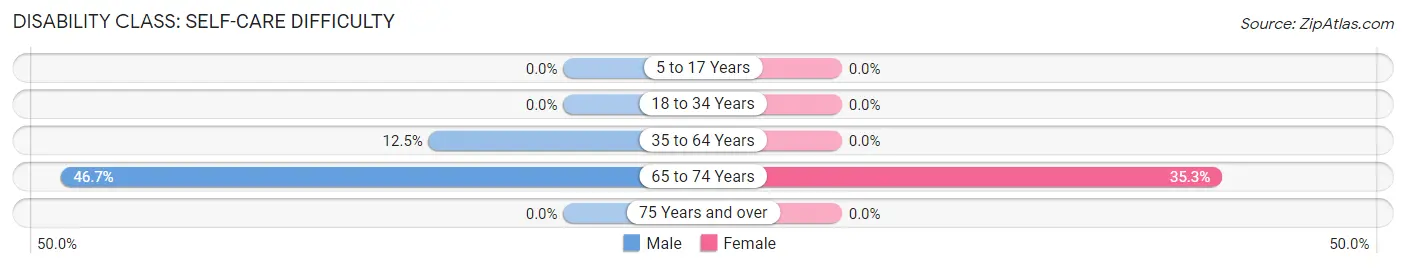
| Age Bracket | Male | Female |
| 5 to 17 Years | 0 (0.0%) | 0 (0.0%) |
| 18 to 34 Years | 0 (0.0%) | 0 (0.0%) |
| 35 to 64 Years | 6 (12.5%) | 0 (0.0%) |
| 65 to 74 Years | 7 (46.7%) | 6 (35.3%) |
| 75 Years and over | 0 (0.0%) | 0 (0.0%) |
Technology Access in McMullin
Computing Device Access in McMullin
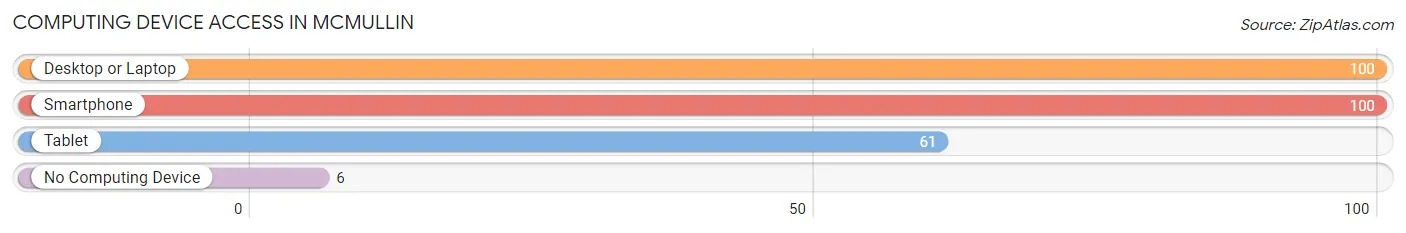
| Device Type | # Households | % Households |
| Desktop or Laptop | 100 | 73.5% |
| Smartphone | 100 | 73.5% |
| Tablet | 61 | 44.9% |
| No Computing Device | 6 | 4.4% |
| Total | 136 | 100.0% |
Internet Access in McMullin
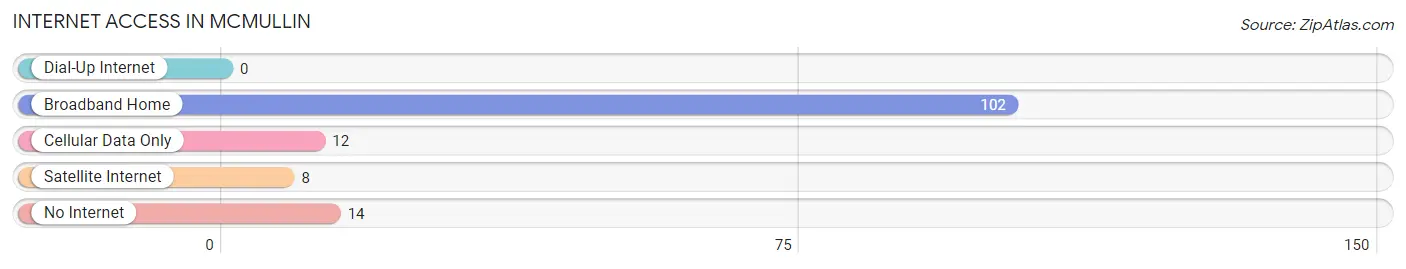
| Internet Type | # Households | % Households |
| Dial-Up Internet | 0 | 0.0% |
| Broadband Home | 102 | 75.0% |
| Cellular Data Only | 12 | 8.8% |
| Satellite Internet | 8 | 5.9% |
| No Internet | 14 | 10.3% |
| Total | 136 | 100.0% |
McMullin Summary
Mcmullin, Virginia is a small town located in the Appalachian Mountains of Southwest Virginia. It is situated in the county of Tazewell, and is part of the Blue Ridge Mountains. The town is located in a rural area, and is home to a population of just over 500 people.
History
Mcmullin, Virginia was first settled in the late 1700s by a group of settlers from North Carolina. The town was originally known as “McMullin’s Crossroads”, and was named after the family of William McMullin, who was one of the first settlers. The town was officially incorporated in 1891, and was named after the McMullin family.
Geography
Mcmullin, Virginia is located in the Appalachian Mountains of Southwest Virginia. The town is situated in the county of Tazewell, and is part of the Blue Ridge Mountains. The town is located in a rural area, and is surrounded by mountains and forests. The town is located at an elevation of 1,890 feet above sea level.
Economy
Mcmullin, Virginia has a small economy that is largely based on agriculture and tourism. The town is home to several small businesses, including a general store, a gas station, and a few restaurants. The town also has a few small manufacturing businesses, such as a furniture factory and a woodworking shop. The town is also home to a few small farms, which produce a variety of crops, including corn, soybeans, and hay.
Demographics
As of the 2010 census, the population of Mcmullin, Virginia was 514 people. The town is predominantly white, with 95.3% of the population being white. The town also has a small African American population, with 2.7% of the population being African American. The town also has a small Hispanic population, with 1.2% of the population being Hispanic. The median household income in the town is $30,000, and the median home value is $90,000.
Mcmullin, Virginia is a small town with a rich history and a unique culture. The town is home to a diverse population, and is a great place to live and work. The town is surrounded by beautiful mountains and forests, and is a great place to explore and enjoy the outdoors. The town is also home to a variety of businesses, and is a great place to start a business or find employment.
Common Questions
What is Per Capita Income in McMullin?
Per Capita income in McMullin is $34,901.
What is the Median Family Income in McMullin?
Median Family Income in McMullin is $89,500.
What is the Median Household income in McMullin?
Median Household Income in McMullin is $38,250.
What is Income or Wage Gap in McMullin?
Income or Wage Gap in McMullin is 2.8%.
Women in McMullin earn 97.2 cents for every dollar earned by a man.
What is Inequality or Gini Index in McMullin?
Inequality or Gini Index in McMullin is 0.43.
What is the Total Population of McMullin?
Total Population of McMullin is 240.
What is the Total Male Population of McMullin?
Total Male Population of McMullin is 117.
What is the Total Female Population of McMullin?
Total Female Population of McMullin is 123.
What is the Ratio of Males per 100 Females in McMullin?
There are 95.12 Males per 100 Females in McMullin.
What is the Ratio of Females per 100 Males in McMullin?
There are 105.13 Females per 100 Males in McMullin.
What is the Median Population Age in McMullin?
Median Population Age in McMullin is 56.6 Years.
What is the Average Family Size in McMullin
Average Family Size in McMullin is 2.6 People.
What is the Average Household Size in McMullin
Average Household Size in McMullin is 1.8 People.
How Large is the Labor Force in McMullin?
There are 148 People in the Labor Forcein in McMullin.
What is the Percentage of People in the Labor Force in McMullin?
64.3% of People are in the Labor Force in McMullin.