Zip Codes with the Highest Percentage of Population Employed in Architecture & Engineering in Winchester, VA
RELATED REPORTS & OPTIONS
Architecture & Engineering
Winchester
Compare Zip Codes
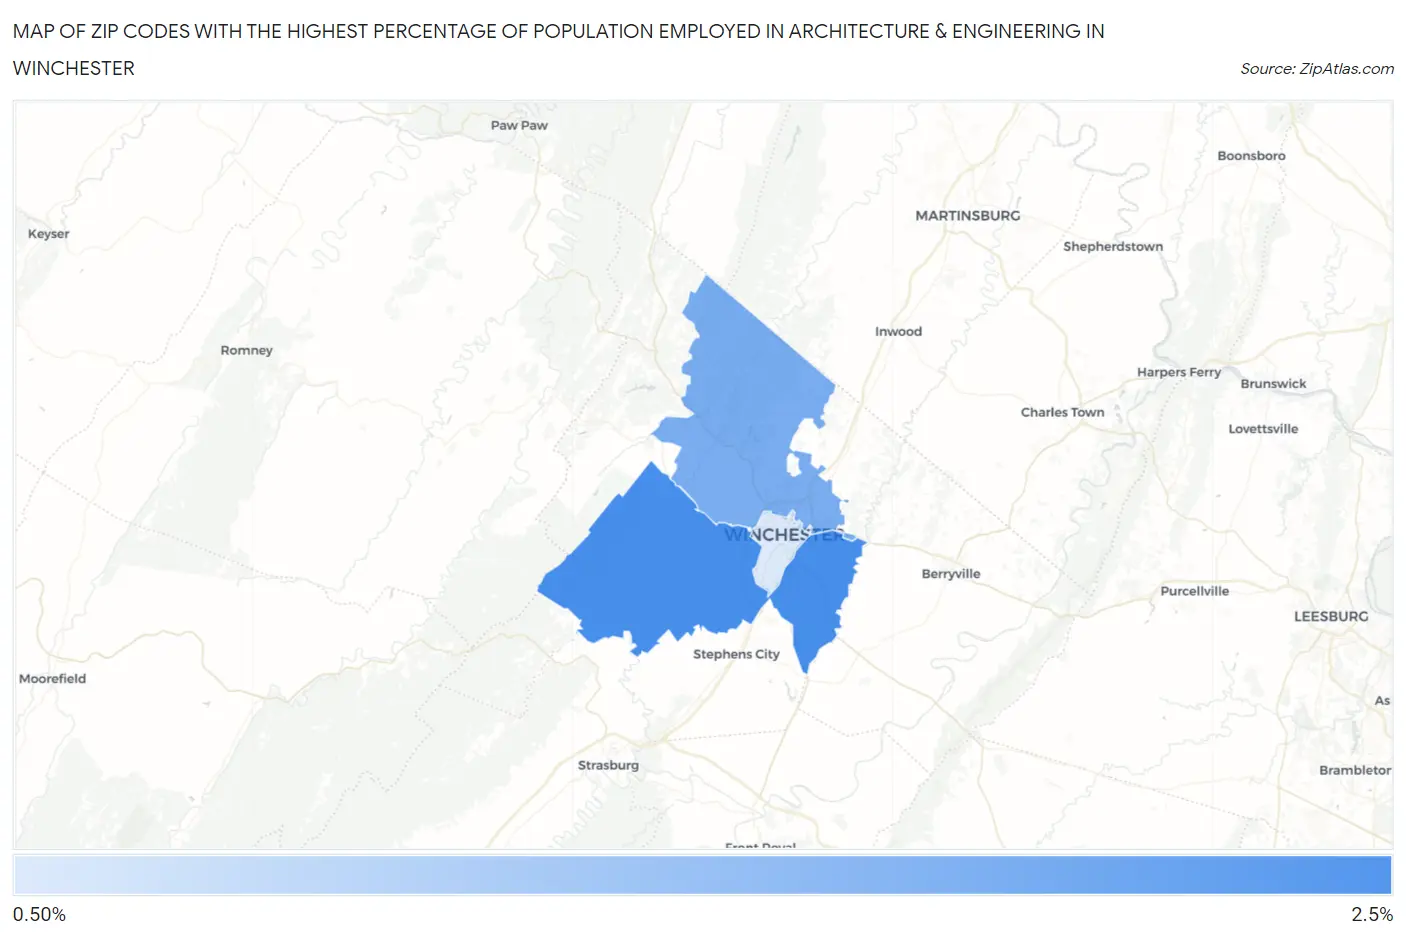
Map of Zip Codes with the Highest Percentage of Population Employed in Architecture & Engineering in Winchester
1.3%
2.2%
Zip Codes with the Highest Percentage of Population Employed in Architecture & Engineering in Winchester, VA
| Zip Code | % Employed | vs State | vs National | |
| 1. | 22602 | 2.2% | 2.3%(-0.083)#242 | 2.1%(+0.073)#8,367 |
| 2. | 22603 | 1.9% | 2.3%(-0.409)#298 | 2.1%(-0.253)#10,270 |
| 3. | 22601 | 1.3% | 2.3%(-1.04)#399 | 2.1%(-0.886)#14,579 |
1
Common Questions
What are the Top Zip Codes with the Highest Percentage of Population Employed in Architecture & Engineering in Winchester, VA?
Top Zip Codes with the Highest Percentage of Population Employed in Architecture & Engineering in Winchester, VA are:
What zip code has the Highest Percentage of Population Employed in Architecture & Engineering in Winchester, VA?
22602 has the Highest Percentage of Population Employed in Architecture & Engineering in Winchester, VA with 2.2%.
What is the Percentage of Population Employed in Architecture & Engineering in Winchester, VA?
Percentage of Population Employed in Architecture & Engineering in Winchester is 1.1%.
What is the Percentage of Population Employed in Architecture & Engineering in Virginia?
Percentage of Population Employed in Architecture & Engineering in Virginia is 2.3%.
What is the Percentage of Population Employed in Architecture & Engineering in the United States?
Percentage of Population Employed in Architecture & Engineering in the United States is 2.1%.