Zip Codes with the Highest Percentage of Population Employed in Architecture & Engineering in Midlothian, VA
RELATED REPORTS & OPTIONS
Architecture & Engineering
Midlothian
Compare Zip Codes
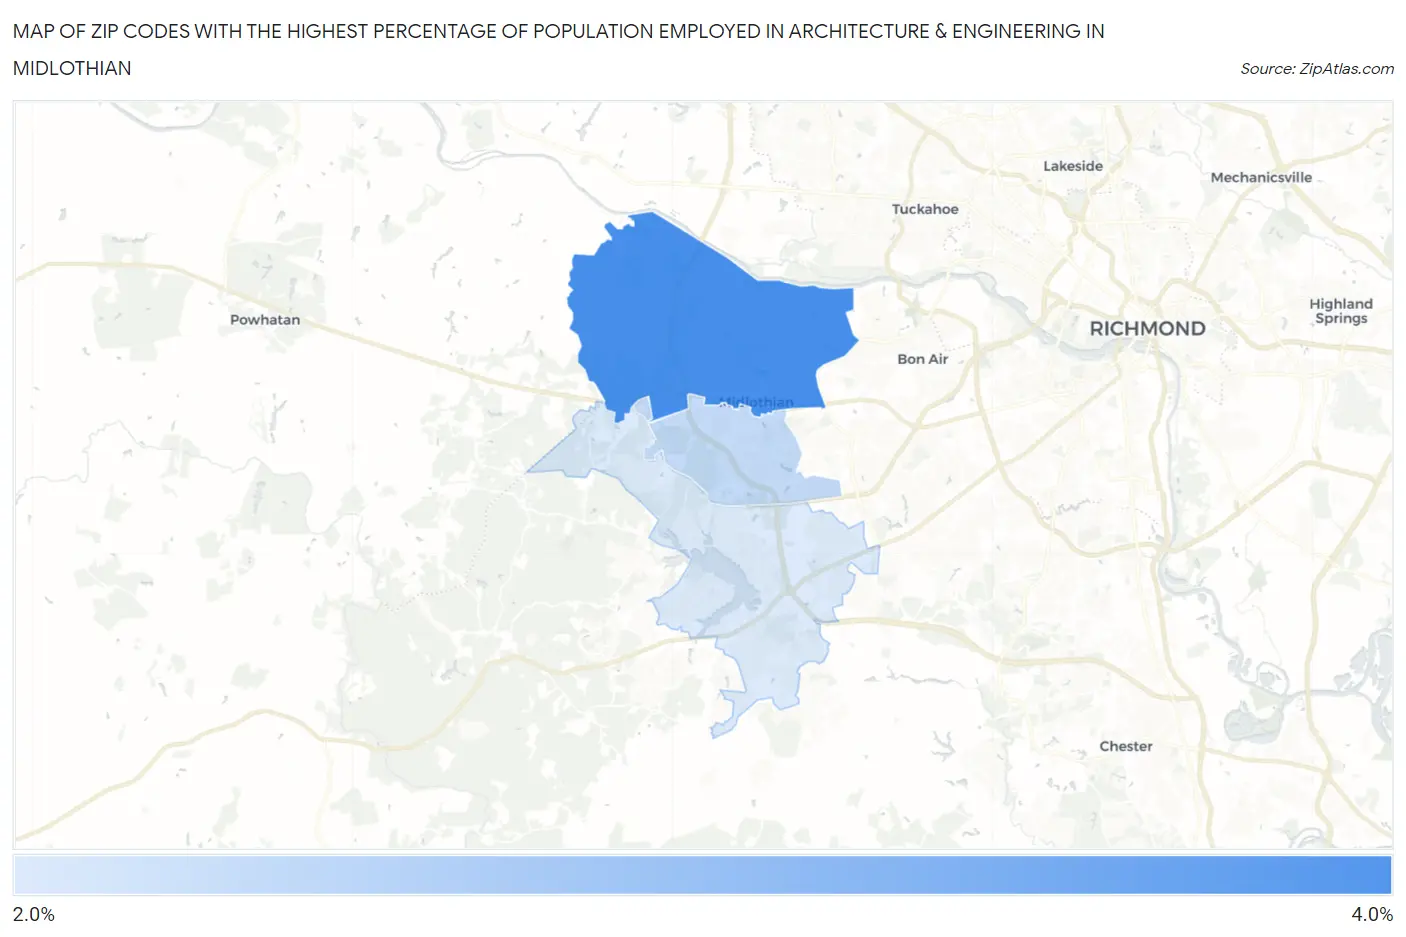
Map of Zip Codes with the Highest Percentage of Population Employed in Architecture & Engineering in Midlothian
2.6%
3.4%
Zip Codes with the Highest Percentage of Population Employed in Architecture & Engineering in Midlothian, VA
| Zip Code | % Employed | vs State | vs National | |
| 1. | 23113 | 3.4% | 2.3%(+1.13)#122 | 2.1%(+1.28)#3,899 |
| 2. | 23114 | 2.7% | 2.3%(+0.421)#175 | 2.1%(+0.577)#6,062 |
| 3. | 23112 | 2.6% | 2.3%(+0.279)#194 | 2.1%(+0.434)#6,650 |
1
Common Questions
What are the Top Zip Codes with the Highest Percentage of Population Employed in Architecture & Engineering in Midlothian, VA?
Top Zip Codes with the Highest Percentage of Population Employed in Architecture & Engineering in Midlothian, VA are:
What zip code has the Highest Percentage of Population Employed in Architecture & Engineering in Midlothian, VA?
23113 has the Highest Percentage of Population Employed in Architecture & Engineering in Midlothian, VA with 3.4%.
What is the Percentage of Population Employed in Architecture & Engineering in Midlothian, VA?
Percentage of Population Employed in Architecture & Engineering in Midlothian is 2.6%.
What is the Percentage of Population Employed in Architecture & Engineering in Virginia?
Percentage of Population Employed in Architecture & Engineering in Virginia is 2.3%.
What is the Percentage of Population Employed in Architecture & Engineering in the United States?
Percentage of Population Employed in Architecture & Engineering in the United States is 2.1%.