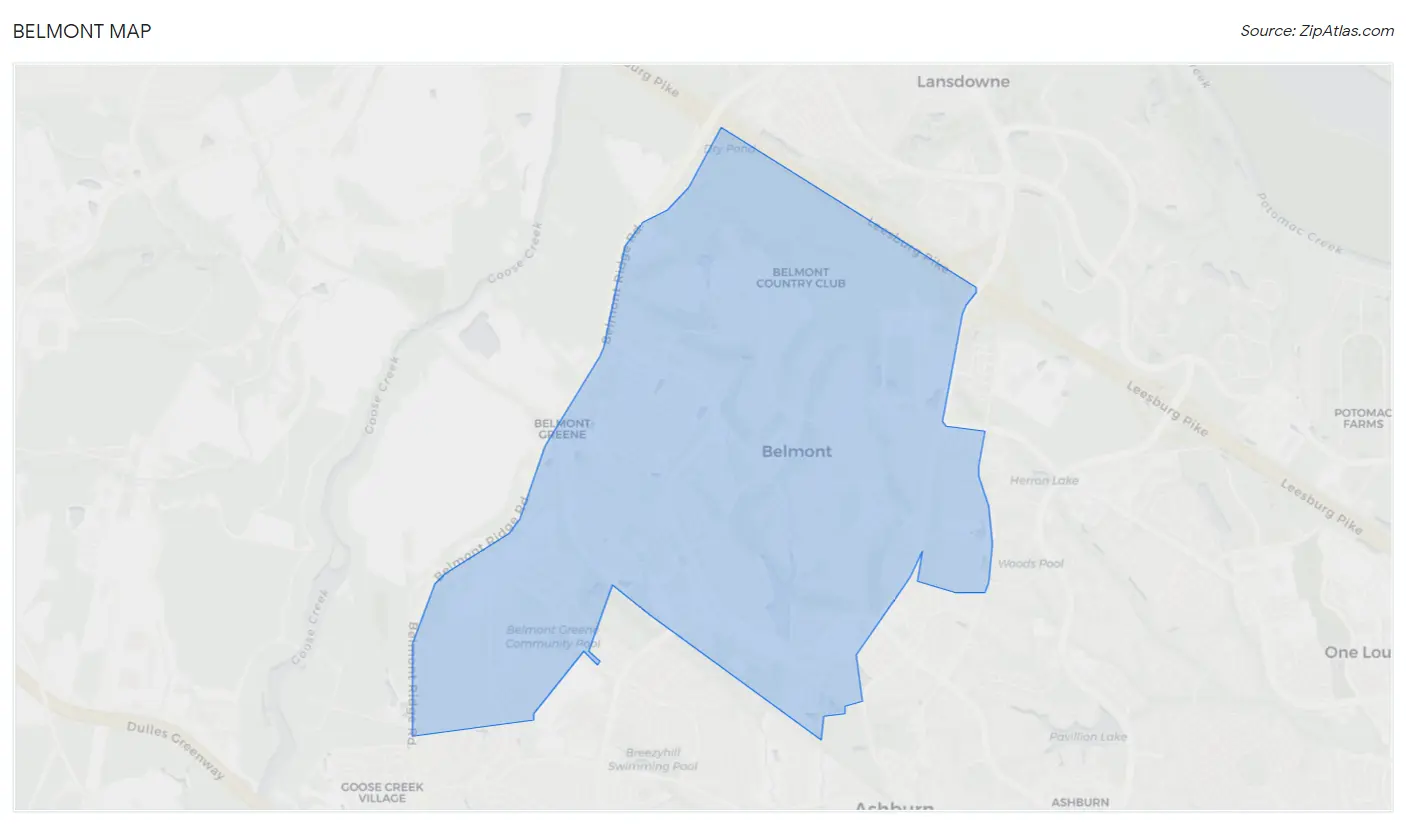
Belmont, VA Map & Demographics
Belmont Map
Belmont Overview
$79,584
PER CAPITA INCOME
$234,167
AVG FAMILY INCOME
$212,159
AVG HOUSEHOLD INCOME
42.1%
WAGE / INCOME GAP [ % ]
57.9¢/ $1
WAGE / INCOME GAP [ $ ]
0.35
INEQUALITY / GINI INDEX
9,888
TOTAL POPULATION
5,040
MALE POPULATION
4,848
FEMALE POPULATION
103.96
MALES / 100 FEMALES
96.19
FEMALES / 100 MALES
38.6
MEDIAN AGE
3.5
AVG FAMILY SIZE
3.2
AVG HOUSEHOLD SIZE
5,636
LABOR FORCE [ PEOPLE ]
76.8%
PERCENT IN LABOR FORCE
3.3%
UNEMPLOYMENT RATE
Income in Belmont
Income Overview in Belmont
Per Capita Income in Belmont is $79,584, while median incomes of families and households are $234,167 and $212,159 respectively.
| Characteristic | Number | Measure |
| Per Capita Income | 9,888 | $79,584 |
| Median Family Income | 2,638 | $234,167 |
| Mean Family Income | 2,638 | $268,275 |
| Median Household Income | 3,132 | $212,159 |
| Mean Household Income | 3,132 | $247,927 |
| Income Deficit | 2,638 | $0 |
| Wage / Income Gap (%) | 9,888 | 42.08% |
| Wage / Income Gap ($) | 9,888 | 57.92¢ per $1 |
| Gini / Inequality Index | 9,888 | 0.35 |
Earnings by Sex in Belmont
Average Earnings in Belmont are $102,985, $135,230 for men and $78,322 for women, a difference of 42.1%.
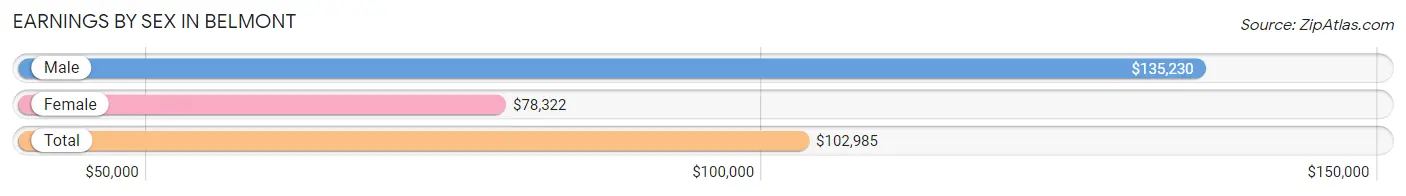
| Sex | Number | Average Earnings |
| Male | 3,330 (57.4%) | $135,230 |
| Female | 2,473 (42.6%) | $78,322 |
| Total | 5,803 (100.0%) | $102,985 |
Earnings by Sex by Income Bracket in Belmont
The most common earnings brackets in Belmont are $100,000+ for men (2,048 | 61.5%) and $100,000+ for women (924 | 37.4%).
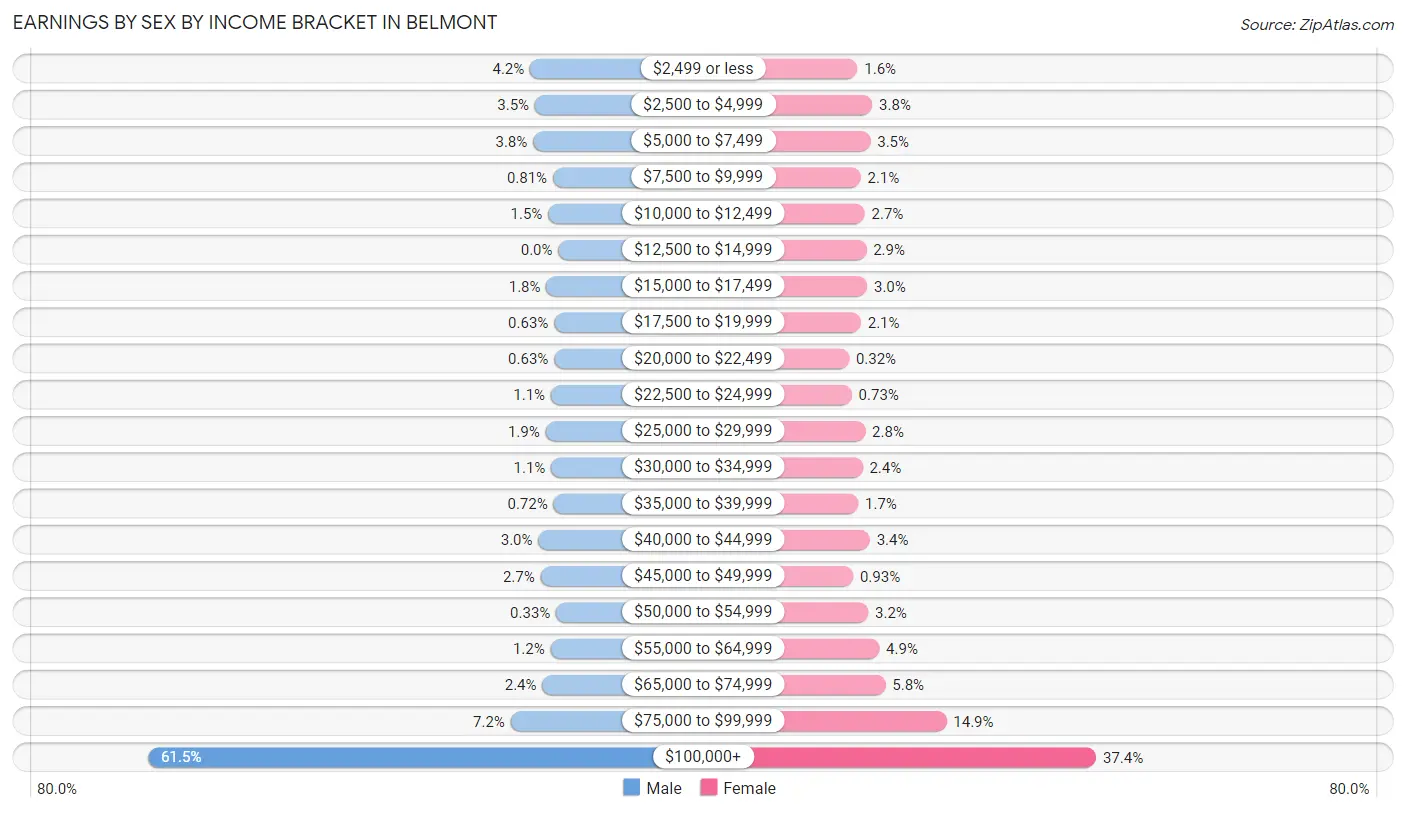
| Income | Male | Female |
| $2,499 or less | 141 (4.2%) | 39 (1.6%) |
| $2,500 to $4,999 | 117 (3.5%) | 94 (3.8%) |
| $5,000 to $7,499 | 126 (3.8%) | 87 (3.5%) |
| $7,500 to $9,999 | 27 (0.8%) | 51 (2.1%) |
| $10,000 to $12,499 | 51 (1.5%) | 66 (2.7%) |
| $12,500 to $14,999 | 0 (0.0%) | 72 (2.9%) |
| $15,000 to $17,499 | 60 (1.8%) | 75 (3.0%) |
| $17,500 to $19,999 | 21 (0.6%) | 52 (2.1%) |
| $20,000 to $22,499 | 21 (0.6%) | 8 (0.3%) |
| $22,500 to $24,999 | 37 (1.1%) | 18 (0.7%) |
| $25,000 to $29,999 | 64 (1.9%) | 68 (2.8%) |
| $30,000 to $34,999 | 36 (1.1%) | 58 (2.4%) |
| $35,000 to $39,999 | 24 (0.7%) | 42 (1.7%) |
| $40,000 to $44,999 | 100 (3.0%) | 85 (3.4%) |
| $45,000 to $49,999 | 89 (2.7%) | 23 (0.9%) |
| $50,000 to $54,999 | 11 (0.3%) | 79 (3.2%) |
| $55,000 to $64,999 | 39 (1.2%) | 120 (4.9%) |
| $65,000 to $74,999 | 80 (2.4%) | 143 (5.8%) |
| $75,000 to $99,999 | 238 (7.1%) | 369 (14.9%) |
| $100,000+ | 2,048 (61.5%) | 924 (37.4%) |
| Total | 3,330 (100.0%) | 2,473 (100.0%) |
Earnings by Sex by Educational Attainment in Belmont
Average earnings in Belmont are $147,344 for men and $81,383 for women, a difference of 44.8%. Men with an educational attainment of graduate degree enjoy the highest average annual earnings of $157,950, while those with less than high school education earn the least with $46,164. Women with an educational attainment of graduate degree earn the most with the average annual earnings of $113,371, while those with high school diploma education have the smallest earnings of $36,667.
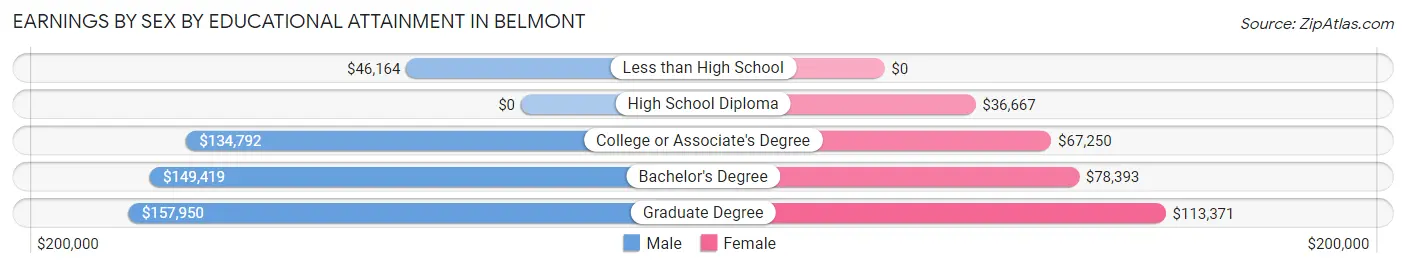
| Educational Attainment | Male Income | Female Income |
| Less than High School | $46,164 | $0 |
| High School Diploma | - | - |
| College or Associate's Degree | $134,792 | $67,250 |
| Bachelor's Degree | $149,419 | $78,393 |
| Graduate Degree | $157,950 | $113,371 |
| Total | $147,344 | $81,383 |
Family Income in Belmont
Family Income Brackets in Belmont
According to the Belmont family income data, there are 1,591 families falling into the $200,000+ income range, which is the most common income bracket and makes up 60.3% of all families.
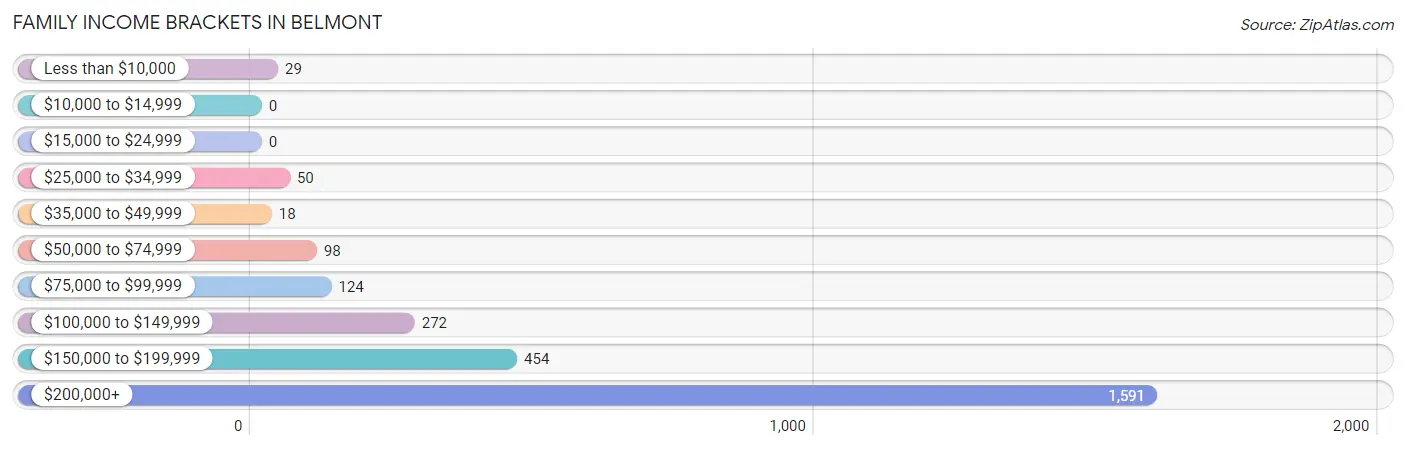
| Income Bracket | # Families | % Families |
| Less than $10,000 | 29 | 1.1% |
| $10,000 to $14,999 | 0 | 0.0% |
| $15,000 to $24,999 | 0 | 0.0% |
| $25,000 to $34,999 | 50 | 1.9% |
| $35,000 to $49,999 | 18 | 0.7% |
| $50,000 to $74,999 | 98 | 3.7% |
| $75,000 to $99,999 | 124 | 4.7% |
| $100,000 to $149,999 | 272 | 10.3% |
| $150,000 to $199,999 | 454 | 17.2% |
| $200,000+ | 1,591 | 60.3% |
Family Income by Famaliy Size in Belmont
4-person families (729 | 27.6%) account for the highest median family income in Belmont with $250,001 per family, while 2-person families (717 | 27.2%) have the highest median income of $99,664 per family member.
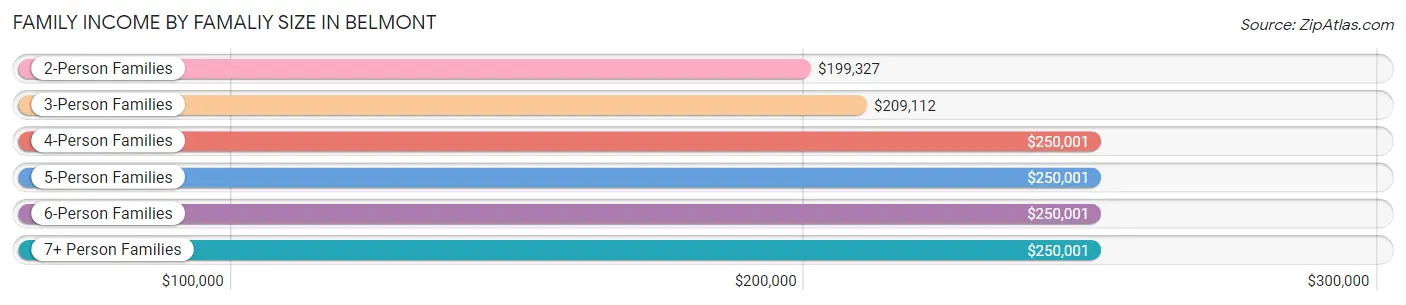
| Income Bracket | # Families | Median Income |
| 2-Person Families | 717 (27.2%) | $199,327 |
| 3-Person Families | 767 (29.1%) | $209,112 |
| 4-Person Families | 729 (27.6%) | $250,001 |
| 5-Person Families | 324 (12.3%) | $250,001 |
| 6-Person Families | 70 (2.6%) | $250,001 |
| 7+ Person Families | 31 (1.2%) | $250,001 |
| Total | 2,638 (100.0%) | $234,167 |
Family Income by Number of Earners in Belmont
The median family income in Belmont is $234,167, with families comprising 2 earners (1,433) having the highest median family income of $250,001, while families with no earners (135) have the lowest median family income of $105,469, accounting for 54.3% and 5.1% of families, respectively.
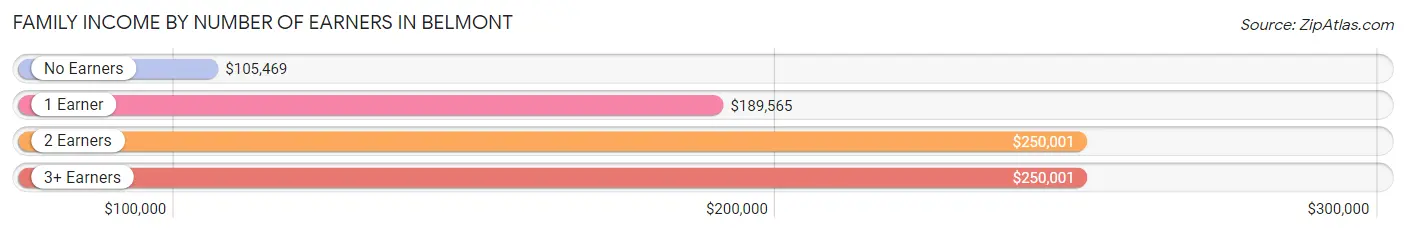
| Number of Earners | # Families | Median Income |
| No Earners | 135 (5.1%) | $105,469 |
| 1 Earner | 614 (23.3%) | $189,565 |
| 2 Earners | 1,433 (54.3%) | $250,001 |
| 3+ Earners | 456 (17.3%) | $250,001 |
| Total | 2,638 (100.0%) | $234,167 |
Household Income in Belmont
Household Income Brackets in Belmont
With 1,723 households falling in the category, the $200,000+ income range is the most frequent in Belmont, accounting for 55.0% of all households.
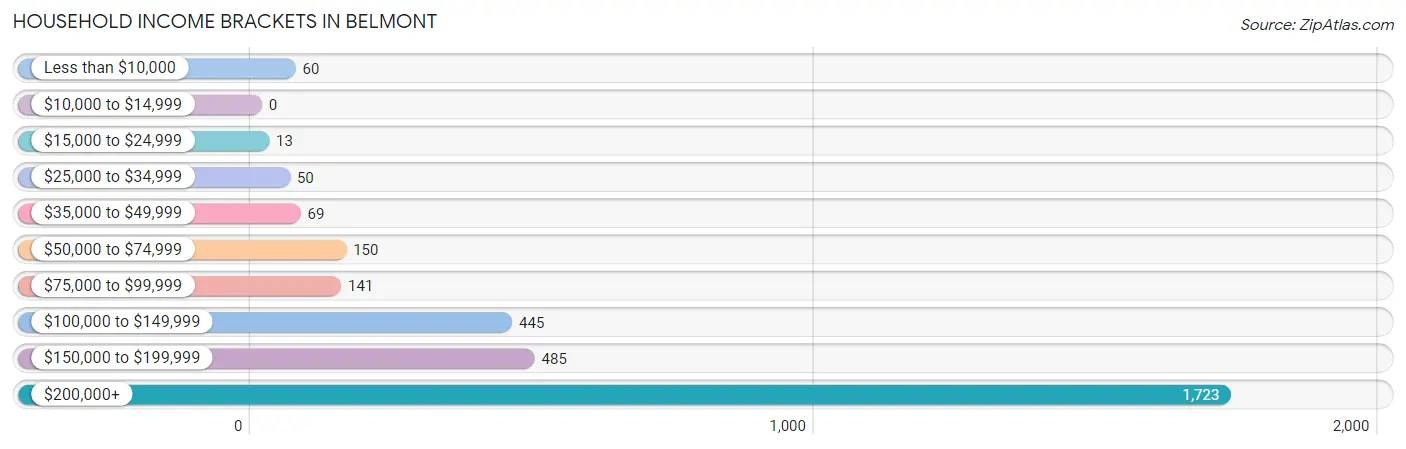
| Income Bracket | # Households | % Households |
| Less than $10,000 | 60 | 1.9% |
| $10,000 to $14,999 | 0 | 0.0% |
| $15,000 to $24,999 | 13 | 0.4% |
| $25,000 to $34,999 | 50 | 1.6% |
| $35,000 to $49,999 | 69 | 2.2% |
| $50,000 to $74,999 | 150 | 4.8% |
| $75,000 to $99,999 | 141 | 4.5% |
| $100,000 to $149,999 | 445 | 14.2% |
| $150,000 to $199,999 | 485 | 15.5% |
| $200,000+ | 1,723 | 55.0% |
Household Income by Householder Age in Belmont
The median household income in Belmont is $212,159, with the highest median household income of $238,152 found in the 45 to 64 years age bracket for the primary householder. A total of 1,804 households (57.6%) fall into this category. Meanwhile, the 15 to 24 years age bracket for the primary householder has the lowest median household income of $0, with 12 households (0.4%) in this group.
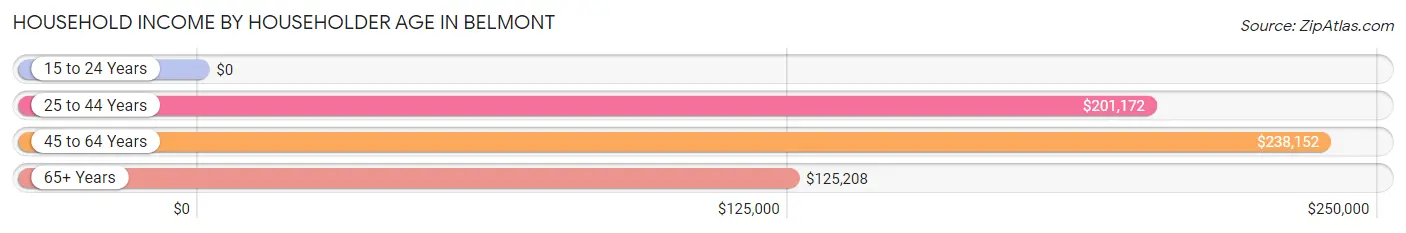
| Income Bracket | # Households | Median Income |
| 15 to 24 Years | 12 (0.4%) | $0 |
| 25 to 44 Years | 1,035 (33.1%) | $201,172 |
| 45 to 64 Years | 1,804 (57.6%) | $238,152 |
| 65+ Years | 281 (9.0%) | $125,208 |
| Total | 3,132 (100.0%) | $212,159 |
Poverty in Belmont
Income Below Poverty by Sex and Age in Belmont
With 0.1% poverty level for males and 2.0% for females among the residents of Belmont, 12 to 14 year old males and 55 to 64 year old females are the most vulnerable to poverty, with 1 males (0.4%) and 29 females (6.7%) in their respective age groups living below the poverty level.
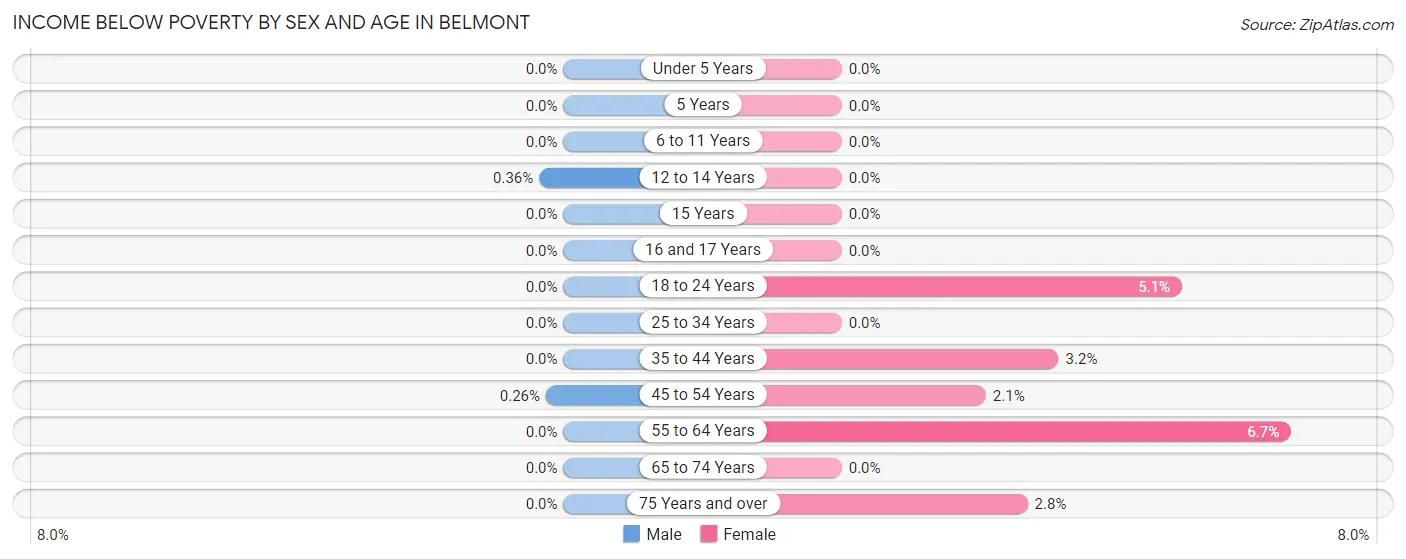
| Age Bracket | Male | Female |
| Under 5 Years | 0 (0.0%) | 0 (0.0%) |
| 5 Years | 0 (0.0%) | 0 (0.0%) |
| 6 to 11 Years | 0 (0.0%) | 0 (0.0%) |
| 12 to 14 Years | 1 (0.4%) | 0 (0.0%) |
| 15 Years | 0 (0.0%) | 0 (0.0%) |
| 16 and 17 Years | 0 (0.0%) | 0 (0.0%) |
| 18 to 24 Years | 0 (0.0%) | 14 (5.1%) |
| 25 to 34 Years | 0 (0.0%) | 0 (0.0%) |
| 35 to 44 Years | 0 (0.0%) | 25 (3.2%) |
| 45 to 54 Years | 3 (0.3%) | 25 (2.1%) |
| 55 to 64 Years | 0 (0.0%) | 29 (6.7%) |
| 65 to 74 Years | 0 (0.0%) | 0 (0.0%) |
| 75 Years and over | 0 (0.0%) | 5 (2.8%) |
| Total | 4 (0.1%) | 98 (2.0%) |
Income Above Poverty by Sex and Age in Belmont
According to the poverty statistics in Belmont, males aged under 5 years and females aged under 5 years are the age groups that are most secure financially, with 100.0% of males and 100.0% of females in these age groups living above the poverty line.
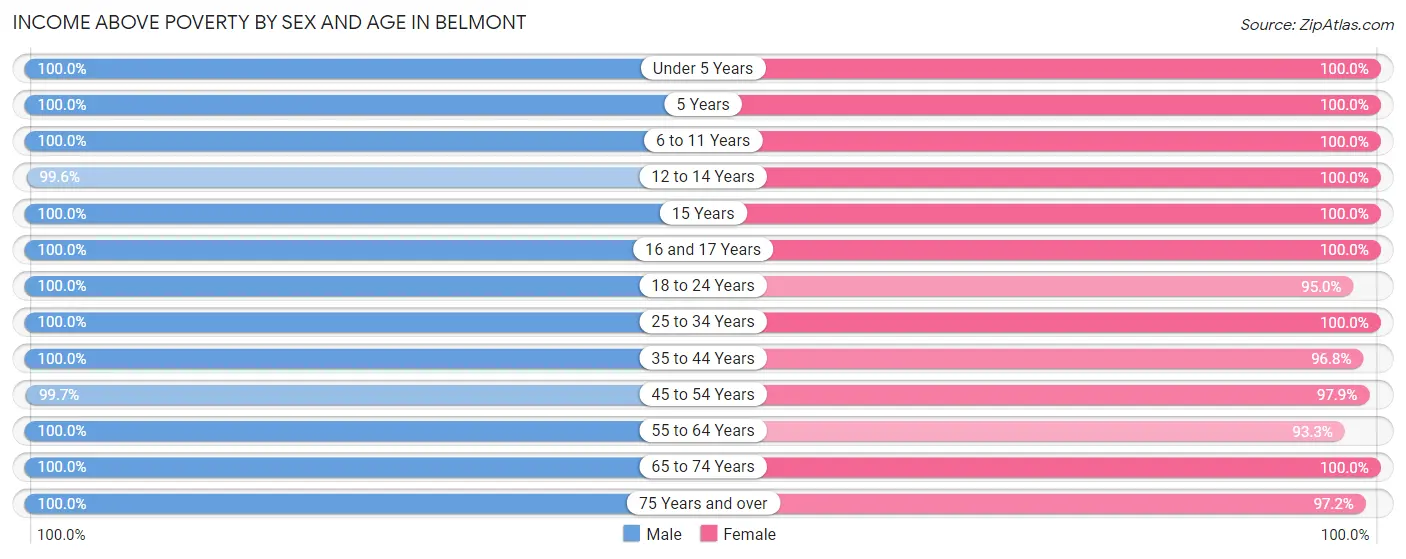
| Age Bracket | Male | Female |
| Under 5 Years | 470 (100.0%) | 187 (100.0%) |
| 5 Years | 30 (100.0%) | 82 (100.0%) |
| 6 to 11 Years | 411 (100.0%) | 574 (100.0%) |
| 12 to 14 Years | 276 (99.6%) | 340 (100.0%) |
| 15 Years | 98 (100.0%) | 73 (100.0%) |
| 16 and 17 Years | 200 (100.0%) | 183 (100.0%) |
| 18 to 24 Years | 500 (100.0%) | 263 (95.0%) |
| 25 to 34 Years | 428 (100.0%) | 411 (100.0%) |
| 35 to 44 Years | 593 (100.0%) | 751 (96.8%) |
| 45 to 54 Years | 1,164 (99.7%) | 1,142 (97.9%) |
| 55 to 64 Years | 573 (100.0%) | 406 (93.3%) |
| 65 to 74 Years | 148 (100.0%) | 154 (100.0%) |
| 75 Years and over | 145 (100.0%) | 176 (97.2%) |
| Total | 5,036 (99.9%) | 4,742 (98.0%) |
Income Below Poverty Among Married-Couple Families in Belmont
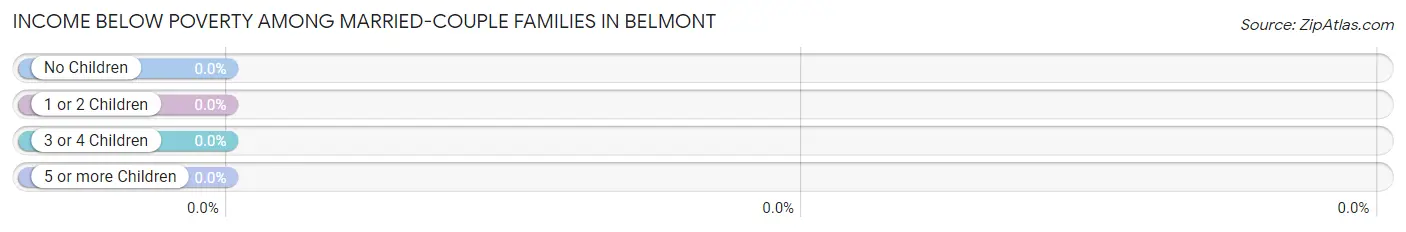
| Children | Above Poverty | Below Poverty |
| No Children | 823 (100.0%) | 0 (0.0%) |
| 1 or 2 Children | 1,287 (100.0%) | 0 (0.0%) |
| 3 or 4 Children | 261 (100.0%) | 0 (0.0%) |
| 5 or more Children | 0 (0.0%) | 0 (0.0%) |
| Total | 2,371 (100.0%) | 0 (0.0%) |
Income Below Poverty Among Single-Parent Households in Belmont
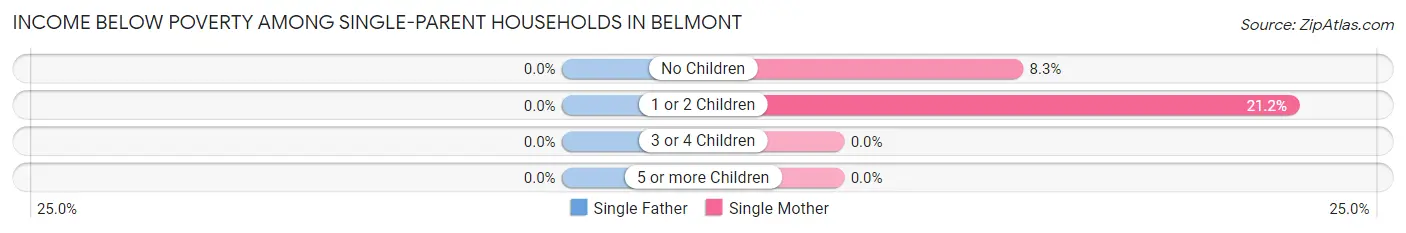
| Children | Single Father | Single Mother |
| No Children | 0 (0.0%) | 5 (8.3%) |
| 1 or 2 Children | 0 (0.0%) | 25 (21.2%) |
| 3 or 4 Children | 0 (0.0%) | 0 (0.0%) |
| 5 or more Children | 0 (0.0%) | 0 (0.0%) |
| Total | 0 (0.0%) | 30 (16.0%) |
Income Below Poverty Among Married-Couple vs Single-Parent Households in Belmont
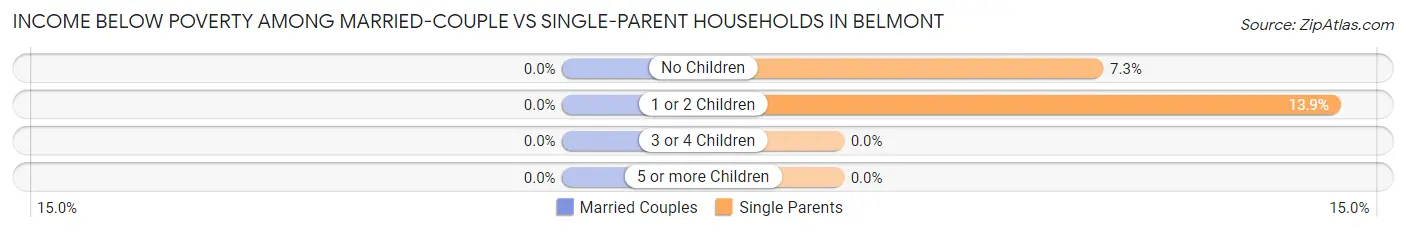
| Children | Married-Couple Families | Single-Parent Households |
| No Children | 0 (0.0%) | 5 (7.2%) |
| 1 or 2 Children | 0 (0.0%) | 25 (13.9%) |
| 3 or 4 Children | 0 (0.0%) | 0 (0.0%) |
| 5 or more Children | 0 (0.0%) | 0 (0.0%) |
| Total | 0 (0.0%) | 30 (11.2%) |
Race in Belmont
The most populous races in Belmont are White / Caucasian (6,139 | 62.1%), Asian (2,414 | 24.4%), and Hispanic or Latino (907 | 9.2%).
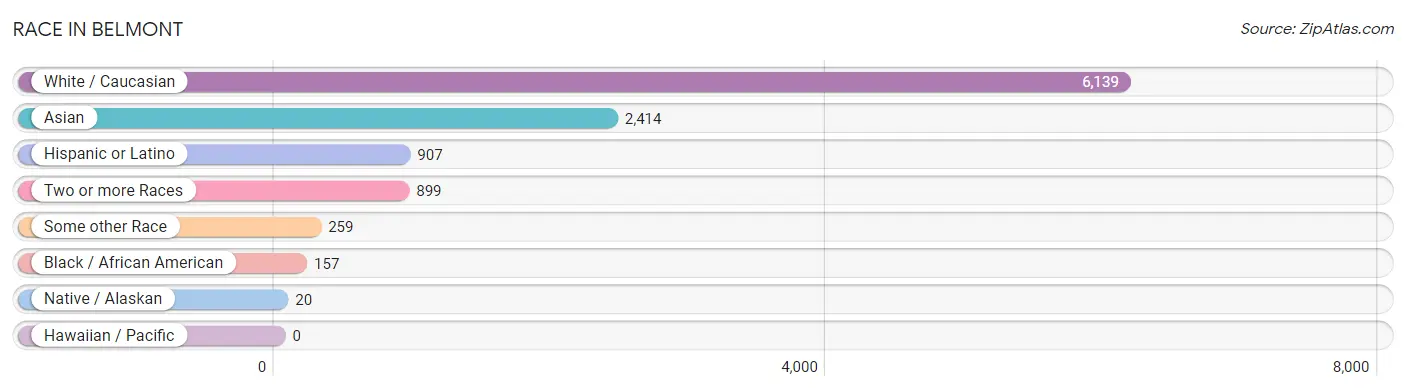
| Race | # Population | % Population |
| Asian | 2,414 | 24.4% |
| Black / African American | 157 | 1.6% |
| Hawaiian / Pacific | 0 | 0.0% |
| Hispanic or Latino | 907 | 9.2% |
| Native / Alaskan | 20 | 0.2% |
| White / Caucasian | 6,139 | 62.1% |
| Two or more Races | 899 | 9.1% |
| Some other Race | 259 | 2.6% |
| Total | 9,888 | 100.0% |
Ancestry in Belmont
The most populous ancestries reported in Belmont are Irish (1,499 | 15.2%), German (1,288 | 13.0%), Thai (1,178 | 11.9%), English (1,146 | 11.6%), and Italian (971 | 9.8%), together accounting for 61.5% of all Belmont residents.
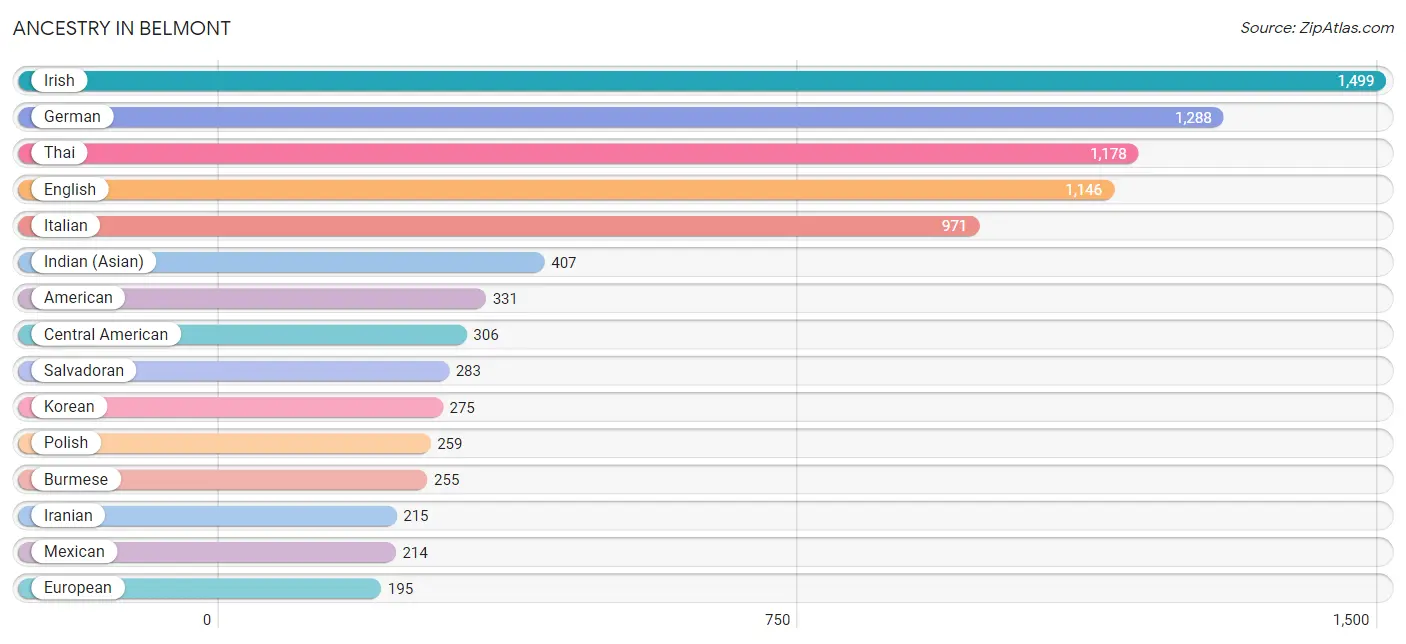
| Ancestry | # Population | % Population |
| Albanian | 23 | 0.2% |
| American | 331 | 3.4% |
| Arab | 190 | 1.9% |
| Armenian | 50 | 0.5% |
| Austrian | 144 | 1.5% |
| Belgian | 7 | 0.1% |
| Bhutanese | 39 | 0.4% |
| Bolivian | 15 | 0.2% |
| British | 135 | 1.4% |
| Burmese | 255 | 2.6% |
| Cambodian | 28 | 0.3% |
| Canadian | 22 | 0.2% |
| Carpatho Rusyn | 12 | 0.1% |
| Central American | 306 | 3.1% |
| Central American Indian | 12 | 0.1% |
| Colombian | 17 | 0.2% |
| Costa Rican | 23 | 0.2% |
| Cypriot | 8 | 0.1% |
| Czech | 15 | 0.2% |
| Dutch | 83 | 0.8% |
| Eastern European | 121 | 1.2% |
| English | 1,146 | 11.6% |
| European | 195 | 2.0% |
| Filipino | 41 | 0.4% |
| French | 178 | 1.8% |
| French Canadian | 37 | 0.4% |
| German | 1,288 | 13.0% |
| Greek | 87 | 0.9% |
| Haitian | 11 | 0.1% |
| Hungarian | 93 | 0.9% |
| Icelander | 38 | 0.4% |
| Indian (Asian) | 407 | 4.1% |
| Iranian | 215 | 2.2% |
| Iraqi | 44 | 0.4% |
| Irish | 1,499 | 15.2% |
| Italian | 971 | 9.8% |
| Jamaican | 27 | 0.3% |
| Korean | 275 | 2.8% |
| Lebanese | 76 | 0.8% |
| Lithuanian | 14 | 0.1% |
| Mexican | 214 | 2.2% |
| Moroccan | 49 | 0.5% |
| Nigerian | 24 | 0.2% |
| Norwegian | 56 | 0.6% |
| Pakistani | 12 | 0.1% |
| Peruvian | 152 | 1.5% |
| Polish | 259 | 2.6% |
| Portuguese | 17 | 0.2% |
| Puerto Rican | 87 | 0.9% |
| Romanian | 8 | 0.1% |
| Russian | 104 | 1.1% |
| Salvadoran | 283 | 2.9% |
| Scandinavian | 59 | 0.6% |
| Scotch-Irish | 59 | 0.6% |
| Scottish | 128 | 1.3% |
| Slovene | 6 | 0.1% |
| South African | 48 | 0.5% |
| South American | 184 | 1.9% |
| Spaniard | 94 | 0.9% |
| Spanish | 22 | 0.2% |
| Sri Lankan | 138 | 1.4% |
| Subsaharan African | 72 | 0.7% |
| Swedish | 51 | 0.5% |
| Swiss | 20 | 0.2% |
| Thai | 1,178 | 11.9% |
| Ukrainian | 14 | 0.1% | View All 66 Rows |
Immigrants in Belmont
The most numerous immigrant groups reported in Belmont came from Asia (1,732 | 17.5%), South Central Asia (1,131 | 11.4%), India (656 | 6.6%), Latin America (403 | 4.1%), and Eastern Asia (370 | 3.7%), together accounting for 43.4% of all Belmont residents.
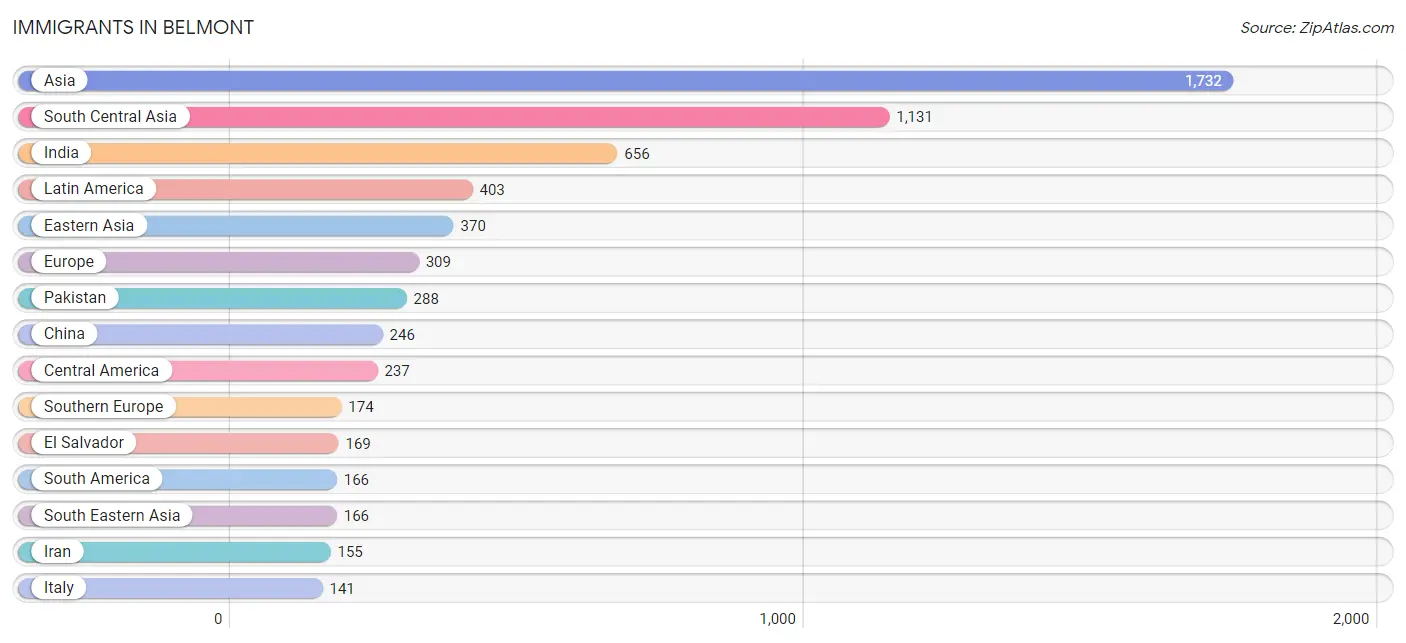
| Immigration Origin | # Population | % Population |
| Africa | 73 | 0.7% |
| Albania | 15 | 0.2% |
| Asia | 1,732 | 17.5% |
| Belarus | 31 | 0.3% |
| Canada | 100 | 1.0% |
| Central America | 237 | 2.4% |
| China | 246 | 2.5% |
| Colombia | 19 | 0.2% |
| Costa Rica | 9 | 0.1% |
| Eastern Asia | 370 | 3.7% |
| Eastern Europe | 65 | 0.7% |
| El Salvador | 169 | 1.7% |
| England | 51 | 0.5% |
| Europe | 309 | 3.1% |
| Germany | 13 | 0.1% |
| Hong Kong | 39 | 0.4% |
| India | 656 | 6.6% |
| Iran | 155 | 1.6% |
| Iraq | 44 | 0.4% |
| Italy | 141 | 1.4% |
| Korea | 110 | 1.1% |
| Latin America | 403 | 4.1% |
| Mexico | 59 | 0.6% |
| Morocco | 15 | 0.2% |
| Northern Africa | 22 | 0.2% |
| Northern Europe | 57 | 0.6% |
| Pakistan | 288 | 2.9% |
| Peru | 41 | 0.4% |
| Philippines | 94 | 0.9% |
| Portugal | 17 | 0.2% |
| Romania | 8 | 0.1% |
| South Africa | 51 | 0.5% |
| South America | 166 | 1.7% |
| South Central Asia | 1,131 | 11.4% |
| South Eastern Asia | 166 | 1.7% |
| Southern Europe | 174 | 1.8% |
| Spain | 16 | 0.2% |
| Sri Lanka | 22 | 0.2% |
| Taiwan | 34 | 0.3% |
| Thailand | 12 | 0.1% |
| Ukraine | 11 | 0.1% |
| Uzbekistan | 10 | 0.1% |
| Venezuela | 106 | 1.1% |
| Vietnam | 60 | 0.6% |
| Western Asia | 65 | 0.7% |
| Western Europe | 13 | 0.1% | View All 46 Rows |
Sex and Age in Belmont
Sex and Age in Belmont
The most populous age groups in Belmont are 45 to 49 Years (613 | 12.2%) for men and 45 to 49 Years (611 | 12.6%) for women.
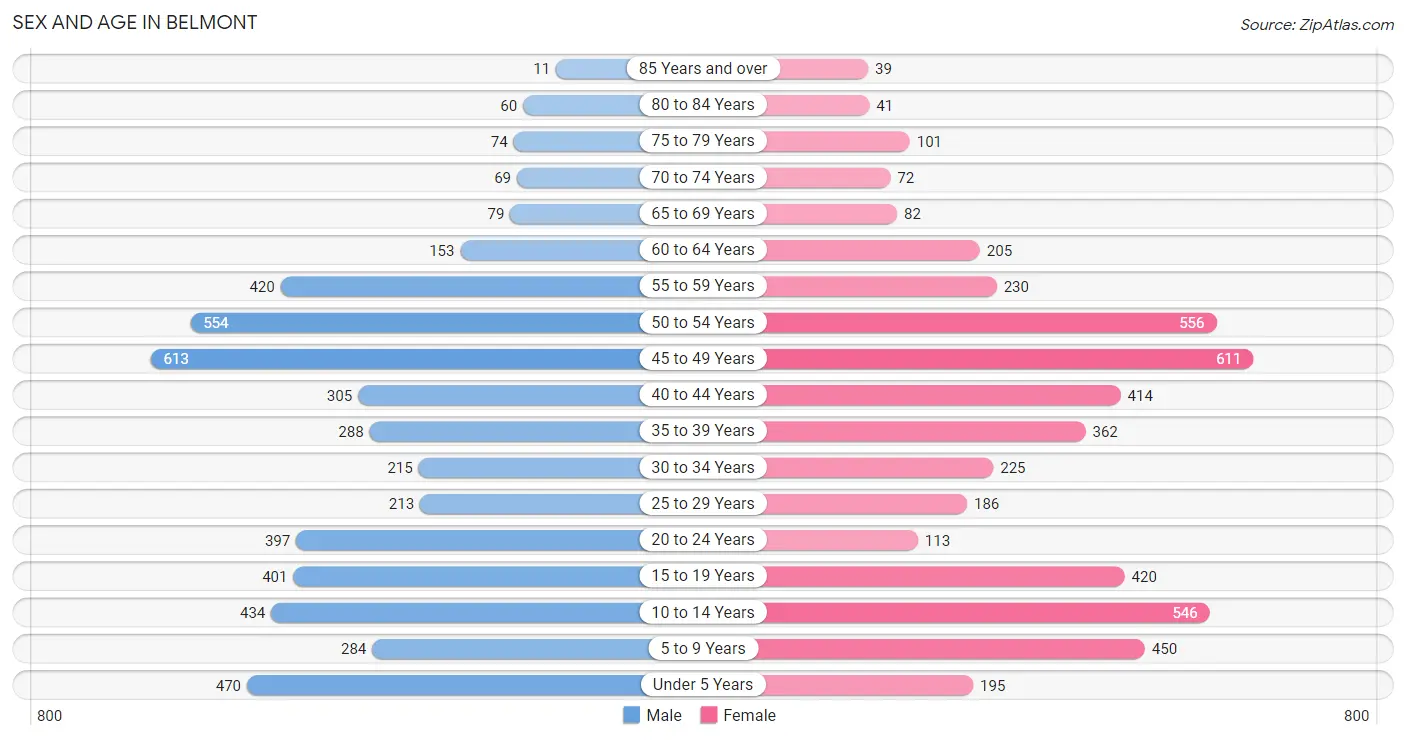
| Age Bracket | Male | Female |
| Under 5 Years | 470 (9.3%) | 195 (4.0%) |
| 5 to 9 Years | 284 (5.6%) | 450 (9.3%) |
| 10 to 14 Years | 434 (8.6%) | 546 (11.3%) |
| 15 to 19 Years | 401 (8.0%) | 420 (8.7%) |
| 20 to 24 Years | 397 (7.9%) | 113 (2.3%) |
| 25 to 29 Years | 213 (4.2%) | 186 (3.8%) |
| 30 to 34 Years | 215 (4.3%) | 225 (4.6%) |
| 35 to 39 Years | 288 (5.7%) | 362 (7.5%) |
| 40 to 44 Years | 305 (6.0%) | 414 (8.5%) |
| 45 to 49 Years | 613 (12.2%) | 611 (12.6%) |
| 50 to 54 Years | 554 (11.0%) | 556 (11.5%) |
| 55 to 59 Years | 420 (8.3%) | 230 (4.7%) |
| 60 to 64 Years | 153 (3.0%) | 205 (4.2%) |
| 65 to 69 Years | 79 (1.6%) | 82 (1.7%) |
| 70 to 74 Years | 69 (1.4%) | 72 (1.5%) |
| 75 to 79 Years | 74 (1.5%) | 101 (2.1%) |
| 80 to 84 Years | 60 (1.2%) | 41 (0.9%) |
| 85 Years and over | 11 (0.2%) | 39 (0.8%) |
| Total | 5,040 (100.0%) | 4,848 (100.0%) |
Families and Households in Belmont
Median Family Size in Belmont
The median family size in Belmont is 3.46 persons per family, with single male/father families (79 | 3.0%) accounting for the largest median family size of 4.76 persons per family. On the other hand, single female/mother families (188 | 7.1%) represent the smallest median family size with 2.60 persons per family.
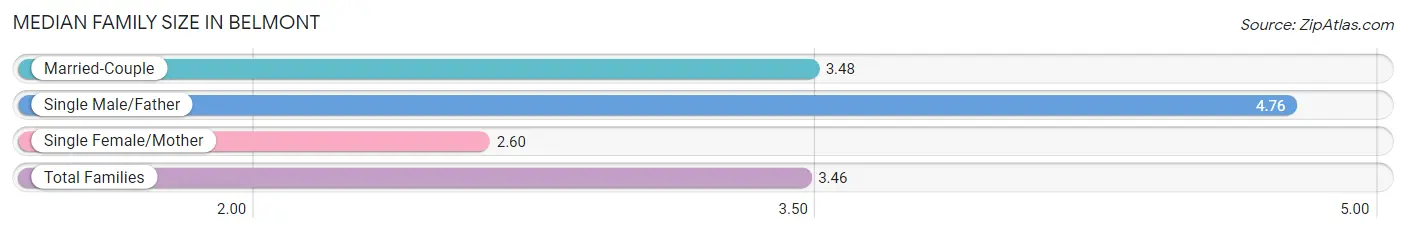
| Family Type | # Families | Family Size |
| Married-Couple | 2,371 (89.9%) | 3.48 |
| Single Male/Father | 79 (3.0%) | 4.76 |
| Single Female/Mother | 188 (7.1%) | 2.60 |
| Total Families | 2,638 (100.0%) | 3.46 |
Median Household Size in Belmont
The median household size in Belmont is 3.16 persons per household, with single male/father households (79 | 2.5%) accounting for the largest median household size of 5.29 persons per household. non-family households (494 | 15.8%) represent the smallest median household size with 1.38 persons per household.
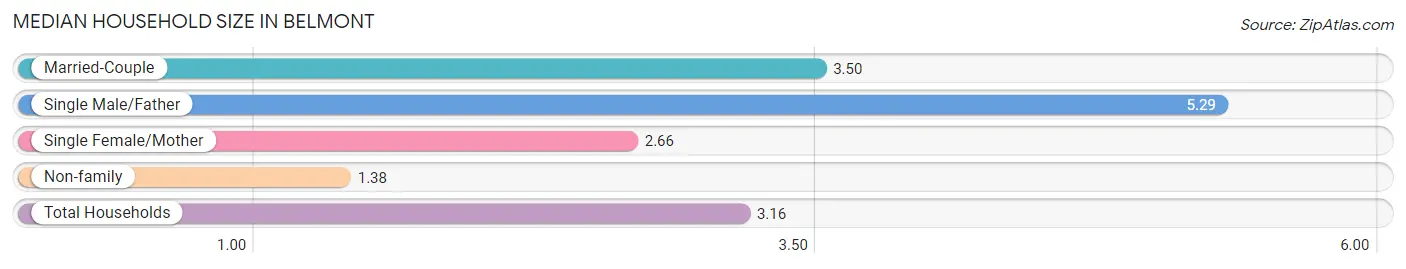
| Household Type | # Households | Household Size |
| Married-Couple | 2,371 (75.7%) | 3.50 |
| Single Male/Father | 79 (2.5%) | 5.29 |
| Single Female/Mother | 188 (6.0%) | 2.66 |
| Non-family | 494 (15.8%) | 1.38 |
| Total Households | 3,132 (100.0%) | 3.16 |
Household Size by Marriage Status in Belmont
Out of a total of 3,132 households in Belmont, 2,638 (84.2%) are family households, while 494 (15.8%) are nonfamily households. The most numerous type of family households are 3-person households, comprising 785, and the most common type of nonfamily households are 1-person households, comprising 362.
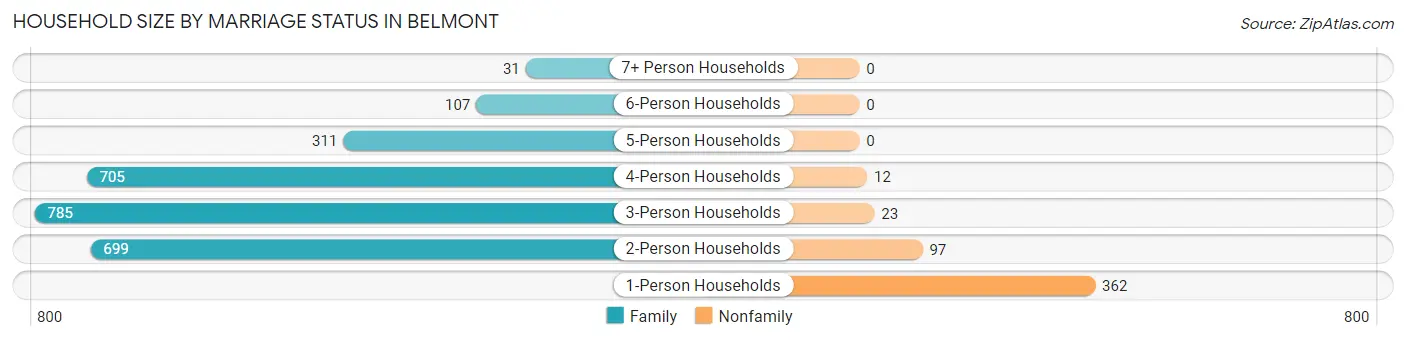
| Household Size | Family Households | Nonfamily Households |
| 1-Person Households | - | 362 (11.6%) |
| 2-Person Households | 699 (22.3%) | 97 (3.1%) |
| 3-Person Households | 785 (25.1%) | 23 (0.7%) |
| 4-Person Households | 705 (22.5%) | 12 (0.4%) |
| 5-Person Households | 311 (9.9%) | 0 (0.0%) |
| 6-Person Households | 107 (3.4%) | 0 (0.0%) |
| 7+ Person Households | 31 (1.0%) | 0 (0.0%) |
| Total | 2,638 (84.2%) | 494 (15.8%) |
Female Fertility in Belmont
Fertility by Age in Belmont
Average fertility rate in Belmont is 57.0 births per 1,000 women. Women in the age bracket of 20 to 34 years have the highest fertility rate with 174.0 births per 1,000 women. Women in the age bracket of 20 to 34 years acount for 66.9% of all women with births.
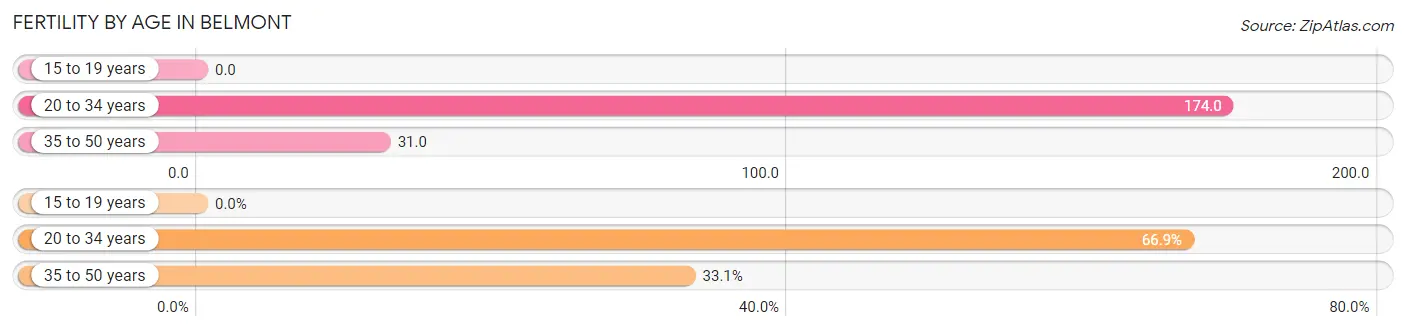
| Age Bracket | Women with Births | Births / 1,000 Women |
| 15 to 19 years | 0 (0.0%) | 0.0 |
| 20 to 34 years | 91 (66.9%) | 174.0 |
| 35 to 50 years | 45 (33.1%) | 31.0 |
| Total | 136 (100.0%) | 57.0 |
Fertility by Age by Marriage Status in Belmont
73.5% of women with births (136) in Belmont are married. The highest percentage of unmarried women with births falls into 20 to 34 years age bracket with 39.6% of them unmarried at the time of birth, while the lowest percentage of unmarried women with births belong to 35 to 50 years age bracket with 0.0% of them unmarried.
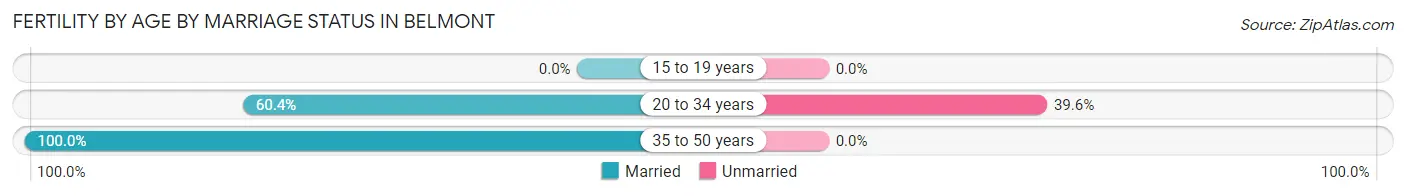
| Age Bracket | Married | Unmarried |
| 15 to 19 years | 0 (0.0%) | 0 (0.0%) |
| 20 to 34 years | 55 (60.4%) | 36 (39.6%) |
| 35 to 50 years | 45 (100.0%) | 0 (0.0%) |
| Total | 100 (73.5%) | 36 (26.5%) |
Fertility by Education in Belmont
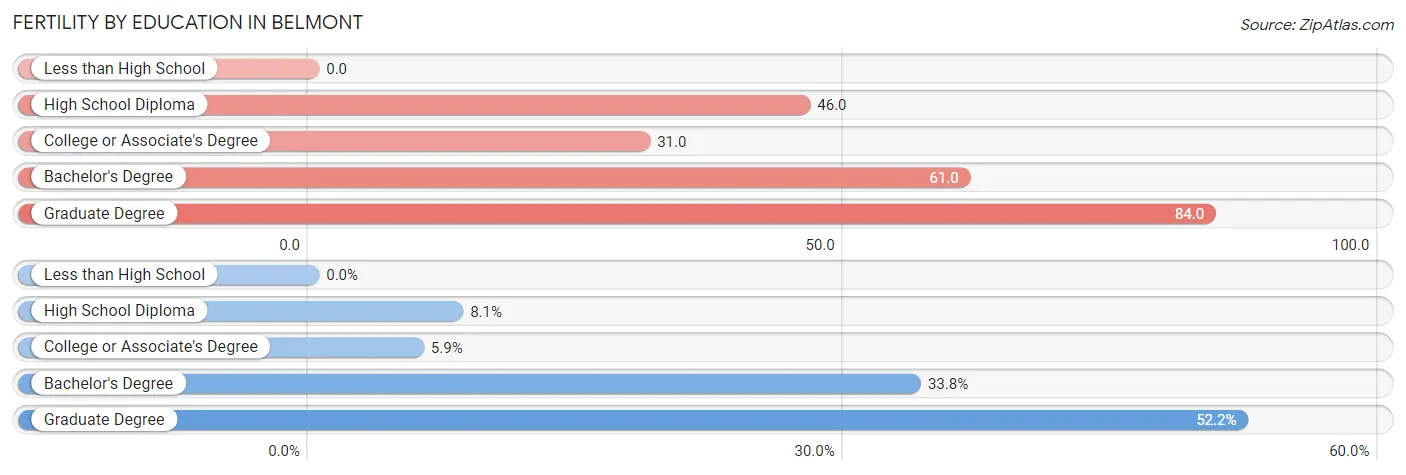
| Educational Attainment | Women with Births | Births / 1,000 Women |
| Less than High School | 0 (0.0%) | 0.0 |
| High School Diploma | 11 (8.1%) | 46.0 |
| College or Associate's Degree | 8 (5.9%) | 31.0 |
| Bachelor's Degree | 46 (33.8%) | 61.0 |
| Graduate Degree | 71 (52.2%) | 84.0 |
| Total | 136 (100.0%) | 57.0 |
Fertility by Education by Marriage Status in Belmont
26.5% of women with births in Belmont are unmarried. Women with the educational attainment of graduate degree are most likely to be married with 100.0% of them married at childbirth, while women with the educational attainment of high school diploma are least likely to be married with 100.0% of them unmarried at childbirth.
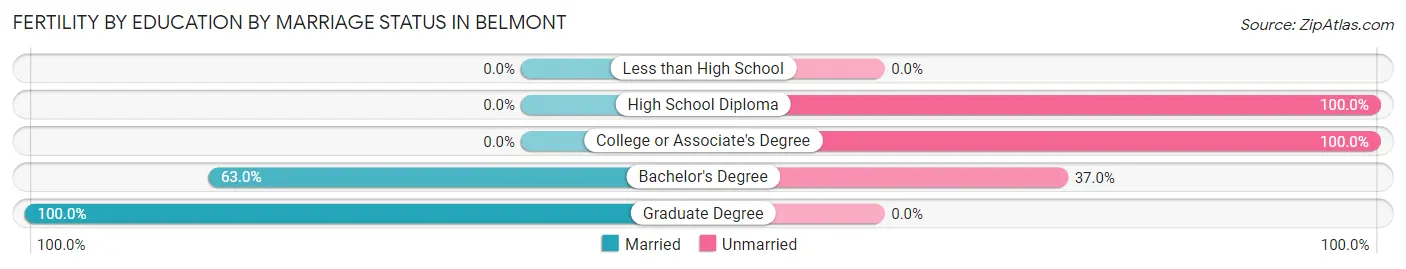
| Educational Attainment | Married | Unmarried |
| Less than High School | 0 (0.0%) | 0 (0.0%) |
| High School Diploma | 0 (0.0%) | 11 (100.0%) |
| College or Associate's Degree | 0 (0.0%) | 8 (100.0%) |
| Bachelor's Degree | 29 (63.0%) | 17 (37.0%) |
| Graduate Degree | 71 (100.0%) | 0 (0.0%) |
| Total | 100 (73.5%) | 36 (26.5%) |
Employment Characteristics in Belmont
Employment by Class of Employer in Belmont
Among the 5,085 employed individuals in Belmont, private company employees (3,360 | 66.1%), federal government employees (468 | 9.2%), and not-for-profit organizations (449 | 8.8%) make up the most common classes of employment.
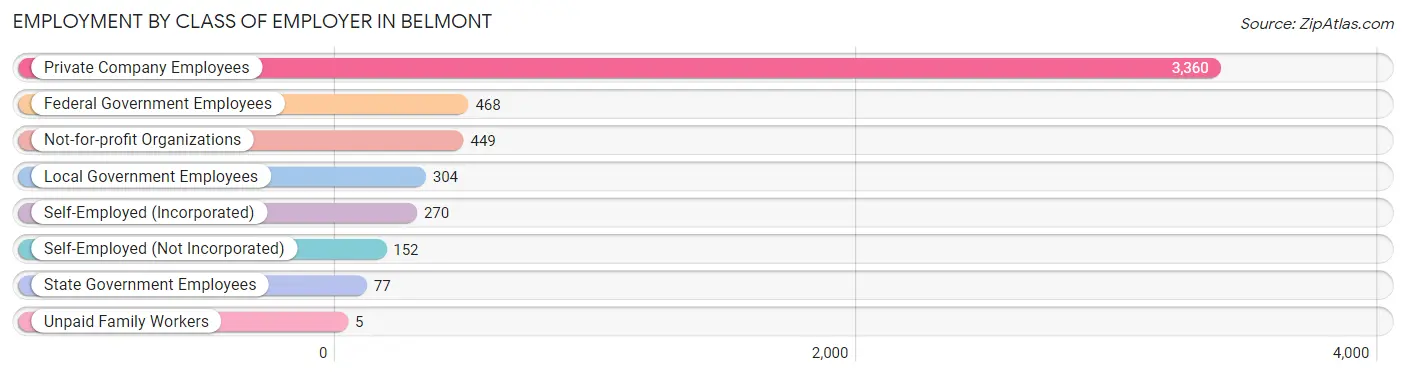
| Employer Class | # Employees | % Employees |
| Private Company Employees | 3,360 | 66.1% |
| Self-Employed (Incorporated) | 270 | 5.3% |
| Self-Employed (Not Incorporated) | 152 | 3.0% |
| Not-for-profit Organizations | 449 | 8.8% |
| Local Government Employees | 304 | 6.0% |
| State Government Employees | 77 | 1.5% |
| Federal Government Employees | 468 | 9.2% |
| Unpaid Family Workers | 5 | 0.1% |
| Total | 5,085 | 100.0% |
Employment Status by Age in Belmont
According to the labor force statistics for Belmont, out of the total population over 16 years of age (7,338), 76.8% or 5,636 individuals are in the labor force, with 3.3% or 186 of them unemployed. The age group with the highest labor force participation rate is 30 to 34 years, with 98.6% or 434 individuals in the labor force. Within the labor force, the 25 to 29 years age range has the highest percentage of unemployed individuals, with 19.9% or 70 of them being unemployed.
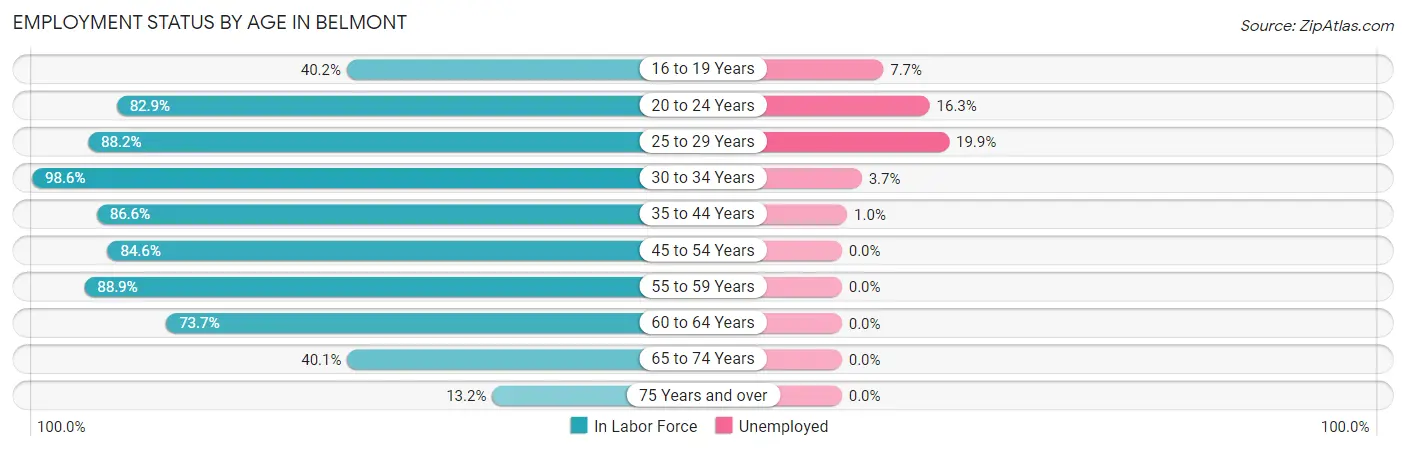
| Age Bracket | In Labor Force | Unemployed |
| 16 to 19 Years | 261 (40.2%) | 20 (7.7%) |
| 20 to 24 Years | 423 (82.9%) | 69 (16.3%) |
| 25 to 29 Years | 352 (88.2%) | 70 (19.9%) |
| 30 to 34 Years | 434 (98.6%) | 16 (3.7%) |
| 35 to 44 Years | 1,186 (86.6%) | 12 (1.0%) |
| 45 to 54 Years | 1,975 (84.6%) | 0 (0.0%) |
| 55 to 59 Years | 578 (88.9%) | 0 (0.0%) |
| 60 to 64 Years | 264 (73.7%) | 0 (0.0%) |
| 65 to 74 Years | 121 (40.1%) | 0 (0.0%) |
| 75 Years and over | 43 (13.2%) | 0 (0.0%) |
| Total | 5,636 (76.8%) | 186 (3.3%) |
Employment Status by Educational Attainment in Belmont
According to labor force statistics for Belmont, 86.3% of individuals (4,790) out of the total population between 25 and 64 years of age (5,550) are in the labor force, with 2.1% or 101 of them being unemployed. The group with the highest labor force participation rate are those with the educational attainment of high school diploma, with 95.1% or 327 individuals in the labor force. Within the labor force, individuals with bachelor's degree or higher education have the highest percentage of unemployment, with 2.5% or 98 of them being unemployed.
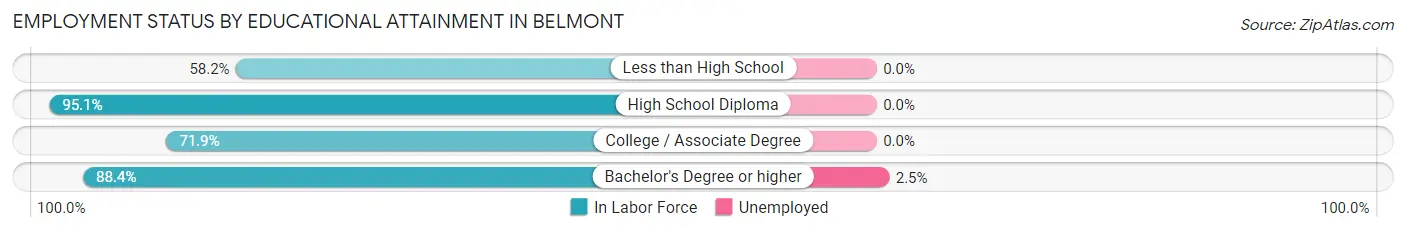
| Educational Attainment | In Labor Force | Unemployed |
| Less than High School | 82 (58.2%) | 0 (0.0%) |
| High School Diploma | 327 (95.1%) | 0 (0.0%) |
| College / Associate Degree | 438 (71.9%) | 0 (0.0%) |
| Bachelor's Degree or higher | 3,939 (88.4%) | 111 (2.5%) |
| Total | 4,790 (86.3%) | 117 (2.1%) |
Employment Occupations by Sex in Belmont
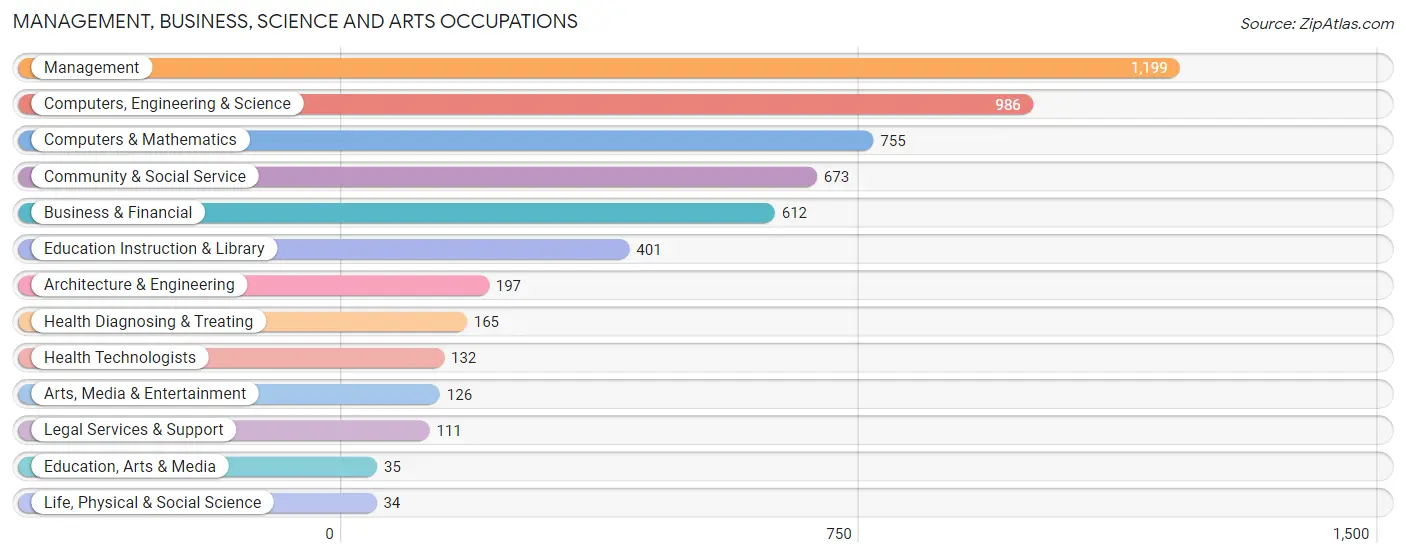
Management, Business, Science and Arts Occupations
The most common Management, Business, Science and Arts occupations in Belmont are Management (1,199 | 22.1%), Computers, Engineering & Science (986 | 18.2%), Computers & Mathematics (755 | 13.9%), Community & Social Service (673 | 12.4%), and Business & Financial (612 | 11.3%).
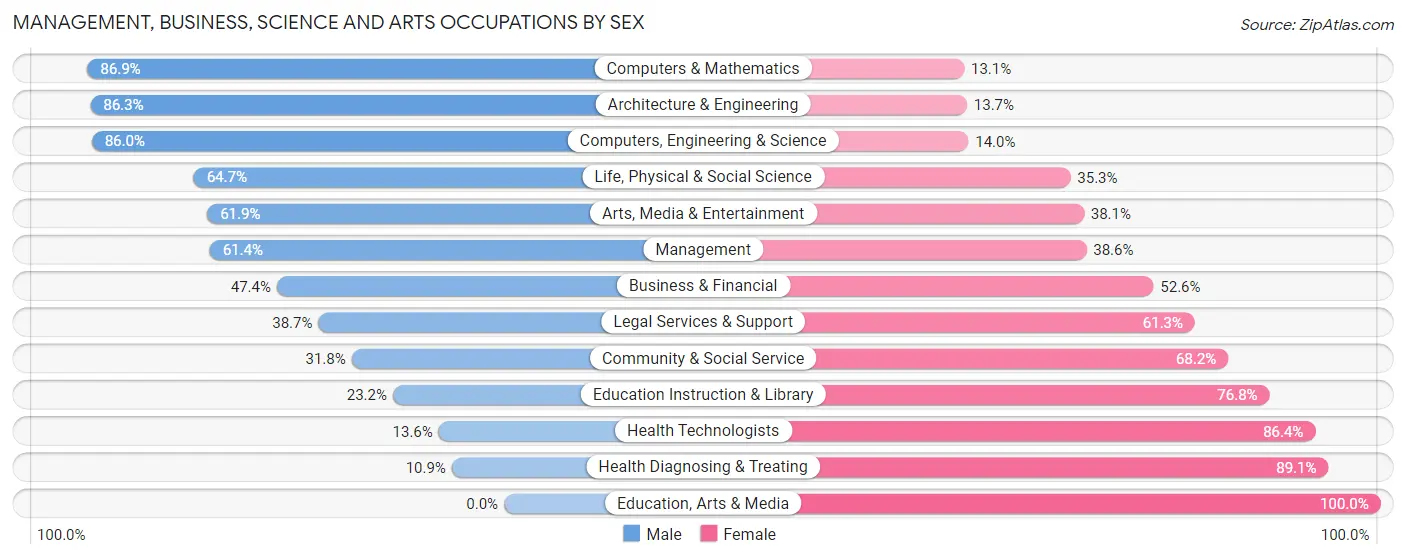
Management, Business, Science and Arts Occupations by Sex
Within the Management, Business, Science and Arts occupations in Belmont, the most male-oriented occupations are Computers & Mathematics (86.9%), Architecture & Engineering (86.3%), and Computers, Engineering & Science (86.0%), while the most female-oriented occupations are Education, Arts & Media (100.0%), Health Diagnosing & Treating (89.1%), and Health Technologists (86.4%).
| Occupation | Male | Female |
| Management | 736 (61.4%) | 463 (38.6%) |
| Business & Financial | 290 (47.4%) | 322 (52.6%) |
| Computers, Engineering & Science | 848 (86.0%) | 138 (14.0%) |
| Computers & Mathematics | 656 (86.9%) | 99 (13.1%) |
| Architecture & Engineering | 170 (86.3%) | 27 (13.7%) |
| Life, Physical & Social Science | 22 (64.7%) | 12 (35.3%) |
| Community & Social Service | 214 (31.8%) | 459 (68.2%) |
| Education, Arts & Media | 0 (0.0%) | 35 (100.0%) |
| Legal Services & Support | 43 (38.7%) | 68 (61.3%) |
| Education Instruction & Library | 93 (23.2%) | 308 (76.8%) |
| Arts, Media & Entertainment | 78 (61.9%) | 48 (38.1%) |
| Health Diagnosing & Treating | 18 (10.9%) | 147 (89.1%) |
| Health Technologists | 18 (13.6%) | 114 (86.4%) |
| Total (Category) | 2,106 (57.9%) | 1,529 (42.1%) |
| Total (Overall) | 3,116 (57.5%) | 2,305 (42.5%) |
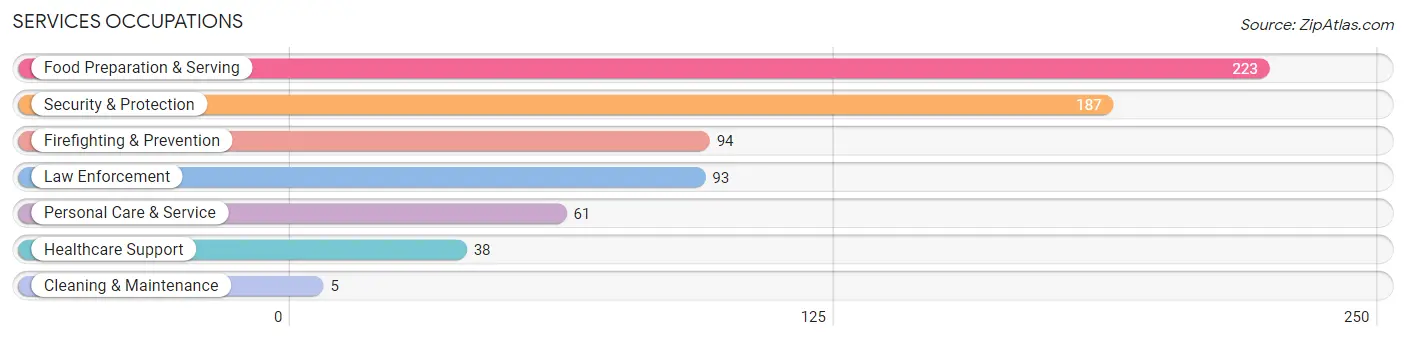
Services Occupations
The most common Services occupations in Belmont are Food Preparation & Serving (223 | 4.1%), Security & Protection (187 | 3.5%), Firefighting & Prevention (94 | 1.7%), Law Enforcement (93 | 1.7%), and Personal Care & Service (61 | 1.1%).
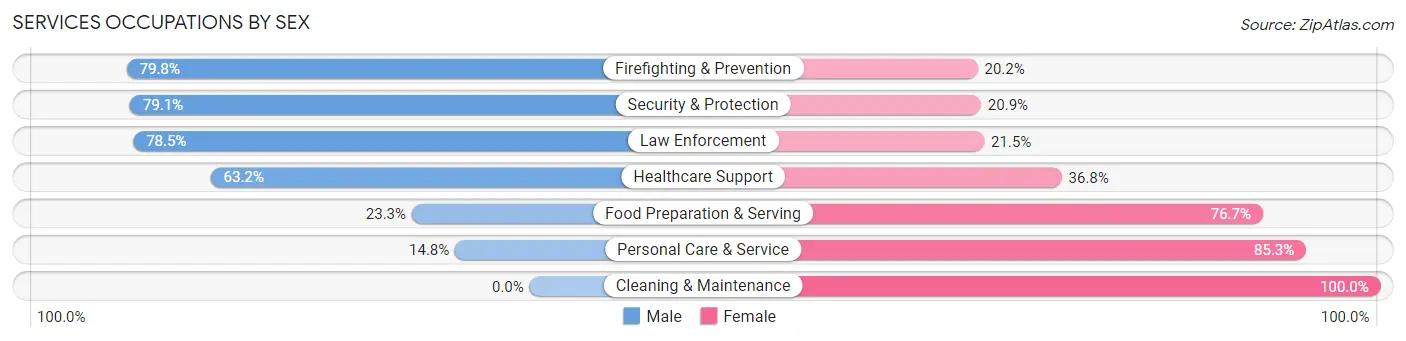
Services Occupations by Sex
Within the Services occupations in Belmont, the most male-oriented occupations are Firefighting & Prevention (79.8%), Security & Protection (79.1%), and Law Enforcement (78.5%), while the most female-oriented occupations are Cleaning & Maintenance (100.0%), Personal Care & Service (85.3%), and Food Preparation & Serving (76.7%).
| Occupation | Male | Female |
| Healthcare Support | 24 (63.2%) | 14 (36.8%) |
| Security & Protection | 148 (79.1%) | 39 (20.9%) |
| Firefighting & Prevention | 75 (79.8%) | 19 (20.2%) |
| Law Enforcement | 73 (78.5%) | 20 (21.5%) |
| Food Preparation & Serving | 52 (23.3%) | 171 (76.7%) |
| Cleaning & Maintenance | 0 (0.0%) | 5 (100.0%) |
| Personal Care & Service | 9 (14.7%) | 52 (85.3%) |
| Total (Category) | 233 (45.3%) | 281 (54.7%) |
| Total (Overall) | 3,116 (57.5%) | 2,305 (42.5%) |
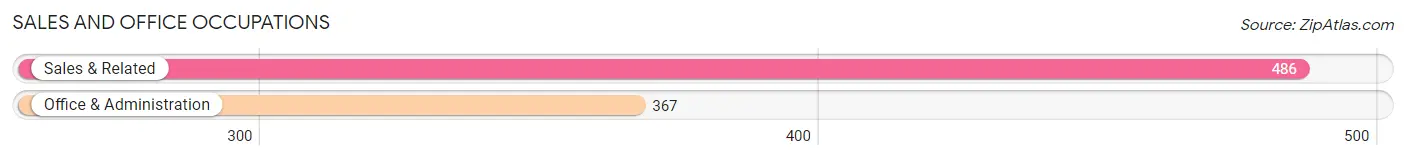
Sales and Office Occupations
The most common Sales and Office occupations in Belmont are Sales & Related (486 | 9.0%), and Office & Administration (367 | 6.8%).
Sales and Office Occupations by Sex
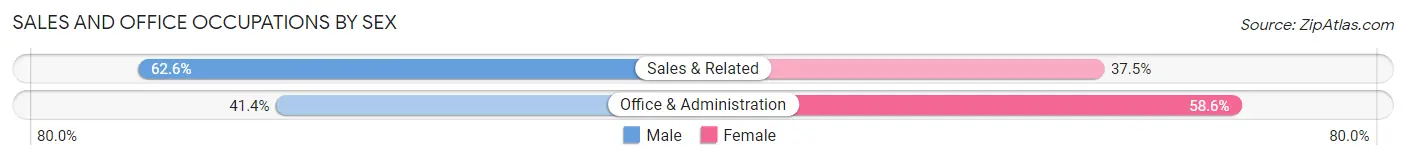
| Occupation | Male | Female |
| Sales & Related | 304 (62.5%) | 182 (37.4%) |
| Office & Administration | 152 (41.4%) | 215 (58.6%) |
| Total (Category) | 456 (53.5%) | 397 (46.5%) |
| Total (Overall) | 3,116 (57.5%) | 2,305 (42.5%) |
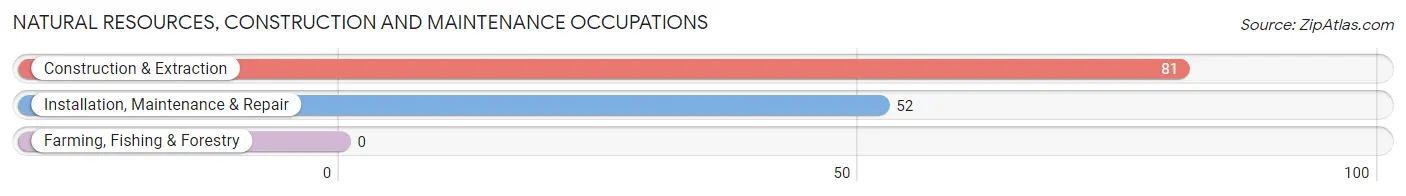
Natural Resources, Construction and Maintenance Occupations
The most common Natural Resources, Construction and Maintenance occupations in Belmont are Construction & Extraction (81 | 1.5%), and Installation, Maintenance & Repair (52 | 1.0%).
Natural Resources, Construction and Maintenance Occupations by Sex
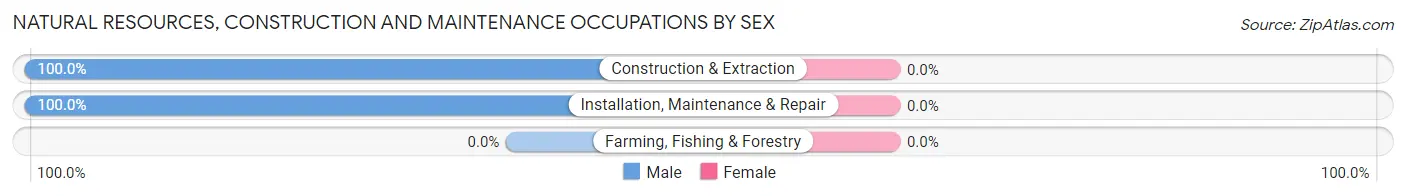
| Occupation | Male | Female |
| Farming, Fishing & Forestry | 0 (0.0%) | 0 (0.0%) |
| Construction & Extraction | 81 (100.0%) | 0 (0.0%) |
| Installation, Maintenance & Repair | 52 (100.0%) | 0 (0.0%) |
| Total (Category) | 133 (100.0%) | 0 (0.0%) |
| Total (Overall) | 3,116 (57.5%) | 2,305 (42.5%) |
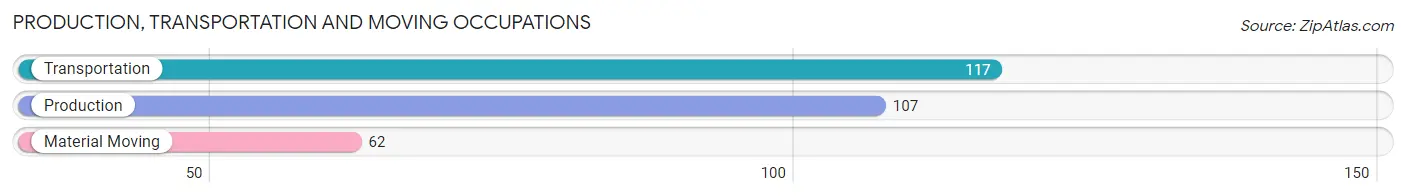
Production, Transportation and Moving Occupations
The most common Production, Transportation and Moving occupations in Belmont are Transportation (117 | 2.2%), Production (107 | 2.0%), and Material Moving (62 | 1.1%).
Production, Transportation and Moving Occupations by Sex
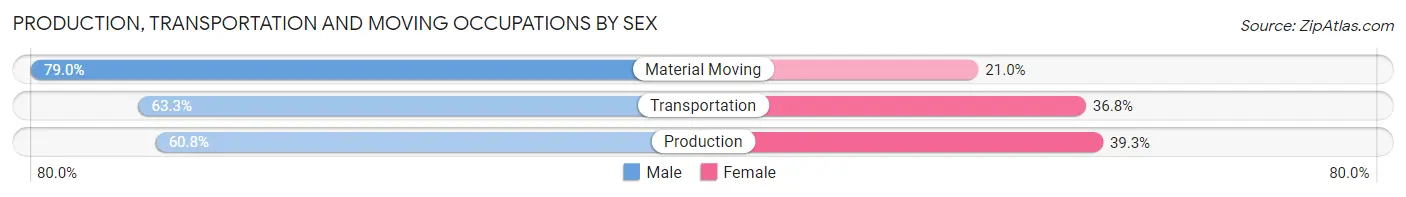
| Occupation | Male | Female |
| Production | 65 (60.8%) | 42 (39.3%) |
| Transportation | 74 (63.2%) | 43 (36.7%) |
| Material Moving | 49 (79.0%) | 13 (21.0%) |
| Total (Category) | 188 (65.7%) | 98 (34.3%) |
| Total (Overall) | 3,116 (57.5%) | 2,305 (42.5%) |
Employment Industries by Sex in Belmont
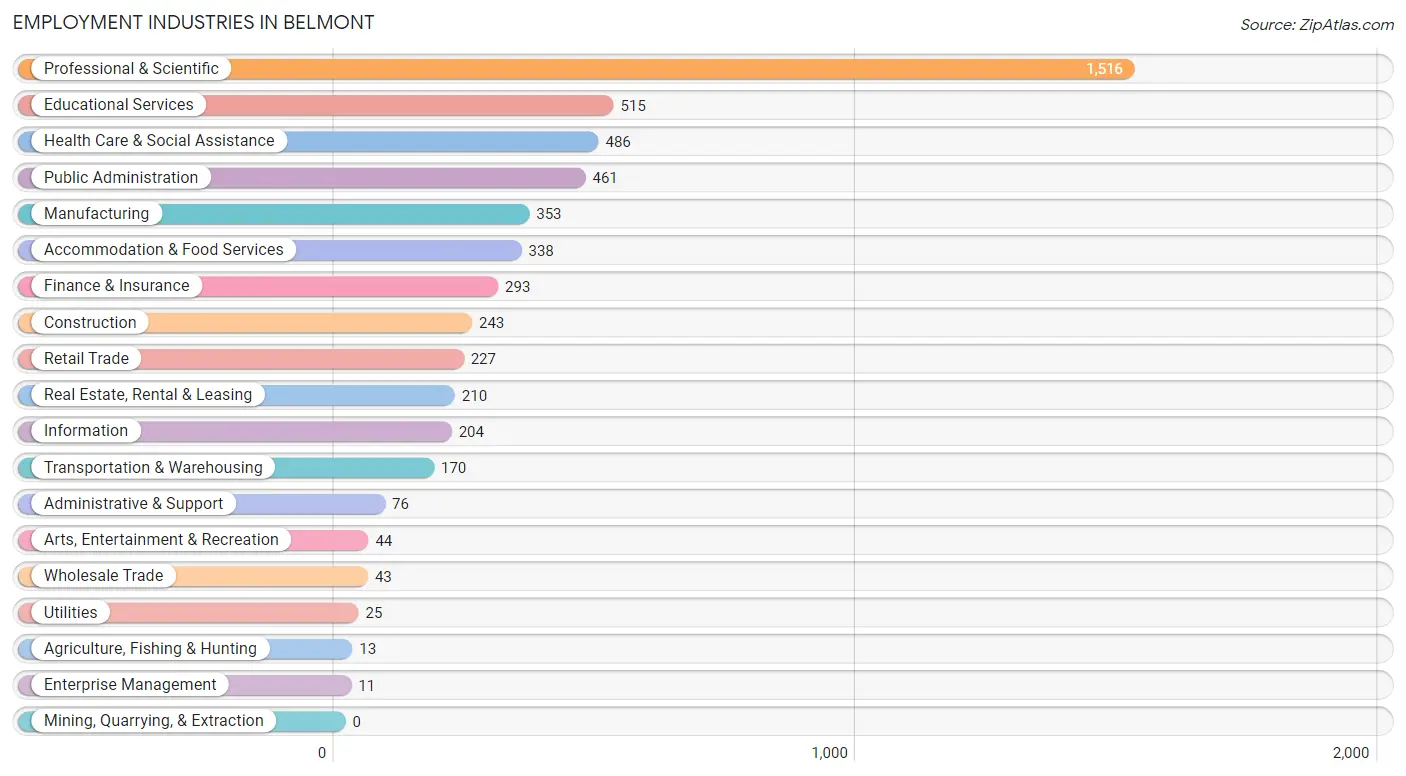
Employment Industries in Belmont
The major employment industries in Belmont include Professional & Scientific (1,516 | 28.0%), Educational Services (515 | 9.5%), Health Care & Social Assistance (486 | 9.0%), Public Administration (461 | 8.5%), and Manufacturing (353 | 6.5%).
Employment Industries by Sex in Belmont
The Belmont industries that see more men than women are Agriculture, Fishing & Hunting (100.0%), Wholesale Trade (100.0%), and Utilities (100.0%), whereas the industries that tend to have a higher number of women are Health Care & Social Assistance (79.8%), Accommodation & Food Services (69.2%), and Educational Services (61.8%).
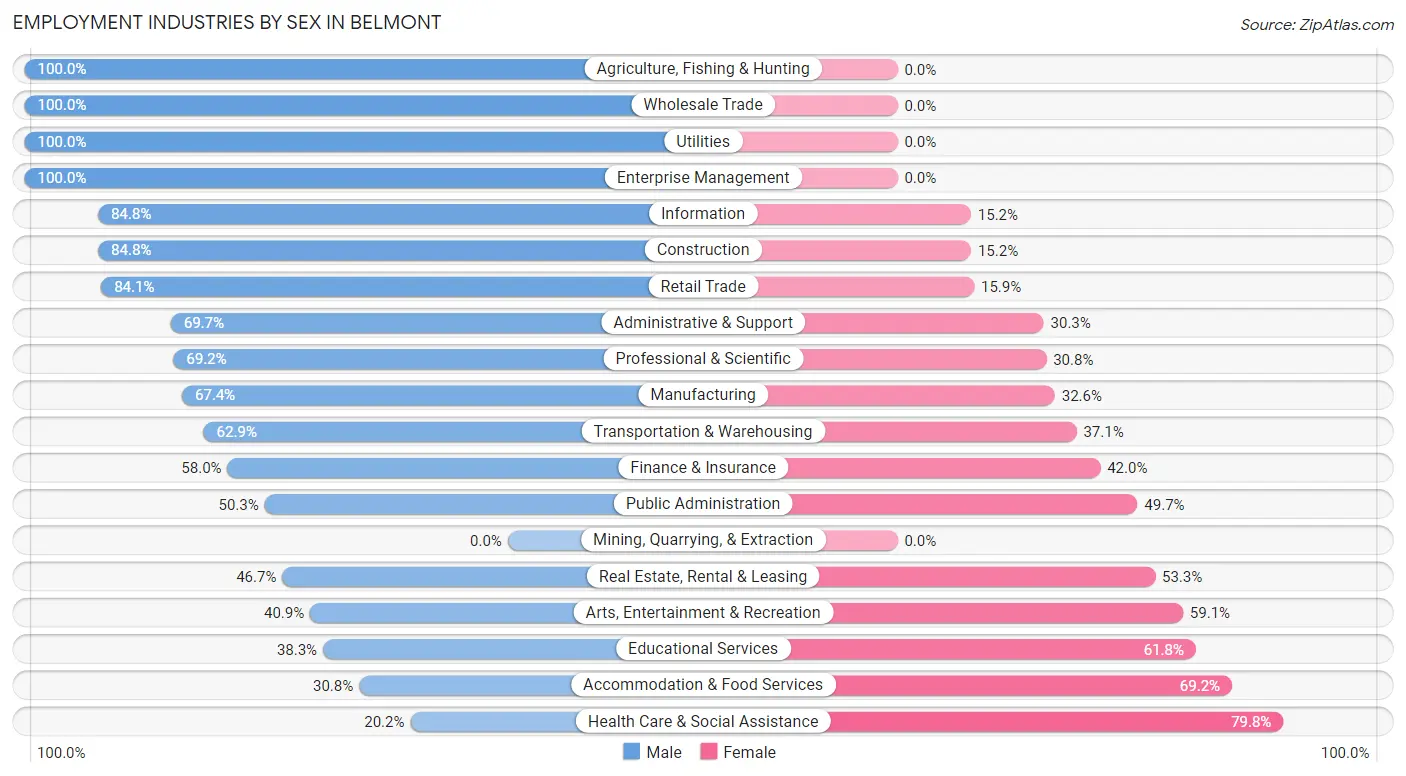
| Industry | Male | Female |
| Agriculture, Fishing & Hunting | 13 (100.0%) | 0 (0.0%) |
| Mining, Quarrying, & Extraction | 0 (0.0%) | 0 (0.0%) |
| Construction | 206 (84.8%) | 37 (15.2%) |
| Manufacturing | 238 (67.4%) | 115 (32.6%) |
| Wholesale Trade | 43 (100.0%) | 0 (0.0%) |
| Retail Trade | 191 (84.1%) | 36 (15.9%) |
| Transportation & Warehousing | 107 (62.9%) | 63 (37.1%) |
| Utilities | 25 (100.0%) | 0 (0.0%) |
| Information | 173 (84.8%) | 31 (15.2%) |
| Finance & Insurance | 170 (58.0%) | 123 (42.0%) |
| Real Estate, Rental & Leasing | 98 (46.7%) | 112 (53.3%) |
| Professional & Scientific | 1,049 (69.2%) | 467 (30.8%) |
| Enterprise Management | 11 (100.0%) | 0 (0.0%) |
| Administrative & Support | 53 (69.7%) | 23 (30.3%) |
| Educational Services | 197 (38.3%) | 318 (61.8%) |
| Health Care & Social Assistance | 98 (20.2%) | 388 (79.8%) |
| Arts, Entertainment & Recreation | 18 (40.9%) | 26 (59.1%) |
| Accommodation & Food Services | 104 (30.8%) | 234 (69.2%) |
| Public Administration | 232 (50.3%) | 229 (49.7%) |
| Total | 3,116 (57.5%) | 2,305 (42.5%) |
Education in Belmont
School Enrollment in Belmont
The most common levels of schooling among the 3,033 students in Belmont are high school (762 | 25.1%), middle school (712 | 23.5%), and elementary school (678 | 22.4%).
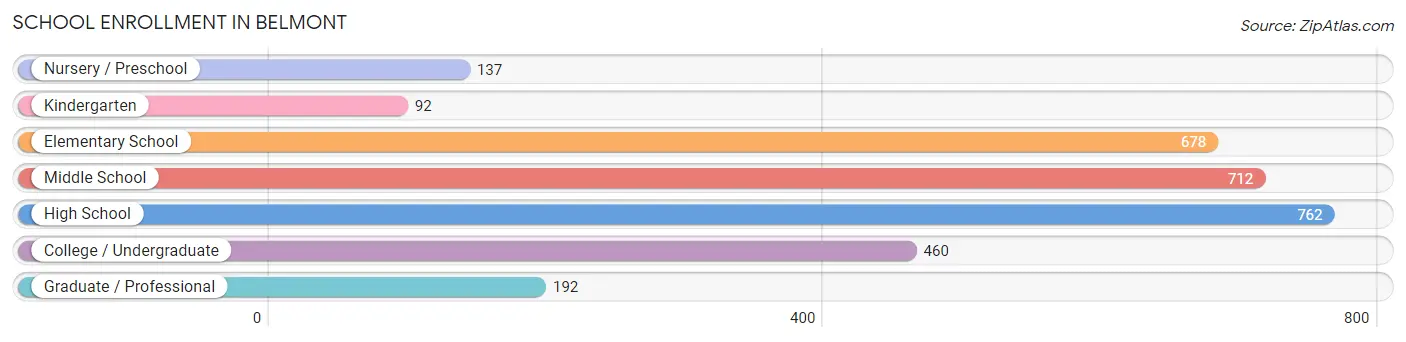
| School Level | # Students | % Students |
| Nursery / Preschool | 137 | 4.5% |
| Kindergarten | 92 | 3.0% |
| Elementary School | 678 | 22.4% |
| Middle School | 712 | 23.5% |
| High School | 762 | 25.1% |
| College / Undergraduate | 460 | 15.2% |
| Graduate / Professional | 192 | 6.3% |
| Total | 3,033 | 100.0% |
School Enrollment by Age by Funding Source in Belmont
Out of a total of 3,033 students who are enrolled in schools in Belmont, 467 (15.4%) attend a private institution, while the remaining 2,566 (84.6%) are enrolled in public schools. The age group of 3 to 4 year olds has the highest likelihood of being enrolled in private schools, with 71 (72.5% in the age bracket) enrolled. Conversely, the age group of 15 to 17 year olds has the lowest likelihood of being enrolled in a private school, with 516 (95.2% in the age bracket) attending a public institution.
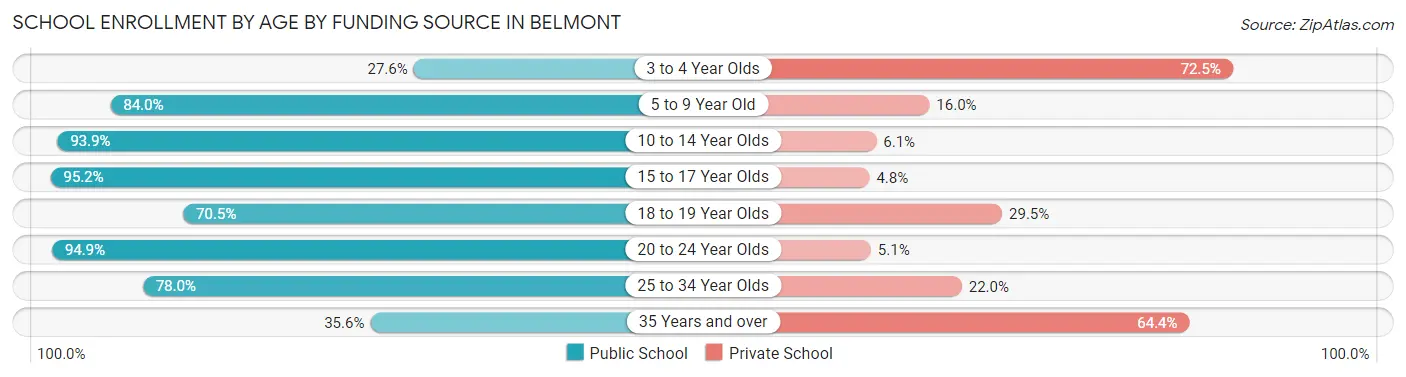
| Age Bracket | Public School | Private School |
| 3 to 4 Year Olds | 27 (27.6%) | 71 (72.5%) |
| 5 to 9 Year Old | 579 (84.0%) | 110 (16.0%) |
| 10 to 14 Year Olds | 896 (93.9%) | 58 (6.1%) |
| 15 to 17 Year Olds | 516 (95.2%) | 26 (4.8%) |
| 18 to 19 Year Olds | 172 (70.5%) | 72 (29.5%) |
| 20 to 24 Year Olds | 281 (94.9%) | 15 (5.1%) |
| 25 to 34 Year Olds | 39 (78.0%) | 11 (22.0%) |
| 35 Years and over | 57 (35.6%) | 103 (64.4%) |
| Total | 2,566 (84.6%) | 467 (15.4%) |
Educational Attainment by Field of Study in Belmont
Business (977 | 19.3%), engineering (696 | 13.8%), social sciences (592 | 11.7%), computers & mathematics (553 | 10.9%), and science & technology (403 | 8.0%) are the most common fields of study among 5,058 individuals in Belmont who have obtained a bachelor's degree or higher.
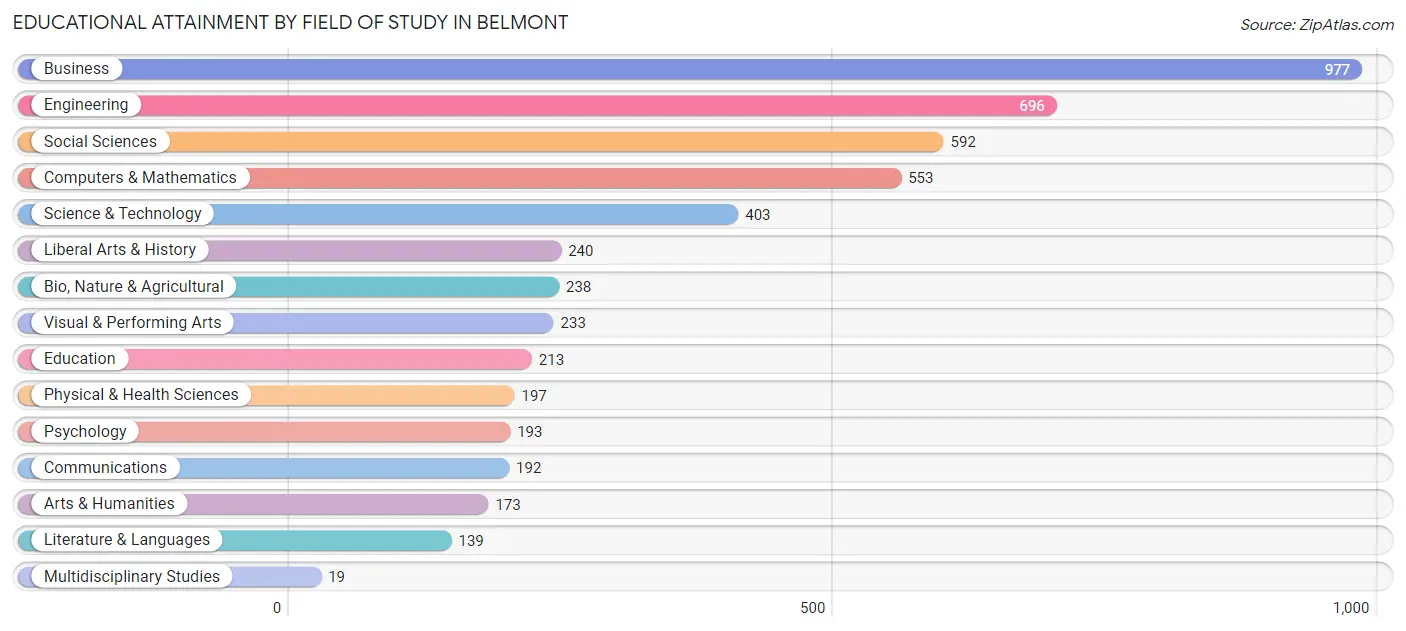
| Field of Study | # Graduates | % Graduates |
| Computers & Mathematics | 553 | 10.9% |
| Bio, Nature & Agricultural | 238 | 4.7% |
| Physical & Health Sciences | 197 | 3.9% |
| Psychology | 193 | 3.8% |
| Social Sciences | 592 | 11.7% |
| Engineering | 696 | 13.8% |
| Multidisciplinary Studies | 19 | 0.4% |
| Science & Technology | 403 | 8.0% |
| Business | 977 | 19.3% |
| Education | 213 | 4.2% |
| Literature & Languages | 139 | 2.8% |
| Liberal Arts & History | 240 | 4.7% |
| Visual & Performing Arts | 233 | 4.6% |
| Communications | 192 | 3.8% |
| Arts & Humanities | 173 | 3.4% |
| Total | 5,058 | 100.0% |
Transportation & Commute in Belmont
Vehicle Availability by Sex in Belmont
The most prevalent vehicle ownership categories in Belmont are males with 2 vehicles (1,314, accounting for 45.0%) and females with 2 vehicles (998, making up 60.7%).
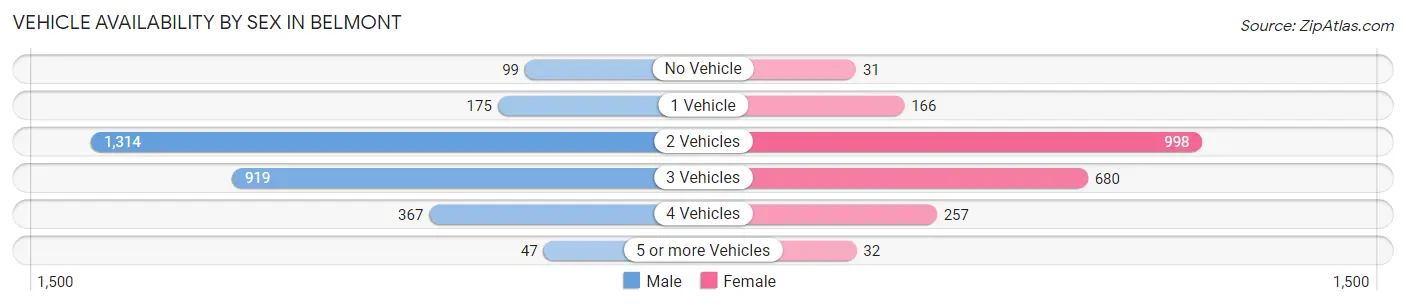
| Vehicles Available | Male | Female |
| No Vehicle | 99 (3.4%) | 31 (1.4%) |
| 1 Vehicle | 175 (6.0%) | 166 (7.7%) |
| 2 Vehicles | 1,314 (45.0%) | 998 (46.1%) |
| 3 Vehicles | 919 (31.5%) | 680 (31.4%) |
| 4 Vehicles | 367 (12.6%) | 257 (11.9%) |
| 5 or more Vehicles | 47 (1.6%) | 32 (1.5%) |
| Total | 2,921 (100.0%) | 2,164 (100.0%) |
Commute Time in Belmont
The most frequently occuring commute durations in Belmont are 15 to 19 minutes (634 commuters, 17.1%), 10 to 14 minutes (467 commuters, 12.6%), and 45 to 59 minutes (446 commuters, 12.0%).
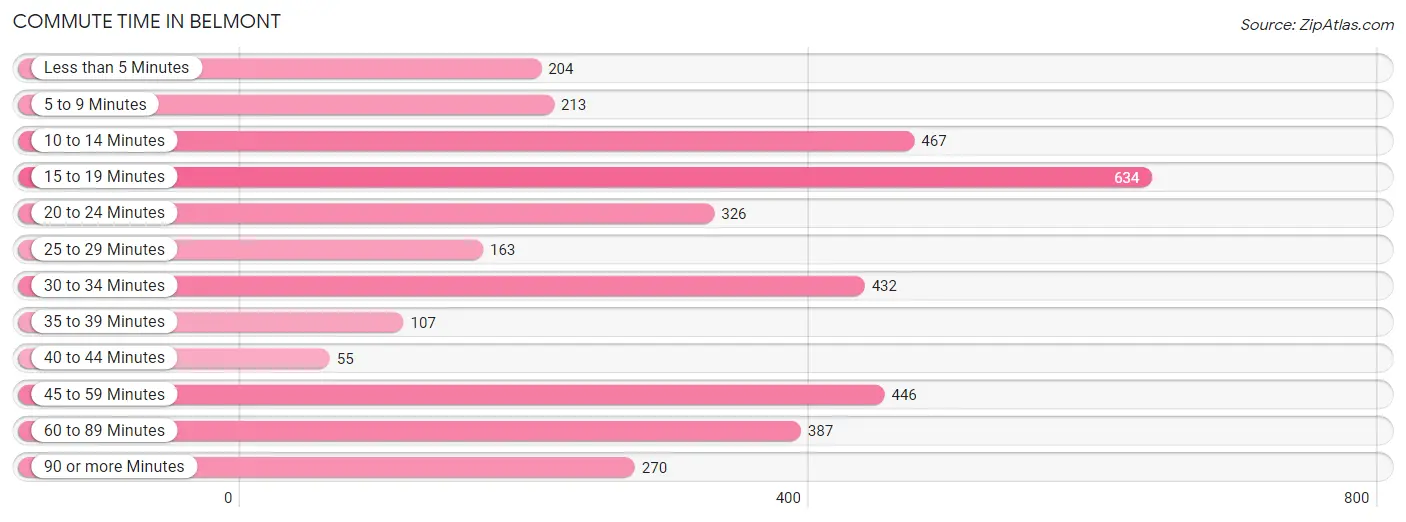
| Commute Time | # Commuters | % Commuters |
| Less than 5 Minutes | 204 | 5.5% |
| 5 to 9 Minutes | 213 | 5.8% |
| 10 to 14 Minutes | 467 | 12.6% |
| 15 to 19 Minutes | 634 | 17.1% |
| 20 to 24 Minutes | 326 | 8.8% |
| 25 to 29 Minutes | 163 | 4.4% |
| 30 to 34 Minutes | 432 | 11.7% |
| 35 to 39 Minutes | 107 | 2.9% |
| 40 to 44 Minutes | 55 | 1.5% |
| 45 to 59 Minutes | 446 | 12.0% |
| 60 to 89 Minutes | 387 | 10.4% |
| 90 or more Minutes | 270 | 7.3% |
Commute Time by Sex in Belmont
The most common commute times in Belmont are 15 to 19 minutes (372 commuters, 17.5%) for males and 10 to 14 minutes (312 commuters, 19.8%) for females.
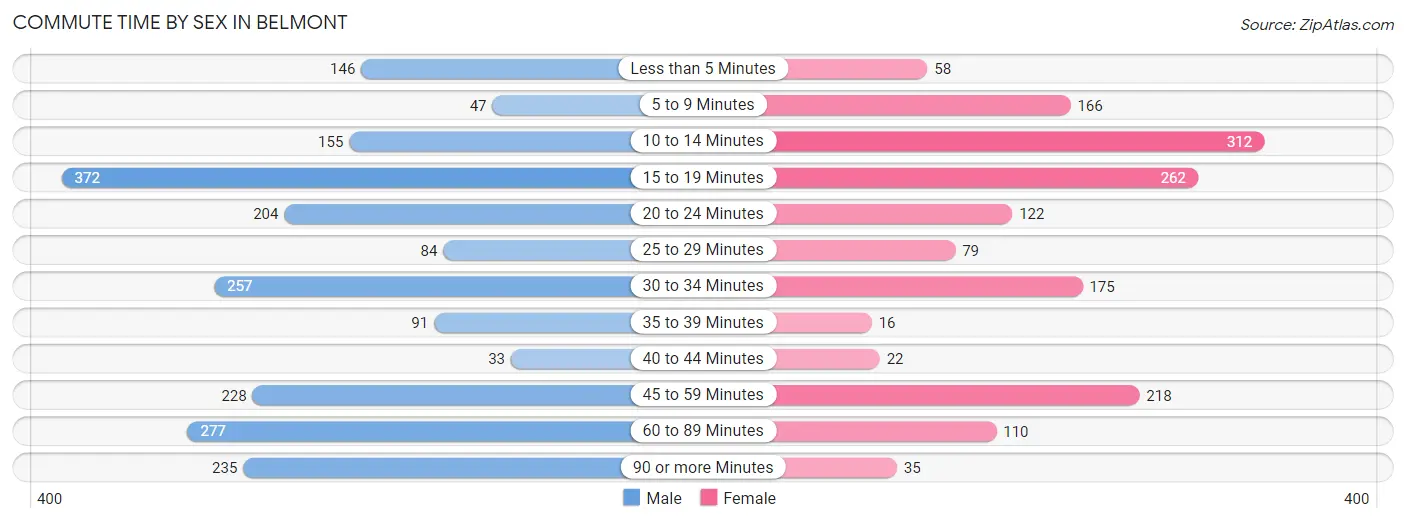
| Commute Time | Male | Female |
| Less than 5 Minutes | 146 (6.9%) | 58 (3.7%) |
| 5 to 9 Minutes | 47 (2.2%) | 166 (10.5%) |
| 10 to 14 Minutes | 155 (7.3%) | 312 (19.8%) |
| 15 to 19 Minutes | 372 (17.5%) | 262 (16.6%) |
| 20 to 24 Minutes | 204 (9.6%) | 122 (7.7%) |
| 25 to 29 Minutes | 84 (4.0%) | 79 (5.0%) |
| 30 to 34 Minutes | 257 (12.1%) | 175 (11.1%) |
| 35 to 39 Minutes | 91 (4.3%) | 16 (1.0%) |
| 40 to 44 Minutes | 33 (1.5%) | 22 (1.4%) |
| 45 to 59 Minutes | 228 (10.7%) | 218 (13.8%) |
| 60 to 89 Minutes | 277 (13.0%) | 110 (7.0%) |
| 90 or more Minutes | 235 (11.0%) | 35 (2.2%) |
Time of Departure to Work by Sex in Belmont
The most frequent times of departure to work in Belmont are 7:00 AM to 7:29 AM (403, 18.9%) for males and 7:00 AM to 7:29 AM (335, 21.3%) for females.
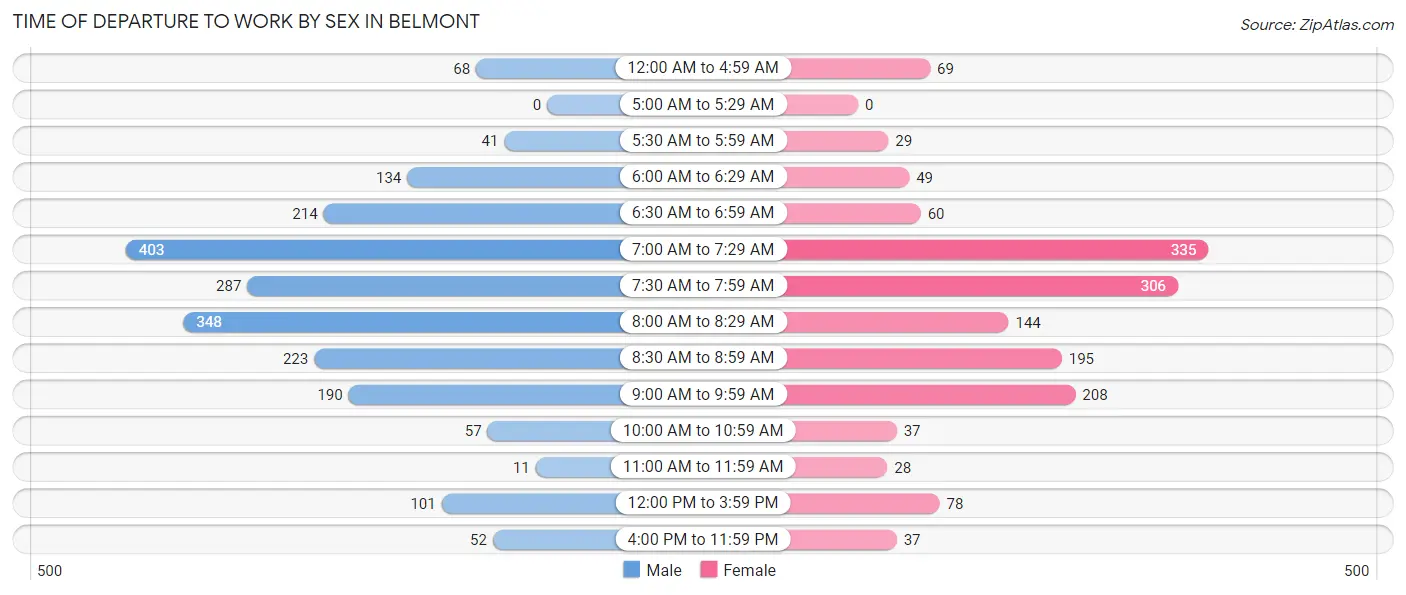
| Time of Departure | Male | Female |
| 12:00 AM to 4:59 AM | 68 (3.2%) | 69 (4.4%) |
| 5:00 AM to 5:29 AM | 0 (0.0%) | 0 (0.0%) |
| 5:30 AM to 5:59 AM | 41 (1.9%) | 29 (1.8%) |
| 6:00 AM to 6:29 AM | 134 (6.3%) | 49 (3.1%) |
| 6:30 AM to 6:59 AM | 214 (10.1%) | 60 (3.8%) |
| 7:00 AM to 7:29 AM | 403 (18.9%) | 335 (21.3%) |
| 7:30 AM to 7:59 AM | 287 (13.5%) | 306 (19.4%) |
| 8:00 AM to 8:29 AM | 348 (16.4%) | 144 (9.1%) |
| 8:30 AM to 8:59 AM | 223 (10.5%) | 195 (12.4%) |
| 9:00 AM to 9:59 AM | 190 (8.9%) | 208 (13.2%) |
| 10:00 AM to 10:59 AM | 57 (2.7%) | 37 (2.4%) |
| 11:00 AM to 11:59 AM | 11 (0.5%) | 28 (1.8%) |
| 12:00 PM to 3:59 PM | 101 (4.7%) | 78 (5.0%) |
| 4:00 PM to 11:59 PM | 52 (2.4%) | 37 (2.4%) |
| Total | 2,129 (100.0%) | 1,575 (100.0%) |
Housing Occupancy in Belmont
Occupancy by Ownership in Belmont
Of the total 3,132 dwellings in Belmont, owner-occupied units account for 2,748 (87.7%), while renter-occupied units make up 384 (12.3%).
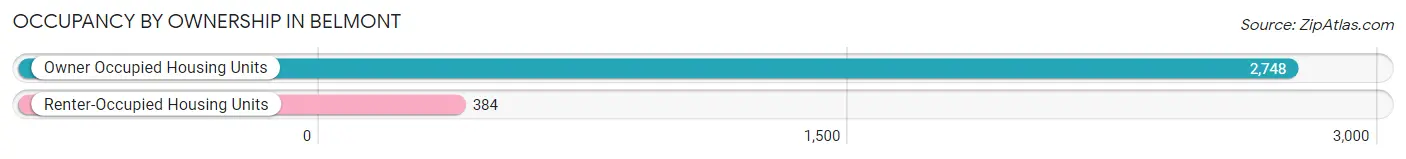
| Occupancy | # Housing Units | % Housing Units |
| Owner Occupied Housing Units | 2,748 | 87.7% |
| Renter-Occupied Housing Units | 384 | 12.3% |
| Total Occupied Housing Units | 3,132 | 100.0% |
Occupancy by Household Size in Belmont
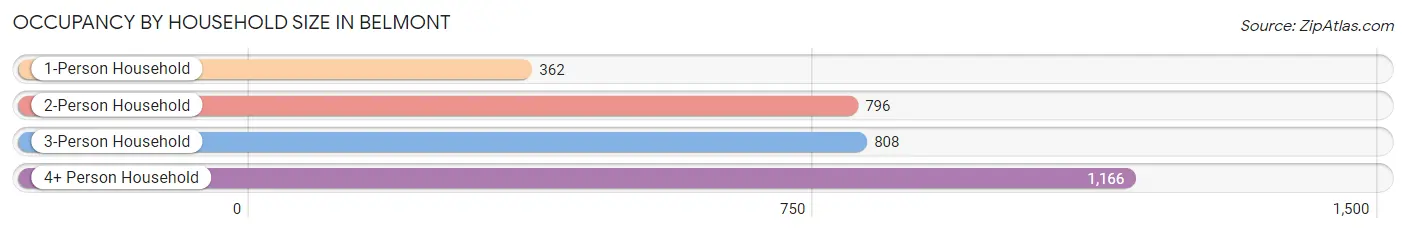
| Household Size | # Housing Units | % Housing Units |
| 1-Person Household | 362 | 11.6% |
| 2-Person Household | 796 | 25.4% |
| 3-Person Household | 808 | 25.8% |
| 4+ Person Household | 1,166 | 37.2% |
| Total Housing Units | 3,132 | 100.0% |
Occupancy by Ownership by Household Size in Belmont
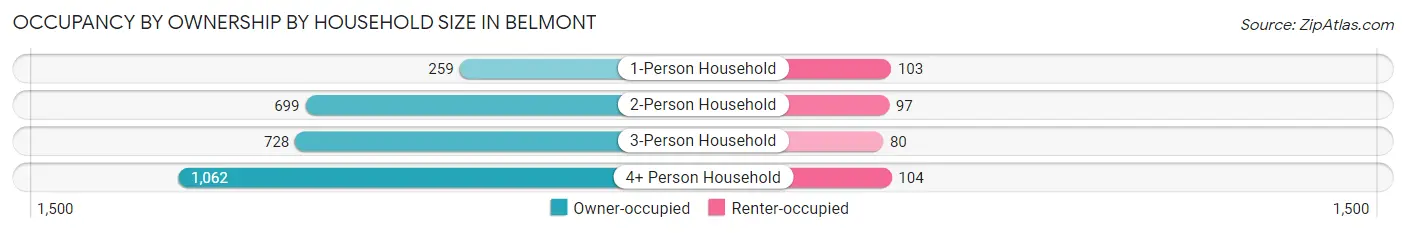
| Household Size | Owner-occupied | Renter-occupied |
| 1-Person Household | 259 (71.6%) | 103 (28.4%) |
| 2-Person Household | 699 (87.8%) | 97 (12.2%) |
| 3-Person Household | 728 (90.1%) | 80 (9.9%) |
| 4+ Person Household | 1,062 (91.1%) | 104 (8.9%) |
| Total Housing Units | 2,748 (87.7%) | 384 (12.3%) |
Occupancy by Educational Attainment in Belmont
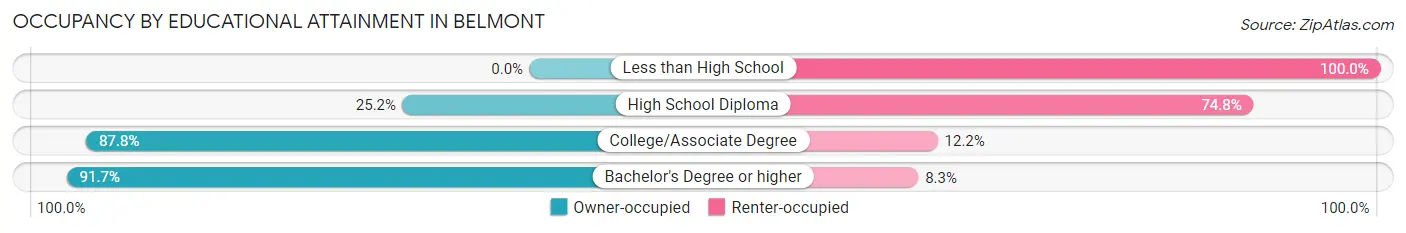
| Household Size | Owner-occupied | Renter-occupied |
| Less than High School | 0 (0.0%) | 29 (100.0%) |
| High School Diploma | 31 (25.2%) | 92 (74.8%) |
| College/Associate Degree | 339 (87.8%) | 47 (12.2%) |
| Bachelor's Degree or higher | 2,378 (91.7%) | 216 (8.3%) |
Occupancy by Age of Householder in Belmont
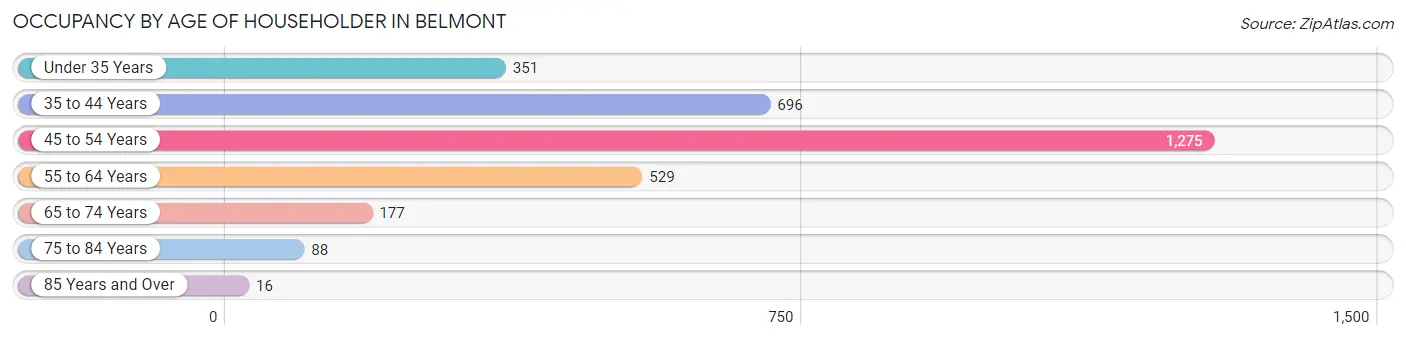
| Age Bracket | # Households | % Households |
| Under 35 Years | 351 | 11.2% |
| 35 to 44 Years | 696 | 22.2% |
| 45 to 54 Years | 1,275 | 40.7% |
| 55 to 64 Years | 529 | 16.9% |
| 65 to 74 Years | 177 | 5.7% |
| 75 to 84 Years | 88 | 2.8% |
| 85 Years and Over | 16 | 0.5% |
| Total | 3,132 | 100.0% |
Housing Finances in Belmont
Median Income by Occupancy in Belmont
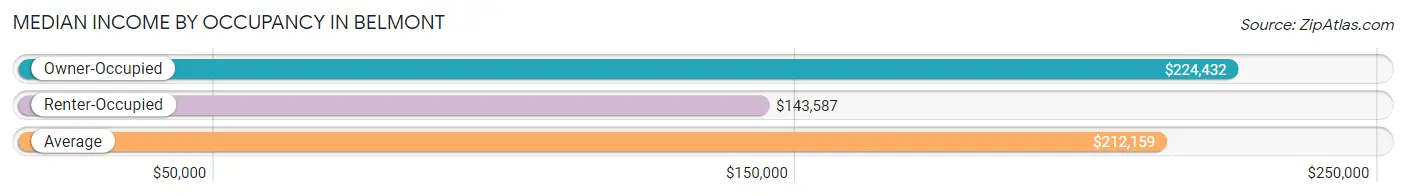
| Occupancy Type | # Households | Median Income |
| Owner-Occupied | 2,748 (87.7%) | $224,432 |
| Renter-Occupied | 384 (12.3%) | $143,587 |
| Average | 3,132 (100.0%) | $212,159 |
Occupancy by Householder Income Bracket in Belmont
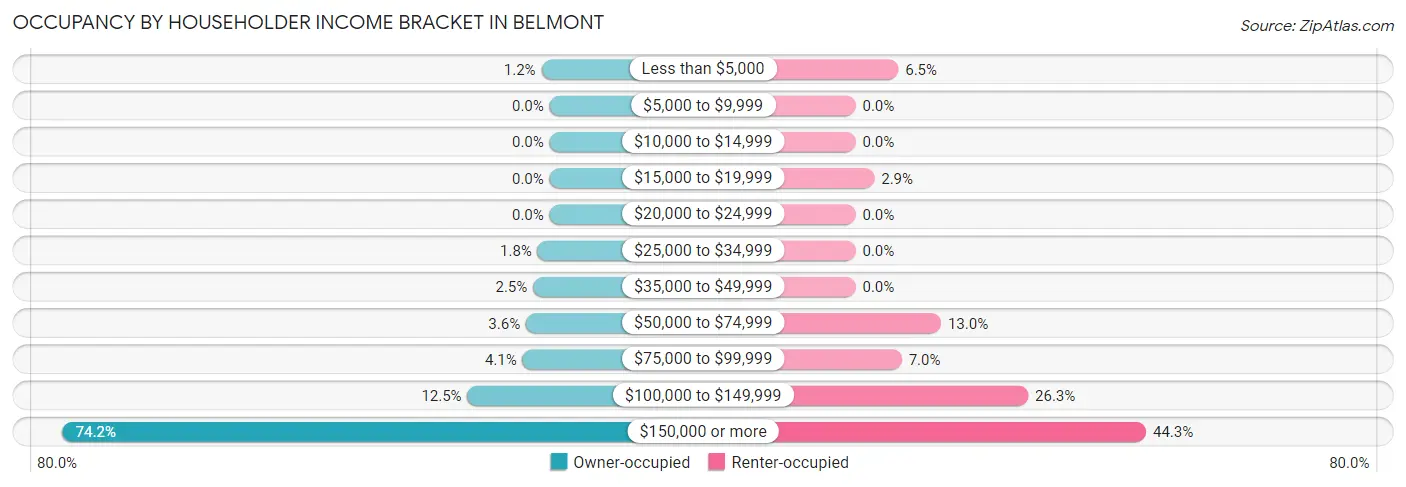
| Income Bracket | Owner-occupied | Renter-occupied |
| Less than $5,000 | 34 (1.2%) | 25 (6.5%) |
| $5,000 to $9,999 | 0 (0.0%) | 0 (0.0%) |
| $10,000 to $14,999 | 0 (0.0%) | 0 (0.0%) |
| $15,000 to $19,999 | 0 (0.0%) | 11 (2.9%) |
| $20,000 to $24,999 | 0 (0.0%) | 0 (0.0%) |
| $25,000 to $34,999 | 50 (1.8%) | 0 (0.0%) |
| $35,000 to $49,999 | 69 (2.5%) | 0 (0.0%) |
| $50,000 to $74,999 | 99 (3.6%) | 50 (13.0%) |
| $75,000 to $99,999 | 113 (4.1%) | 27 (7.0%) |
| $100,000 to $149,999 | 344 (12.5%) | 101 (26.3%) |
| $150,000 or more | 2,039 (74.2%) | 170 (44.3%) |
| Total | 2,748 (100.0%) | 384 (100.0%) |
Monthly Housing Cost Tiers in Belmont
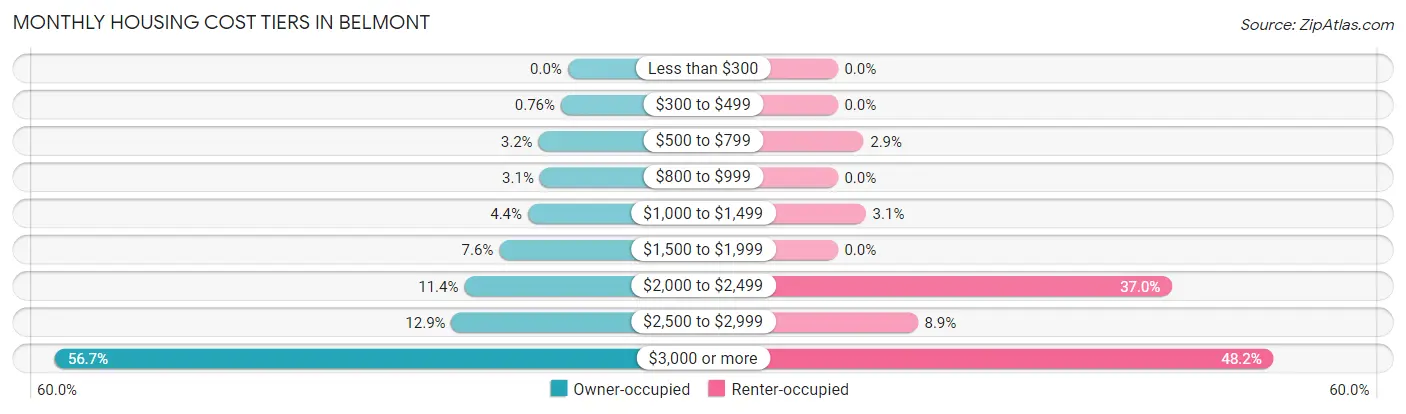
| Monthly Cost | Owner-occupied | Renter-occupied |
| Less than $300 | 0 (0.0%) | 0 (0.0%) |
| $300 to $499 | 21 (0.8%) | 0 (0.0%) |
| $500 to $799 | 89 (3.2%) | 11 (2.9%) |
| $800 to $999 | 85 (3.1%) | 0 (0.0%) |
| $1,000 to $1,499 | 121 (4.4%) | 12 (3.1%) |
| $1,500 to $1,999 | 208 (7.6%) | 0 (0.0%) |
| $2,000 to $2,499 | 314 (11.4%) | 142 (37.0%) |
| $2,500 to $2,999 | 353 (12.9%) | 34 (8.8%) |
| $3,000 or more | 1,557 (56.7%) | 185 (48.2%) |
| Total | 2,748 (100.0%) | 384 (100.0%) |
Physical Housing Characteristics in Belmont
Housing Structures in Belmont
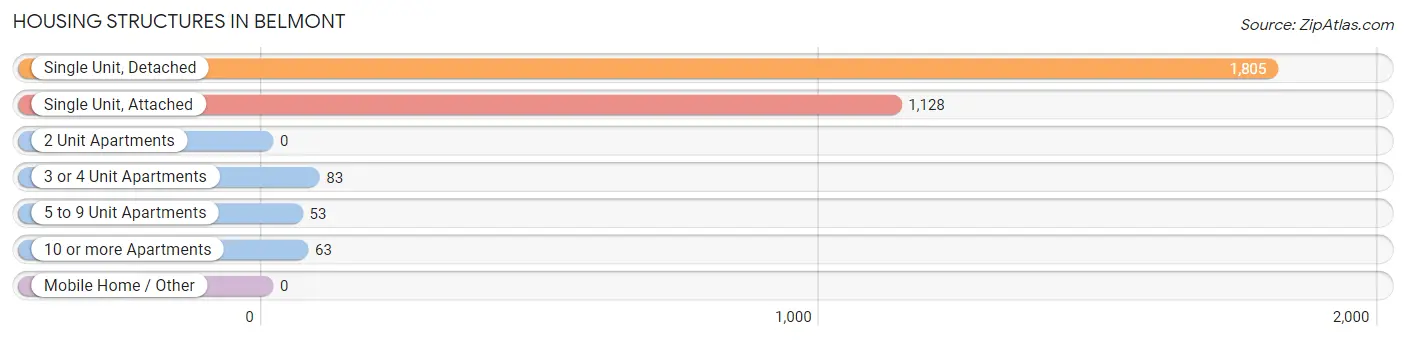
| Structure Type | # Housing Units | % Housing Units |
| Single Unit, Detached | 1,805 | 57.6% |
| Single Unit, Attached | 1,128 | 36.0% |
| 2 Unit Apartments | 0 | 0.0% |
| 3 or 4 Unit Apartments | 83 | 2.6% |
| 5 to 9 Unit Apartments | 53 | 1.7% |
| 10 or more Apartments | 63 | 2.0% |
| Mobile Home / Other | 0 | 0.0% |
| Total | 3,132 | 100.0% |
Housing Structures by Occupancy in Belmont
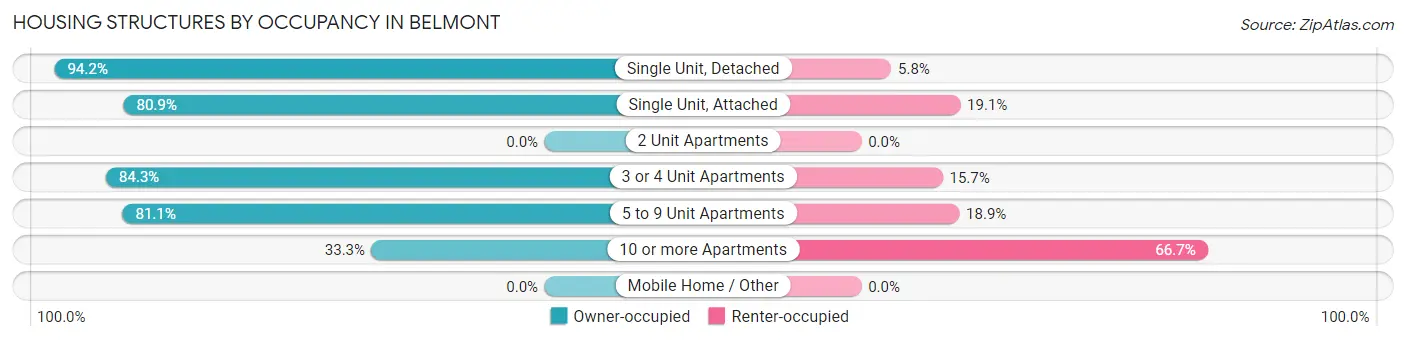
| Structure Type | Owner-occupied | Renter-occupied |
| Single Unit, Detached | 1,701 (94.2%) | 104 (5.8%) |
| Single Unit, Attached | 913 (80.9%) | 215 (19.1%) |
| 2 Unit Apartments | 0 (0.0%) | 0 (0.0%) |
| 3 or 4 Unit Apartments | 70 (84.3%) | 13 (15.7%) |
| 5 to 9 Unit Apartments | 43 (81.1%) | 10 (18.9%) |
| 10 or more Apartments | 21 (33.3%) | 42 (66.7%) |
| Mobile Home / Other | 0 (0.0%) | 0 (0.0%) |
| Total | 2,748 (87.7%) | 384 (12.3%) |
Housing Structures by Number of Rooms in Belmont
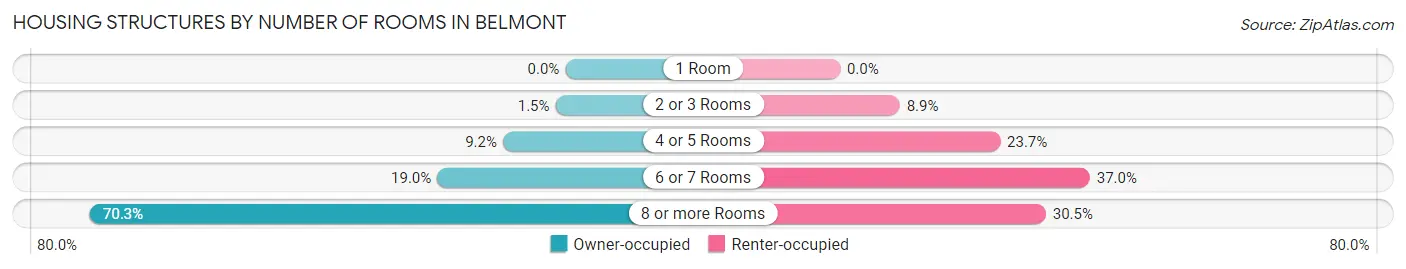
| Number of Rooms | Owner-occupied | Renter-occupied |
| 1 Room | 0 (0.0%) | 0 (0.0%) |
| 2 or 3 Rooms | 40 (1.5%) | 34 (8.8%) |
| 4 or 5 Rooms | 254 (9.2%) | 91 (23.7%) |
| 6 or 7 Rooms | 521 (19.0%) | 142 (37.0%) |
| 8 or more Rooms | 1,933 (70.3%) | 117 (30.5%) |
| Total | 2,748 (100.0%) | 384 (100.0%) |
Housing Structure by Heating Type in Belmont
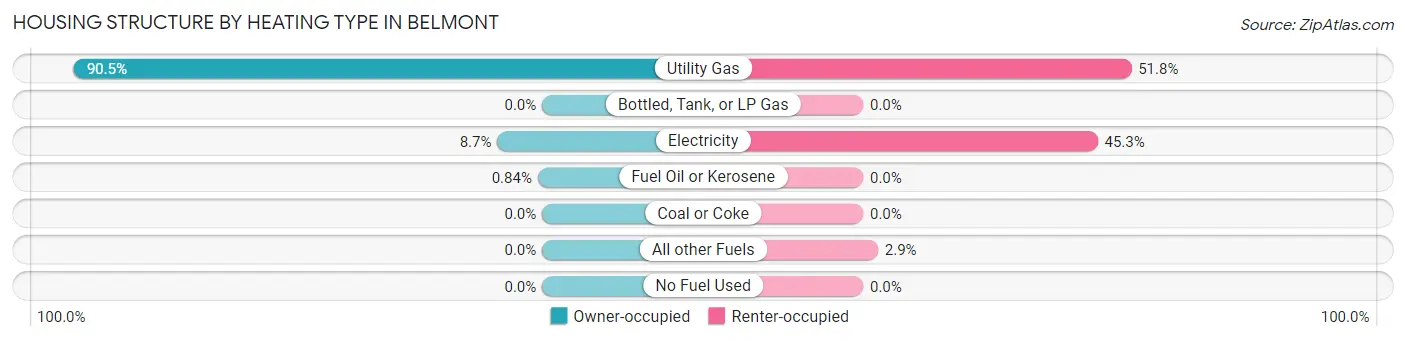
| Heating Type | Owner-occupied | Renter-occupied |
| Utility Gas | 2,487 (90.5%) | 199 (51.8%) |
| Bottled, Tank, or LP Gas | 0 (0.0%) | 0 (0.0%) |
| Electricity | 238 (8.7%) | 174 (45.3%) |
| Fuel Oil or Kerosene | 23 (0.8%) | 0 (0.0%) |
| Coal or Coke | 0 (0.0%) | 0 (0.0%) |
| All other Fuels | 0 (0.0%) | 11 (2.9%) |
| No Fuel Used | 0 (0.0%) | 0 (0.0%) |
| Total | 2,748 (100.0%) | 384 (100.0%) |
Household Vehicle Usage in Belmont
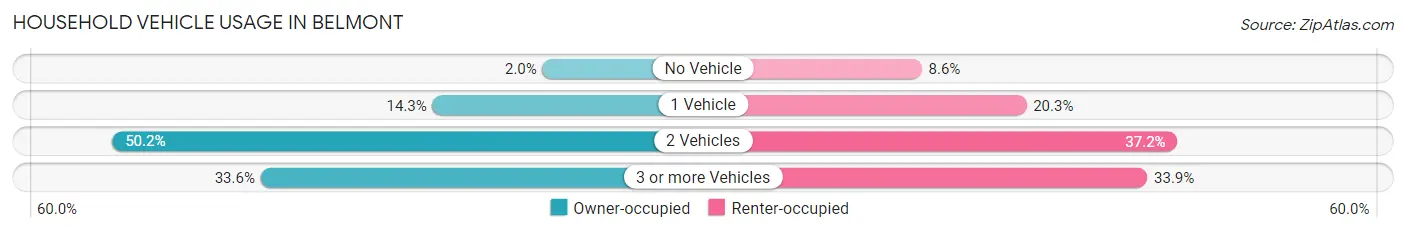
| Vehicles per Household | Owner-occupied | Renter-occupied |
| No Vehicle | 54 (2.0%) | 33 (8.6%) |
| 1 Vehicle | 393 (14.3%) | 78 (20.3%) |
| 2 Vehicles | 1,379 (50.2%) | 143 (37.2%) |
| 3 or more Vehicles | 922 (33.6%) | 130 (33.9%) |
| Total | 2,748 (100.0%) | 384 (100.0%) |
Real Estate & Mortgages in Belmont
Real Estate and Mortgage Overview in Belmont
| Characteristic | Without Mortgage | With Mortgage |
| Housing Units | 314 | 2,434 |
| Median Property Value | $800,500 | $743,700 |
| Median Household Income | $200,781 | $1,839 |
| Monthly Housing Costs | $946 | $1,557 |
| Real Estate Taxes | $6,376 | $18 |
Property Value by Mortgage Status in Belmont
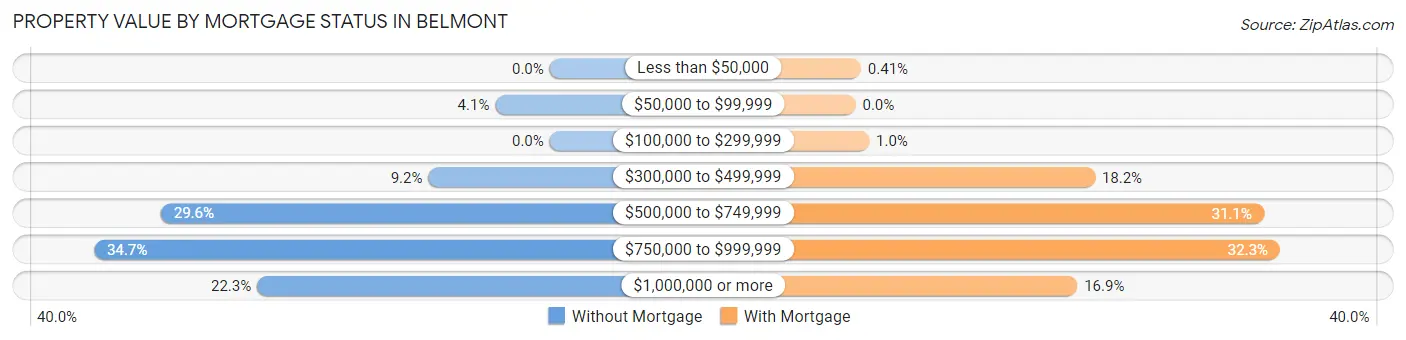
| Property Value | Without Mortgage | With Mortgage |
| Less than $50,000 | 0 (0.0%) | 10 (0.4%) |
| $50,000 to $99,999 | 13 (4.1%) | 0 (0.0%) |
| $100,000 to $299,999 | 0 (0.0%) | 25 (1.0%) |
| $300,000 to $499,999 | 29 (9.2%) | 444 (18.2%) |
| $500,000 to $749,999 | 93 (29.6%) | 757 (31.1%) |
| $750,000 to $999,999 | 109 (34.7%) | 787 (32.3%) |
| $1,000,000 or more | 70 (22.3%) | 411 (16.9%) |
| Total | 314 (100.0%) | 2,434 (100.0%) |
Household Income by Mortgage Status in Belmont
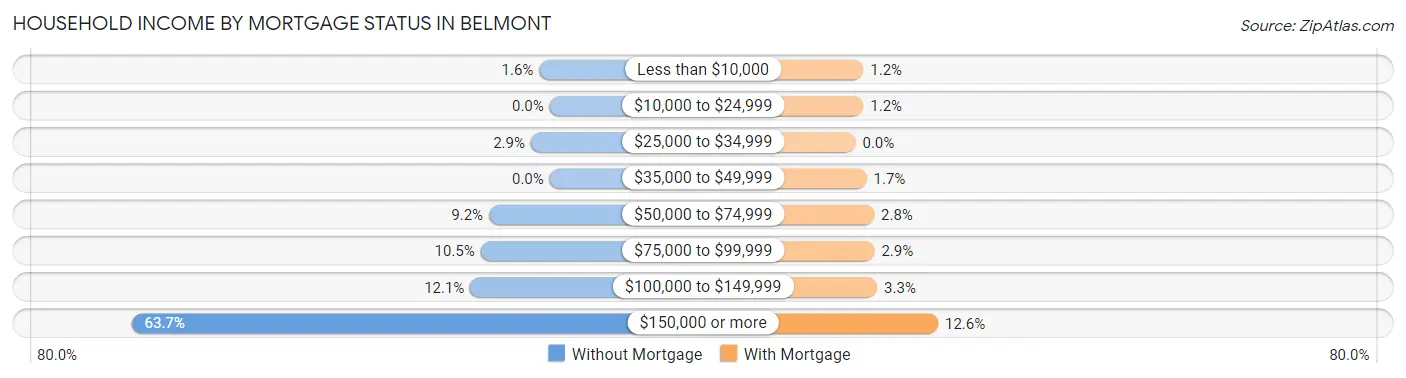
| Household Income | Without Mortgage | With Mortgage |
| Less than $10,000 | 5 (1.6%) | 29 (1.2%) |
| $10,000 to $24,999 | 0 (0.0%) | 29 (1.2%) |
| $25,000 to $34,999 | 9 (2.9%) | 0 (0.0%) |
| $35,000 to $49,999 | 0 (0.0%) | 41 (1.7%) |
| $50,000 to $74,999 | 29 (9.2%) | 69 (2.8%) |
| $75,000 to $99,999 | 33 (10.5%) | 70 (2.9%) |
| $100,000 to $149,999 | 38 (12.1%) | 80 (3.3%) |
| $150,000 or more | 200 (63.7%) | 306 (12.6%) |
| Total | 314 (100.0%) | 2,434 (100.0%) |
Property Value to Household Income Ratio in Belmont
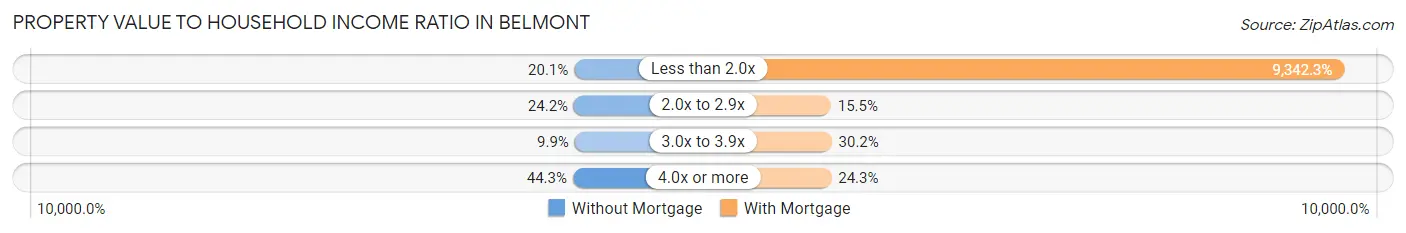
| Value-to-Income Ratio | Without Mortgage | With Mortgage |
| Less than 2.0x | 63 (20.1%) | 227,391 (9,342.3%) |
| 2.0x to 2.9x | 76 (24.2%) | 378 (15.5%) |
| 3.0x to 3.9x | 31 (9.9%) | 734 (30.2%) |
| 4.0x or more | 139 (44.3%) | 592 (24.3%) |
| Total | 314 (100.0%) | 2,434 (100.0%) |
Real Estate Taxes by Mortgage Status in Belmont
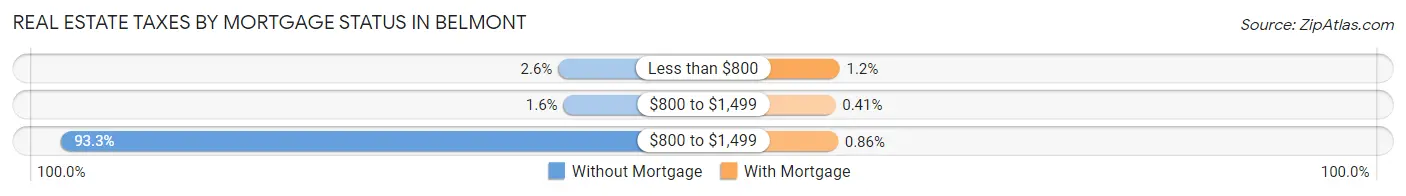
| Property Taxes | Without Mortgage | With Mortgage |
| Less than $800 | 8 (2.5%) | 29 (1.2%) |
| $800 to $1,499 | 5 (1.6%) | 10 (0.4%) |
| $800 to $1,499 | 293 (93.3%) | 21 (0.9%) |
| Total | 314 (100.0%) | 2,434 (100.0%) |
Health & Disability in Belmont
Health Insurance Coverage by Age in Belmont
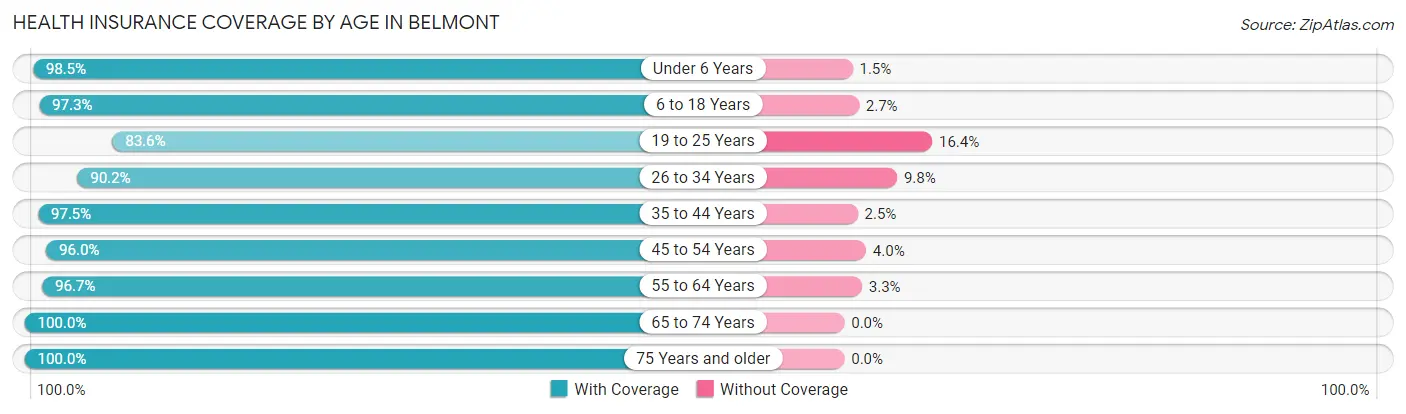
| Age Bracket | With Coverage | Without Coverage |
| Under 6 Years | 765 (98.5%) | 12 (1.5%) |
| 6 to 18 Years | 2,249 (97.3%) | 63 (2.7%) |
| 19 to 25 Years | 583 (83.6%) | 114 (16.4%) |
| 26 to 34 Years | 688 (90.2%) | 75 (9.8%) |
| 35 to 44 Years | 1,335 (97.5%) | 34 (2.5%) |
| 45 to 54 Years | 2,213 (96.0%) | 93 (4.0%) |
| 55 to 64 Years | 975 (96.7%) | 33 (3.3%) |
| 65 to 74 Years | 302 (100.0%) | 0 (0.0%) |
| 75 Years and older | 326 (100.0%) | 0 (0.0%) |
| Total | 9,436 (95.7%) | 424 (4.3%) |
Health Insurance Coverage by Citizenship Status in Belmont
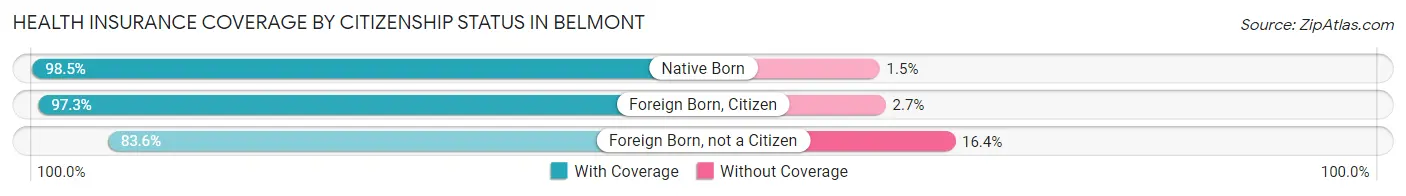
| Citizenship Status | With Coverage | Without Coverage |
| Native Born | 765 (98.5%) | 12 (1.5%) |
| Foreign Born, Citizen | 2,249 (97.3%) | 63 (2.7%) |
| Foreign Born, not a Citizen | 583 (83.6%) | 114 (16.4%) |
Health Insurance Coverage by Household Income in Belmont
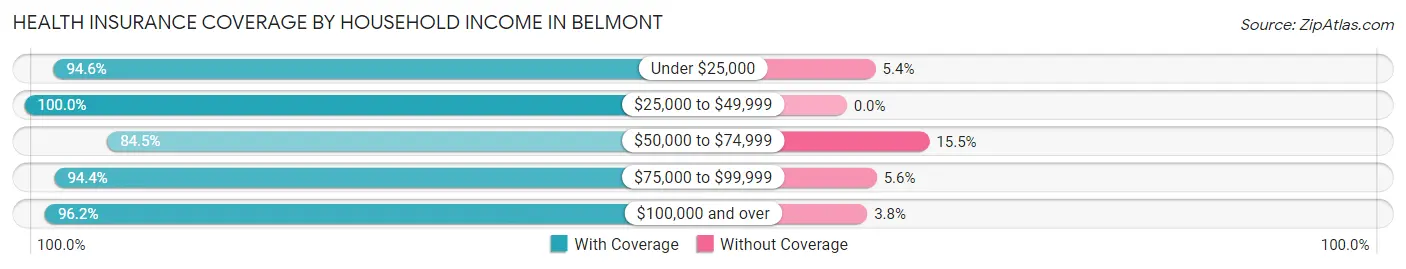
| Household Income | With Coverage | Without Coverage |
| Under $25,000 | 70 (94.6%) | 4 (5.4%) |
| $25,000 to $49,999 | 207 (100.0%) | 0 (0.0%) |
| $50,000 to $74,999 | 333 (84.5%) | 61 (15.5%) |
| $75,000 to $99,999 | 371 (94.4%) | 22 (5.6%) |
| $100,000 and over | 8,455 (96.2%) | 337 (3.8%) |
Public vs Private Health Insurance Coverage by Age in Belmont
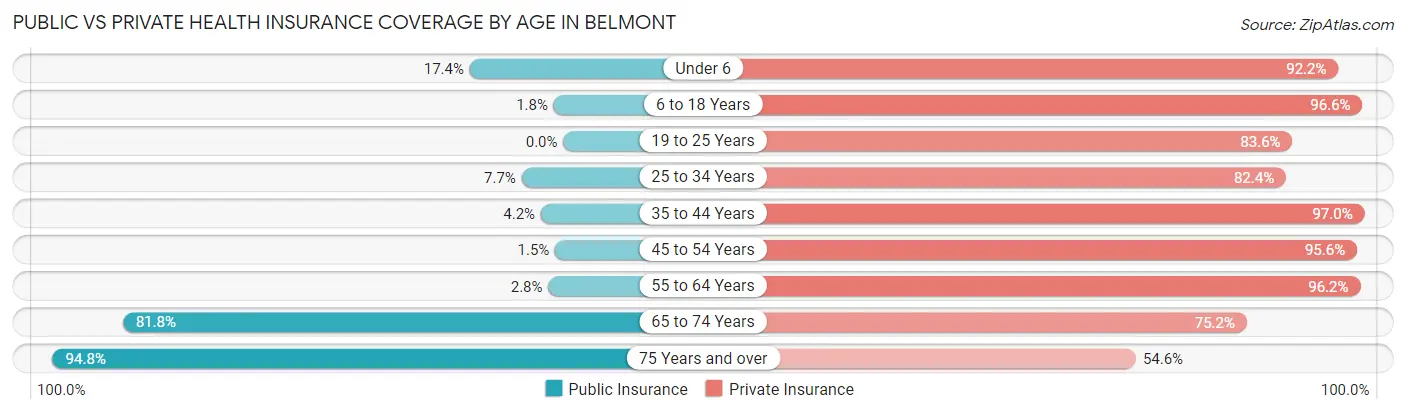
| Age Bracket | Public Insurance | Private Insurance |
| Under 6 | 135 (17.4%) | 716 (92.1%) |
| 6 to 18 Years | 41 (1.8%) | 2,234 (96.6%) |
| 19 to 25 Years | 0 (0.0%) | 583 (83.6%) |
| 25 to 34 Years | 59 (7.7%) | 629 (82.4%) |
| 35 to 44 Years | 57 (4.2%) | 1,328 (97.0%) |
| 45 to 54 Years | 35 (1.5%) | 2,205 (95.6%) |
| 55 to 64 Years | 28 (2.8%) | 970 (96.2%) |
| 65 to 74 Years | 247 (81.8%) | 227 (75.2%) |
| 75 Years and over | 309 (94.8%) | 178 (54.6%) |
| Total | 911 (9.2%) | 9,070 (92.0%) |
Disability Status by Sex by Age in Belmont
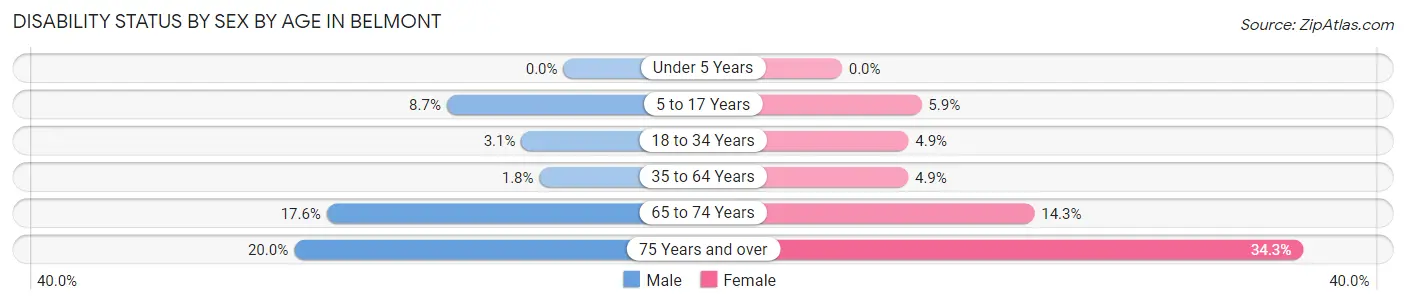
| Age Bracket | Male | Female |
| Under 5 Years | 0 (0.0%) | 0 (0.0%) |
| 5 to 17 Years | 88 (8.7%) | 74 (5.9%) |
| 18 to 34 Years | 29 (3.1%) | 34 (4.9%) |
| 35 to 64 Years | 41 (1.8%) | 117 (4.9%) |
| 65 to 74 Years | 26 (17.6%) | 22 (14.3%) |
| 75 Years and over | 29 (20.0%) | 62 (34.3%) |
Disability Class by Sex by Age in Belmont
Disability Class: Hearing Difficulty
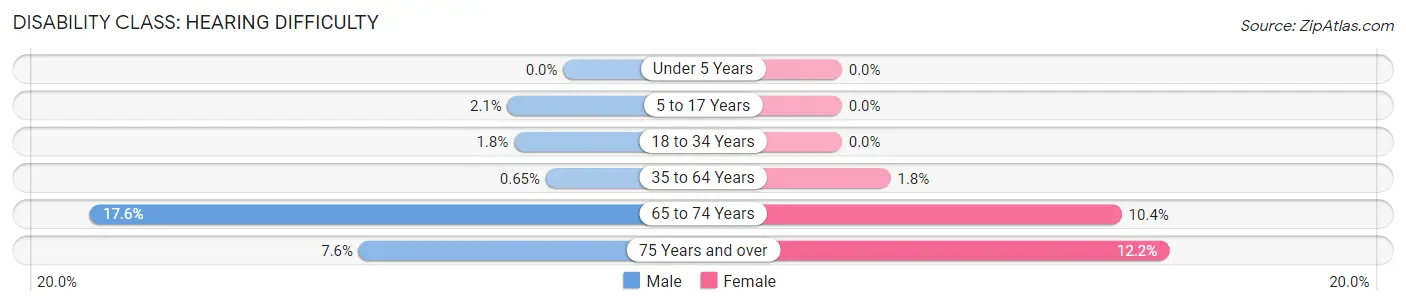
| Age Bracket | Male | Female |
| Under 5 Years | 0 (0.0%) | 0 (0.0%) |
| 5 to 17 Years | 21 (2.1%) | 0 (0.0%) |
| 18 to 34 Years | 17 (1.8%) | 0 (0.0%) |
| 35 to 64 Years | 15 (0.6%) | 43 (1.8%) |
| 65 to 74 Years | 26 (17.6%) | 16 (10.4%) |
| 75 Years and over | 11 (7.6%) | 22 (12.1%) |
Disability Class: Vision Difficulty
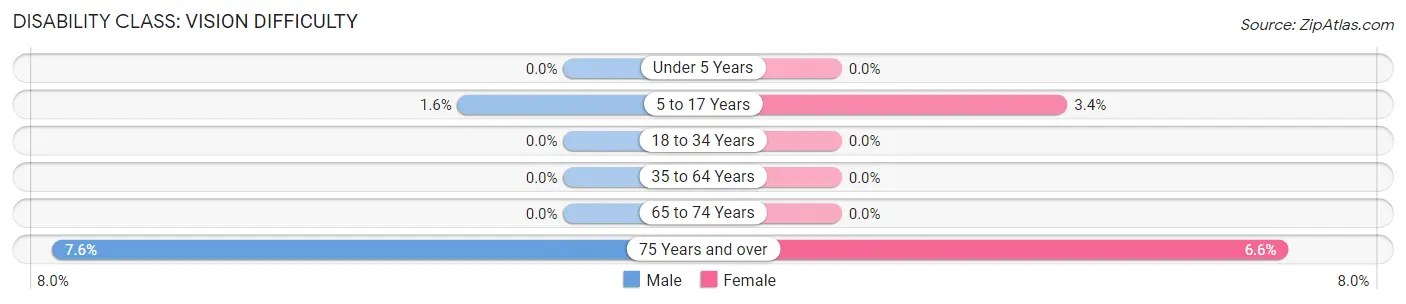
| Age Bracket | Male | Female |
| Under 5 Years | 0 (0.0%) | 0 (0.0%) |
| 5 to 17 Years | 16 (1.6%) | 42 (3.4%) |
| 18 to 34 Years | 0 (0.0%) | 0 (0.0%) |
| 35 to 64 Years | 0 (0.0%) | 0 (0.0%) |
| 65 to 74 Years | 0 (0.0%) | 0 (0.0%) |
| 75 Years and over | 11 (7.6%) | 12 (6.6%) |
Disability Class: Cognitive Difficulty
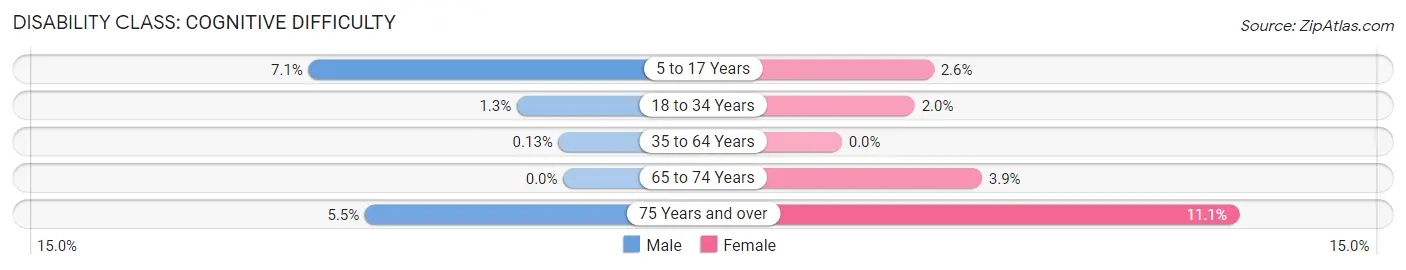
| Age Bracket | Male | Female |
| 5 to 17 Years | 72 (7.1%) | 32 (2.6%) |
| 18 to 34 Years | 12 (1.3%) | 14 (2.0%) |
| 35 to 64 Years | 3 (0.1%) | 0 (0.0%) |
| 65 to 74 Years | 0 (0.0%) | 6 (3.9%) |
| 75 Years and over | 8 (5.5%) | 20 (11.1%) |
Disability Class: Ambulatory Difficulty
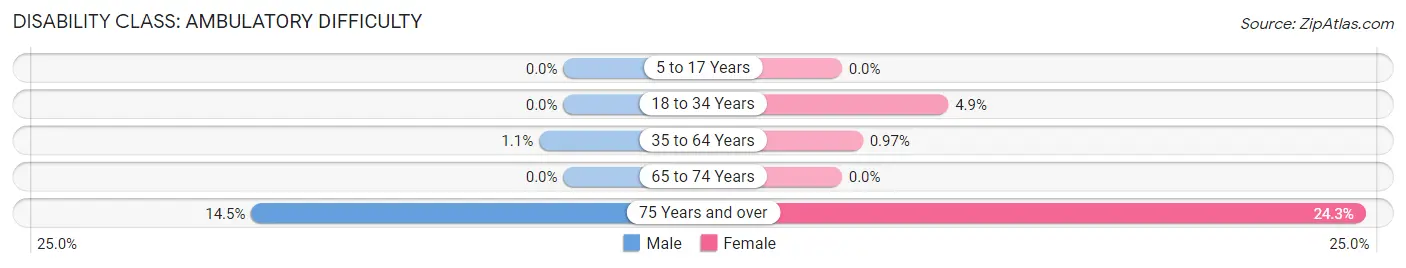
| Age Bracket | Male | Female |
| 5 to 17 Years | 0 (0.0%) | 0 (0.0%) |
| 18 to 34 Years | 0 (0.0%) | 34 (4.9%) |
| 35 to 64 Years | 26 (1.1%) | 23 (1.0%) |
| 65 to 74 Years | 0 (0.0%) | 0 (0.0%) |
| 75 Years and over | 21 (14.5%) | 44 (24.3%) |
Disability Class: Self-Care Difficulty
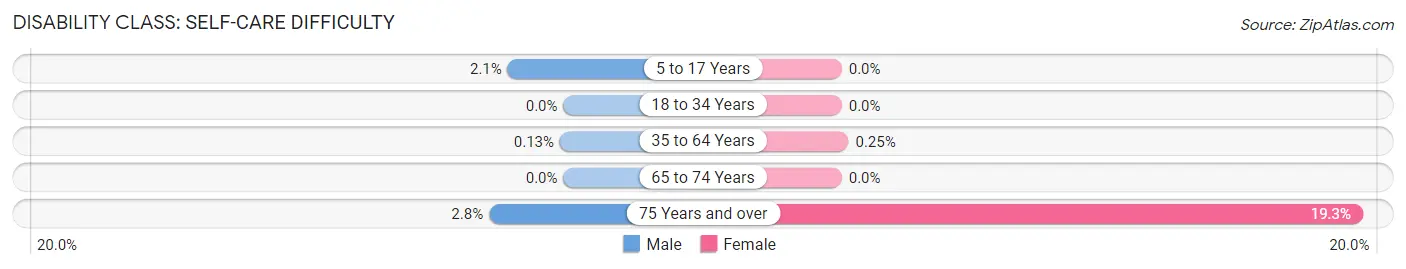
| Age Bracket | Male | Female |
| 5 to 17 Years | 21 (2.1%) | 0 (0.0%) |
| 18 to 34 Years | 0 (0.0%) | 0 (0.0%) |
| 35 to 64 Years | 3 (0.1%) | 6 (0.3%) |
| 65 to 74 Years | 0 (0.0%) | 0 (0.0%) |
| 75 Years and over | 4 (2.8%) | 35 (19.3%) |
Technology Access in Belmont
Computing Device Access in Belmont
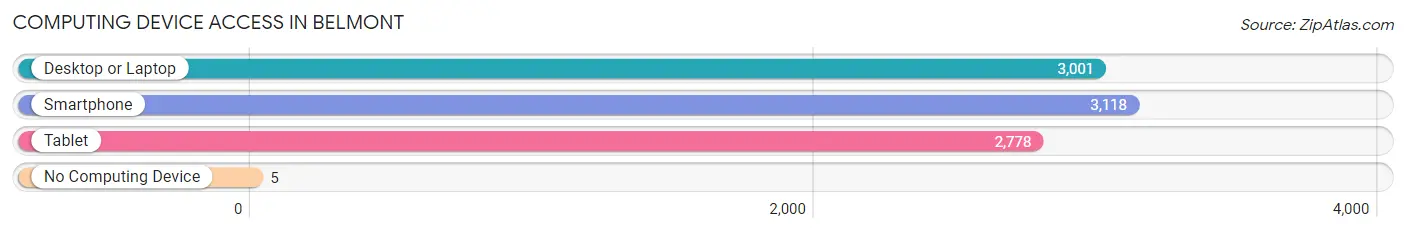
| Device Type | # Households | % Households |
| Desktop or Laptop | 3,001 | 95.8% |
| Smartphone | 3,118 | 99.6% |
| Tablet | 2,778 | 88.7% |
| No Computing Device | 5 | 0.2% |
| Total | 3,132 | 100.0% |
Internet Access in Belmont
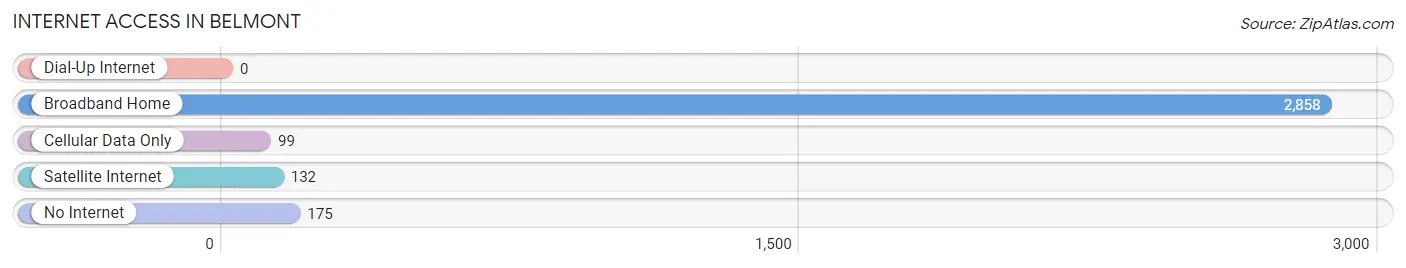
| Internet Type | # Households | % Households |
| Dial-Up Internet | 0 | 0.0% |
| Broadband Home | 2,858 | 91.2% |
| Cellular Data Only | 99 | 3.2% |
| Satellite Internet | 132 | 4.2% |
| No Internet | 175 | 5.6% |
| Total | 3,132 | 100.0% |
Belmont Summary
Belmont, Virginia is a small town located in the Shenandoah Valley of Virginia. It is situated in the northern part of the state, about 25 miles west of Winchester and about 75 miles west of Washington, D.C. The town is part of the Winchester, VA-WV Metropolitan Statistical Area and is home to a population of approximately 1,500 people.
History
Belmont was first settled in the late 1700s by a group of German immigrants. The town was originally known as “Bellemont” and was named after the beautiful mountain views that could be seen from the area. The town was officially incorporated in 1891 and was named after the nearby Bellemont Mountain.
In the late 1800s, Belmont was a thriving agricultural community. The town was home to several farms, a grist mill, a saw mill, and a general store. The town also had a post office, a blacksmith shop, and a school.
In the early 1900s, the town began to experience a decline in population as many of the residents moved away in search of better economic opportunities. However, the town was able to remain relatively stable due to its proximity to the nearby cities of Winchester and Front Royal.
Geography
Belmont is located in the northern part of Virginia in the Shenandoah Valley. The town is situated on the banks of the Shenandoah River and is surrounded by the Blue Ridge Mountains. The town is located about 25 miles west of Winchester and about 75 miles west of Washington, D.C.
The town has a total area of 0.7 square miles, all of which is land. The town is located at an elevation of 1,000 feet above sea level.
Economy
Belmont’s economy is largely based on agriculture and tourism. The town is home to several farms that produce a variety of crops, including corn, soybeans, wheat, and hay. The town is also home to several wineries and vineyards, which attract tourists from all over the region.
In addition to agriculture and tourism, Belmont is home to several small businesses, including restaurants, shops, and other services. The town is also home to a few manufacturing companies, which provide jobs for many of the town’s residents.
Demographics
As of the 2010 census, Belmont had a population of 1,500 people. The town has a median age of 43.7 years and a median household income of $45,000. The town is predominantly white (94.7%) and has a small Hispanic population (2.7%).
Belmont is a small, rural town with a close-knit community. The town is home to several churches, a library, and a few parks. The town is also home to a few historic sites, including the Bellemont Mansion and the Bellemont Cemetery.
Common Questions
What is Per Capita Income in Belmont?
Per Capita income in Belmont is $79,584.
What is the Median Family Income in Belmont?
Median Family Income in Belmont is $234,167.
What is the Median Household income in Belmont?
Median Household Income in Belmont is $212,159.
What is Income or Wage Gap in Belmont?
Income or Wage Gap in Belmont is 42.1%.
Women in Belmont earn 57.9 cents for every dollar earned by a man.
What is Inequality or Gini Index in Belmont?
Inequality or Gini Index in Belmont is 0.35.
What is the Total Population of Belmont?
Total Population of Belmont is 9,888.
What is the Total Male Population of Belmont?
Total Male Population of Belmont is 5,040.
What is the Total Female Population of Belmont?
Total Female Population of Belmont is 4,848.
What is the Ratio of Males per 100 Females in Belmont?
There are 103.96 Males per 100 Females in Belmont.
What is the Ratio of Females per 100 Males in Belmont?
There are 96.19 Females per 100 Males in Belmont.
What is the Median Population Age in Belmont?
Median Population Age in Belmont is 38.6 Years.
What is the Average Family Size in Belmont
Average Family Size in Belmont is 3.5 People.
What is the Average Household Size in Belmont
Average Household Size in Belmont is 3.2 People.
How Large is the Labor Force in Belmont?
There are 5,636 People in the Labor Forcein in Belmont.
What is the Percentage of People in the Labor Force in Belmont?
76.8% of People are in the Labor Force in Belmont.
What is the Unemployment Rate in Belmont?
Unemployment Rate in Belmont is 3.3%.