Burke, VA Map & Demographics
Burke Map
Burke Overview
$60,981
PER CAPITA INCOME
$176,970
AVG FAMILY INCOME
$172,432
AVG HOUSEHOLD INCOME
39.1%
WAGE / INCOME GAP [ % ]
60.9¢/ $1
WAGE / INCOME GAP [ $ ]
0.33
INEQUALITY / GINI INDEX
44,228
TOTAL POPULATION
22,489
MALE POPULATION
21,739
FEMALE POPULATION
103.45
MALES / 100 FEMALES
96.67
FEMALES / 100 MALES
39.6
MEDIAN AGE
3.4
AVG FAMILY SIZE
3.2
AVG HOUSEHOLD SIZE
23,733
LABOR FORCE [ PEOPLE ]
70.2%
PERCENT IN LABOR FORCE
6.3%
UNEMPLOYMENT RATE
Burke Zip Codes
Income in Burke
Income Overview in Burke
Per Capita Income in Burke is $60,981, while median incomes of families and households are $176,970 and $172,432 respectively.
| Characteristic | Number | Measure |
| Per Capita Income | 44,228 | $60,981 |
| Median Family Income | 11,925 | $176,970 |
| Mean Family Income | 11,925 | $199,550 |
| Median Household Income | 13,786 | $172,432 |
| Mean Household Income | 13,786 | $191,937 |
| Income Deficit | 11,925 | $0 |
| Wage / Income Gap (%) | 44,228 | 39.13% |
| Wage / Income Gap ($) | 44,228 | 60.87¢ per $1 |
| Gini / Inequality Index | 44,228 | 0.33 |
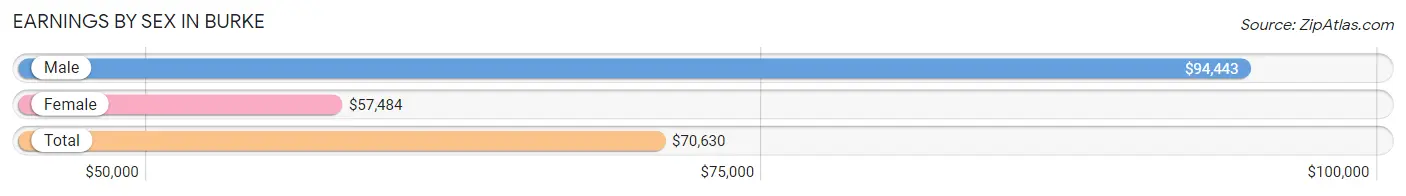
Earnings by Sex in Burke
Average Earnings in Burke are $70,630, $94,443 for men and $57,484 for women, a difference of 39.1%.
| Sex | Number | Average Earnings |
| Male | 12,871 (52.8%) | $94,443 |
| Female | 11,487 (47.2%) | $57,484 |
| Total | 24,358 (100.0%) | $70,630 |
Earnings by Sex by Income Bracket in Burke
The most common earnings brackets in Burke are $100,000+ for men (6,123 | 47.6%) and $100,000+ for women (2,928 | 25.5%).

| Income | Male | Female |
| $2,499 or less | 565 (4.4%) | 606 (5.3%) |
| $2,500 to $4,999 | 359 (2.8%) | 407 (3.5%) |
| $5,000 to $7,499 | 240 (1.9%) | 494 (4.3%) |
| $7,500 to $9,999 | 96 (0.7%) | 268 (2.3%) |
| $10,000 to $12,499 | 192 (1.5%) | 367 (3.2%) |
| $12,500 to $14,999 | 128 (1.0%) | 213 (1.8%) |
| $15,000 to $17,499 | 186 (1.5%) | 280 (2.4%) |
| $17,500 to $19,999 | 104 (0.8%) | 174 (1.5%) |
| $20,000 to $22,499 | 223 (1.7%) | 266 (2.3%) |
| $22,500 to $24,999 | 276 (2.1%) | 193 (1.7%) |
| $25,000 to $29,999 | 403 (3.1%) | 377 (3.3%) |
| $30,000 to $34,999 | 437 (3.4%) | 454 (4.0%) |
| $35,000 to $39,999 | 221 (1.7%) | 374 (3.3%) |
| $40,000 to $44,999 | 384 (3.0%) | 437 (3.8%) |
| $45,000 to $49,999 | 274 (2.1%) | 277 (2.4%) |
| $50,000 to $54,999 | 300 (2.3%) | 320 (2.8%) |
| $55,000 to $64,999 | 610 (4.7%) | 772 (6.7%) |
| $65,000 to $74,999 | 545 (4.2%) | 727 (6.3%) |
| $75,000 to $99,999 | 1,205 (9.4%) | 1,553 (13.5%) |
| $100,000+ | 6,123 (47.6%) | 2,928 (25.5%) |
| Total | 12,871 (100.0%) | 11,487 (100.0%) |
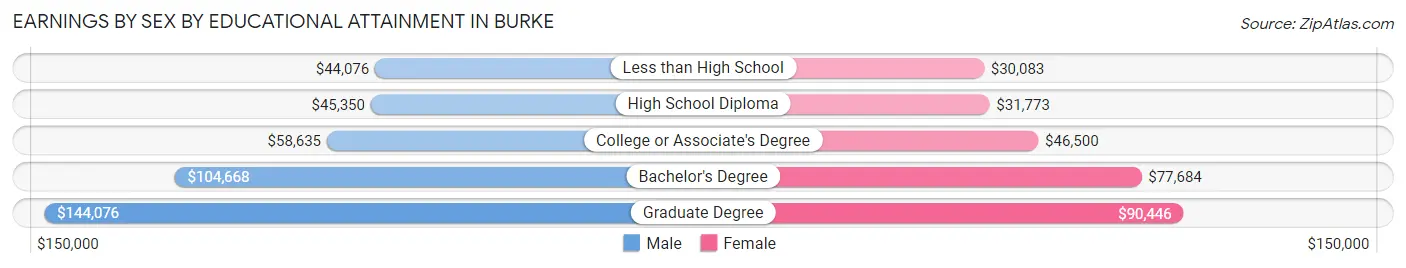
Earnings by Sex by Educational Attainment in Burke
Average earnings in Burke are $103,634 for men and $68,176 for women, a difference of 34.2%. Men with an educational attainment of graduate degree enjoy the highest average annual earnings of $144,076, while those with less than high school education earn the least with $44,076. Women with an educational attainment of graduate degree earn the most with the average annual earnings of $90,446, while those with less than high school education have the smallest earnings of $30,083.
| Educational Attainment | Male Income | Female Income |
| Less than High School | $44,076 | $30,083 |
| High School Diploma | $45,350 | $31,773 |
| College or Associate's Degree | $58,635 | $46,500 |
| Bachelor's Degree | $104,668 | $77,684 |
| Graduate Degree | $144,076 | $90,446 |
| Total | $103,634 | $68,176 |
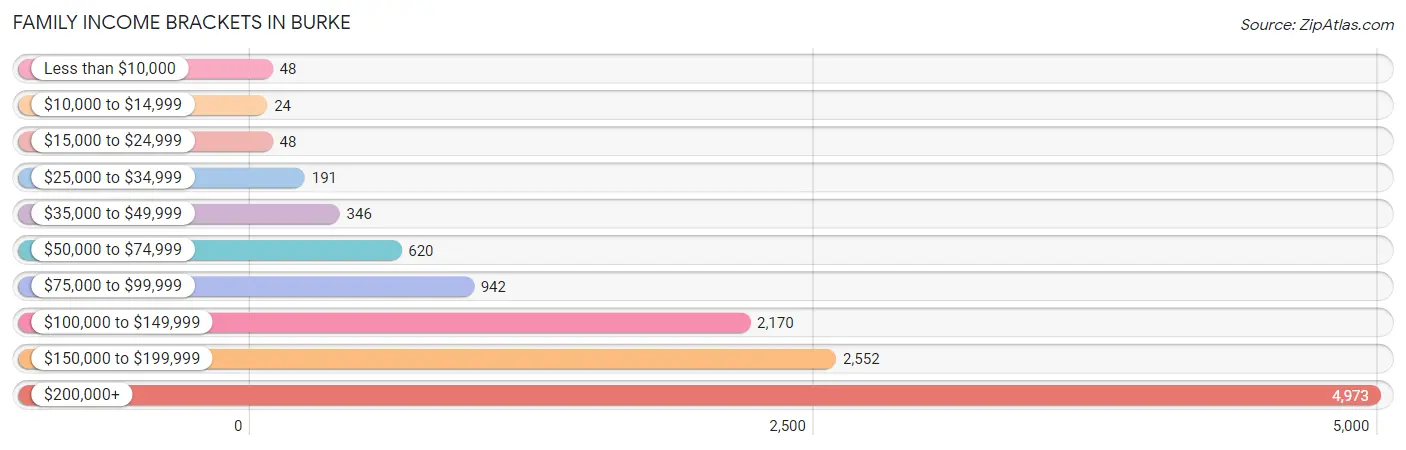
Family Income in Burke
Family Income Brackets in Burke
According to the Burke family income data, there are 4,973 families falling into the $200,000+ income range, which is the most common income bracket and makes up 41.7% of all families. Conversely, the $10,000 to $14,999 income bracket is the least frequent group with only 24 families (0.2%) belonging to this category.
| Income Bracket | # Families | % Families |
| Less than $10,000 | 48 | 0.4% |
| $10,000 to $14,999 | 24 | 0.2% |
| $15,000 to $24,999 | 48 | 0.4% |
| $25,000 to $34,999 | 191 | 1.6% |
| $35,000 to $49,999 | 346 | 2.9% |
| $50,000 to $74,999 | 620 | 5.2% |
| $75,000 to $99,999 | 942 | 7.9% |
| $100,000 to $149,999 | 2,170 | 18.2% |
| $150,000 to $199,999 | 2,552 | 21.4% |
| $200,000+ | 4,973 | 41.7% |
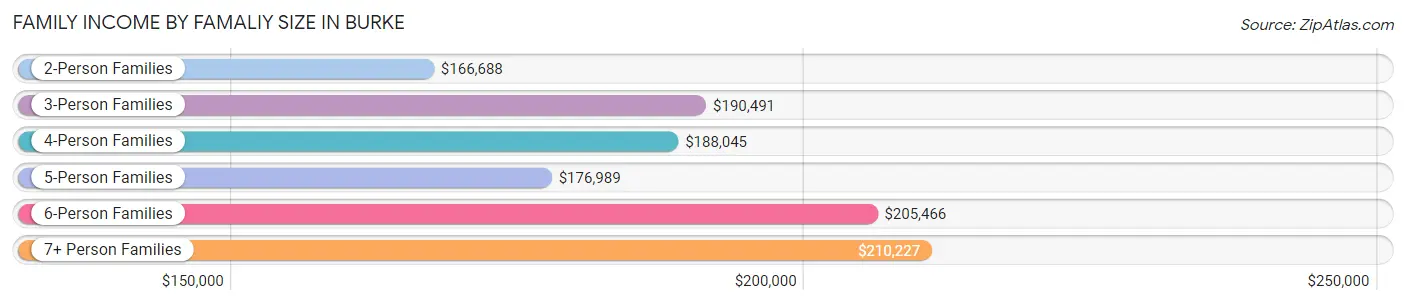
Family Income by Famaliy Size in Burke
7+ person families (140 | 1.2%) account for the highest median family income in Burke with $210,227 per family, while 2-person families (4,236 | 35.5%) have the highest median income of $83,344 per family member.
| Income Bracket | # Families | Median Income |
| 2-Person Families | 4,236 (35.5%) | $166,688 |
| 3-Person Families | 2,992 (25.1%) | $190,491 |
| 4-Person Families | 2,707 (22.7%) | $188,045 |
| 5-Person Families | 1,335 (11.2%) | $176,989 |
| 6-Person Families | 515 (4.3%) | $205,466 |
| 7+ Person Families | 140 (1.2%) | $210,227 |
| Total | 11,925 (100.0%) | $176,970 |
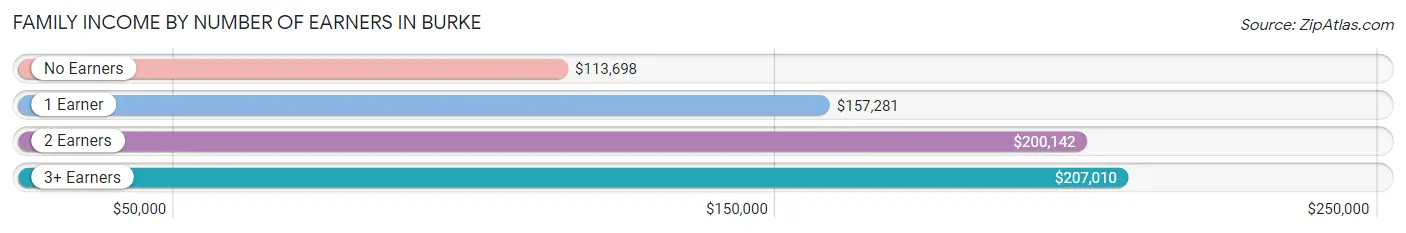
Family Income by Number of Earners in Burke
The median family income in Burke is $176,970, with families comprising 3+ earners (1,938) having the highest median family income of $207,010, while families with no earners (1,211) have the lowest median family income of $113,698, accounting for 16.3% and 10.2% of families, respectively.
| Number of Earners | # Families | Median Income |
| No Earners | 1,211 (10.2%) | $113,698 |
| 1 Earner | 3,065 (25.7%) | $157,281 |
| 2 Earners | 5,711 (47.9%) | $200,142 |
| 3+ Earners | 1,938 (16.3%) | $207,010 |
| Total | 11,925 (100.0%) | $176,970 |
Household Income in Burke
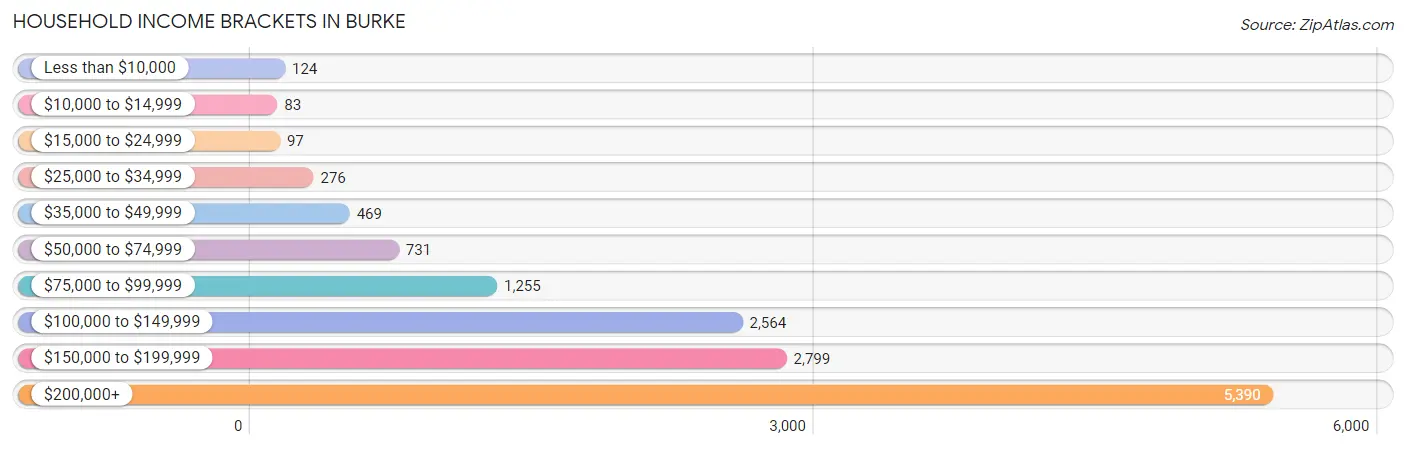
Household Income Brackets in Burke
With 5,390 households falling in the category, the $200,000+ income range is the most frequent in Burke, accounting for 39.1% of all households. In contrast, only 83 households (0.6%) fall into the $10,000 to $14,999 income bracket, making it the least populous group.
| Income Bracket | # Households | % Households |
| Less than $10,000 | 124 | 0.9% |
| $10,000 to $14,999 | 83 | 0.6% |
| $15,000 to $24,999 | 97 | 0.7% |
| $25,000 to $34,999 | 276 | 2.0% |
| $35,000 to $49,999 | 469 | 3.4% |
| $50,000 to $74,999 | 731 | 5.3% |
| $75,000 to $99,999 | 1,255 | 9.1% |
| $100,000 to $149,999 | 2,564 | 18.6% |
| $150,000 to $199,999 | 2,799 | 20.3% |
| $200,000+ | 5,390 | 39.1% |
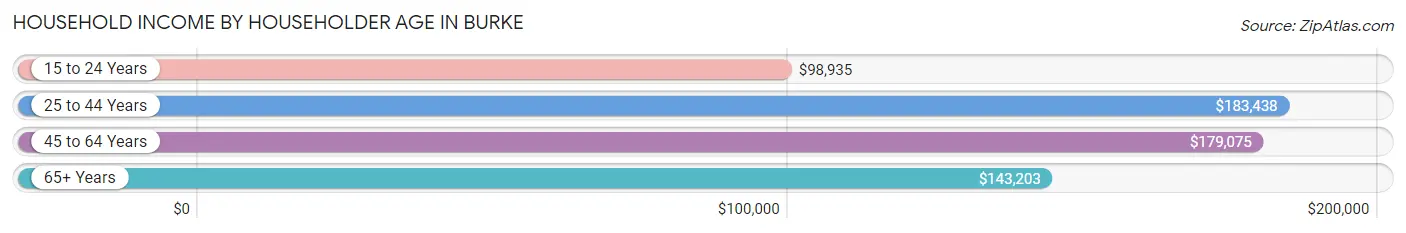
Household Income by Householder Age in Burke
The median household income in Burke is $172,432, with the highest median household income of $183,438 found in the 25 to 44 years age bracket for the primary householder. A total of 3,757 households (27.3%) fall into this category. Meanwhile, the 15 to 24 years age bracket for the primary householder has the lowest median household income of $98,935, with 65 households (0.5%) in this group.
| Income Bracket | # Households | Median Income |
| 15 to 24 Years | 65 (0.5%) | $98,935 |
| 25 to 44 Years | 3,757 (27.3%) | $183,438 |
| 45 to 64 Years | 6,259 (45.4%) | $179,075 |
| 65+ Years | 3,705 (26.9%) | $143,203 |
| Total | 13,786 (100.0%) | $172,432 |
Poverty in Burke
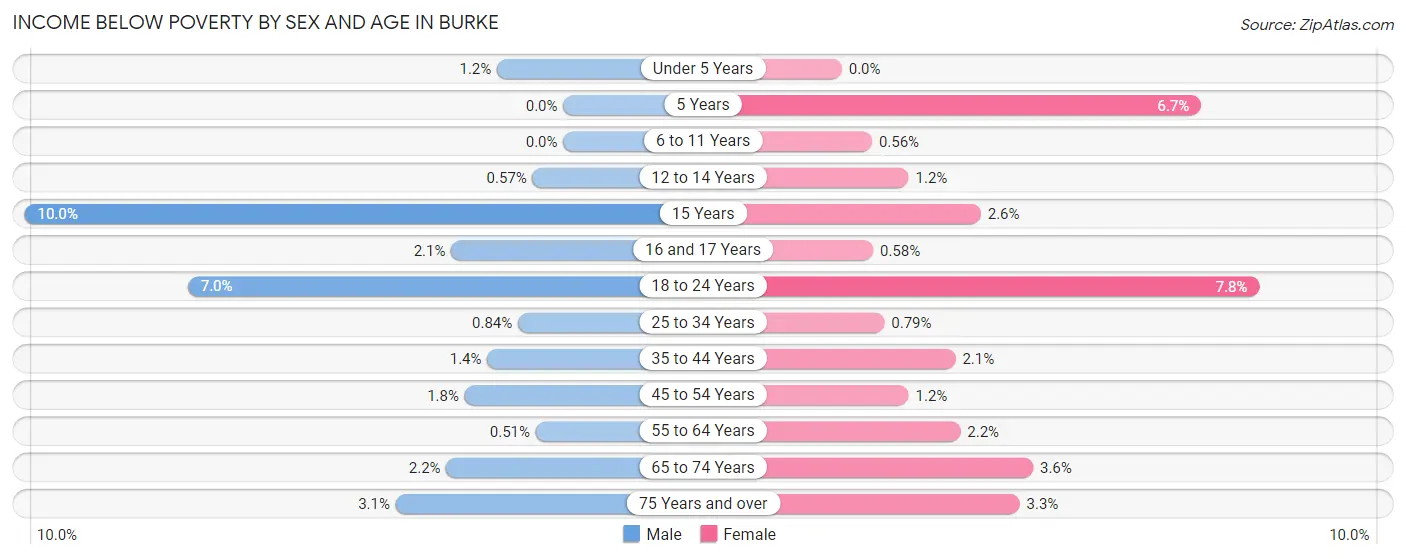
Income Below Poverty by Sex and Age in Burke
With 1.8% poverty level for males and 2.3% for females among the residents of Burke, 15 year old males and 18 to 24 year old females are the most vulnerable to poverty, with 47 males (10.0%) and 133 females (7.7%) in their respective age groups living below the poverty level.
| Age Bracket | Male | Female |
| Under 5 Years | 18 (1.2%) | 0 (0.0%) |
| 5 Years | 0 (0.0%) | 20 (6.7%) |
| 6 to 11 Years | 0 (0.0%) | 9 (0.6%) |
| 12 to 14 Years | 7 (0.6%) | 15 (1.2%) |
| 15 Years | 47 (10.0%) | 9 (2.6%) |
| 16 and 17 Years | 15 (2.1%) | 3 (0.6%) |
| 18 to 24 Years | 97 (7.0%) | 133 (7.7%) |
| 25 to 34 Years | 19 (0.8%) | 15 (0.8%) |
| 35 to 44 Years | 47 (1.4%) | 67 (2.1%) |
| 45 to 54 Years | 56 (1.8%) | 39 (1.2%) |
| 55 to 64 Years | 14 (0.5%) | 62 (2.2%) |
| 65 to 74 Years | 45 (2.2%) | 81 (3.5%) |
| 75 Years and over | 39 (3.1%) | 46 (3.3%) |
| Total | 404 (1.8%) | 499 (2.3%) |
Income Above Poverty by Sex and Age in Burke
According to the poverty statistics in Burke, males aged 5 years and females aged under 5 years are the age groups that are most secure financially, with 100.0% of males and 100.0% of females in these age groups living above the poverty line.

| Age Bracket | Male | Female |
| Under 5 Years | 1,445 (98.8%) | 1,243 (100.0%) |
| 5 Years | 381 (100.0%) | 280 (93.3%) |
| 6 to 11 Years | 2,027 (100.0%) | 1,588 (99.4%) |
| 12 to 14 Years | 1,217 (99.4%) | 1,198 (98.8%) |
| 15 Years | 423 (90.0%) | 340 (97.4%) |
| 16 and 17 Years | 705 (97.9%) | 518 (99.4%) |
| 18 to 24 Years | 1,295 (93.0%) | 1,583 (92.2%) |
| 25 to 34 Years | 2,254 (99.2%) | 1,884 (99.2%) |
| 35 to 44 Years | 3,277 (98.6%) | 3,103 (97.9%) |
| 45 to 54 Years | 3,004 (98.2%) | 3,105 (98.8%) |
| 55 to 64 Years | 2,758 (99.5%) | 2,750 (97.8%) |
| 65 to 74 Years | 2,031 (97.8%) | 2,200 (96.5%) |
| 75 Years and over | 1,215 (96.9%) | 1,348 (96.7%) |
| Total | 22,032 (98.2%) | 21,140 (97.7%) |
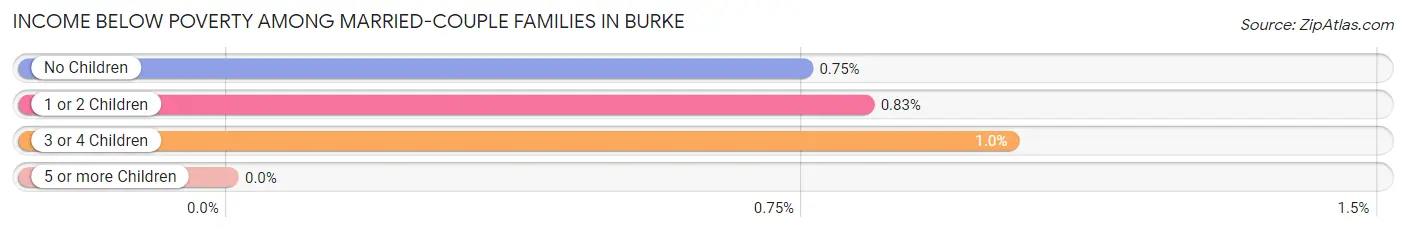
Income Below Poverty Among Married-Couple Families in Burke
The poverty statistics for married-couple families in Burke show that 0.8% or 82 of the total 10,221 families live below the poverty line. Families with 3 or 4 children have the highest poverty rate of 1.0%, comprising of 10 families. On the other hand, families with 5 or more children have the lowest poverty rate of 0.0%, which includes 0 families.
| Children | Above Poverty | Below Poverty |
| No Children | 5,313 (99.3%) | 40 (0.7%) |
| 1 or 2 Children | 3,838 (99.2%) | 32 (0.8%) |
| 3 or 4 Children | 967 (99.0%) | 10 (1.0%) |
| 5 or more Children | 21 (100.0%) | 0 (0.0%) |
| Total | 10,139 (99.2%) | 82 (0.8%) |
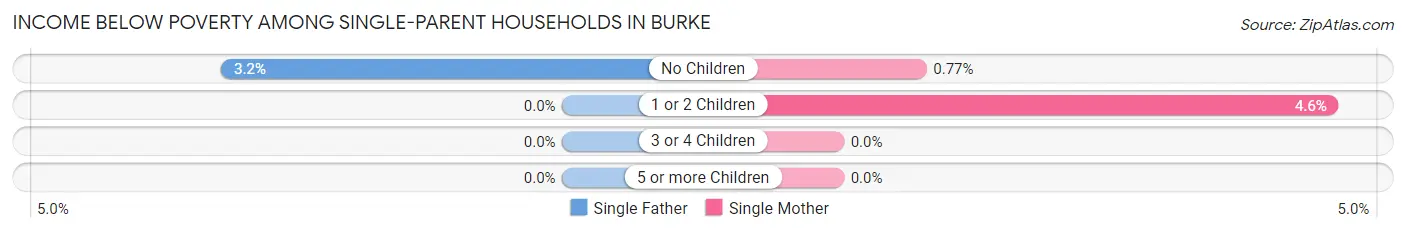
Income Below Poverty Among Single-Parent Households in Burke
According to the poverty data in Burke, 1.1% or 6 single-father households and 2.6% or 30 single-mother households are living below the poverty line. Among single-father households, those with no children have the highest poverty rate, with 6 households (3.2%) experiencing poverty. Likewise, among single-mother households, those with 1 or 2 children have the highest poverty rate, with 26 households (4.6%) falling below the poverty line.
| Children | Single Father | Single Mother |
| No Children | 6 (3.2%) | 4 (0.8%) |
| 1 or 2 Children | 0 (0.0%) | 26 (4.6%) |
| 3 or 4 Children | 0 (0.0%) | 0 (0.0%) |
| 5 or more Children | 0 (0.0%) | 0 (0.0%) |
| Total | 6 (1.1%) | 30 (2.6%) |
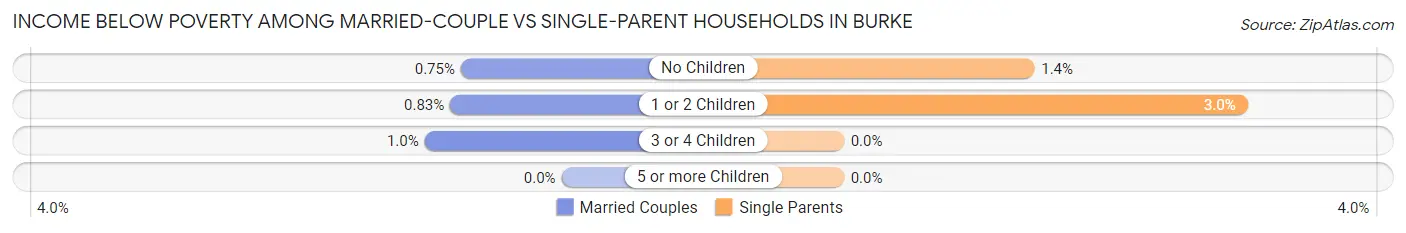
Income Below Poverty Among Married-Couple vs Single-Parent Households in Burke
The poverty data for Burke shows that 82 of the married-couple family households (0.8%) and 36 of the single-parent households (2.1%) are living below the poverty level. Within the married-couple family households, those with 3 or 4 children have the highest poverty rate, with 10 households (1.0%) falling below the poverty line. Among the single-parent households, those with 1 or 2 children have the highest poverty rate, with 26 household (3.0%) living below poverty.
| Children | Married-Couple Families | Single-Parent Households |
| No Children | 40 (0.7%) | 10 (1.4%) |
| 1 or 2 Children | 32 (0.8%) | 26 (3.0%) |
| 3 or 4 Children | 10 (1.0%) | 0 (0.0%) |
| 5 or more Children | 0 (0.0%) | 0 (0.0%) |
| Total | 82 (0.8%) | 36 (2.1%) |
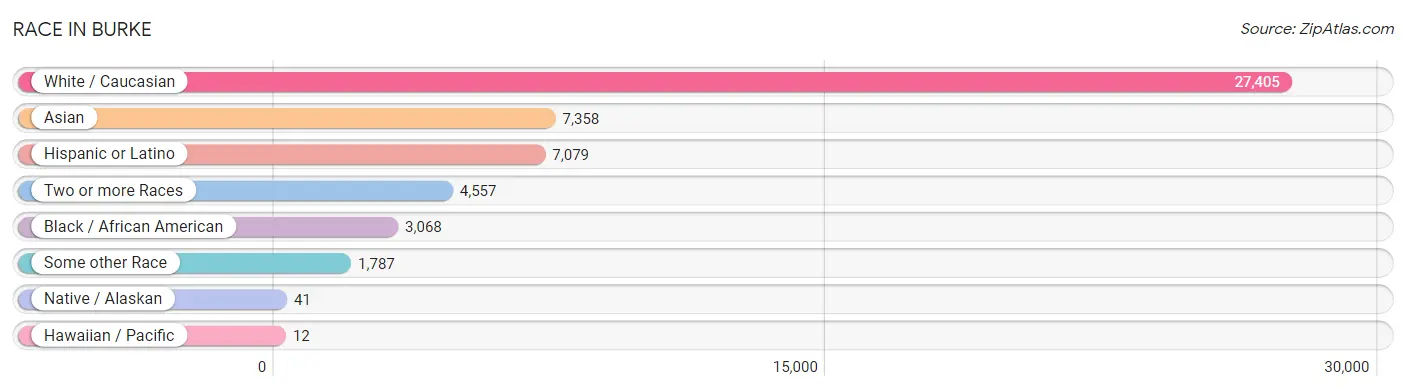
Race in Burke
The most populous races in Burke are White / Caucasian (27,405 | 62.0%), Asian (7,358 | 16.6%), and Hispanic or Latino (7,079 | 16.0%).
| Race | # Population | % Population |
| Asian | 7,358 | 16.6% |
| Black / African American | 3,068 | 6.9% |
| Hawaiian / Pacific | 12 | 0.0% |
| Hispanic or Latino | 7,079 | 16.0% |
| Native / Alaskan | 41 | 0.1% |
| White / Caucasian | 27,405 | 62.0% |
| Two or more Races | 4,557 | 10.3% |
| Some other Race | 1,787 | 4.0% |
| Total | 44,228 | 100.0% |
Ancestry in Burke
The most populous ancestries reported in Burke are German (6,048 | 13.7%), Irish (4,800 | 10.8%), English (4,719 | 10.7%), South American (3,245 | 7.3%), and Italian (2,543 | 5.8%), together accounting for 48.3% of all Burke residents.

| Ancestry | # Population | % Population |
| Afghan | 605 | 1.4% |
| African | 109 | 0.3% |
| Albanian | 20 | 0.1% |
| American | 2,058 | 4.6% |
| Apache | 14 | 0.0% |
| Arab | 1,252 | 2.8% |
| Argentinean | 117 | 0.3% |
| Assyrian / Chaldean / Syriac | 7 | 0.0% |
| Austrian | 73 | 0.2% |
| Barbadian | 6 | 0.0% |
| Belgian | 40 | 0.1% |
| Belizean | 31 | 0.1% |
| Bhutanese | 250 | 0.6% |
| Blackfeet | 35 | 0.1% |
| Bolivian | 1,310 | 3.0% |
| Brazilian | 28 | 0.1% |
| British | 554 | 1.3% |
| Bulgarian | 6 | 0.0% |
| Burmese | 2,203 | 5.0% |
| Cambodian | 26 | 0.1% |
| Canadian | 107 | 0.2% |
| Central American | 1,840 | 4.2% |
| Central American Indian | 50 | 0.1% |
| Cherokee | 151 | 0.3% |
| Chilean | 93 | 0.2% |
| Chinese | 29 | 0.1% |
| Chippewa | 13 | 0.0% |
| Colombian | 452 | 1.0% |
| Costa Rican | 106 | 0.2% |
| Croatian | 49 | 0.1% |
| Cuban | 195 | 0.4% |
| Czech | 63 | 0.1% |
| Czechoslovakian | 43 | 0.1% |
| Danish | 213 | 0.5% |
| Dominican | 177 | 0.4% |
| Dutch | 460 | 1.0% |
| Eastern European | 283 | 0.6% |
| Ecuadorian | 55 | 0.1% |
| Egyptian | 120 | 0.3% |
| English | 4,719 | 10.7% |
| Estonian | 9 | 0.0% |
| Ethiopian | 1,055 | 2.4% |
| European | 1,104 | 2.5% |
| Filipino | 34 | 0.1% |
| Finnish | 91 | 0.2% |
| French | 998 | 2.3% |
| French Canadian | 240 | 0.5% |
| German | 6,048 | 13.7% |
| Ghanaian | 64 | 0.1% |
| Greek | 118 | 0.3% |
| Guamanian / Chamorro | 97 | 0.2% |
| Guatemalan | 278 | 0.6% |
| Haitian | 103 | 0.2% |
| Honduran | 351 | 0.8% |
| Hungarian | 141 | 0.3% |
| Indian (Asian) | 1,644 | 3.7% |
| Iranian | 204 | 0.5% |
| Iraqi | 57 | 0.1% |
| Irish | 4,800 | 10.8% |
| Israeli | 14 | 0.0% |
| Italian | 2,543 | 5.8% |
| Jamaican | 24 | 0.1% |
| Japanese | 95 | 0.2% |
| Jordanian | 85 | 0.2% |
| Korean | 628 | 1.4% |
| Laotian | 37 | 0.1% |
| Latvian | 70 | 0.2% |
| Lebanese | 433 | 1.0% |
| Lithuanian | 249 | 0.6% |
| Luxembourger | 5 | 0.0% |
| Mexican | 712 | 1.6% |
| Mongolian | 3 | 0.0% |
| Moroccan | 141 | 0.3% |
| Native Hawaiian | 139 | 0.3% |
| Nicaraguan | 21 | 0.1% |
| Northern European | 260 | 0.6% |
| Norwegian | 282 | 0.6% |
| Pakistani | 72 | 0.2% |
| Palestinian | 104 | 0.2% |
| Panamanian | 13 | 0.0% |
| Peruvian | 1,218 | 2.8% |
| Polish | 1,161 | 2.6% |
| Portuguese | 54 | 0.1% |
| Puerto Rican | 373 | 0.8% |
| Romanian | 23 | 0.1% |
| Russian | 391 | 0.9% |
| Salvadoran | 1,071 | 2.4% |
| Samoan | 14 | 0.0% |
| Scandinavian | 270 | 0.6% |
| Scotch-Irish | 491 | 1.1% |
| Scottish | 1,089 | 2.5% |
| Serbian | 9 | 0.0% |
| Sierra Leonean | 42 | 0.1% |
| Sioux | 13 | 0.0% |
| Slavic | 79 | 0.2% |
| Slovak | 165 | 0.4% |
| Slovene | 35 | 0.1% |
| Somali | 32 | 0.1% |
| South American | 3,245 | 7.3% |
| South American Indian | 59 | 0.1% |
| Spaniard | 245 | 0.5% |
| Spanish | 146 | 0.3% |
| Sri Lankan | 1,258 | 2.8% |
| Subsaharan African | 1,394 | 3.2% |
| Swedish | 441 | 1.0% |
| Swiss | 45 | 0.1% |
| Syrian | 94 | 0.2% |
| Thai | 1,452 | 3.3% |
| Turkish | 40 | 0.1% |
| Ugandan | 48 | 0.1% |
| Ukrainian | 265 | 0.6% |
| Vietnamese | 59 | 0.1% |
| Welsh | 434 | 1.0% |
| West Indian | 26 | 0.1% | View All 114 Rows |
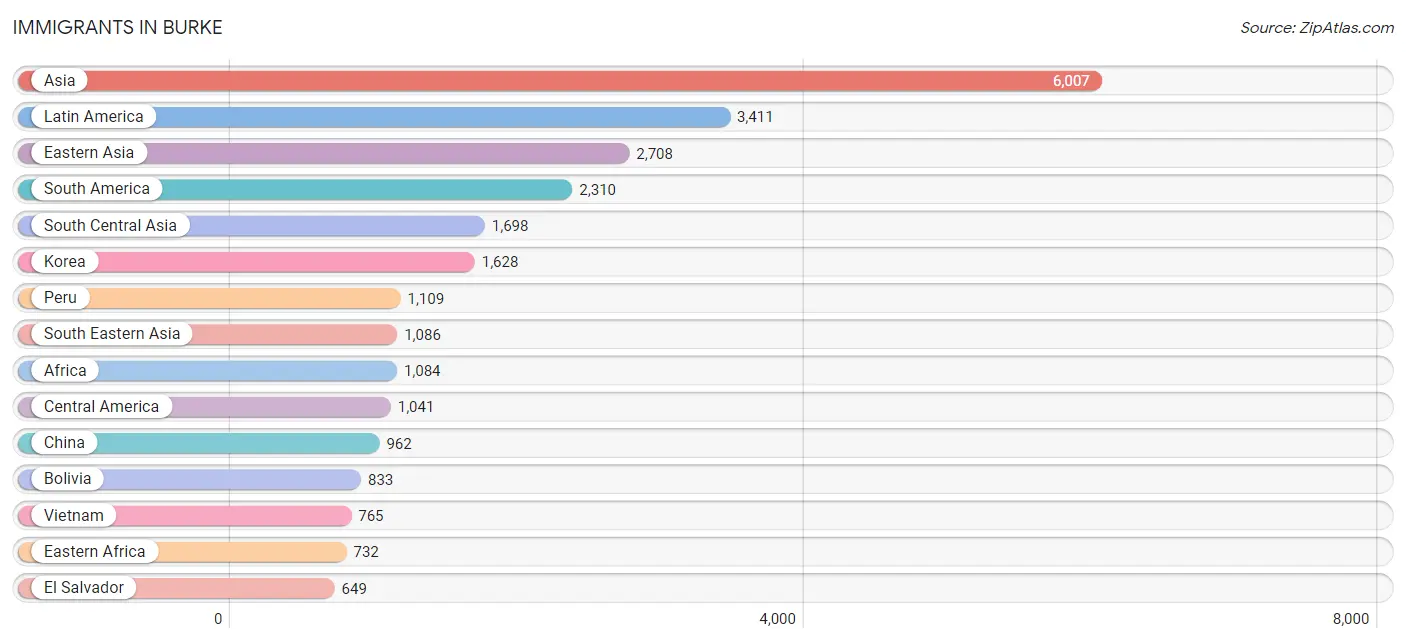
Immigrants in Burke
The most numerous immigrant groups reported in Burke came from Asia (6,007 | 13.6%), Latin America (3,411 | 7.7%), Eastern Asia (2,708 | 6.1%), South America (2,310 | 5.2%), and South Central Asia (1,698 | 3.8%), together accounting for 36.5% of all Burke residents.
| Immigration Origin | # Population | % Population |
| Afghanistan | 421 | 0.9% |
| Africa | 1,084 | 2.5% |
| Argentina | 79 | 0.2% |
| Asia | 6,007 | 13.6% |
| Australia | 28 | 0.1% |
| Bangladesh | 162 | 0.4% |
| Barbados | 6 | 0.0% |
| Belgium | 8 | 0.0% |
| Bolivia | 833 | 1.9% |
| Brazil | 38 | 0.1% |
| Canada | 82 | 0.2% |
| Caribbean | 60 | 0.1% |
| Central America | 1,041 | 2.4% |
| Chile | 70 | 0.2% |
| China | 962 | 2.2% |
| Colombia | 166 | 0.4% |
| Costa Rica | 37 | 0.1% |
| Czechoslovakia | 16 | 0.0% |
| Dominican Republic | 51 | 0.1% |
| Eastern Africa | 732 | 1.7% |
| Eastern Asia | 2,708 | 6.1% |
| Eastern Europe | 168 | 0.4% |
| Ecuador | 15 | 0.0% |
| Egypt | 44 | 0.1% |
| El Salvador | 649 | 1.5% |
| England | 41 | 0.1% |
| Eritrea | 118 | 0.3% |
| Ethiopia | 555 | 1.3% |
| Europe | 563 | 1.3% |
| France | 18 | 0.0% |
| Germany | 112 | 0.3% |
| Ghana | 39 | 0.1% |
| Greece | 18 | 0.0% |
| Guatemala | 139 | 0.3% |
| Honduras | 186 | 0.4% |
| Hong Kong | 95 | 0.2% |
| India | 631 | 1.4% |
| Indonesia | 26 | 0.1% |
| Iran | 124 | 0.3% |
| Iraq | 140 | 0.3% |
| Ireland | 48 | 0.1% |
| Israel | 14 | 0.0% |
| Italy | 20 | 0.1% |
| Jamaica | 3 | 0.0% |
| Japan | 67 | 0.2% |
| Jordan | 87 | 0.2% |
| Kazakhstan | 16 | 0.0% |
| Kenya | 11 | 0.0% |
| Korea | 1,628 | 3.7% |
| Latin America | 3,411 | 7.7% |
| Latvia | 18 | 0.0% |
| Lebanon | 157 | 0.4% |
| Malaysia | 3 | 0.0% |
| Mexico | 9 | 0.0% |
| Morocco | 97 | 0.2% |
| Nepal | 27 | 0.1% |
| Netherlands | 41 | 0.1% |
| Nicaragua | 11 | 0.0% |
| Nigeria | 11 | 0.0% |
| Northern Africa | 154 | 0.4% |
| Northern Europe | 154 | 0.4% |
| Norway | 9 | 0.0% |
| Oceania | 28 | 0.1% |
| Pakistan | 152 | 0.3% |
| Panama | 10 | 0.0% |
| Peru | 1,109 | 2.5% |
| Philippines | 223 | 0.5% |
| Poland | 36 | 0.1% |
| Romania | 5 | 0.0% |
| Russia | 24 | 0.1% |
| Scotland | 19 | 0.0% |
| Sierra Leone | 51 | 0.1% |
| Singapore | 10 | 0.0% |
| Somalia | 10 | 0.0% |
| South Africa | 66 | 0.2% |
| South America | 2,310 | 5.2% |
| South Central Asia | 1,698 | 3.8% |
| South Eastern Asia | 1,086 | 2.5% |
| Southern Europe | 48 | 0.1% |
| Spain | 10 | 0.0% |
| Sri Lanka | 45 | 0.1% |
| Sudan | 8 | 0.0% |
| Switzerland | 9 | 0.0% |
| Syria | 23 | 0.1% |
| Taiwan | 243 | 0.5% |
| Thailand | 59 | 0.1% |
| Turkey | 13 | 0.0% |
| Uganda | 38 | 0.1% |
| Ukraine | 60 | 0.1% |
| Uzbekistan | 114 | 0.3% |
| Vietnam | 765 | 1.7% |
| Western Africa | 123 | 0.3% |
| Western Asia | 515 | 1.2% |
| Western Europe | 193 | 0.4% |
| Yemen | 10 | 0.0% | View All 95 Rows |
Sex and Age in Burke
Sex and Age in Burke
The most populous age groups in Burke are 10 to 14 Years (1,900 | 8.5%) for men and 10 to 14 Years (1,989 | 9.1%) for women.

| Age Bracket | Male | Female |
| Under 5 Years | 1,473 (6.6%) | 1,247 (5.7%) |
| 5 to 9 Years | 1,775 (7.9%) | 1,217 (5.6%) |
| 10 to 14 Years | 1,900 (8.5%) | 1,989 (9.1%) |
| 15 to 19 Years | 1,544 (6.9%) | 1,355 (6.2%) |
| 20 to 24 Years | 1,038 (4.6%) | 1,231 (5.7%) |
| 25 to 29 Years | 1,261 (5.6%) | 805 (3.7%) |
| 30 to 34 Years | 1,012 (4.5%) | 1,094 (5.0%) |
| 35 to 39 Years | 1,761 (7.8%) | 1,699 (7.8%) |
| 40 to 44 Years | 1,563 (7.0%) | 1,471 (6.8%) |
| 45 to 49 Years | 1,616 (7.2%) | 1,746 (8.0%) |
| 50 to 54 Years | 1,444 (6.4%) | 1,398 (6.4%) |
| 55 to 59 Years | 1,486 (6.6%) | 1,599 (7.4%) |
| 60 to 64 Years | 1,286 (5.7%) | 1,213 (5.6%) |
| 65 to 69 Years | 1,111 (4.9%) | 1,183 (5.4%) |
| 70 to 74 Years | 965 (4.3%) | 1,098 (5.1%) |
| 75 to 79 Years | 778 (3.5%) | 760 (3.5%) |
| 80 to 84 Years | 321 (1.4%) | 394 (1.8%) |
| 85 Years and over | 155 (0.7%) | 240 (1.1%) |
| Total | 22,489 (100.0%) | 21,739 (100.0%) |
Families and Households in Burke
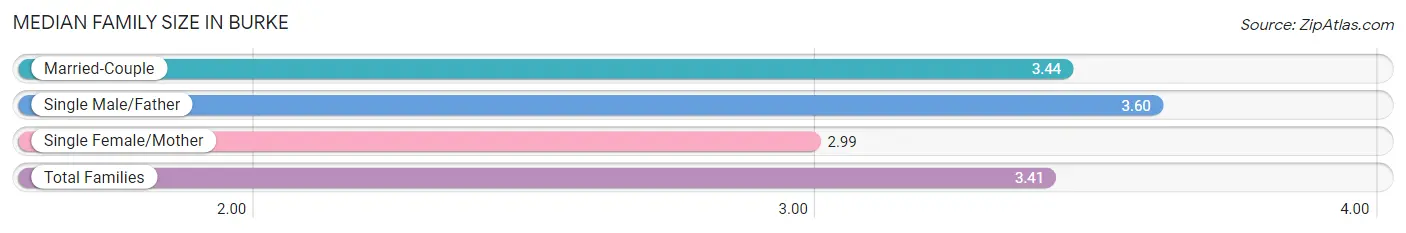
Median Family Size in Burke
The median family size in Burke is 3.41 persons per family, with single male/father families (555 | 4.6%) accounting for the largest median family size of 3.6 persons per family. On the other hand, single female/mother families (1,149 | 9.6%) represent the smallest median family size with 2.99 persons per family.
| Family Type | # Families | Family Size |
| Married-Couple | 10,221 (85.7%) | 3.44 |
| Single Male/Father | 555 (4.6%) | 3.60 |
| Single Female/Mother | 1,149 (9.6%) | 2.99 |
| Total Families | 11,925 (100.0%) | 3.41 |
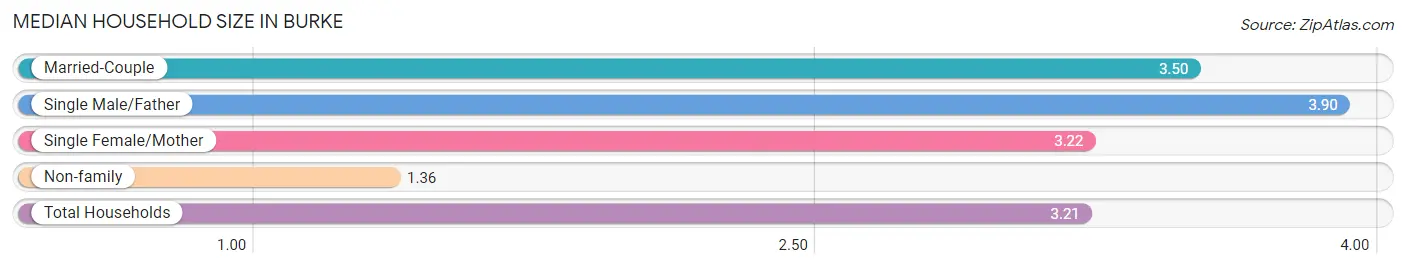
Median Household Size in Burke
The median household size in Burke is 3.21 persons per household, with single male/father households (555 | 4.0%) accounting for the largest median household size of 3.9 persons per household. non-family households (1,861 | 13.5%) represent the smallest median household size with 1.36 persons per household.
| Household Type | # Households | Household Size |
| Married-Couple | 10,221 (74.1%) | 3.50 |
| Single Male/Father | 555 (4.0%) | 3.90 |
| Single Female/Mother | 1,149 (8.3%) | 3.22 |
| Non-family | 1,861 (13.5%) | 1.36 |
| Total Households | 13,786 (100.0%) | 3.21 |
Household Size by Marriage Status in Burke
Out of a total of 13,786 households in Burke, 11,925 (86.5%) are family households, while 1,861 (13.5%) are nonfamily households. The most numerous type of family households are 2-person households, comprising 3,987, and the most common type of nonfamily households are 1-person households, comprising 1,477.
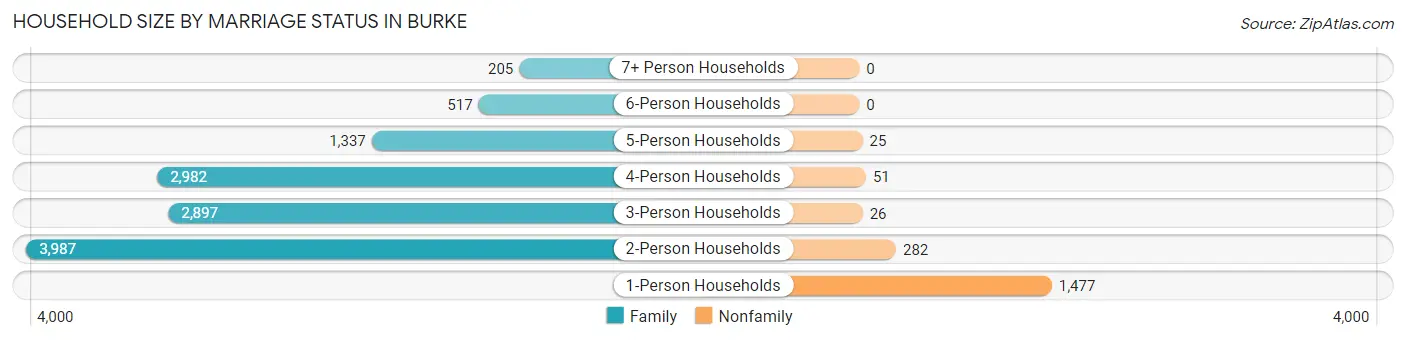
| Household Size | Family Households | Nonfamily Households |
| 1-Person Households | - | 1,477 (10.7%) |
| 2-Person Households | 3,987 (28.9%) | 282 (2.1%) |
| 3-Person Households | 2,897 (21.0%) | 26 (0.2%) |
| 4-Person Households | 2,982 (21.6%) | 51 (0.4%) |
| 5-Person Households | 1,337 (9.7%) | 25 (0.2%) |
| 6-Person Households | 517 (3.7%) | 0 (0.0%) |
| 7+ Person Households | 205 (1.5%) | 0 (0.0%) |
| Total | 11,925 (86.5%) | 1,861 (13.5%) |
Female Fertility in Burke
Fertility by Age in Burke
Average fertility rate in Burke is 48.0 births per 1,000 women. Women in the age bracket of 20 to 34 years have the highest fertility rate with 106.0 births per 1,000 women. Women in the age bracket of 20 to 34 years acount for 72.0% of all women with births.
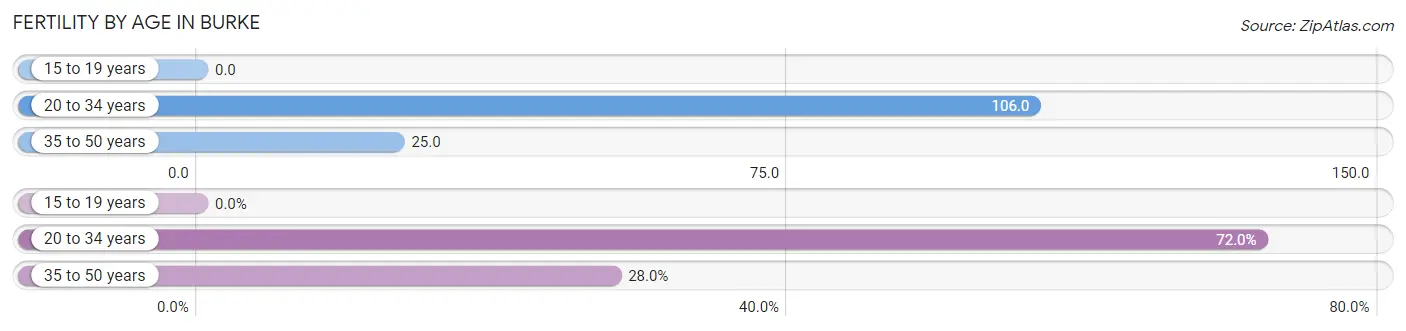
| Age Bracket | Women with Births | Births / 1,000 Women |
| 15 to 19 years | 0 (0.0%) | 0.0 |
| 20 to 34 years | 331 (72.0%) | 106.0 |
| 35 to 50 years | 129 (28.0%) | 25.0 |
| Total | 460 (100.0%) | 48.0 |
Fertility by Age by Marriage Status in Burke
93.3% of women with births (460) in Burke are married. The highest percentage of unmarried women with births falls into 35 to 50 years age bracket with 17.8% of them unmarried at the time of birth, while the lowest percentage of unmarried women with births belong to 20 to 34 years age bracket with 2.4% of them unmarried.
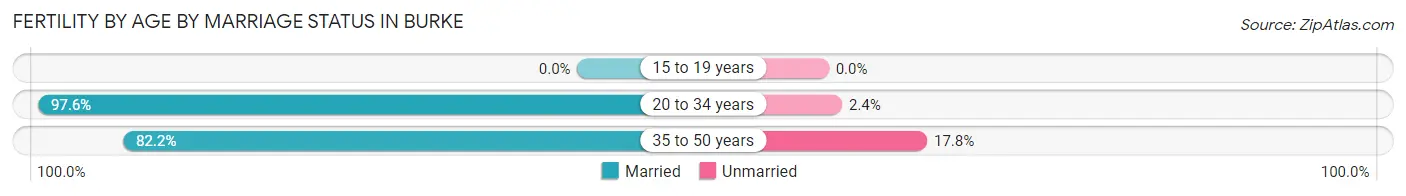
| Age Bracket | Married | Unmarried |
| 15 to 19 years | 0 (0.0%) | 0 (0.0%) |
| 20 to 34 years | 323 (97.6%) | 8 (2.4%) |
| 35 to 50 years | 106 (82.2%) | 23 (17.8%) |
| Total | 429 (93.3%) | 31 (6.7%) |
Fertility by Education in Burke
Average fertility rate in Burke is 48.0 births per 1,000 women. Women with the education attainment of graduate degree have the highest fertility rate of 76.0 births per 1,000 women, while women with the education attainment of high school diploma have the lowest fertility at 27.0 births per 1,000 women. Women with the education attainment of graduate degree represent 42.0% of all women with births.
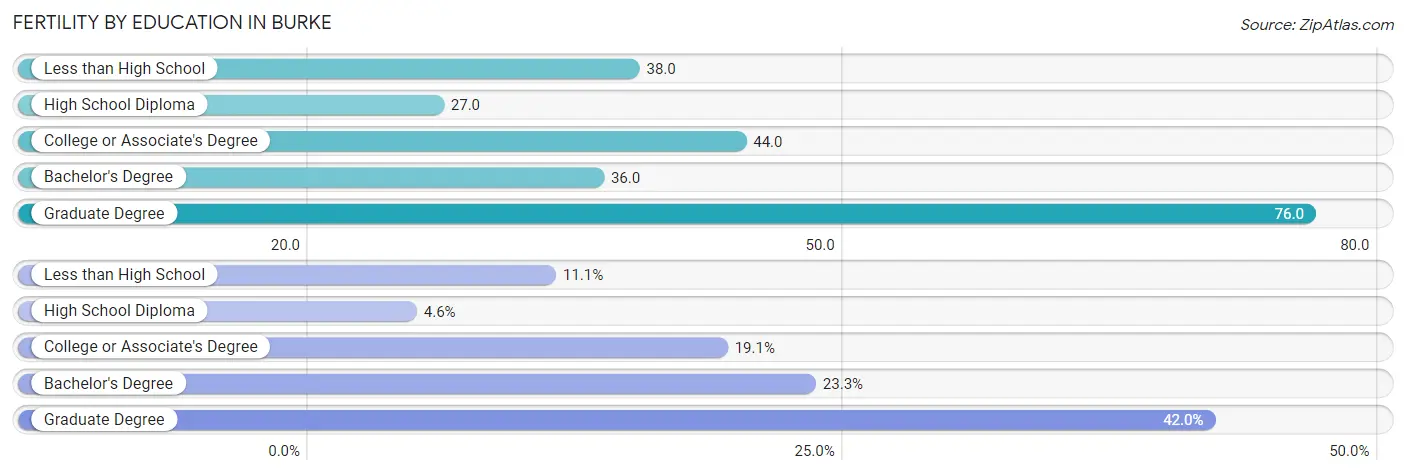
| Educational Attainment | Women with Births | Births / 1,000 Women |
| Less than High School | 51 (11.1%) | 38.0 |
| High School Diploma | 21 (4.6%) | 27.0 |
| College or Associate's Degree | 88 (19.1%) | 44.0 |
| Bachelor's Degree | 107 (23.3%) | 36.0 |
| Graduate Degree | 193 (42.0%) | 76.0 |
| Total | 460 (100.0%) | 48.0 |
Fertility by Education by Marriage Status in Burke
6.7% of women with births in Burke are unmarried. Women with the educational attainment of less than high school are most likely to be married with 100.0% of them married at childbirth, while women with the educational attainment of graduate degree are least likely to be married with 11.9% of them unmarried at childbirth.
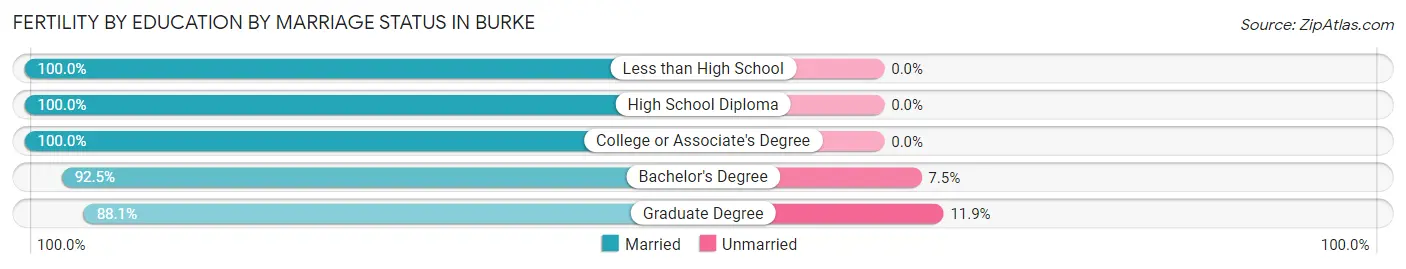
| Educational Attainment | Married | Unmarried |
| Less than High School | 51 (100.0%) | 0 (0.0%) |
| High School Diploma | 21 (100.0%) | 0 (0.0%) |
| College or Associate's Degree | 88 (100.0%) | 0 (0.0%) |
| Bachelor's Degree | 99 (92.5%) | 8 (7.5%) |
| Graduate Degree | 170 (88.1%) | 23 (11.9%) |
| Total | 429 (93.3%) | 31 (6.7%) |
Employment Characteristics in Burke
Employment by Class of Employer in Burke
Among the 21,816 employed individuals in Burke, private company employees (11,808 | 54.1%), federal government employees (4,294 | 19.7%), and not-for-profit organizations (1,898 | 8.7%) make up the most common classes of employment.

| Employer Class | # Employees | % Employees |
| Private Company Employees | 11,808 | 54.1% |
| Self-Employed (Incorporated) | 790 | 3.6% |
| Self-Employed (Not Incorporated) | 922 | 4.2% |
| Not-for-profit Organizations | 1,898 | 8.7% |
| Local Government Employees | 1,722 | 7.9% |
| State Government Employees | 338 | 1.5% |
| Federal Government Employees | 4,294 | 19.7% |
| Unpaid Family Workers | 44 | 0.2% |
| Total | 21,816 | 100.0% |
Employment Status by Age in Burke
According to the labor force statistics for Burke, out of the total population over 16 years of age (33,808), 70.2% or 23,733 individuals are in the labor force, with 6.3% or 1,495 of them unemployed. The age group with the highest labor force participation rate is 30 to 34 years, with 90.1% or 1,898 individuals in the labor force. Within the labor force, the 16 to 19 years age range has the highest percentage of unemployed individuals, with 27.8% or 175 of them being unemployed.
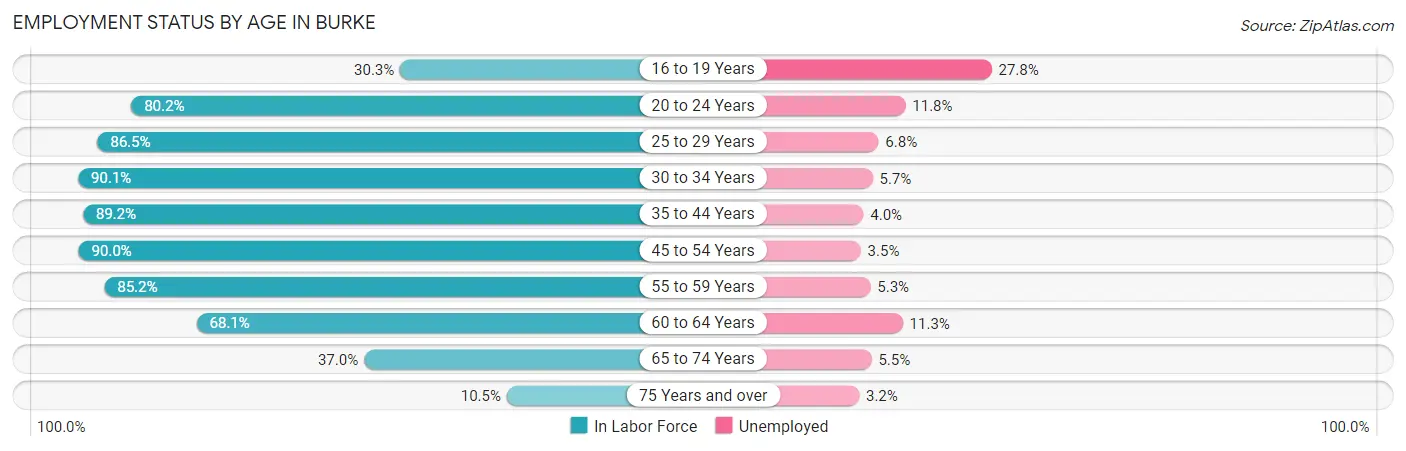
| Age Bracket | In Labor Force | Unemployed |
| 16 to 19 Years | 630 (30.3%) | 175 (27.8%) |
| 20 to 24 Years | 1,820 (80.2%) | 215 (11.8%) |
| 25 to 29 Years | 1,787 (86.5%) | 122 (6.8%) |
| 30 to 34 Years | 1,898 (90.1%) | 108 (5.7%) |
| 35 to 44 Years | 5,793 (89.2%) | 232 (4.0%) |
| 45 to 54 Years | 5,584 (90.0%) | 195 (3.5%) |
| 55 to 59 Years | 2,628 (85.2%) | 139 (5.3%) |
| 60 to 64 Years | 1,702 (68.1%) | 192 (11.3%) |
| 65 to 74 Years | 1,612 (37.0%) | 89 (5.5%) |
| 75 Years and over | 278 (10.5%) | 9 (3.2%) |
| Total | 23,733 (70.2%) | 1,495 (6.3%) |
Employment Status by Educational Attainment in Burke
According to labor force statistics for Burke, 86.3% of individuals (19,378) out of the total population between 25 and 64 years of age (22,454) are in the labor force, with 5.1% or 988 of them being unemployed. The group with the highest labor force participation rate are those with the educational attainment of bachelor's degree or higher, with 89.2% or 13,206 individuals in the labor force. Within the labor force, individuals with less than high school education have the highest percentage of unemployment, with 18.0% or 131 of them being unemployed.
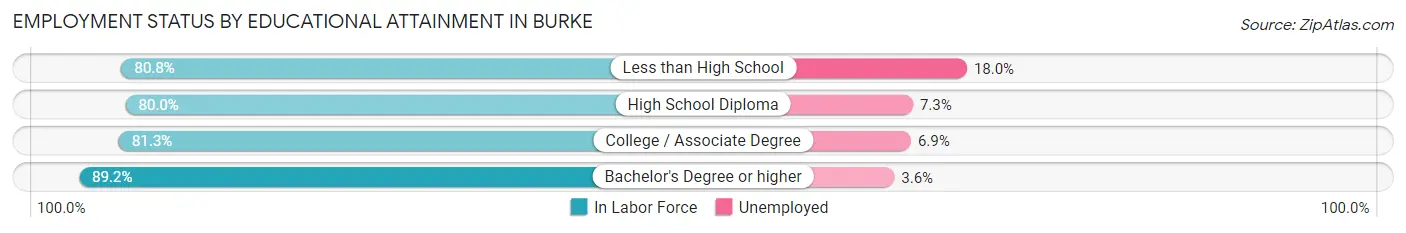
| Educational Attainment | In Labor Force | Unemployed |
| Less than High School | 729 (80.8%) | 162 (18.0%) |
| High School Diploma | 1,879 (80.0%) | 171 (7.3%) |
| College / Associate Degree | 3,576 (81.3%) | 303 (6.9%) |
| Bachelor's Degree or higher | 13,206 (89.2%) | 533 (3.6%) |
| Total | 19,378 (86.3%) | 1,145 (5.1%) |
Employment Occupations by Sex in Burke
Management, Business, Science and Arts Occupations
The most common Management, Business, Science and Arts occupations in Burke are Computers, Engineering & Science (3,717 | 17.2%), Community & Social Service (3,339 | 15.5%), Management (3,321 | 15.4%), Computers & Mathematics (2,195 | 10.2%), and Business & Financial (2,125 | 9.8%).
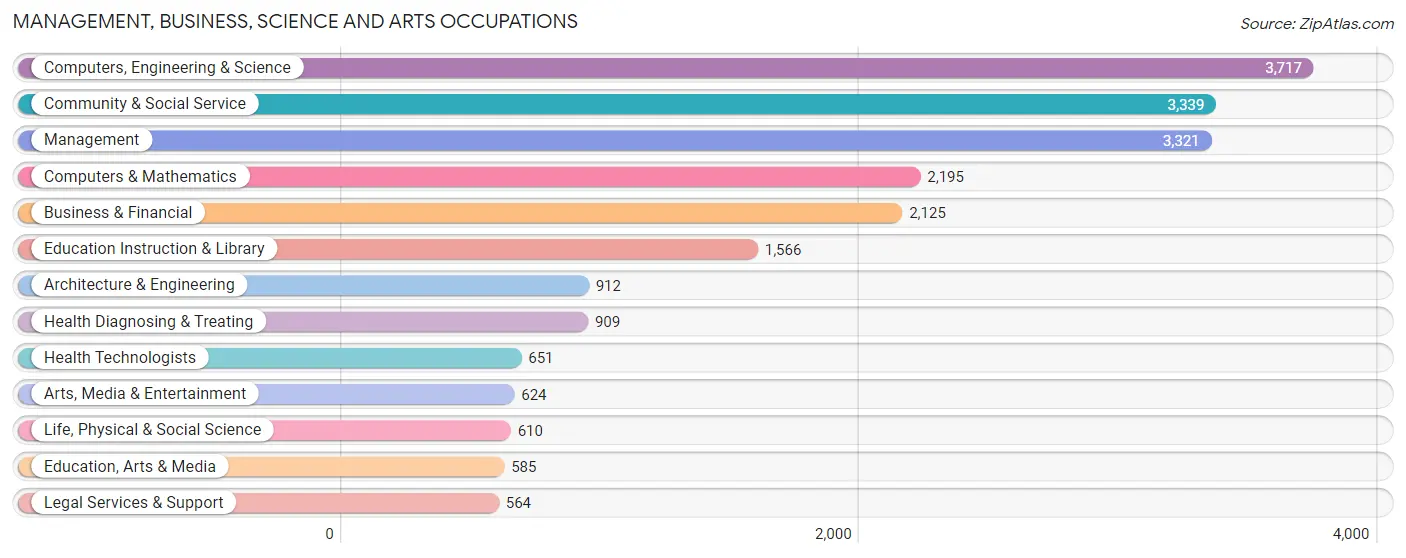
Management, Business, Science and Arts Occupations by Sex
Within the Management, Business, Science and Arts occupations in Burke, the most male-oriented occupations are Architecture & Engineering (82.4%), Computers & Mathematics (73.8%), and Computers, Engineering & Science (70.7%), while the most female-oriented occupations are Health Diagnosing & Treating (76.8%), Education Instruction & Library (76.4%), and Health Technologists (76.2%).
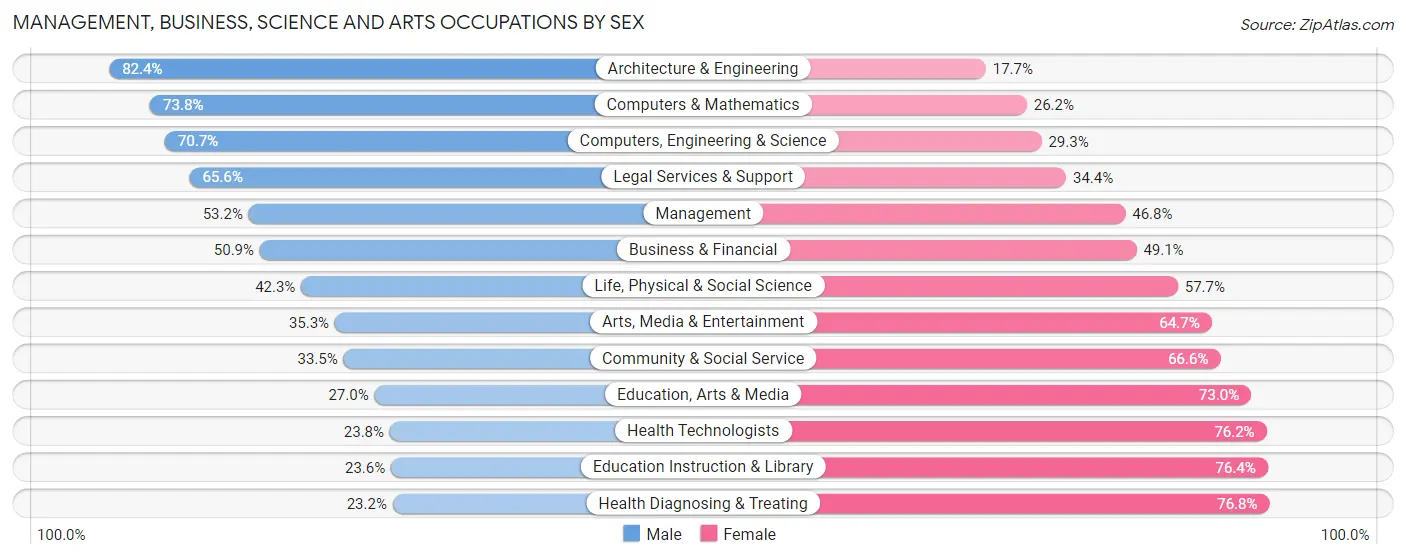
| Occupation | Male | Female |
| Management | 1,768 (53.2%) | 1,553 (46.8%) |
| Business & Financial | 1,082 (50.9%) | 1,043 (49.1%) |
| Computers, Engineering & Science | 2,629 (70.7%) | 1,088 (29.3%) |
| Computers & Mathematics | 1,620 (73.8%) | 575 (26.2%) |
| Architecture & Engineering | 751 (82.4%) | 161 (17.6%) |
| Life, Physical & Social Science | 258 (42.3%) | 352 (57.7%) |
| Community & Social Service | 1,117 (33.5%) | 2,222 (66.5%) |
| Education, Arts & Media | 158 (27.0%) | 427 (73.0%) |
| Legal Services & Support | 370 (65.6%) | 194 (34.4%) |
| Education Instruction & Library | 369 (23.6%) | 1,197 (76.4%) |
| Arts, Media & Entertainment | 220 (35.3%) | 404 (64.7%) |
| Health Diagnosing & Treating | 211 (23.2%) | 698 (76.8%) |
| Health Technologists | 155 (23.8%) | 496 (76.2%) |
| Total (Category) | 6,807 (50.8%) | 6,604 (49.2%) |
| Total (Overall) | 11,236 (52.0%) | 10,358 (48.0%) |
Services Occupations
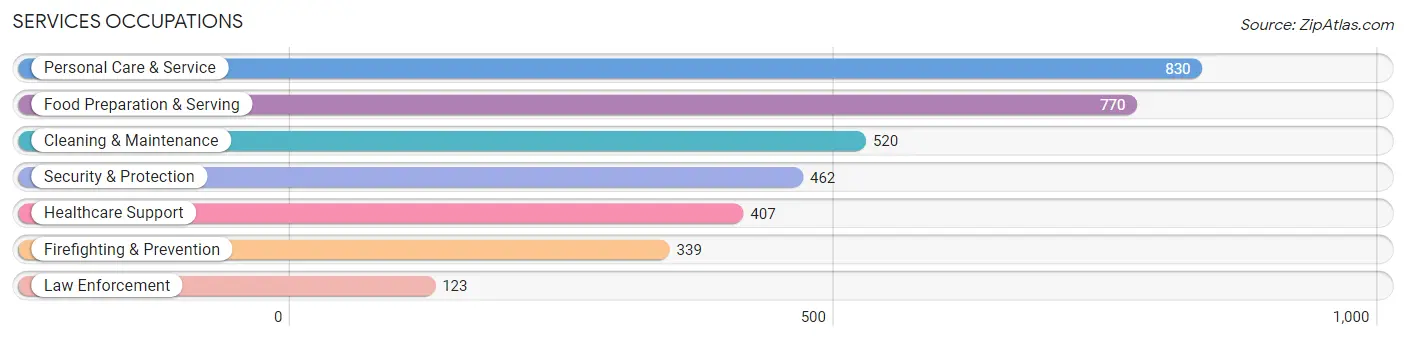
The most common Services occupations in Burke are Personal Care & Service (830 | 3.8%), Food Preparation & Serving (770 | 3.6%), Cleaning & Maintenance (520 | 2.4%), Security & Protection (462 | 2.1%), and Healthcare Support (407 | 1.9%).
Services Occupations by Sex
Within the Services occupations in Burke, the most male-oriented occupations are Law Enforcement (74.8%), Security & Protection (71.2%), and Firefighting & Prevention (69.9%), while the most female-oriented occupations are Personal Care & Service (76.9%), Healthcare Support (65.1%), and Food Preparation & Serving (49.2%).
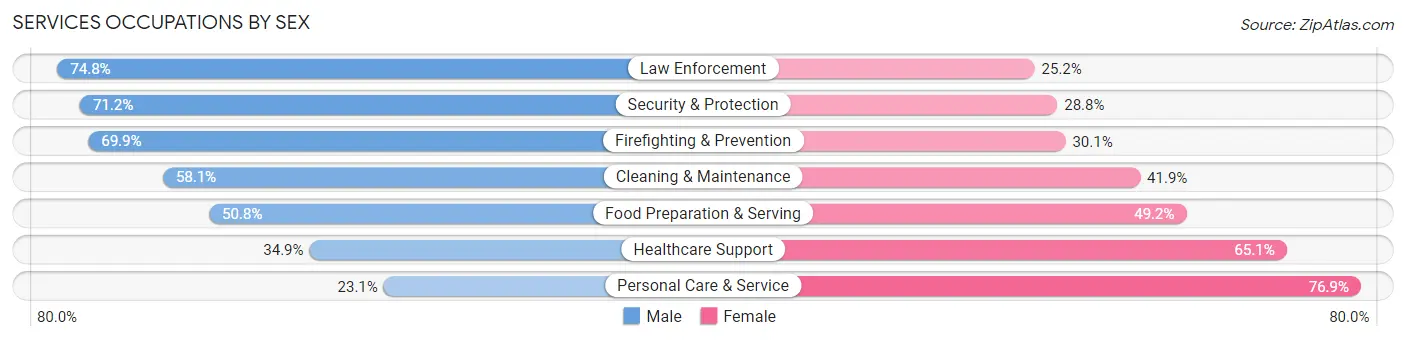
| Occupation | Male | Female |
| Healthcare Support | 142 (34.9%) | 265 (65.1%) |
| Security & Protection | 329 (71.2%) | 133 (28.8%) |
| Firefighting & Prevention | 237 (69.9%) | 102 (30.1%) |
| Law Enforcement | 92 (74.8%) | 31 (25.2%) |
| Food Preparation & Serving | 391 (50.8%) | 379 (49.2%) |
| Cleaning & Maintenance | 302 (58.1%) | 218 (41.9%) |
| Personal Care & Service | 192 (23.1%) | 638 (76.9%) |
| Total (Category) | 1,356 (45.4%) | 1,633 (54.6%) |
| Total (Overall) | 11,236 (52.0%) | 10,358 (48.0%) |
Sales and Office Occupations
The most common Sales and Office occupations in Burke are Office & Administration (1,728 | 8.0%), and Sales & Related (1,526 | 7.1%).

Sales and Office Occupations by Sex
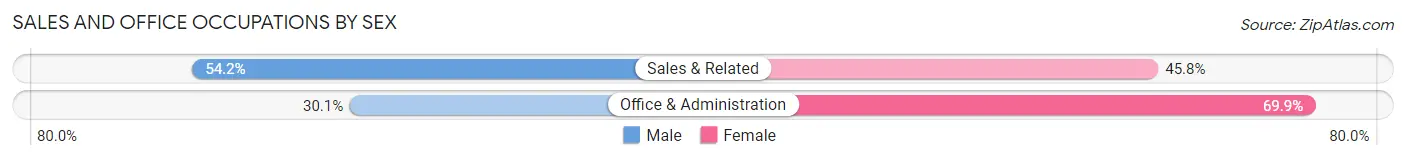
| Occupation | Male | Female |
| Sales & Related | 827 (54.2%) | 699 (45.8%) |
| Office & Administration | 520 (30.1%) | 1,208 (69.9%) |
| Total (Category) | 1,347 (41.4%) | 1,907 (58.6%) |
| Total (Overall) | 11,236 (52.0%) | 10,358 (48.0%) |
Natural Resources, Construction and Maintenance Occupations
The most common Natural Resources, Construction and Maintenance occupations in Burke are Construction & Extraction (506 | 2.3%), and Installation, Maintenance & Repair (385 | 1.8%).
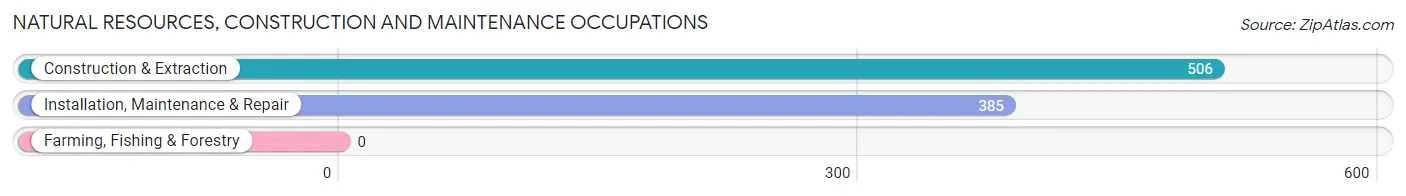
Natural Resources, Construction and Maintenance Occupations by Sex
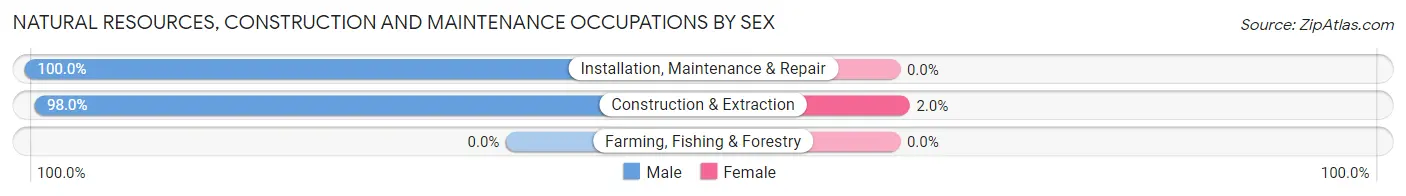
| Occupation | Male | Female |
| Farming, Fishing & Forestry | 0 (0.0%) | 0 (0.0%) |
| Construction & Extraction | 496 (98.0%) | 10 (2.0%) |
| Installation, Maintenance & Repair | 385 (100.0%) | 0 (0.0%) |
| Total (Category) | 881 (98.9%) | 10 (1.1%) |
| Total (Overall) | 11,236 (52.0%) | 10,358 (48.0%) |
Production, Transportation and Moving Occupations
The most common Production, Transportation and Moving occupations in Burke are Transportation (511 | 2.4%), Material Moving (288 | 1.3%), and Production (250 | 1.2%).
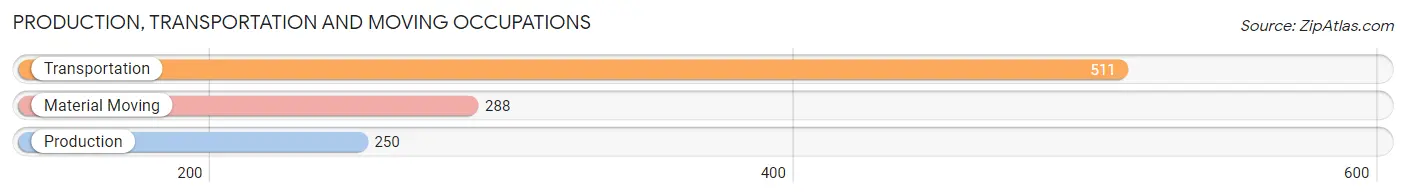
Production, Transportation and Moving Occupations by Sex
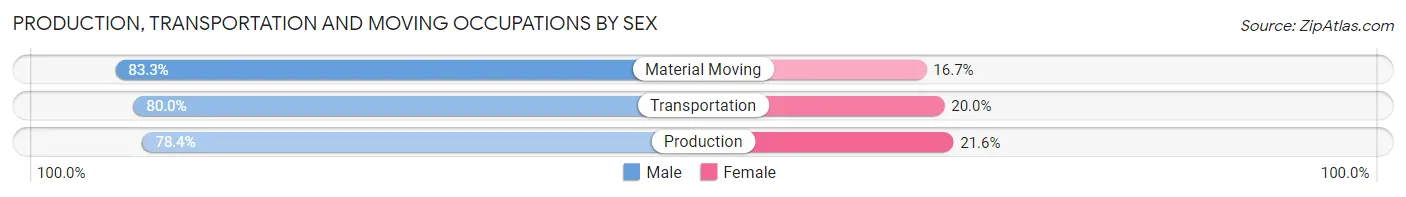
| Occupation | Male | Female |
| Production | 196 (78.4%) | 54 (21.6%) |
| Transportation | 409 (80.0%) | 102 (20.0%) |
| Material Moving | 240 (83.3%) | 48 (16.7%) |
| Total (Category) | 845 (80.5%) | 204 (19.5%) |
| Total (Overall) | 11,236 (52.0%) | 10,358 (48.0%) |
Employment Industries by Sex in Burke
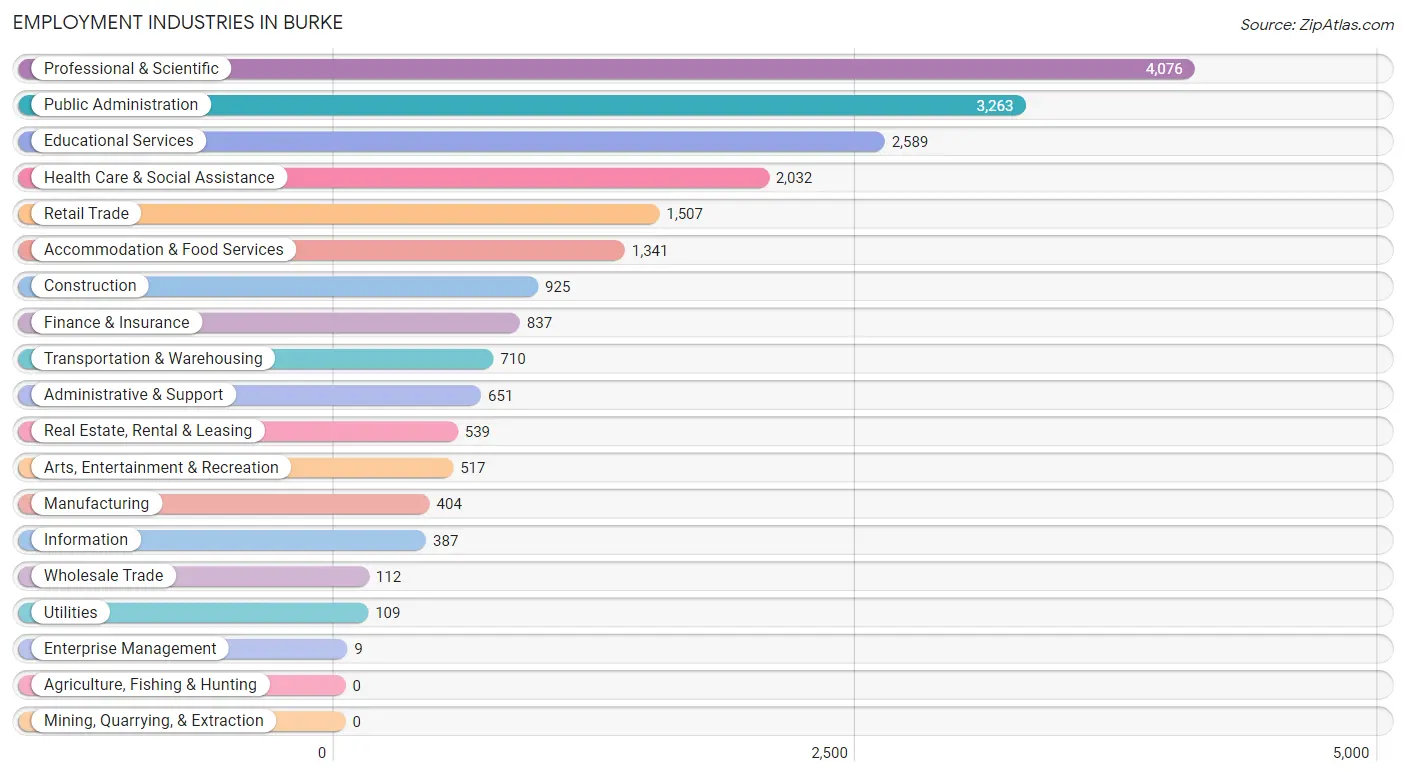
Employment Industries in Burke
The major employment industries in Burke include Professional & Scientific (4,076 | 18.9%), Public Administration (3,263 | 15.1%), Educational Services (2,589 | 12.0%), Health Care & Social Assistance (2,032 | 9.4%), and Retail Trade (1,507 | 7.0%).
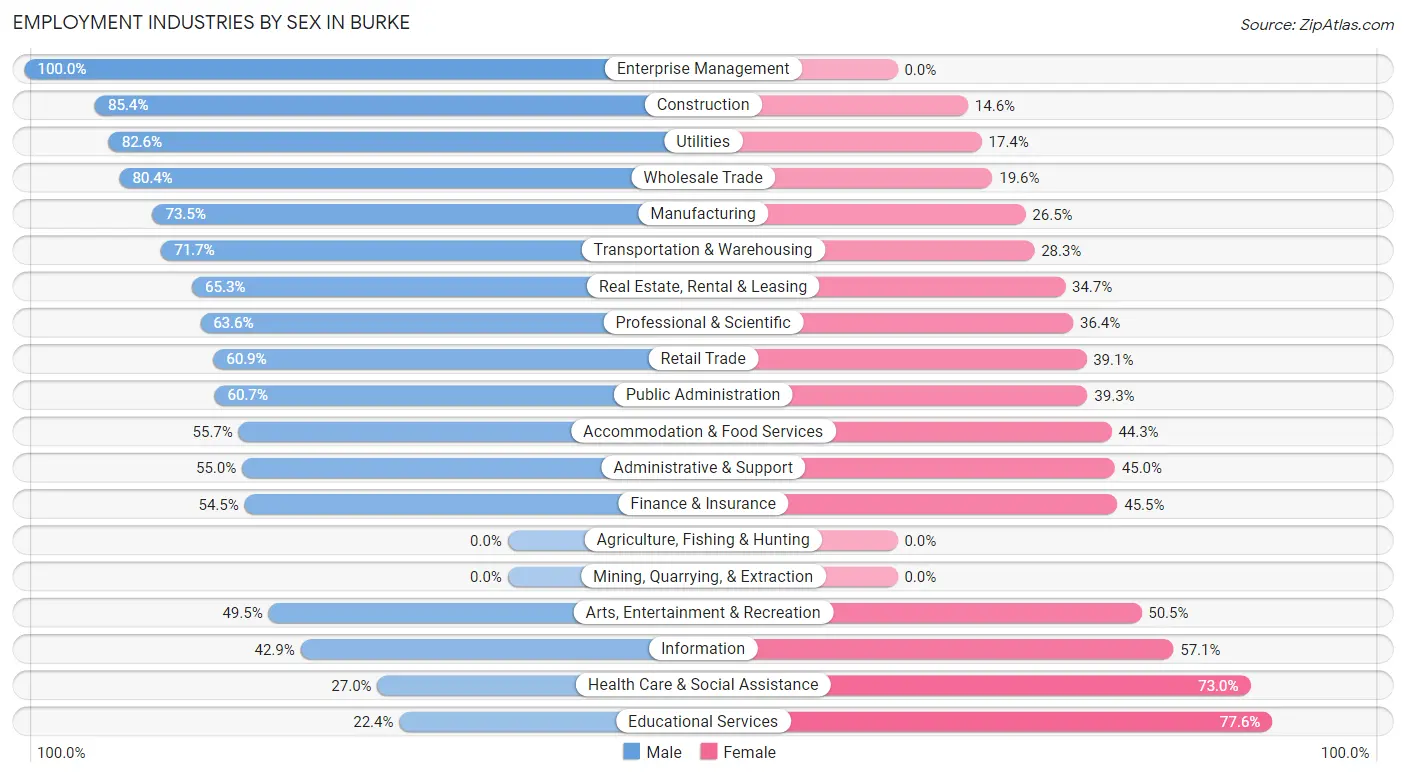
Employment Industries by Sex in Burke
The Burke industries that see more men than women are Enterprise Management (100.0%), Construction (85.4%), and Utilities (82.6%), whereas the industries that tend to have a higher number of women are Educational Services (77.6%), Health Care & Social Assistance (73.0%), and Information (57.1%).
| Industry | Male | Female |
| Agriculture, Fishing & Hunting | 0 (0.0%) | 0 (0.0%) |
| Mining, Quarrying, & Extraction | 0 (0.0%) | 0 (0.0%) |
| Construction | 790 (85.4%) | 135 (14.6%) |
| Manufacturing | 297 (73.5%) | 107 (26.5%) |
| Wholesale Trade | 90 (80.4%) | 22 (19.6%) |
| Retail Trade | 918 (60.9%) | 589 (39.1%) |
| Transportation & Warehousing | 509 (71.7%) | 201 (28.3%) |
| Utilities | 90 (82.6%) | 19 (17.4%) |
| Information | 166 (42.9%) | 221 (57.1%) |
| Finance & Insurance | 456 (54.5%) | 381 (45.5%) |
| Real Estate, Rental & Leasing | 352 (65.3%) | 187 (34.7%) |
| Professional & Scientific | 2,594 (63.6%) | 1,482 (36.4%) |
| Enterprise Management | 9 (100.0%) | 0 (0.0%) |
| Administrative & Support | 358 (55.0%) | 293 (45.0%) |
| Educational Services | 581 (22.4%) | 2,008 (77.6%) |
| Health Care & Social Assistance | 548 (27.0%) | 1,484 (73.0%) |
| Arts, Entertainment & Recreation | 256 (49.5%) | 261 (50.5%) |
| Accommodation & Food Services | 747 (55.7%) | 594 (44.3%) |
| Public Administration | 1,980 (60.7%) | 1,283 (39.3%) |
| Total | 11,236 (52.0%) | 10,358 (48.0%) |
Education in Burke
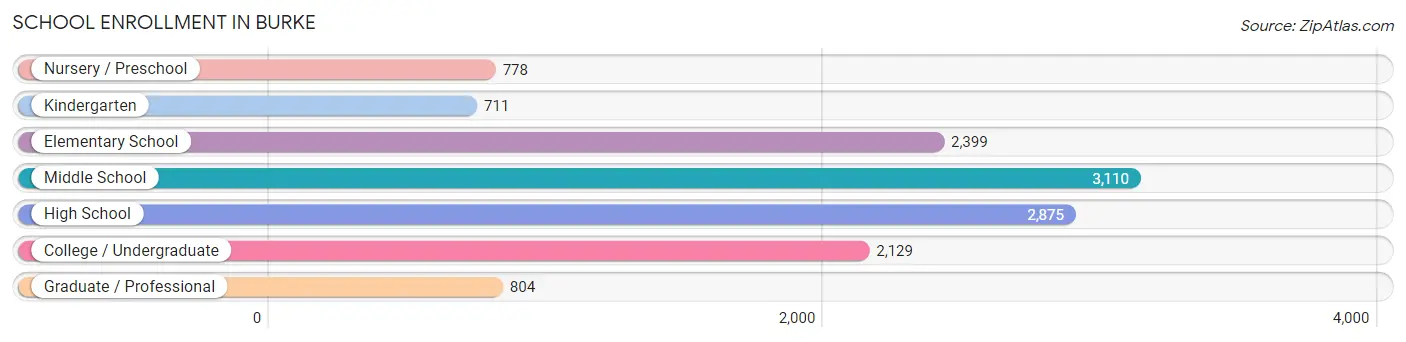
School Enrollment in Burke
The most common levels of schooling among the 12,806 students in Burke are middle school (3,110 | 24.3%), high school (2,875 | 22.5%), and elementary school (2,399 | 18.7%).
| School Level | # Students | % Students |
| Nursery / Preschool | 778 | 6.1% |
| Kindergarten | 711 | 5.6% |
| Elementary School | 2,399 | 18.7% |
| Middle School | 3,110 | 24.3% |
| High School | 2,875 | 22.5% |
| College / Undergraduate | 2,129 | 16.6% |
| Graduate / Professional | 804 | 6.3% |
| Total | 12,806 | 100.0% |
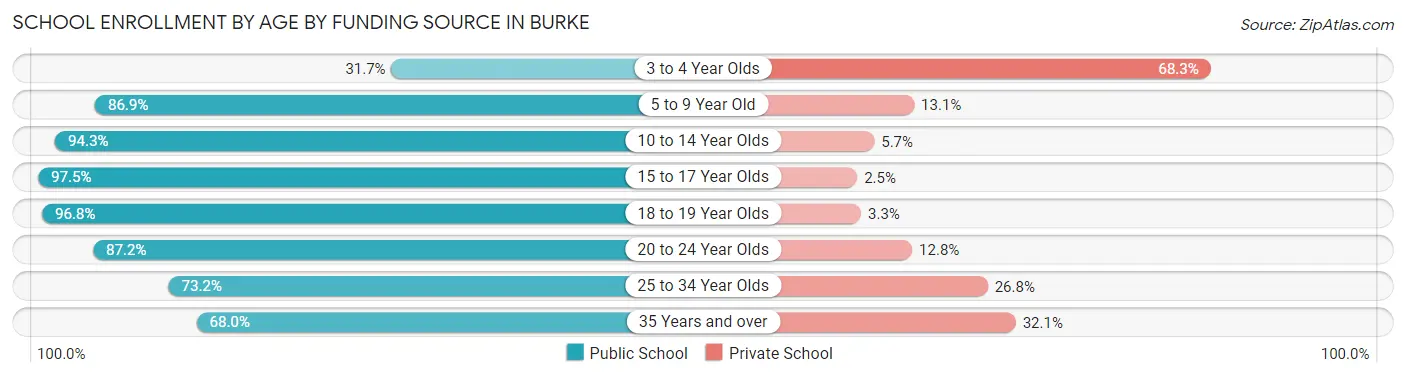
School Enrollment by Age by Funding Source in Burke
Out of a total of 12,806 students who are enrolled in schools in Burke, 1,716 (13.4%) attend a private institution, while the remaining 11,090 (86.6%) are enrolled in public schools. The age group of 3 to 4 year olds has the highest likelihood of being enrolled in private schools, with 438 (68.3% in the age bracket) enrolled. Conversely, the age group of 15 to 17 year olds has the lowest likelihood of being enrolled in a private school, with 1,962 (97.5% in the age bracket) attending a public institution.
| Age Bracket | Public School | Private School |
| 3 to 4 Year Olds | 203 (31.7%) | 438 (68.3%) |
| 5 to 9 Year Old | 2,475 (86.9%) | 374 (13.1%) |
| 10 to 14 Year Olds | 3,659 (94.3%) | 221 (5.7%) |
| 15 to 17 Year Olds | 1,962 (97.5%) | 51 (2.5%) |
| 18 to 19 Year Olds | 626 (96.8%) | 21 (3.3%) |
| 20 to 24 Year Olds | 1,135 (87.2%) | 166 (12.8%) |
| 25 to 34 Year Olds | 431 (73.2%) | 158 (26.8%) |
| 35 Years and over | 602 (67.9%) | 284 (32.1%) |
| Total | 11,090 (86.6%) | 1,716 (13.4%) |
Educational Attainment by Field of Study in Burke
Business (3,367 | 16.2%), social sciences (3,069 | 14.7%), engineering (2,422 | 11.6%), education (1,450 | 7.0%), and computers & mathematics (1,421 | 6.8%) are the most common fields of study among 20,800 individuals in Burke who have obtained a bachelor's degree or higher.
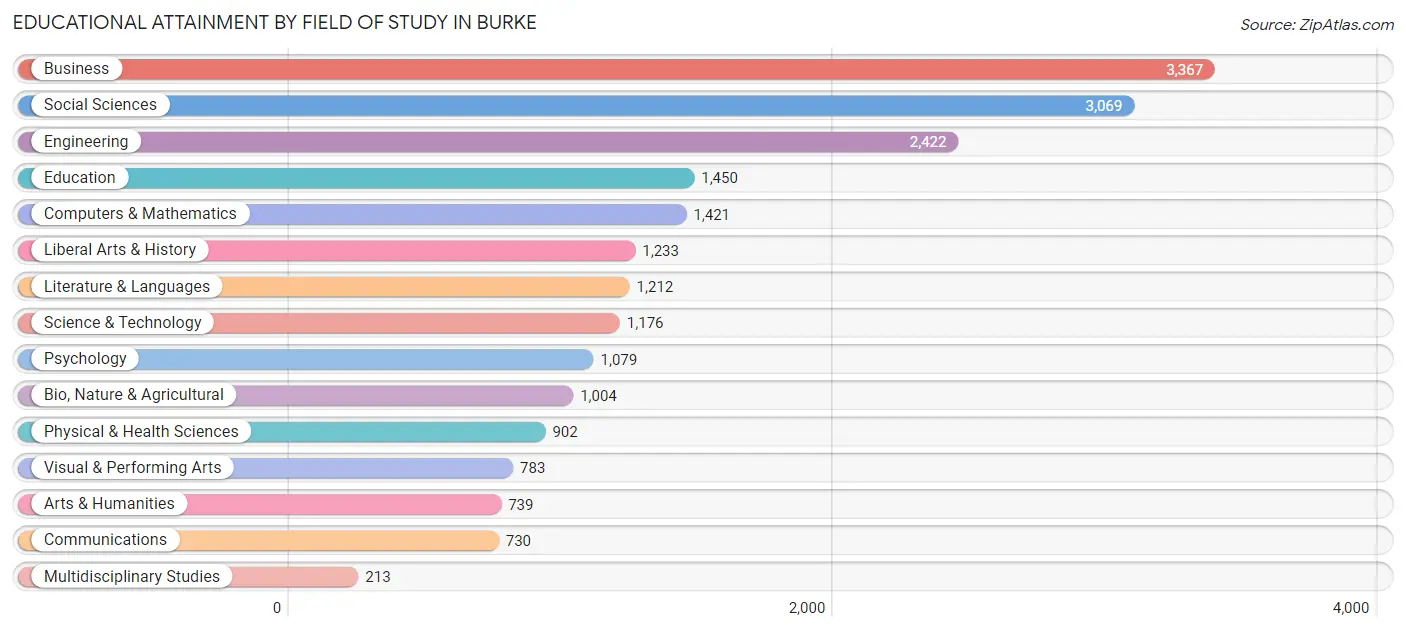
| Field of Study | # Graduates | % Graduates |
| Computers & Mathematics | 1,421 | 6.8% |
| Bio, Nature & Agricultural | 1,004 | 4.8% |
| Physical & Health Sciences | 902 | 4.3% |
| Psychology | 1,079 | 5.2% |
| Social Sciences | 3,069 | 14.7% |
| Engineering | 2,422 | 11.6% |
| Multidisciplinary Studies | 213 | 1.0% |
| Science & Technology | 1,176 | 5.7% |
| Business | 3,367 | 16.2% |
| Education | 1,450 | 7.0% |
| Literature & Languages | 1,212 | 5.8% |
| Liberal Arts & History | 1,233 | 5.9% |
| Visual & Performing Arts | 783 | 3.8% |
| Communications | 730 | 3.5% |
| Arts & Humanities | 739 | 3.5% |
| Total | 20,800 | 100.0% |
Transportation & Commute in Burke
Vehicle Availability by Sex in Burke
The most prevalent vehicle ownership categories in Burke are males with 2 vehicles (5,574, accounting for 48.0%) and females with 2 vehicles (4,449, making up 54.7%).
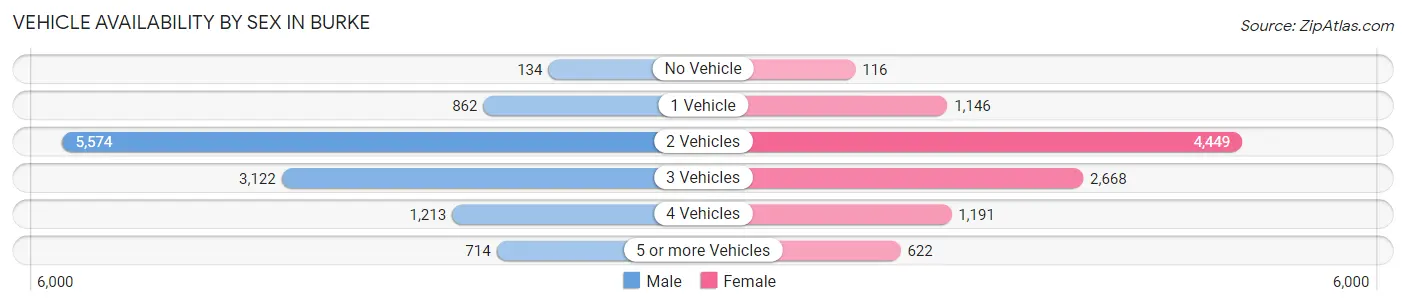
| Vehicles Available | Male | Female |
| No Vehicle | 134 (1.1%) | 116 (1.1%) |
| 1 Vehicle | 862 (7.4%) | 1,146 (11.2%) |
| 2 Vehicles | 5,574 (48.0%) | 4,449 (43.6%) |
| 3 Vehicles | 3,122 (26.9%) | 2,668 (26.2%) |
| 4 Vehicles | 1,213 (10.4%) | 1,191 (11.7%) |
| 5 or more Vehicles | 714 (6.1%) | 622 (6.1%) |
| Total | 11,619 (100.0%) | 10,192 (100.0%) |
Commute Time in Burke
The most frequently occuring commute durations in Burke are 30 to 34 minutes (3,579 commuters, 21.3%), 45 to 59 minutes (2,693 commuters, 16.1%), and 20 to 24 minutes (2,095 commuters, 12.5%).
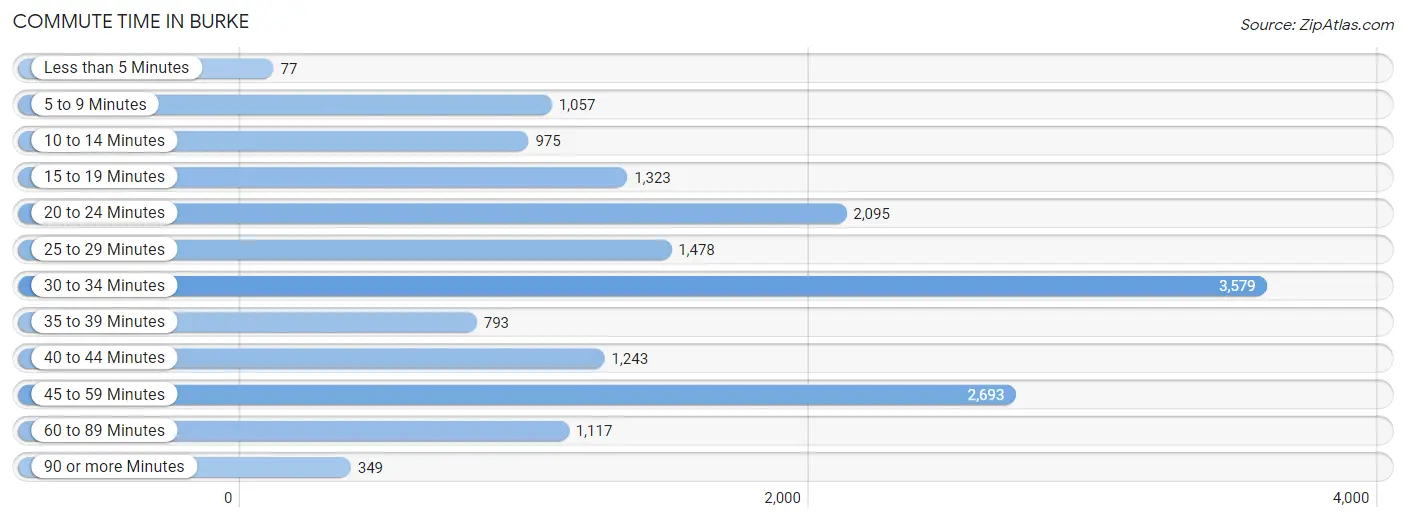
| Commute Time | # Commuters | % Commuters |
| Less than 5 Minutes | 77 | 0.5% |
| 5 to 9 Minutes | 1,057 | 6.3% |
| 10 to 14 Minutes | 975 | 5.8% |
| 15 to 19 Minutes | 1,323 | 7.9% |
| 20 to 24 Minutes | 2,095 | 12.5% |
| 25 to 29 Minutes | 1,478 | 8.8% |
| 30 to 34 Minutes | 3,579 | 21.3% |
| 35 to 39 Minutes | 793 | 4.7% |
| 40 to 44 Minutes | 1,243 | 7.4% |
| 45 to 59 Minutes | 2,693 | 16.1% |
| 60 to 89 Minutes | 1,117 | 6.7% |
| 90 or more Minutes | 349 | 2.1% |
Commute Time by Sex in Burke
The most common commute times in Burke are 30 to 34 minutes (2,009 commuters, 21.9%) for males and 30 to 34 minutes (1,570 commuters, 20.6%) for females.
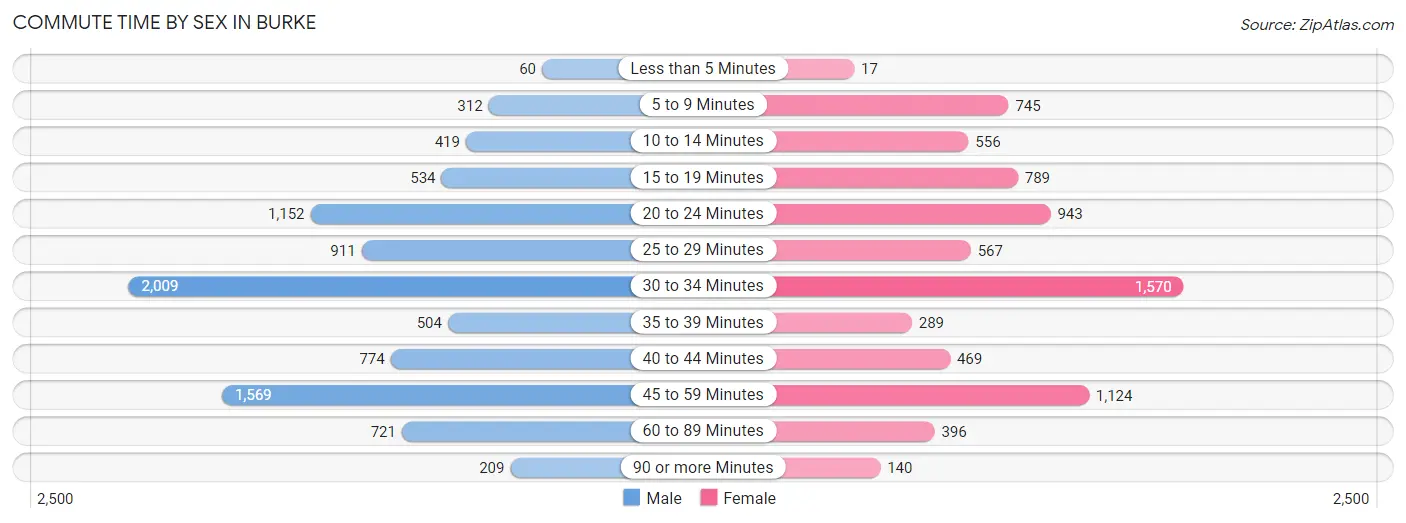
| Commute Time | Male | Female |
| Less than 5 Minutes | 60 (0.6%) | 17 (0.2%) |
| 5 to 9 Minutes | 312 (3.4%) | 745 (9.8%) |
| 10 to 14 Minutes | 419 (4.6%) | 556 (7.3%) |
| 15 to 19 Minutes | 534 (5.8%) | 789 (10.4%) |
| 20 to 24 Minutes | 1,152 (12.6%) | 943 (12.4%) |
| 25 to 29 Minutes | 911 (9.9%) | 567 (7.5%) |
| 30 to 34 Minutes | 2,009 (21.9%) | 1,570 (20.6%) |
| 35 to 39 Minutes | 504 (5.5%) | 289 (3.8%) |
| 40 to 44 Minutes | 774 (8.4%) | 469 (6.2%) |
| 45 to 59 Minutes | 1,569 (17.1%) | 1,124 (14.8%) |
| 60 to 89 Minutes | 721 (7.9%) | 396 (5.2%) |
| 90 or more Minutes | 209 (2.3%) | 140 (1.8%) |
Time of Departure to Work by Sex in Burke
The most frequent times of departure to work in Burke are 8:00 AM to 8:29 AM (1,420, 15.5%) for males and 7:00 AM to 7:29 AM (1,398, 18.4%) for females.
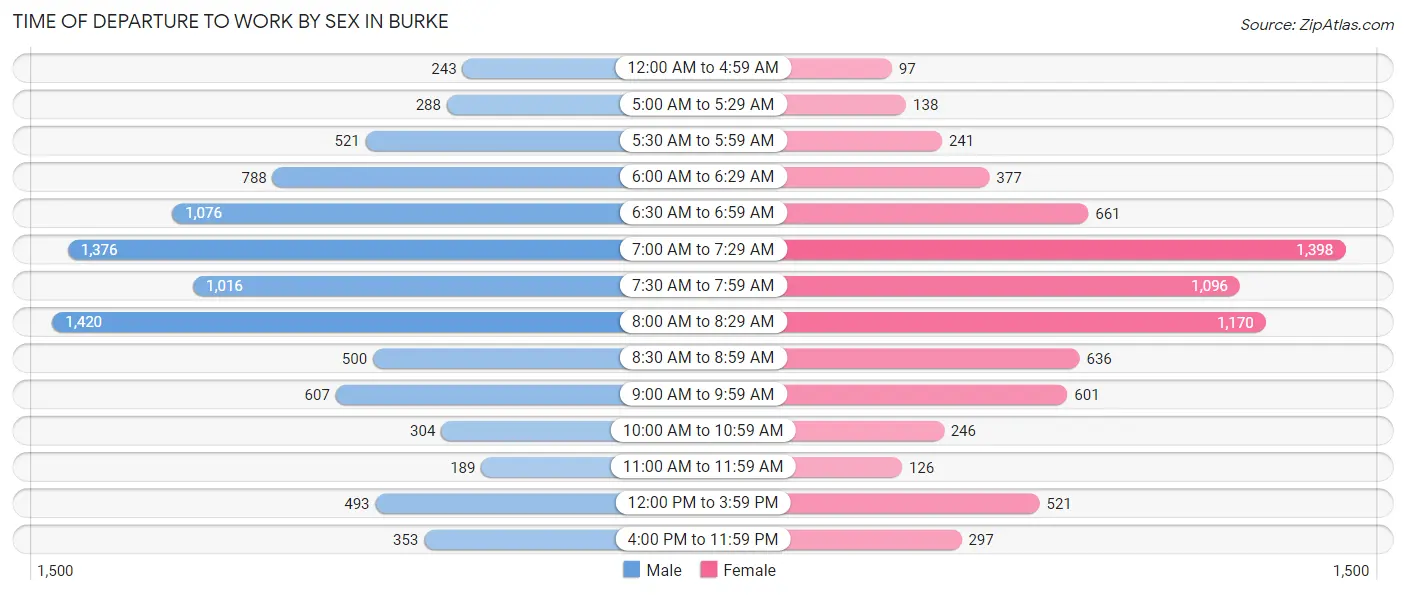
| Time of Departure | Male | Female |
| 12:00 AM to 4:59 AM | 243 (2.6%) | 97 (1.3%) |
| 5:00 AM to 5:29 AM | 288 (3.1%) | 138 (1.8%) |
| 5:30 AM to 5:59 AM | 521 (5.7%) | 241 (3.2%) |
| 6:00 AM to 6:29 AM | 788 (8.6%) | 377 (5.0%) |
| 6:30 AM to 6:59 AM | 1,076 (11.7%) | 661 (8.7%) |
| 7:00 AM to 7:29 AM | 1,376 (15.0%) | 1,398 (18.4%) |
| 7:30 AM to 7:59 AM | 1,016 (11.1%) | 1,096 (14.4%) |
| 8:00 AM to 8:29 AM | 1,420 (15.5%) | 1,170 (15.4%) |
| 8:30 AM to 8:59 AM | 500 (5.4%) | 636 (8.4%) |
| 9:00 AM to 9:59 AM | 607 (6.6%) | 601 (7.9%) |
| 10:00 AM to 10:59 AM | 304 (3.3%) | 246 (3.2%) |
| 11:00 AM to 11:59 AM | 189 (2.1%) | 126 (1.7%) |
| 12:00 PM to 3:59 PM | 493 (5.4%) | 521 (6.9%) |
| 4:00 PM to 11:59 PM | 353 (3.8%) | 297 (3.9%) |
| Total | 9,174 (100.0%) | 7,605 (100.0%) |
Housing Occupancy in Burke
Occupancy by Ownership in Burke
Of the total 13,786 dwellings in Burke, owner-occupied units account for 12,179 (88.3%), while renter-occupied units make up 1,607 (11.7%).
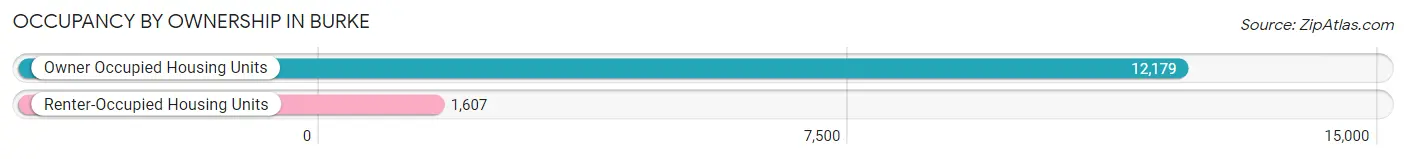
| Occupancy | # Housing Units | % Housing Units |
| Owner Occupied Housing Units | 12,179 | 88.3% |
| Renter-Occupied Housing Units | 1,607 | 11.7% |
| Total Occupied Housing Units | 13,786 | 100.0% |
Occupancy by Household Size in Burke
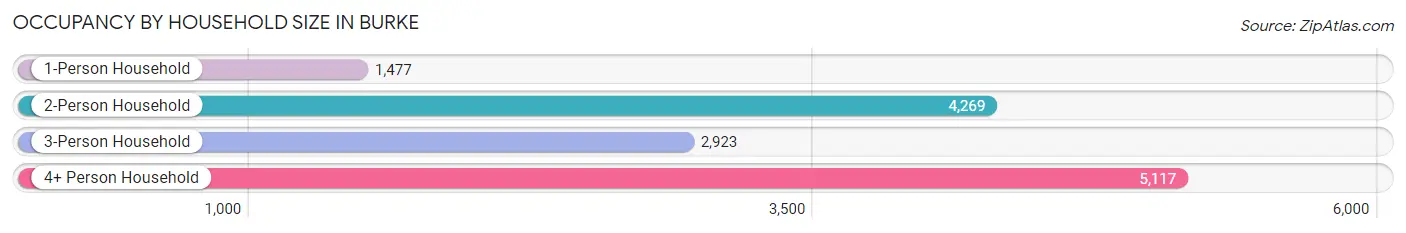
| Household Size | # Housing Units | % Housing Units |
| 1-Person Household | 1,477 | 10.7% |
| 2-Person Household | 4,269 | 31.0% |
| 3-Person Household | 2,923 | 21.2% |
| 4+ Person Household | 5,117 | 37.1% |
| Total Housing Units | 13,786 | 100.0% |
Occupancy by Ownership by Household Size in Burke
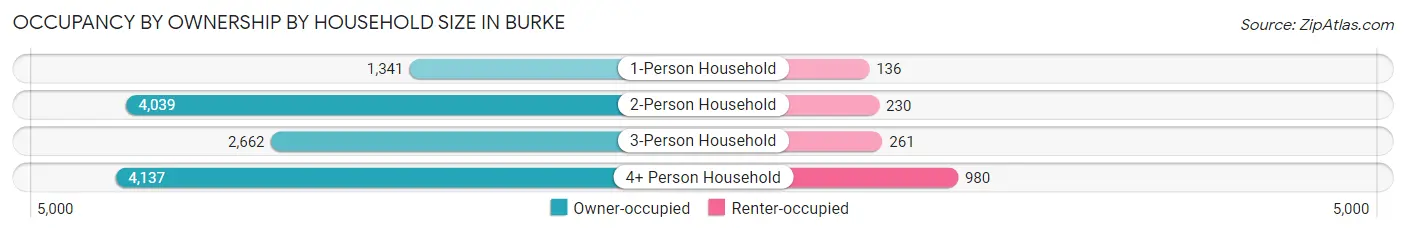
| Household Size | Owner-occupied | Renter-occupied |
| 1-Person Household | 1,341 (90.8%) | 136 (9.2%) |
| 2-Person Household | 4,039 (94.6%) | 230 (5.4%) |
| 3-Person Household | 2,662 (91.1%) | 261 (8.9%) |
| 4+ Person Household | 4,137 (80.8%) | 980 (19.2%) |
| Total Housing Units | 12,179 (88.3%) | 1,607 (11.7%) |
Occupancy by Educational Attainment in Burke
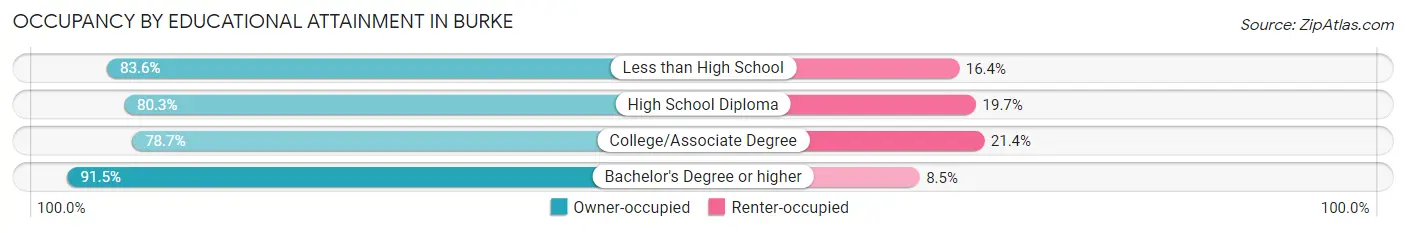
| Household Size | Owner-occupied | Renter-occupied |
| Less than High School | 337 (83.6%) | 66 (16.4%) |
| High School Diploma | 814 (80.3%) | 200 (19.7%) |
| College/Associate Degree | 1,746 (78.6%) | 474 (21.3%) |
| Bachelor's Degree or higher | 9,282 (91.5%) | 867 (8.5%) |
Occupancy by Age of Householder in Burke
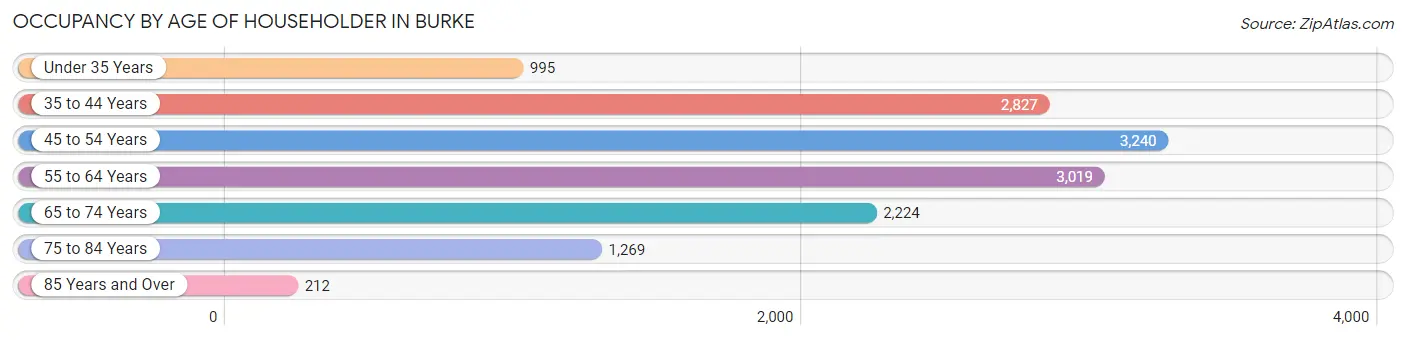
| Age Bracket | # Households | % Households |
| Under 35 Years | 995 | 7.2% |
| 35 to 44 Years | 2,827 | 20.5% |
| 45 to 54 Years | 3,240 | 23.5% |
| 55 to 64 Years | 3,019 | 21.9% |
| 65 to 74 Years | 2,224 | 16.1% |
| 75 to 84 Years | 1,269 | 9.2% |
| 85 Years and Over | 212 | 1.5% |
| Total | 13,786 | 100.0% |
Housing Finances in Burke
Median Income by Occupancy in Burke
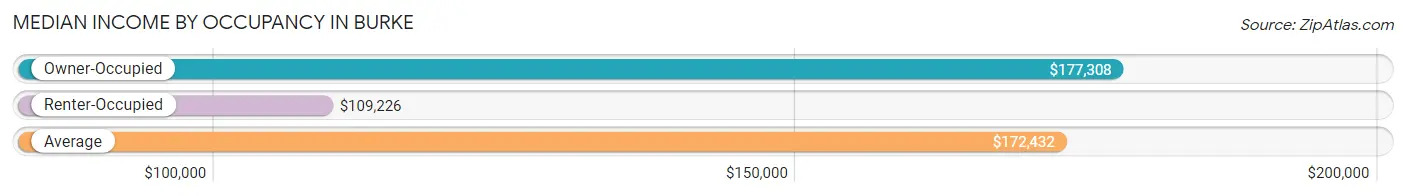
| Occupancy Type | # Households | Median Income |
| Owner-Occupied | 12,179 (88.3%) | $177,308 |
| Renter-Occupied | 1,607 (11.7%) | $109,226 |
| Average | 13,786 (100.0%) | $172,432 |
Occupancy by Householder Income Bracket in Burke
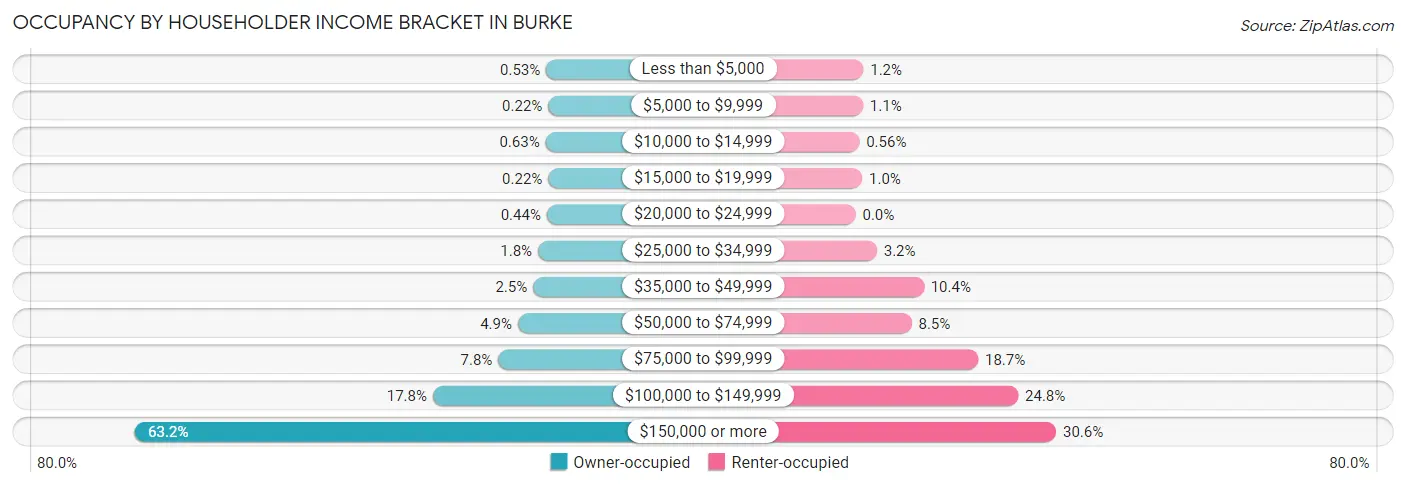
| Income Bracket | Owner-occupied | Renter-occupied |
| Less than $5,000 | 64 (0.5%) | 19 (1.2%) |
| $5,000 to $9,999 | 27 (0.2%) | 18 (1.1%) |
| $10,000 to $14,999 | 77 (0.6%) | 9 (0.6%) |
| $15,000 to $19,999 | 27 (0.2%) | 16 (1.0%) |
| $20,000 to $24,999 | 53 (0.4%) | 0 (0.0%) |
| $25,000 to $34,999 | 217 (1.8%) | 52 (3.2%) |
| $35,000 to $49,999 | 307 (2.5%) | 167 (10.4%) |
| $50,000 to $74,999 | 591 (4.9%) | 137 (8.5%) |
| $75,000 to $99,999 | 955 (7.8%) | 300 (18.7%) |
| $100,000 to $149,999 | 2,168 (17.8%) | 398 (24.8%) |
| $150,000 or more | 7,693 (63.2%) | 491 (30.5%) |
| Total | 12,179 (100.0%) | 1,607 (100.0%) |
Monthly Housing Cost Tiers in Burke
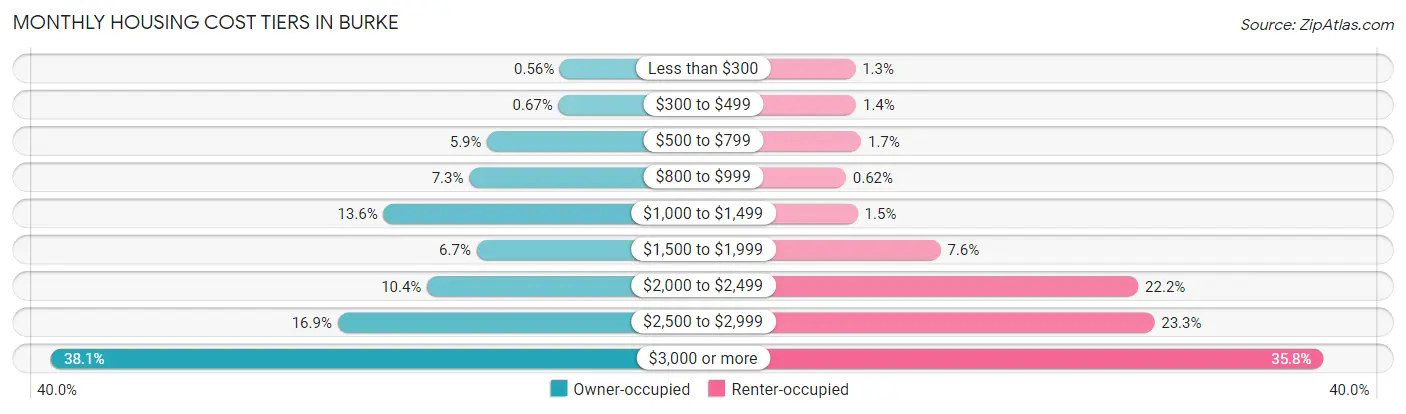
| Monthly Cost | Owner-occupied | Renter-occupied |
| Less than $300 | 68 (0.6%) | 21 (1.3%) |
| $300 to $499 | 81 (0.7%) | 22 (1.4%) |
| $500 to $799 | 721 (5.9%) | 28 (1.7%) |
| $800 to $999 | 883 (7.2%) | 10 (0.6%) |
| $1,000 to $1,499 | 1,653 (13.6%) | 24 (1.5%) |
| $1,500 to $1,999 | 816 (6.7%) | 122 (7.6%) |
| $2,000 to $2,499 | 1,260 (10.3%) | 356 (22.2%) |
| $2,500 to $2,999 | 2,063 (16.9%) | 375 (23.3%) |
| $3,000 or more | 4,634 (38.1%) | 575 (35.8%) |
| Total | 12,179 (100.0%) | 1,607 (100.0%) |
Physical Housing Characteristics in Burke
Housing Structures in Burke
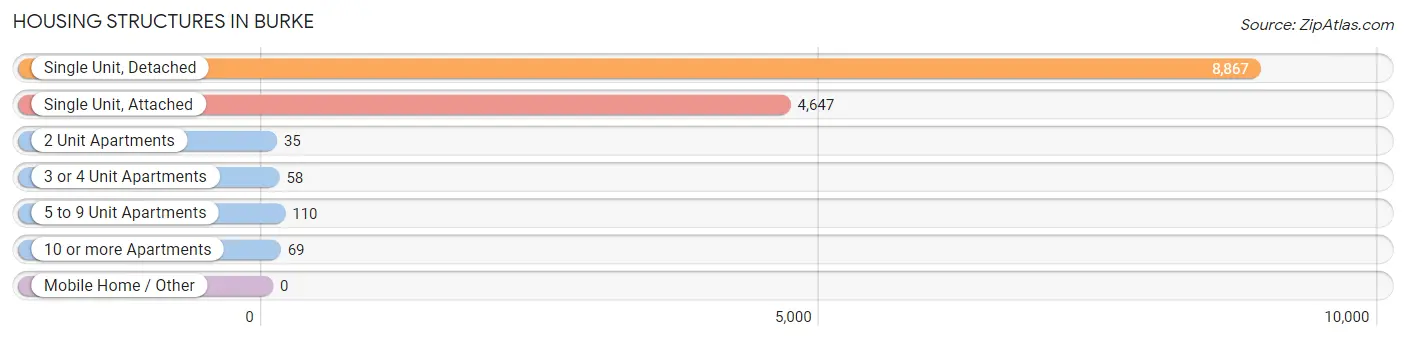
| Structure Type | # Housing Units | % Housing Units |
| Single Unit, Detached | 8,867 | 64.3% |
| Single Unit, Attached | 4,647 | 33.7% |
| 2 Unit Apartments | 35 | 0.3% |
| 3 or 4 Unit Apartments | 58 | 0.4% |
| 5 to 9 Unit Apartments | 110 | 0.8% |
| 10 or more Apartments | 69 | 0.5% |
| Mobile Home / Other | 0 | 0.0% |
| Total | 13,786 | 100.0% |
Housing Structures by Occupancy in Burke
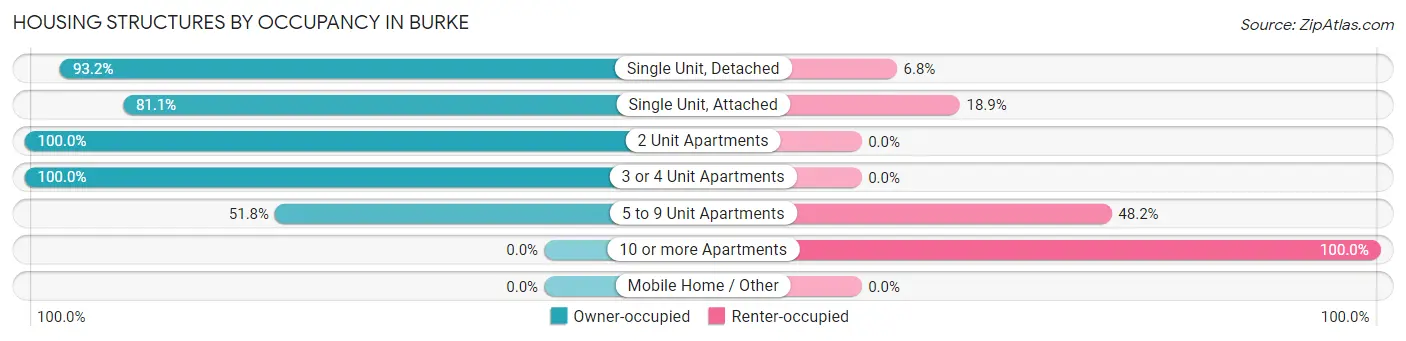
| Structure Type | Owner-occupied | Renter-occupied |
| Single Unit, Detached | 8,262 (93.2%) | 605 (6.8%) |
| Single Unit, Attached | 3,767 (81.1%) | 880 (18.9%) |
| 2 Unit Apartments | 35 (100.0%) | 0 (0.0%) |
| 3 or 4 Unit Apartments | 58 (100.0%) | 0 (0.0%) |
| 5 to 9 Unit Apartments | 57 (51.8%) | 53 (48.2%) |
| 10 or more Apartments | 0 (0.0%) | 69 (100.0%) |
| Mobile Home / Other | 0 (0.0%) | 0 (0.0%) |
| Total | 12,179 (88.3%) | 1,607 (11.7%) |
Housing Structures by Number of Rooms in Burke
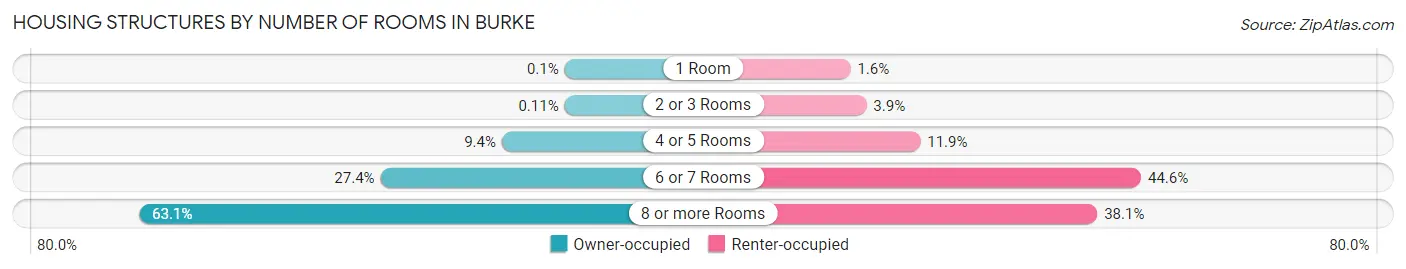
| Number of Rooms | Owner-occupied | Renter-occupied |
| 1 Room | 12 (0.1%) | 25 (1.6%) |
| 2 or 3 Rooms | 14 (0.1%) | 63 (3.9%) |
| 4 or 5 Rooms | 1,143 (9.4%) | 191 (11.9%) |
| 6 or 7 Rooms | 3,331 (27.4%) | 716 (44.6%) |
| 8 or more Rooms | 7,679 (63.0%) | 612 (38.1%) |
| Total | 12,179 (100.0%) | 1,607 (100.0%) |
Housing Structure by Heating Type in Burke
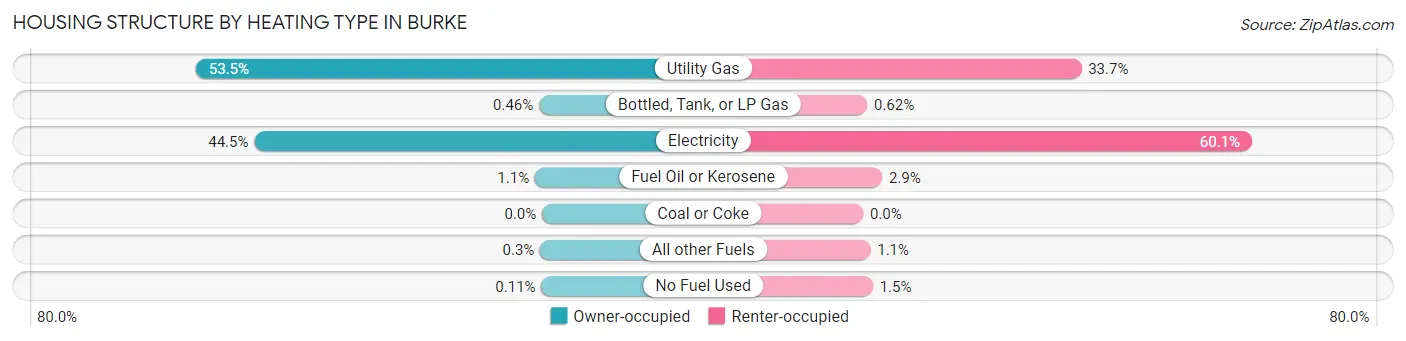
| Heating Type | Owner-occupied | Renter-occupied |
| Utility Gas | 6,520 (53.5%) | 542 (33.7%) |
| Bottled, Tank, or LP Gas | 56 (0.5%) | 10 (0.6%) |
| Electricity | 5,419 (44.5%) | 966 (60.1%) |
| Fuel Oil or Kerosene | 134 (1.1%) | 47 (2.9%) |
| Coal or Coke | 0 (0.0%) | 0 (0.0%) |
| All other Fuels | 37 (0.3%) | 18 (1.1%) |
| No Fuel Used | 13 (0.1%) | 24 (1.5%) |
| Total | 12,179 (100.0%) | 1,607 (100.0%) |
Household Vehicle Usage in Burke
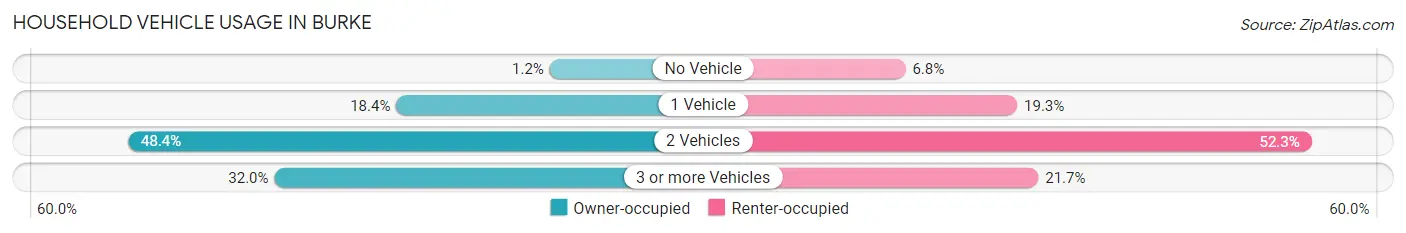
| Vehicles per Household | Owner-occupied | Renter-occupied |
| No Vehicle | 144 (1.2%) | 109 (6.8%) |
| 1 Vehicle | 2,237 (18.4%) | 310 (19.3%) |
| 2 Vehicles | 5,898 (48.4%) | 840 (52.3%) |
| 3 or more Vehicles | 3,900 (32.0%) | 348 (21.7%) |
| Total | 12,179 (100.0%) | 1,607 (100.0%) |
Real Estate & Mortgages in Burke
Real Estate and Mortgage Overview in Burke
| Characteristic | Without Mortgage | With Mortgage |
| Housing Units | 2,956 | 9,223 |
| Median Property Value | $677,900 | $638,800 |
| Median Household Income | $166,047 | $6,131 |
| Monthly Housing Costs | $967 | $4,634 |
| Real Estate Taxes | $7,120 | $139 |
Property Value by Mortgage Status in Burke
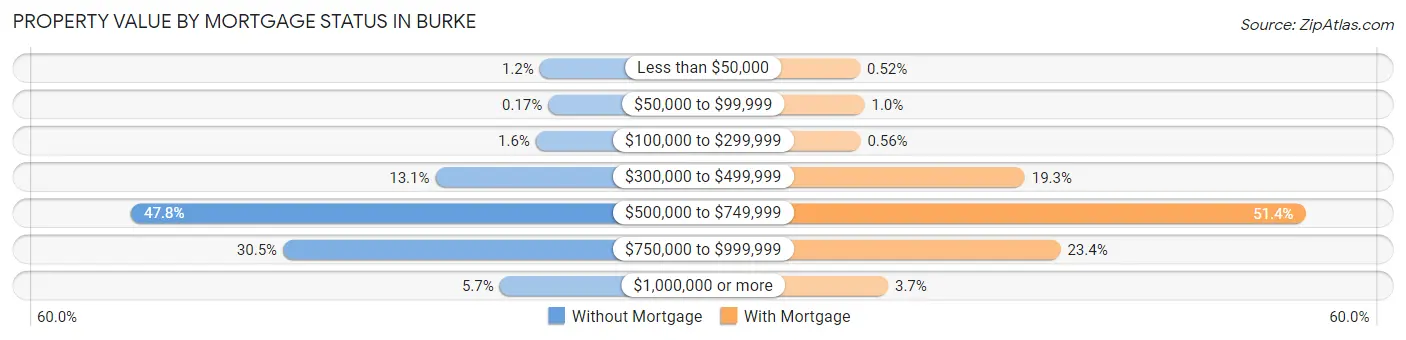
| Property Value | Without Mortgage | With Mortgage |
| Less than $50,000 | 34 (1.1%) | 48 (0.5%) |
| $50,000 to $99,999 | 5 (0.2%) | 95 (1.0%) |
| $100,000 to $299,999 | 47 (1.6%) | 52 (0.6%) |
| $300,000 to $499,999 | 386 (13.1%) | 1,784 (19.3%) |
| $500,000 to $749,999 | 1,414 (47.8%) | 4,742 (51.4%) |
| $750,000 to $999,999 | 901 (30.5%) | 2,160 (23.4%) |
| $1,000,000 or more | 169 (5.7%) | 342 (3.7%) |
| Total | 2,956 (100.0%) | 9,223 (100.0%) |
Household Income by Mortgage Status in Burke

| Household Income | Without Mortgage | With Mortgage |
| Less than $10,000 | 45 (1.5%) | 116 (1.3%) |
| $10,000 to $24,999 | 51 (1.7%) | 46 (0.5%) |
| $25,000 to $34,999 | 119 (4.0%) | 106 (1.1%) |
| $35,000 to $49,999 | 115 (3.9%) | 98 (1.1%) |
| $50,000 to $74,999 | 189 (6.4%) | 192 (2.1%) |
| $75,000 to $99,999 | 283 (9.6%) | 402 (4.4%) |
| $100,000 to $149,999 | 592 (20.0%) | 672 (7.3%) |
| $150,000 or more | 1,562 (52.8%) | 1,576 (17.1%) |
| Total | 2,956 (100.0%) | 9,223 (100.0%) |
Property Value to Household Income Ratio in Burke

| Value-to-Income Ratio | Without Mortgage | With Mortgage |
| Less than 2.0x | 299 (10.1%) | 185,018 (2,006.1%) |
| 2.0x to 2.9x | 584 (19.8%) | 1,002 (10.9%) |
| 3.0x to 3.9x | 438 (14.8%) | 2,440 (26.5%) |
| 4.0x or more | 1,618 (54.7%) | 2,445 (26.5%) |
| Total | 2,956 (100.0%) | 9,223 (100.0%) |
Real Estate Taxes by Mortgage Status in Burke
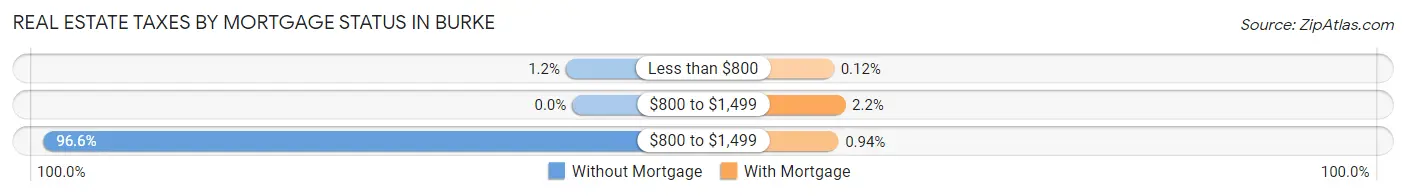
| Property Taxes | Without Mortgage | With Mortgage |
| Less than $800 | 34 (1.1%) | 11 (0.1%) |
| $800 to $1,499 | 0 (0.0%) | 203 (2.2%) |
| $800 to $1,499 | 2,855 (96.6%) | 87 (0.9%) |
| Total | 2,956 (100.0%) | 9,223 (100.0%) |
Health & Disability in Burke
Health Insurance Coverage by Age in Burke
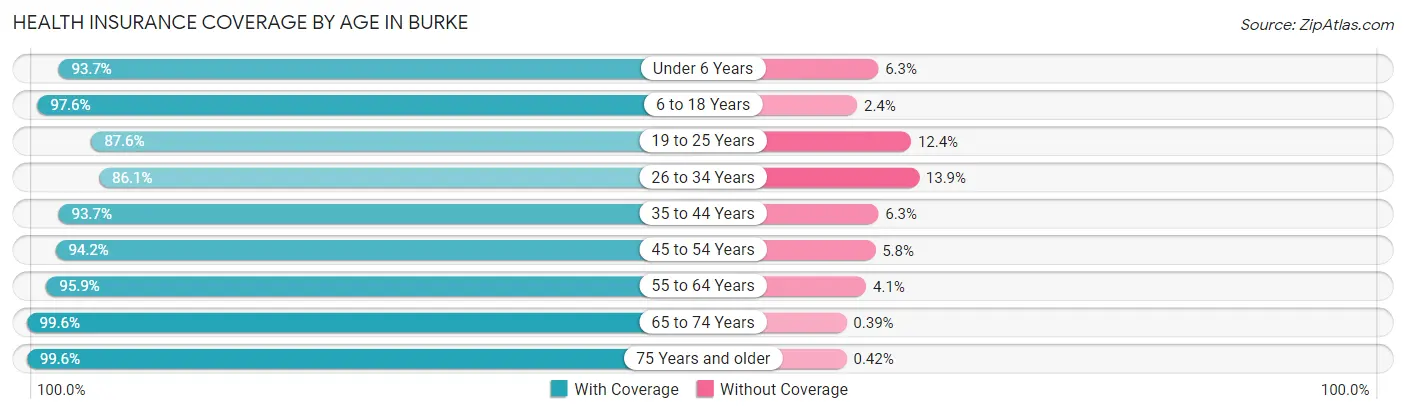
| Age Bracket | With Coverage | Without Coverage |
| Under 6 Years | 3,186 (93.7%) | 215 (6.3%) |
| 6 to 18 Years | 8,556 (97.6%) | 209 (2.4%) |
| 19 to 25 Years | 2,706 (87.6%) | 384 (12.4%) |
| 26 to 34 Years | 3,121 (86.1%) | 504 (13.9%) |
| 35 to 44 Years | 5,750 (93.7%) | 389 (6.3%) |
| 45 to 54 Years | 5,598 (94.2%) | 342 (5.8%) |
| 55 to 64 Years | 5,350 (95.9%) | 227 (4.1%) |
| 65 to 74 Years | 4,340 (99.6%) | 17 (0.4%) |
| 75 Years and older | 2,637 (99.6%) | 11 (0.4%) |
| Total | 41,244 (94.7%) | 2,298 (5.3%) |
Health Insurance Coverage by Citizenship Status in Burke
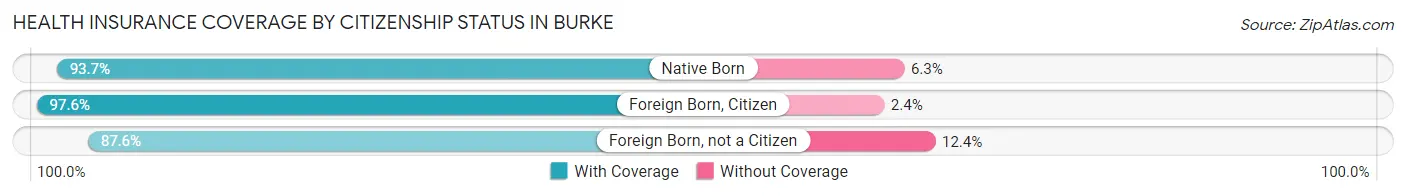
| Citizenship Status | With Coverage | Without Coverage |
| Native Born | 3,186 (93.7%) | 215 (6.3%) |
| Foreign Born, Citizen | 8,556 (97.6%) | 209 (2.4%) |
| Foreign Born, not a Citizen | 2,706 (87.6%) | 384 (12.4%) |
Health Insurance Coverage by Household Income in Burke
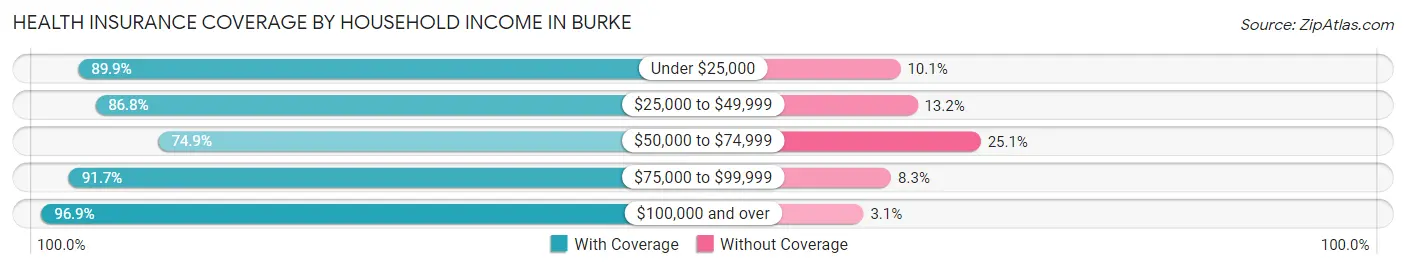
| Household Income | With Coverage | Without Coverage |
| Under $25,000 | 483 (89.9%) | 54 (10.1%) |
| $25,000 to $49,999 | 1,894 (86.8%) | 289 (13.2%) |
| $50,000 to $74,999 | 1,681 (74.9%) | 563 (25.1%) |
| $75,000 to $99,999 | 3,232 (91.7%) | 293 (8.3%) |
| $100,000 and over | 33,943 (96.9%) | 1,097 (3.1%) |
Public vs Private Health Insurance Coverage by Age in Burke
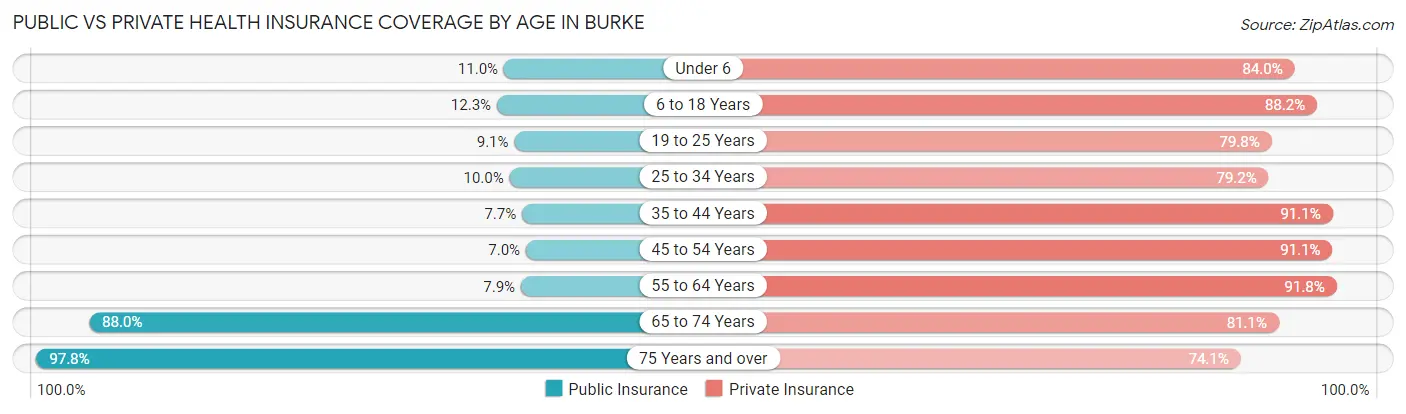
| Age Bracket | Public Insurance | Private Insurance |
| Under 6 | 375 (11.0%) | 2,858 (84.0%) |
| 6 to 18 Years | 1,081 (12.3%) | 7,731 (88.2%) |
| 19 to 25 Years | 281 (9.1%) | 2,465 (79.8%) |
| 25 to 34 Years | 362 (10.0%) | 2,871 (79.2%) |
| 35 to 44 Years | 471 (7.7%) | 5,591 (91.1%) |
| 45 to 54 Years | 413 (7.0%) | 5,409 (91.1%) |
| 55 to 64 Years | 439 (7.9%) | 5,122 (91.8%) |
| 65 to 74 Years | 3,835 (88.0%) | 3,534 (81.1%) |
| 75 Years and over | 2,590 (97.8%) | 1,961 (74.1%) |
| Total | 9,847 (22.6%) | 37,542 (86.2%) |
Disability Status by Sex by Age in Burke
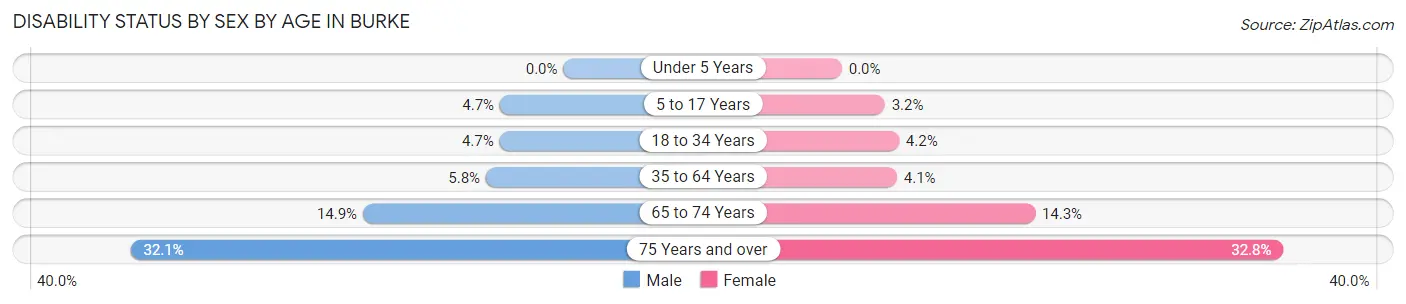
| Age Bracket | Male | Female |
| Under 5 Years | 0 (0.0%) | 0 (0.0%) |
| 5 to 17 Years | 229 (4.7%) | 130 (3.2%) |
| 18 to 34 Years | 171 (4.7%) | 153 (4.2%) |
| 35 to 64 Years | 497 (5.8%) | 368 (4.1%) |
| 65 to 74 Years | 309 (14.9%) | 327 (14.3%) |
| 75 Years and over | 403 (32.1%) | 457 (32.8%) |
Disability Class by Sex by Age in Burke
Disability Class: Hearing Difficulty
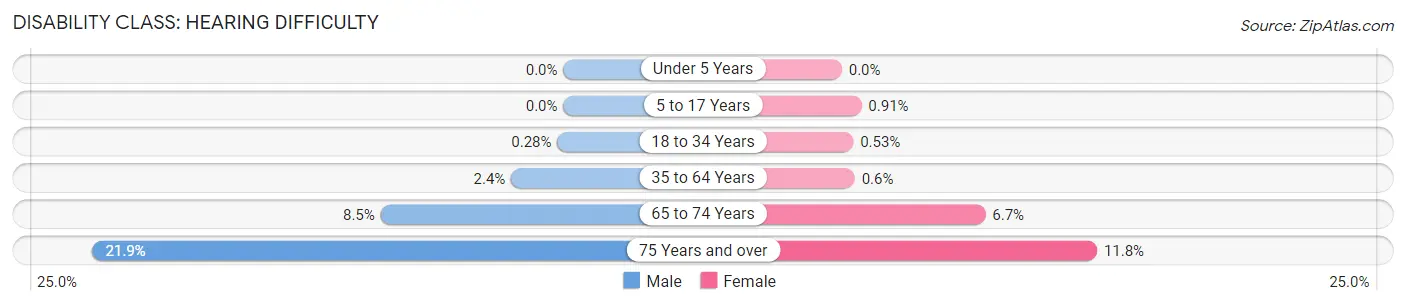
| Age Bracket | Male | Female |
| Under 5 Years | 0 (0.0%) | 0 (0.0%) |
| 5 to 17 Years | 0 (0.0%) | 37 (0.9%) |
| 18 to 34 Years | 10 (0.3%) | 19 (0.5%) |
| 35 to 64 Years | 209 (2.4%) | 54 (0.6%) |
| 65 to 74 Years | 176 (8.5%) | 152 (6.7%) |
| 75 Years and over | 274 (21.8%) | 165 (11.8%) |
Disability Class: Vision Difficulty

| Age Bracket | Male | Female |
| Under 5 Years | 0 (0.0%) | 0 (0.0%) |
| 5 to 17 Years | 38 (0.8%) | 36 (0.9%) |
| 18 to 34 Years | 10 (0.3%) | 10 (0.3%) |
| 35 to 64 Years | 14 (0.2%) | 34 (0.4%) |
| 65 to 74 Years | 26 (1.3%) | 69 (3.0%) |
| 75 Years and over | 67 (5.3%) | 97 (7.0%) |
Disability Class: Cognitive Difficulty
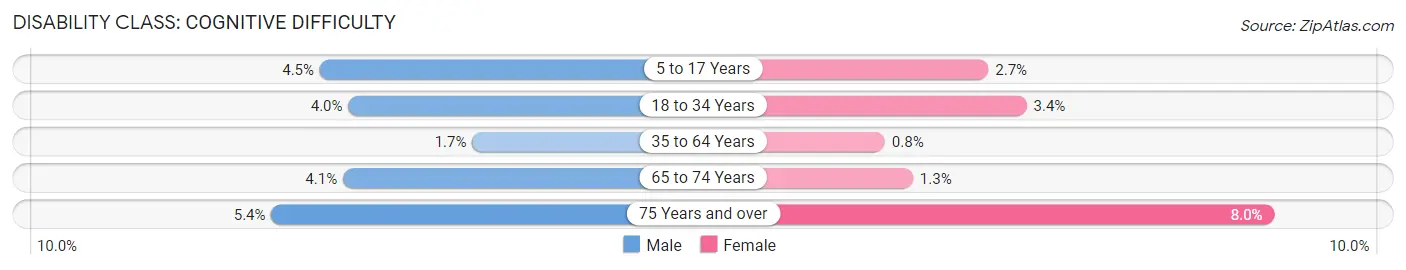
| Age Bracket | Male | Female |
| 5 to 17 Years | 220 (4.5%) | 111 (2.7%) |
| 18 to 34 Years | 144 (4.0%) | 124 (3.4%) |
| 35 to 64 Years | 146 (1.7%) | 72 (0.8%) |
| 65 to 74 Years | 85 (4.1%) | 30 (1.3%) |
| 75 Years and over | 68 (5.4%) | 112 (8.0%) |
Disability Class: Ambulatory Difficulty
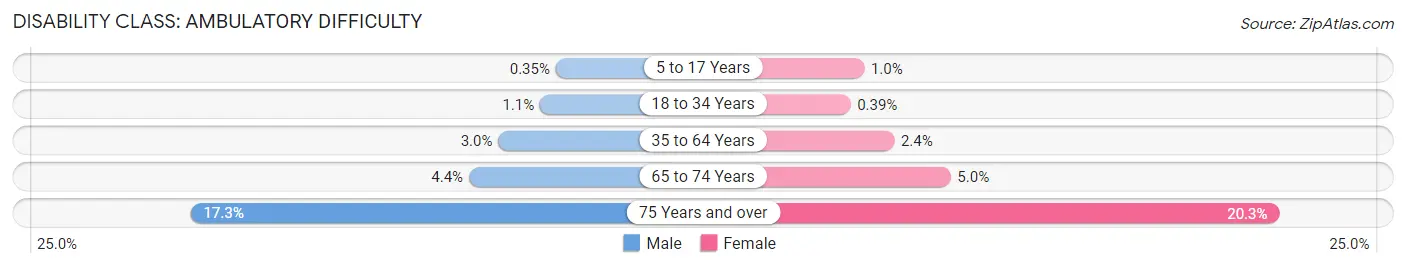
| Age Bracket | Male | Female |
| 5 to 17 Years | 17 (0.4%) | 42 (1.0%) |
| 18 to 34 Years | 39 (1.1%) | 14 (0.4%) |
| 35 to 64 Years | 261 (3.0%) | 218 (2.4%) |
| 65 to 74 Years | 91 (4.4%) | 115 (5.0%) |
| 75 Years and over | 217 (17.3%) | 283 (20.3%) |
Disability Class: Self-Care Difficulty
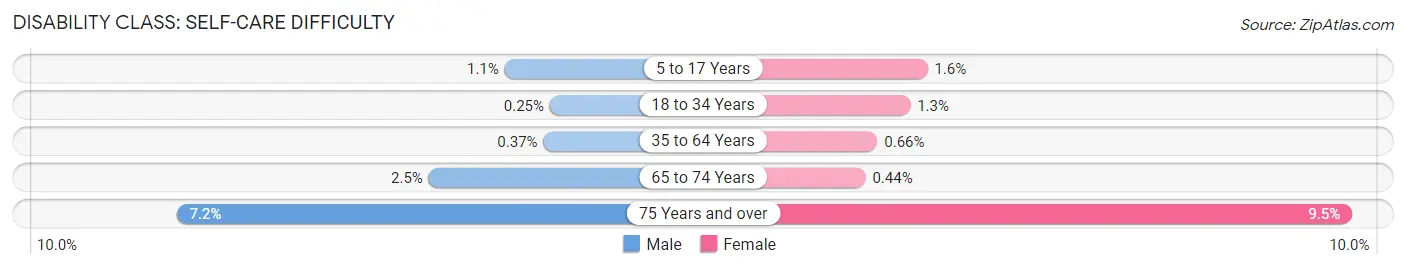
| Age Bracket | Male | Female |
| 5 to 17 Years | 53 (1.1%) | 65 (1.6%) |
| 18 to 34 Years | 9 (0.3%) | 46 (1.3%) |
| 35 to 64 Years | 32 (0.4%) | 59 (0.7%) |
| 65 to 74 Years | 52 (2.5%) | 10 (0.4%) |
| 75 Years and over | 90 (7.2%) | 132 (9.5%) |
Technology Access in Burke
Computing Device Access in Burke
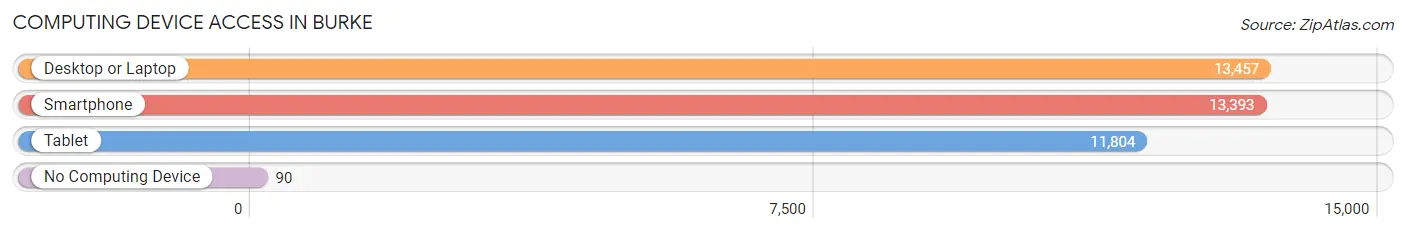
| Device Type | # Households | % Households |
| Desktop or Laptop | 13,457 | 97.6% |
| Smartphone | 13,393 | 97.2% |
| Tablet | 11,804 | 85.6% |
| No Computing Device | 90 | 0.6% |
| Total | 13,786 | 100.0% |
Internet Access in Burke
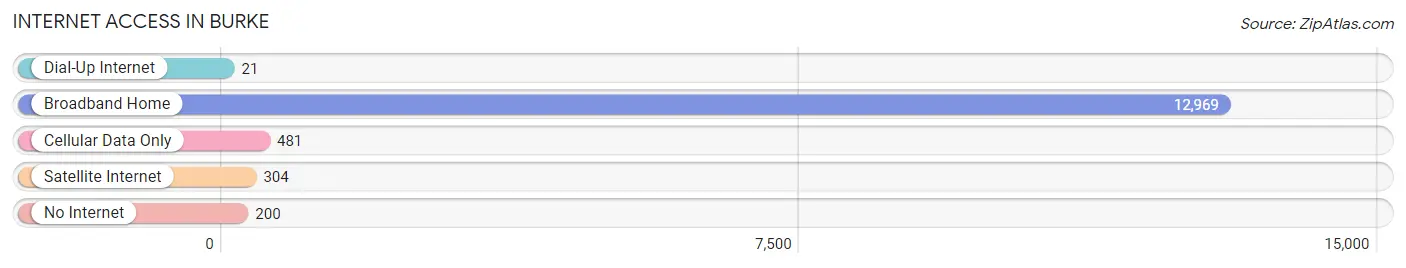
| Internet Type | # Households | % Households |
| Dial-Up Internet | 21 | 0.2% |
| Broadband Home | 12,969 | 94.1% |
| Cellular Data Only | 481 | 3.5% |
| Satellite Internet | 304 | 2.2% |
| No Internet | 200 | 1.5% |
| Total | 13,786 | 100.0% |
Burke Summary
Burke, Virginia is a census-designated place (CDP) located in Fairfax County, Virginia. It is a suburb of Washington, D.C., located approximately 15 miles southwest of the nation’s capital. The population of Burke was 57,737 as of the 2010 census.
History
The area now known as Burke was originally inhabited by Native Americans, including the Doeg and Piscataway tribes. The first European settlers arrived in the area in the late 17th century. The area was part of the 10,000-acre tract of land granted to Colonel William Fairfax in 1745. The area was known as the “Burke’s Station” in the late 18th century, and was named after Silas Burke, a local landowner.
In the early 19th century, the area was part of the Fairfax County plantation economy. The area was home to several large plantations, including the “Burke’s Station” plantation, which was owned by Silas Burke. The area was also home to several small farms and businesses.
In the late 19th century, the area began to develop as a suburb of Washington, D.C. The Washington and Old Dominion Railroad was built through the area in 1873, and the area began to attract more residents. The area was officially incorporated as the Town of Burke in 1902.
Geography
Burke is located in Fairfax County, Virginia, approximately 15 miles southwest of Washington, D.C. The CDP has a total area of 8.3 square miles, all of which is land. Burke is bordered by Fairfax Station to the north, Fairfax City to the east, Clifton to the south, and Springfield to the west.
The terrain of Burke is mostly flat, with some rolling hills. The area is part of the Piedmont Plateau, and is located in the Atlantic Coastal Plain. The area is drained by Accotink Creek, which flows through the center of the CDP.
Economy
The economy of Burke is largely based on the service industry. The largest employers in the area are the Fairfax County Public Schools, the Fairfax County Government, and the George Mason University. Other major employers include the Inova Health System, the U.S. Department of Defense, and the U.S. Department of Homeland Security.
The area is also home to several large retail centers, including the Burke Centre Shopping Center, the Burke Town Centre, and the Burke Village Centre. The area is also home to several corporate offices, including the headquarters of the National Rural Electric Cooperative Association.
Demographics
As of the 2010 census, the population of Burke was 57,737. The racial makeup of the CDP was 68.3% White, 16.2% Asian, 8.2% African American, and 5.3% Hispanic or Latino. The median household income was $107,817, and the median family income was $118,837.
The largest age group in Burke was 25-44, which made up 33.2% of the population. The median age was 40.2 years. The population was spread out, with 24.2% under the age of 18, 8.2% from 18 to 24, 33.2% from 25 to 44, 25.2% from 45 to 64, and 9.2% who were 65 years of age or older.
Conclusion
Burke, Virginia is a census-designated place located in Fairfax County, Virginia. It is a suburb of Washington, D.C., located approximately 15 miles southwest of the nation’s capital. The area was originally inhabited by Native Americans, and was part of the Fairfax County plantation economy in the early 19th century. In the late 19th century, the area began to develop as a suburb of Washington, D.C. The population of Burke was 57,737 as of the 2010 census. The economy of Burke is largely based on the service industry, and the largest employers in the area are the Fairfax County Public Schools, the Fairfax County Government, and the George Mason University. The racial makeup of the CDP was 68.3% White, 16.2% Asian, 8.2% African American, and 5.3% Hispanic or Latino. The median household income was $107,817, and the median family income was $118,837.
Common Questions
What is Per Capita Income in Burke?
Per Capita income in Burke is $60,981.
What is the Median Family Income in Burke?
Median Family Income in Burke is $176,970.
What is the Median Household income in Burke?
Median Household Income in Burke is $172,432.
What is Income or Wage Gap in Burke?
Income or Wage Gap in Burke is 39.1%.
Women in Burke earn 60.9 cents for every dollar earned by a man.
What is Inequality or Gini Index in Burke?
Inequality or Gini Index in Burke is 0.33.
What is the Total Population of Burke?
Total Population of Burke is 44,228.
What is the Total Male Population of Burke?
Total Male Population of Burke is 22,489.
What is the Total Female Population of Burke?
Total Female Population of Burke is 21,739.
What is the Ratio of Males per 100 Females in Burke?
There are 103.45 Males per 100 Females in Burke.
What is the Ratio of Females per 100 Males in Burke?
There are 96.67 Females per 100 Males in Burke.
What is the Median Population Age in Burke?
Median Population Age in Burke is 39.6 Years.
What is the Average Family Size in Burke
Average Family Size in Burke is 3.4 People.
What is the Average Household Size in Burke
Average Household Size in Burke is 3.2 People.
How Large is the Labor Force in Burke?
There are 23,733 People in the Labor Forcein in Burke.
What is the Percentage of People in the Labor Force in Burke?
70.2% of People are in the Labor Force in Burke.
What is the Unemployment Rate in Burke?
Unemployment Rate in Burke is 6.3%.