Shenandoah Farms, VA Map & Demographics
Shenandoah Farms Map
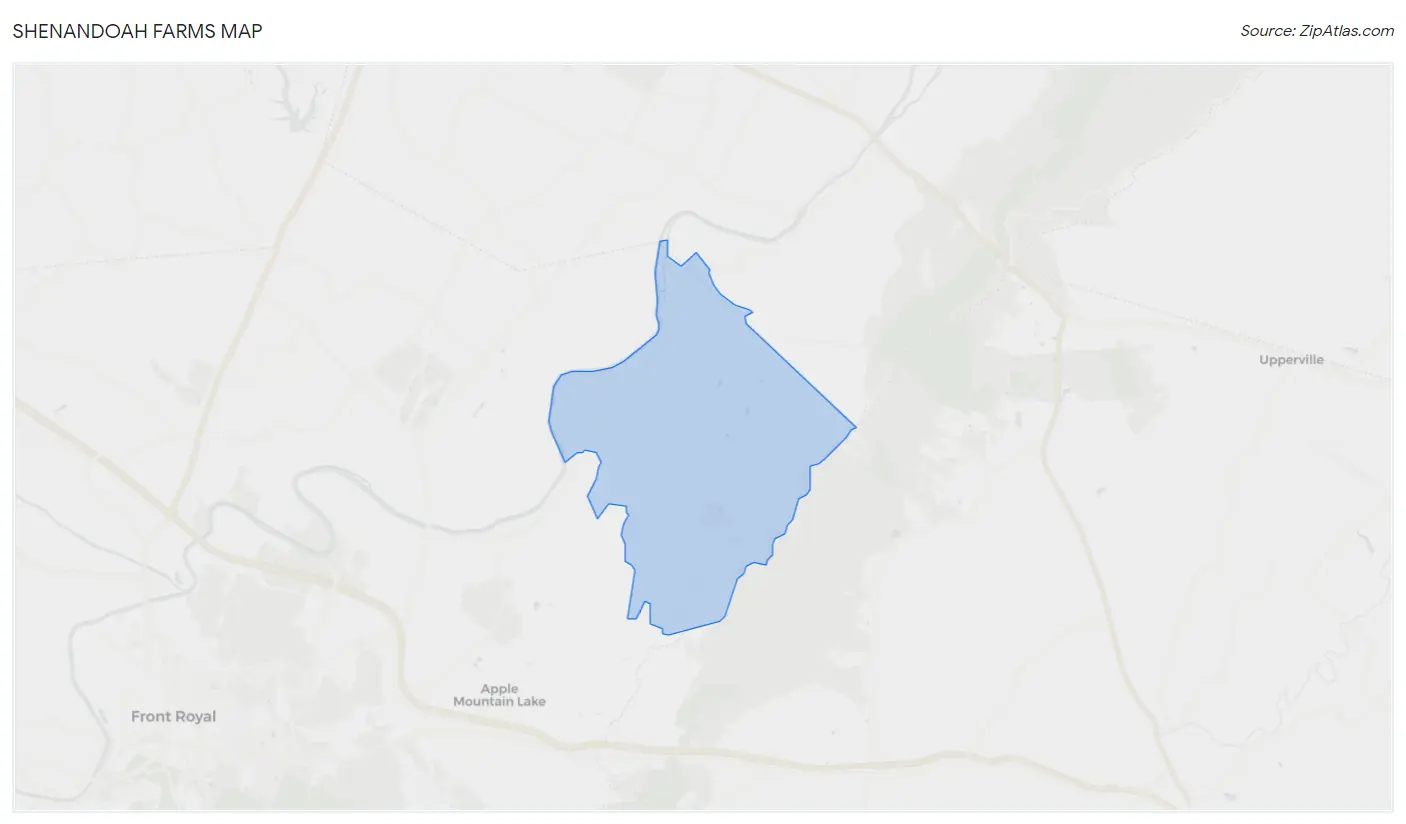
Shenandoah Farms Overview
$36,703
PER CAPITA INCOME
$64,205
AVG FAMILY INCOME
$81,071
AVG HOUSEHOLD INCOME
44.7%
WAGE / INCOME GAP [ % ]
55.3¢/ $1
WAGE / INCOME GAP [ $ ]
0.45
INEQUALITY / GINI INDEX
3,926
TOTAL POPULATION
2,220
MALE POPULATION
1,706
FEMALE POPULATION
130.13
MALES / 100 FEMALES
76.85
FEMALES / 100 MALES
35.5
MEDIAN AGE
3.1
AVG FAMILY SIZE
2.7
AVG HOUSEHOLD SIZE
1,646
LABOR FORCE [ PEOPLE ]
56.1%
PERCENT IN LABOR FORCE
6.4%
UNEMPLOYMENT RATE
Income in Shenandoah Farms
Income Overview in Shenandoah Farms
Per Capita Income in Shenandoah Farms is $36,703, while median incomes of families and households are $64,205 and $81,071 respectively.
| Characteristic | Number | Measure |
| Per Capita Income | 3,926 | $36,703 |
| Median Family Income | 1,081 | $64,205 |
| Mean Family Income | 1,081 | $91,039 |
| Median Household Income | 1,470 | $81,071 |
| Mean Household Income | 1,470 | $94,626 |
| Income Deficit | 1,081 | $0 |
| Wage / Income Gap (%) | 3,926 | 44.66% |
| Wage / Income Gap ($) | 3,926 | 55.34¢ per $1 |
| Gini / Inequality Index | 3,926 | 0.45 |
Earnings by Sex in Shenandoah Farms
Average Earnings in Shenandoah Farms are $42,237, $59,107 for men and $32,708 for women, a difference of 44.7%.
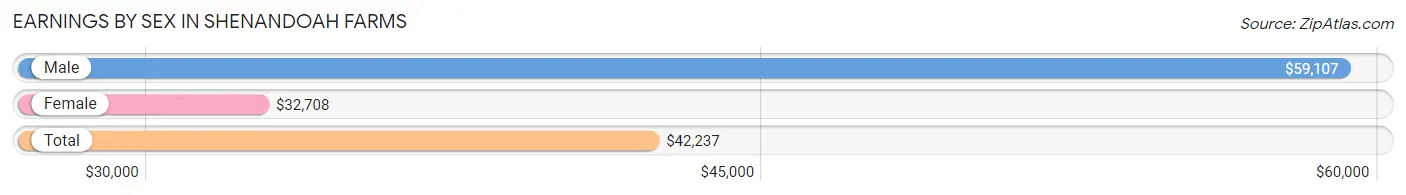
| Sex | Number | Average Earnings |
| Male | 1,088 (55.6%) | $59,107 |
| Female | 870 (44.4%) | $32,708 |
| Total | 1,958 (100.0%) | $42,237 |
Earnings by Sex by Income Bracket in Shenandoah Farms
The most common earnings brackets in Shenandoah Farms are $100,000+ for men (297 | 27.3%) and $2,499 or less for women (155 | 17.8%).
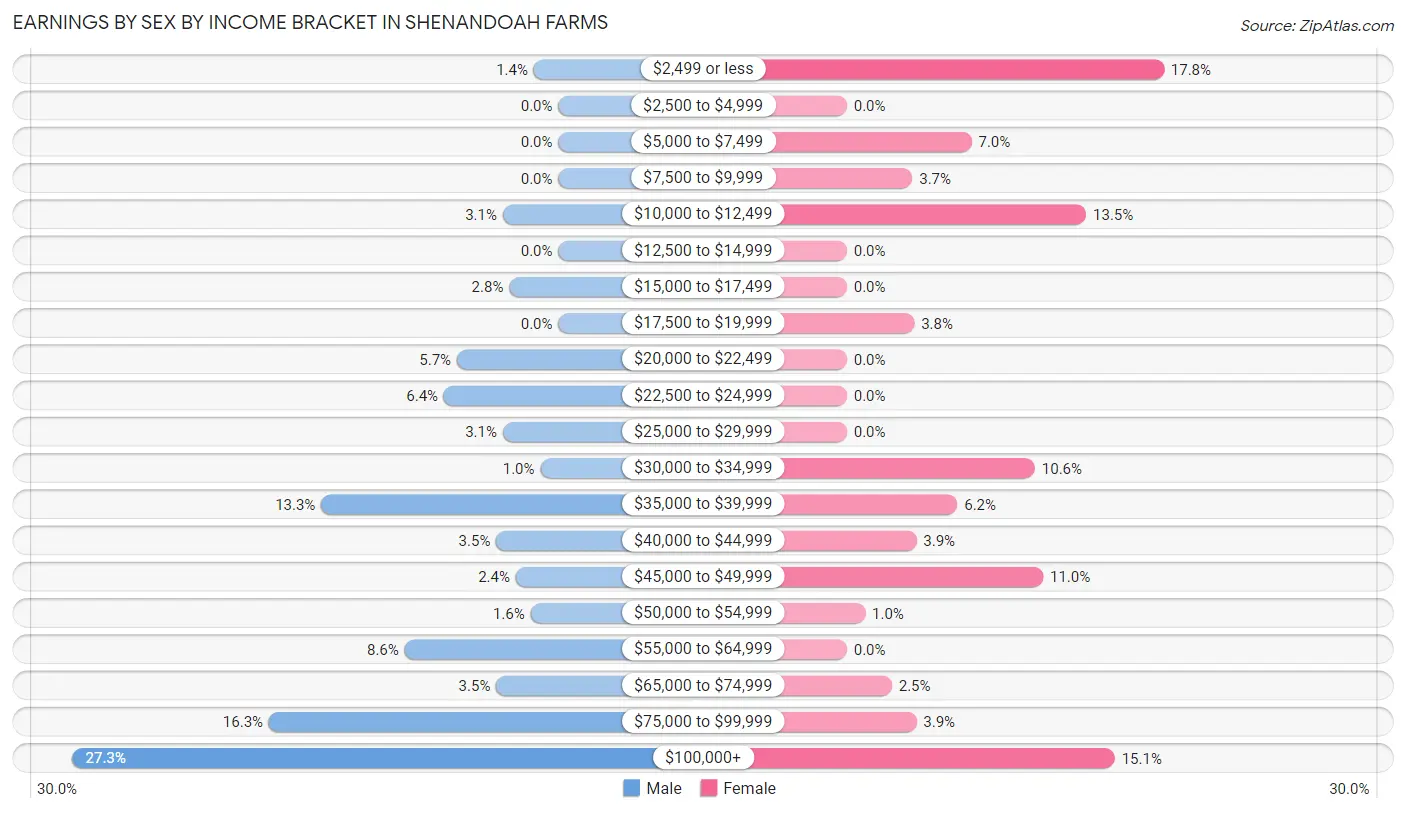
| Income | Male | Female |
| $2,499 or less | 15 (1.4%) | 155 (17.8%) |
| $2,500 to $4,999 | 0 (0.0%) | 0 (0.0%) |
| $5,000 to $7,499 | 0 (0.0%) | 61 (7.0%) |
| $7,500 to $9,999 | 0 (0.0%) | 32 (3.7%) |
| $10,000 to $12,499 | 34 (3.1%) | 117 (13.5%) |
| $12,500 to $14,999 | 0 (0.0%) | 0 (0.0%) |
| $15,000 to $17,499 | 30 (2.8%) | 0 (0.0%) |
| $17,500 to $19,999 | 0 (0.0%) | 33 (3.8%) |
| $20,000 to $22,499 | 62 (5.7%) | 0 (0.0%) |
| $22,500 to $24,999 | 70 (6.4%) | 0 (0.0%) |
| $25,000 to $29,999 | 34 (3.1%) | 0 (0.0%) |
| $30,000 to $34,999 | 11 (1.0%) | 92 (10.6%) |
| $35,000 to $39,999 | 145 (13.3%) | 54 (6.2%) |
| $40,000 to $44,999 | 38 (3.5%) | 34 (3.9%) |
| $45,000 to $49,999 | 26 (2.4%) | 96 (11.0%) |
| $50,000 to $54,999 | 17 (1.6%) | 9 (1.0%) |
| $55,000 to $64,999 | 94 (8.6%) | 0 (0.0%) |
| $65,000 to $74,999 | 38 (3.5%) | 22 (2.5%) |
| $75,000 to $99,999 | 177 (16.3%) | 34 (3.9%) |
| $100,000+ | 297 (27.3%) | 131 (15.1%) |
| Total | 1,088 (100.0%) | 870 (100.0%) |
Earnings by Sex by Educational Attainment in Shenandoah Farms
Average earnings in Shenandoah Farms are $79,550 for men and $38,218 for women, a difference of 52.0%. Men with an educational attainment of bachelor's degree enjoy the highest average annual earnings of $99,167, while those with high school diploma education earn the least with $56,810. Women with an educational attainment of bachelor's degree earn the most with the average annual earnings of $81,719, while those with high school diploma education have the smallest earnings of $2,499.
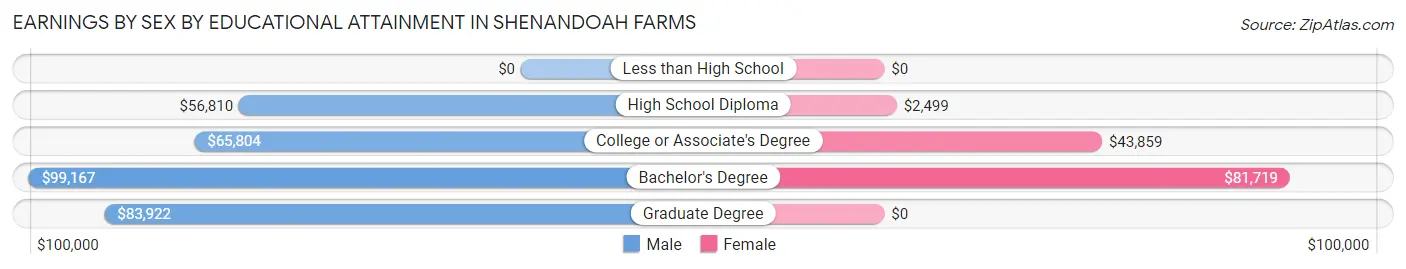
| Educational Attainment | Male Income | Female Income |
| Less than High School | - | - |
| High School Diploma | $56,810 | $2,499 |
| College or Associate's Degree | $65,804 | $43,859 |
| Bachelor's Degree | $99,167 | $81,719 |
| Graduate Degree | $83,922 | $0 |
| Total | $79,550 | $38,218 |
Family Income in Shenandoah Farms
Family Income Brackets in Shenandoah Farms
According to the Shenandoah Farms family income data, there are 197 families falling into the less than $10,000 income range, which is the most common income bracket and makes up 18.2% of all families. Conversely, the $25,000 to $34,999 income bracket is the least frequent group with only 16 families (1.5%) belonging to this category.
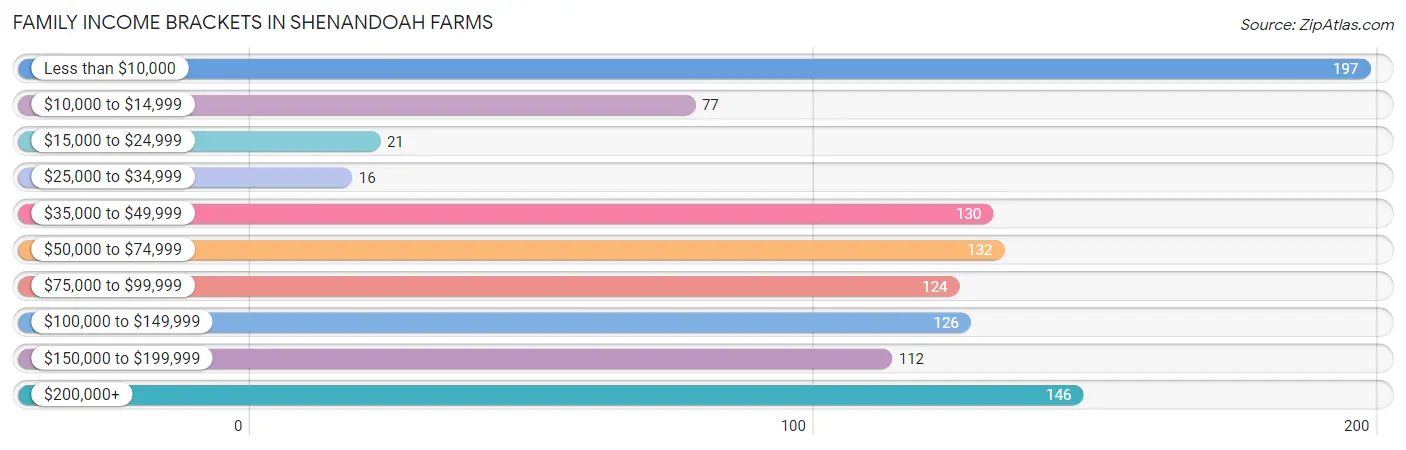
| Income Bracket | # Families | % Families |
| Less than $10,000 | 197 | 18.2% |
| $10,000 to $14,999 | 77 | 7.1% |
| $15,000 to $24,999 | 21 | 1.9% |
| $25,000 to $34,999 | 16 | 1.5% |
| $35,000 to $49,999 | 130 | 12.0% |
| $50,000 to $74,999 | 132 | 12.2% |
| $75,000 to $99,999 | 124 | 11.5% |
| $100,000 to $149,999 | 126 | 11.7% |
| $150,000 to $199,999 | 112 | 10.4% |
| $200,000+ | 146 | 13.5% |
Family Income by Famaliy Size in Shenandoah Farms
2-person families (434 | 40.2%) account for the highest median family income in Shenandoah Farms with $122,561 per family, while 2-person families (434 | 40.2%) have the highest median income of $61,280 per family member.
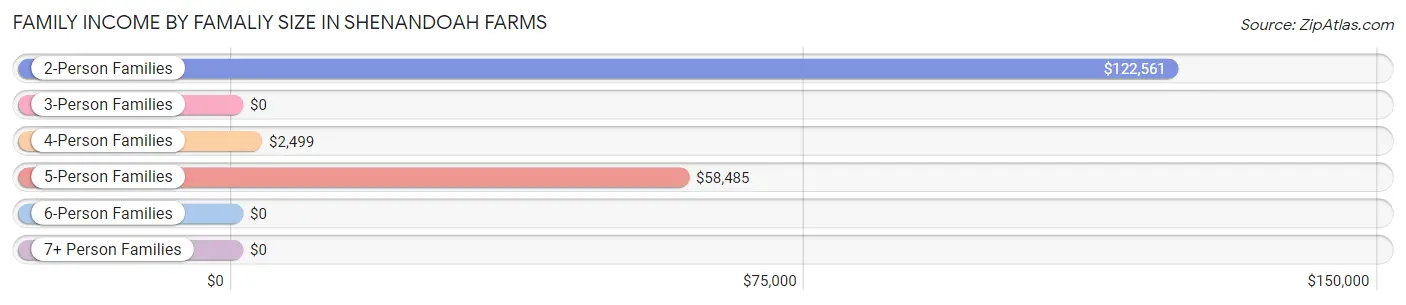
| Income Bracket | # Families | Median Income |
| 2-Person Families | 434 (40.2%) | $122,561 |
| 3-Person Families | 177 (16.4%) | $0 |
| 4-Person Families | 302 (27.9%) | $2,499 |
| 5-Person Families | 136 (12.6%) | $58,485 |
| 6-Person Families | 32 (3.0%) | $0 |
| 7+ Person Families | 0 (0.0%) | $0 |
| Total | 1,081 (100.0%) | $64,205 |
Family Income by Number of Earners in Shenandoah Farms
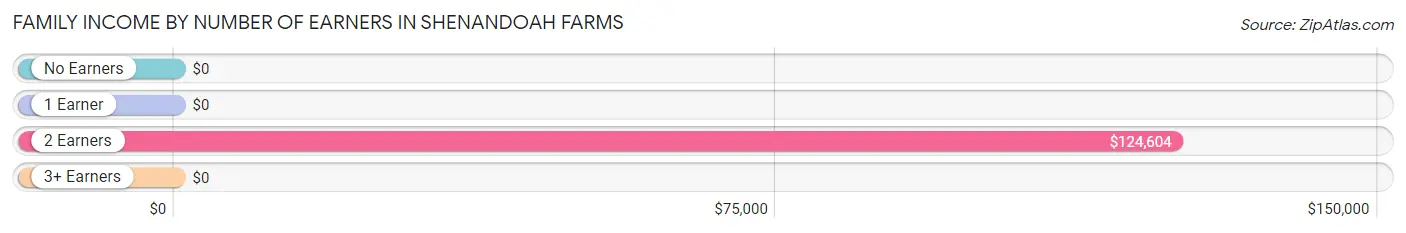
| Number of Earners | # Families | Median Income |
| No Earners | 66 (6.1%) | $0 |
| 1 Earner | 570 (52.7%) | $0 |
| 2 Earners | 381 (35.2%) | $124,604 |
| 3+ Earners | 64 (5.9%) | $0 |
| Total | 1,081 (100.0%) | $64,205 |
Household Income in Shenandoah Farms
Household Income Brackets in Shenandoah Farms
With 248 households falling in the category, the $35,000 to $49,999 income range is the most frequent in Shenandoah Farms, accounting for 16.9% of all households.
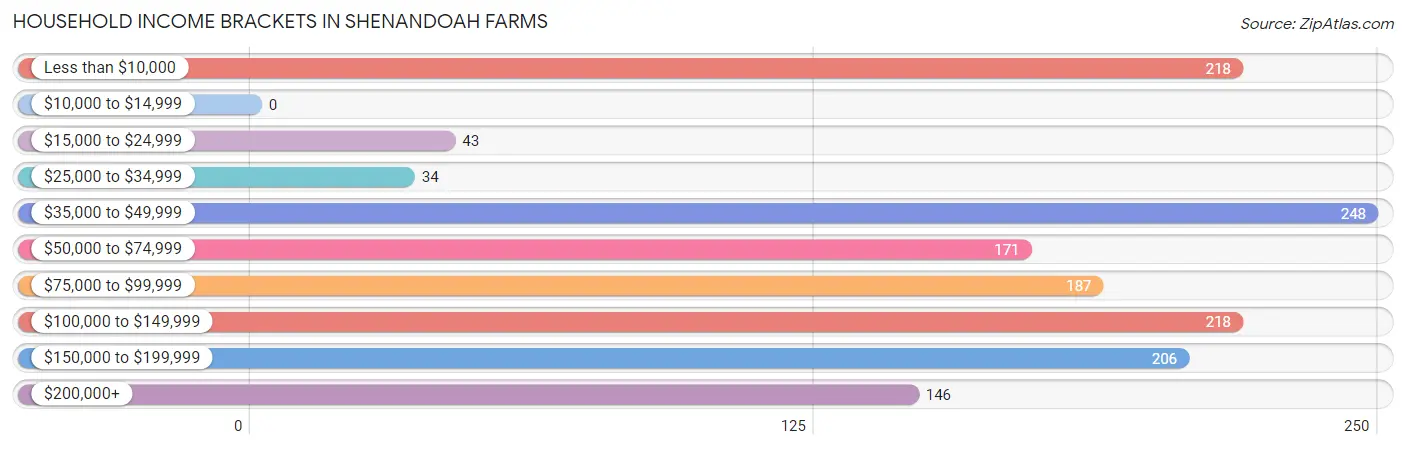
| Income Bracket | # Households | % Households |
| Less than $10,000 | 218 | 14.8% |
| $10,000 to $14,999 | 0 | 0.0% |
| $15,000 to $24,999 | 43 | 2.9% |
| $25,000 to $34,999 | 34 | 2.3% |
| $35,000 to $49,999 | 248 | 16.9% |
| $50,000 to $74,999 | 171 | 11.6% |
| $75,000 to $99,999 | 187 | 12.7% |
| $100,000 to $149,999 | 218 | 14.8% |
| $150,000 to $199,999 | 206 | 14.0% |
| $200,000+ | 146 | 9.9% |
Household Income by Householder Age in Shenandoah Farms
The median household income in Shenandoah Farms is $81,071, with the highest median household income of $108,750 found in the 45 to 64 years age bracket for the primary householder. A total of 549 households (37.3%) fall into this category. Meanwhile, the 15 to 24 years age bracket for the primary householder has the lowest median household income of $0, with 124 households (8.4%) in this group.
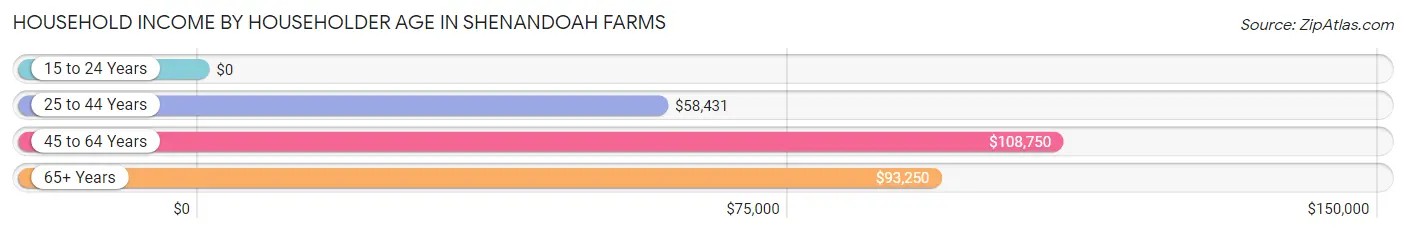
| Income Bracket | # Households | Median Income |
| 15 to 24 Years | 124 (8.4%) | $0 |
| 25 to 44 Years | 565 (38.4%) | $58,431 |
| 45 to 64 Years | 549 (37.3%) | $108,750 |
| 65+ Years | 232 (15.8%) | $93,250 |
| Total | 1,470 (100.0%) | $81,071 |
Poverty in Shenandoah Farms
Income Below Poverty by Sex and Age in Shenandoah Farms
With 21.4% poverty level for males and 22.2% for females among the residents of Shenandoah Farms, 35 to 44 year old males and 15 year old females are the most vulnerable to poverty, with 197 males (47.6%) and 90 females (86.5%) in their respective age groups living below the poverty level.
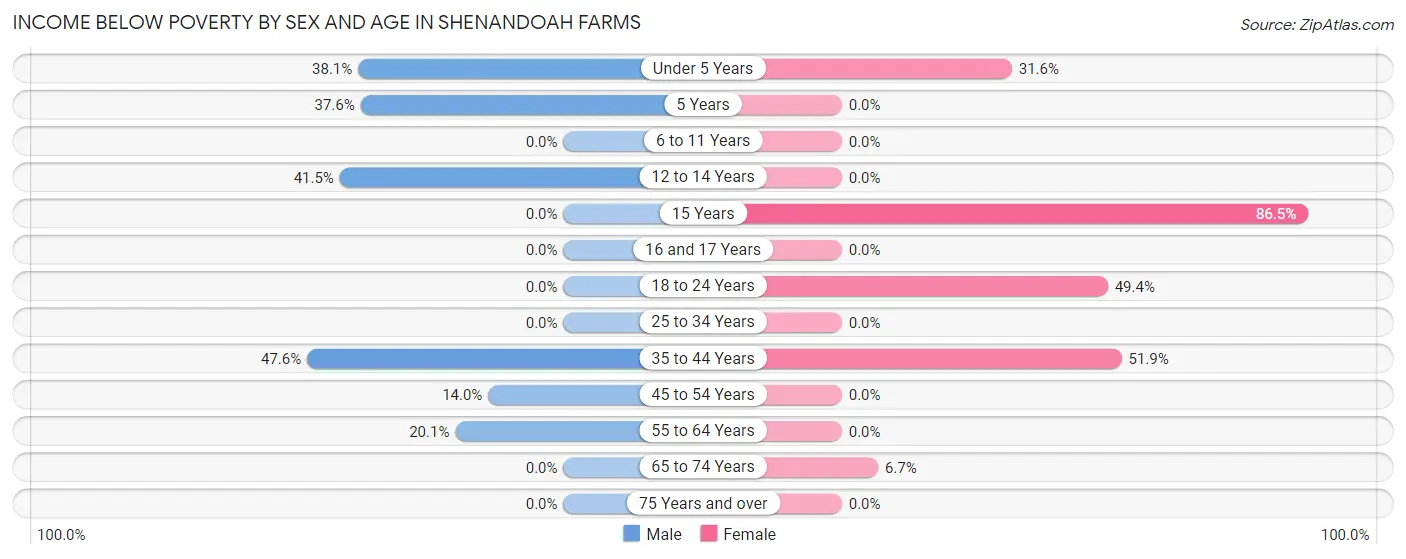
| Age Bracket | Male | Female |
| Under 5 Years | 56 (38.1%) | 53 (31.6%) |
| 5 Years | 99 (37.6%) | 0 (0.0%) |
| 6 to 11 Years | 0 (0.0%) | 0 (0.0%) |
| 12 to 14 Years | 22 (41.5%) | 0 (0.0%) |
| 15 Years | 0 (0.0%) | 90 (86.5%) |
| 16 and 17 Years | 0 (0.0%) | 0 (0.0%) |
| 18 to 24 Years | 0 (0.0%) | 77 (49.4%) |
| 25 to 34 Years | 0 (0.0%) | 0 (0.0%) |
| 35 to 44 Years | 197 (47.6%) | 148 (51.9%) |
| 45 to 54 Years | 41 (14.0%) | 0 (0.0%) |
| 55 to 64 Years | 60 (20.1%) | 0 (0.0%) |
| 65 to 74 Years | 0 (0.0%) | 10 (6.7%) |
| 75 Years and over | 0 (0.0%) | 0 (0.0%) |
| Total | 475 (21.4%) | 378 (22.2%) |
Income Above Poverty by Sex and Age in Shenandoah Farms
According to the poverty statistics in Shenandoah Farms, males aged 6 to 11 years and females aged 6 to 11 years are the age groups that are most secure financially, with 100.0% of males and 100.0% of females in these age groups living above the poverty line.
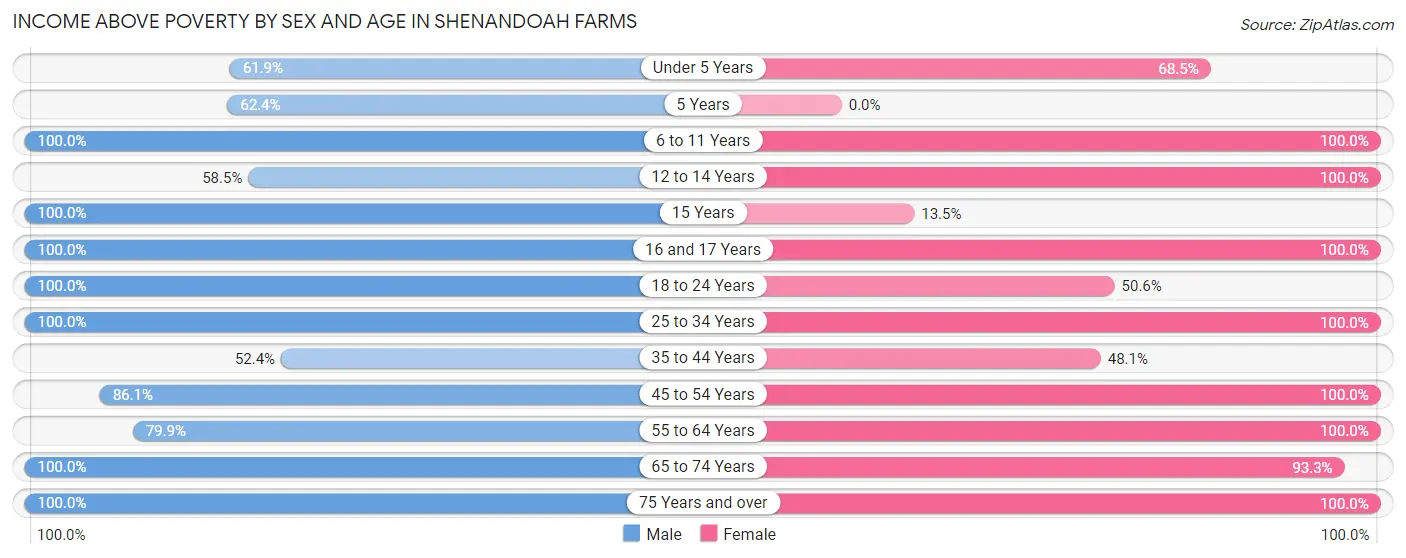
| Age Bracket | Male | Female |
| Under 5 Years | 91 (61.9%) | 115 (68.4%) |
| 5 Years | 164 (62.4%) | 0 (0.0%) |
| 6 to 11 Years | 62 (100.0%) | 60 (100.0%) |
| 12 to 14 Years | 31 (58.5%) | 84 (100.0%) |
| 15 Years | 51 (100.0%) | 14 (13.5%) |
| 16 and 17 Years | 13 (100.0%) | 32 (100.0%) |
| 18 to 24 Years | 199 (100.0%) | 79 (50.6%) |
| 25 to 34 Years | 266 (100.0%) | 189 (100.0%) |
| 35 to 44 Years | 217 (52.4%) | 137 (48.1%) |
| 45 to 54 Years | 253 (86.1%) | 148 (100.0%) |
| 55 to 64 Years | 239 (79.9%) | 311 (100.0%) |
| 65 to 74 Years | 137 (100.0%) | 139 (93.3%) |
| 75 Years and over | 22 (100.0%) | 20 (100.0%) |
| Total | 1,745 (78.6%) | 1,328 (77.8%) |
Income Below Poverty Among Married-Couple Families in Shenandoah Farms
The poverty statistics for married-couple families in Shenandoah Farms show that 22.8% or 197 of the total 863 families live below the poverty line. Families with 1 or 2 children have the highest poverty rate of 53.7%, comprising of 197 families. On the other hand, families with no children have the lowest poverty rate of 0.0%, which includes 0 families.
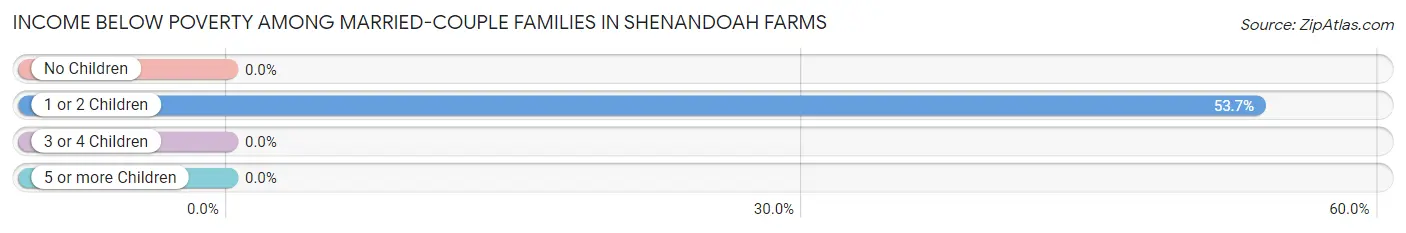
| Children | Above Poverty | Below Poverty |
| No Children | 388 (100.0%) | 0 (0.0%) |
| 1 or 2 Children | 170 (46.3%) | 197 (53.7%) |
| 3 or 4 Children | 108 (100.0%) | 0 (0.0%) |
| 5 or more Children | 0 (0.0%) | 0 (0.0%) |
| Total | 666 (77.2%) | 197 (22.8%) |
Income Below Poverty Among Single-Parent Households in Shenandoah Farms
According to the poverty data in Shenandoah Farms, 27.8% or 20 single-father households and 52.7% or 77 single-mother households are living below the poverty line. Among single-father households, those with 1 or 2 children have the highest poverty rate, with 20 households (48.8%) experiencing poverty. Likewise, among single-mother households, those with 1 or 2 children have the highest poverty rate, with 77 households (84.6%) falling below the poverty line.
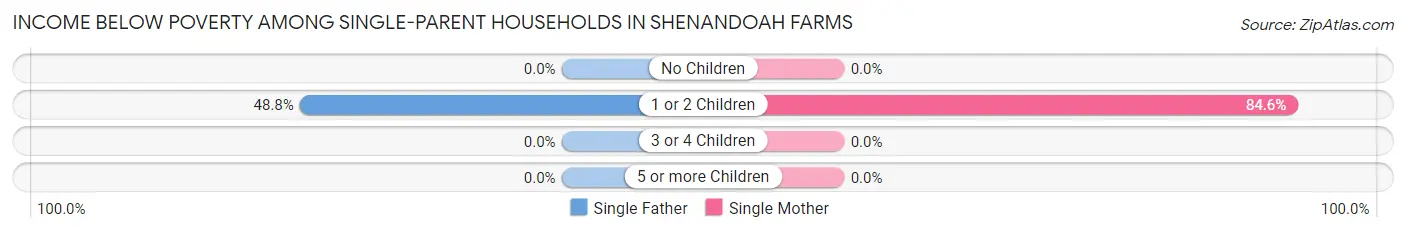
| Children | Single Father | Single Mother |
| No Children | 0 (0.0%) | 0 (0.0%) |
| 1 or 2 Children | 20 (48.8%) | 77 (84.6%) |
| 3 or 4 Children | 0 (0.0%) | 0 (0.0%) |
| 5 or more Children | 0 (0.0%) | 0 (0.0%) |
| Total | 20 (27.8%) | 77 (52.7%) |
Income Below Poverty Among Married-Couple vs Single-Parent Households in Shenandoah Farms
The poverty data for Shenandoah Farms shows that 197 of the married-couple family households (22.8%) and 97 of the single-parent households (44.5%) are living below the poverty level. Within the married-couple family households, those with 1 or 2 children have the highest poverty rate, with 197 households (53.7%) falling below the poverty line. Among the single-parent households, those with 1 or 2 children have the highest poverty rate, with 97 household (73.5%) living below poverty.
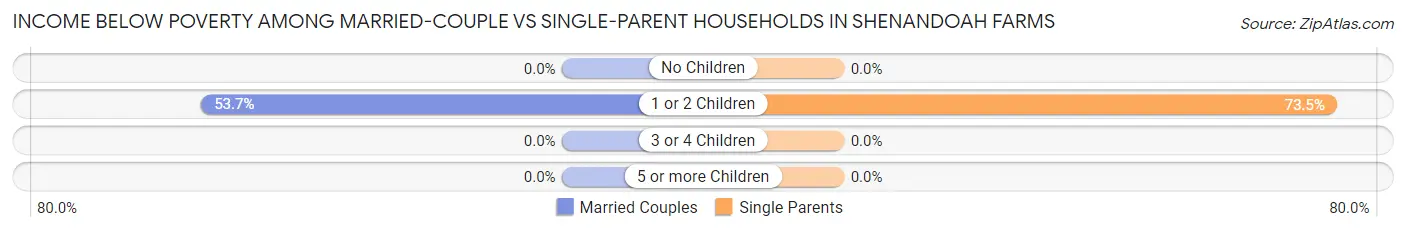
| Children | Married-Couple Families | Single-Parent Households |
| No Children | 0 (0.0%) | 0 (0.0%) |
| 1 or 2 Children | 197 (53.7%) | 97 (73.5%) |
| 3 or 4 Children | 0 (0.0%) | 0 (0.0%) |
| 5 or more Children | 0 (0.0%) | 0 (0.0%) |
| Total | 197 (22.8%) | 97 (44.5%) |
Race in Shenandoah Farms
The most populous races in Shenandoah Farms are White / Caucasian (3,830 | 97.6%), Hispanic or Latino (90 | 2.3%), and Black / African American (38 | 1.0%).
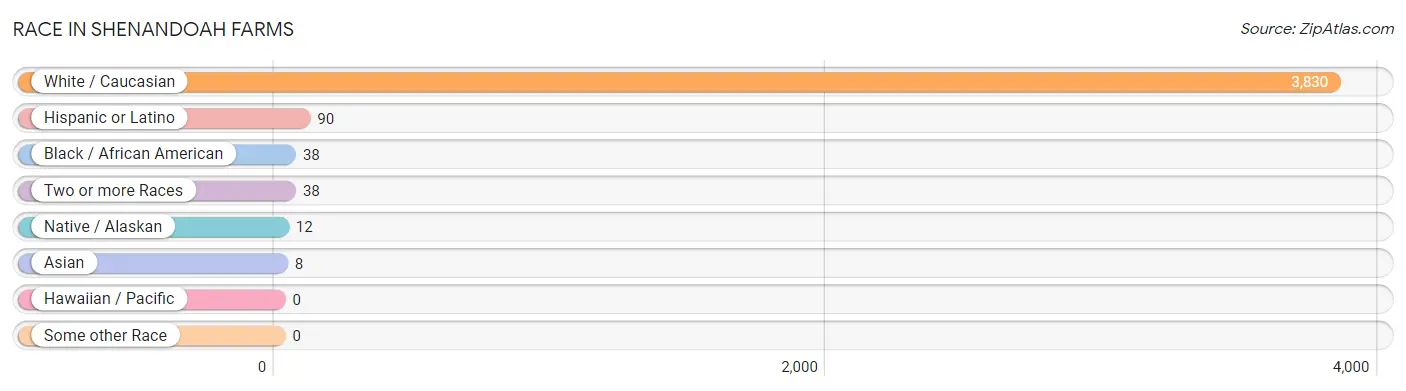
| Race | # Population | % Population |
| Asian | 8 | 0.2% |
| Black / African American | 38 | 1.0% |
| Hawaiian / Pacific | 0 | 0.0% |
| Hispanic or Latino | 90 | 2.3% |
| Native / Alaskan | 12 | 0.3% |
| White / Caucasian | 3,830 | 97.6% |
| Two or more Races | 38 | 1.0% |
| Some other Race | 0 | 0.0% |
| Total | 3,926 | 100.0% |
Ancestry in Shenandoah Farms
The most populous ancestries reported in Shenandoah Farms are German (368 | 9.4%), English (279 | 7.1%), Scottish (235 | 6.0%), French Canadian (224 | 5.7%), and European (207 | 5.3%), together accounting for 33.5% of all Shenandoah Farms residents.
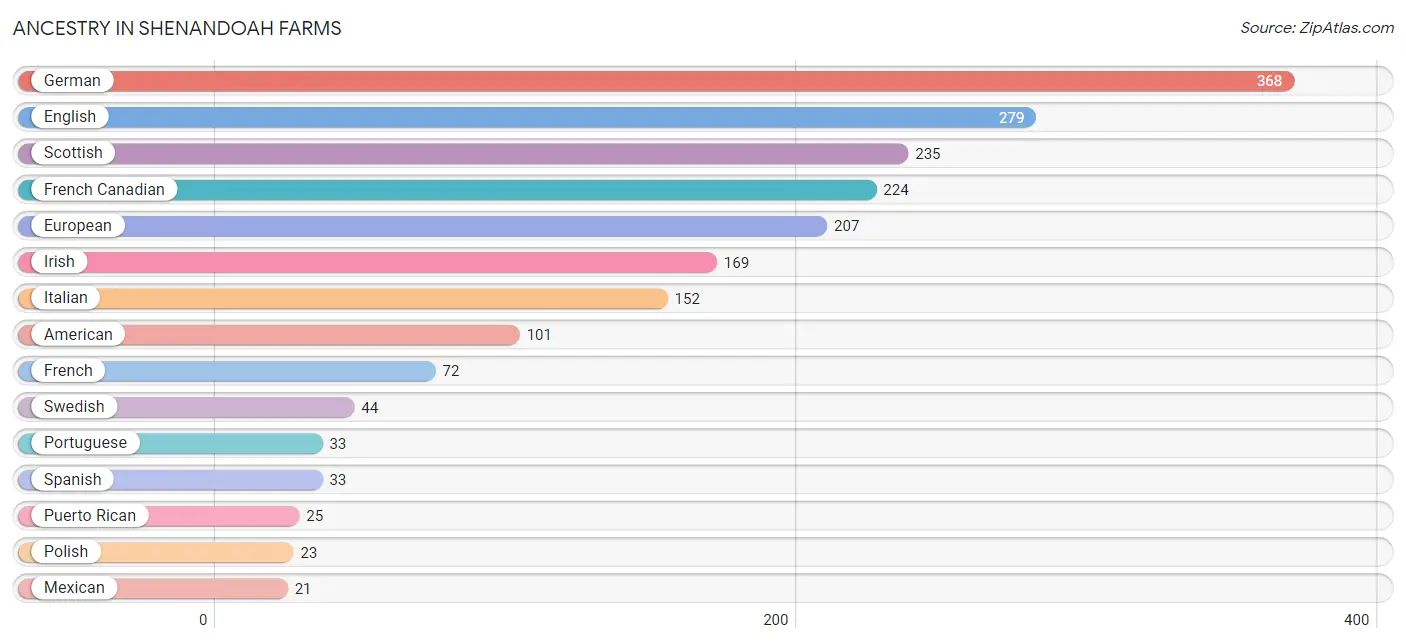
| Ancestry | # Population | % Population |
| American | 101 | 2.6% |
| Austrian | 14 | 0.4% |
| Burmese | 8 | 0.2% |
| Central American | 11 | 0.3% |
| Delaware | 12 | 0.3% |
| English | 279 | 7.1% |
| European | 207 | 5.3% |
| Finnish | 8 | 0.2% |
| French | 72 | 1.8% |
| French Canadian | 224 | 5.7% |
| German | 368 | 9.4% |
| Irish | 169 | 4.3% |
| Italian | 152 | 3.9% |
| Mexican | 21 | 0.5% |
| Nicaraguan | 11 | 0.3% |
| Norwegian | 9 | 0.2% |
| Polish | 23 | 0.6% |
| Portuguese | 33 | 0.8% |
| Puerto Rican | 25 | 0.6% |
| Russian | 8 | 0.2% |
| Scottish | 235 | 6.0% |
| South African | 8 | 0.2% |
| Spanish | 33 | 0.8% |
| Subsaharan African | 8 | 0.2% |
| Swedish | 44 | 1.1% |
| Swiss | 10 | 0.3% |
| Welsh | 14 | 0.4% | View All 27 Rows |
Immigrants in Shenandoah Farms
The most numerous immigrant groups reported in Shenandoah Farms came from Europe (61 | 1.5%), Northern Europe (61 | 1.5%), Central America (21 | 0.5%), Latin America (21 | 0.5%), and Mexico (21 | 0.5%), together accounting for 4.7% of all Shenandoah Farms residents.
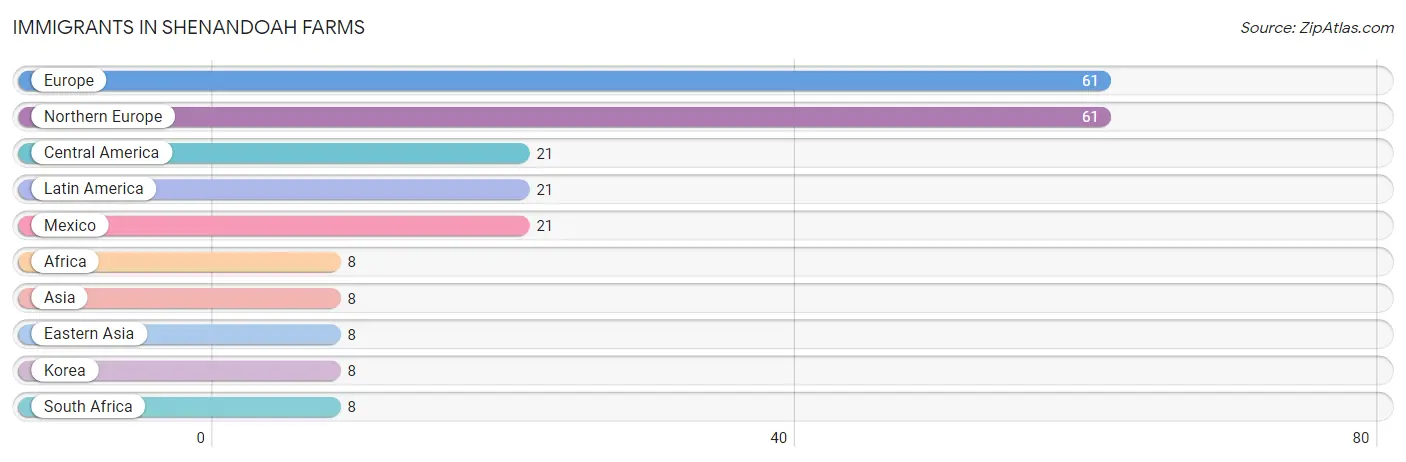
| Immigration Origin | # Population | % Population |
| Africa | 8 | 0.2% |
| Asia | 8 | 0.2% |
| Central America | 21 | 0.5% |
| Eastern Asia | 8 | 0.2% |
| Europe | 61 | 1.5% |
| Korea | 8 | 0.2% |
| Latin America | 21 | 0.5% |
| Mexico | 21 | 0.5% |
| Northern Europe | 61 | 1.5% |
| South Africa | 8 | 0.2% | View All 10 Rows |
Sex and Age in Shenandoah Farms
Sex and Age in Shenandoah Farms
The most populous age groups in Shenandoah Farms are 5 to 9 Years (305 | 13.7%) for men and 35 to 39 Years (217 | 12.7%) for women.
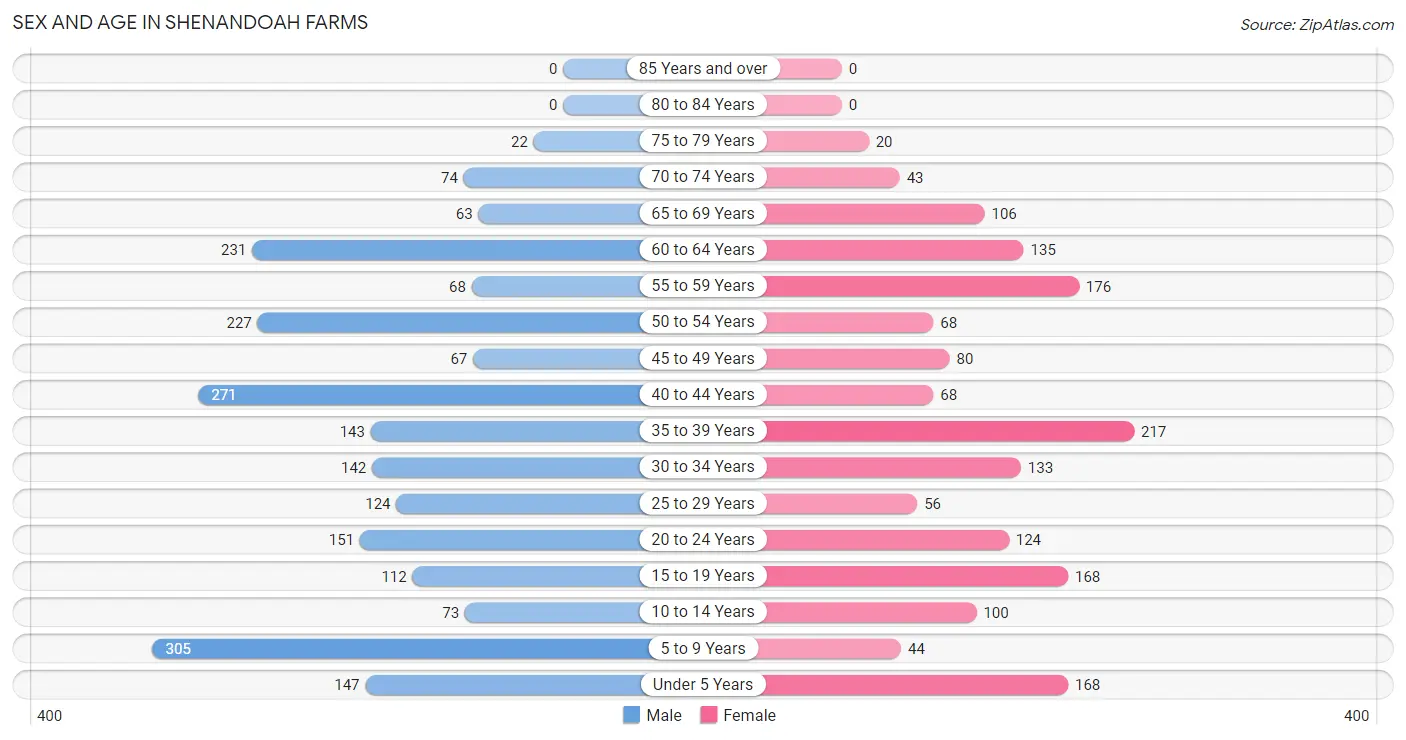
| Age Bracket | Male | Female |
| Under 5 Years | 147 (6.6%) | 168 (9.9%) |
| 5 to 9 Years | 305 (13.7%) | 44 (2.6%) |
| 10 to 14 Years | 73 (3.3%) | 100 (5.9%) |
| 15 to 19 Years | 112 (5.1%) | 168 (9.9%) |
| 20 to 24 Years | 151 (6.8%) | 124 (7.3%) |
| 25 to 29 Years | 124 (5.6%) | 56 (3.3%) |
| 30 to 34 Years | 142 (6.4%) | 133 (7.8%) |
| 35 to 39 Years | 143 (6.4%) | 217 (12.7%) |
| 40 to 44 Years | 271 (12.2%) | 68 (4.0%) |
| 45 to 49 Years | 67 (3.0%) | 80 (4.7%) |
| 50 to 54 Years | 227 (10.2%) | 68 (4.0%) |
| 55 to 59 Years | 68 (3.1%) | 176 (10.3%) |
| 60 to 64 Years | 231 (10.4%) | 135 (7.9%) |
| 65 to 69 Years | 63 (2.8%) | 106 (6.2%) |
| 70 to 74 Years | 74 (3.3%) | 43 (2.5%) |
| 75 to 79 Years | 22 (1.0%) | 20 (1.2%) |
| 80 to 84 Years | 0 (0.0%) | 0 (0.0%) |
| 85 Years and over | 0 (0.0%) | 0 (0.0%) |
| Total | 2,220 (100.0%) | 1,706 (100.0%) |
Families and Households in Shenandoah Farms
Median Family Size in Shenandoah Farms
The median family size in Shenandoah Farms is 3.10 persons per family, with married-couple families (863 | 79.8%) accounting for the largest median family size of 3.14 persons per family. On the other hand, single male/father families (72 | 6.7%) represent the smallest median family size with 2.76 persons per family.
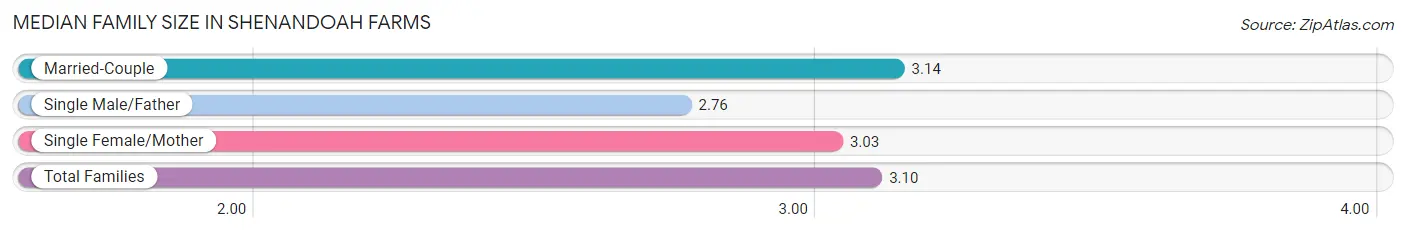
| Family Type | # Families | Family Size |
| Married-Couple | 863 (79.8%) | 3.14 |
| Single Male/Father | 72 (6.7%) | 2.76 |
| Single Female/Mother | 146 (13.5%) | 3.03 |
| Total Families | 1,081 (100.0%) | 3.10 |
Median Household Size in Shenandoah Farms
The median household size in Shenandoah Farms is 2.67 persons per household, with single female/mother households (146 | 9.9%) accounting for the largest median household size of 3.6 persons per household. non-family households (389 | 26.5%) represent the smallest median household size with 1.27 persons per household.
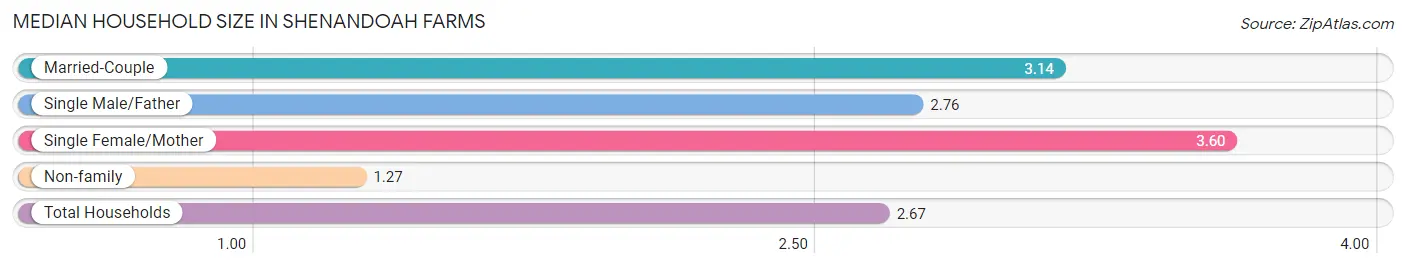
| Household Type | # Households | Household Size |
| Married-Couple | 863 (58.7%) | 3.14 |
| Single Male/Father | 72 (4.9%) | 2.76 |
| Single Female/Mother | 146 (9.9%) | 3.60 |
| Non-family | 389 (26.5%) | 1.27 |
| Total Households | 1,470 (100.0%) | 2.67 |
Household Size by Marriage Status in Shenandoah Farms
Out of a total of 1,470 households in Shenandoah Farms, 1,081 (73.5%) are family households, while 389 (26.5%) are nonfamily households. The most numerous type of family households are 2-person households, comprising 434, and the most common type of nonfamily households are 1-person households, comprising 315.
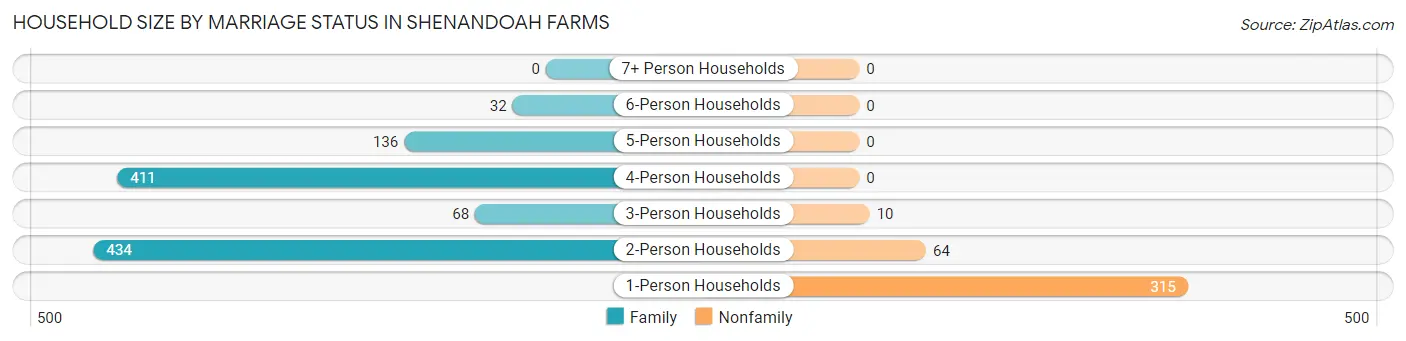
| Household Size | Family Households | Nonfamily Households |
| 1-Person Households | - | 315 (21.4%) |
| 2-Person Households | 434 (29.5%) | 64 (4.3%) |
| 3-Person Households | 68 (4.6%) | 10 (0.7%) |
| 4-Person Households | 411 (28.0%) | 0 (0.0%) |
| 5-Person Households | 136 (9.2%) | 0 (0.0%) |
| 6-Person Households | 32 (2.2%) | 0 (0.0%) |
| 7+ Person Households | 0 (0.0%) | 0 (0.0%) |
| Total | 1,081 (73.5%) | 389 (26.5%) |
Female Fertility in Shenandoah Farms
Fertility by Age in Shenandoah Farms
Average fertility rate in Shenandoah Farms is 114.0 births per 1,000 women. Women in the age bracket of 20 to 34 years have the highest fertility rate with 294.0 births per 1,000 women. Women in the age bracket of 20 to 34 years acount for 88.5% of all women with births.
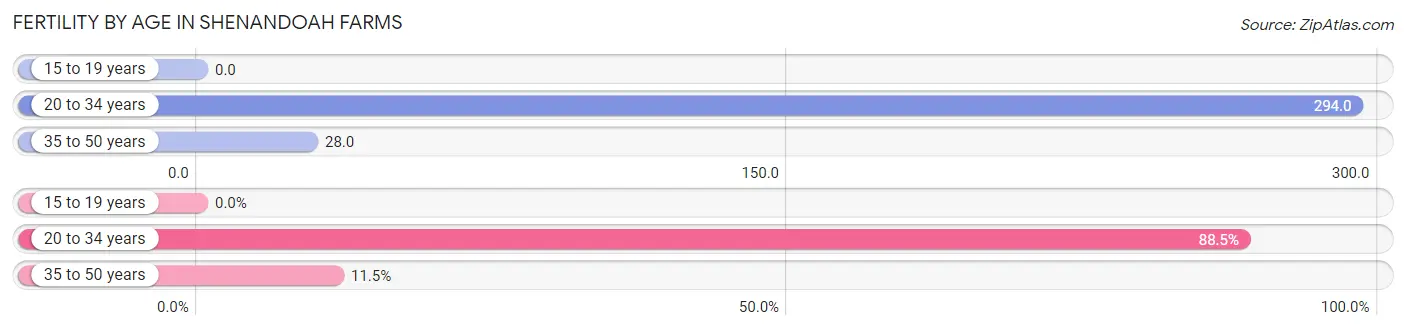
| Age Bracket | Women with Births | Births / 1,000 Women |
| 15 to 19 years | 0 (0.0%) | 0.0 |
| 20 to 34 years | 92 (88.5%) | 294.0 |
| 35 to 50 years | 12 (11.5%) | 28.0 |
| Total | 104 (100.0%) | 114.0 |
Fertility by Age by Marriage Status in Shenandoah Farms
26.0% of women with births (104) in Shenandoah Farms are married. The highest percentage of unmarried women with births falls into 20 to 34 years age bracket with 83.7% of them unmarried at the time of birth, while the lowest percentage of unmarried women with births belong to 35 to 50 years age bracket with 0.0% of them unmarried.
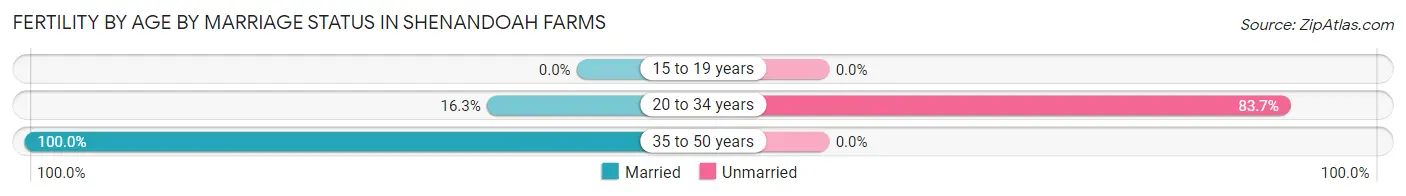
| Age Bracket | Married | Unmarried |
| 15 to 19 years | 0 (0.0%) | 0 (0.0%) |
| 20 to 34 years | 15 (16.3%) | 77 (83.7%) |
| 35 to 50 years | 12 (100.0%) | 0 (0.0%) |
| Total | 27 (26.0%) | 77 (74.0%) |
Fertility by Education in Shenandoah Farms
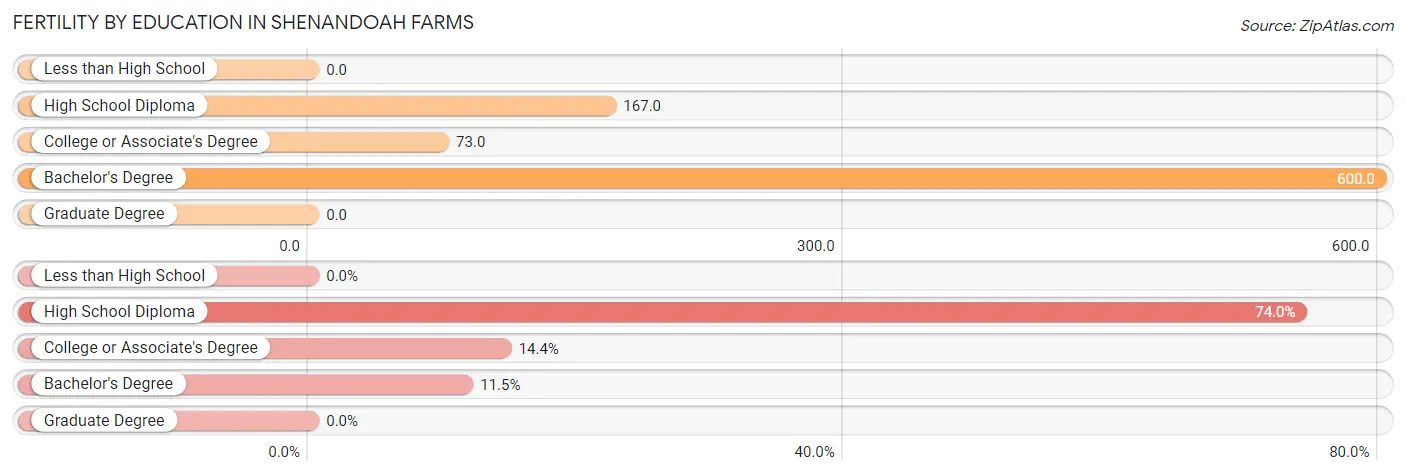
| Educational Attainment | Women with Births | Births / 1,000 Women |
| Less than High School | 0 (0.0%) | 0.0 |
| High School Diploma | 77 (74.0%) | 167.0 |
| College or Associate's Degree | 15 (14.4%) | 73.0 |
| Bachelor's Degree | 12 (11.5%) | 600.0 |
| Graduate Degree | 0 (0.0%) | 0.0 |
| Total | 104 (100.0%) | 114.0 |
Fertility by Education by Marriage Status in Shenandoah Farms
74.0% of women with births in Shenandoah Farms are unmarried. Women with the educational attainment of college or associate's degree are most likely to be married with 100.0% of them married at childbirth, while women with the educational attainment of high school diploma are least likely to be married with 100.0% of them unmarried at childbirth.
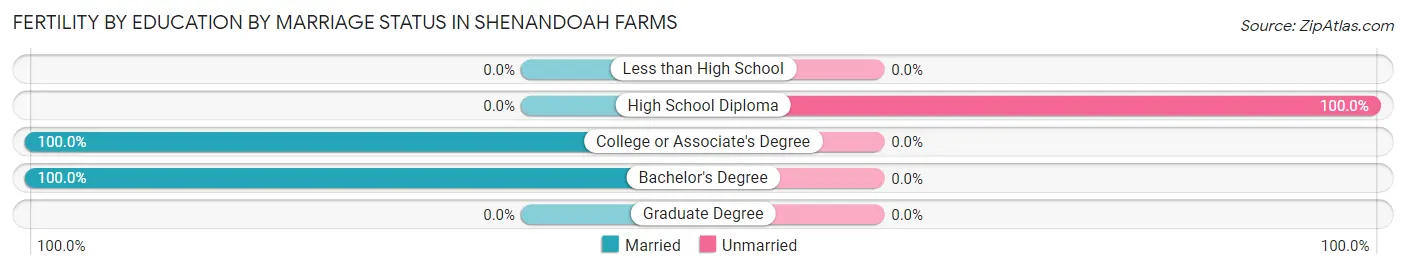
| Educational Attainment | Married | Unmarried |
| Less than High School | 0 (0.0%) | 0 (0.0%) |
| High School Diploma | 0 (0.0%) | 77 (100.0%) |
| College or Associate's Degree | 15 (100.0%) | 0 (0.0%) |
| Bachelor's Degree | 12 (100.0%) | 0 (0.0%) |
| Graduate Degree | 0 (0.0%) | 0 (0.0%) |
| Total | 27 (26.0%) | 77 (74.0%) |
Employment Characteristics in Shenandoah Farms
Employment by Class of Employer in Shenandoah Farms
Among the 1,480 employed individuals in Shenandoah Farms, private company employees (936 | 63.2%), local government employees (178 | 12.0%), and state government employees (92 | 6.2%) make up the most common classes of employment.
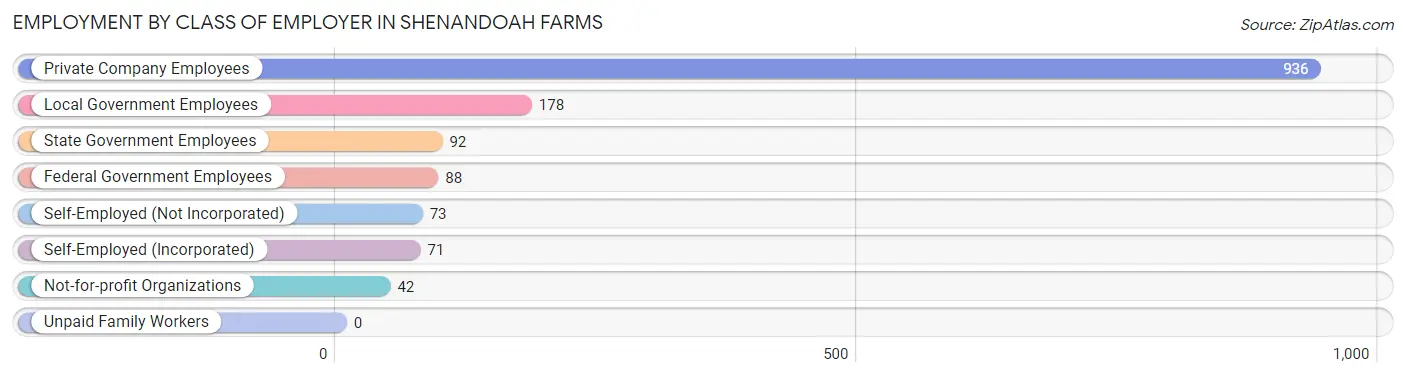
| Employer Class | # Employees | % Employees |
| Private Company Employees | 936 | 63.2% |
| Self-Employed (Incorporated) | 71 | 4.8% |
| Self-Employed (Not Incorporated) | 73 | 4.9% |
| Not-for-profit Organizations | 42 | 2.8% |
| Local Government Employees | 178 | 12.0% |
| State Government Employees | 92 | 6.2% |
| Federal Government Employees | 88 | 5.9% |
| Unpaid Family Workers | 0 | 0.0% |
| Total | 1,480 | 100.0% |
Employment Status by Age in Shenandoah Farms
According to the labor force statistics for Shenandoah Farms, out of the total population over 16 years of age (2,934), 56.1% or 1,646 individuals are in the labor force, with 6.4% or 105 of them unemployed. The age group with the highest labor force participation rate is 25 to 29 years, with 84.4% or 152 individuals in the labor force. Within the labor force, the 20 to 24 years age range has the highest percentage of unemployed individuals, with 35.2% or 58 of them being unemployed.
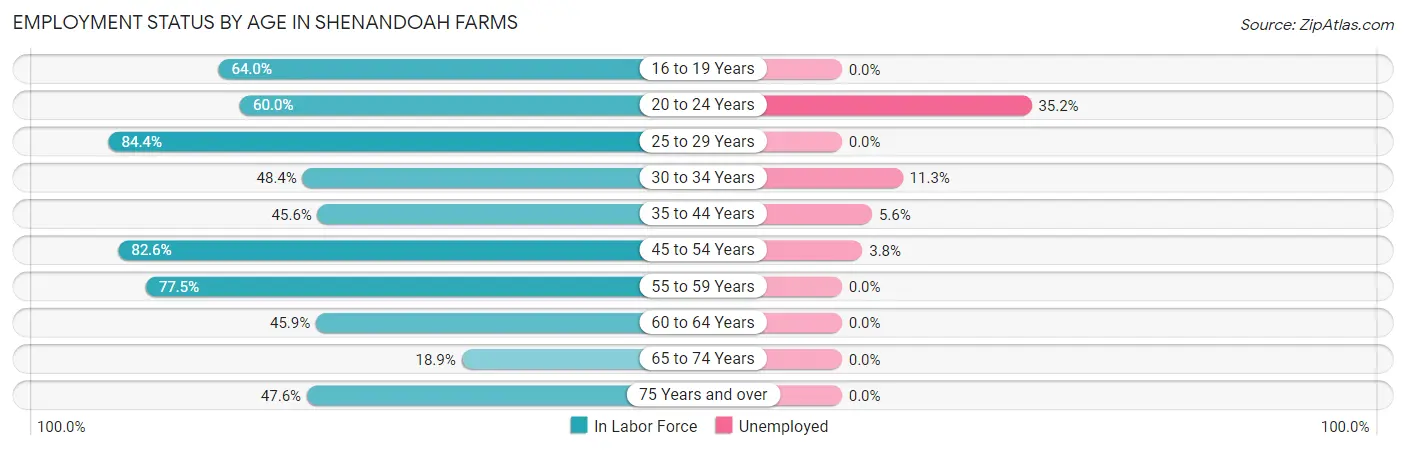
| Age Bracket | In Labor Force | Unemployed |
| 16 to 19 Years | 80 (64.0%) | 0 (0.0%) |
| 20 to 24 Years | 165 (60.0%) | 58 (35.2%) |
| 25 to 29 Years | 152 (84.4%) | 0 (0.0%) |
| 30 to 34 Years | 133 (48.4%) | 15 (11.3%) |
| 35 to 44 Years | 319 (45.6%) | 18 (5.6%) |
| 45 to 54 Years | 365 (82.6%) | 14 (3.8%) |
| 55 to 59 Years | 189 (77.5%) | 0 (0.0%) |
| 60 to 64 Years | 168 (45.9%) | 0 (0.0%) |
| 65 to 74 Years | 54 (18.9%) | 0 (0.0%) |
| 75 Years and over | 20 (47.6%) | 0 (0.0%) |
| Total | 1,646 (56.1%) | 105 (6.4%) |
Employment Status by Educational Attainment in Shenandoah Farms
According to labor force statistics for Shenandoah Farms, 60.1% of individuals (1,326) out of the total population between 25 and 64 years of age (2,206) are in the labor force, with 3.5% or 46 of them being unemployed. The group with the highest labor force participation rate are those with the educational attainment of bachelor's degree or higher, with 83.7% or 380 individuals in the labor force. Within the labor force, individuals with high school diploma education have the highest percentage of unemployment, with 11.3% or 29 of them being unemployed.
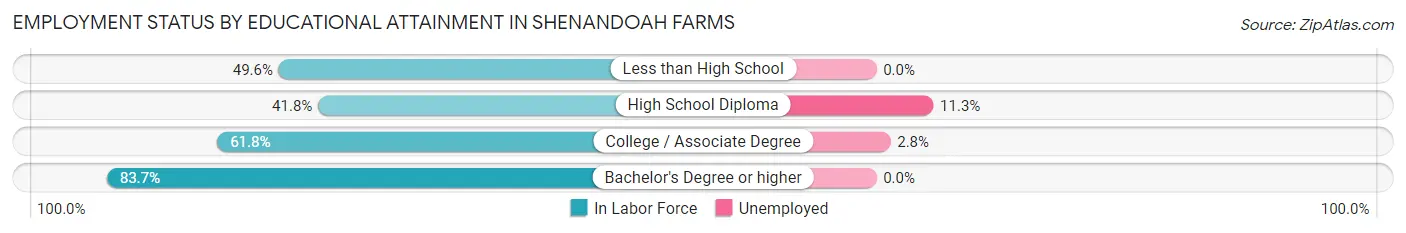
| Educational Attainment | In Labor Force | Unemployed |
| Less than High School | 58 (49.6%) | 0 (0.0%) |
| High School Diploma | 256 (41.8%) | 69 (11.3%) |
| College / Associate Degree | 632 (61.8%) | 29 (2.8%) |
| Bachelor's Degree or higher | 380 (83.7%) | 0 (0.0%) |
| Total | 1,326 (60.1%) | 77 (3.5%) |
Employment Occupations by Sex in Shenandoah Farms
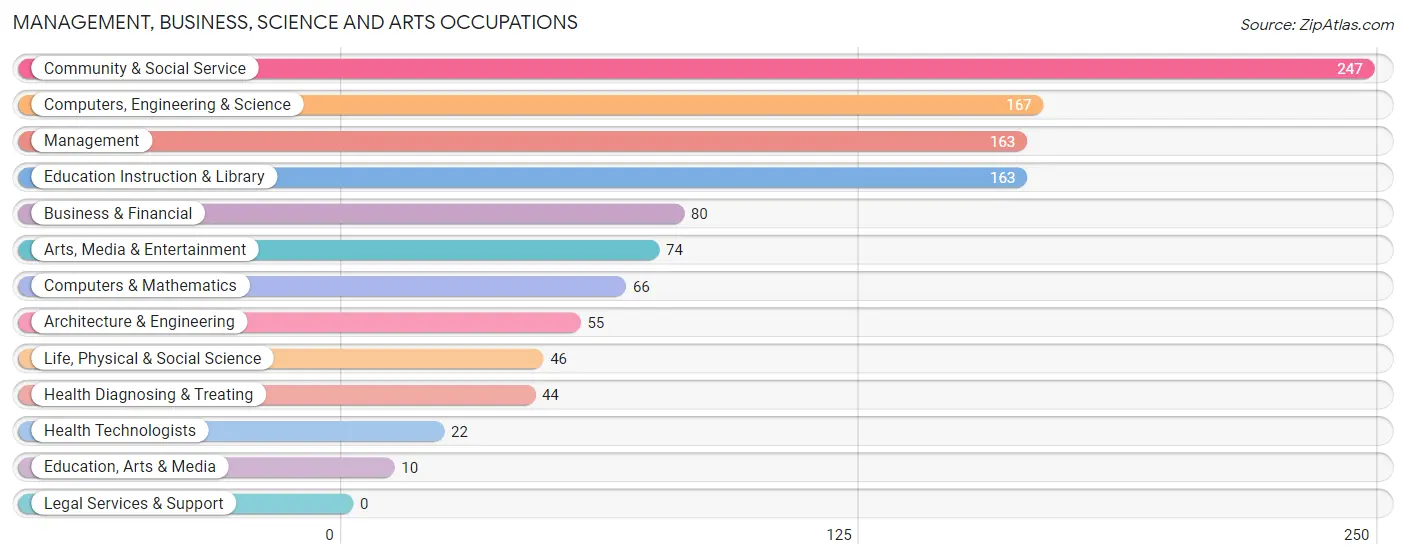
Management, Business, Science and Arts Occupations
The most common Management, Business, Science and Arts occupations in Shenandoah Farms are Community & Social Service (247 | 16.0%), Computers, Engineering & Science (167 | 10.8%), Management (163 | 10.6%), Education Instruction & Library (163 | 10.6%), and Business & Financial (80 | 5.2%).
Management, Business, Science and Arts Occupations by Sex
Within the Management, Business, Science and Arts occupations in Shenandoah Farms, the most male-oriented occupations are Business & Financial (100.0%), Architecture & Engineering (100.0%), and Education, Arts & Media (100.0%), while the most female-oriented occupations are Life, Physical & Social Science (100.0%), Education Instruction & Library (78.5%), and Community & Social Service (59.9%).
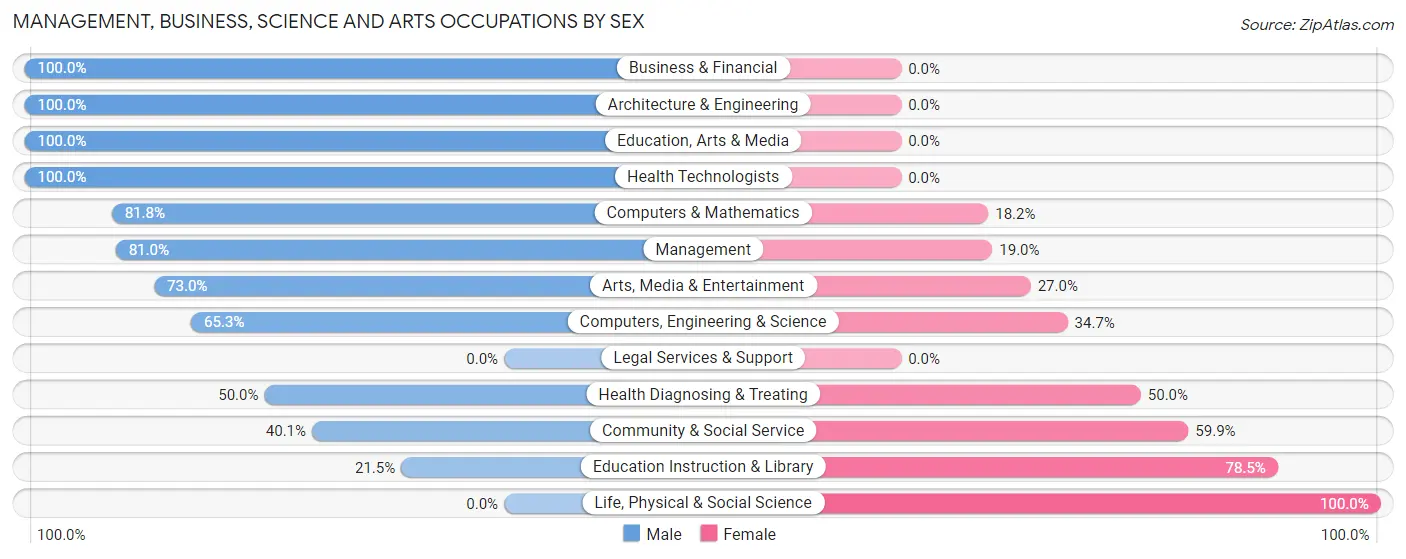
| Occupation | Male | Female |
| Management | 132 (81.0%) | 31 (19.0%) |
| Business & Financial | 80 (100.0%) | 0 (0.0%) |
| Computers, Engineering & Science | 109 (65.3%) | 58 (34.7%) |
| Computers & Mathematics | 54 (81.8%) | 12 (18.2%) |
| Architecture & Engineering | 55 (100.0%) | 0 (0.0%) |
| Life, Physical & Social Science | 0 (0.0%) | 46 (100.0%) |
| Community & Social Service | 99 (40.1%) | 148 (59.9%) |
| Education, Arts & Media | 10 (100.0%) | 0 (0.0%) |
| Legal Services & Support | 0 (0.0%) | 0 (0.0%) |
| Education Instruction & Library | 35 (21.5%) | 128 (78.5%) |
| Arts, Media & Entertainment | 54 (73.0%) | 20 (27.0%) |
| Health Diagnosing & Treating | 22 (50.0%) | 22 (50.0%) |
| Health Technologists | 22 (100.0%) | 0 (0.0%) |
| Total (Category) | 442 (63.0%) | 259 (36.9%) |
| Total (Overall) | 1,004 (65.2%) | 536 (34.8%) |
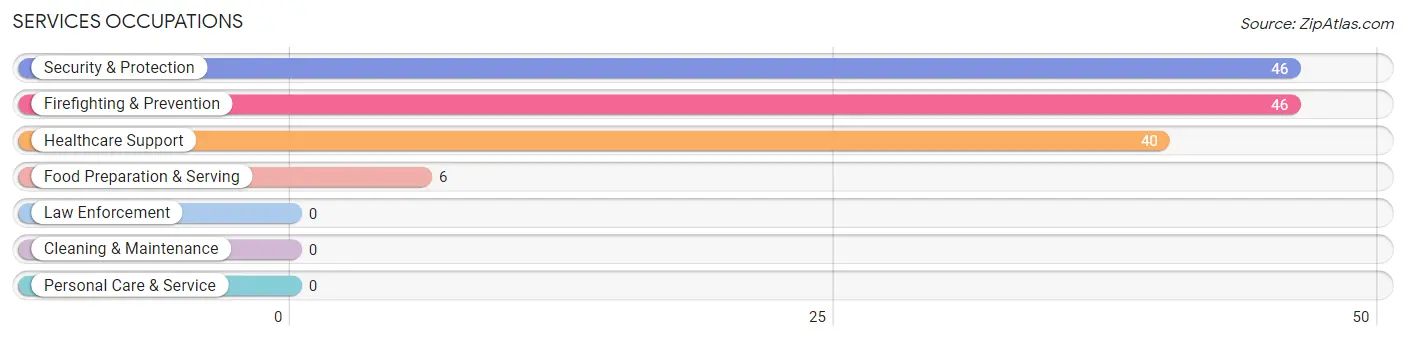
Services Occupations
The most common Services occupations in Shenandoah Farms are Security & Protection (46 | 3.0%), Firefighting & Prevention (46 | 3.0%), Healthcare Support (40 | 2.6%), and Food Preparation & Serving (6 | 0.4%).
Services Occupations by Sex
Within the Services occupations in Shenandoah Farms, the most male-oriented occupations are Food Preparation & Serving (100.0%), Security & Protection (63.0%), and Firefighting & Prevention (63.0%), while the most female-oriented occupations are Healthcare Support (100.0%), Security & Protection (37.0%), and Firefighting & Prevention (37.0%).
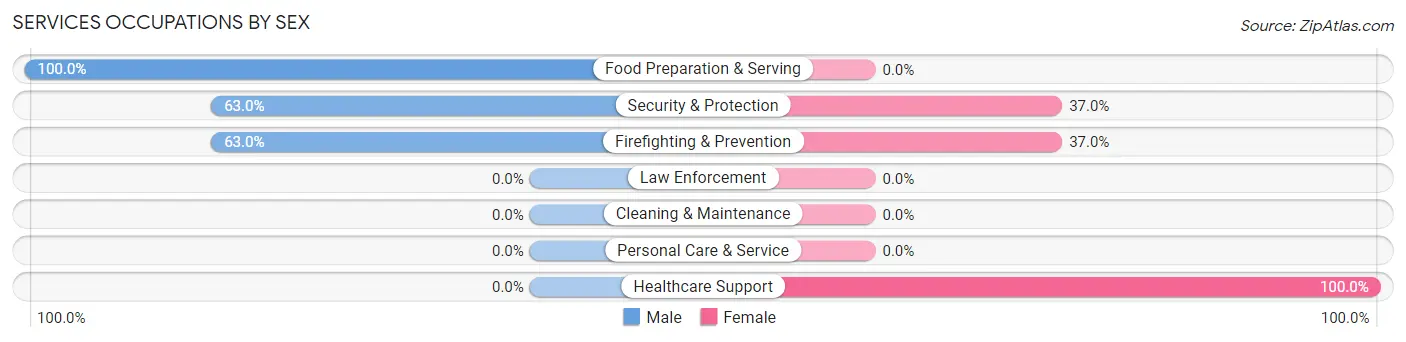
| Occupation | Male | Female |
| Healthcare Support | 0 (0.0%) | 40 (100.0%) |
| Security & Protection | 29 (63.0%) | 17 (37.0%) |
| Firefighting & Prevention | 29 (63.0%) | 17 (37.0%) |
| Law Enforcement | 0 (0.0%) | 0 (0.0%) |
| Food Preparation & Serving | 6 (100.0%) | 0 (0.0%) |
| Cleaning & Maintenance | 0 (0.0%) | 0 (0.0%) |
| Personal Care & Service | 0 (0.0%) | 0 (0.0%) |
| Total (Category) | 35 (38.0%) | 57 (62.0%) |
| Total (Overall) | 1,004 (65.2%) | 536 (34.8%) |
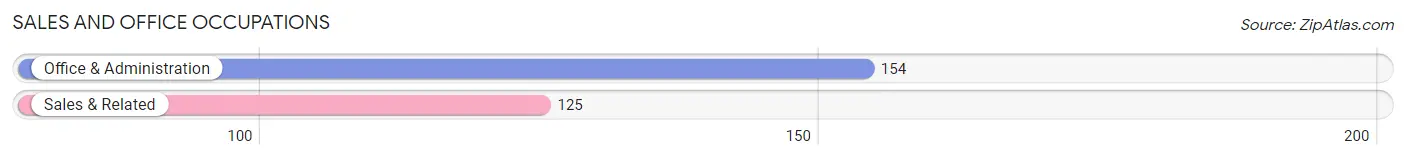
Sales and Office Occupations
The most common Sales and Office occupations in Shenandoah Farms are Office & Administration (154 | 10.0%), and Sales & Related (125 | 8.1%).
Sales and Office Occupations by Sex
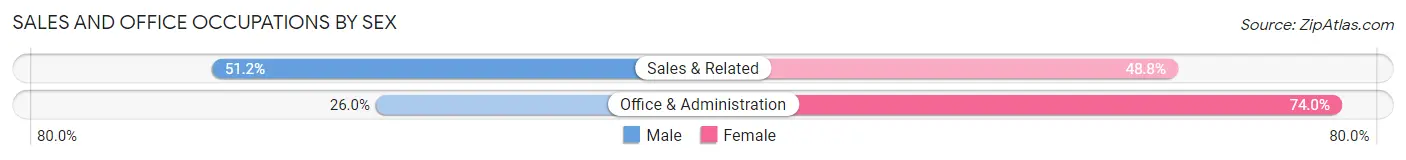
| Occupation | Male | Female |
| Sales & Related | 64 (51.2%) | 61 (48.8%) |
| Office & Administration | 40 (26.0%) | 114 (74.0%) |
| Total (Category) | 104 (37.3%) | 175 (62.7%) |
| Total (Overall) | 1,004 (65.2%) | 536 (34.8%) |
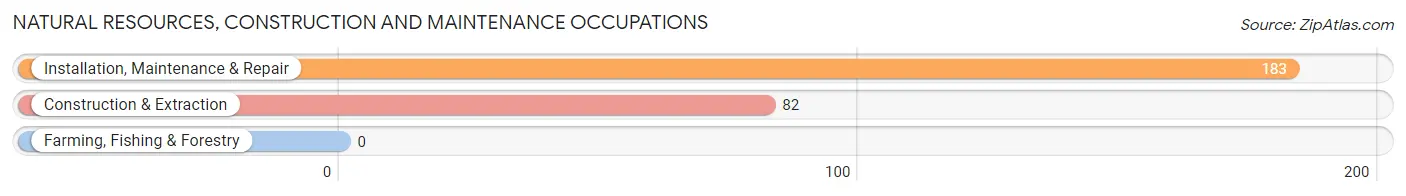
Natural Resources, Construction and Maintenance Occupations
The most common Natural Resources, Construction and Maintenance occupations in Shenandoah Farms are Installation, Maintenance & Repair (183 | 11.9%), and Construction & Extraction (82 | 5.3%).
Natural Resources, Construction and Maintenance Occupations by Sex
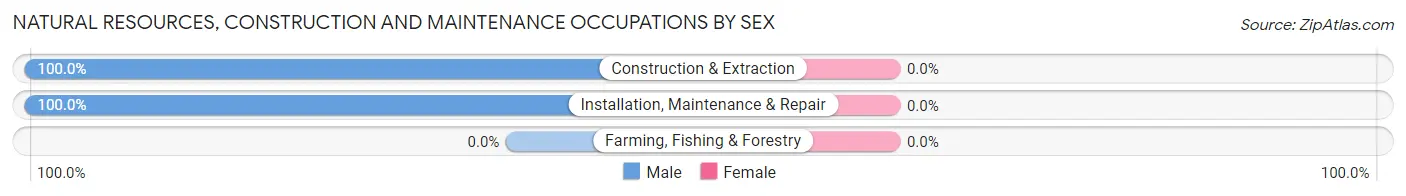
| Occupation | Male | Female |
| Farming, Fishing & Forestry | 0 (0.0%) | 0 (0.0%) |
| Construction & Extraction | 82 (100.0%) | 0 (0.0%) |
| Installation, Maintenance & Repair | 183 (100.0%) | 0 (0.0%) |
| Total (Category) | 265 (100.0%) | 0 (0.0%) |
| Total (Overall) | 1,004 (65.2%) | 536 (34.8%) |
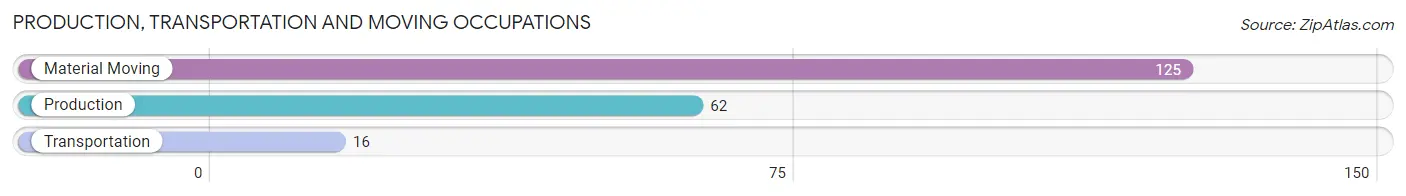
Production, Transportation and Moving Occupations
The most common Production, Transportation and Moving occupations in Shenandoah Farms are Material Moving (125 | 8.1%), Production (62 | 4.0%), and Transportation (16 | 1.0%).
Production, Transportation and Moving Occupations by Sex
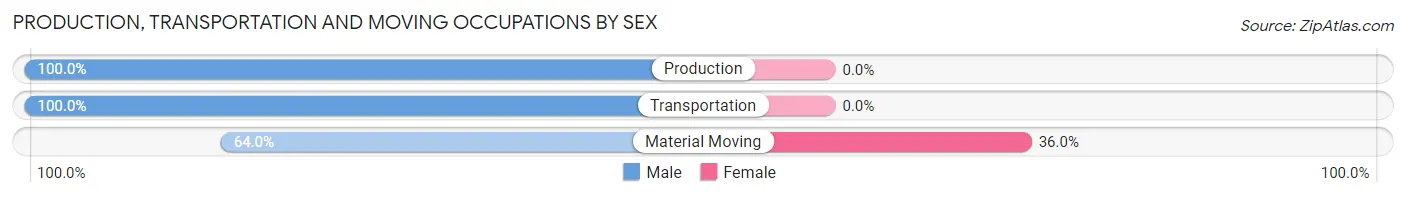
| Occupation | Male | Female |
| Production | 62 (100.0%) | 0 (0.0%) |
| Transportation | 16 (100.0%) | 0 (0.0%) |
| Material Moving | 80 (64.0%) | 45 (36.0%) |
| Total (Category) | 158 (77.8%) | 45 (22.2%) |
| Total (Overall) | 1,004 (65.2%) | 536 (34.8%) |
Employment Industries by Sex in Shenandoah Farms
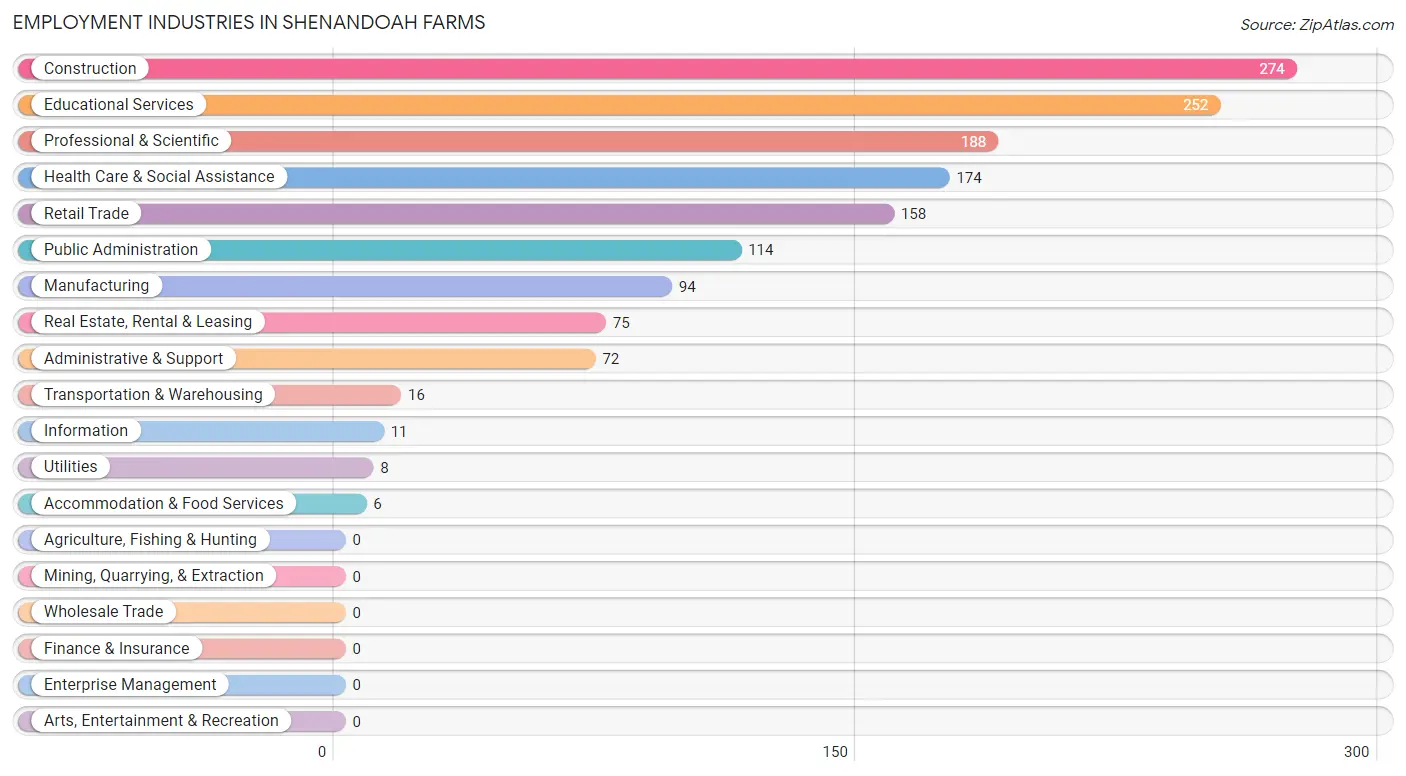
Employment Industries in Shenandoah Farms
The major employment industries in Shenandoah Farms include Construction (274 | 17.8%), Educational Services (252 | 16.4%), Professional & Scientific (188 | 12.2%), Health Care & Social Assistance (174 | 11.3%), and Retail Trade (158 | 10.3%).
Employment Industries by Sex in Shenandoah Farms
The Shenandoah Farms industries that see more men than women are Transportation & Warehousing (100.0%), Utilities (100.0%), and Information (100.0%), whereas the industries that tend to have a higher number of women are Health Care & Social Assistance (81.6%), Retail Trade (61.4%), and Real Estate, Rental & Leasing (54.7%).
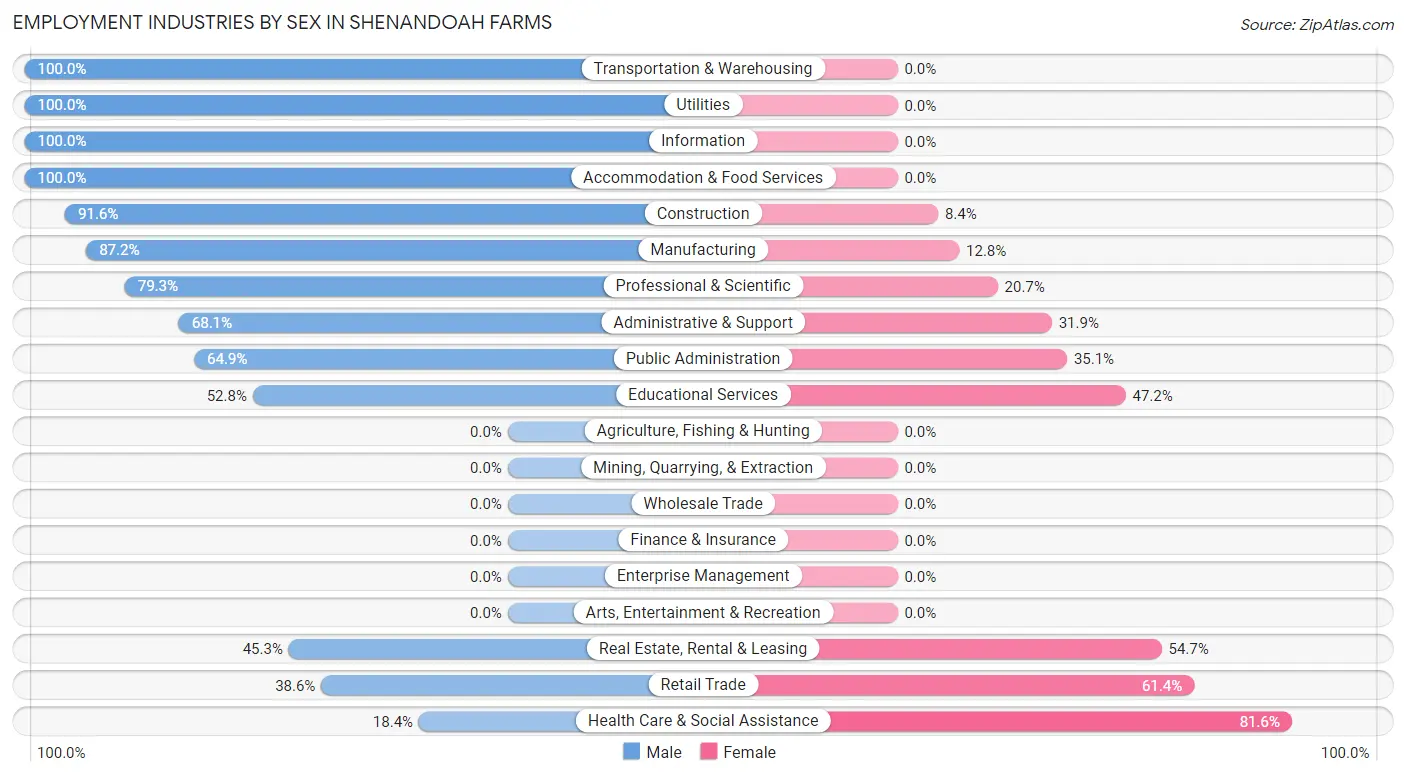
| Industry | Male | Female |
| Agriculture, Fishing & Hunting | 0 (0.0%) | 0 (0.0%) |
| Mining, Quarrying, & Extraction | 0 (0.0%) | 0 (0.0%) |
| Construction | 251 (91.6%) | 23 (8.4%) |
| Manufacturing | 82 (87.2%) | 12 (12.8%) |
| Wholesale Trade | 0 (0.0%) | 0 (0.0%) |
| Retail Trade | 61 (38.6%) | 97 (61.4%) |
| Transportation & Warehousing | 16 (100.0%) | 0 (0.0%) |
| Utilities | 8 (100.0%) | 0 (0.0%) |
| Information | 11 (100.0%) | 0 (0.0%) |
| Finance & Insurance | 0 (0.0%) | 0 (0.0%) |
| Real Estate, Rental & Leasing | 34 (45.3%) | 41 (54.7%) |
| Professional & Scientific | 149 (79.3%) | 39 (20.7%) |
| Enterprise Management | 0 (0.0%) | 0 (0.0%) |
| Administrative & Support | 49 (68.1%) | 23 (31.9%) |
| Educational Services | 133 (52.8%) | 119 (47.2%) |
| Health Care & Social Assistance | 32 (18.4%) | 142 (81.6%) |
| Arts, Entertainment & Recreation | 0 (0.0%) | 0 (0.0%) |
| Accommodation & Food Services | 6 (100.0%) | 0 (0.0%) |
| Public Administration | 74 (64.9%) | 40 (35.1%) |
| Total | 1,004 (65.2%) | 536 (34.8%) |
Education in Shenandoah Farms
School Enrollment in Shenandoah Farms
The most common levels of schooling among the 1,003 students in Shenandoah Farms are kindergarten (324 | 32.3%), high school (200 | 19.9%), and college / undergraduate (182 | 18.1%).
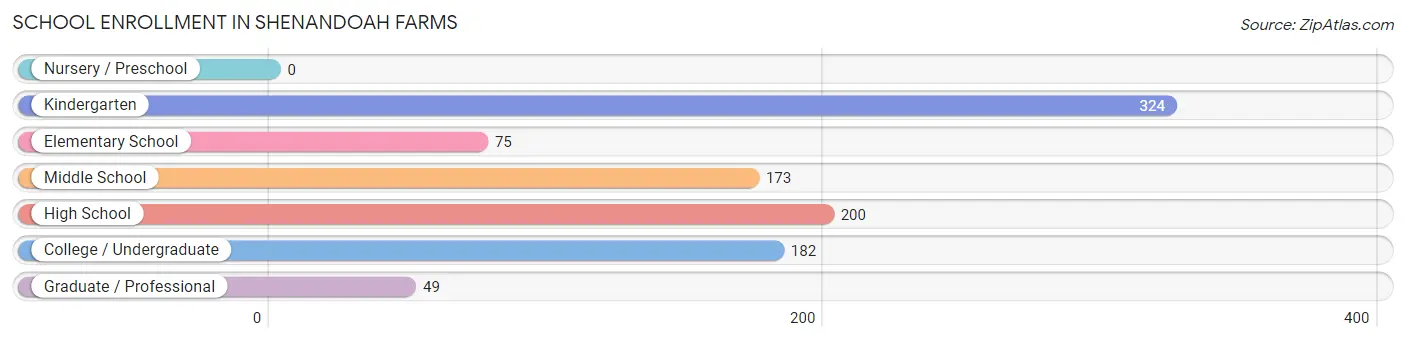
| School Level | # Students | % Students |
| Nursery / Preschool | 0 | 0.0% |
| Kindergarten | 324 | 32.3% |
| Elementary School | 75 | 7.5% |
| Middle School | 173 | 17.2% |
| High School | 200 | 19.9% |
| College / Undergraduate | 182 | 18.1% |
| Graduate / Professional | 49 | 4.9% |
| Total | 1,003 | 100.0% |
School Enrollment by Age by Funding Source in Shenandoah Farms
Out of a total of 1,003 students who are enrolled in schools in Shenandoah Farms, 419 (41.8%) attend a private institution, while the remaining 584 (58.2%) are enrolled in public schools. The age group of 3 to 4 year olds has the highest likelihood of being enrolled in private schools, with 50 (100.0% in the age bracket) enrolled. Conversely, the age group of 15 to 17 year olds has the lowest likelihood of being enrolled in a private school, with 200 (100.0% in the age bracket) attending a public institution.
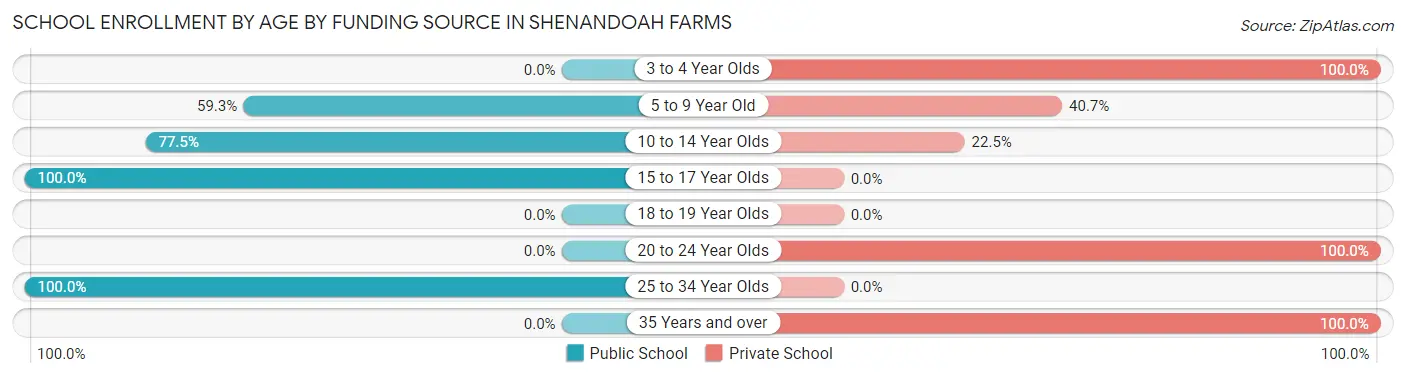
| Age Bracket | Public School | Private School |
| 3 to 4 Year Olds | 0 (0.0%) | 50 (100.0%) |
| 5 to 9 Year Old | 207 (59.3%) | 142 (40.7%) |
| 10 to 14 Year Olds | 134 (77.5%) | 39 (22.5%) |
| 15 to 17 Year Olds | 200 (100.0%) | 0 (0.0%) |
| 18 to 19 Year Olds | 0 (0.0%) | 0 (0.0%) |
| 20 to 24 Year Olds | 0 (0.0%) | 34 (100.0%) |
| 25 to 34 Year Olds | 43 (100.0%) | 0 (0.0%) |
| 35 Years and over | 0 (0.0%) | 154 (100.0%) |
| Total | 584 (58.2%) | 419 (41.8%) |
Educational Attainment by Field of Study in Shenandoah Farms
Social sciences (108 | 16.0%), bio, nature & agricultural (93 | 13.7%), liberal arts & history (88 | 13.0%), business (74 | 10.9%), and computers & mathematics (67 | 9.9%) are the most common fields of study among 677 individuals in Shenandoah Farms who have obtained a bachelor's degree or higher.
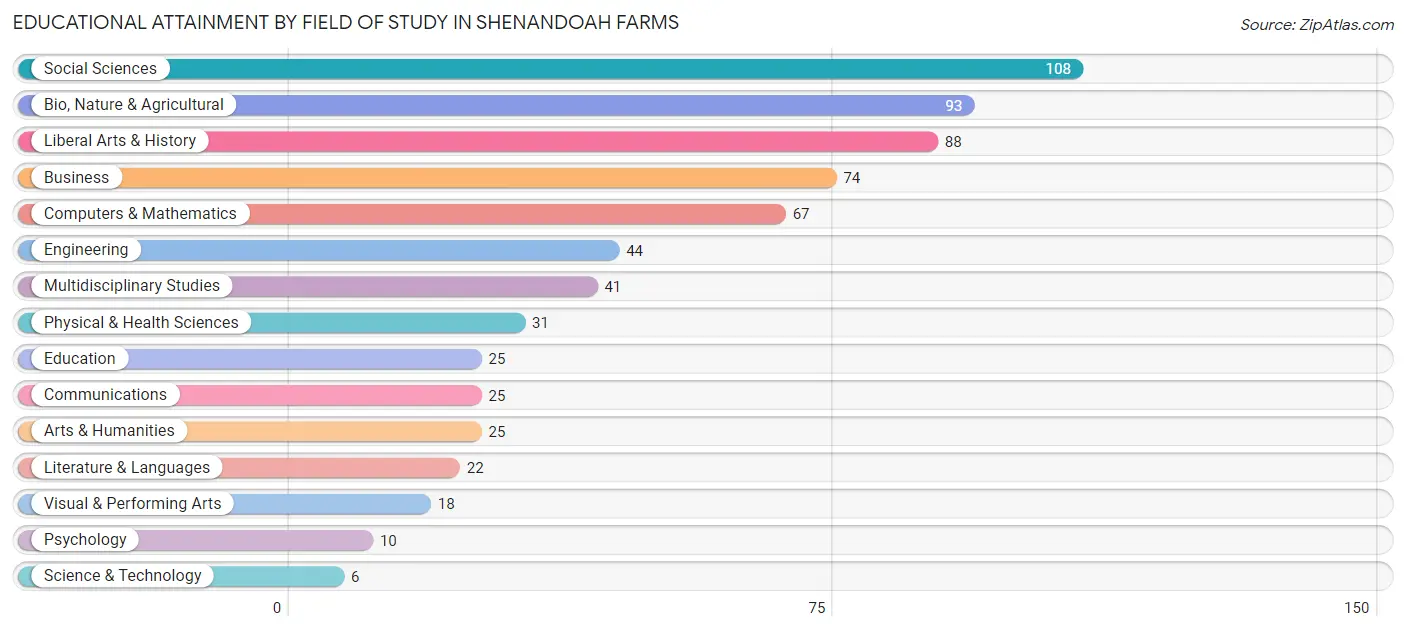
| Field of Study | # Graduates | % Graduates |
| Computers & Mathematics | 67 | 9.9% |
| Bio, Nature & Agricultural | 93 | 13.7% |
| Physical & Health Sciences | 31 | 4.6% |
| Psychology | 10 | 1.5% |
| Social Sciences | 108 | 16.0% |
| Engineering | 44 | 6.5% |
| Multidisciplinary Studies | 41 | 6.1% |
| Science & Technology | 6 | 0.9% |
| Business | 74 | 10.9% |
| Education | 25 | 3.7% |
| Literature & Languages | 22 | 3.3% |
| Liberal Arts & History | 88 | 13.0% |
| Visual & Performing Arts | 18 | 2.7% |
| Communications | 25 | 3.7% |
| Arts & Humanities | 25 | 3.7% |
| Total | 677 | 100.0% |
Transportation & Commute in Shenandoah Farms
Vehicle Availability by Sex in Shenandoah Farms
The most prevalent vehicle ownership categories in Shenandoah Farms are males with 2 vehicles (356, accounting for 36.1%) and females with 2 vehicles (156, making up 72.2%).
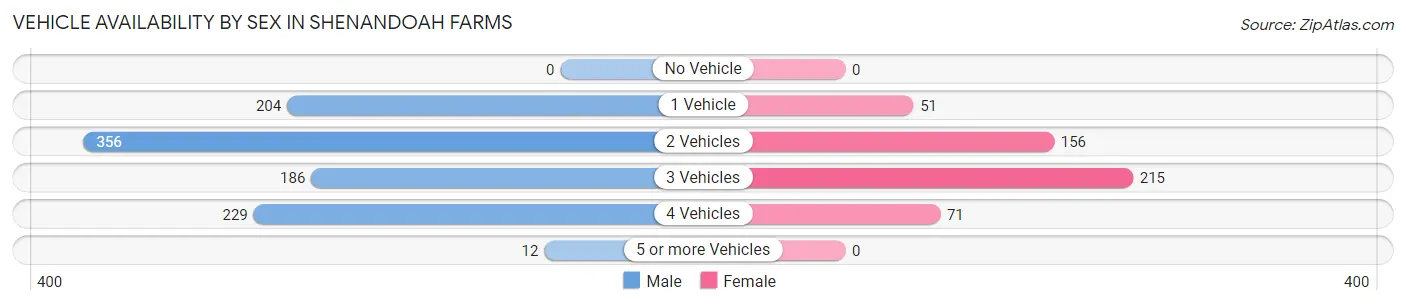
| Vehicles Available | Male | Female |
| No Vehicle | 0 (0.0%) | 0 (0.0%) |
| 1 Vehicle | 204 (20.7%) | 51 (10.3%) |
| 2 Vehicles | 356 (36.1%) | 156 (31.6%) |
| 3 Vehicles | 186 (18.8%) | 215 (43.6%) |
| 4 Vehicles | 229 (23.2%) | 71 (14.4%) |
| 5 or more Vehicles | 12 (1.2%) | 0 (0.0%) |
| Total | 987 (100.0%) | 493 (100.0%) |
Commute Time in Shenandoah Farms
The most frequently occuring commute durations in Shenandoah Farms are 60 to 89 minutes (417 commuters, 34.5%), 45 to 59 minutes (268 commuters, 22.2%), and 30 to 34 minutes (186 commuters, 15.4%).
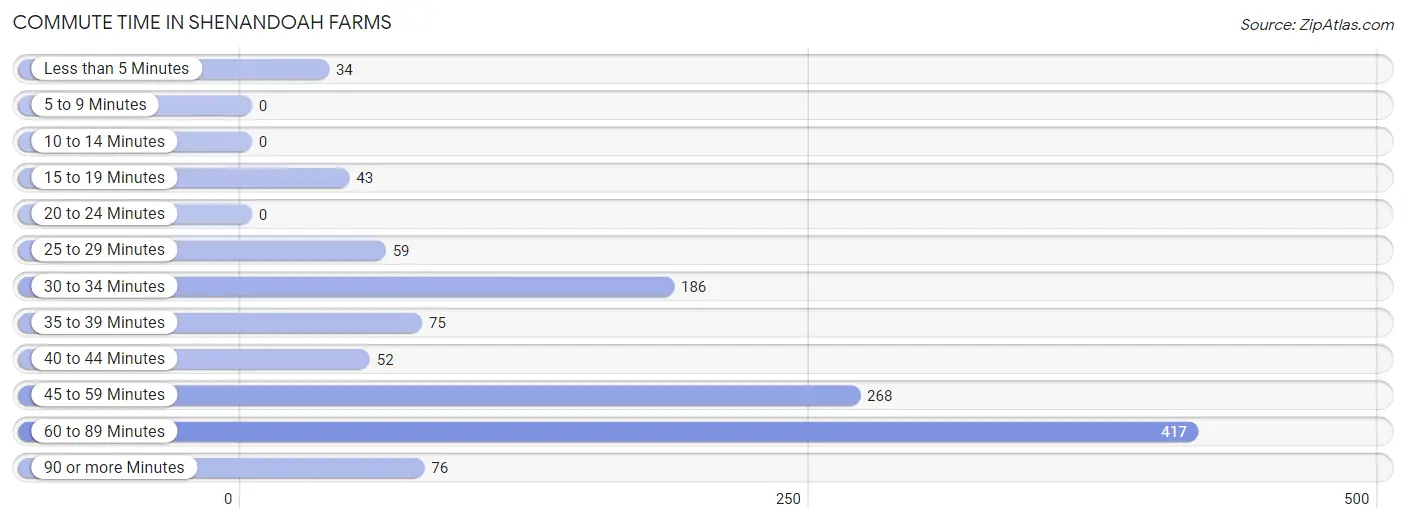
| Commute Time | # Commuters | % Commuters |
| Less than 5 Minutes | 34 | 2.8% |
| 5 to 9 Minutes | 0 | 0.0% |
| 10 to 14 Minutes | 0 | 0.0% |
| 15 to 19 Minutes | 43 | 3.5% |
| 20 to 24 Minutes | 0 | 0.0% |
| 25 to 29 Minutes | 59 | 4.9% |
| 30 to 34 Minutes | 186 | 15.4% |
| 35 to 39 Minutes | 75 | 6.2% |
| 40 to 44 Minutes | 52 | 4.3% |
| 45 to 59 Minutes | 268 | 22.2% |
| 60 to 89 Minutes | 417 | 34.5% |
| 90 or more Minutes | 76 | 6.3% |
Commute Time by Sex in Shenandoah Farms
The most common commute times in Shenandoah Farms are 60 to 89 minutes (245 commuters, 29.7%) for males and 60 to 89 minutes (172 commuters, 44.8%) for females.
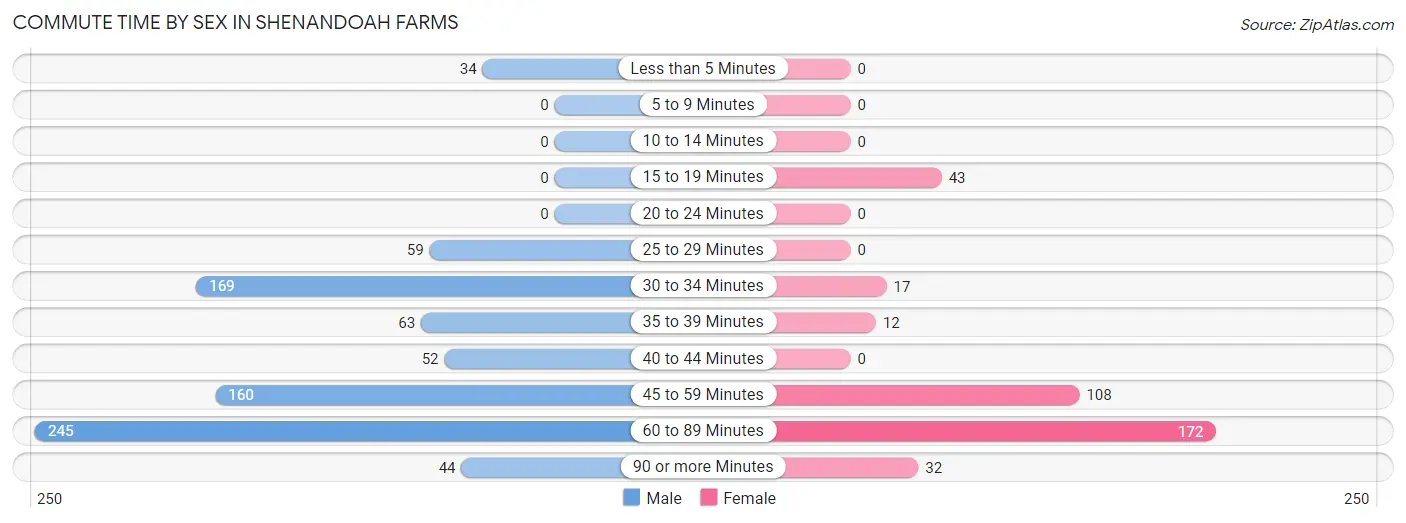
| Commute Time | Male | Female |
| Less than 5 Minutes | 34 (4.1%) | 0 (0.0%) |
| 5 to 9 Minutes | 0 (0.0%) | 0 (0.0%) |
| 10 to 14 Minutes | 0 (0.0%) | 0 (0.0%) |
| 15 to 19 Minutes | 0 (0.0%) | 43 (11.2%) |
| 20 to 24 Minutes | 0 (0.0%) | 0 (0.0%) |
| 25 to 29 Minutes | 59 (7.1%) | 0 (0.0%) |
| 30 to 34 Minutes | 169 (20.5%) | 17 (4.4%) |
| 35 to 39 Minutes | 63 (7.6%) | 12 (3.1%) |
| 40 to 44 Minutes | 52 (6.3%) | 0 (0.0%) |
| 45 to 59 Minutes | 160 (19.4%) | 108 (28.1%) |
| 60 to 89 Minutes | 245 (29.7%) | 172 (44.8%) |
| 90 or more Minutes | 44 (5.3%) | 32 (8.3%) |
Time of Departure to Work by Sex in Shenandoah Farms
The most frequent times of departure to work in Shenandoah Farms are 7:00 AM to 7:29 AM (212, 25.7%) for males and 6:30 AM to 6:59 AM (139, 36.2%) for females.
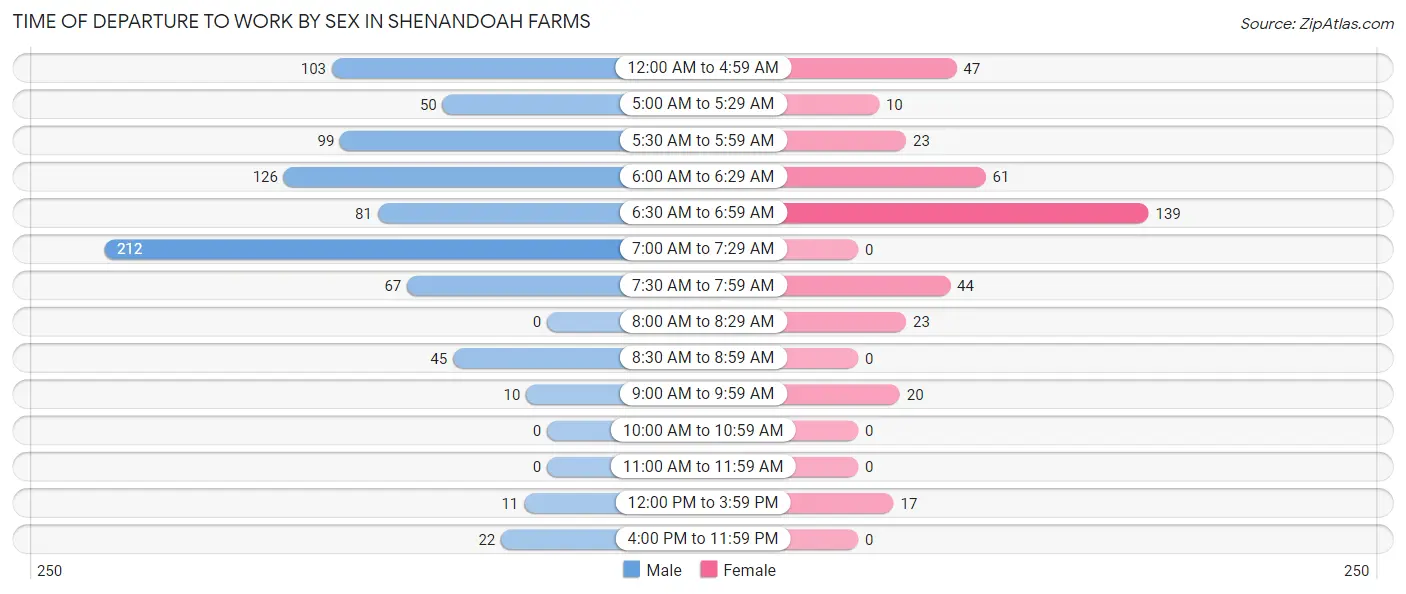
| Time of Departure | Male | Female |
| 12:00 AM to 4:59 AM | 103 (12.5%) | 47 (12.2%) |
| 5:00 AM to 5:29 AM | 50 (6.0%) | 10 (2.6%) |
| 5:30 AM to 5:59 AM | 99 (12.0%) | 23 (6.0%) |
| 6:00 AM to 6:29 AM | 126 (15.2%) | 61 (15.9%) |
| 6:30 AM to 6:59 AM | 81 (9.8%) | 139 (36.2%) |
| 7:00 AM to 7:29 AM | 212 (25.7%) | 0 (0.0%) |
| 7:30 AM to 7:59 AM | 67 (8.1%) | 44 (11.5%) |
| 8:00 AM to 8:29 AM | 0 (0.0%) | 23 (6.0%) |
| 8:30 AM to 8:59 AM | 45 (5.4%) | 0 (0.0%) |
| 9:00 AM to 9:59 AM | 10 (1.2%) | 20 (5.2%) |
| 10:00 AM to 10:59 AM | 0 (0.0%) | 0 (0.0%) |
| 11:00 AM to 11:59 AM | 0 (0.0%) | 0 (0.0%) |
| 12:00 PM to 3:59 PM | 11 (1.3%) | 17 (4.4%) |
| 4:00 PM to 11:59 PM | 22 (2.7%) | 0 (0.0%) |
| Total | 826 (100.0%) | 384 (100.0%) |
Housing Occupancy in Shenandoah Farms
Occupancy by Ownership in Shenandoah Farms
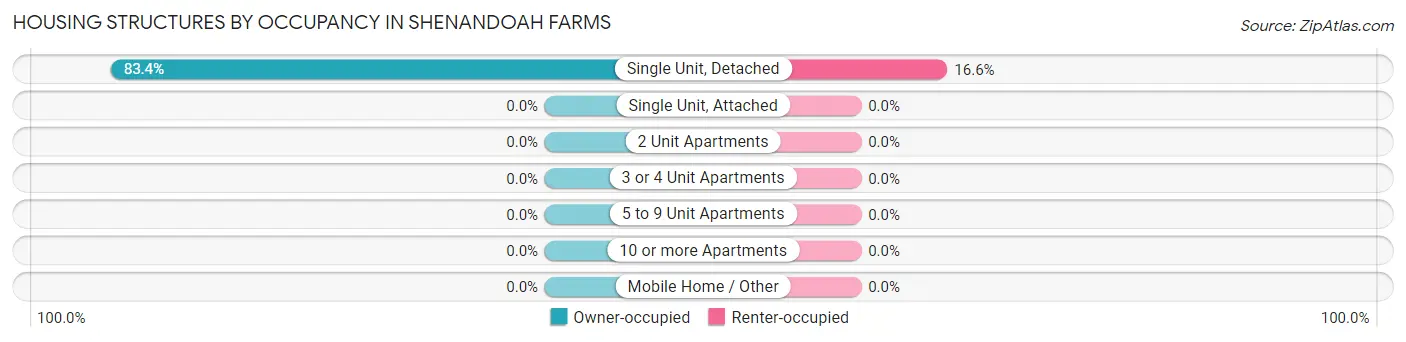
Of the total 1,470 dwellings in Shenandoah Farms, owner-occupied units account for 1,226 (83.4%), while renter-occupied units make up 244 (16.6%).
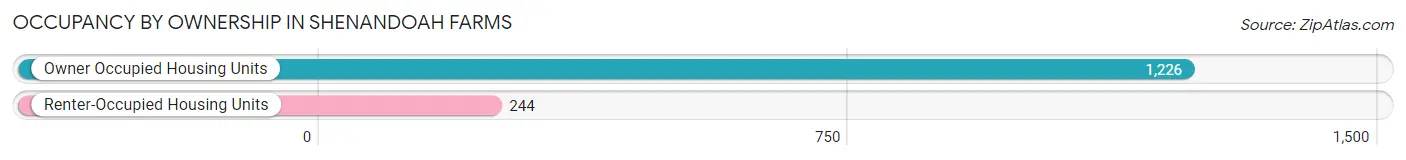
| Occupancy | # Housing Units | % Housing Units |
| Owner Occupied Housing Units | 1,226 | 83.4% |
| Renter-Occupied Housing Units | 244 | 16.6% |
| Total Occupied Housing Units | 1,470 | 100.0% |
Occupancy by Household Size in Shenandoah Farms
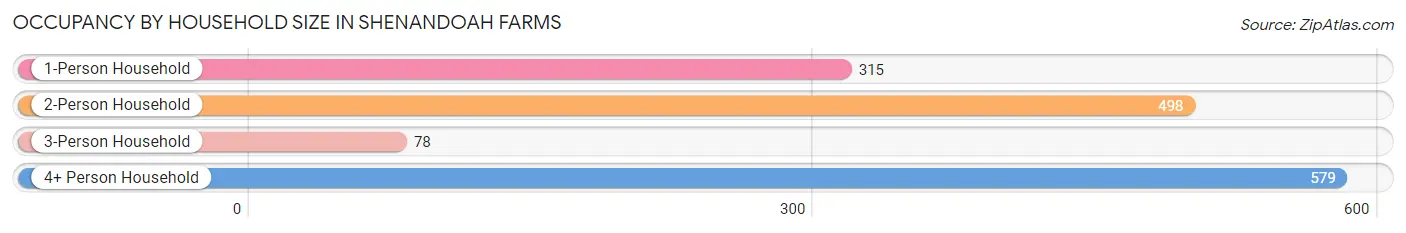
| Household Size | # Housing Units | % Housing Units |
| 1-Person Household | 315 | 21.4% |
| 2-Person Household | 498 | 33.9% |
| 3-Person Household | 78 | 5.3% |
| 4+ Person Household | 579 | 39.4% |
| Total Housing Units | 1,470 | 100.0% |
Occupancy by Ownership by Household Size in Shenandoah Farms
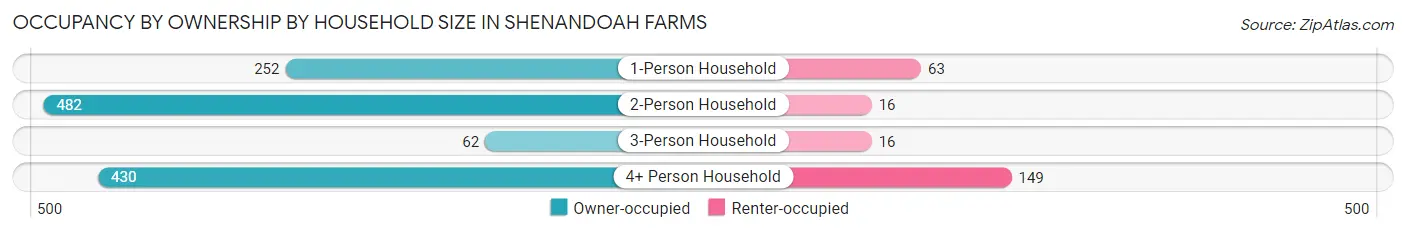
| Household Size | Owner-occupied | Renter-occupied |
| 1-Person Household | 252 (80.0%) | 63 (20.0%) |
| 2-Person Household | 482 (96.8%) | 16 (3.2%) |
| 3-Person Household | 62 (79.5%) | 16 (20.5%) |
| 4+ Person Household | 430 (74.3%) | 149 (25.7%) |
| Total Housing Units | 1,226 (83.4%) | 244 (16.6%) |
Occupancy by Educational Attainment in Shenandoah Farms
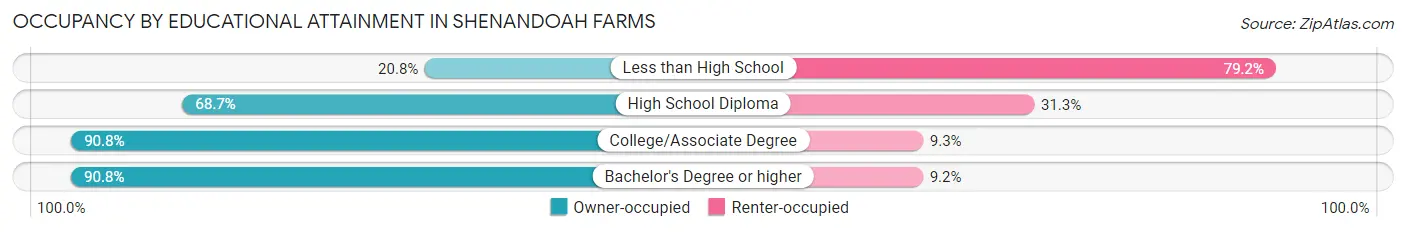
| Household Size | Owner-occupied | Renter-occupied |
| Less than High School | 16 (20.8%) | 61 (79.2%) |
| High School Diploma | 169 (68.7%) | 77 (31.3%) |
| College/Associate Degree | 736 (90.7%) | 75 (9.2%) |
| Bachelor's Degree or higher | 305 (90.8%) | 31 (9.2%) |
Occupancy by Age of Householder in Shenandoah Farms
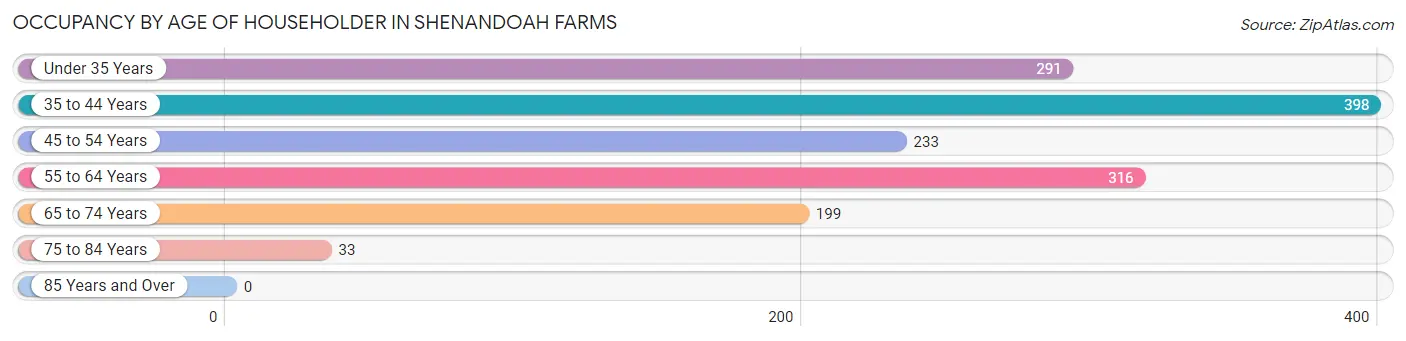
| Age Bracket | # Households | % Households |
| Under 35 Years | 291 | 19.8% |
| 35 to 44 Years | 398 | 27.1% |
| 45 to 54 Years | 233 | 15.9% |
| 55 to 64 Years | 316 | 21.5% |
| 65 to 74 Years | 199 | 13.5% |
| 75 to 84 Years | 33 | 2.2% |
| 85 Years and Over | 0 | 0.0% |
| Total | 1,470 | 100.0% |
Housing Finances in Shenandoah Farms
Median Income by Occupancy in Shenandoah Farms
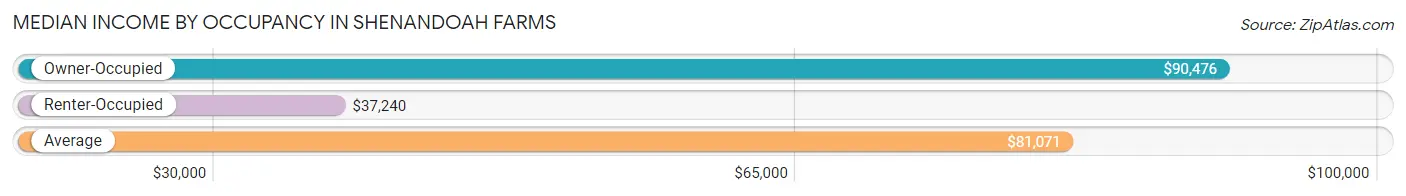
| Occupancy Type | # Households | Median Income |
| Owner-Occupied | 1,226 (83.4%) | $90,476 |
| Renter-Occupied | 244 (16.6%) | $37,240 |
| Average | 1,470 (100.0%) | $81,071 |
Occupancy by Householder Income Bracket in Shenandoah Farms
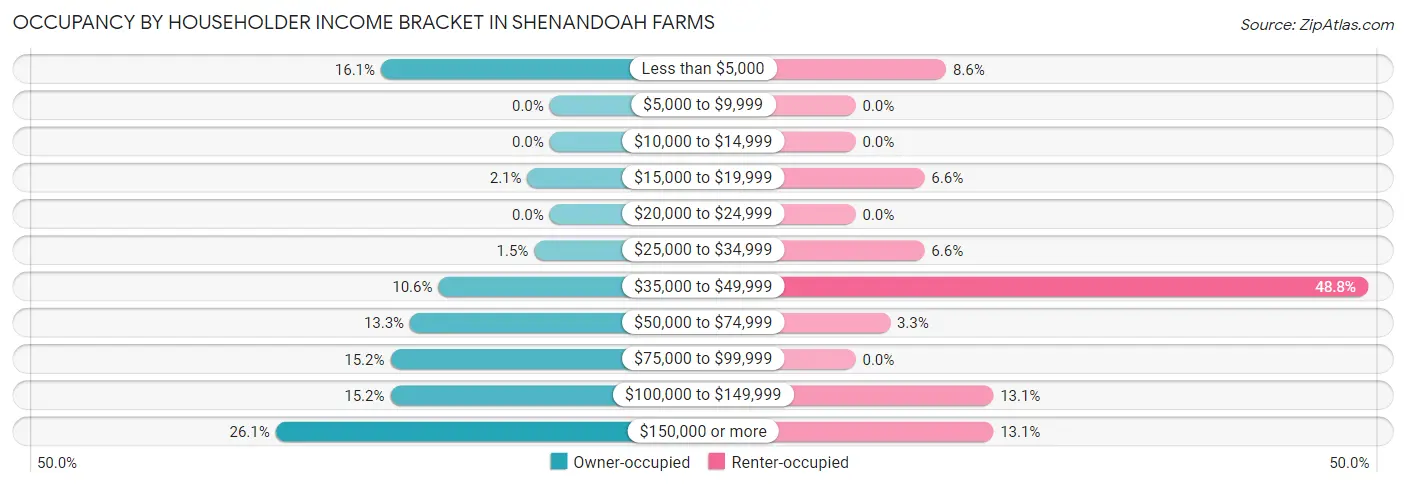
| Income Bracket | Owner-occupied | Renter-occupied |
| Less than $5,000 | 197 (16.1%) | 21 (8.6%) |
| $5,000 to $9,999 | 0 (0.0%) | 0 (0.0%) |
| $10,000 to $14,999 | 0 (0.0%) | 0 (0.0%) |
| $15,000 to $19,999 | 26 (2.1%) | 16 (6.6%) |
| $20,000 to $24,999 | 0 (0.0%) | 0 (0.0%) |
| $25,000 to $34,999 | 18 (1.5%) | 16 (6.6%) |
| $35,000 to $49,999 | 130 (10.6%) | 119 (48.8%) |
| $50,000 to $74,999 | 163 (13.3%) | 8 (3.3%) |
| $75,000 to $99,999 | 186 (15.2%) | 0 (0.0%) |
| $100,000 to $149,999 | 186 (15.2%) | 32 (13.1%) |
| $150,000 or more | 320 (26.1%) | 32 (13.1%) |
| Total | 1,226 (100.0%) | 244 (100.0%) |
Monthly Housing Cost Tiers in Shenandoah Farms
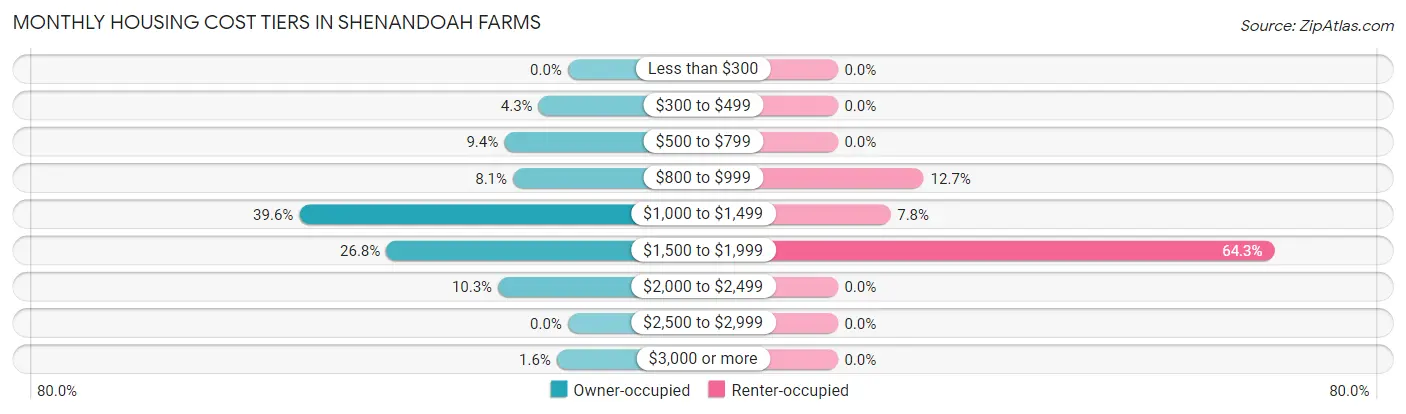
| Monthly Cost | Owner-occupied | Renter-occupied |
| Less than $300 | 0 (0.0%) | 0 (0.0%) |
| $300 to $499 | 53 (4.3%) | 0 (0.0%) |
| $500 to $799 | 115 (9.4%) | 0 (0.0%) |
| $800 to $999 | 99 (8.1%) | 31 (12.7%) |
| $1,000 to $1,499 | 485 (39.6%) | 19 (7.8%) |
| $1,500 to $1,999 | 328 (26.8%) | 157 (64.3%) |
| $2,000 to $2,499 | 126 (10.3%) | 0 (0.0%) |
| $2,500 to $2,999 | 0 (0.0%) | 0 (0.0%) |
| $3,000 or more | 20 (1.6%) | 0 (0.0%) |
| Total | 1,226 (100.0%) | 244 (100.0%) |
Physical Housing Characteristics in Shenandoah Farms
Housing Structures in Shenandoah Farms
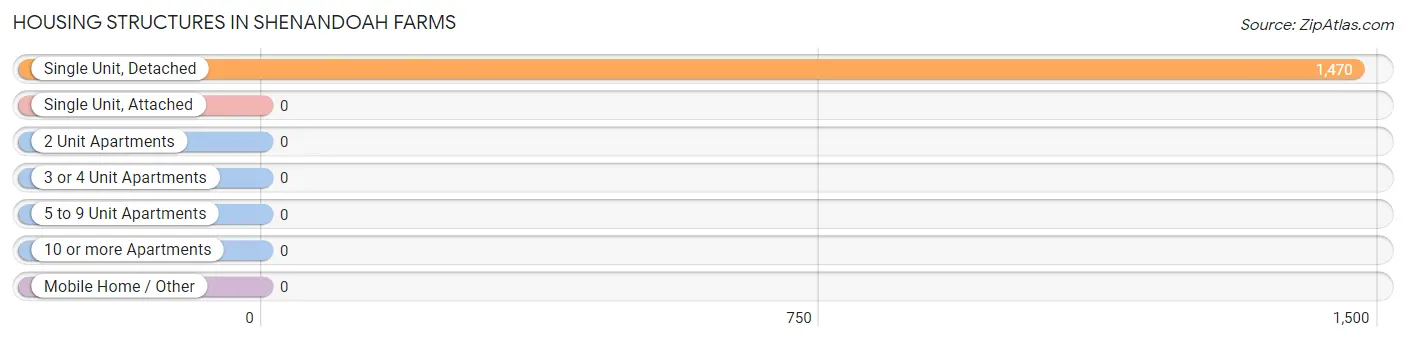
| Structure Type | # Housing Units | % Housing Units |
| Single Unit, Detached | 1,470 | 100.0% |
| Single Unit, Attached | 0 | 0.0% |
| 2 Unit Apartments | 0 | 0.0% |
| 3 or 4 Unit Apartments | 0 | 0.0% |
| 5 to 9 Unit Apartments | 0 | 0.0% |
| 10 or more Apartments | 0 | 0.0% |
| Mobile Home / Other | 0 | 0.0% |
| Total | 1,470 | 100.0% |
Housing Structures by Occupancy in Shenandoah Farms
| Structure Type | Owner-occupied | Renter-occupied |
| Single Unit, Detached | 1,226 (83.4%) | 244 (16.6%) |
| Single Unit, Attached | 0 (0.0%) | 0 (0.0%) |
| 2 Unit Apartments | 0 (0.0%) | 0 (0.0%) |
| 3 or 4 Unit Apartments | 0 (0.0%) | 0 (0.0%) |
| 5 to 9 Unit Apartments | 0 (0.0%) | 0 (0.0%) |
| 10 or more Apartments | 0 (0.0%) | 0 (0.0%) |
| Mobile Home / Other | 0 (0.0%) | 0 (0.0%) |
| Total | 1,226 (83.4%) | 244 (16.6%) |
Housing Structures by Number of Rooms in Shenandoah Farms
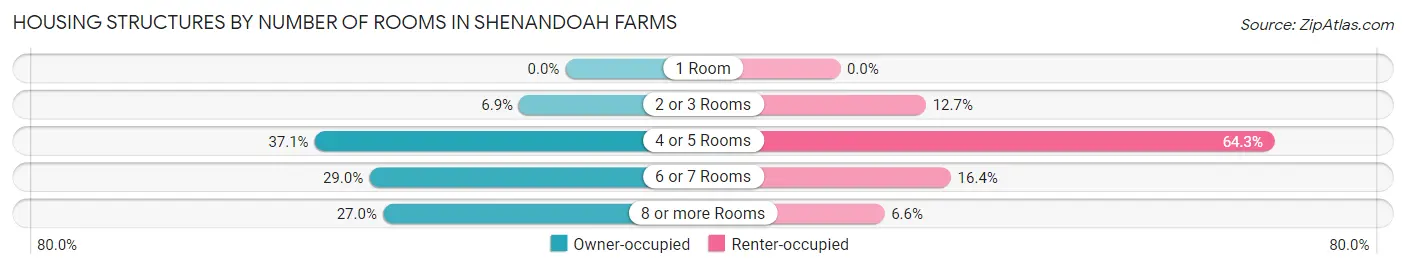
| Number of Rooms | Owner-occupied | Renter-occupied |
| 1 Room | 0 (0.0%) | 0 (0.0%) |
| 2 or 3 Rooms | 84 (6.9%) | 31 (12.7%) |
| 4 or 5 Rooms | 455 (37.1%) | 157 (64.3%) |
| 6 or 7 Rooms | 356 (29.0%) | 40 (16.4%) |
| 8 or more Rooms | 331 (27.0%) | 16 (6.6%) |
| Total | 1,226 (100.0%) | 244 (100.0%) |
Housing Structure by Heating Type in Shenandoah Farms
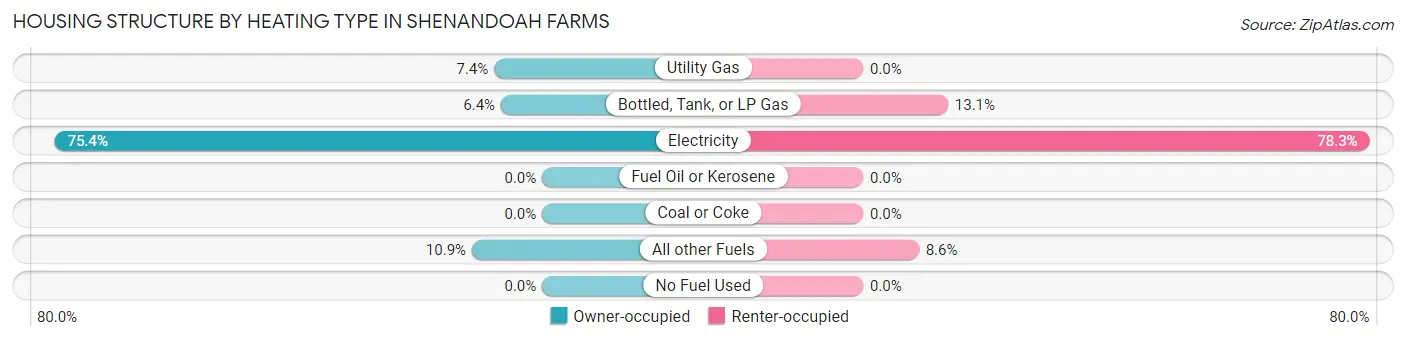
| Heating Type | Owner-occupied | Renter-occupied |
| Utility Gas | 91 (7.4%) | 0 (0.0%) |
| Bottled, Tank, or LP Gas | 78 (6.4%) | 32 (13.1%) |
| Electricity | 924 (75.4%) | 191 (78.3%) |
| Fuel Oil or Kerosene | 0 (0.0%) | 0 (0.0%) |
| Coal or Coke | 0 (0.0%) | 0 (0.0%) |
| All other Fuels | 133 (10.8%) | 21 (8.6%) |
| No Fuel Used | 0 (0.0%) | 0 (0.0%) |
| Total | 1,226 (100.0%) | 244 (100.0%) |
Household Vehicle Usage in Shenandoah Farms
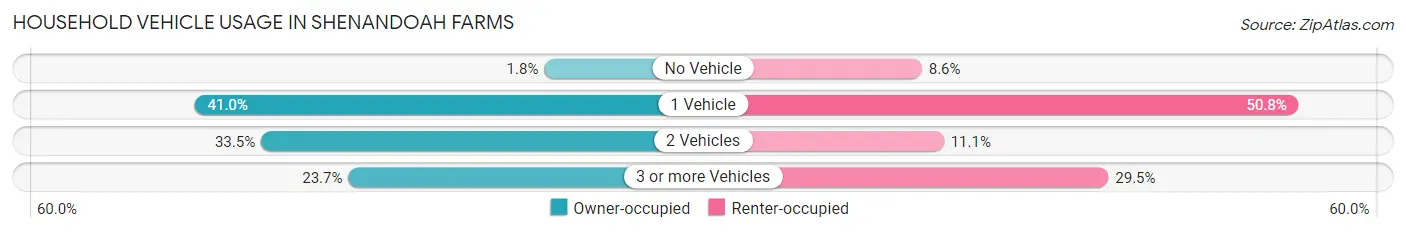
| Vehicles per Household | Owner-occupied | Renter-occupied |
| No Vehicle | 22 (1.8%) | 21 (8.6%) |
| 1 Vehicle | 502 (40.9%) | 124 (50.8%) |
| 2 Vehicles | 411 (33.5%) | 27 (11.1%) |
| 3 or more Vehicles | 291 (23.7%) | 72 (29.5%) |
| Total | 1,226 (100.0%) | 244 (100.0%) |
Real Estate & Mortgages in Shenandoah Farms
Real Estate and Mortgage Overview in Shenandoah Farms
| Characteristic | Without Mortgage | With Mortgage |
| Housing Units | 107 | 1,119 |
| Median Property Value | $233,500 | $269,400 |
| Median Household Income | - | - |
| Monthly Housing Costs | $502 | $20 |
| Real Estate Taxes | $1,750 | $32 |
Property Value by Mortgage Status in Shenandoah Farms
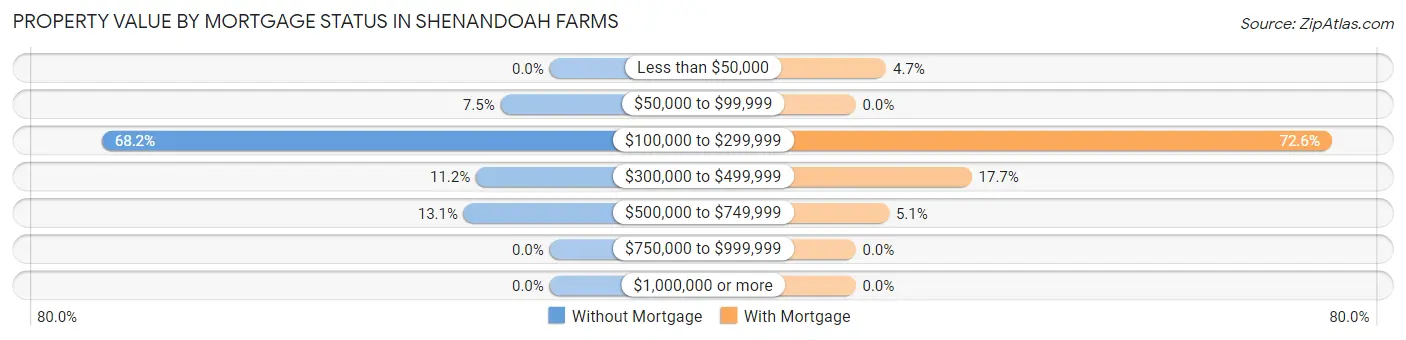
| Property Value | Without Mortgage | With Mortgage |
| Less than $50,000 | 0 (0.0%) | 52 (4.6%) |
| $50,000 to $99,999 | 8 (7.5%) | 0 (0.0%) |
| $100,000 to $299,999 | 73 (68.2%) | 812 (72.6%) |
| $300,000 to $499,999 | 12 (11.2%) | 198 (17.7%) |
| $500,000 to $749,999 | 14 (13.1%) | 57 (5.1%) |
| $750,000 to $999,999 | 0 (0.0%) | 0 (0.0%) |
| $1,000,000 or more | 0 (0.0%) | 0 (0.0%) |
| Total | 107 (100.0%) | 1,119 (100.0%) |
Household Income by Mortgage Status in Shenandoah Farms
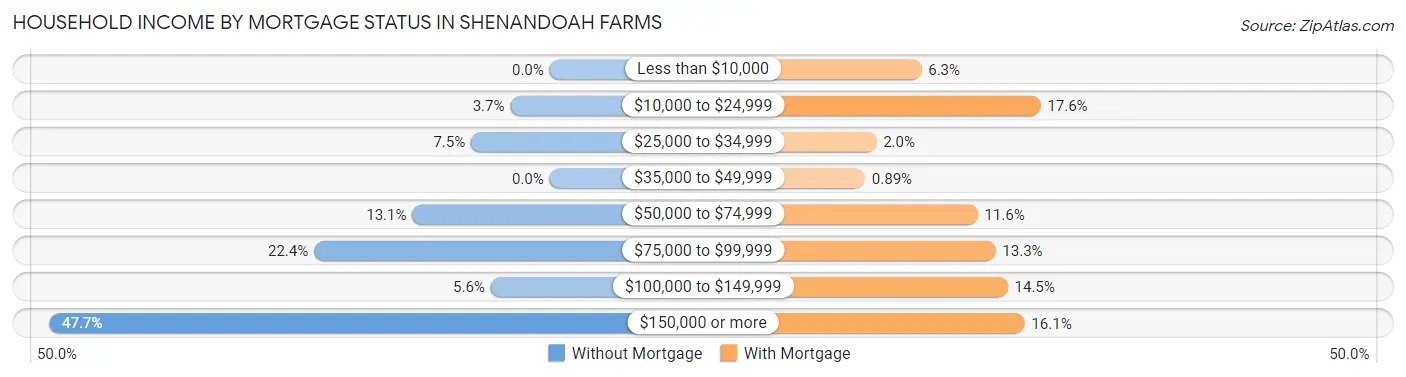
| Household Income | Without Mortgage | With Mortgage |
| Less than $10,000 | 0 (0.0%) | 70 (6.3%) |
| $10,000 to $24,999 | 4 (3.7%) | 197 (17.6%) |
| $25,000 to $34,999 | 8 (7.5%) | 22 (2.0%) |
| $35,000 to $49,999 | 0 (0.0%) | 10 (0.9%) |
| $50,000 to $74,999 | 14 (13.1%) | 130 (11.6%) |
| $75,000 to $99,999 | 24 (22.4%) | 149 (13.3%) |
| $100,000 to $149,999 | 6 (5.6%) | 162 (14.5%) |
| $150,000 or more | 51 (47.7%) | 180 (16.1%) |
| Total | 107 (100.0%) | 1,119 (100.0%) |
Property Value to Household Income Ratio in Shenandoah Farms
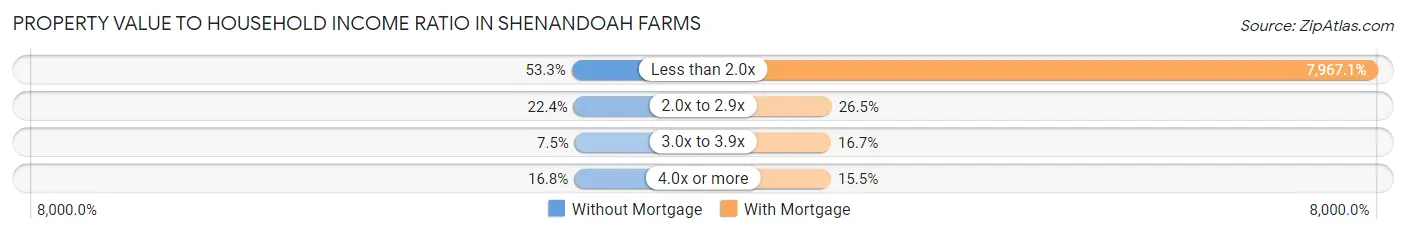
| Value-to-Income Ratio | Without Mortgage | With Mortgage |
| Less than 2.0x | 57 (53.3%) | 89,152 (7,967.1%) |
| 2.0x to 2.9x | 24 (22.4%) | 297 (26.5%) |
| 3.0x to 3.9x | 8 (7.5%) | 187 (16.7%) |
| 4.0x or more | 18 (16.8%) | 173 (15.5%) |
| Total | 107 (100.0%) | 1,119 (100.0%) |
Real Estate Taxes by Mortgage Status in Shenandoah Farms
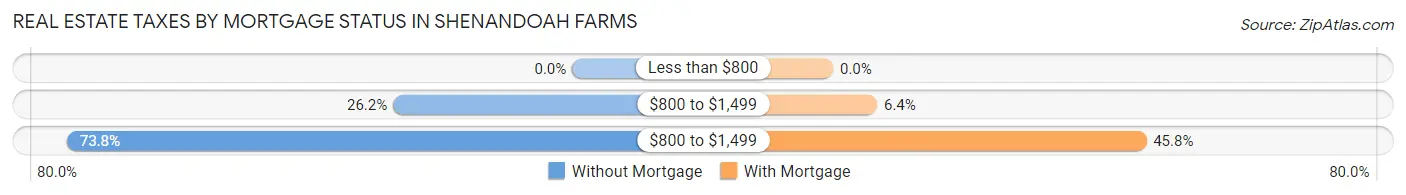
| Property Taxes | Without Mortgage | With Mortgage |
| Less than $800 | 0 (0.0%) | 0 (0.0%) |
| $800 to $1,499 | 28 (26.2%) | 72 (6.4%) |
| $800 to $1,499 | 79 (73.8%) | 512 (45.8%) |
| Total | 107 (100.0%) | 1,119 (100.0%) |
Health & Disability in Shenandoah Farms
Health Insurance Coverage by Age in Shenandoah Farms
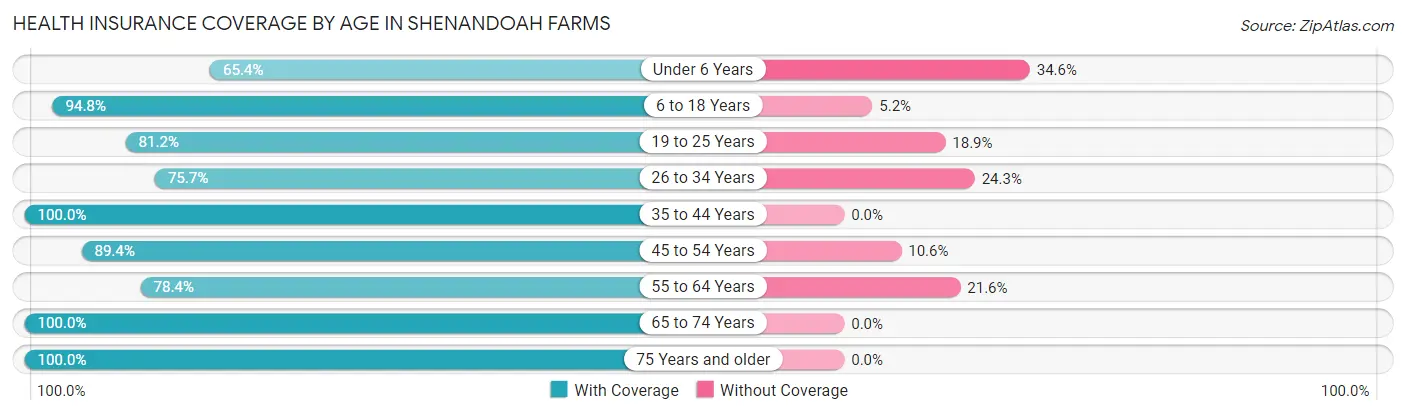
| Age Bracket | With Coverage | Without Coverage |
| Under 6 Years | 378 (65.4%) | 200 (34.6%) |
| 6 to 18 Years | 435 (94.8%) | 24 (5.2%) |
| 19 to 25 Years | 297 (81.1%) | 69 (18.9%) |
| 26 to 34 Years | 336 (75.7%) | 108 (24.3%) |
| 35 to 44 Years | 699 (100.0%) | 0 (0.0%) |
| 45 to 54 Years | 395 (89.4%) | 47 (10.6%) |
| 55 to 64 Years | 478 (78.4%) | 132 (21.6%) |
| 65 to 74 Years | 286 (100.0%) | 0 (0.0%) |
| 75 Years and older | 42 (100.0%) | 0 (0.0%) |
| Total | 3,346 (85.2%) | 580 (14.8%) |
Health Insurance Coverage by Citizenship Status in Shenandoah Farms
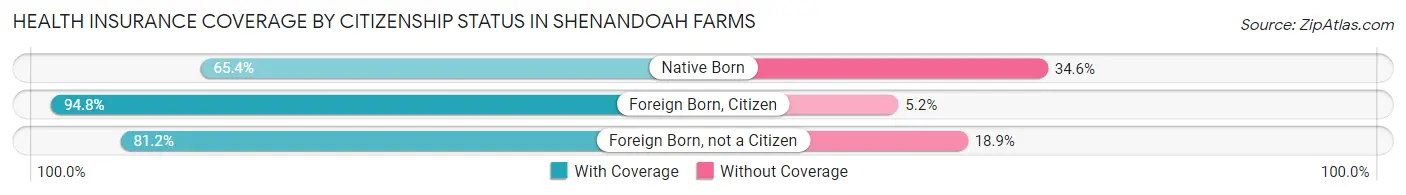
| Citizenship Status | With Coverage | Without Coverage |
| Native Born | 378 (65.4%) | 200 (34.6%) |
| Foreign Born, Citizen | 435 (94.8%) | 24 (5.2%) |
| Foreign Born, not a Citizen | 297 (81.1%) | 69 (18.9%) |
Health Insurance Coverage by Household Income in Shenandoah Farms
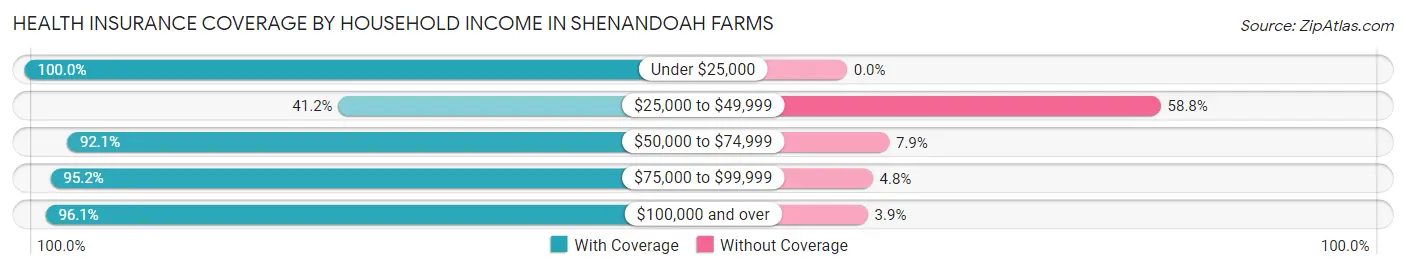
| Household Income | With Coverage | Without Coverage |
| Under $25,000 | 670 (100.0%) | 0 (0.0%) |
| $25,000 to $49,999 | 321 (41.2%) | 458 (58.8%) |
| $50,000 to $74,999 | 489 (92.1%) | 42 (7.9%) |
| $75,000 to $99,999 | 393 (95.2%) | 20 (4.8%) |
| $100,000 and over | 1,473 (96.1%) | 60 (3.9%) |
Public vs Private Health Insurance Coverage by Age in Shenandoah Farms
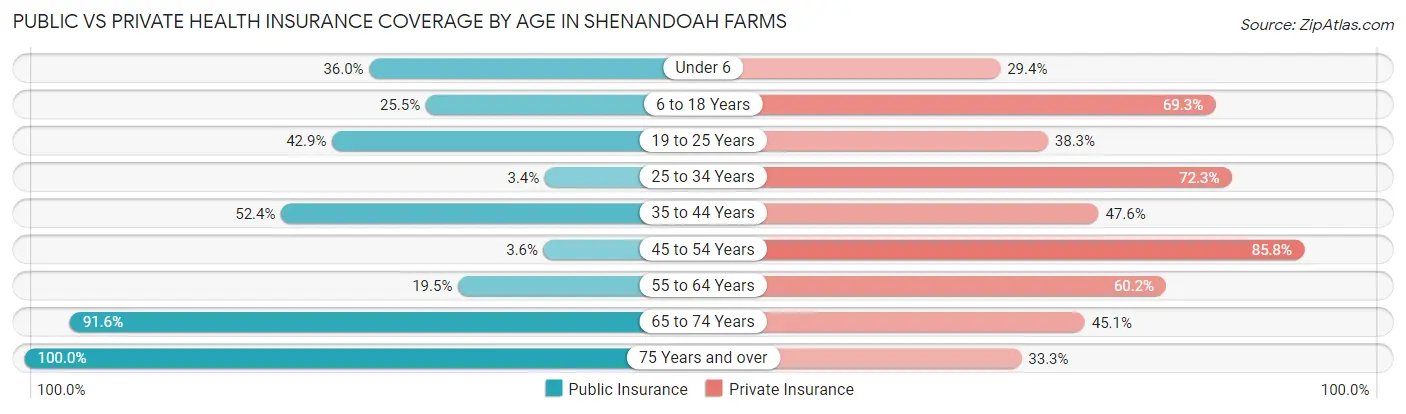
| Age Bracket | Public Insurance | Private Insurance |
| Under 6 | 208 (36.0%) | 170 (29.4%) |
| 6 to 18 Years | 117 (25.5%) | 318 (69.3%) |
| 19 to 25 Years | 157 (42.9%) | 140 (38.3%) |
| 25 to 34 Years | 15 (3.4%) | 321 (72.3%) |
| 35 to 44 Years | 366 (52.4%) | 333 (47.6%) |
| 45 to 54 Years | 16 (3.6%) | 379 (85.8%) |
| 55 to 64 Years | 119 (19.5%) | 367 (60.2%) |
| 65 to 74 Years | 262 (91.6%) | 129 (45.1%) |
| 75 Years and over | 42 (100.0%) | 14 (33.3%) |
| Total | 1,302 (33.2%) | 2,171 (55.3%) |
Disability Status by Sex by Age in Shenandoah Farms
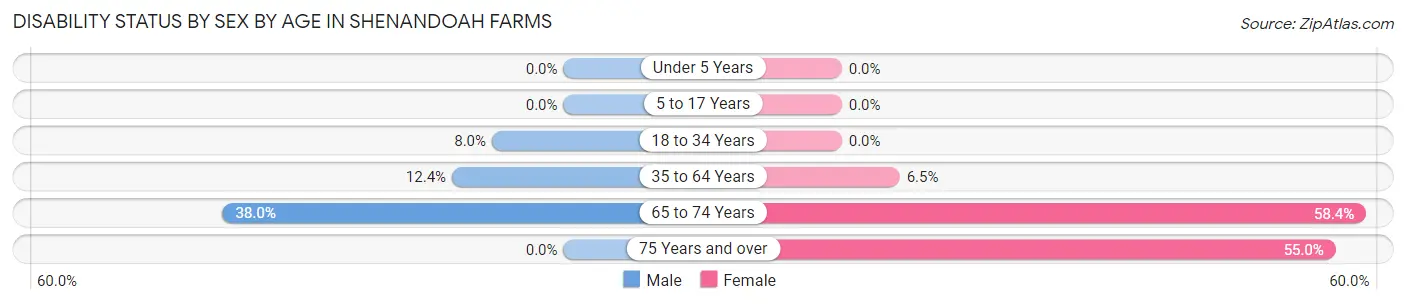
| Age Bracket | Male | Female |
| Under 5 Years | 0 (0.0%) | 0 (0.0%) |
| 5 to 17 Years | 0 (0.0%) | 0 (0.0%) |
| 18 to 34 Years | 37 (8.0%) | 0 (0.0%) |
| 35 to 64 Years | 125 (12.4%) | 48 (6.5%) |
| 65 to 74 Years | 52 (38.0%) | 87 (58.4%) |
| 75 Years and over | 0 (0.0%) | 11 (55.0%) |
Disability Class by Sex by Age in Shenandoah Farms
Disability Class: Hearing Difficulty
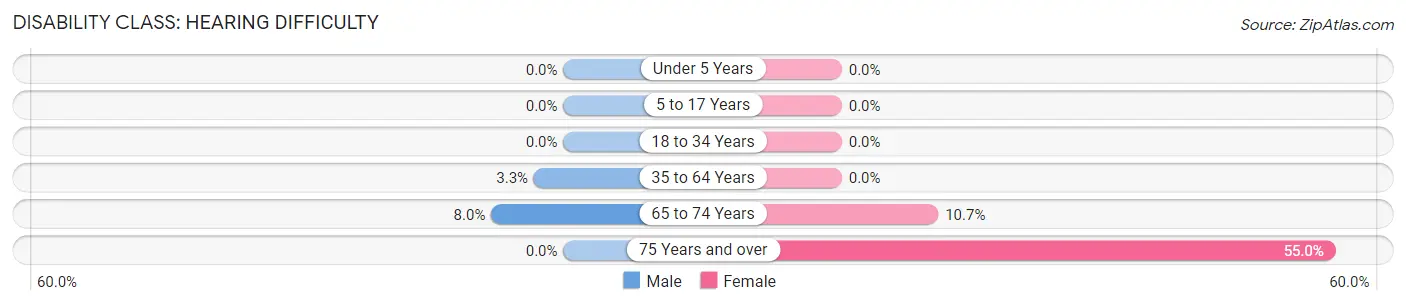
| Age Bracket | Male | Female |
| Under 5 Years | 0 (0.0%) | 0 (0.0%) |
| 5 to 17 Years | 0 (0.0%) | 0 (0.0%) |
| 18 to 34 Years | 0 (0.0%) | 0 (0.0%) |
| 35 to 64 Years | 33 (3.3%) | 0 (0.0%) |
| 65 to 74 Years | 11 (8.0%) | 16 (10.7%) |
| 75 Years and over | 0 (0.0%) | 11 (55.0%) |
Disability Class: Vision Difficulty
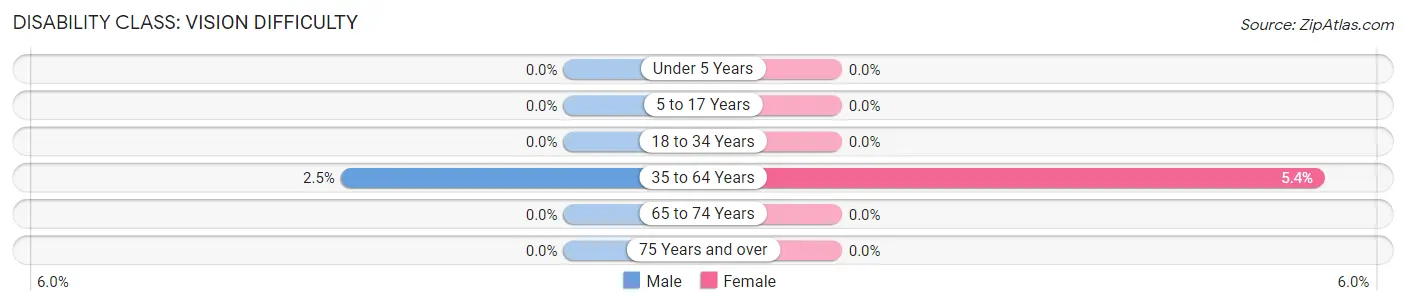
| Age Bracket | Male | Female |
| Under 5 Years | 0 (0.0%) | 0 (0.0%) |
| 5 to 17 Years | 0 (0.0%) | 0 (0.0%) |
| 18 to 34 Years | 0 (0.0%) | 0 (0.0%) |
| 35 to 64 Years | 25 (2.5%) | 40 (5.4%) |
| 65 to 74 Years | 0 (0.0%) | 0 (0.0%) |
| 75 Years and over | 0 (0.0%) | 0 (0.0%) |
Disability Class: Cognitive Difficulty
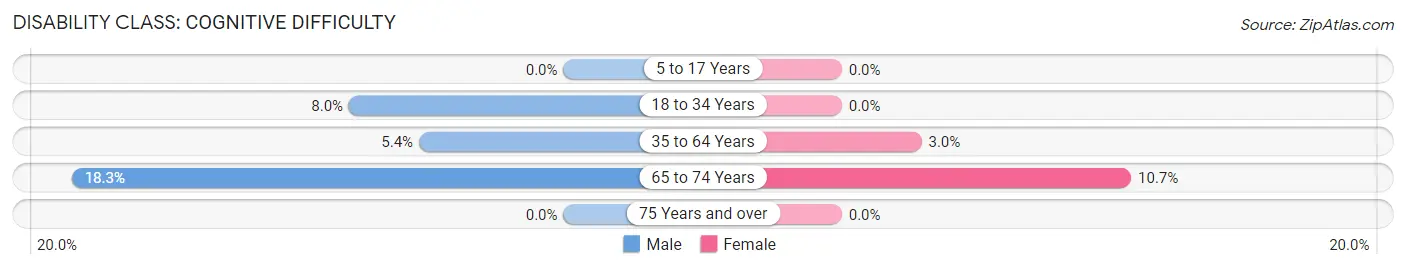
| Age Bracket | Male | Female |
| 5 to 17 Years | 0 (0.0%) | 0 (0.0%) |
| 18 to 34 Years | 37 (8.0%) | 0 (0.0%) |
| 35 to 64 Years | 54 (5.4%) | 22 (3.0%) |
| 65 to 74 Years | 25 (18.2%) | 16 (10.7%) |
| 75 Years and over | 0 (0.0%) | 0 (0.0%) |
Disability Class: Ambulatory Difficulty
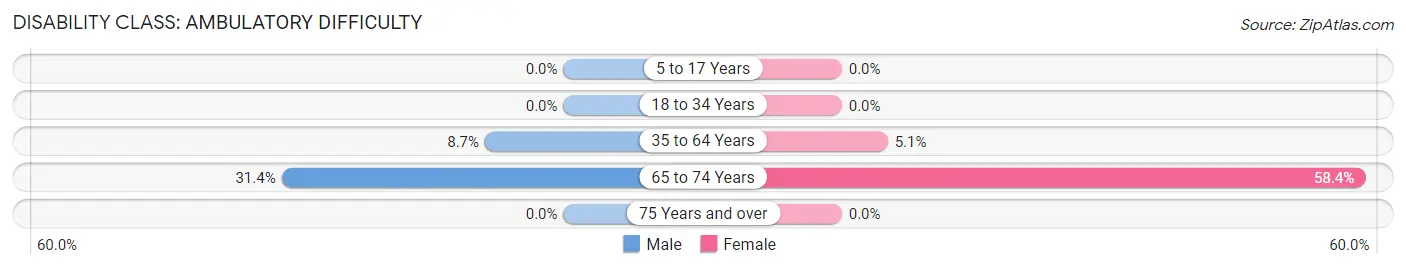
| Age Bracket | Male | Female |
| 5 to 17 Years | 0 (0.0%) | 0 (0.0%) |
| 18 to 34 Years | 0 (0.0%) | 0 (0.0%) |
| 35 to 64 Years | 88 (8.7%) | 38 (5.1%) |
| 65 to 74 Years | 43 (31.4%) | 87 (58.4%) |
| 75 Years and over | 0 (0.0%) | 0 (0.0%) |
Disability Class: Self-Care Difficulty
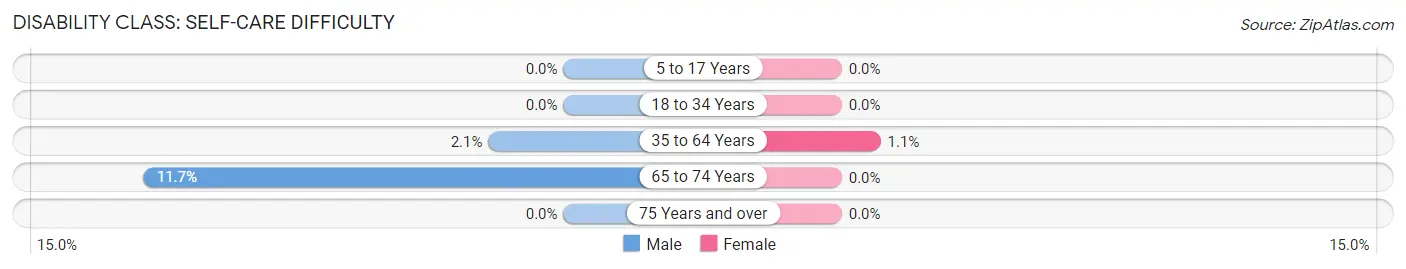
| Age Bracket | Male | Female |
| 5 to 17 Years | 0 (0.0%) | 0 (0.0%) |
| 18 to 34 Years | 0 (0.0%) | 0 (0.0%) |
| 35 to 64 Years | 21 (2.1%) | 8 (1.1%) |
| 65 to 74 Years | 16 (11.7%) | 0 (0.0%) |
| 75 Years and over | 0 (0.0%) | 0 (0.0%) |
Technology Access in Shenandoah Farms
Computing Device Access in Shenandoah Farms
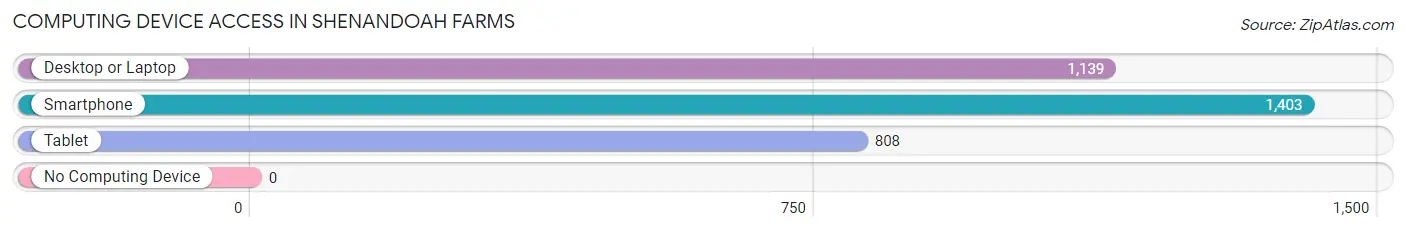
| Device Type | # Households | % Households |
| Desktop or Laptop | 1,139 | 77.5% |
| Smartphone | 1,403 | 95.4% |
| Tablet | 808 | 55.0% |
| No Computing Device | 0 | 0.0% |
| Total | 1,470 | 100.0% |
Internet Access in Shenandoah Farms
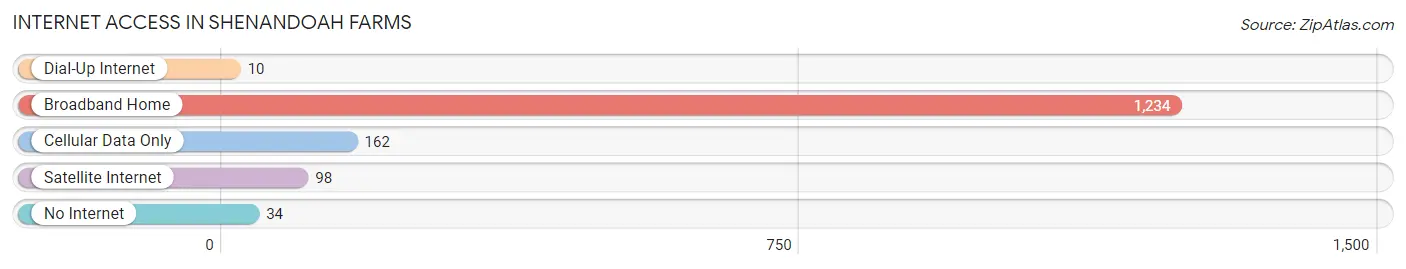
| Internet Type | # Households | % Households |
| Dial-Up Internet | 10 | 0.7% |
| Broadband Home | 1,234 | 84.0% |
| Cellular Data Only | 162 | 11.0% |
| Satellite Internet | 98 | 6.7% |
| No Internet | 34 | 2.3% |
| Total | 1,470 | 100.0% |
Shenandoah Farms Summary
Shenandoah Farms is a small unincorporated community located in Loudoun County, Virginia. It is situated in the foothills of the Blue Ridge Mountains, approximately 30 miles west of Washington, D.C. The community is home to a diverse population of approximately 1,000 people, and is known for its rural charm and scenic beauty.
History
Shenandoah Farms was first settled in the late 1700s by German and Swiss immigrants. The area was originally known as “The Farms” due to its agricultural nature. In the early 1800s, the area was renamed “Shenandoah Farms” in honor of the Shenandoah Valley, which lies to the west.
The community was largely agricultural until the mid-1900s, when the area began to experience rapid growth due to its proximity to Washington, D.C. In the 1950s, the area was annexed by Loudoun County, and the population began to increase.
Geography
Shenandoah Farms is located in the foothills of the Blue Ridge Mountains, approximately 30 miles west of Washington, D.C. The community is situated in a rural area, and is surrounded by rolling hills and farmland. The area is known for its scenic beauty, and is home to a variety of wildlife, including deer, foxes, and wild turkeys.
Economy
Shenandoah Farms is largely a residential community, and the majority of its residents are employed in the nearby cities of Washington, D.C. and Leesburg. The area is also home to a number of small businesses, including restaurants, shops, and farms.
Demographics
As of the 2010 census, the population of Shenandoah Farms was 1,000. The racial makeup of the community was 94.2% White, 2.2% African American, 0.7% Asian, 0.3% Native American, and 2.6% from other races. The median household income was $90,000, and the median age was 40.
Shenandoah Farms is a small, rural community with a diverse population and a rich history. The area is known for its scenic beauty and rural charm, and is a popular destination for outdoor enthusiasts. The community is home to a variety of businesses, and is a popular destination for those seeking a quiet, rural lifestyle.
Common Questions
What is Per Capita Income in Shenandoah Farms?
Per Capita income in Shenandoah Farms is $36,703.
What is the Median Family Income in Shenandoah Farms?
Median Family Income in Shenandoah Farms is $64,205.
What is the Median Household income in Shenandoah Farms?
Median Household Income in Shenandoah Farms is $81,071.
What is Income or Wage Gap in Shenandoah Farms?
Income or Wage Gap in Shenandoah Farms is 44.7%.
Women in Shenandoah Farms earn 55.3 cents for every dollar earned by a man.
What is Inequality or Gini Index in Shenandoah Farms?
Inequality or Gini Index in Shenandoah Farms is 0.45.
What is the Total Population of Shenandoah Farms?
Total Population of Shenandoah Farms is 3,926.
What is the Total Male Population of Shenandoah Farms?
Total Male Population of Shenandoah Farms is 2,220.
What is the Total Female Population of Shenandoah Farms?
Total Female Population of Shenandoah Farms is 1,706.
What is the Ratio of Males per 100 Females in Shenandoah Farms?
There are 130.13 Males per 100 Females in Shenandoah Farms.
What is the Ratio of Females per 100 Males in Shenandoah Farms?
There are 76.85 Females per 100 Males in Shenandoah Farms.
What is the Median Population Age in Shenandoah Farms?
Median Population Age in Shenandoah Farms is 35.5 Years.
What is the Average Family Size in Shenandoah Farms
Average Family Size in Shenandoah Farms is 3.1 People.
What is the Average Household Size in Shenandoah Farms
Average Household Size in Shenandoah Farms is 2.7 People.
How Large is the Labor Force in Shenandoah Farms?
There are 1,646 People in the Labor Forcein in Shenandoah Farms.
What is the Percentage of People in the Labor Force in Shenandoah Farms?
56.1% of People are in the Labor Force in Shenandoah Farms.
What is the Unemployment Rate in Shenandoah Farms?
Unemployment Rate in Shenandoah Farms is 6.4%.