Basye, VA Map & Demographics
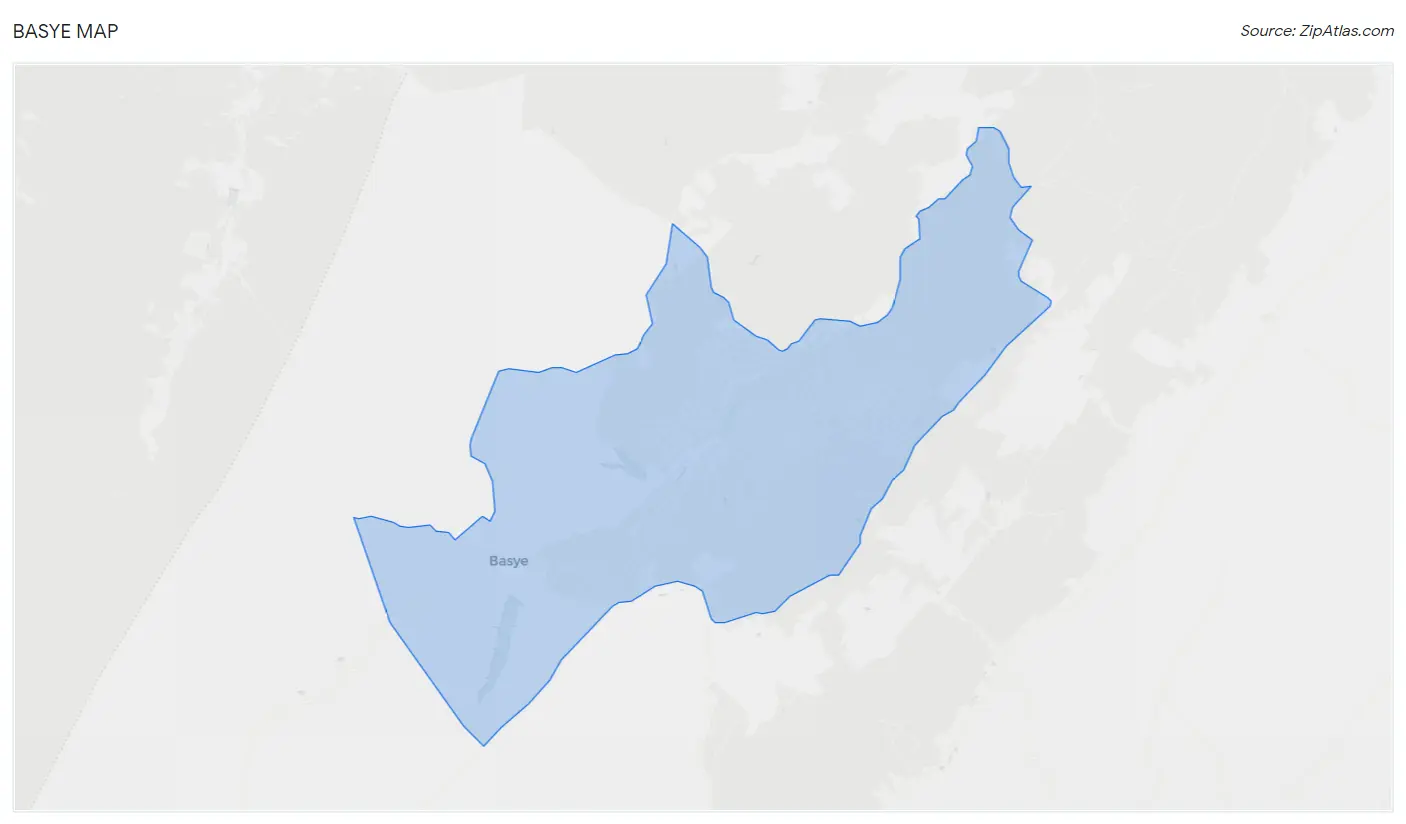
Basye Map
Basye Overview
$42,148
PER CAPITA INCOME
$86,028
AVG HOUSEHOLD INCOME
39.4%
WAGE / INCOME GAP [ % ]
60.6¢/ $1
WAGE / INCOME GAP [ $ ]
0.42
INEQUALITY / GINI INDEX
1,341
TOTAL POPULATION
693
MALE POPULATION
648
FEMALE POPULATION
106.94
MALES / 100 FEMALES
93.51
FEMALES / 100 MALES
47.0
MEDIAN AGE
4.1
AVG FAMILY SIZE
3.0
AVG HOUSEHOLD SIZE
640
LABOR FORCE [ PEOPLE ]
56.2%
PERCENT IN LABOR FORCE
Basye Zip Codes
Basye Area Codes
Income in Basye
Income Overview in Basye
| Characteristic | Number | Measure |
| Per Capita Income | 1,341 | $42,148 |
| Median Family Income | 262 | $0 |
| Mean Family Income | 262 | $126,421 |
| Median Household Income | 451 | $86,028 |
| Mean Household Income | 451 | $109,823 |
| Income Deficit | 262 | $0 |
| Wage / Income Gap (%) | 1,341 | 39.43% |
| Wage / Income Gap ($) | 1,341 | 60.57¢ per $1 |
| Gini / Inequality Index | 1,341 | 0.42 |
Earnings by Sex in Basye
Average Earnings in Basye are $42,955, $51,591 for men and $31,250 for women, a difference of 39.4%.
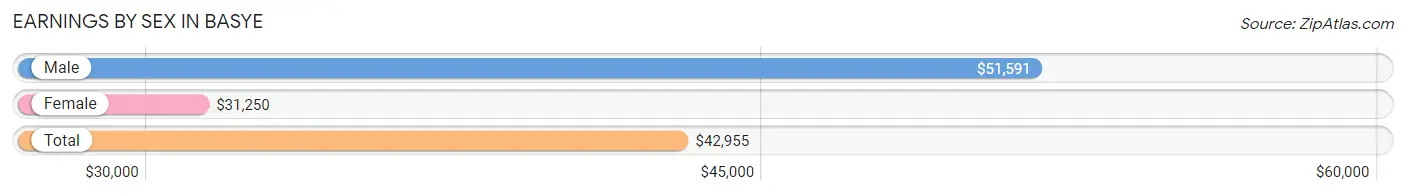
| Sex | Number | Average Earnings |
| Male | 370 (54.4%) | $51,591 |
| Female | 310 (45.6%) | $31,250 |
| Total | 680 (100.0%) | $42,955 |
Earnings by Sex by Income Bracket in Basye
The most common earnings brackets in Basye are $100,000+ for men (92 | 24.9%) and $22,500 to $24,999 for women (91 | 29.3%).
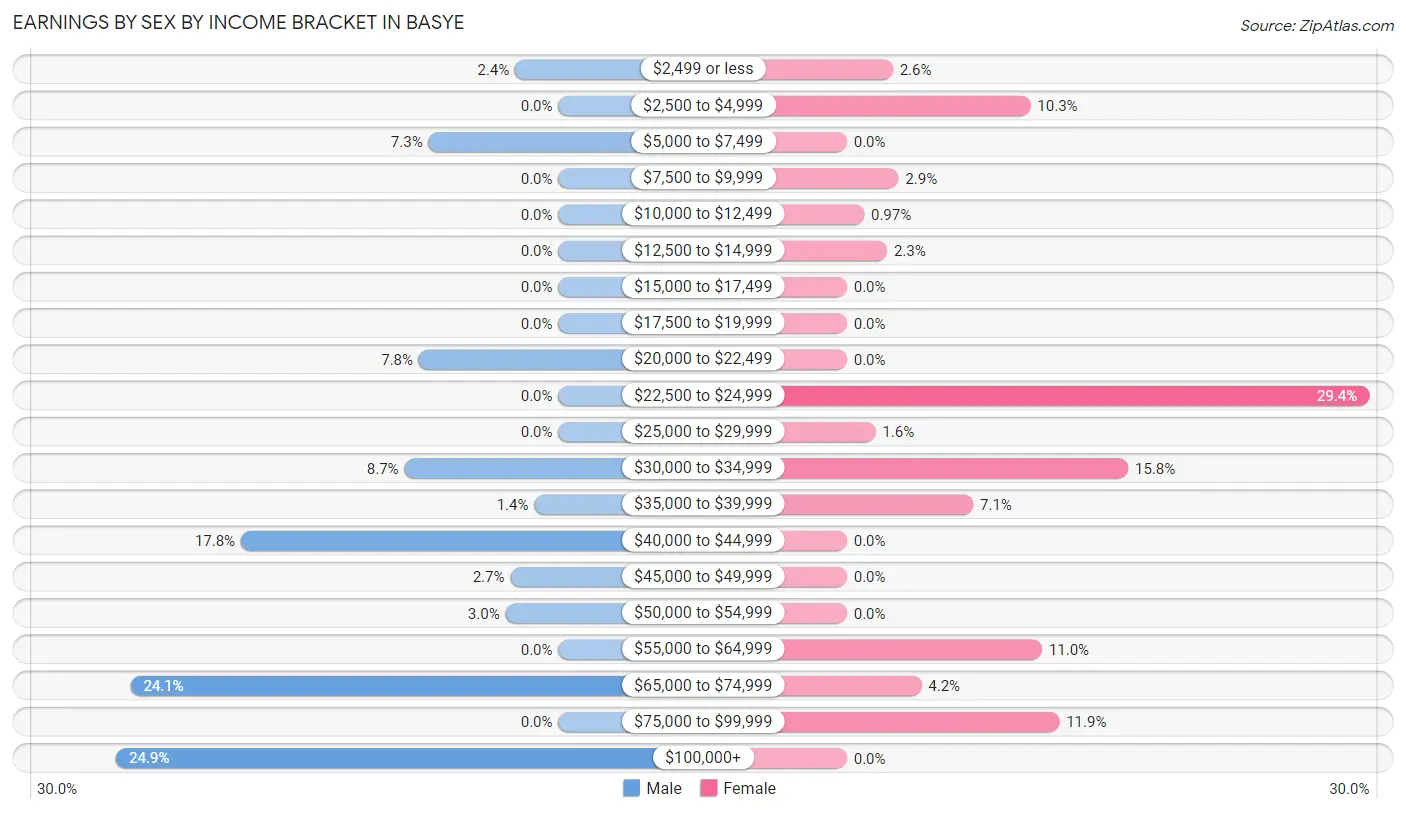
| Income | Male | Female |
| $2,499 or less | 9 (2.4%) | 8 (2.6%) |
| $2,500 to $4,999 | 0 (0.0%) | 32 (10.3%) |
| $5,000 to $7,499 | 27 (7.3%) | 0 (0.0%) |
| $7,500 to $9,999 | 0 (0.0%) | 9 (2.9%) |
| $10,000 to $12,499 | 0 (0.0%) | 3 (1.0%) |
| $12,500 to $14,999 | 0 (0.0%) | 7 (2.3%) |
| $15,000 to $17,499 | 0 (0.0%) | 0 (0.0%) |
| $17,500 to $19,999 | 0 (0.0%) | 0 (0.0%) |
| $20,000 to $22,499 | 29 (7.8%) | 0 (0.0%) |
| $22,500 to $24,999 | 0 (0.0%) | 91 (29.3%) |
| $25,000 to $29,999 | 0 (0.0%) | 5 (1.6%) |
| $30,000 to $34,999 | 32 (8.6%) | 49 (15.8%) |
| $35,000 to $39,999 | 5 (1.3%) | 22 (7.1%) |
| $40,000 to $44,999 | 66 (17.8%) | 0 (0.0%) |
| $45,000 to $49,999 | 10 (2.7%) | 0 (0.0%) |
| $50,000 to $54,999 | 11 (3.0%) | 0 (0.0%) |
| $55,000 to $64,999 | 0 (0.0%) | 34 (11.0%) |
| $65,000 to $74,999 | 89 (24.0%) | 13 (4.2%) |
| $75,000 to $99,999 | 0 (0.0%) | 37 (11.9%) |
| $100,000+ | 92 (24.9%) | 0 (0.0%) |
| Total | 370 (100.0%) | 310 (100.0%) |
Earnings by Sex by Educational Attainment in Basye
Average earnings in Basye are $65,267 for men and $34,694 for women, a difference of 46.8%. Men with an educational attainment of high school diploma enjoy the highest average annual earnings of $66,545, while those with college or associate's degree education earn the least with $33,008. Women with an educational attainment of bachelor's degree earn the most with the average annual earnings of $66,250, while those with college or associate's degree education have the smallest earnings of $34,031.
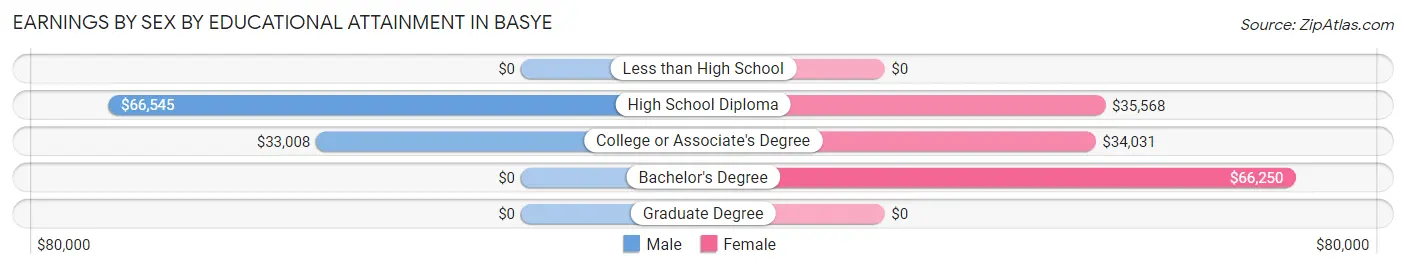
| Educational Attainment | Male Income | Female Income |
| Less than High School | - | - |
| High School Diploma | $66,545 | $35,568 |
| College or Associate's Degree | $33,008 | $34,031 |
| Bachelor's Degree | - | - |
| Graduate Degree | - | - |
| Total | $65,267 | $34,694 |
Family Income in Basye
Family Income Brackets in Basye
According to the Basye family income data, there are 66 families falling into the $150,000 to $199,999 income range, which is the most common income bracket and makes up 25.2% of all families.
| Income Bracket | # Families | % Families |
| Less than $10,000 | 0 | 0.0% |
| $10,000 to $14,999 | 0 | 0.0% |
| $15,000 to $24,999 | 0 | 0.0% |
| $25,000 to $34,999 | 0 | 0.0% |
| $35,000 to $49,999 | 40 | 15.3% |
| $50,000 to $74,999 | 47 | 17.9% |
| $75,000 to $99,999 | 50 | 19.1% |
| $100,000 to $149,999 | 22 | 8.4% |
| $150,000 to $199,999 | 66 | 25.2% |
| $200,000+ | 37 | 14.1% |
Family Income by Famaliy Size in Basye
3-person families (52 | 19.9%) account for the highest median family income in Basye with $86,912 per family, while 2-person families (114 | 43.5%) have the highest median income of $31,974 per family member.
| Income Bracket | # Families | Median Income |
| 2-Person Families | 114 (43.5%) | $63,947 |
| 3-Person Families | 52 (19.9%) | $86,912 |
| 4-Person Families | 49 (18.7%) | $0 |
| 5-Person Families | 0 (0.0%) | $0 |
| 6-Person Families | 0 (0.0%) | $0 |
| 7+ Person Families | 47 (17.9%) | $0 |
| Total | 262 (100.0%) | $0 |
Family Income by Number of Earners in Basye
| Number of Earners | # Families | Median Income |
| No Earners | 60 (22.9%) | $56,250 |
| 1 Earner | 33 (12.6%) | $0 |
| 2 Earners | 83 (31.7%) | $86,360 |
| 3+ Earners | 86 (32.8%) | $0 |
| Total | 262 (100.0%) | $0 |
Household Income in Basye
Household Income Brackets in Basye
With 101 households falling in the category, the $150,000 to $199,999 income range is the most frequent in Basye, accounting for 22.4% of all households.
| Income Bracket | # Households | % Households |
| Less than $10,000 | 12 | 2.7% |
| $10,000 to $14,999 | 0 | 0.0% |
| $15,000 to $24,999 | 59 | 13.1% |
| $25,000 to $34,999 | 47 | 10.4% |
| $35,000 to $49,999 | 40 | 8.9% |
| $50,000 to $74,999 | 36 | 8.0% |
| $75,000 to $99,999 | 61 | 13.5% |
| $100,000 to $149,999 | 32 | 7.1% |
| $150,000 to $199,999 | 101 | 22.4% |
| $200,000+ | 63 | 14.0% |
Household Income by Householder Age in Basye
The median household income in Basye is $86,028, with the highest median household income of $144,375 found in the 45 to 64 years age bracket for the primary householder. A total of 177 households (39.3%) fall into this category.
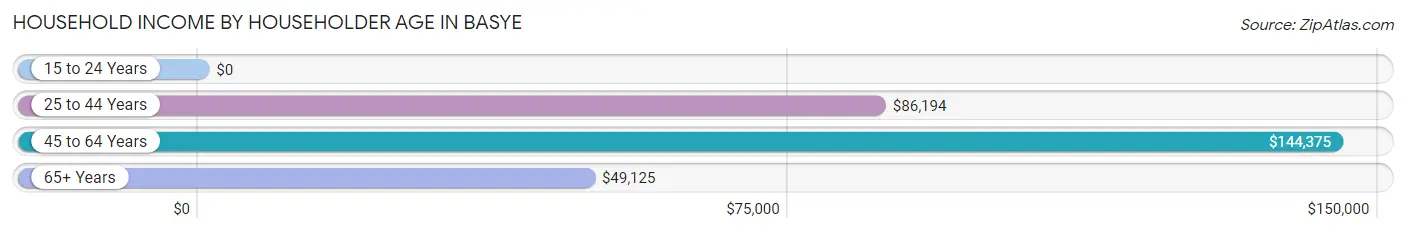
| Income Bracket | # Households | Median Income |
| 15 to 24 Years | 0 (0.0%) | $0 |
| 25 to 44 Years | 63 (14.0%) | $86,194 |
| 45 to 64 Years | 177 (39.3%) | $144,375 |
| 65+ Years | 211 (46.8%) | $49,125 |
| Total | 451 (100.0%) | $86,028 |
Poverty in Basye
Income Below Poverty by Sex and Age in Basye
With 8.8% poverty level for males and 6.6% for females among the residents of Basye, 6 to 11 year old males and 6 to 11 year old females are the most vulnerable to poverty, with 15 males (100.0%) and 17 females (60.7%) in their respective age groups living below the poverty level.
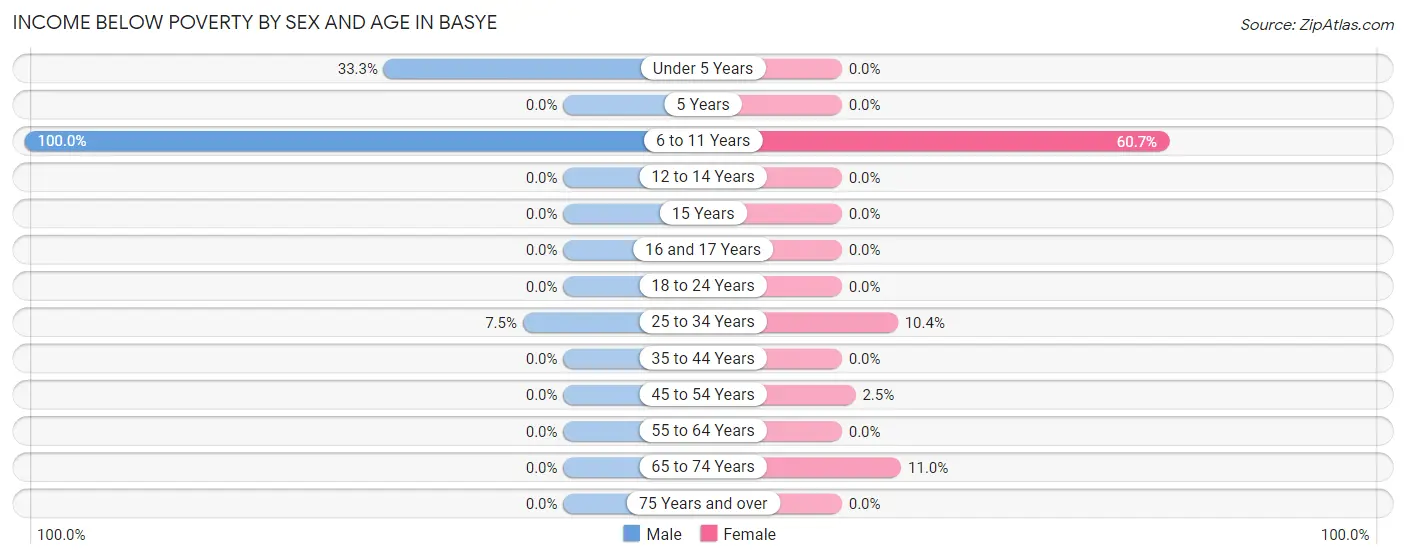
| Age Bracket | Male | Female |
| Under 5 Years | 36 (33.3%) | 0 (0.0%) |
| 5 Years | 0 (0.0%) | 0 (0.0%) |
| 6 to 11 Years | 15 (100.0%) | 17 (60.7%) |
| 12 to 14 Years | 0 (0.0%) | 0 (0.0%) |
| 15 Years | 0 (0.0%) | 0 (0.0%) |
| 16 and 17 Years | 0 (0.0%) | 0 (0.0%) |
| 18 to 24 Years | 0 (0.0%) | 0 (0.0%) |
| 25 to 34 Years | 10 (7.5%) | 11 (10.4%) |
| 35 to 44 Years | 0 (0.0%) | 0 (0.0%) |
| 45 to 54 Years | 0 (0.0%) | 3 (2.5%) |
| 55 to 64 Years | 0 (0.0%) | 0 (0.0%) |
| 65 to 74 Years | 0 (0.0%) | 12 (11.0%) |
| 75 Years and over | 0 (0.0%) | 0 (0.0%) |
| Total | 61 (8.8%) | 43 (6.6%) |
Income Above Poverty by Sex and Age in Basye
According to the poverty statistics in Basye, males aged 18 to 24 years and females aged under 5 years are the age groups that are most secure financially, with 100.0% of males and 100.0% of females in these age groups living above the poverty line.
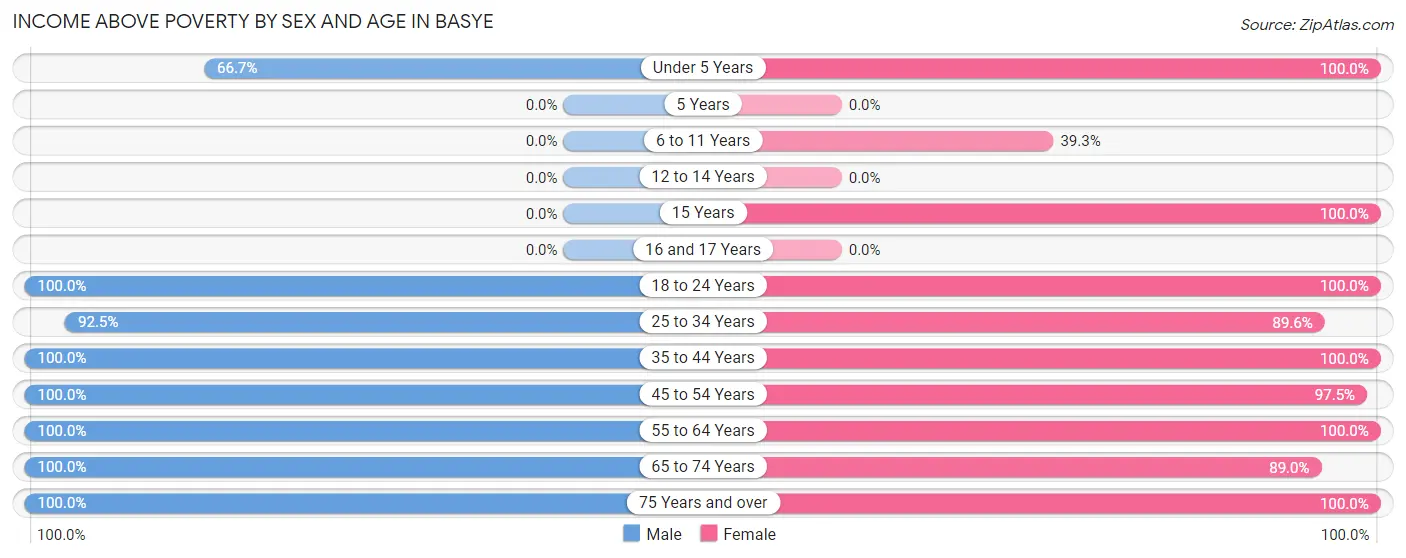
| Age Bracket | Male | Female |
| Under 5 Years | 72 (66.7%) | 45 (100.0%) |
| 5 Years | 0 (0.0%) | 0 (0.0%) |
| 6 to 11 Years | 0 (0.0%) | 11 (39.3%) |
| 12 to 14 Years | 0 (0.0%) | 0 (0.0%) |
| 15 Years | 0 (0.0%) | 7 (100.0%) |
| 16 and 17 Years | 0 (0.0%) | 0 (0.0%) |
| 18 to 24 Years | 27 (100.0%) | 86 (100.0%) |
| 25 to 34 Years | 123 (92.5%) | 95 (89.6%) |
| 35 to 44 Years | 51 (100.0%) | 30 (100.0%) |
| 45 to 54 Years | 149 (100.0%) | 115 (97.5%) |
| 55 to 64 Years | 31 (100.0%) | 83 (100.0%) |
| 65 to 74 Years | 40 (100.0%) | 97 (89.0%) |
| 75 Years and over | 139 (100.0%) | 36 (100.0%) |
| Total | 632 (91.2%) | 605 (93.4%) |
Income Below Poverty Among Married-Couple Families in Basye
The poverty statistics for married-couple families in Basye show that 4.2% or 10 of the total 241 families live below the poverty line. Families with 5 or more children have the highest poverty rate of 100.0%, comprising of 10 families. On the other hand, families with no children have the lowest poverty rate of 0.0%, which includes 0 families.
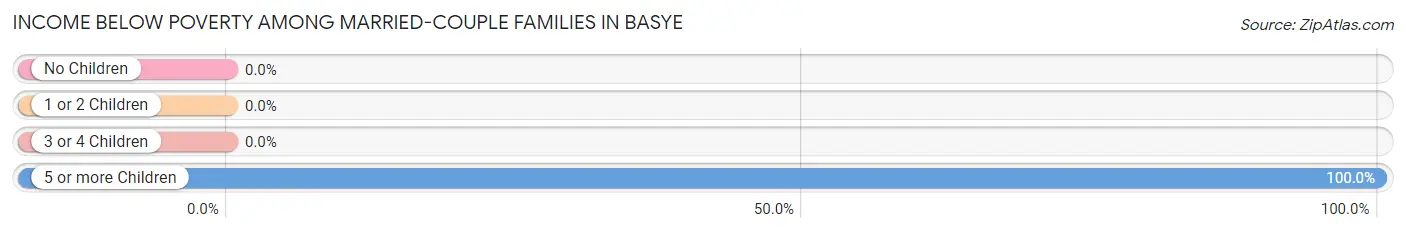
| Children | Above Poverty | Below Poverty |
| No Children | 142 (100.0%) | 0 (0.0%) |
| 1 or 2 Children | 89 (100.0%) | 0 (0.0%) |
| 3 or 4 Children | 0 (0.0%) | 0 (0.0%) |
| 5 or more Children | 0 (0.0%) | 10 (100.0%) |
| Total | 231 (95.9%) | 10 (4.2%) |
Income Below Poverty Among Single-Parent Households in Basye
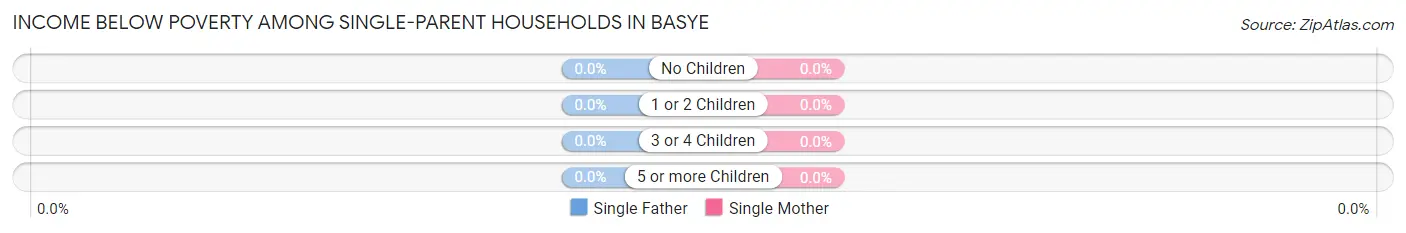
| Children | Single Father | Single Mother |
| No Children | 0 (0.0%) | 0 (0.0%) |
| 1 or 2 Children | 0 (0.0%) | 0 (0.0%) |
| 3 or 4 Children | 0 (0.0%) | 0 (0.0%) |
| 5 or more Children | 0 (0.0%) | 0 (0.0%) |
| Total | 0 (0.0%) | 0 (0.0%) |
Income Below Poverty Among Married-Couple vs Single-Parent Households in Basye
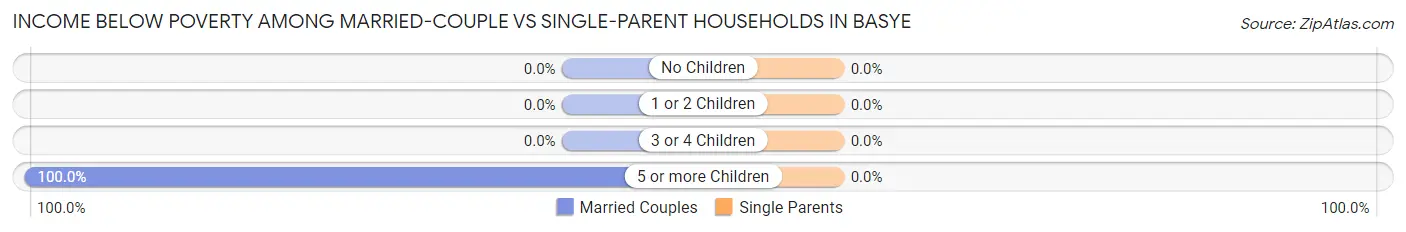
| Children | Married-Couple Families | Single-Parent Households |
| No Children | 0 (0.0%) | 0 (0.0%) |
| 1 or 2 Children | 0 (0.0%) | 0 (0.0%) |
| 3 or 4 Children | 0 (0.0%) | 0 (0.0%) |
| 5 or more Children | 10 (100.0%) | 0 (0.0%) |
| Total | 10 (4.2%) | 0 (0.0%) |
Race in Basye
The most populous races in Basye are White / Caucasian (1,270 | 94.7%), Two or more Races (49 | 3.6%), and Hispanic or Latino (40 | 3.0%).
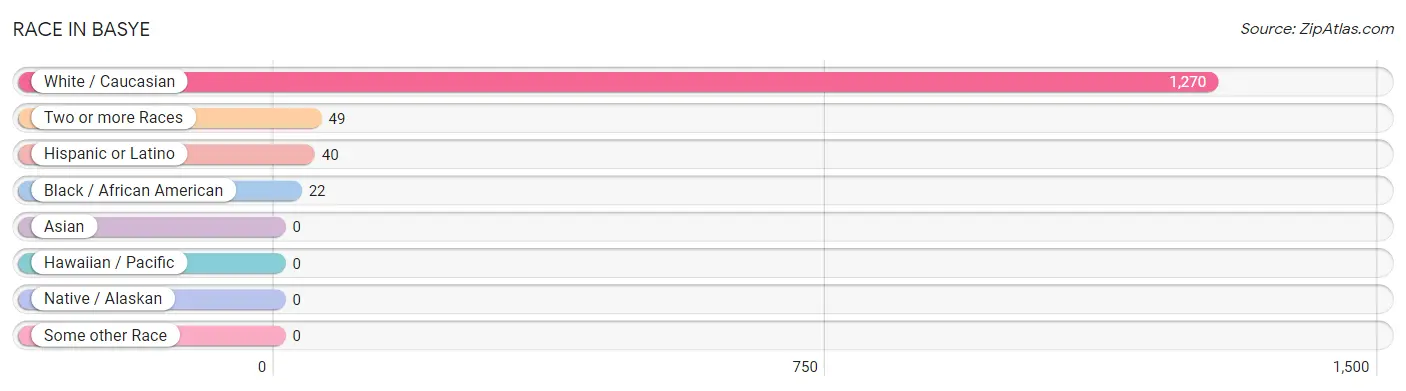
| Race | # Population | % Population |
| Asian | 0 | 0.0% |
| Black / African American | 22 | 1.6% |
| Hawaiian / Pacific | 0 | 0.0% |
| Hispanic or Latino | 40 | 3.0% |
| Native / Alaskan | 0 | 0.0% |
| White / Caucasian | 1,270 | 94.7% |
| Two or more Races | 49 | 3.6% |
| Some other Race | 0 | 0.0% |
| Total | 1,341 | 100.0% |
Ancestry in Basye
The most populous ancestries reported in Basye are Irish (405 | 30.2%), English (282 | 21.0%), German (221 | 16.5%), Italian (69 | 5.1%), and American (65 | 4.9%), together accounting for 77.7% of all Basye residents.
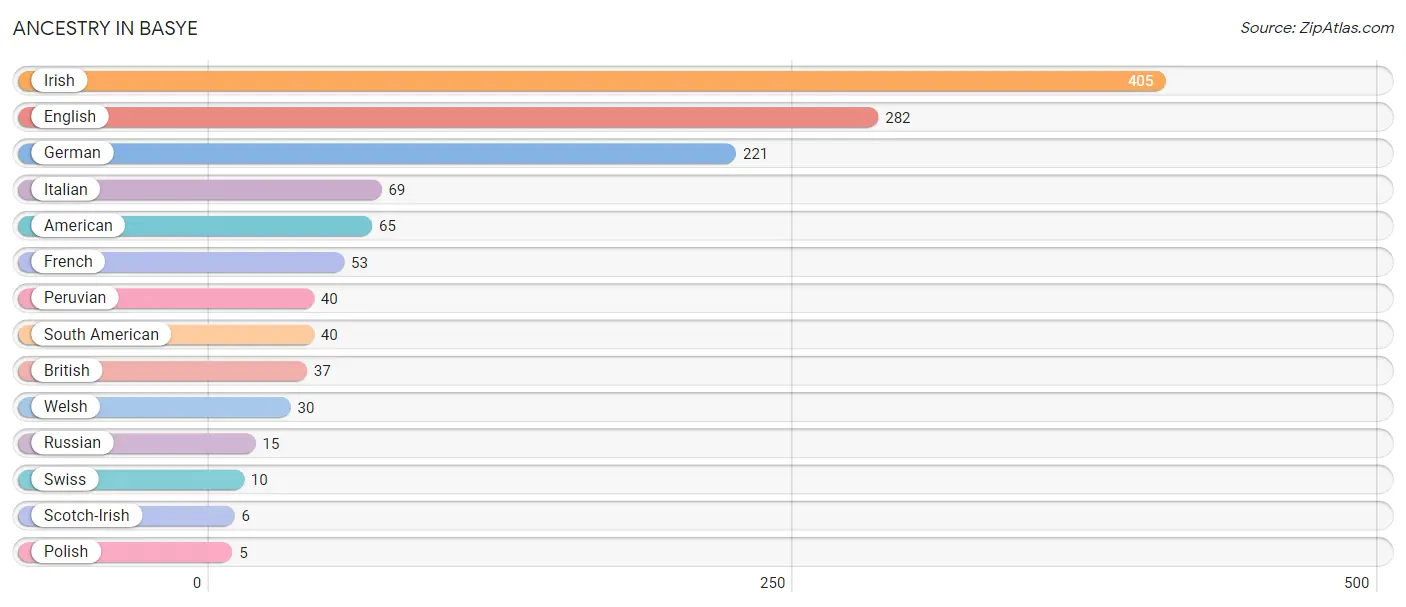
| Ancestry | # Population | % Population |
| American | 65 | 4.9% |
| British | 37 | 2.8% |
| English | 282 | 21.0% |
| French | 53 | 4.0% |
| German | 221 | 16.5% |
| Irish | 405 | 30.2% |
| Italian | 69 | 5.1% |
| Peruvian | 40 | 3.0% |
| Polish | 5 | 0.4% |
| Russian | 15 | 1.1% |
| Scotch-Irish | 6 | 0.4% |
| South American | 40 | 3.0% |
| Swiss | 10 | 0.7% |
| Welsh | 30 | 2.2% | View All 14 Rows |
Immigrants in Basye
The most numerous immigrant groups reported in Basye came from Latin America (13 | 1.0%), Peru (13 | 1.0%), and South America (13 | 1.0%), together accounting for 2.9% of all Basye residents.
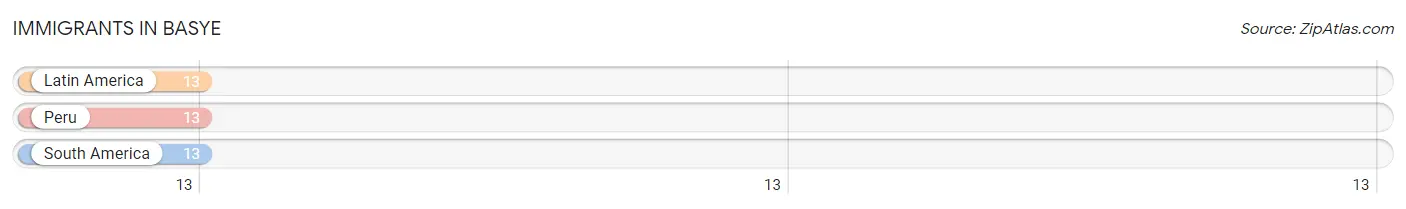
| Immigration Origin | # Population | % Population |
| Latin America | 13 | 1.0% |
| Peru | 13 | 1.0% |
| South America | 13 | 1.0% | View All 3 Rows |
Sex and Age in Basye
Sex and Age in Basye
The most populous age groups in Basye are 25 to 29 Years (123 | 17.7%) for men and 45 to 49 Years (106 | 16.4%) for women.
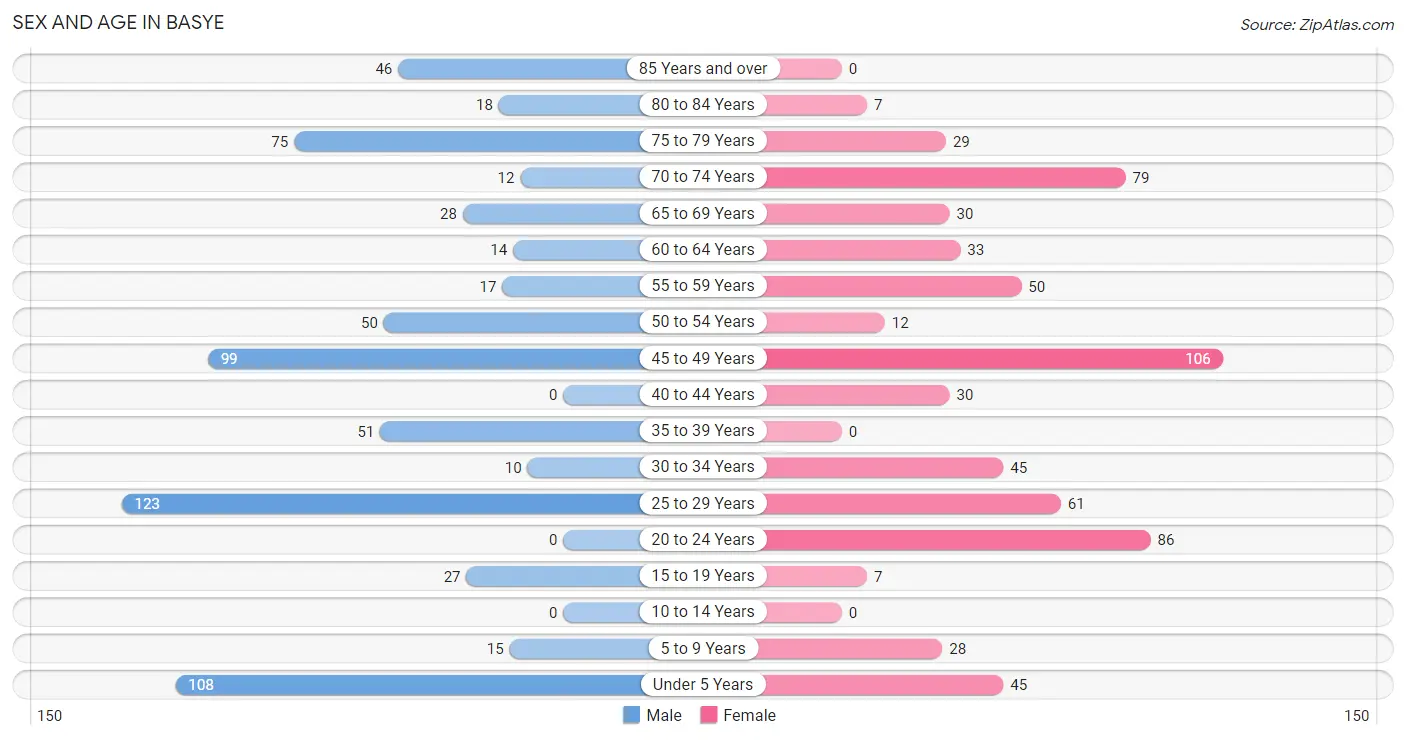
| Age Bracket | Male | Female |
| Under 5 Years | 108 (15.6%) | 45 (6.9%) |
| 5 to 9 Years | 15 (2.2%) | 28 (4.3%) |
| 10 to 14 Years | 0 (0.0%) | 0 (0.0%) |
| 15 to 19 Years | 27 (3.9%) | 7 (1.1%) |
| 20 to 24 Years | 0 (0.0%) | 86 (13.3%) |
| 25 to 29 Years | 123 (17.7%) | 61 (9.4%) |
| 30 to 34 Years | 10 (1.4%) | 45 (6.9%) |
| 35 to 39 Years | 51 (7.4%) | 0 (0.0%) |
| 40 to 44 Years | 0 (0.0%) | 30 (4.6%) |
| 45 to 49 Years | 99 (14.3%) | 106 (16.4%) |
| 50 to 54 Years | 50 (7.2%) | 12 (1.8%) |
| 55 to 59 Years | 17 (2.5%) | 50 (7.7%) |
| 60 to 64 Years | 14 (2.0%) | 33 (5.1%) |
| 65 to 69 Years | 28 (4.0%) | 30 (4.6%) |
| 70 to 74 Years | 12 (1.7%) | 79 (12.2%) |
| 75 to 79 Years | 75 (10.8%) | 29 (4.5%) |
| 80 to 84 Years | 18 (2.6%) | 7 (1.1%) |
| 85 Years and over | 46 (6.6%) | 0 (0.0%) |
| Total | 693 (100.0%) | 648 (100.0%) |
Families and Households in Basye
Median Family Size in Basye
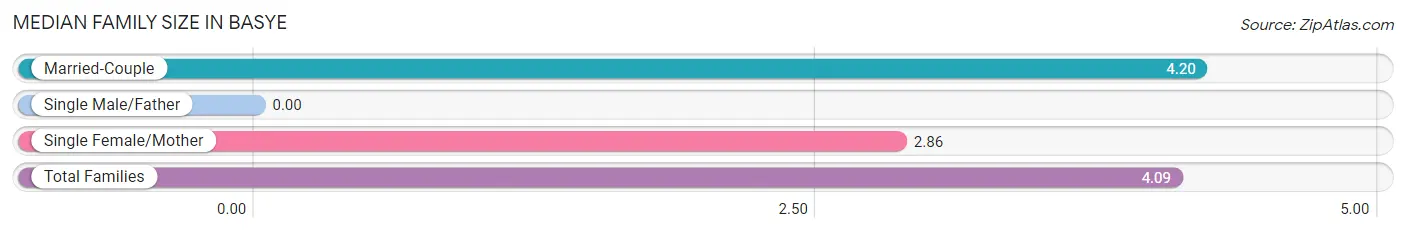
| Family Type | # Families | Family Size |
| Married-Couple | 241 (92.0%) | 4.20 |
| Single Male/Father | 0 (0.0%) | - |
| Single Female/Mother | 21 (8.0%) | 2.86 |
| Total Families | 262 (100.0%) | 4.09 |
Median Household Size in Basye
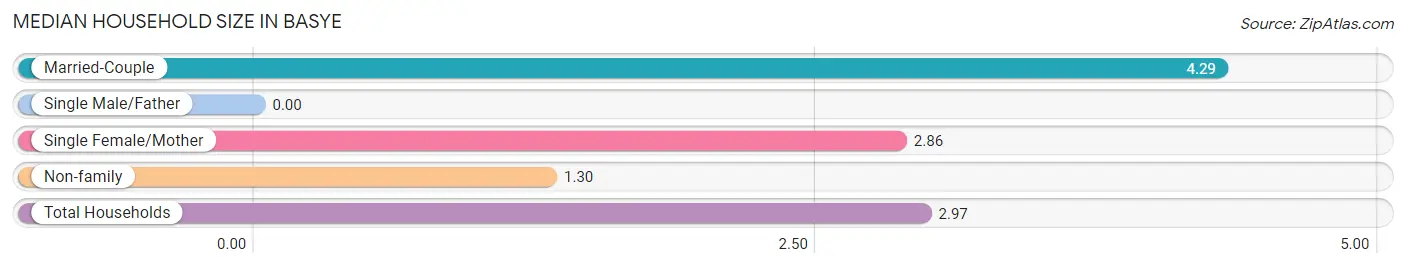
| Household Type | # Households | Household Size |
| Married-Couple | 241 (53.4%) | 4.29 |
| Single Male/Father | 0 (0.0%) | - |
| Single Female/Mother | 21 (4.7%) | 2.86 |
| Non-family | 189 (41.9%) | 1.30 |
| Total Households | 451 (100.0%) | 2.97 |
Household Size by Marriage Status in Basye
Out of a total of 451 households in Basye, 262 (58.1%) are family households, while 189 (41.9%) are nonfamily households. The most numerous type of family households are 2-person households, comprising 103, and the most common type of nonfamily households are 1-person households, comprising 139.
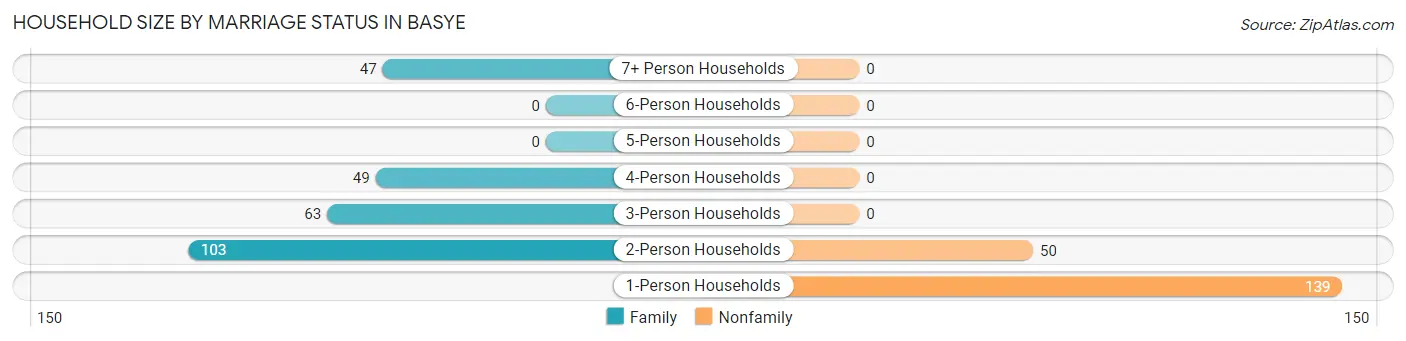
| Household Size | Family Households | Nonfamily Households |
| 1-Person Households | - | 139 (30.8%) |
| 2-Person Households | 103 (22.8%) | 50 (11.1%) |
| 3-Person Households | 63 (14.0%) | 0 (0.0%) |
| 4-Person Households | 49 (10.9%) | 0 (0.0%) |
| 5-Person Households | 0 (0.0%) | 0 (0.0%) |
| 6-Person Households | 0 (0.0%) | 0 (0.0%) |
| 7+ Person Households | 47 (10.4%) | 0 (0.0%) |
| Total | 262 (58.1%) | 189 (41.9%) |
Female Fertility in Basye
Fertility by Age in Basye
Average fertility rate in Basye is 215.0 births per 1,000 women. Women in the age bracket of 20 to 34 years have the highest fertility rate with 375.0 births per 1,000 women. Women in the age bracket of 20 to 34 years acount for 100.0% of all women with births.
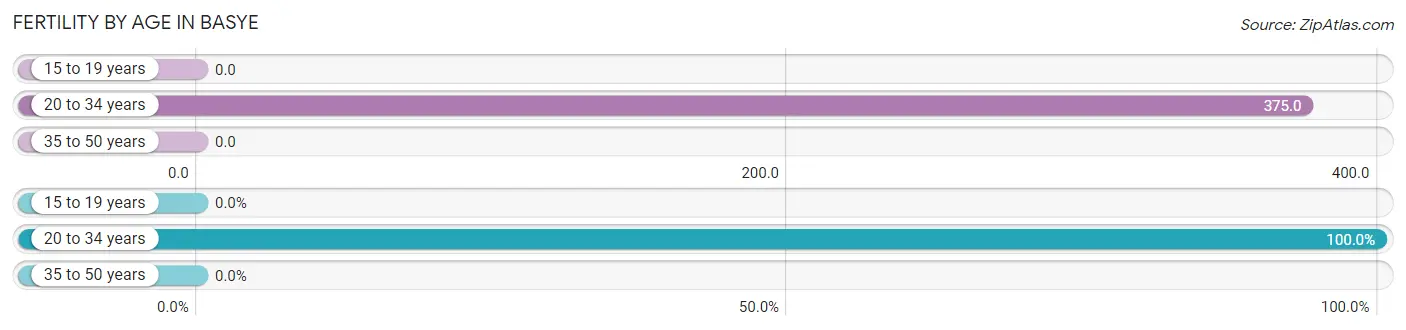
| Age Bracket | Women with Births | Births / 1,000 Women |
| 15 to 19 years | 0 (0.0%) | 0.0 |
| 20 to 34 years | 72 (100.0%) | 375.0 |
| 35 to 50 years | 0 (0.0%) | 0.0 |
| Total | 72 (100.0%) | 215.0 |
Fertility by Age by Marriage Status in Basye
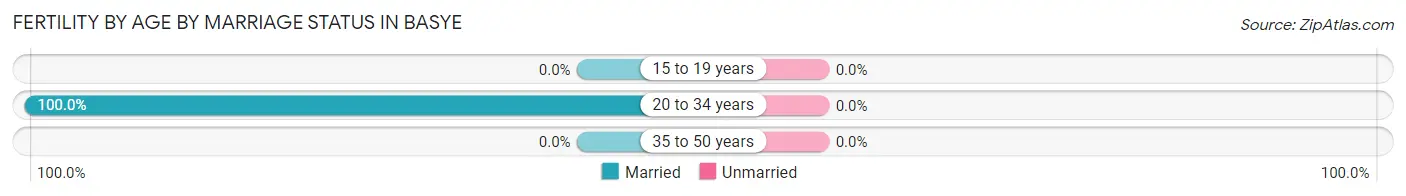
| Age Bracket | Married | Unmarried |
| 15 to 19 years | 0 (0.0%) | 0 (0.0%) |
| 20 to 34 years | 72 (100.0%) | 0 (0.0%) |
| 35 to 50 years | 0 (0.0%) | 0 (0.0%) |
| Total | 72 (100.0%) | 0 (0.0%) |
Fertility by Education in Basye
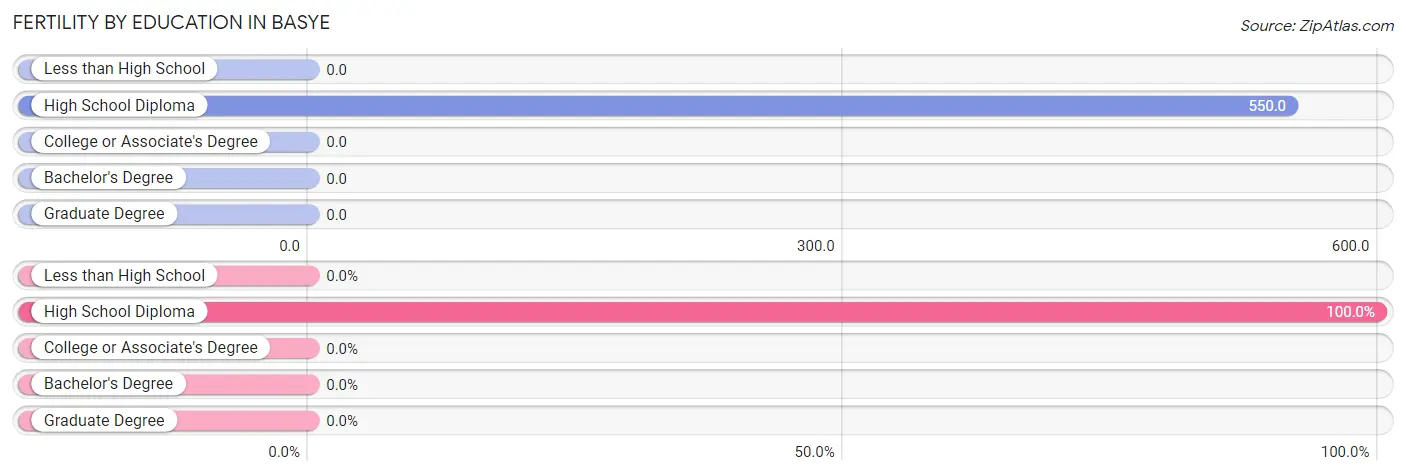
| Educational Attainment | Women with Births | Births / 1,000 Women |
| Less than High School | 0 (0.0%) | 0.0 |
| High School Diploma | 72 (100.0%) | 550.0 |
| College or Associate's Degree | 0 (0.0%) | 0.0 |
| Bachelor's Degree | 0 (0.0%) | 0.0 |
| Graduate Degree | 0 (0.0%) | 0.0 |
| Total | 72 (100.0%) | 215.0 |
Fertility by Education by Marriage Status in Basye
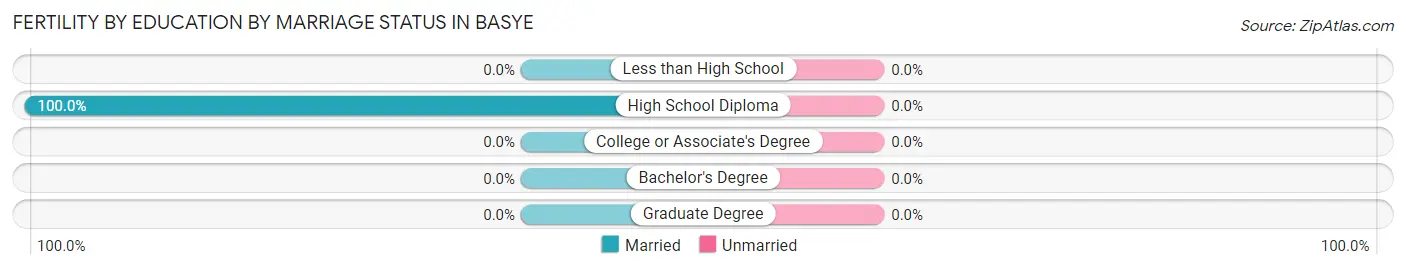
| Educational Attainment | Married | Unmarried |
| Less than High School | 0 (0.0%) | 0 (0.0%) |
| High School Diploma | 72 (100.0%) | 0 (0.0%) |
| College or Associate's Degree | 0 (0.0%) | 0 (0.0%) |
| Bachelor's Degree | 0 (0.0%) | 0 (0.0%) |
| Graduate Degree | 0 (0.0%) | 0 (0.0%) |
| Total | 72 (100.0%) | 0 (0.0%) |
Employment Characteristics in Basye
Employment by Class of Employer in Basye
Among the 640 employed individuals in Basye, private company employees (458 | 71.6%), not-for-profit organizations (110 | 17.2%), and local government employees (41 | 6.4%) make up the most common classes of employment.
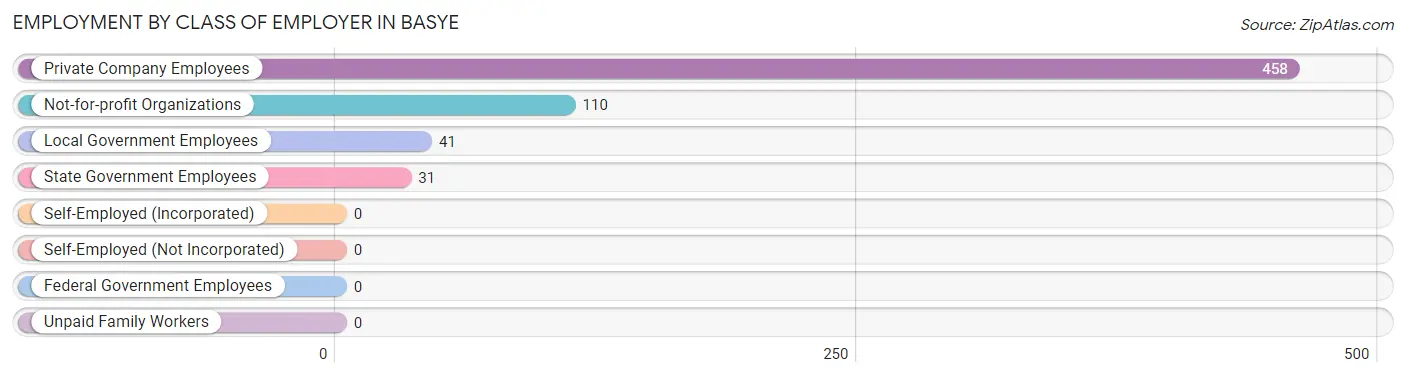
| Employer Class | # Employees | % Employees |
| Private Company Employees | 458 | 71.6% |
| Self-Employed (Incorporated) | 0 | 0.0% |
| Self-Employed (Not Incorporated) | 0 | 0.0% |
| Not-for-profit Organizations | 110 | 17.2% |
| Local Government Employees | 41 | 6.4% |
| State Government Employees | 31 | 4.8% |
| Federal Government Employees | 0 | 0.0% |
| Unpaid Family Workers | 0 | 0.0% |
| Total | 640 | 100.0% |
Employment Status by Age in Basye
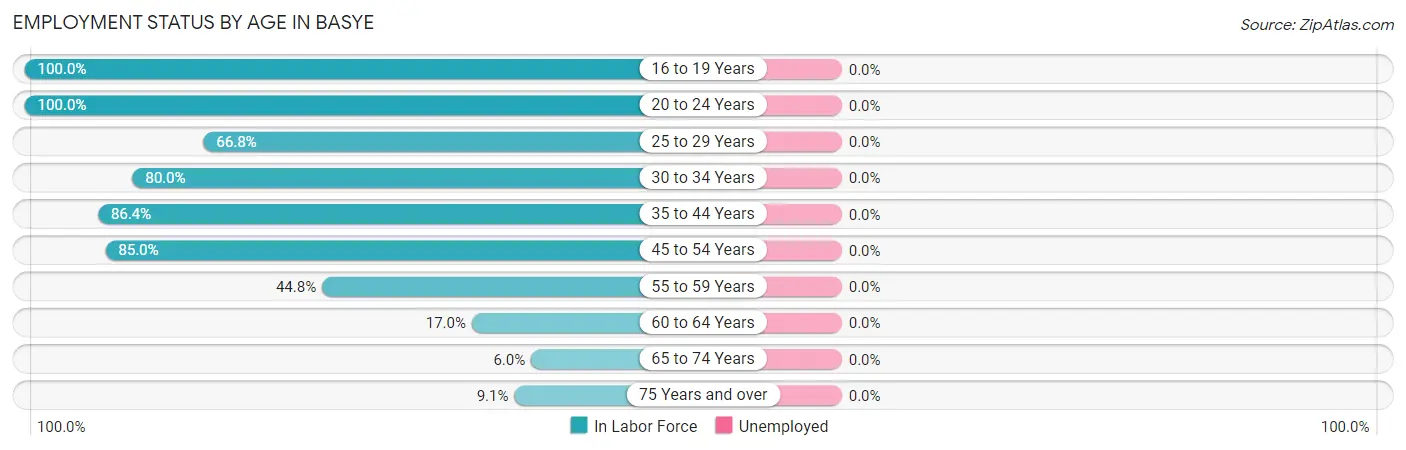
| Age Bracket | In Labor Force | Unemployed |
| 16 to 19 Years | 27 (100.0%) | 0 (0.0%) |
| 20 to 24 Years | 86 (100.0%) | 0 (0.0%) |
| 25 to 29 Years | 123 (66.8%) | 0 (0.0%) |
| 30 to 34 Years | 44 (80.0%) | 0 (0.0%) |
| 35 to 44 Years | 70 (86.4%) | 0 (0.0%) |
| 45 to 54 Years | 227 (85.0%) | 0 (0.0%) |
| 55 to 59 Years | 30 (44.8%) | 0 (0.0%) |
| 60 to 64 Years | 8 (17.0%) | 0 (0.0%) |
| 65 to 74 Years | 9 (6.0%) | 0 (0.0%) |
| 75 Years and over | 16 (9.1%) | 0 (0.0%) |
| Total | 640 (56.2%) | 0 (0.0%) |
Employment Status by Educational Attainment in Basye
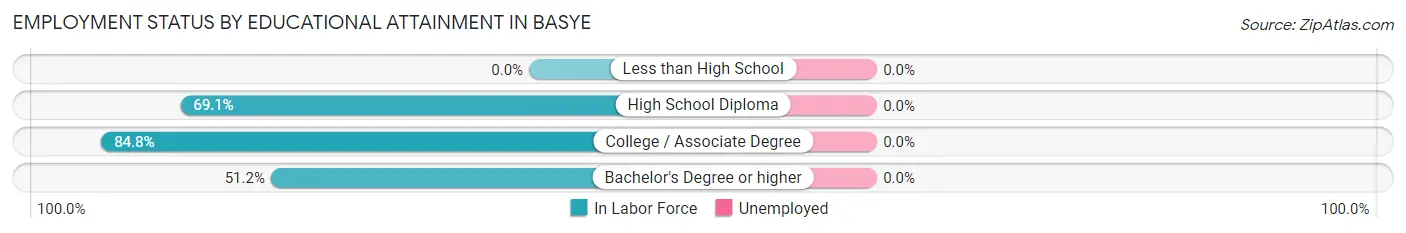
| Educational Attainment | In Labor Force | Unemployed |
| Less than High School | 0 (0.0%) | 0 (0.0%) |
| High School Diploma | 279 (69.1%) | 0 (0.0%) |
| College / Associate Degree | 179 (84.8%) | 0 (0.0%) |
| Bachelor's Degree or higher | 44 (51.2%) | 0 (0.0%) |
| Total | 502 (71.6%) | 0 (0.0%) |
Employment Occupations by Sex in Basye
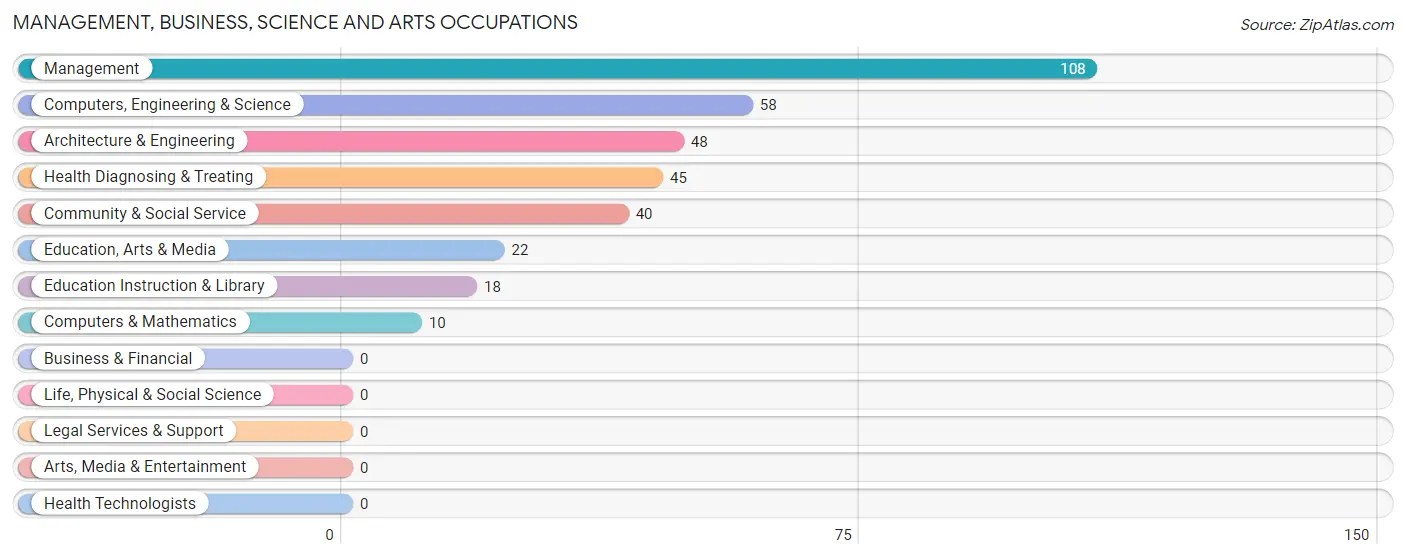
Management, Business, Science and Arts Occupations
The most common Management, Business, Science and Arts occupations in Basye are Management (108 | 16.9%), Computers, Engineering & Science (58 | 9.1%), Architecture & Engineering (48 | 7.5%), Health Diagnosing & Treating (45 | 7.0%), and Community & Social Service (40 | 6.2%).
Management, Business, Science and Arts Occupations by Sex
Within the Management, Business, Science and Arts occupations in Basye, the most male-oriented occupations are Architecture & Engineering (100.0%), Computers, Engineering & Science (82.8%), and Management (82.4%), while the most female-oriented occupations are Computers & Mathematics (100.0%), Community & Social Service (100.0%), and Education, Arts & Media (100.0%).
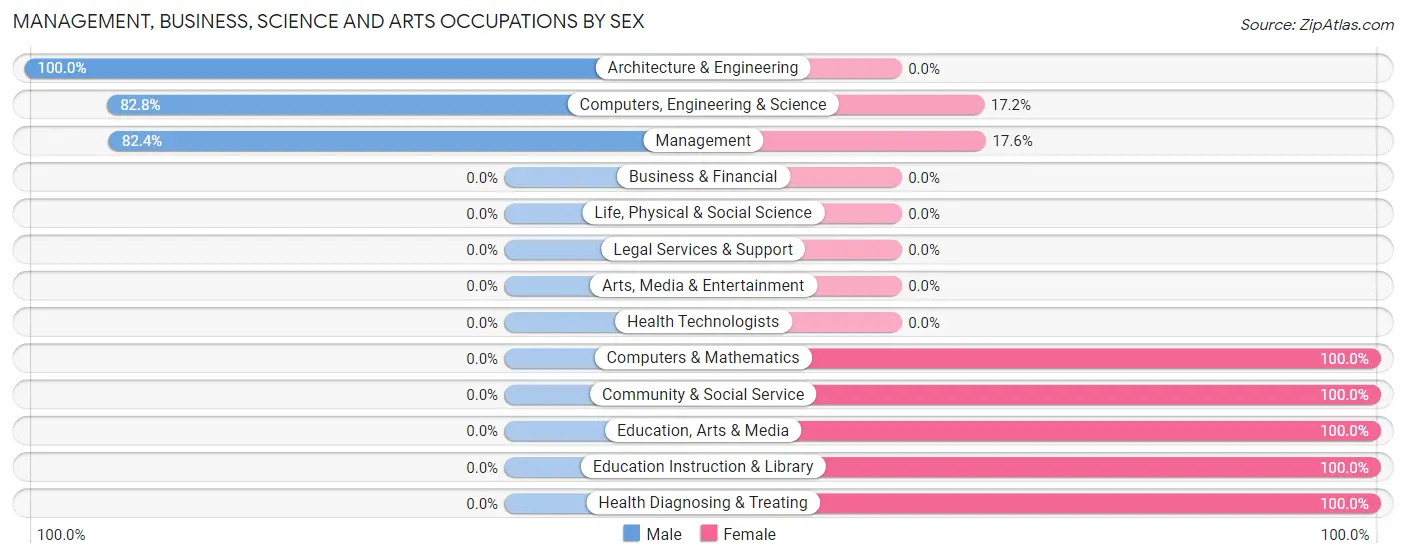
| Occupation | Male | Female |
| Management | 89 (82.4%) | 19 (17.6%) |
| Business & Financial | 0 (0.0%) | 0 (0.0%) |
| Computers, Engineering & Science | 48 (82.8%) | 10 (17.2%) |
| Computers & Mathematics | 0 (0.0%) | 10 (100.0%) |
| Architecture & Engineering | 48 (100.0%) | 0 (0.0%) |
| Life, Physical & Social Science | 0 (0.0%) | 0 (0.0%) |
| Community & Social Service | 0 (0.0%) | 40 (100.0%) |
| Education, Arts & Media | 0 (0.0%) | 22 (100.0%) |
| Legal Services & Support | 0 (0.0%) | 0 (0.0%) |
| Education Instruction & Library | 0 (0.0%) | 18 (100.0%) |
| Arts, Media & Entertainment | 0 (0.0%) | 0 (0.0%) |
| Health Diagnosing & Treating | 0 (0.0%) | 45 (100.0%) |
| Health Technologists | 0 (0.0%) | 0 (0.0%) |
| Total (Category) | 137 (54.6%) | 114 (45.4%) |
| Total (Overall) | 370 (57.8%) | 270 (42.2%) |
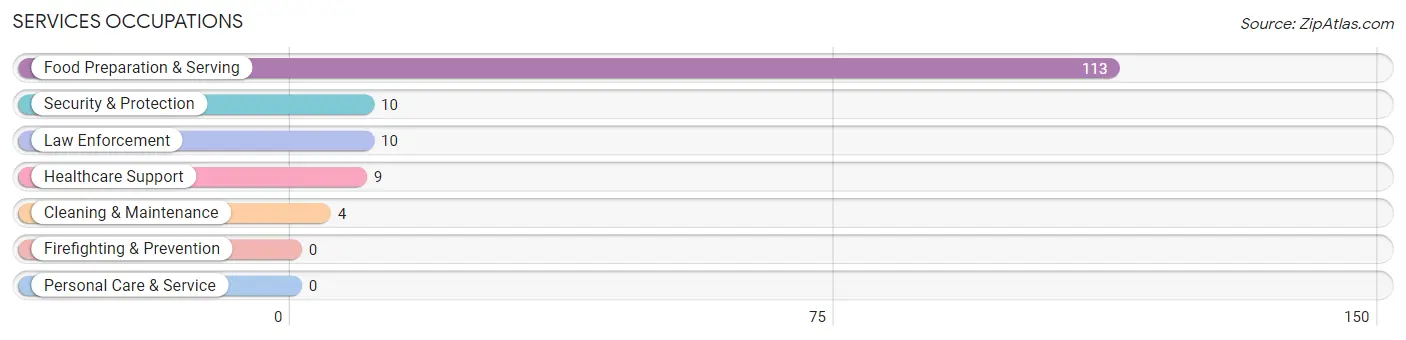
Services Occupations
The most common Services occupations in Basye are Food Preparation & Serving (113 | 17.7%), Security & Protection (10 | 1.6%), Law Enforcement (10 | 1.6%), Healthcare Support (9 | 1.4%), and Cleaning & Maintenance (4 | 0.6%).
Services Occupations by Sex
Within the Services occupations in Basye, the most male-oriented occupations are Security & Protection (100.0%), Law Enforcement (100.0%), and Cleaning & Maintenance (100.0%), while the most female-oriented occupations are Healthcare Support (100.0%), and Food Preparation & Serving (76.1%).
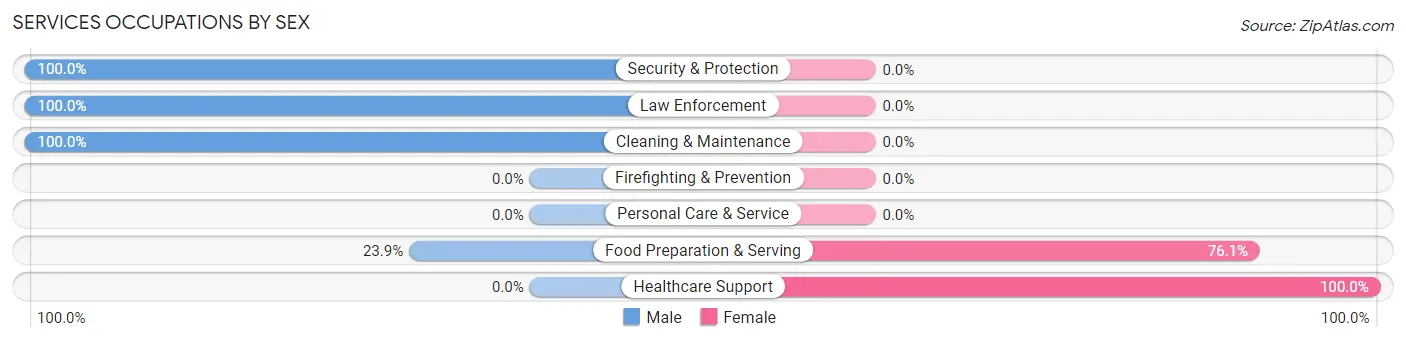
| Occupation | Male | Female |
| Healthcare Support | 0 (0.0%) | 9 (100.0%) |
| Security & Protection | 10 (100.0%) | 0 (0.0%) |
| Firefighting & Prevention | 0 (0.0%) | 0 (0.0%) |
| Law Enforcement | 10 (100.0%) | 0 (0.0%) |
| Food Preparation & Serving | 27 (23.9%) | 86 (76.1%) |
| Cleaning & Maintenance | 4 (100.0%) | 0 (0.0%) |
| Personal Care & Service | 0 (0.0%) | 0 (0.0%) |
| Total (Category) | 41 (30.1%) | 95 (69.9%) |
| Total (Overall) | 370 (57.8%) | 270 (42.2%) |
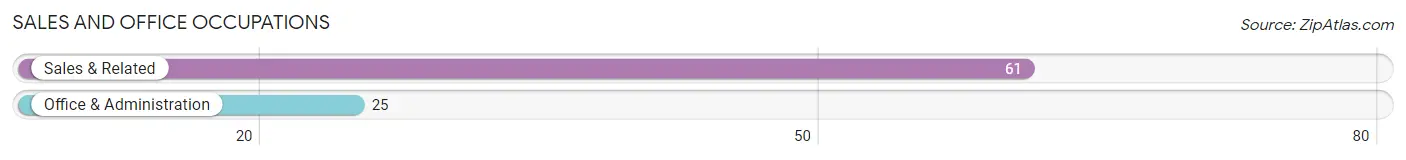
Sales and Office Occupations
The most common Sales and Office occupations in Basye are Sales & Related (61 | 9.5%), and Office & Administration (25 | 3.9%).
Sales and Office Occupations by Sex
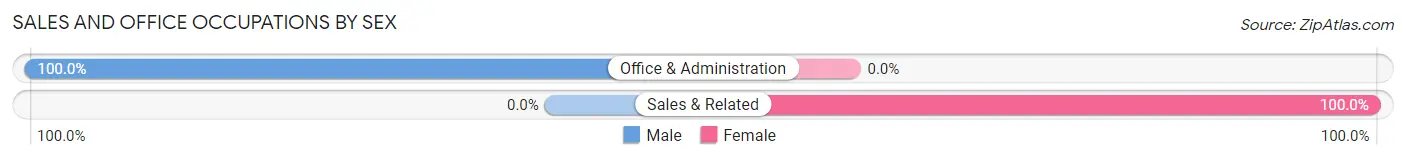
| Occupation | Male | Female |
| Sales & Related | 0 (0.0%) | 61 (100.0%) |
| Office & Administration | 25 (100.0%) | 0 (0.0%) |
| Total (Category) | 25 (29.1%) | 61 (70.9%) |
| Total (Overall) | 370 (57.8%) | 270 (42.2%) |
Natural Resources, Construction and Maintenance Occupations
The most common Natural Resources, Construction and Maintenance occupations in Basye are Installation, Maintenance & Repair (29 | 4.5%), and Construction & Extraction (28 | 4.4%).
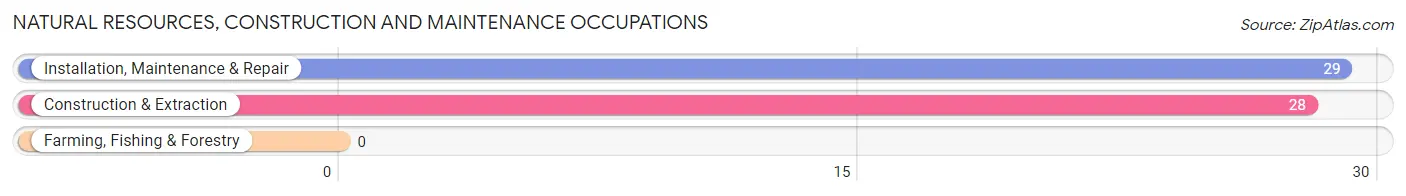
Natural Resources, Construction and Maintenance Occupations by Sex
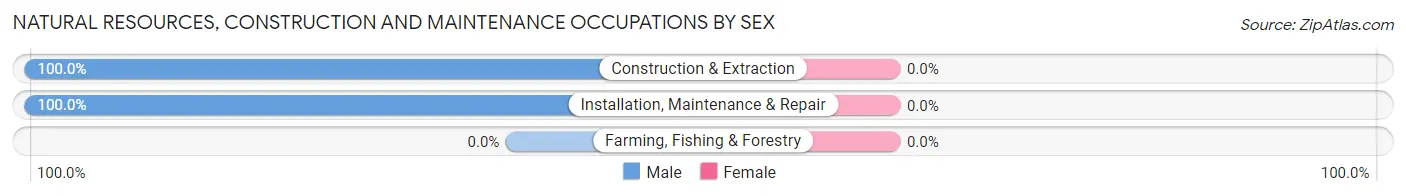
| Occupation | Male | Female |
| Farming, Fishing & Forestry | 0 (0.0%) | 0 (0.0%) |
| Construction & Extraction | 28 (100.0%) | 0 (0.0%) |
| Installation, Maintenance & Repair | 29 (100.0%) | 0 (0.0%) |
| Total (Category) | 57 (100.0%) | 0 (0.0%) |
| Total (Overall) | 370 (57.8%) | 270 (42.2%) |
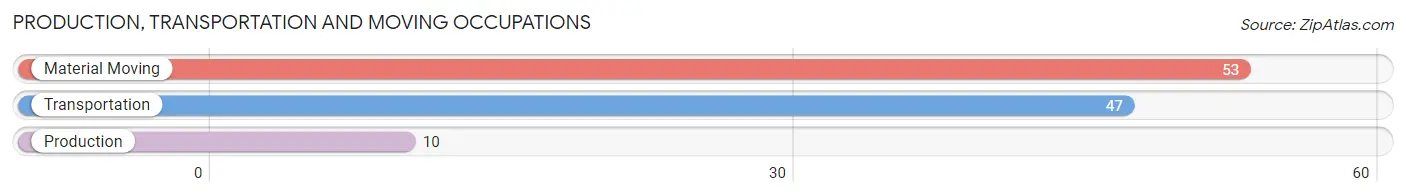
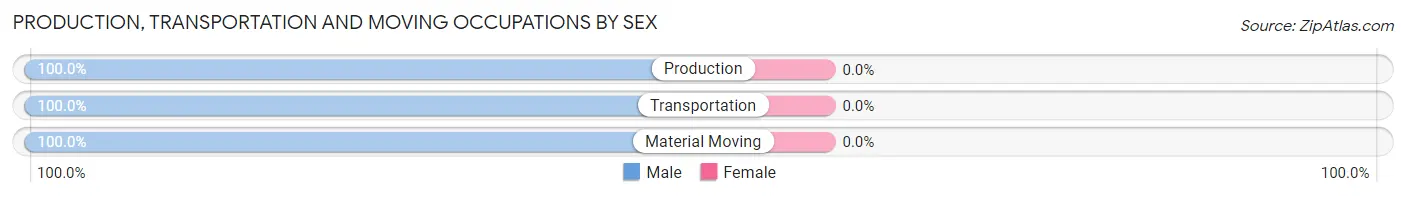
Production, Transportation and Moving Occupations
The most common Production, Transportation and Moving occupations in Basye are Material Moving (53 | 8.3%), Transportation (47 | 7.3%), and Production (10 | 1.6%).
Production, Transportation and Moving Occupations by Sex
| Occupation | Male | Female |
| Production | 10 (100.0%) | 0 (0.0%) |
| Transportation | 47 (100.0%) | 0 (0.0%) |
| Material Moving | 53 (100.0%) | 0 (0.0%) |
| Total (Category) | 110 (100.0%) | 0 (0.0%) |
| Total (Overall) | 370 (57.8%) | 270 (42.2%) |
Employment Industries by Sex in Basye
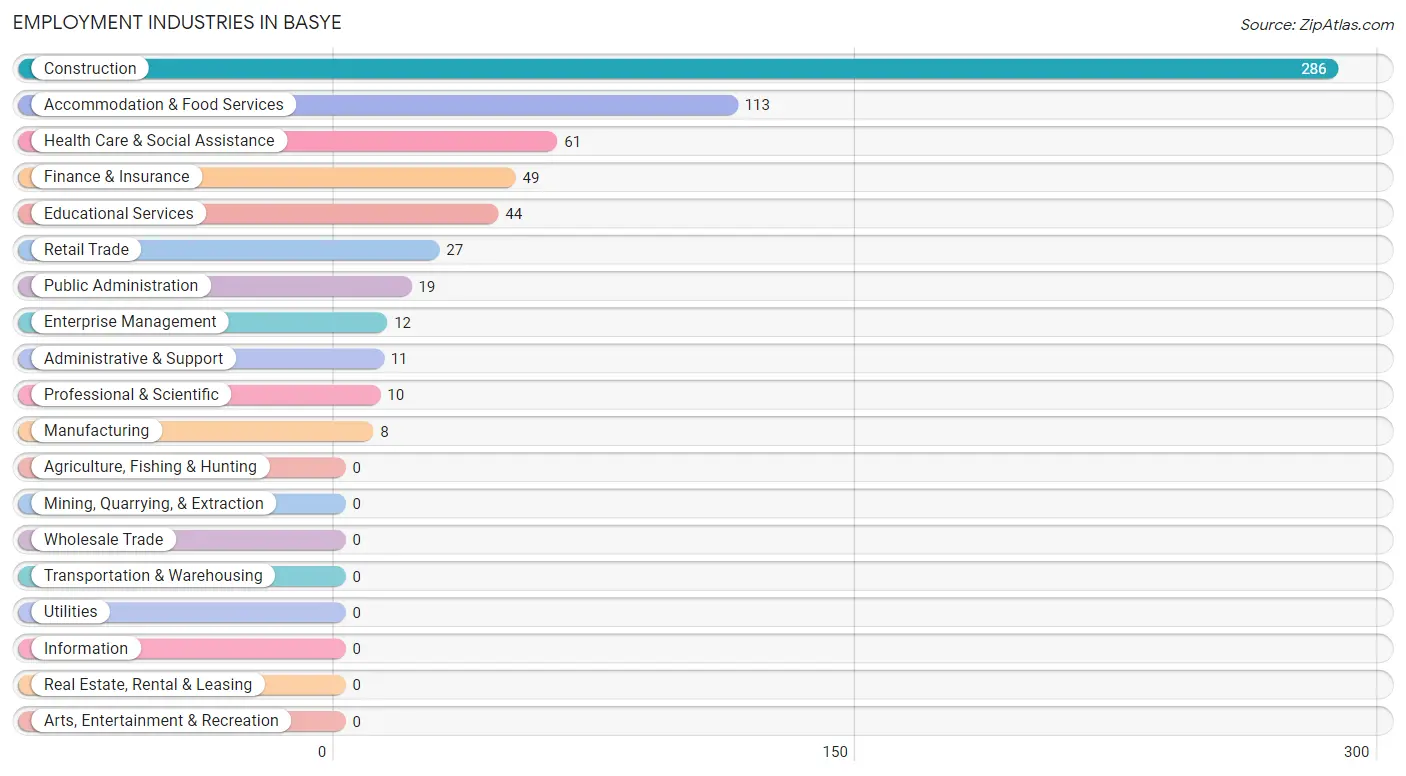
Employment Industries in Basye
The major employment industries in Basye include Construction (286 | 44.7%), Accommodation & Food Services (113 | 17.7%), Health Care & Social Assistance (61 | 9.5%), Finance & Insurance (49 | 7.7%), and Educational Services (44 | 6.9%).
Employment Industries by Sex in Basye
The Basye industries that see more men than women are Construction (100.0%), Manufacturing (100.0%), and Administrative & Support (100.0%), whereas the industries that tend to have a higher number of women are Finance & Insurance (100.0%), Professional & Scientific (100.0%), and Enterprise Management (100.0%).
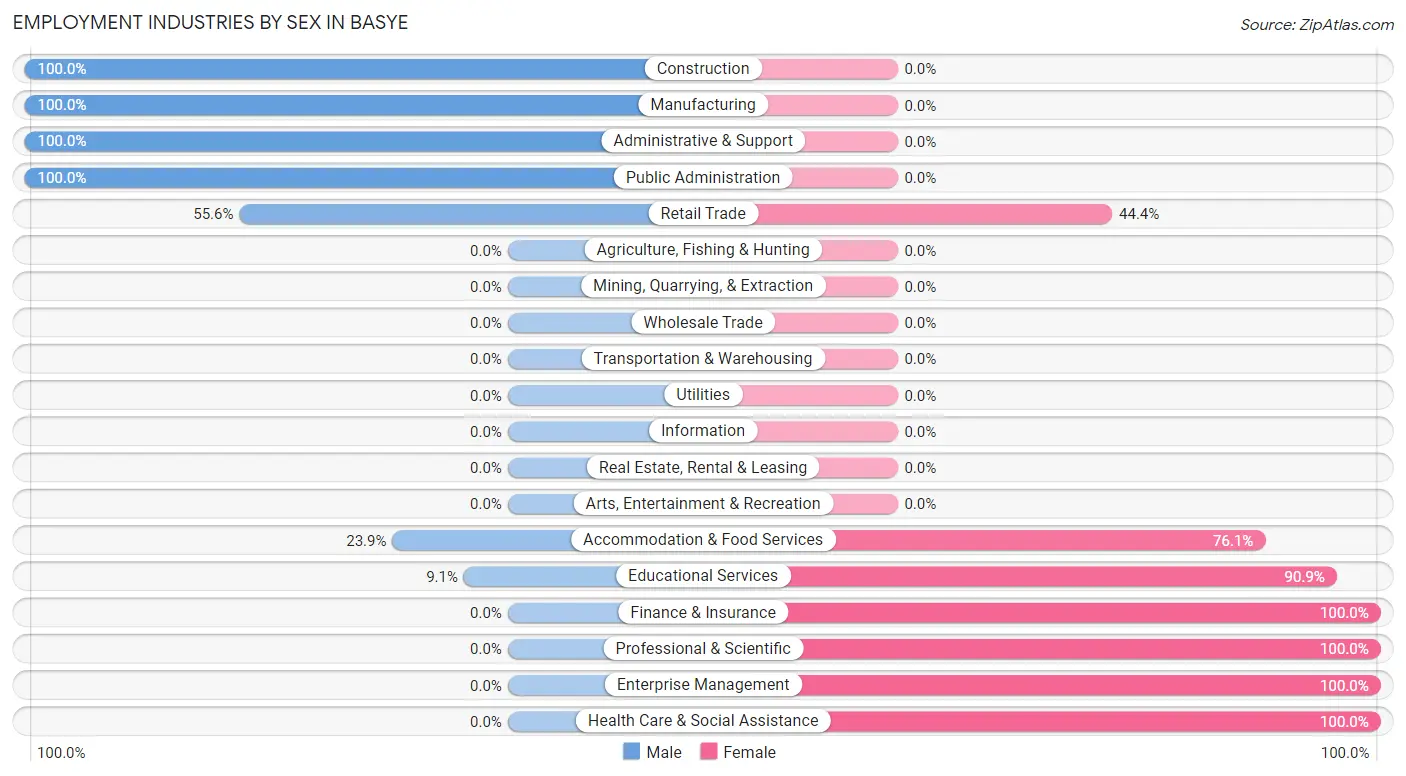
| Industry | Male | Female |
| Agriculture, Fishing & Hunting | 0 (0.0%) | 0 (0.0%) |
| Mining, Quarrying, & Extraction | 0 (0.0%) | 0 (0.0%) |
| Construction | 286 (100.0%) | 0 (0.0%) |
| Manufacturing | 8 (100.0%) | 0 (0.0%) |
| Wholesale Trade | 0 (0.0%) | 0 (0.0%) |
| Retail Trade | 15 (55.6%) | 12 (44.4%) |
| Transportation & Warehousing | 0 (0.0%) | 0 (0.0%) |
| Utilities | 0 (0.0%) | 0 (0.0%) |
| Information | 0 (0.0%) | 0 (0.0%) |
| Finance & Insurance | 0 (0.0%) | 49 (100.0%) |
| Real Estate, Rental & Leasing | 0 (0.0%) | 0 (0.0%) |
| Professional & Scientific | 0 (0.0%) | 10 (100.0%) |
| Enterprise Management | 0 (0.0%) | 12 (100.0%) |
| Administrative & Support | 11 (100.0%) | 0 (0.0%) |
| Educational Services | 4 (9.1%) | 40 (90.9%) |
| Health Care & Social Assistance | 0 (0.0%) | 61 (100.0%) |
| Arts, Entertainment & Recreation | 0 (0.0%) | 0 (0.0%) |
| Accommodation & Food Services | 27 (23.9%) | 86 (76.1%) |
| Public Administration | 19 (100.0%) | 0 (0.0%) |
| Total | 370 (57.8%) | 270 (42.2%) |
Education in Basye
School Enrollment in Basye
The most common levels of schooling among the 197 students in Basye are college / undergraduate (83 | 42.1%), nursery / preschool (51 | 25.9%), and elementary school (36 | 18.3%).
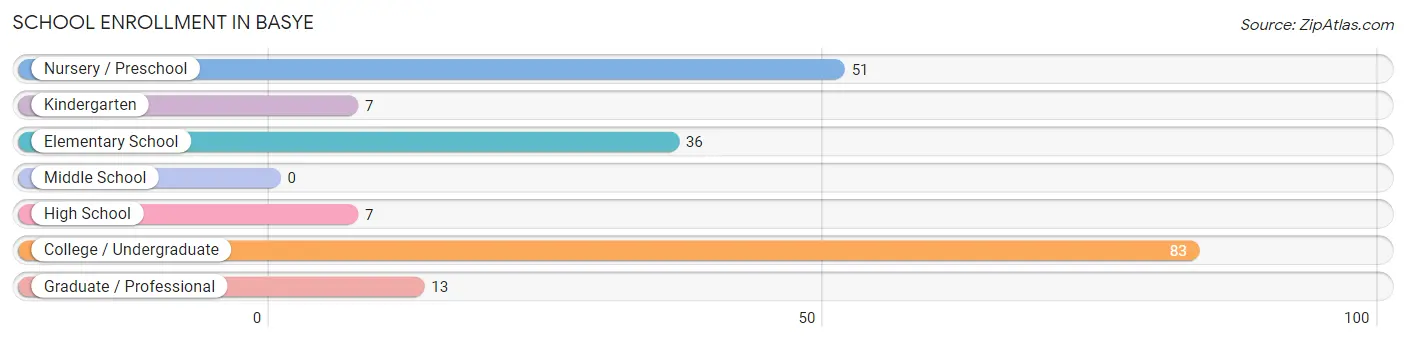
| School Level | # Students | % Students |
| Nursery / Preschool | 51 | 25.9% |
| Kindergarten | 7 | 3.5% |
| Elementary School | 36 | 18.3% |
| Middle School | 0 | 0.0% |
| High School | 7 | 3.5% |
| College / Undergraduate | 83 | 42.1% |
| Graduate / Professional | 13 | 6.6% |
| Total | 197 | 100.0% |
School Enrollment by Age by Funding Source in Basye
Out of a total of 197 students who are enrolled in schools in Basye, 96 (48.7%) attend a private institution, while the remaining 101 (51.3%) are enrolled in public schools. The age group of 3 to 4 year olds has the highest likelihood of being enrolled in private schools, with 51 (100.0% in the age bracket) enrolled. Conversely, the age group of 15 to 17 year olds has the lowest likelihood of being enrolled in a private school, with 7 (100.0% in the age bracket) attending a public institution.
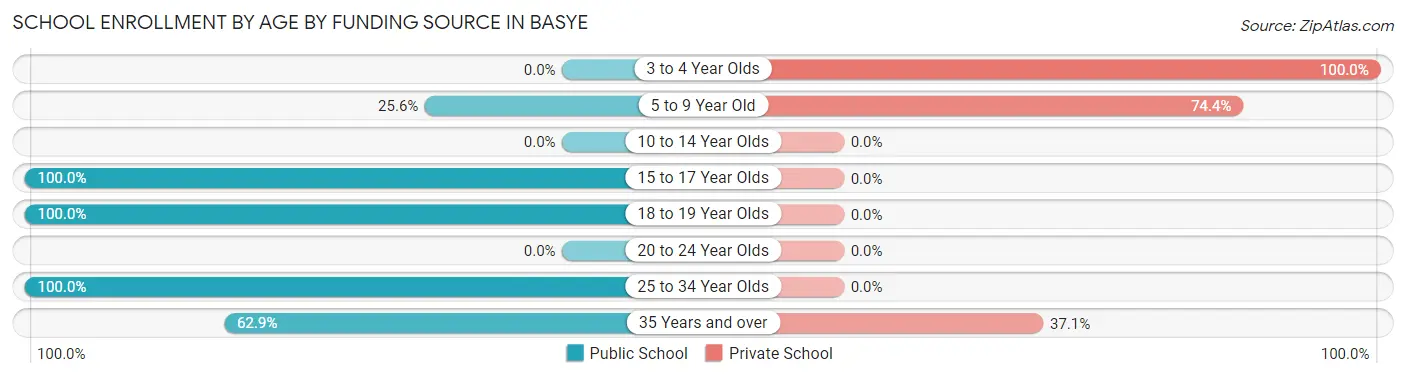
| Age Bracket | Public School | Private School |
| 3 to 4 Year Olds | 0 (0.0%) | 51 (100.0%) |
| 5 to 9 Year Old | 11 (25.6%) | 32 (74.4%) |
| 10 to 14 Year Olds | 0 (0.0%) | 0 (0.0%) |
| 15 to 17 Year Olds | 7 (100.0%) | 0 (0.0%) |
| 18 to 19 Year Olds | 27 (100.0%) | 0 (0.0%) |
| 20 to 24 Year Olds | 0 (0.0%) | 0 (0.0%) |
| 25 to 34 Year Olds | 34 (100.0%) | 0 (0.0%) |
| 35 Years and over | 22 (62.9%) | 13 (37.1%) |
| Total | 101 (51.3%) | 96 (48.7%) |
Educational Attainment by Field of Study in Basye
Business (81 | 35.8%), science & technology (27 | 11.9%), education (24 | 10.6%), social sciences (21 | 9.3%), and arts & humanities (14 | 6.2%) are the most common fields of study among 226 individuals in Basye who have obtained a bachelor's degree or higher.
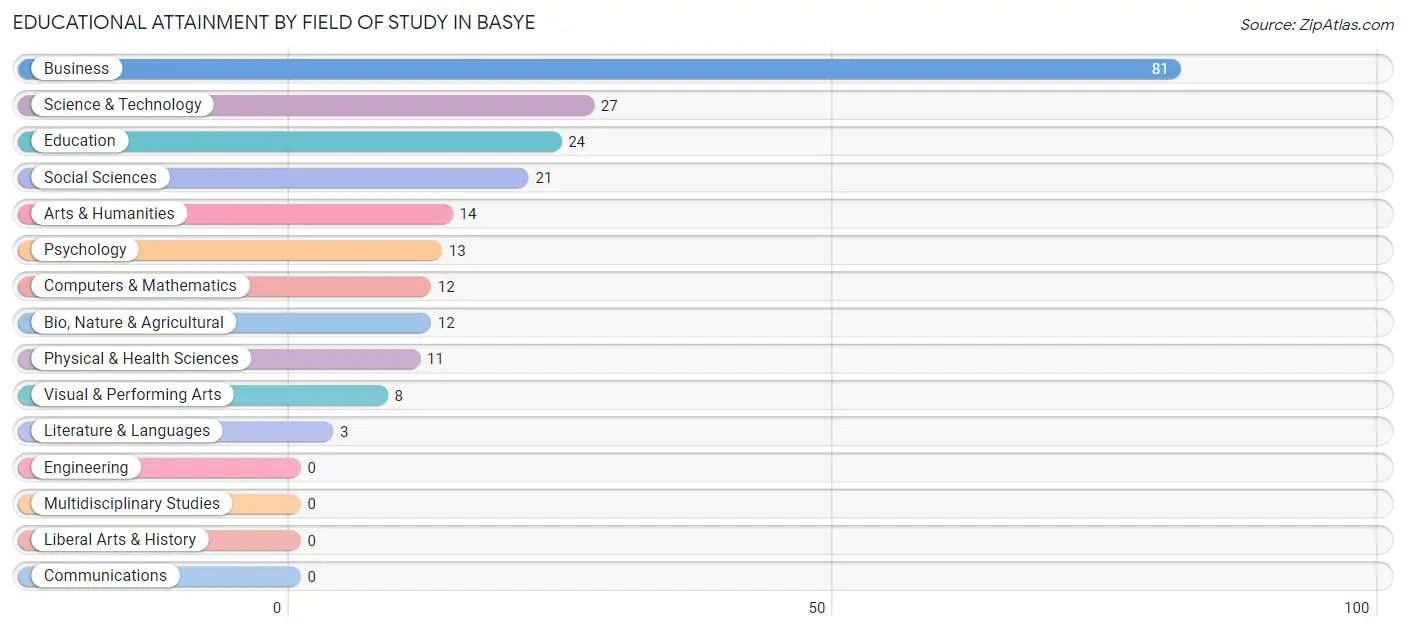
| Field of Study | # Graduates | % Graduates |
| Computers & Mathematics | 12 | 5.3% |
| Bio, Nature & Agricultural | 12 | 5.3% |
| Physical & Health Sciences | 11 | 4.9% |
| Psychology | 13 | 5.8% |
| Social Sciences | 21 | 9.3% |
| Engineering | 0 | 0.0% |
| Multidisciplinary Studies | 0 | 0.0% |
| Science & Technology | 27 | 11.9% |
| Business | 81 | 35.8% |
| Education | 24 | 10.6% |
| Literature & Languages | 3 | 1.3% |
| Liberal Arts & History | 0 | 0.0% |
| Visual & Performing Arts | 8 | 3.5% |
| Communications | 0 | 0.0% |
| Arts & Humanities | 14 | 6.2% |
| Total | 226 | 100.0% |
Transportation & Commute in Basye
Vehicle Availability by Sex in Basye
The most prevalent vehicle ownership categories in Basye are males with 5 or more vehicles (140, accounting for 37.8%) and females with 5 or more vehicles (0, making up 51.8%).
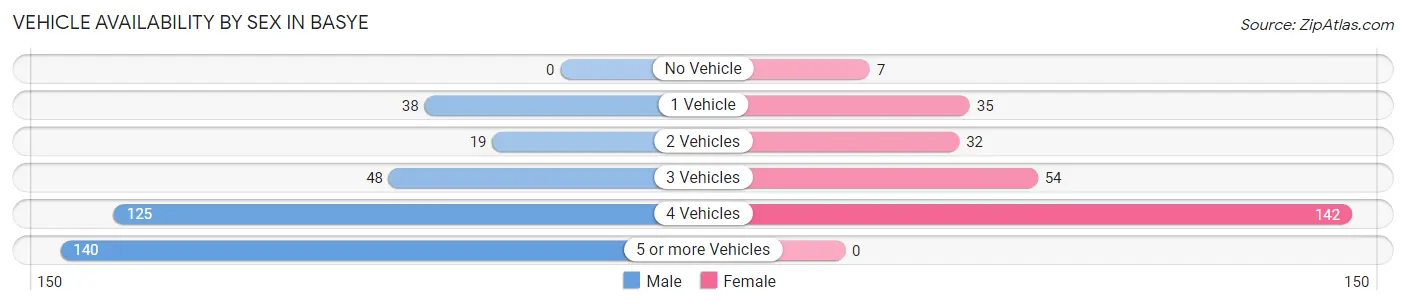
| Vehicles Available | Male | Female |
| No Vehicle | 0 (0.0%) | 7 (2.6%) |
| 1 Vehicle | 38 (10.3%) | 35 (13.0%) |
| 2 Vehicles | 19 (5.1%) | 32 (11.8%) |
| 3 Vehicles | 48 (13.0%) | 54 (20.0%) |
| 4 Vehicles | 125 (33.8%) | 142 (52.6%) |
| 5 or more Vehicles | 140 (37.8%) | 0 (0.0%) |
| Total | 370 (100.0%) | 270 (100.0%) |
Commute Time in Basye
The most frequently occuring commute durations in Basye are 15 to 19 minutes (230 commuters, 35.9%), 45 to 59 minutes (153 commuters, 23.9%), and 20 to 24 minutes (86 commuters, 13.4%).
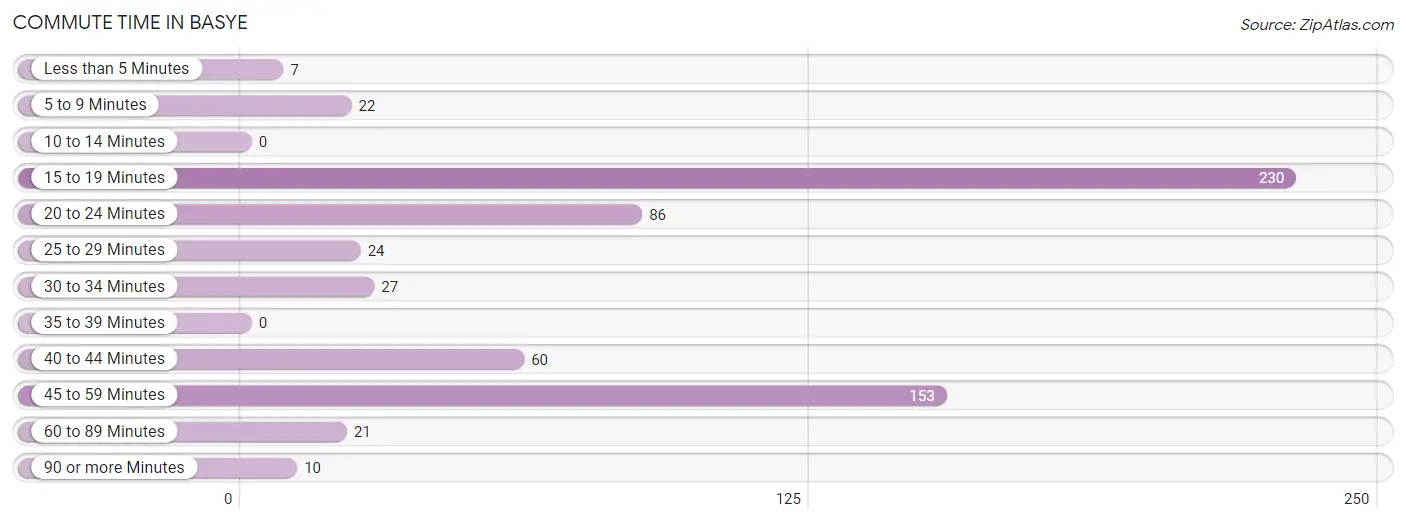
| Commute Time | # Commuters | % Commuters |
| Less than 5 Minutes | 7 | 1.1% |
| 5 to 9 Minutes | 22 | 3.4% |
| 10 to 14 Minutes | 0 | 0.0% |
| 15 to 19 Minutes | 230 | 35.9% |
| 20 to 24 Minutes | 86 | 13.4% |
| 25 to 29 Minutes | 24 | 3.7% |
| 30 to 34 Minutes | 27 | 4.2% |
| 35 to 39 Minutes | 0 | 0.0% |
| 40 to 44 Minutes | 60 | 9.4% |
| 45 to 59 Minutes | 153 | 23.9% |
| 60 to 89 Minutes | 21 | 3.3% |
| 90 or more Minutes | 10 | 1.6% |
Commute Time by Sex in Basye
The most common commute times in Basye are 15 to 19 minutes (221 commuters, 59.7%) for males and 20 to 24 minutes (86 commuters, 31.9%) for females.
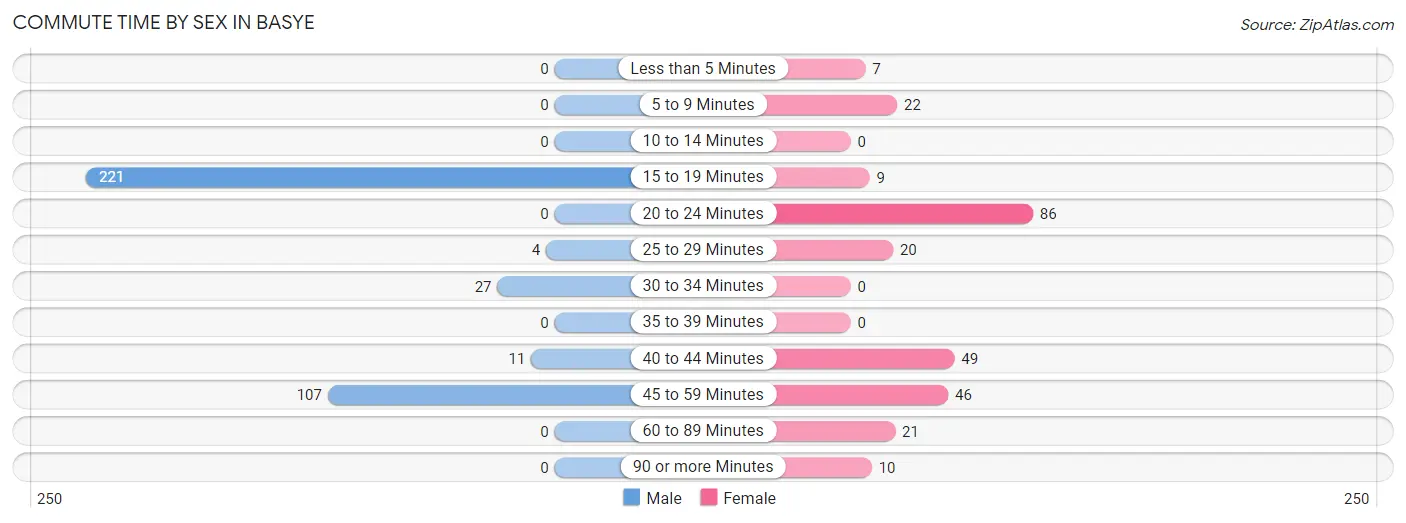
| Commute Time | Male | Female |
| Less than 5 Minutes | 0 (0.0%) | 7 (2.6%) |
| 5 to 9 Minutes | 0 (0.0%) | 22 (8.2%) |
| 10 to 14 Minutes | 0 (0.0%) | 0 (0.0%) |
| 15 to 19 Minutes | 221 (59.7%) | 9 (3.3%) |
| 20 to 24 Minutes | 0 (0.0%) | 86 (31.9%) |
| 25 to 29 Minutes | 4 (1.1%) | 20 (7.4%) |
| 30 to 34 Minutes | 27 (7.3%) | 0 (0.0%) |
| 35 to 39 Minutes | 0 (0.0%) | 0 (0.0%) |
| 40 to 44 Minutes | 11 (3.0%) | 49 (18.1%) |
| 45 to 59 Minutes | 107 (28.9%) | 46 (17.0%) |
| 60 to 89 Minutes | 0 (0.0%) | 21 (7.8%) |
| 90 or more Minutes | 0 (0.0%) | 10 (3.7%) |
Time of Departure to Work by Sex in Basye
The most frequent times of departure to work in Basye are 6:30 AM to 6:59 AM (159, 43.0%) for males and 7:30 AM to 7:59 AM (135, 50.0%) for females.
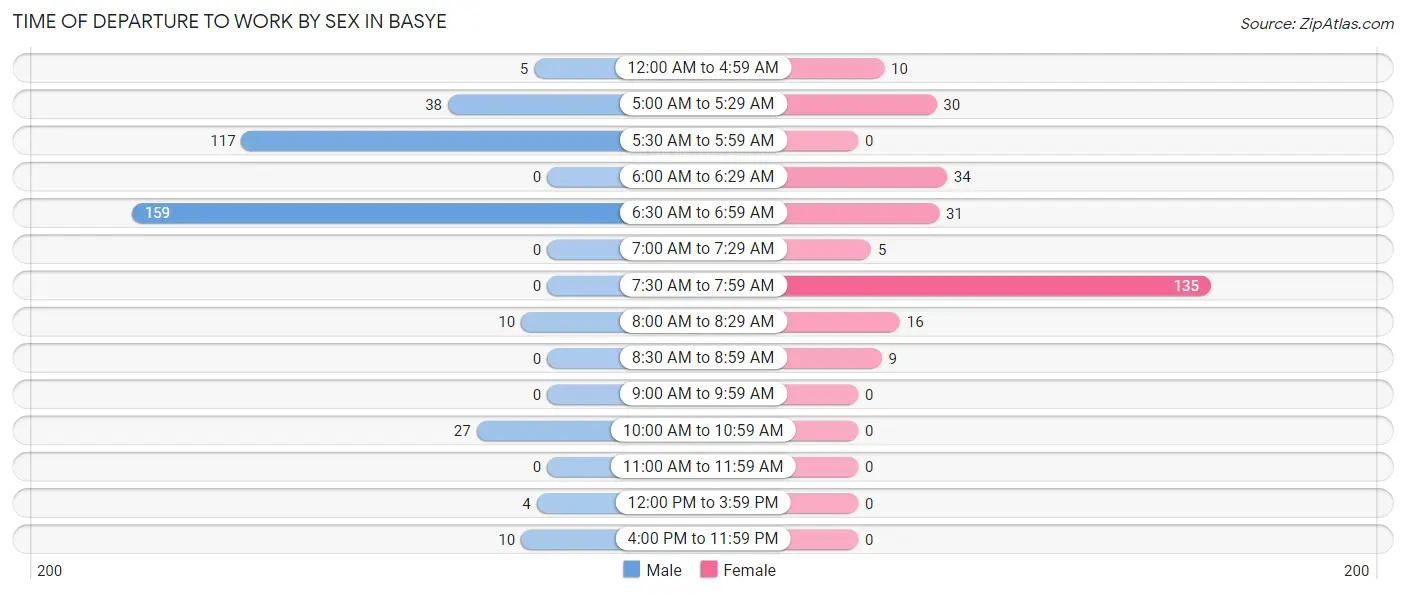
| Time of Departure | Male | Female |
| 12:00 AM to 4:59 AM | 5 (1.3%) | 10 (3.7%) |
| 5:00 AM to 5:29 AM | 38 (10.3%) | 30 (11.1%) |
| 5:30 AM to 5:59 AM | 117 (31.6%) | 0 (0.0%) |
| 6:00 AM to 6:29 AM | 0 (0.0%) | 34 (12.6%) |
| 6:30 AM to 6:59 AM | 159 (43.0%) | 31 (11.5%) |
| 7:00 AM to 7:29 AM | 0 (0.0%) | 5 (1.8%) |
| 7:30 AM to 7:59 AM | 0 (0.0%) | 135 (50.0%) |
| 8:00 AM to 8:29 AM | 10 (2.7%) | 16 (5.9%) |
| 8:30 AM to 8:59 AM | 0 (0.0%) | 9 (3.3%) |
| 9:00 AM to 9:59 AM | 0 (0.0%) | 0 (0.0%) |
| 10:00 AM to 10:59 AM | 27 (7.3%) | 0 (0.0%) |
| 11:00 AM to 11:59 AM | 0 (0.0%) | 0 (0.0%) |
| 12:00 PM to 3:59 PM | 4 (1.1%) | 0 (0.0%) |
| 4:00 PM to 11:59 PM | 10 (2.7%) | 0 (0.0%) |
| Total | 370 (100.0%) | 270 (100.0%) |
Housing Occupancy in Basye
Occupancy by Ownership in Basye
Of the total 451 dwellings in Basye, owner-occupied units account for 408 (90.5%), while renter-occupied units make up 43 (9.5%).
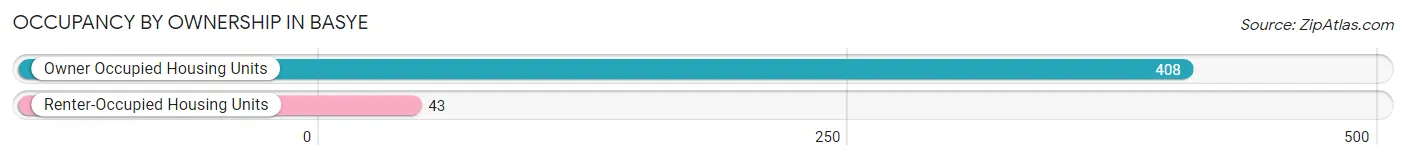
| Occupancy | # Housing Units | % Housing Units |
| Owner Occupied Housing Units | 408 | 90.5% |
| Renter-Occupied Housing Units | 43 | 9.5% |
| Total Occupied Housing Units | 451 | 100.0% |
Occupancy by Household Size in Basye
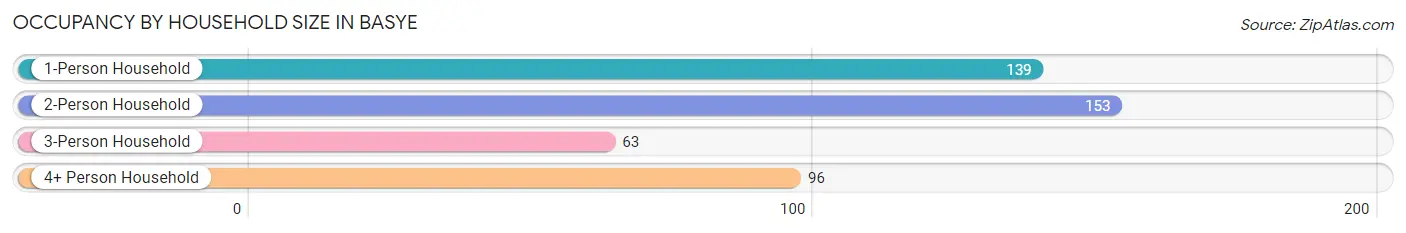
| Household Size | # Housing Units | % Housing Units |
| 1-Person Household | 139 | 30.8% |
| 2-Person Household | 153 | 33.9% |
| 3-Person Household | 63 | 14.0% |
| 4+ Person Household | 96 | 21.3% |
| Total Housing Units | 451 | 100.0% |
Occupancy by Ownership by Household Size in Basye
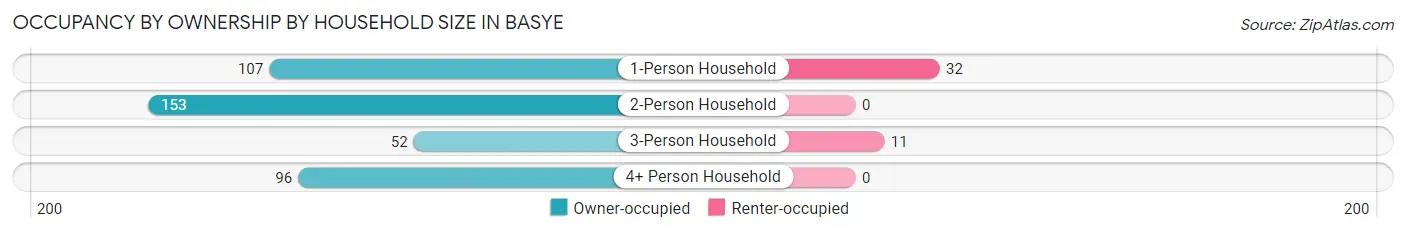
| Household Size | Owner-occupied | Renter-occupied |
| 1-Person Household | 107 (77.0%) | 32 (23.0%) |
| 2-Person Household | 153 (100.0%) | 0 (0.0%) |
| 3-Person Household | 52 (82.5%) | 11 (17.5%) |
| 4+ Person Household | 96 (100.0%) | 0 (0.0%) |
| Total Housing Units | 408 (90.5%) | 43 (9.5%) |
Occupancy by Educational Attainment in Basye
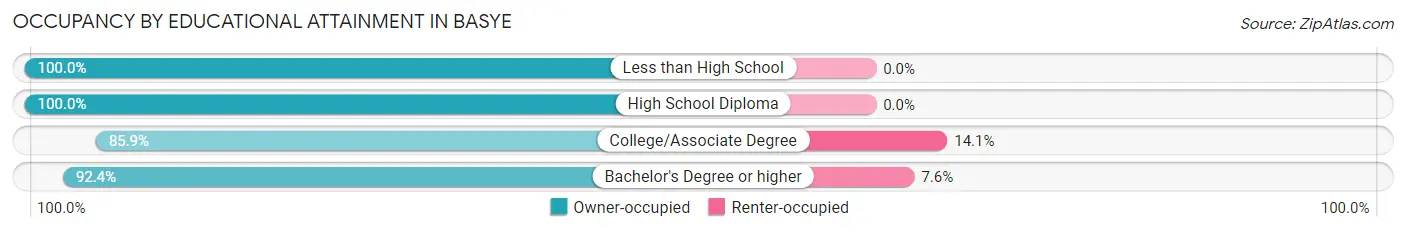
| Household Size | Owner-occupied | Renter-occupied |
| Less than High School | 19 (100.0%) | 0 (0.0%) |
| High School Diploma | 60 (100.0%) | 0 (0.0%) |
| College/Associate Degree | 195 (85.9%) | 32 (14.1%) |
| Bachelor's Degree or higher | 134 (92.4%) | 11 (7.6%) |
Occupancy by Age of Householder in Basye
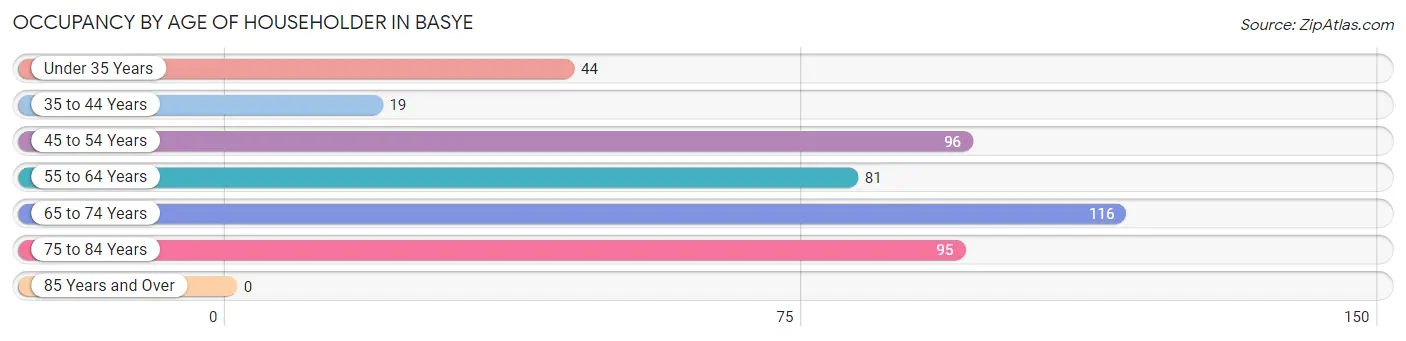
| Age Bracket | # Households | % Households |
| Under 35 Years | 44 | 9.8% |
| 35 to 44 Years | 19 | 4.2% |
| 45 to 54 Years | 96 | 21.3% |
| 55 to 64 Years | 81 | 18.0% |
| 65 to 74 Years | 116 | 25.7% |
| 75 to 84 Years | 95 | 21.1% |
| 85 Years and Over | 0 | 0.0% |
| Total | 451 | 100.0% |
Housing Finances in Basye
Median Income by Occupancy in Basye
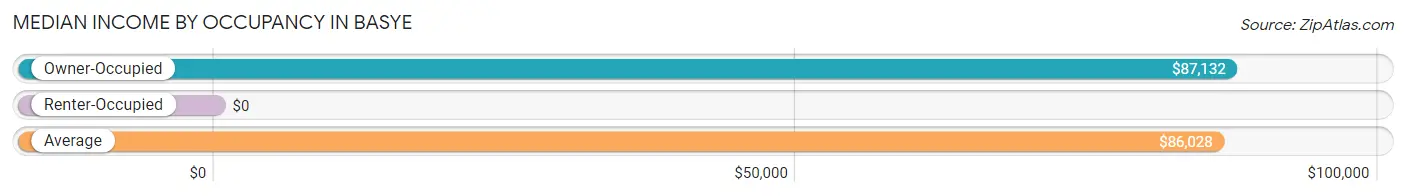
| Occupancy Type | # Households | Median Income |
| Owner-Occupied | 408 (90.5%) | $87,132 |
| Renter-Occupied | 43 (9.5%) | $0 |
| Average | 451 (100.0%) | $86,028 |
Occupancy by Householder Income Bracket in Basye
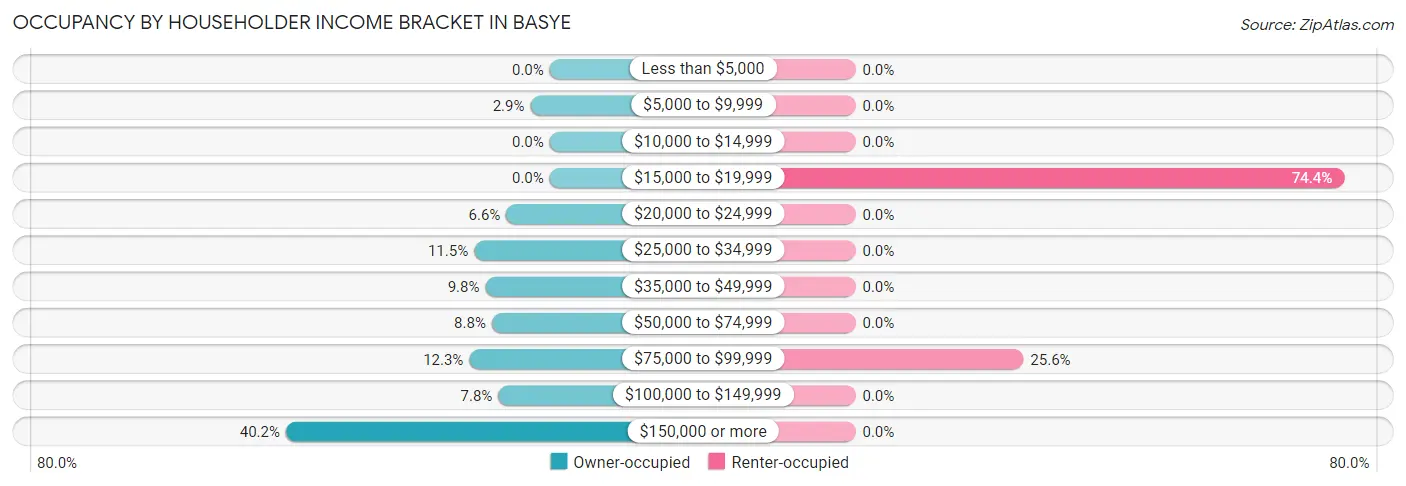
| Income Bracket | Owner-occupied | Renter-occupied |
| Less than $5,000 | 0 (0.0%) | 0 (0.0%) |
| $5,000 to $9,999 | 12 (2.9%) | 0 (0.0%) |
| $10,000 to $14,999 | 0 (0.0%) | 0 (0.0%) |
| $15,000 to $19,999 | 0 (0.0%) | 32 (74.4%) |
| $20,000 to $24,999 | 27 (6.6%) | 0 (0.0%) |
| $25,000 to $34,999 | 47 (11.5%) | 0 (0.0%) |
| $35,000 to $49,999 | 40 (9.8%) | 0 (0.0%) |
| $50,000 to $74,999 | 36 (8.8%) | 0 (0.0%) |
| $75,000 to $99,999 | 50 (12.2%) | 11 (25.6%) |
| $100,000 to $149,999 | 32 (7.8%) | 0 (0.0%) |
| $150,000 or more | 164 (40.2%) | 0 (0.0%) |
| Total | 408 (100.0%) | 43 (100.0%) |
Monthly Housing Cost Tiers in Basye
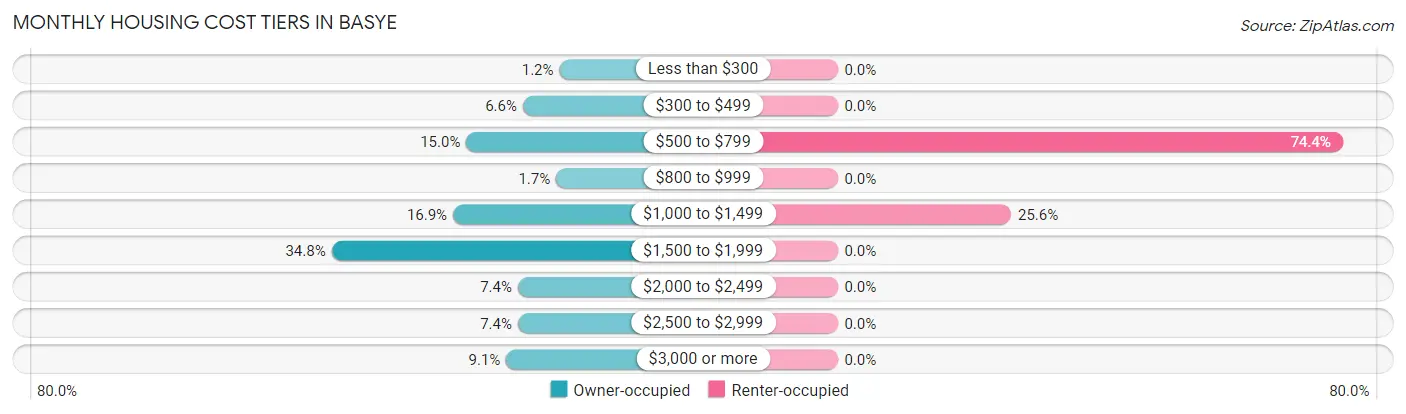
| Monthly Cost | Owner-occupied | Renter-occupied |
| Less than $300 | 5 (1.2%) | 0 (0.0%) |
| $300 to $499 | 27 (6.6%) | 0 (0.0%) |
| $500 to $799 | 61 (14.9%) | 32 (74.4%) |
| $800 to $999 | 7 (1.7%) | 0 (0.0%) |
| $1,000 to $1,499 | 69 (16.9%) | 11 (25.6%) |
| $1,500 to $1,999 | 142 (34.8%) | 0 (0.0%) |
| $2,000 to $2,499 | 30 (7.3%) | 0 (0.0%) |
| $2,500 to $2,999 | 30 (7.3%) | 0 (0.0%) |
| $3,000 or more | 37 (9.1%) | 0 (0.0%) |
| Total | 408 (100.0%) | 43 (100.0%) |
Physical Housing Characteristics in Basye
Housing Structures in Basye
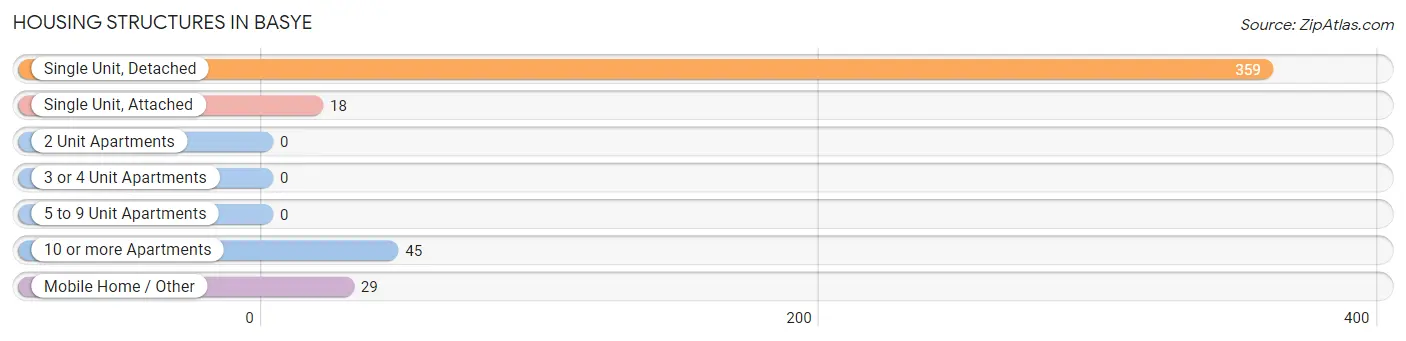
| Structure Type | # Housing Units | % Housing Units |
| Single Unit, Detached | 359 | 79.6% |
| Single Unit, Attached | 18 | 4.0% |
| 2 Unit Apartments | 0 | 0.0% |
| 3 or 4 Unit Apartments | 0 | 0.0% |
| 5 to 9 Unit Apartments | 0 | 0.0% |
| 10 or more Apartments | 45 | 10.0% |
| Mobile Home / Other | 29 | 6.4% |
| Total | 451 | 100.0% |
Housing Structures by Occupancy in Basye
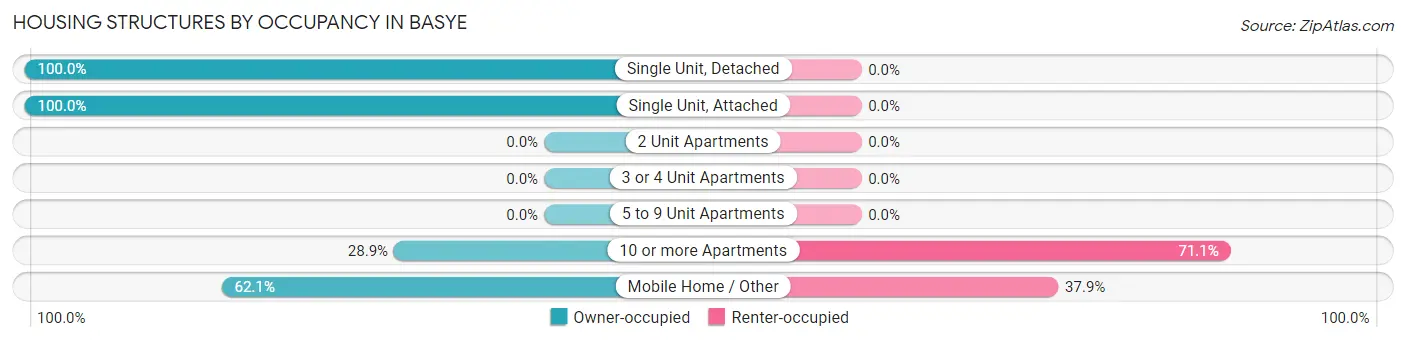
| Structure Type | Owner-occupied | Renter-occupied |
| Single Unit, Detached | 359 (100.0%) | 0 (0.0%) |
| Single Unit, Attached | 18 (100.0%) | 0 (0.0%) |
| 2 Unit Apartments | 0 (0.0%) | 0 (0.0%) |
| 3 or 4 Unit Apartments | 0 (0.0%) | 0 (0.0%) |
| 5 to 9 Unit Apartments | 0 (0.0%) | 0 (0.0%) |
| 10 or more Apartments | 13 (28.9%) | 32 (71.1%) |
| Mobile Home / Other | 18 (62.1%) | 11 (37.9%) |
| Total | 408 (90.5%) | 43 (9.5%) |
Housing Structures by Number of Rooms in Basye
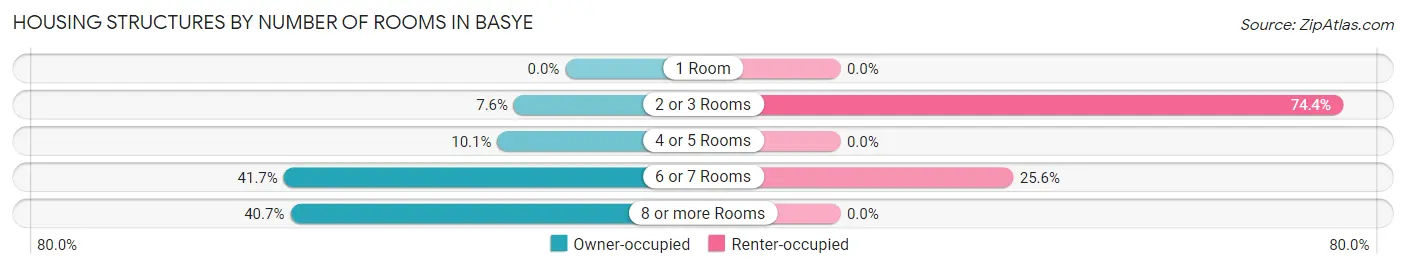
| Number of Rooms | Owner-occupied | Renter-occupied |
| 1 Room | 0 (0.0%) | 0 (0.0%) |
| 2 or 3 Rooms | 31 (7.6%) | 32 (74.4%) |
| 4 or 5 Rooms | 41 (10.1%) | 0 (0.0%) |
| 6 or 7 Rooms | 170 (41.7%) | 11 (25.6%) |
| 8 or more Rooms | 166 (40.7%) | 0 (0.0%) |
| Total | 408 (100.0%) | 43 (100.0%) |
Housing Structure by Heating Type in Basye
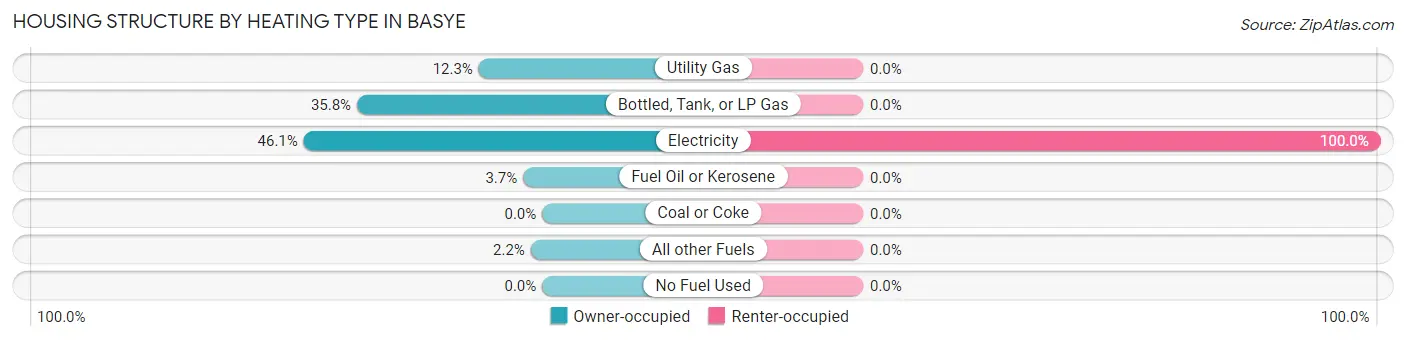
| Heating Type | Owner-occupied | Renter-occupied |
| Utility Gas | 50 (12.2%) | 0 (0.0%) |
| Bottled, Tank, or LP Gas | 146 (35.8%) | 0 (0.0%) |
| Electricity | 188 (46.1%) | 43 (100.0%) |
| Fuel Oil or Kerosene | 15 (3.7%) | 0 (0.0%) |
| Coal or Coke | 0 (0.0%) | 0 (0.0%) |
| All other Fuels | 9 (2.2%) | 0 (0.0%) |
| No Fuel Used | 0 (0.0%) | 0 (0.0%) |
| Total | 408 (100.0%) | 43 (100.0%) |
Household Vehicle Usage in Basye
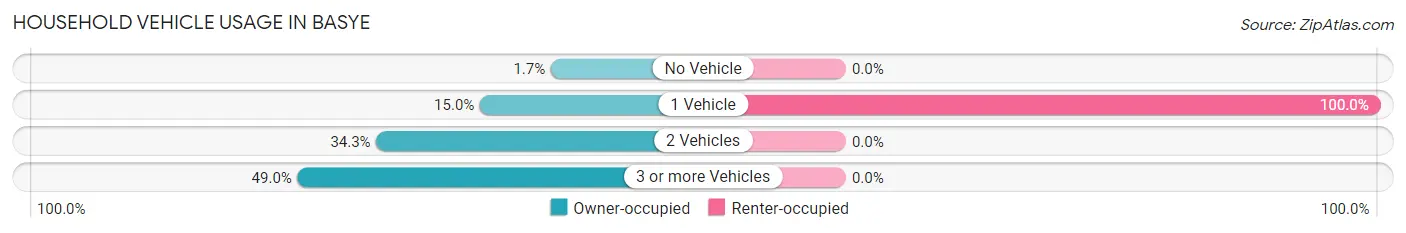
| Vehicles per Household | Owner-occupied | Renter-occupied |
| No Vehicle | 7 (1.7%) | 0 (0.0%) |
| 1 Vehicle | 61 (14.9%) | 43 (100.0%) |
| 2 Vehicles | 140 (34.3%) | 0 (0.0%) |
| 3 or more Vehicles | 200 (49.0%) | 0 (0.0%) |
| Total | 408 (100.0%) | 43 (100.0%) |
Real Estate & Mortgages in Basye
Real Estate and Mortgage Overview in Basye
| Characteristic | Without Mortgage | With Mortgage |
| Housing Units | 91 | 317 |
| Median Property Value | $246,900 | $241,300 |
| Median Household Income | $47,542 | $164 |
| Monthly Housing Costs | $575 | $37 |
| Real Estate Taxes | - | - |
Property Value by Mortgage Status in Basye
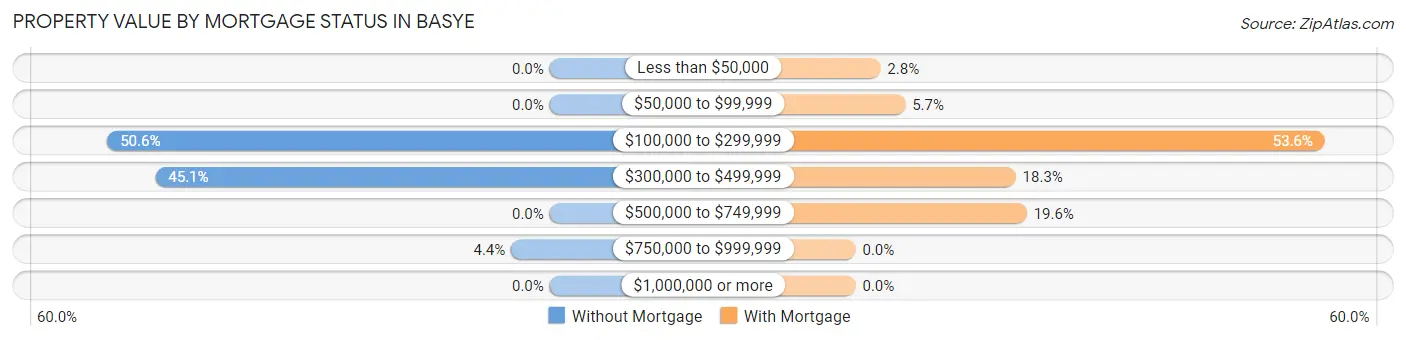
| Property Value | Without Mortgage | With Mortgage |
| Less than $50,000 | 0 (0.0%) | 9 (2.8%) |
| $50,000 to $99,999 | 0 (0.0%) | 18 (5.7%) |
| $100,000 to $299,999 | 46 (50.5%) | 170 (53.6%) |
| $300,000 to $499,999 | 41 (45.1%) | 58 (18.3%) |
| $500,000 to $749,999 | 0 (0.0%) | 62 (19.6%) |
| $750,000 to $999,999 | 4 (4.4%) | 0 (0.0%) |
| $1,000,000 or more | 0 (0.0%) | 0 (0.0%) |
| Total | 91 (100.0%) | 317 (100.0%) |
Household Income by Mortgage Status in Basye

| Household Income | Without Mortgage | With Mortgage |
| Less than $10,000 | 3 (3.3%) | 0 (0.0%) |
| $10,000 to $24,999 | 9 (9.9%) | 9 (2.8%) |
| $25,000 to $34,999 | 33 (36.3%) | 18 (5.7%) |
| $35,000 to $49,999 | 30 (33.0%) | 14 (4.4%) |
| $50,000 to $74,999 | 9 (9.9%) | 10 (3.2%) |
| $75,000 to $99,999 | 3 (3.3%) | 27 (8.5%) |
| $100,000 to $149,999 | 4 (4.4%) | 47 (14.8%) |
| $150,000 or more | 0 (0.0%) | 28 (8.8%) |
| Total | 91 (100.0%) | 317 (100.0%) |
Property Value to Household Income Ratio in Basye
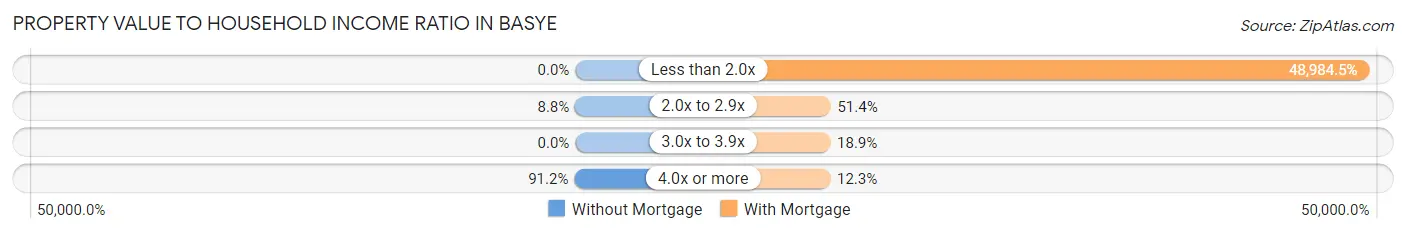
| Value-to-Income Ratio | Without Mortgage | With Mortgage |
| Less than 2.0x | 0 (0.0%) | 155,281 (48,984.5%) |
| 2.0x to 2.9x | 8 (8.8%) | 163 (51.4%) |
| 3.0x to 3.9x | 0 (0.0%) | 60 (18.9%) |
| 4.0x or more | 83 (91.2%) | 39 (12.3%) |
| Total | 91 (100.0%) | 317 (100.0%) |
Real Estate Taxes by Mortgage Status in Basye
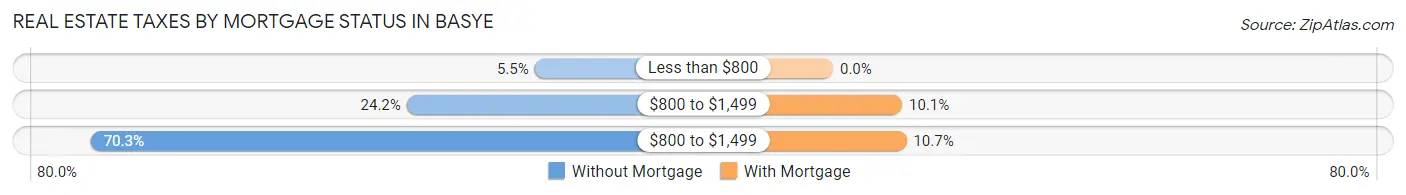
| Property Taxes | Without Mortgage | With Mortgage |
| Less than $800 | 5 (5.5%) | 0 (0.0%) |
| $800 to $1,499 | 22 (24.2%) | 32 (10.1%) |
| $800 to $1,499 | 64 (70.3%) | 34 (10.7%) |
| Total | 91 (100.0%) | 317 (100.0%) |
Health & Disability in Basye
Health Insurance Coverage by Age in Basye
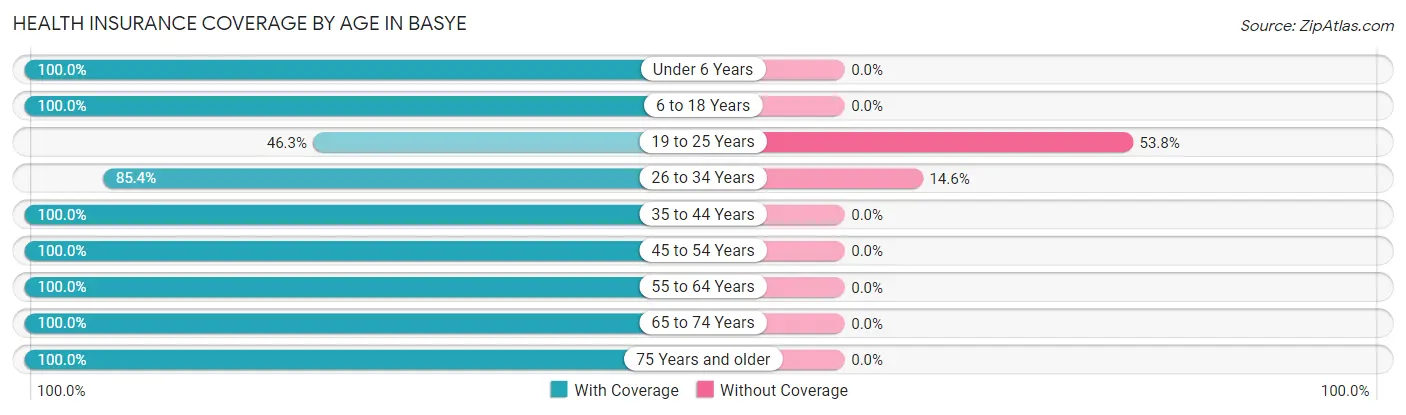
| Age Bracket | With Coverage | Without Coverage |
| Under 6 Years | 153 (100.0%) | 0 (0.0%) |
| 6 to 18 Years | 50 (100.0%) | 0 (0.0%) |
| 19 to 25 Years | 74 (46.3%) | 86 (53.7%) |
| 26 to 34 Years | 164 (85.4%) | 28 (14.6%) |
| 35 to 44 Years | 81 (100.0%) | 0 (0.0%) |
| 45 to 54 Years | 267 (100.0%) | 0 (0.0%) |
| 55 to 64 Years | 114 (100.0%) | 0 (0.0%) |
| 65 to 74 Years | 149 (100.0%) | 0 (0.0%) |
| 75 Years and older | 175 (100.0%) | 0 (0.0%) |
| Total | 1,227 (91.5%) | 114 (8.5%) |
Health Insurance Coverage by Citizenship Status in Basye
| Citizenship Status | With Coverage | Without Coverage |
| Native Born | 153 (100.0%) | 0 (0.0%) |
| Foreign Born, Citizen | 50 (100.0%) | 0 (0.0%) |
| Foreign Born, not a Citizen | 74 (46.3%) | 86 (53.7%) |
Health Insurance Coverage by Household Income in Basye
| Household Income | With Coverage | Without Coverage |
| Under $25,000 | 71 (100.0%) | 0 (0.0%) |
| $25,000 to $49,999 | 212 (100.0%) | 0 (0.0%) |
| $50,000 to $74,999 | 68 (100.0%) | 0 (0.0%) |
| $75,000 to $99,999 | 183 (100.0%) | 0 (0.0%) |
| $100,000 and over | 690 (85.8%) | 114 (14.2%) |
Public vs Private Health Insurance Coverage by Age in Basye
| Age Bracket | Public Insurance | Private Insurance |
| Under 6 | 36 (23.5%) | 117 (76.5%) |
| 6 to 18 Years | 32 (64.0%) | 18 (36.0%) |
| 19 to 25 Years | 0 (0.0%) | 74 (46.3%) |
| 25 to 34 Years | 55 (28.6%) | 119 (62.0%) |
| 35 to 44 Years | 22 (27.2%) | 59 (72.8%) |
| 45 to 54 Years | 3 (1.1%) | 264 (98.9%) |
| 55 to 64 Years | 61 (53.5%) | 82 (71.9%) |
| 65 to 74 Years | 149 (100.0%) | 124 (83.2%) |
| 75 Years and over | 175 (100.0%) | 105 (60.0%) |
| Total | 533 (39.8%) | 962 (71.7%) |
Disability Status by Sex by Age in Basye
| Age Bracket | Male | Female |
| Under 5 Years | 0 (0.0%) | 0 (0.0%) |
| 5 to 17 Years | 0 (0.0%) | 0 (0.0%) |
| 18 to 34 Years | 0 (0.0%) | 0 (0.0%) |
| 35 to 64 Years | 0 (0.0%) | 32 (13.9%) |
| 65 to 74 Years | 0 (0.0%) | 35 (32.1%) |
| 75 Years and over | 79 (56.8%) | 0 (0.0%) |
Disability Class by Sex by Age in Basye
Disability Class: Hearing Difficulty
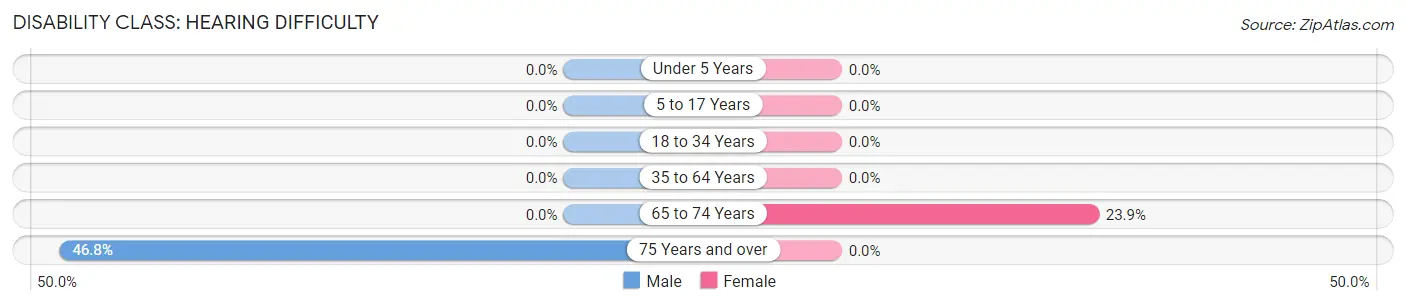
| Age Bracket | Male | Female |
| Under 5 Years | 0 (0.0%) | 0 (0.0%) |
| 5 to 17 Years | 0 (0.0%) | 0 (0.0%) |
| 18 to 34 Years | 0 (0.0%) | 0 (0.0%) |
| 35 to 64 Years | 0 (0.0%) | 0 (0.0%) |
| 65 to 74 Years | 0 (0.0%) | 26 (23.8%) |
| 75 Years and over | 65 (46.8%) | 0 (0.0%) |
Disability Class: Vision Difficulty
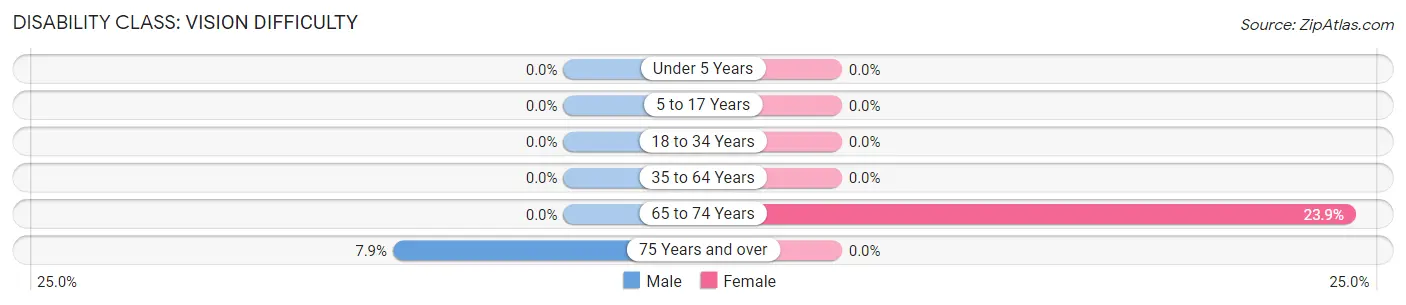
| Age Bracket | Male | Female |
| Under 5 Years | 0 (0.0%) | 0 (0.0%) |
| 5 to 17 Years | 0 (0.0%) | 0 (0.0%) |
| 18 to 34 Years | 0 (0.0%) | 0 (0.0%) |
| 35 to 64 Years | 0 (0.0%) | 0 (0.0%) |
| 65 to 74 Years | 0 (0.0%) | 26 (23.8%) |
| 75 Years and over | 11 (7.9%) | 0 (0.0%) |
Disability Class: Cognitive Difficulty
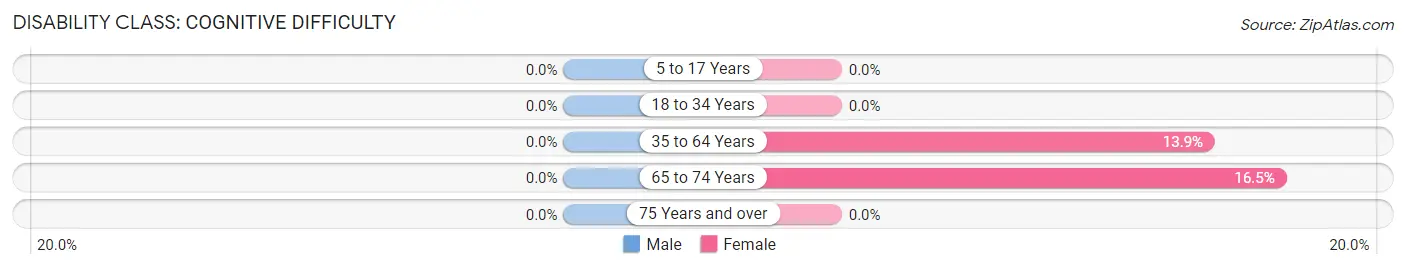
| Age Bracket | Male | Female |
| 5 to 17 Years | 0 (0.0%) | 0 (0.0%) |
| 18 to 34 Years | 0 (0.0%) | 0 (0.0%) |
| 35 to 64 Years | 0 (0.0%) | 32 (13.9%) |
| 65 to 74 Years | 0 (0.0%) | 18 (16.5%) |
| 75 Years and over | 0 (0.0%) | 0 (0.0%) |
Disability Class: Ambulatory Difficulty
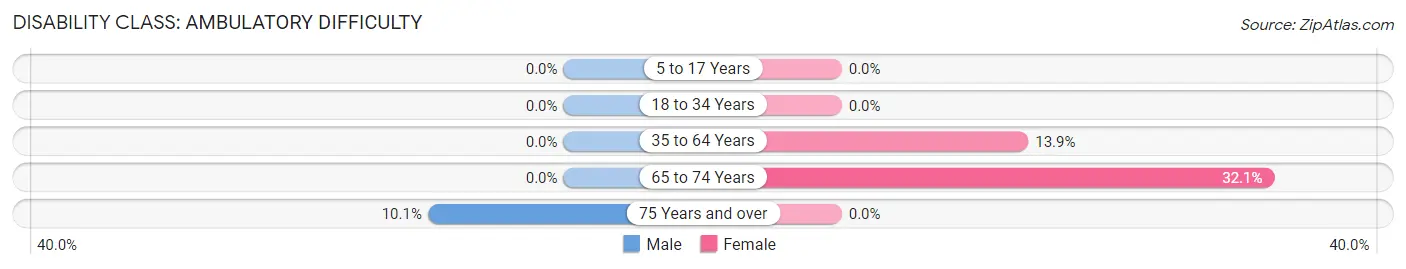
| Age Bracket | Male | Female |
| 5 to 17 Years | 0 (0.0%) | 0 (0.0%) |
| 18 to 34 Years | 0 (0.0%) | 0 (0.0%) |
| 35 to 64 Years | 0 (0.0%) | 32 (13.9%) |
| 65 to 74 Years | 0 (0.0%) | 35 (32.1%) |
| 75 Years and over | 14 (10.1%) | 0 (0.0%) |
Disability Class: Self-Care Difficulty
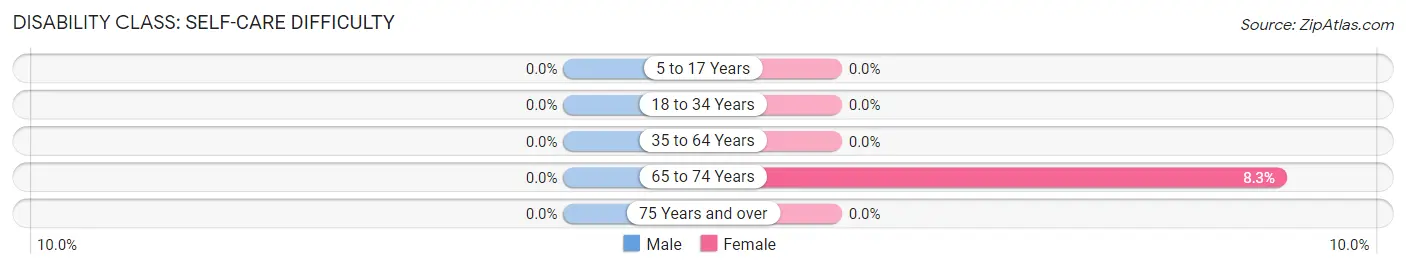
| Age Bracket | Male | Female |
| 5 to 17 Years | 0 (0.0%) | 0 (0.0%) |
| 18 to 34 Years | 0 (0.0%) | 0 (0.0%) |
| 35 to 64 Years | 0 (0.0%) | 0 (0.0%) |
| 65 to 74 Years | 0 (0.0%) | 9 (8.3%) |
| 75 Years and over | 0 (0.0%) | 0 (0.0%) |
Technology Access in Basye
Computing Device Access in Basye
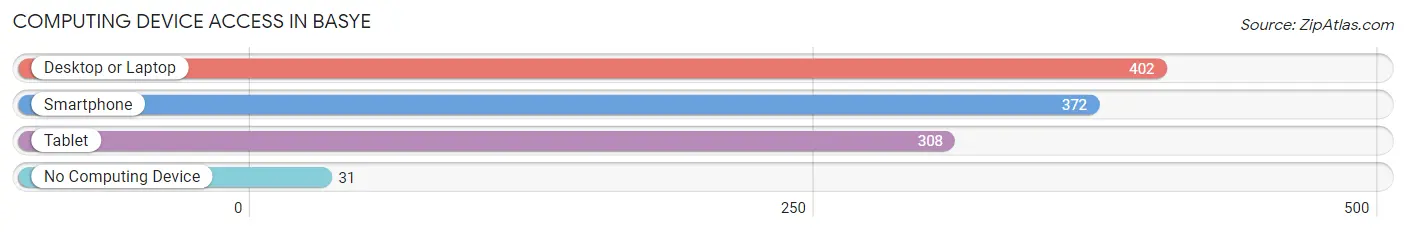
| Device Type | # Households | % Households |
| Desktop or Laptop | 402 | 89.1% |
| Smartphone | 372 | 82.5% |
| Tablet | 308 | 68.3% |
| No Computing Device | 31 | 6.9% |
| Total | 451 | 100.0% |
Internet Access in Basye
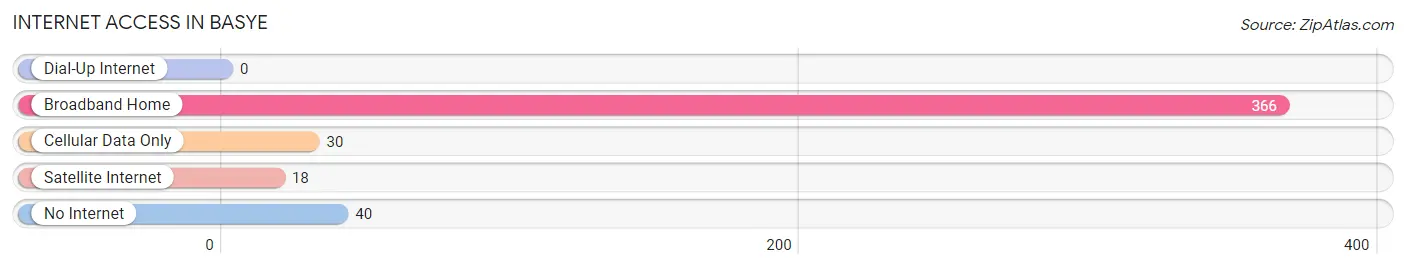
| Internet Type | # Households | % Households |
| Dial-Up Internet | 0 | 0.0% |
| Broadband Home | 366 | 81.1% |
| Cellular Data Only | 30 | 6.7% |
| Satellite Internet | 18 | 4.0% |
| No Internet | 40 | 8.9% |
| Total | 451 | 100.0% |
Basye Summary
Basye, Virginia is a small unincorporated community located in the Shenandoah Valley of Virginia. It is situated in the northern part of the state, in the county of Shenandoah. The town is located near the border of West Virginia and is approximately 30 miles from the city of Winchester. Basye is a rural community with a population of just over 500 people.
History
The area that is now Basye was first settled in the late 1700s by German immigrants. The town was originally known as “Basye’s Mill” and was named after the first settler, John Basye. The town was officially incorporated in 1891 and was named after the Basye family.
The town was a popular stop for travelers on the Valley Turnpike, which connected Winchester to Harrisonburg. The turnpike was built in the early 1800s and was the main route for travelers in the area.
In the late 1800s, the town was home to a number of businesses, including a hotel, a general store, a blacksmith shop, and a post office. The town also had a school, which was built in 1891.
Geography
Basye is located in the northern part of Shenandoah County, Virginia. It is situated in the Shenandoah Valley, which is a large valley that stretches from the Blue Ridge Mountains to the Allegheny Mountains. The town is located near the border of West Virginia and is approximately 30 miles from the city of Winchester.
The town is surrounded by the George Washington National Forest, which is a large forest that covers over 1.8 million acres of land. The forest is home to a variety of wildlife, including deer, bear, and wild turkey.
Economy
The economy of Basye is largely based on tourism. The town is home to a number of attractions, including Bryce Resort, which is a ski resort located in the nearby mountains. The resort offers skiing, snowboarding, and other winter activities.
The town is also home to a number of wineries, which produce a variety of wines. The town is also home to a number of antique shops, which sell a variety of items from the past.
Demographics
As of the 2010 census, the population of Basye was 517 people. The town is predominantly white, with 95.3% of the population being white. The median household income in the town is $45,000, which is slightly lower than the national average.
The town is home to a number of churches, including the Basye United Methodist Church, the Basye Baptist Church, and the Basye Presbyterian Church. The town also has a number of schools, including the Basye Elementary School and the Basye High School.
Conclusion
Basye, Virginia is a small unincorporated community located in the Shenandoah Valley of Virginia. It is situated in the northern part of the state, in the county of Shenandoah. The town was first settled in the late 1700s by German immigrants and was officially incorporated in 1891. The town is largely based on tourism, with a number of attractions, wineries, and antique shops. The population of Basye is 517 people, with the median household income being $45,000. The town is home to a number of churches and schools, making it a great place to live and visit.
Common Questions
What is Per Capita Income in Basye?
Per Capita income in Basye is $42,148.
What is the Median Household income in Basye?
Median Household Income in Basye is $86,028.
What is Income or Wage Gap in Basye?
Income or Wage Gap in Basye is 39.4%.
Women in Basye earn 60.6 cents for every dollar earned by a man.
What is Inequality or Gini Index in Basye?
Inequality or Gini Index in Basye is 0.42.
What is the Total Population of Basye?
Total Population of Basye is 1,341.
What is the Total Male Population of Basye?
Total Male Population of Basye is 693.
What is the Total Female Population of Basye?
Total Female Population of Basye is 648.
What is the Ratio of Males per 100 Females in Basye?
There are 106.94 Males per 100 Females in Basye.
What is the Ratio of Females per 100 Males in Basye?
There are 93.51 Females per 100 Males in Basye.
What is the Median Population Age in Basye?
Median Population Age in Basye is 47.0 Years.
What is the Average Family Size in Basye
Average Family Size in Basye is 4.1 People.
What is the Average Household Size in Basye
Average Household Size in Basye is 3.0 People.
How Large is the Labor Force in Basye?
There are 640 People in the Labor Forcein in Basye.
What is the Percentage of People in the Labor Force in Basye?
56.2% of People are in the Labor Force in Basye.