Twin Lakes, VA Map & Demographics
Twin Lakes Map
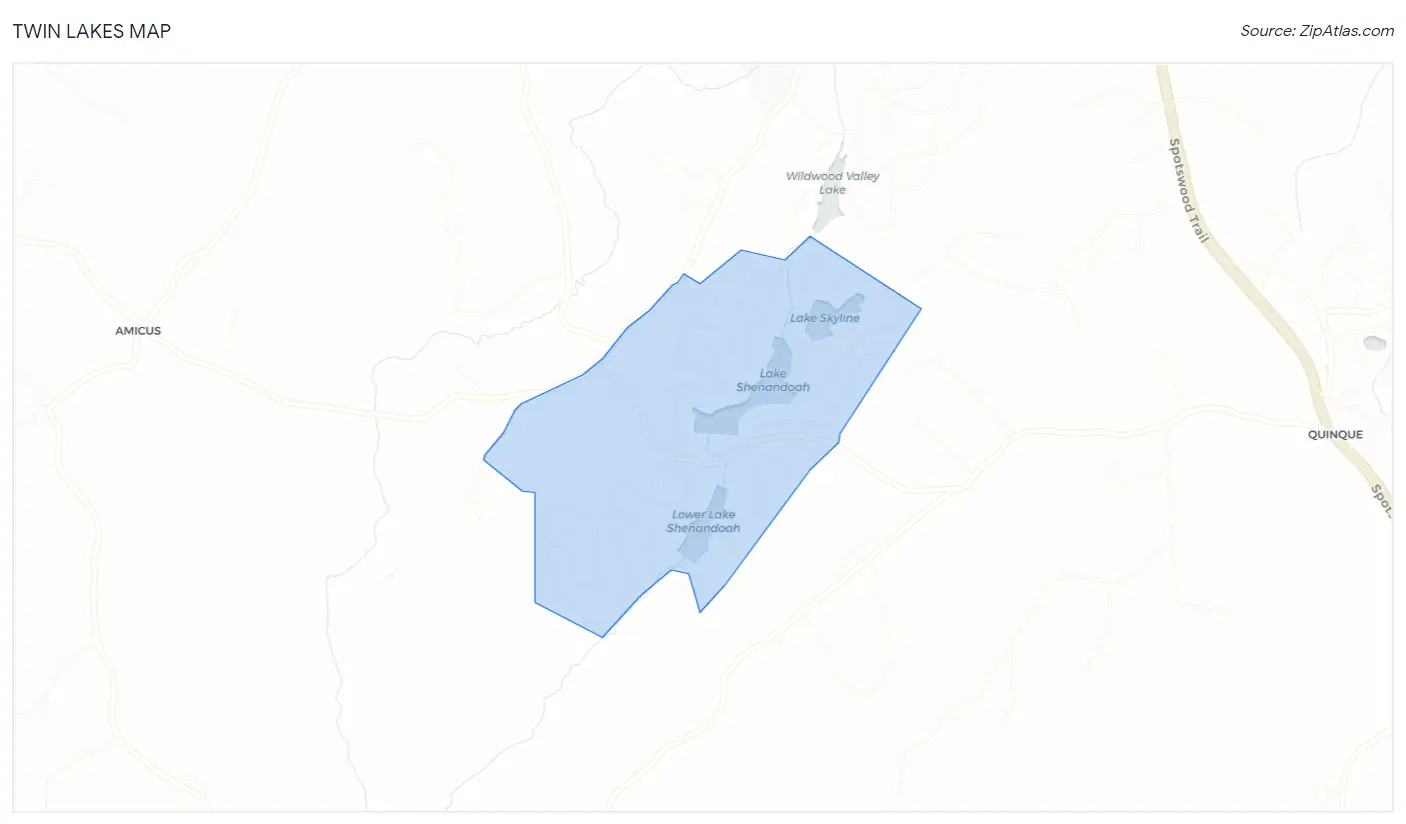
Twin Lakes Overview
$29,059
PER CAPITA INCOME
$62,310
AVG FAMILY INCOME
$63,351
AVG HOUSEHOLD INCOME
20.9%
WAGE / INCOME GAP [ % ]
79.1¢/ $1
WAGE / INCOME GAP [ $ ]
0.25
INEQUALITY / GINI INDEX
1,374
TOTAL POPULATION
636
MALE POPULATION
738
FEMALE POPULATION
86.18
MALES / 100 FEMALES
116.04
FEMALES / 100 MALES
38.8
MEDIAN AGE
2.7
AVG FAMILY SIZE
2.5
AVG HOUSEHOLD SIZE
747
LABOR FORCE [ PEOPLE ]
69.9%
PERCENT IN LABOR FORCE
Income in Twin Lakes
Income Overview in Twin Lakes
Per Capita Income in Twin Lakes is $29,059, while median incomes of families and households are $62,310 and $63,351 respectively.
| Characteristic | Number | Measure |
| Per Capita Income | 1,374 | $29,059 |
| Median Family Income | 423 | $62,310 |
| Mean Family Income | 423 | $66,417 |
| Median Household Income | 541 | $63,351 |
| Mean Household Income | 541 | $69,151 |
| Income Deficit | 423 | $0 |
| Wage / Income Gap (%) | 1,374 | 20.87% |
| Wage / Income Gap ($) | 1,374 | 79.13¢ per $1 |
| Gini / Inequality Index | 1,374 | 0.25 |
Earnings by Sex in Twin Lakes
Average Earnings in Twin Lakes are $36,689, $39,375 for men and $31,157 for women, a difference of 20.9%.
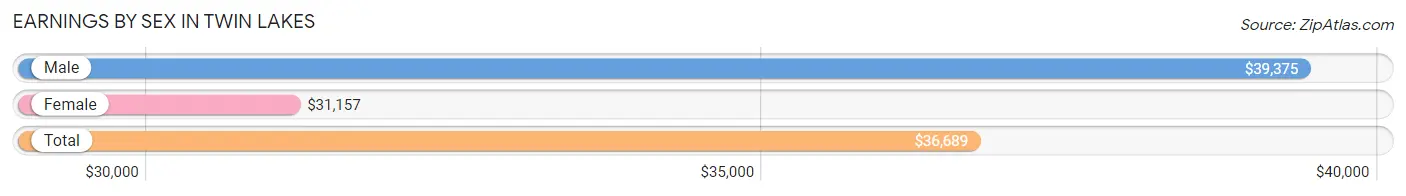
| Sex | Number | Average Earnings |
| Male | 409 (47.2%) | $39,375 |
| Female | 457 (52.8%) | $31,157 |
| Total | 866 (100.0%) | $36,689 |
Earnings by Sex by Income Bracket in Twin Lakes
The most common earnings brackets in Twin Lakes are $35,000 to $39,999 for men (97 | 23.7%) and $20,000 to $22,499 for women (103 | 22.5%).
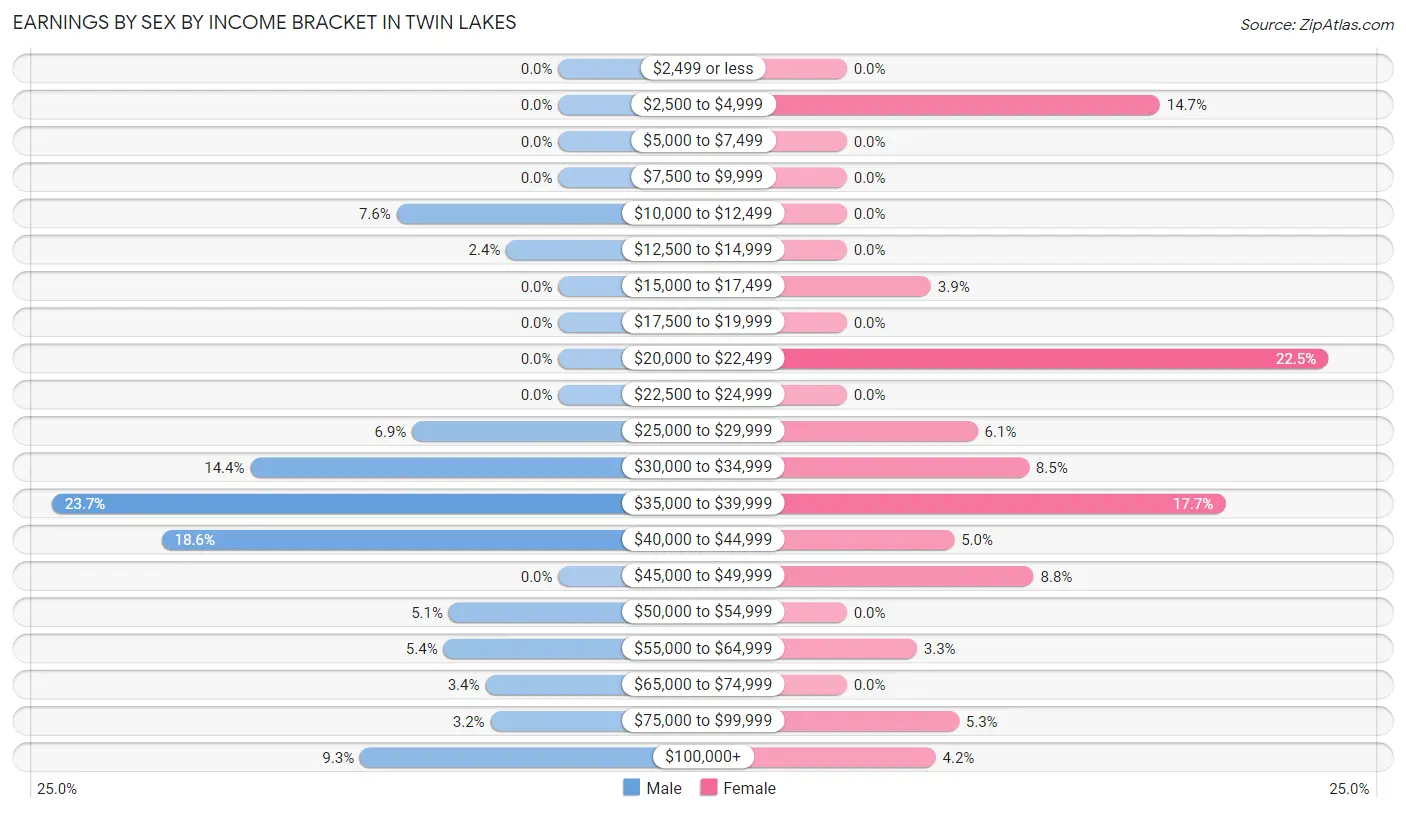
| Income | Male | Female |
| $2,499 or less | 0 (0.0%) | 0 (0.0%) |
| $2,500 to $4,999 | 0 (0.0%) | 67 (14.7%) |
| $5,000 to $7,499 | 0 (0.0%) | 0 (0.0%) |
| $7,500 to $9,999 | 0 (0.0%) | 0 (0.0%) |
| $10,000 to $12,499 | 31 (7.6%) | 0 (0.0%) |
| $12,500 to $14,999 | 10 (2.4%) | 0 (0.0%) |
| $15,000 to $17,499 | 0 (0.0%) | 18 (3.9%) |
| $17,500 to $19,999 | 0 (0.0%) | 0 (0.0%) |
| $20,000 to $22,499 | 0 (0.0%) | 103 (22.5%) |
| $22,500 to $24,999 | 0 (0.0%) | 0 (0.0%) |
| $25,000 to $29,999 | 28 (6.9%) | 28 (6.1%) |
| $30,000 to $34,999 | 59 (14.4%) | 39 (8.5%) |
| $35,000 to $39,999 | 97 (23.7%) | 81 (17.7%) |
| $40,000 to $44,999 | 76 (18.6%) | 23 (5.0%) |
| $45,000 to $49,999 | 0 (0.0%) | 40 (8.7%) |
| $50,000 to $54,999 | 21 (5.1%) | 0 (0.0%) |
| $55,000 to $64,999 | 22 (5.4%) | 15 (3.3%) |
| $65,000 to $74,999 | 14 (3.4%) | 0 (0.0%) |
| $75,000 to $99,999 | 13 (3.2%) | 24 (5.2%) |
| $100,000+ | 38 (9.3%) | 19 (4.2%) |
| Total | 409 (100.0%) | 457 (100.0%) |
Earnings by Sex by Educational Attainment in Twin Lakes
Average earnings in Twin Lakes are $38,811 for men and $31,528 for women, a difference of 18.8%. Men with an educational attainment of college or associate's degree enjoy the highest average annual earnings of $71,071, while those with high school diploma education earn the least with $38,079. Women with an educational attainment of high school diploma earn the most with the average annual earnings of $21,711, while those with high school diploma education have the smallest earnings of $21,711.
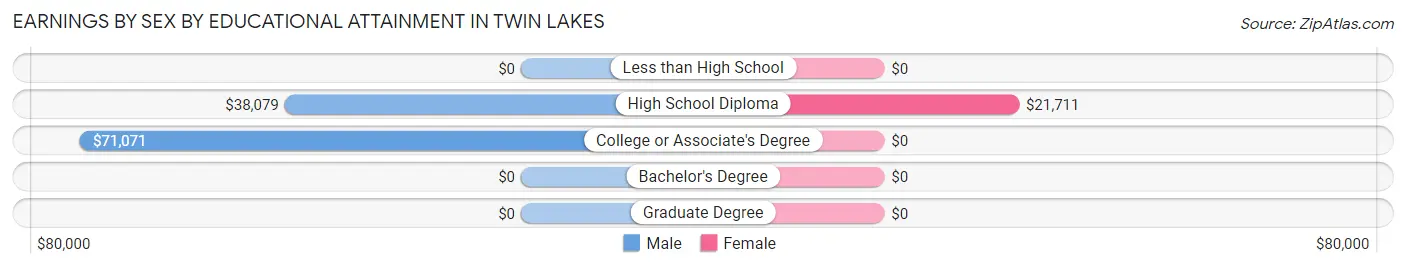
| Educational Attainment | Male Income | Female Income |
| Less than High School | - | - |
| High School Diploma | $38,079 | $21,711 |
| College or Associate's Degree | $71,071 | $0 |
| Bachelor's Degree | - | - |
| Graduate Degree | - | - |
| Total | $38,811 | $31,528 |
Family Income in Twin Lakes
Family Income Brackets in Twin Lakes
According to the Twin Lakes family income data, there are 122 families falling into the $75,000 to $99,999 income range, which is the most common income bracket and makes up 28.8% of all families.
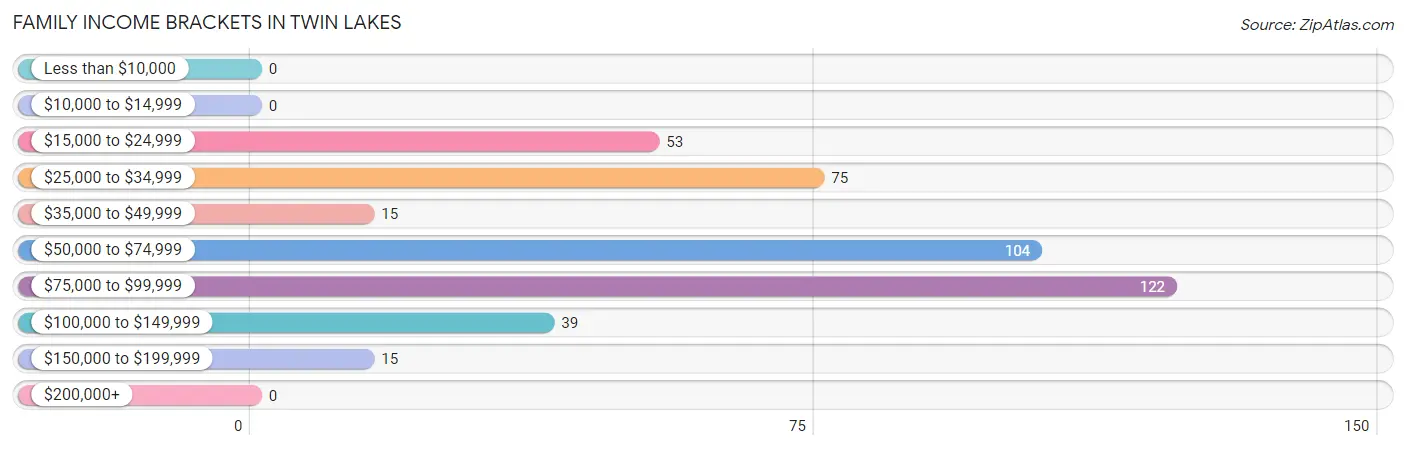
| Income Bracket | # Families | % Families |
| Less than $10,000 | 0 | 0.0% |
| $10,000 to $14,999 | 0 | 0.0% |
| $15,000 to $24,999 | 53 | 12.5% |
| $25,000 to $34,999 | 75 | 17.7% |
| $35,000 to $49,999 | 15 | 3.5% |
| $50,000 to $74,999 | 104 | 24.6% |
| $75,000 to $99,999 | 122 | 28.8% |
| $100,000 to $149,999 | 39 | 9.2% |
| $150,000 to $199,999 | 15 | 3.5% |
| $200,000+ | 0 | 0.0% |
Family Income by Famaliy Size in Twin Lakes
3-person families (129 | 30.5%) account for the highest median family income in Twin Lakes with $82,152 per family, while 2-person families (181 | 42.8%) have the highest median income of $30,883 per family member.
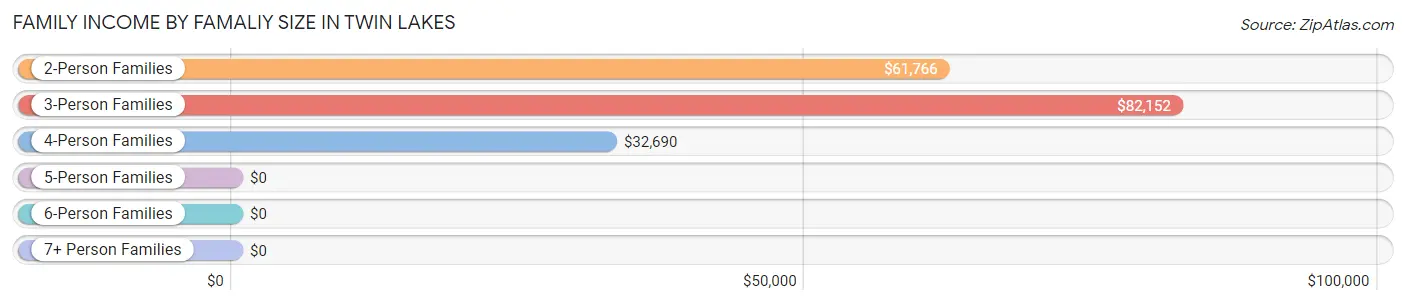
| Income Bracket | # Families | Median Income |
| 2-Person Families | 181 (42.8%) | $61,766 |
| 3-Person Families | 129 (30.5%) | $82,152 |
| 4-Person Families | 113 (26.7%) | $32,690 |
| 5-Person Families | 0 (0.0%) | $0 |
| 6-Person Families | 0 (0.0%) | $0 |
| 7+ Person Families | 0 (0.0%) | $0 |
| Total | 423 (100.0%) | $62,310 |
Family Income by Number of Earners in Twin Lakes
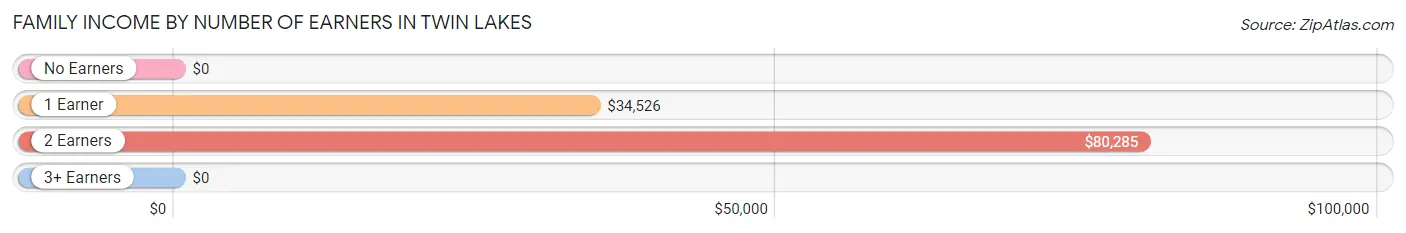
| Number of Earners | # Families | Median Income |
| No Earners | 16 (3.8%) | $0 |
| 1 Earner | 128 (30.3%) | $34,526 |
| 2 Earners | 248 (58.6%) | $80,285 |
| 3+ Earners | 31 (7.3%) | $0 |
| Total | 423 (100.0%) | $62,310 |
Household Income in Twin Lakes
Household Income Brackets in Twin Lakes
With 165 households falling in the category, the $50,000 to $74,999 income range is the most frequent in Twin Lakes, accounting for 30.5% of all households.
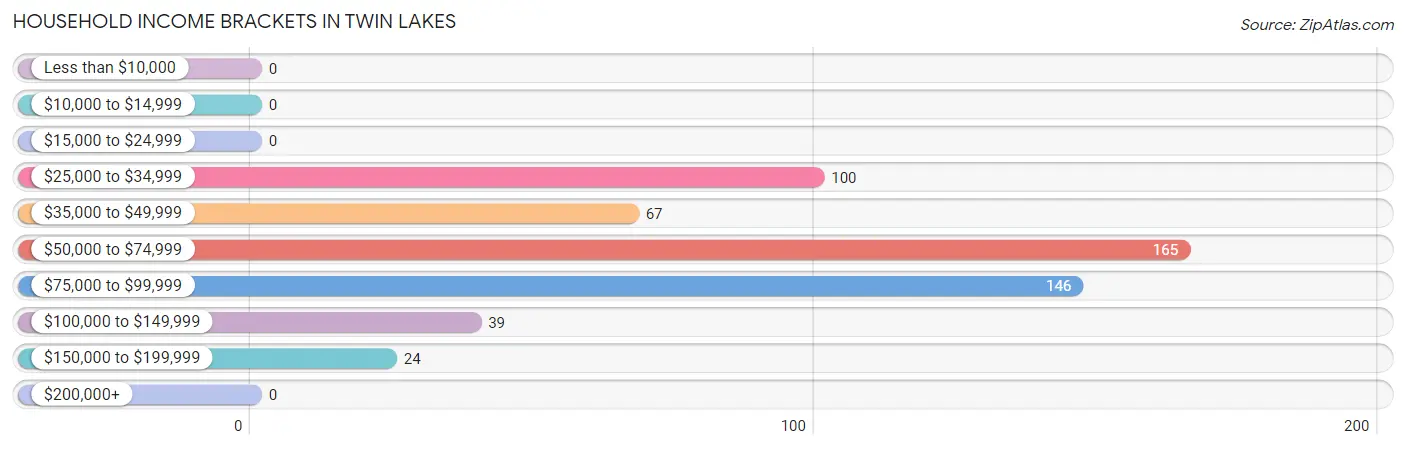
| Income Bracket | # Households | % Households |
| Less than $10,000 | 0 | 0.0% |
| $10,000 to $14,999 | 0 | 0.0% |
| $15,000 to $24,999 | 0 | 0.0% |
| $25,000 to $34,999 | 100 | 18.5% |
| $35,000 to $49,999 | 67 | 12.4% |
| $50,000 to $74,999 | 165 | 30.5% |
| $75,000 to $99,999 | 146 | 27.0% |
| $100,000 to $149,999 | 39 | 7.2% |
| $150,000 to $199,999 | 24 | 4.4% |
| $200,000+ | 0 | 0.0% |
Household Income by Householder Age in Twin Lakes
The median household income in Twin Lakes is $63,351, with the highest median household income of $63,438 found in the 45 to 64 years age bracket for the primary householder. A total of 234 households (43.2%) fall into this category. Meanwhile, the 15 to 24 years age bracket for the primary householder has the lowest median household income of $0, with 61 households (11.3%) in this group.
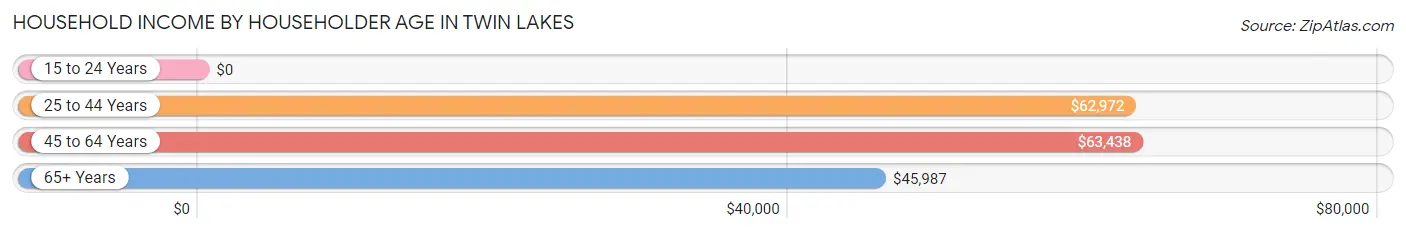
| Income Bracket | # Households | Median Income |
| 15 to 24 Years | 61 (11.3%) | $0 |
| 25 to 44 Years | 138 (25.5%) | $62,972 |
| 45 to 64 Years | 234 (43.2%) | $63,438 |
| 65+ Years | 108 (20.0%) | $45,987 |
| Total | 541 (100.0%) | $63,351 |
Poverty in Twin Lakes
Income Below Poverty by Sex and Age in Twin Lakes
With 5.8% poverty level for males and 20.2% for females among the residents of Twin Lakes, 12 to 14 year old males and 16 and 17 year old females are the most vulnerable to poverty, with 29 males (58.0%) and 51 females (100.0%) in their respective age groups living below the poverty level.
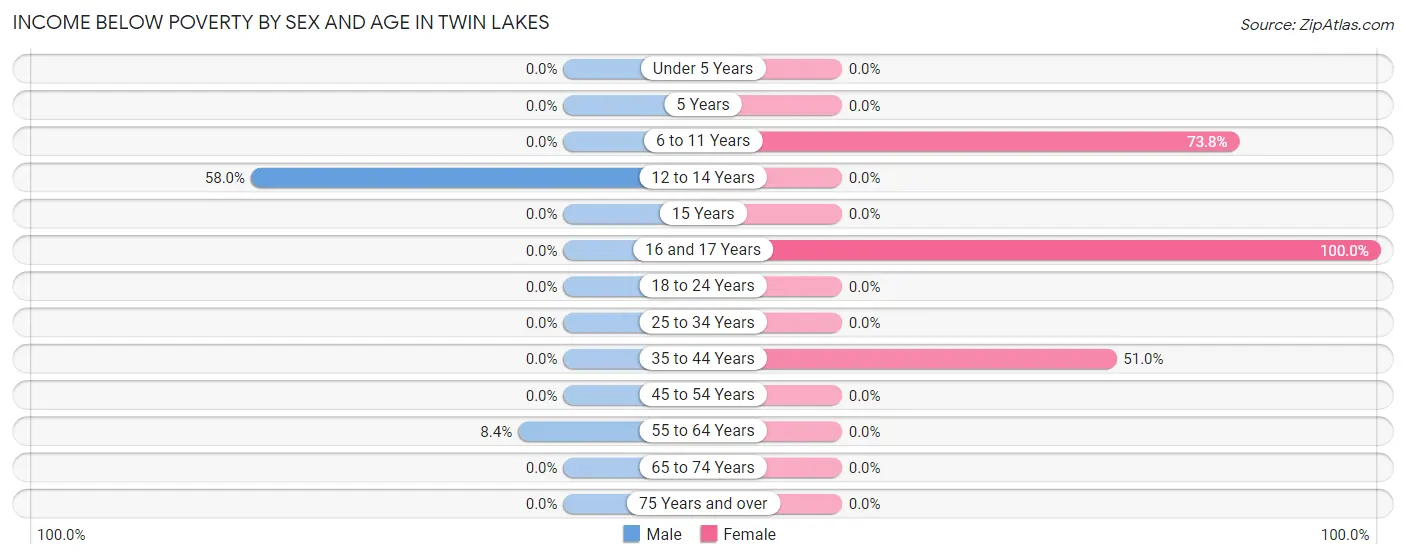
| Age Bracket | Male | Female |
| Under 5 Years | 0 (0.0%) | 0 (0.0%) |
| 5 Years | 0 (0.0%) | 0 (0.0%) |
| 6 to 11 Years | 0 (0.0%) | 45 (73.8%) |
| 12 to 14 Years | 29 (58.0%) | 0 (0.0%) |
| 15 Years | 0 (0.0%) | 0 (0.0%) |
| 16 and 17 Years | 0 (0.0%) | 51 (100.0%) |
| 18 to 24 Years | 0 (0.0%) | 0 (0.0%) |
| 25 to 34 Years | 0 (0.0%) | 0 (0.0%) |
| 35 to 44 Years | 0 (0.0%) | 53 (51.0%) |
| 45 to 54 Years | 0 (0.0%) | 0 (0.0%) |
| 55 to 64 Years | 8 (8.4%) | 0 (0.0%) |
| 65 to 74 Years | 0 (0.0%) | 0 (0.0%) |
| 75 Years and over | 0 (0.0%) | 0 (0.0%) |
| Total | 37 (5.8%) | 149 (20.2%) |
Income Above Poverty by Sex and Age in Twin Lakes
According to the poverty statistics in Twin Lakes, males aged under 5 years and females aged 5 years are the age groups that are most secure financially, with 100.0% of males and 100.0% of females in these age groups living above the poverty line.
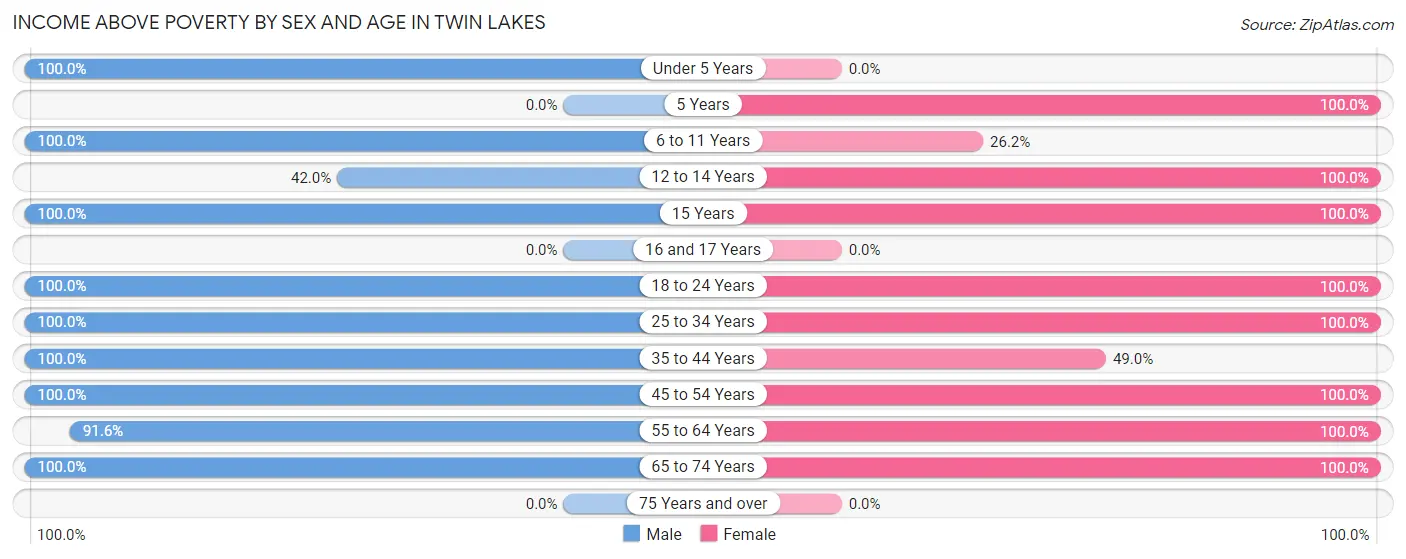
| Age Bracket | Male | Female |
| Under 5 Years | 63 (100.0%) | 0 (0.0%) |
| 5 Years | 0 (0.0%) | 15 (100.0%) |
| 6 to 11 Years | 15 (100.0%) | 16 (26.2%) |
| 12 to 14 Years | 21 (42.0%) | 54 (100.0%) |
| 15 Years | 15 (100.0%) | 33 (100.0%) |
| 16 and 17 Years | 0 (0.0%) | 0 (0.0%) |
| 18 to 24 Years | 85 (100.0%) | 43 (100.0%) |
| 25 to 34 Years | 17 (100.0%) | 58 (100.0%) |
| 35 to 44 Years | 133 (100.0%) | 51 (49.0%) |
| 45 to 54 Years | 70 (100.0%) | 108 (100.0%) |
| 55 to 64 Years | 87 (91.6%) | 181 (100.0%) |
| 65 to 74 Years | 93 (100.0%) | 30 (100.0%) |
| 75 Years and over | 0 (0.0%) | 0 (0.0%) |
| Total | 599 (94.2%) | 589 (79.8%) |
Income Below Poverty Among Married-Couple Families in Twin Lakes
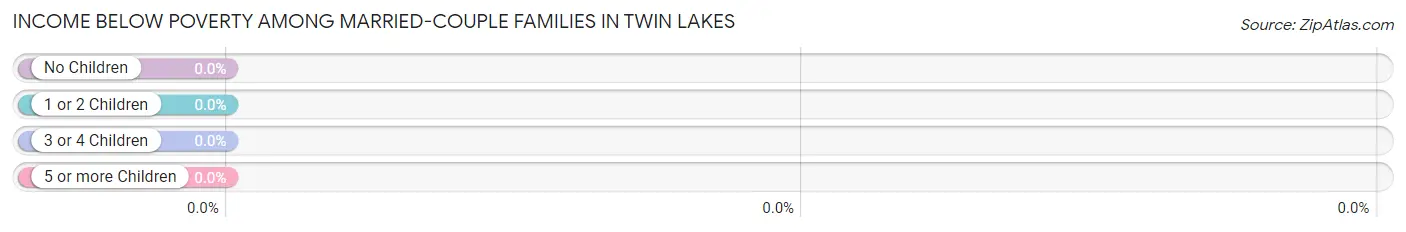
| Children | Above Poverty | Below Poverty |
| No Children | 169 (100.0%) | 0 (0.0%) |
| 1 or 2 Children | 133 (100.0%) | 0 (0.0%) |
| 3 or 4 Children | 0 (0.0%) | 0 (0.0%) |
| 5 or more Children | 0 (0.0%) | 0 (0.0%) |
| Total | 302 (100.0%) | 0 (0.0%) |
Income Below Poverty Among Single-Parent Households in Twin Lakes
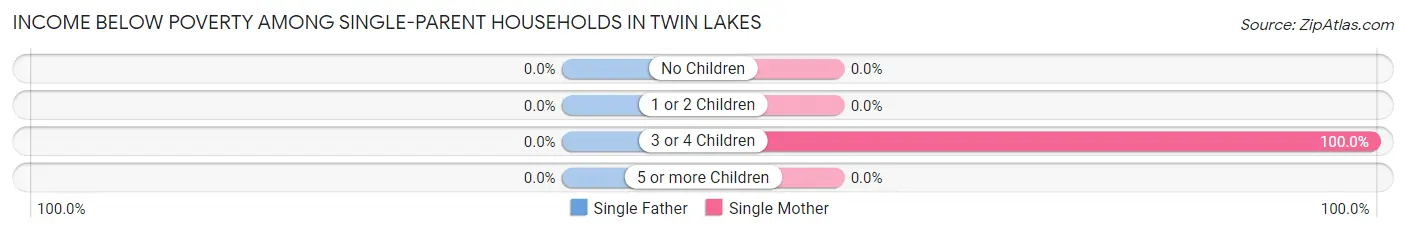
| Children | Single Father | Single Mother |
| No Children | 0 (0.0%) | 0 (0.0%) |
| 1 or 2 Children | 0 (0.0%) | 0 (0.0%) |
| 3 or 4 Children | 0 (0.0%) | 53 (100.0%) |
| 5 or more Children | 0 (0.0%) | 0 (0.0%) |
| Total | 0 (0.0%) | 53 (51.0%) |
Income Below Poverty Among Married-Couple vs Single-Parent Households in Twin Lakes
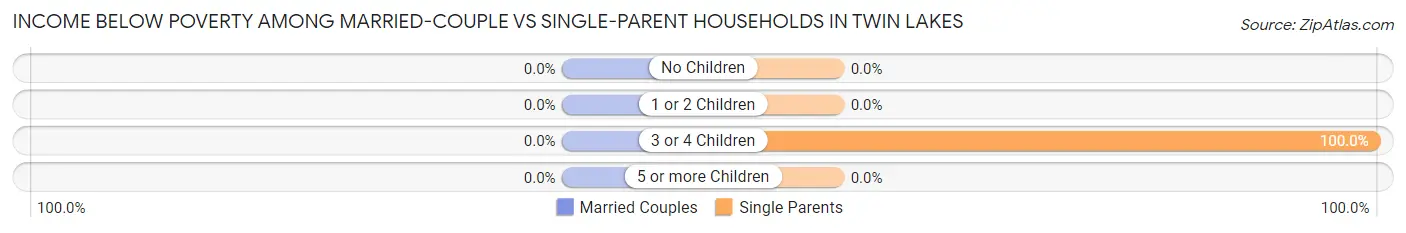
| Children | Married-Couple Families | Single-Parent Households |
| No Children | 0 (0.0%) | 0 (0.0%) |
| 1 or 2 Children | 0 (0.0%) | 0 (0.0%) |
| 3 or 4 Children | 0 (0.0%) | 53 (100.0%) |
| 5 or more Children | 0 (0.0%) | 0 (0.0%) |
| Total | 0 (0.0%) | 53 (43.8%) |
Race in Twin Lakes
The most populous races in Twin Lakes are White / Caucasian (1,016 | 73.9%), Asian (158 | 11.5%), and Black / African American (100 | 7.3%).
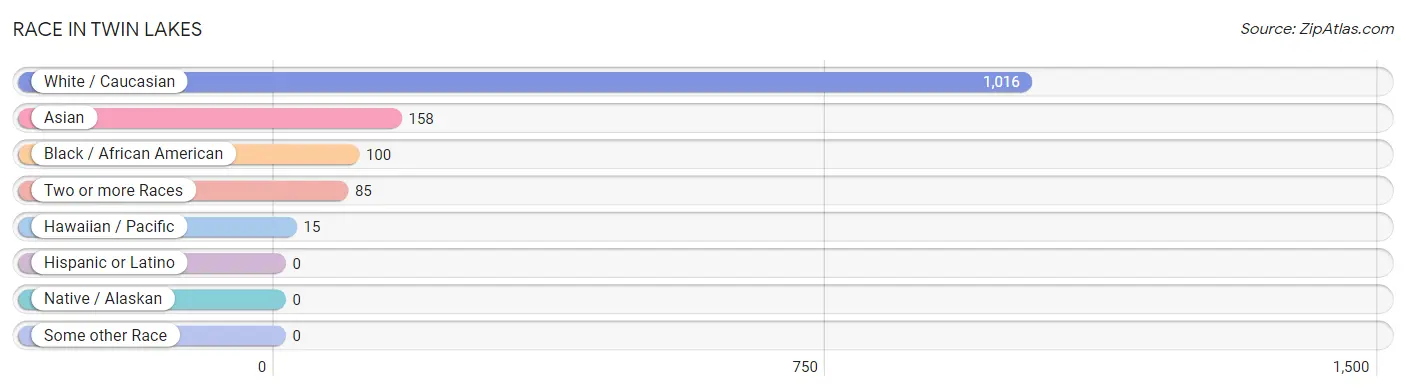
| Race | # Population | % Population |
| Asian | 158 | 11.5% |
| Black / African American | 100 | 7.3% |
| Hawaiian / Pacific | 15 | 1.1% |
| Hispanic or Latino | 0 | 0.0% |
| Native / Alaskan | 0 | 0.0% |
| White / Caucasian | 1,016 | 73.9% |
| Two or more Races | 85 | 6.2% |
| Some other Race | 0 | 0.0% |
| Total | 1,374 | 100.0% |
Ancestry in Twin Lakes
The most populous ancestries reported in Twin Lakes are English (224 | 16.3%), Irish (179 | 13.0%), British (142 | 10.3%), Scotch-Irish (124 | 9.0%), and Italian (117 | 8.5%), together accounting for 57.2% of all Twin Lakes residents.
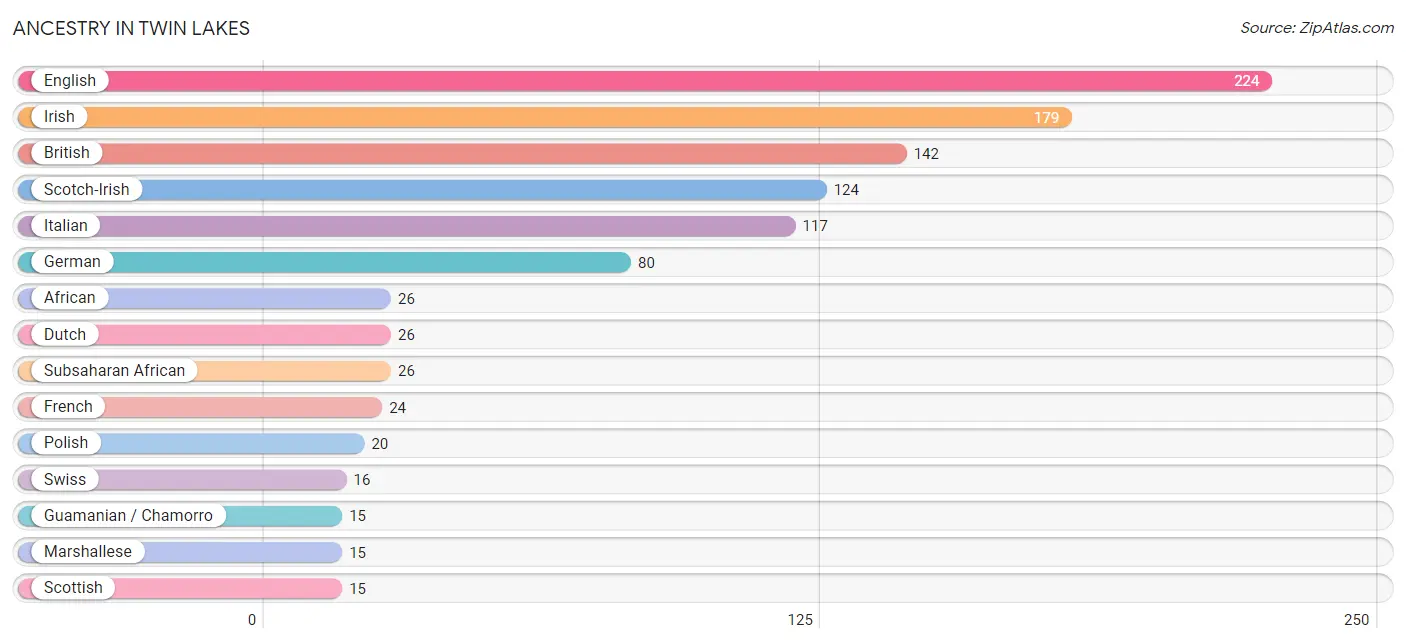
| Ancestry | # Population | % Population |
| African | 26 | 1.9% |
| American | 14 | 1.0% |
| British | 142 | 10.3% |
| Canadian | 13 | 0.9% |
| Dutch | 26 | 1.9% |
| English | 224 | 16.3% |
| French | 24 | 1.8% |
| German | 80 | 5.8% |
| Guamanian / Chamorro | 15 | 1.1% |
| Irish | 179 | 13.0% |
| Italian | 117 | 8.5% |
| Marshallese | 15 | 1.1% |
| Polish | 20 | 1.5% |
| Russian | 9 | 0.7% |
| Scotch-Irish | 124 | 9.0% |
| Scottish | 15 | 1.1% |
| Subsaharan African | 26 | 1.9% |
| Swiss | 16 | 1.2% | View All 18 Rows |
Immigrants in Twin Lakes
The most numerous immigrant groups reported in Twin Lakes came from Asia (92 | 6.7%), Pakistan (92 | 6.7%), South Central Asia (92 | 6.7%), Europe (44 | 3.2%), and Northern Europe (44 | 3.2%), together accounting for 26.5% of all Twin Lakes residents.
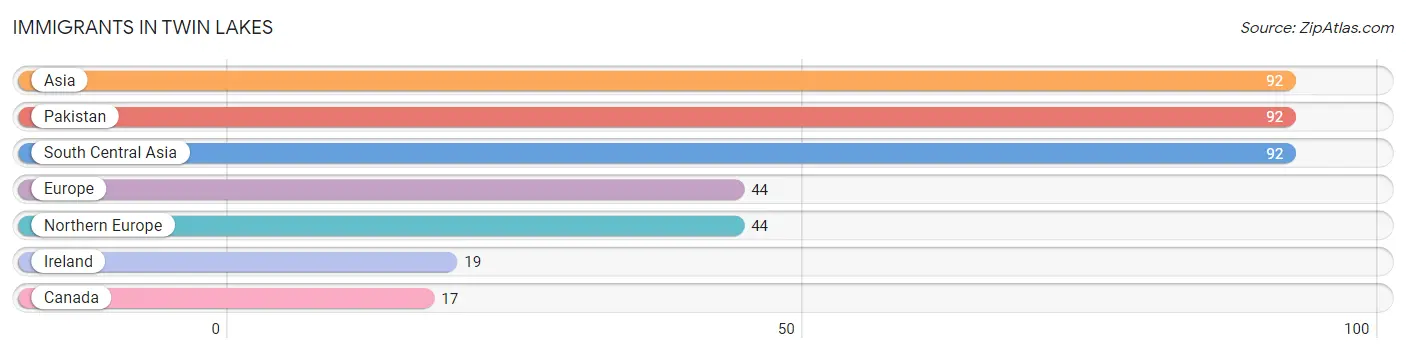
| Immigration Origin | # Population | % Population |
| Asia | 92 | 6.7% |
| Canada | 17 | 1.2% |
| Europe | 44 | 3.2% |
| Ireland | 19 | 1.4% |
| Northern Europe | 44 | 3.2% |
| Pakistan | 92 | 6.7% |
| South Central Asia | 92 | 6.7% | View All 7 Rows |
Sex and Age in Twin Lakes
Sex and Age in Twin Lakes
The most populous age groups in Twin Lakes are 40 to 44 Years (90 | 14.1%) for men and 55 to 59 Years (96 | 13.0%) for women.
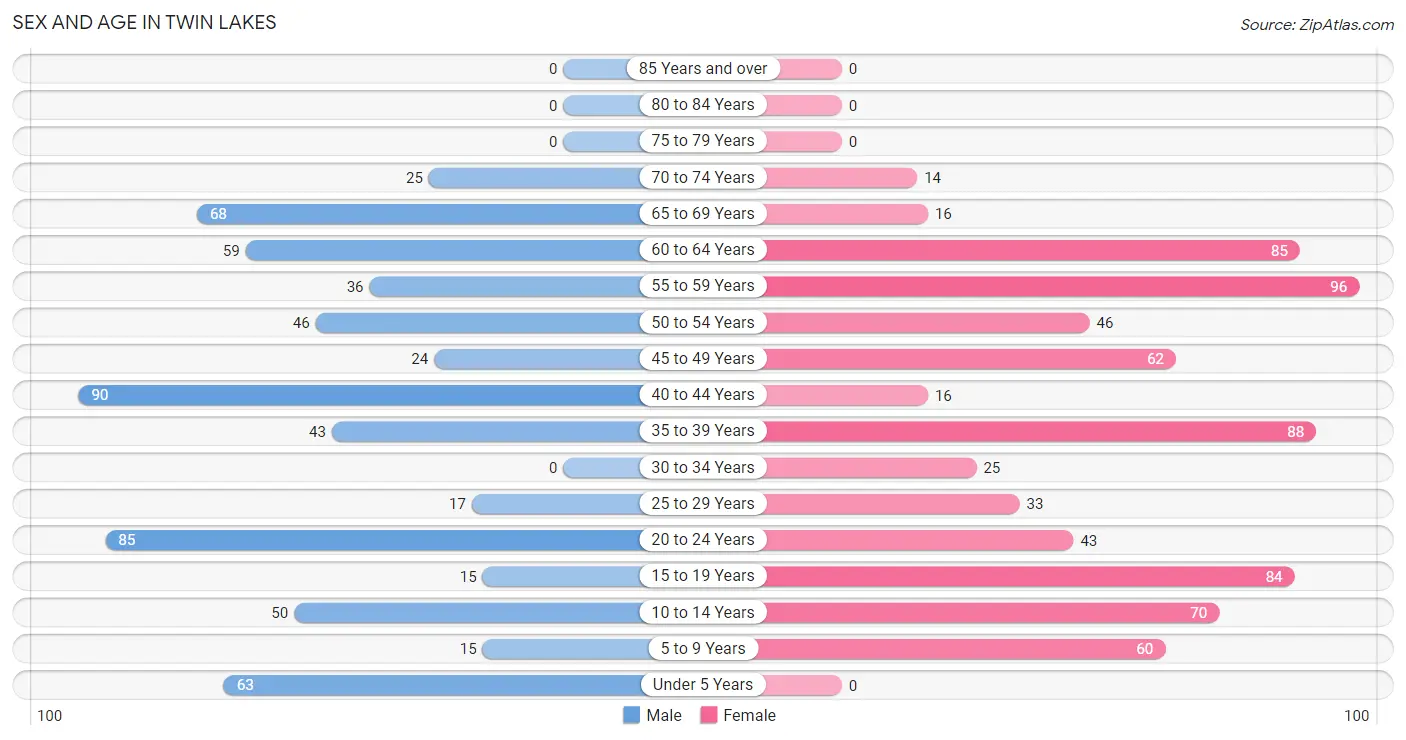
| Age Bracket | Male | Female |
| Under 5 Years | 63 (9.9%) | 0 (0.0%) |
| 5 to 9 Years | 15 (2.4%) | 60 (8.1%) |
| 10 to 14 Years | 50 (7.9%) | 70 (9.5%) |
| 15 to 19 Years | 15 (2.4%) | 84 (11.4%) |
| 20 to 24 Years | 85 (13.4%) | 43 (5.8%) |
| 25 to 29 Years | 17 (2.7%) | 33 (4.5%) |
| 30 to 34 Years | 0 (0.0%) | 25 (3.4%) |
| 35 to 39 Years | 43 (6.8%) | 88 (11.9%) |
| 40 to 44 Years | 90 (14.1%) | 16 (2.2%) |
| 45 to 49 Years | 24 (3.8%) | 62 (8.4%) |
| 50 to 54 Years | 46 (7.2%) | 46 (6.2%) |
| 55 to 59 Years | 36 (5.7%) | 96 (13.0%) |
| 60 to 64 Years | 59 (9.3%) | 85 (11.5%) |
| 65 to 69 Years | 68 (10.7%) | 16 (2.2%) |
| 70 to 74 Years | 25 (3.9%) | 14 (1.9%) |
| 75 to 79 Years | 0 (0.0%) | 0 (0.0%) |
| 80 to 84 Years | 0 (0.0%) | 0 (0.0%) |
| 85 Years and over | 0 (0.0%) | 0 (0.0%) |
| Total | 636 (100.0%) | 738 (100.0%) |
Families and Households in Twin Lakes
Median Family Size in Twin Lakes
The median family size in Twin Lakes is 2.74 persons per family, with single female/mother families (104 | 24.6%) accounting for the largest median family size of 2.79 persons per family. On the other hand, single male/father families (17 | 4.0%) represent the smallest median family size with 1.88 persons per family.
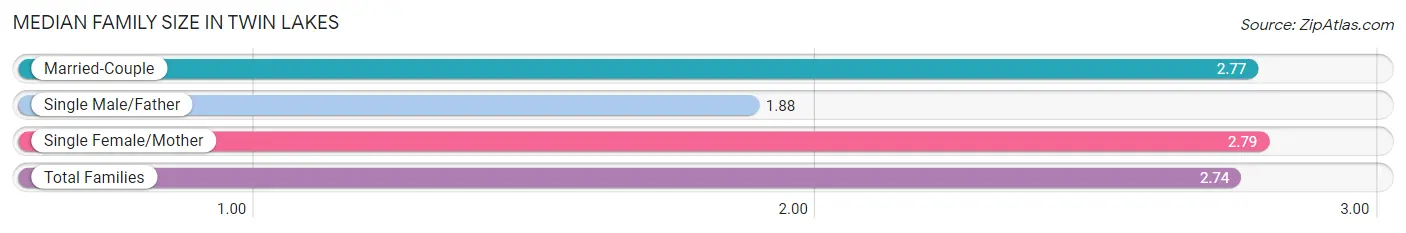
| Family Type | # Families | Family Size |
| Married-Couple | 302 (71.4%) | 2.77 |
| Single Male/Father | 17 (4.0%) | 1.88 |
| Single Female/Mother | 104 (24.6%) | 2.79 |
| Total Families | 423 (100.0%) | 2.74 |
Median Household Size in Twin Lakes
The median household size in Twin Lakes is 2.54 persons per household, with single female/mother households (104 | 19.2%) accounting for the largest median household size of 3.4 persons per household. non-family households (118 | 21.8%) represent the smallest median household size with 1.29 persons per household.
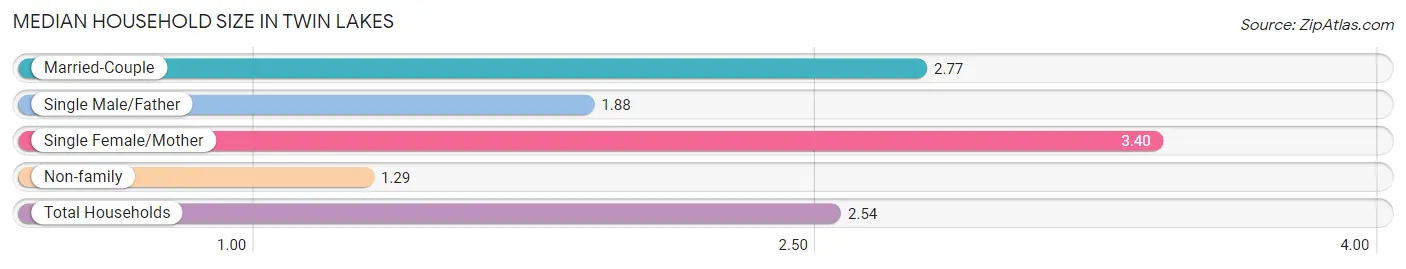
| Household Type | # Households | Household Size |
| Married-Couple | 302 (55.8%) | 2.77 |
| Single Male/Father | 17 (3.1%) | 1.88 |
| Single Female/Mother | 104 (19.2%) | 3.40 |
| Non-family | 118 (21.8%) | 1.29 |
| Total Households | 541 (100.0%) | 2.54 |
Household Size by Marriage Status in Twin Lakes
Out of a total of 541 households in Twin Lakes, 423 (78.2%) are family households, while 118 (21.8%) are nonfamily households. The most numerous type of family households are 2-person households, comprising 181, and the most common type of nonfamily households are 1-person households, comprising 101.
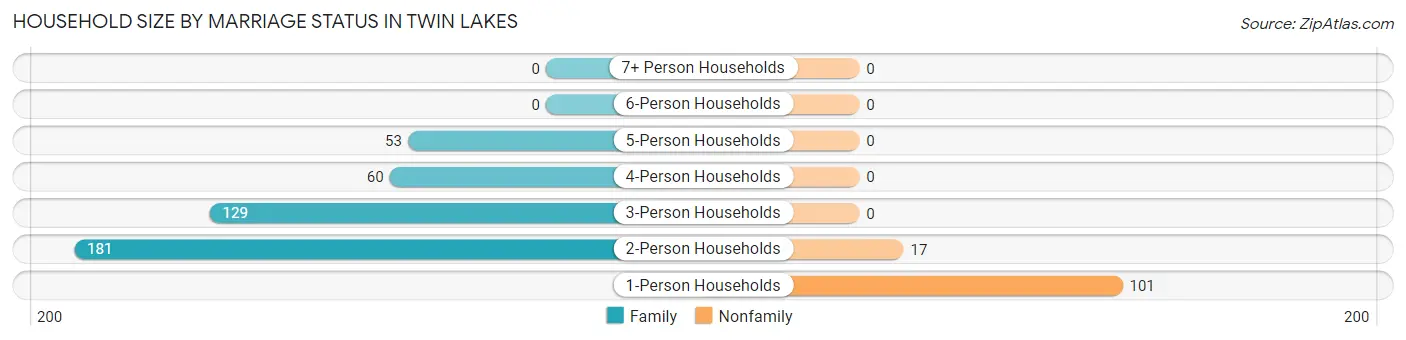
| Household Size | Family Households | Nonfamily Households |
| 1-Person Households | - | 101 (18.7%) |
| 2-Person Households | 181 (33.5%) | 17 (3.1%) |
| 3-Person Households | 129 (23.8%) | 0 (0.0%) |
| 4-Person Households | 60 (11.1%) | 0 (0.0%) |
| 5-Person Households | 53 (9.8%) | 0 (0.0%) |
| 6-Person Households | 0 (0.0%) | 0 (0.0%) |
| 7+ Person Households | 0 (0.0%) | 0 (0.0%) |
| Total | 423 (78.2%) | 118 (21.8%) |
Female Fertility in Twin Lakes
Fertility by Age in Twin Lakes
Average fertility rate in Twin Lakes is 123.0 births per 1,000 women. Women in the age bracket of 20 to 34 years have the highest fertility rate with 426.0 births per 1,000 women. Women in the age bracket of 20 to 34 years acount for 100.0% of all women with births.
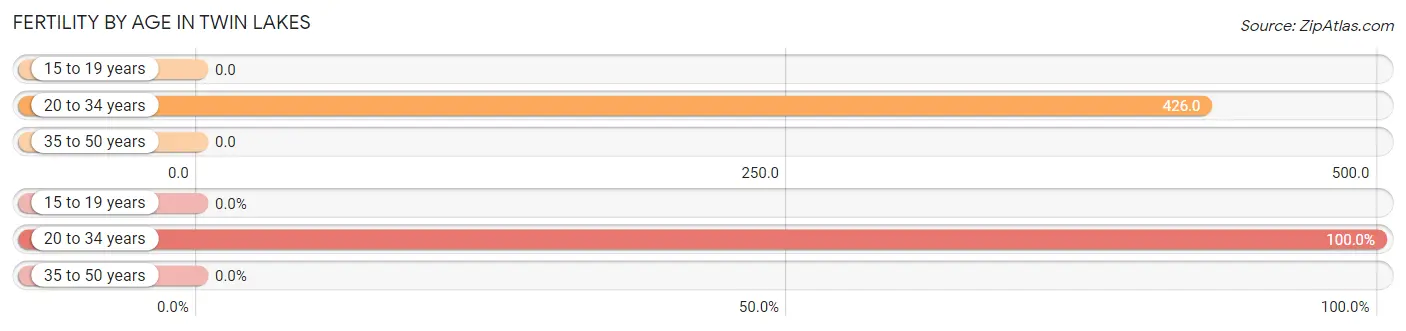
| Age Bracket | Women with Births | Births / 1,000 Women |
| 15 to 19 years | 0 (0.0%) | 0.0 |
| 20 to 34 years | 43 (100.0%) | 426.0 |
| 35 to 50 years | 0 (0.0%) | 0.0 |
| Total | 43 (100.0%) | 123.0 |
Fertility by Age by Marriage Status in Twin Lakes
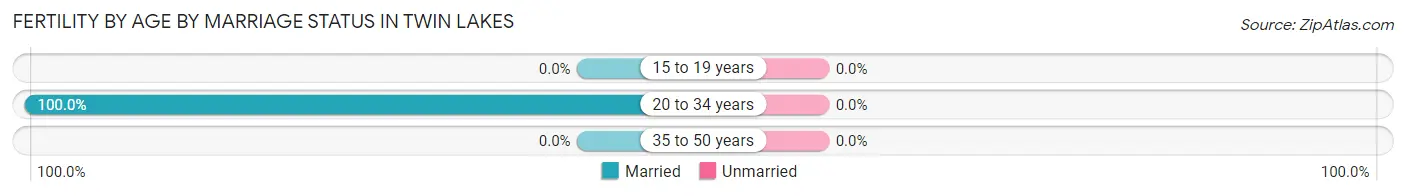
| Age Bracket | Married | Unmarried |
| 15 to 19 years | 0 (0.0%) | 0 (0.0%) |
| 20 to 34 years | 43 (100.0%) | 0 (0.0%) |
| 35 to 50 years | 0 (0.0%) | 0 (0.0%) |
| Total | 43 (100.0%) | 0 (0.0%) |
Fertility by Education in Twin Lakes
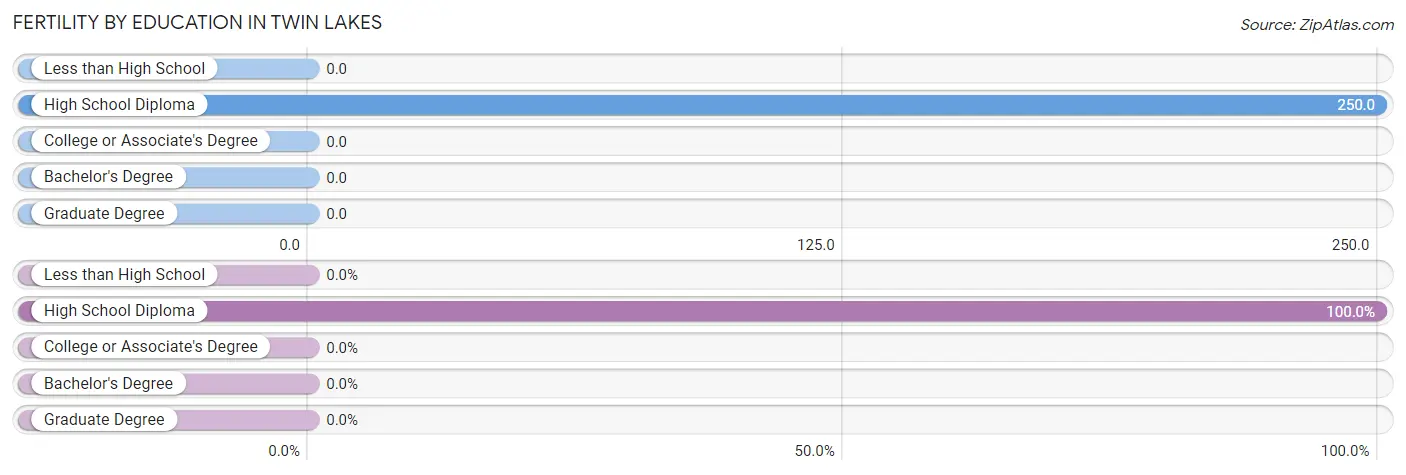
| Educational Attainment | Women with Births | Births / 1,000 Women |
| Less than High School | 0 (0.0%) | 0.0 |
| High School Diploma | 43 (100.0%) | 250.0 |
| College or Associate's Degree | 0 (0.0%) | 0.0 |
| Bachelor's Degree | 0 (0.0%) | 0.0 |
| Graduate Degree | 0 (0.0%) | 0.0 |
| Total | 43 (100.0%) | 123.0 |
Fertility by Education by Marriage Status in Twin Lakes
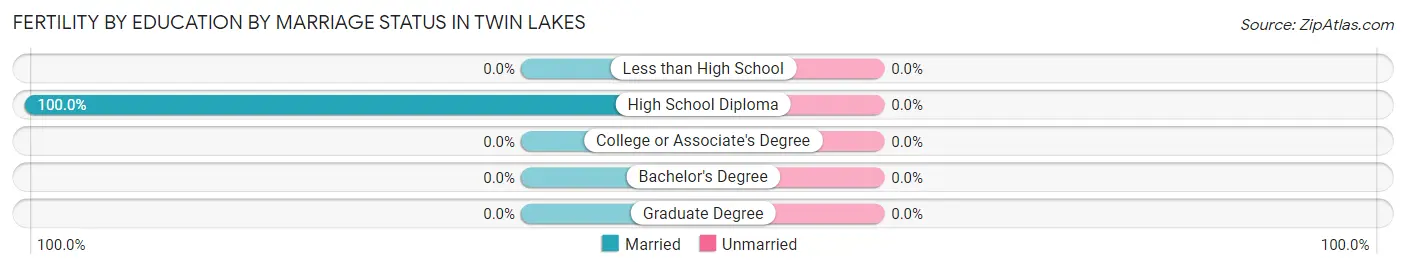
| Educational Attainment | Married | Unmarried |
| Less than High School | 0 (0.0%) | 0 (0.0%) |
| High School Diploma | 43 (100.0%) | 0 (0.0%) |
| College or Associate's Degree | 0 (0.0%) | 0 (0.0%) |
| Bachelor's Degree | 0 (0.0%) | 0 (0.0%) |
| Graduate Degree | 0 (0.0%) | 0 (0.0%) |
| Total | 43 (100.0%) | 0 (0.0%) |
Employment Characteristics in Twin Lakes
Employment by Class of Employer in Twin Lakes
Among the 714 employed individuals in Twin Lakes, private company employees (550 | 77.0%), self-employed (not incorporated) (69 | 9.7%), and federal government employees (27 | 3.8%) make up the most common classes of employment.
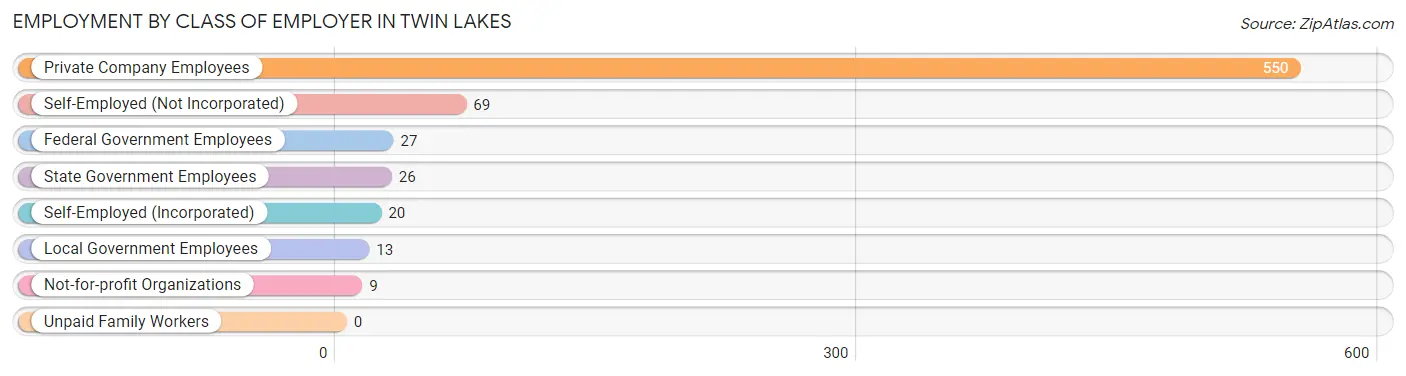
| Employer Class | # Employees | % Employees |
| Private Company Employees | 550 | 77.0% |
| Self-Employed (Incorporated) | 20 | 2.8% |
| Self-Employed (Not Incorporated) | 69 | 9.7% |
| Not-for-profit Organizations | 9 | 1.3% |
| Local Government Employees | 13 | 1.8% |
| State Government Employees | 26 | 3.6% |
| Federal Government Employees | 27 | 3.8% |
| Unpaid Family Workers | 0 | 0.0% |
| Total | 714 | 100.0% |
Employment Status by Age in Twin Lakes
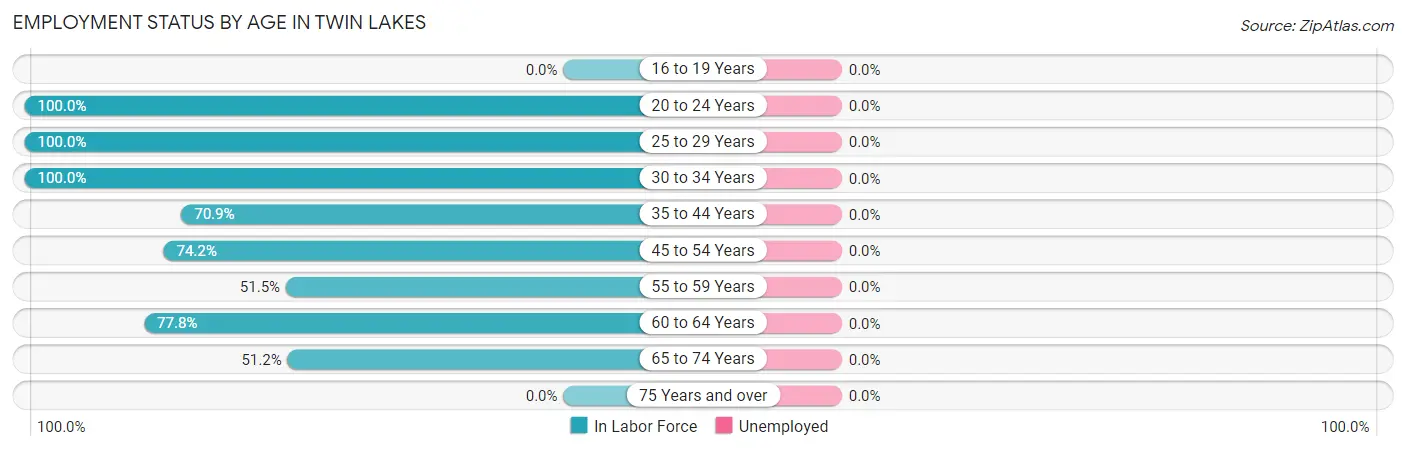
| Age Bracket | In Labor Force | Unemployed |
| 16 to 19 Years | 0 (0.0%) | 0 (0.0%) |
| 20 to 24 Years | 128 (100.0%) | 0 (0.0%) |
| 25 to 29 Years | 50 (100.0%) | 0 (0.0%) |
| 30 to 34 Years | 25 (100.0%) | 0 (0.0%) |
| 35 to 44 Years | 168 (70.9%) | 0 (0.0%) |
| 45 to 54 Years | 132 (74.2%) | 0 (0.0%) |
| 55 to 59 Years | 68 (51.5%) | 0 (0.0%) |
| 60 to 64 Years | 112 (77.8%) | 0 (0.0%) |
| 65 to 74 Years | 63 (51.2%) | 0 (0.0%) |
| 75 Years and over | 0 (0.0%) | 0 (0.0%) |
| Total | 747 (69.9%) | 0 (0.0%) |
Employment Status by Educational Attainment in Twin Lakes
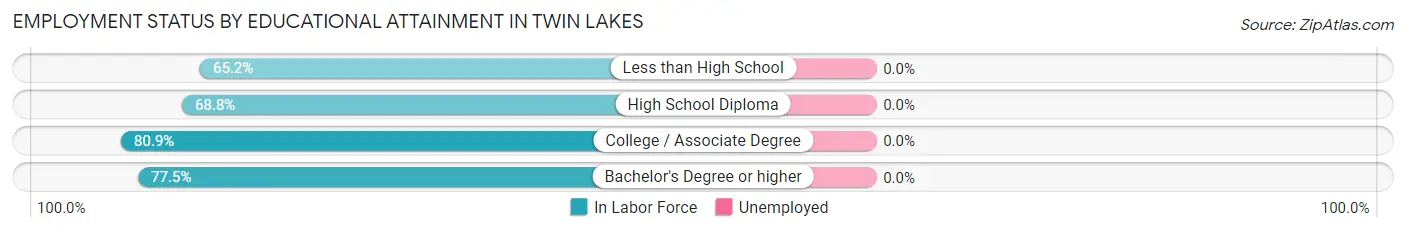
| Educational Attainment | In Labor Force | Unemployed |
| Less than High School | 15 (65.2%) | 0 (0.0%) |
| High School Diploma | 320 (68.8%) | 0 (0.0%) |
| College / Associate Degree | 110 (80.9%) | 0 (0.0%) |
| Bachelor's Degree or higher | 110 (77.5%) | 0 (0.0%) |
| Total | 555 (72.5%) | 0 (0.0%) |
Employment Occupations by Sex in Twin Lakes
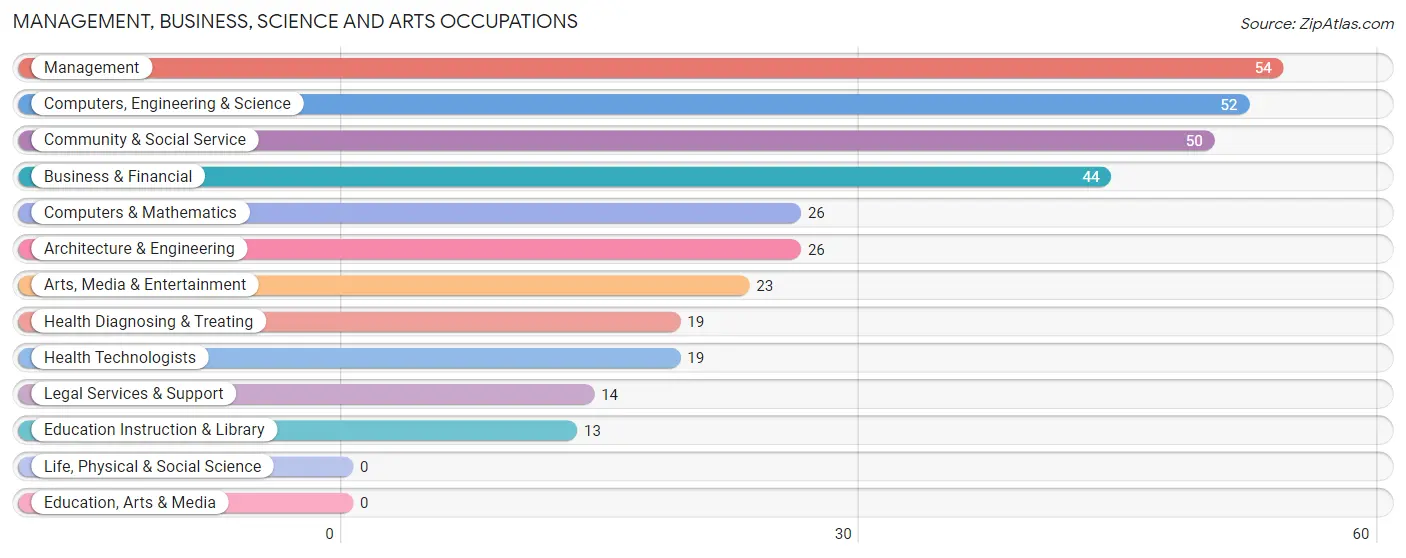
Management, Business, Science and Arts Occupations
The most common Management, Business, Science and Arts occupations in Twin Lakes are Management (54 | 7.2%), Computers, Engineering & Science (52 | 7.0%), Community & Social Service (50 | 6.7%), Business & Financial (44 | 5.9%), and Computers & Mathematics (26 | 3.5%).
Management, Business, Science and Arts Occupations by Sex
Within the Management, Business, Science and Arts occupations in Twin Lakes, the most male-oriented occupations are Computers, Engineering & Science (100.0%), Computers & Mathematics (100.0%), and Architecture & Engineering (100.0%), while the most female-oriented occupations are Business & Financial (100.0%), Community & Social Service (100.0%), and Legal Services & Support (100.0%).
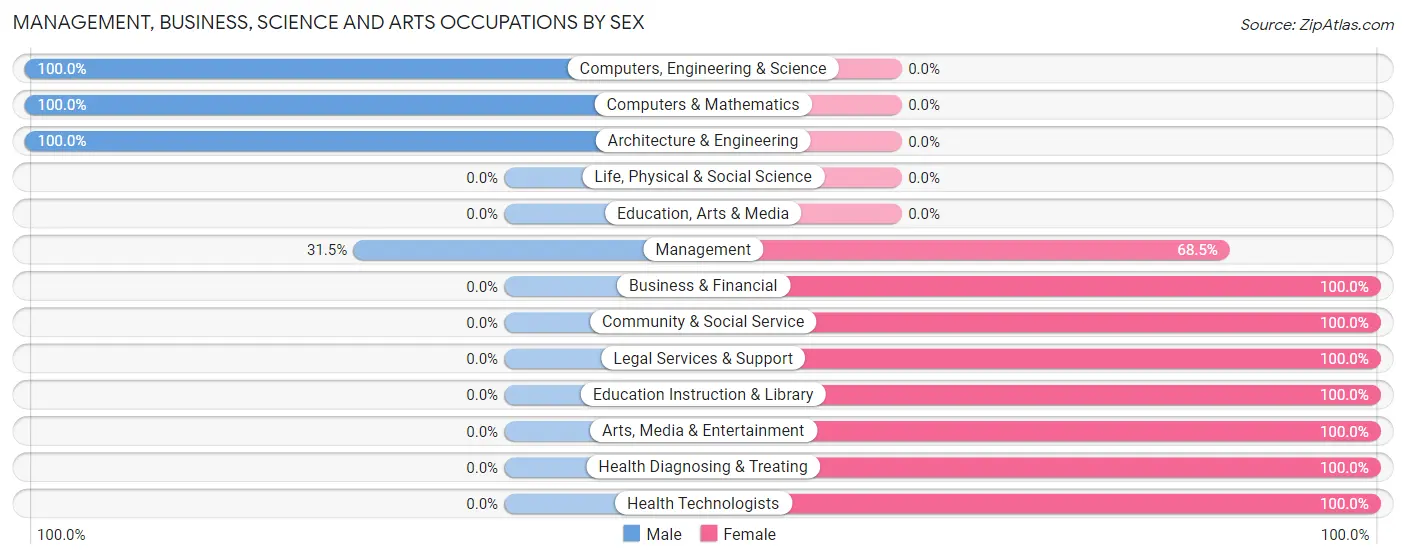
| Occupation | Male | Female |
| Management | 17 (31.5%) | 37 (68.5%) |
| Business & Financial | 0 (0.0%) | 44 (100.0%) |
| Computers, Engineering & Science | 52 (100.0%) | 0 (0.0%) |
| Computers & Mathematics | 26 (100.0%) | 0 (0.0%) |
| Architecture & Engineering | 26 (100.0%) | 0 (0.0%) |
| Life, Physical & Social Science | 0 (0.0%) | 0 (0.0%) |
| Community & Social Service | 0 (0.0%) | 50 (100.0%) |
| Education, Arts & Media | 0 (0.0%) | 0 (0.0%) |
| Legal Services & Support | 0 (0.0%) | 14 (100.0%) |
| Education Instruction & Library | 0 (0.0%) | 13 (100.0%) |
| Arts, Media & Entertainment | 0 (0.0%) | 23 (100.0%) |
| Health Diagnosing & Treating | 0 (0.0%) | 19 (100.0%) |
| Health Technologists | 0 (0.0%) | 19 (100.0%) |
| Total (Category) | 69 (31.5%) | 150 (68.5%) |
| Total (Overall) | 409 (54.8%) | 337 (45.2%) |
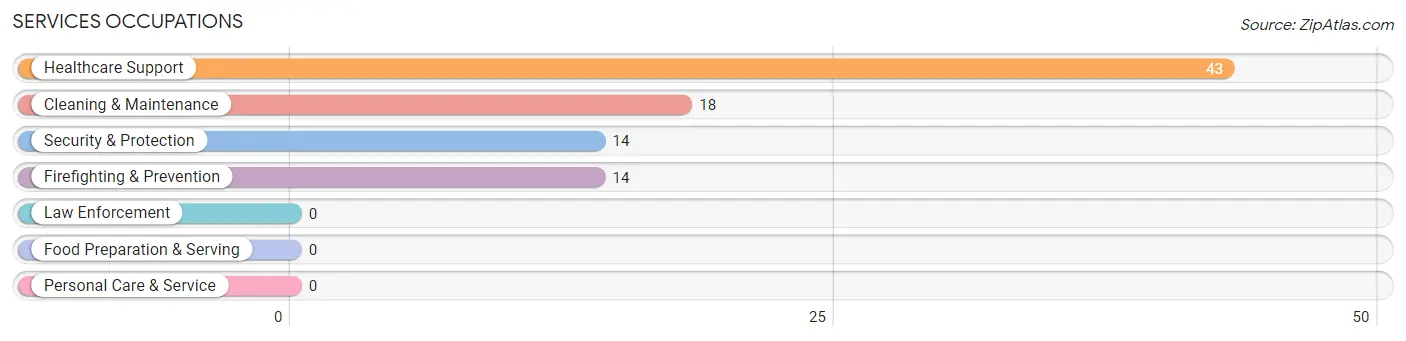
Services Occupations
The most common Services occupations in Twin Lakes are Healthcare Support (43 | 5.8%), Cleaning & Maintenance (18 | 2.4%), Security & Protection (14 | 1.9%), and Firefighting & Prevention (14 | 1.9%).
Services Occupations by Sex
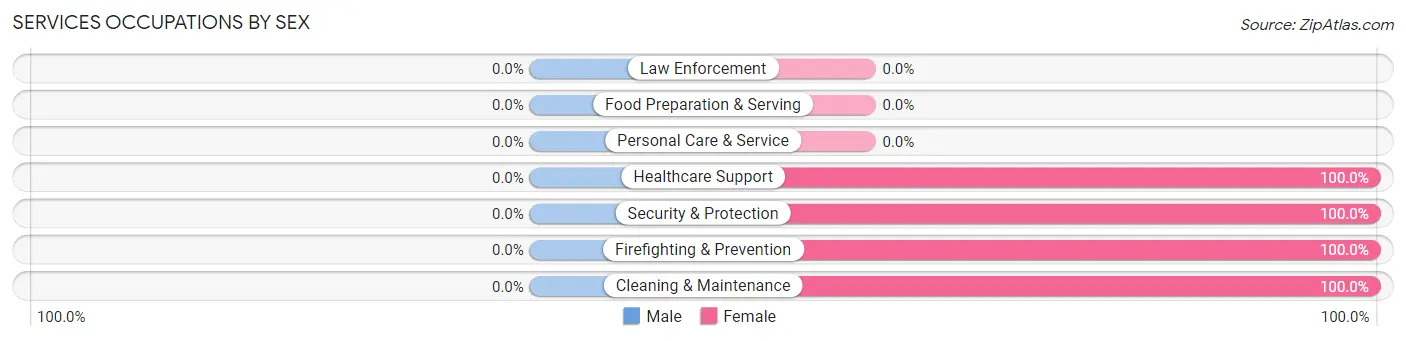
| Occupation | Male | Female |
| Healthcare Support | 0 (0.0%) | 43 (100.0%) |
| Security & Protection | 0 (0.0%) | 14 (100.0%) |
| Firefighting & Prevention | 0 (0.0%) | 14 (100.0%) |
| Law Enforcement | 0 (0.0%) | 0 (0.0%) |
| Food Preparation & Serving | 0 (0.0%) | 0 (0.0%) |
| Cleaning & Maintenance | 0 (0.0%) | 18 (100.0%) |
| Personal Care & Service | 0 (0.0%) | 0 (0.0%) |
| Total (Category) | 0 (0.0%) | 75 (100.0%) |
| Total (Overall) | 409 (54.8%) | 337 (45.2%) |
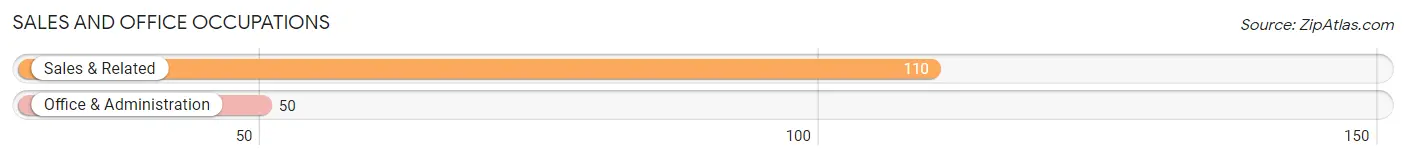
Sales and Office Occupations
The most common Sales and Office occupations in Twin Lakes are Sales & Related (110 | 14.7%), and Office & Administration (50 | 6.7%).
Sales and Office Occupations by Sex
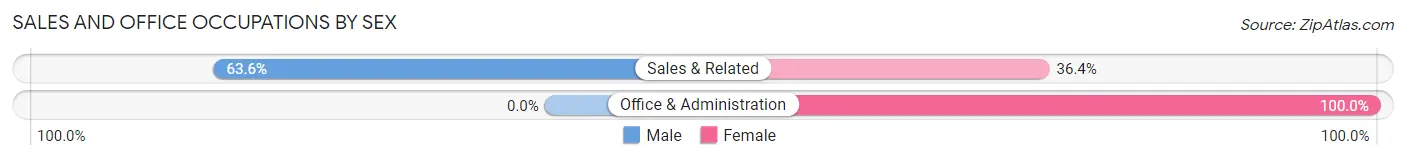
| Occupation | Male | Female |
| Sales & Related | 70 (63.6%) | 40 (36.4%) |
| Office & Administration | 0 (0.0%) | 50 (100.0%) |
| Total (Category) | 70 (43.8%) | 90 (56.2%) |
| Total (Overall) | 409 (54.8%) | 337 (45.2%) |
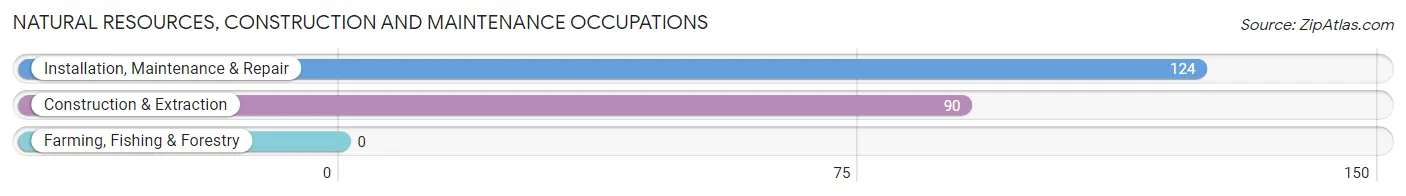
Natural Resources, Construction and Maintenance Occupations
The most common Natural Resources, Construction and Maintenance occupations in Twin Lakes are Installation, Maintenance & Repair (124 | 16.6%), and Construction & Extraction (90 | 12.1%).
Natural Resources, Construction and Maintenance Occupations by Sex
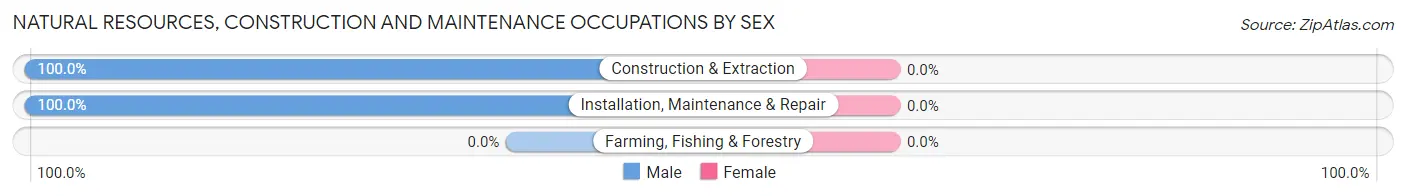
| Occupation | Male | Female |
| Farming, Fishing & Forestry | 0 (0.0%) | 0 (0.0%) |
| Construction & Extraction | 90 (100.0%) | 0 (0.0%) |
| Installation, Maintenance & Repair | 124 (100.0%) | 0 (0.0%) |
| Total (Category) | 214 (100.0%) | 0 (0.0%) |
| Total (Overall) | 409 (54.8%) | 337 (45.2%) |
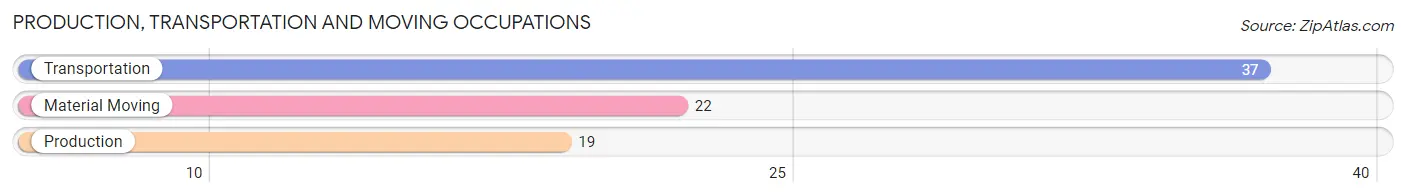
Production, Transportation and Moving Occupations
The most common Production, Transportation and Moving occupations in Twin Lakes are Transportation (37 | 5.0%), Material Moving (22 | 2.9%), and Production (19 | 2.5%).
Production, Transportation and Moving Occupations by Sex
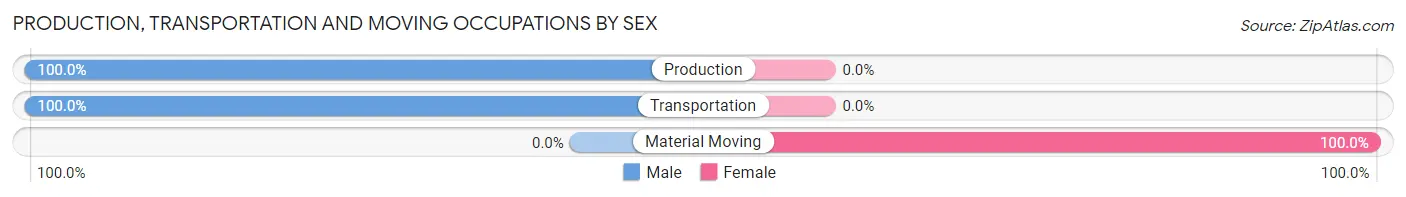
| Occupation | Male | Female |
| Production | 19 (100.0%) | 0 (0.0%) |
| Transportation | 37 (100.0%) | 0 (0.0%) |
| Material Moving | 0 (0.0%) | 22 (100.0%) |
| Total (Category) | 56 (71.8%) | 22 (28.2%) |
| Total (Overall) | 409 (54.8%) | 337 (45.2%) |
Employment Industries by Sex in Twin Lakes
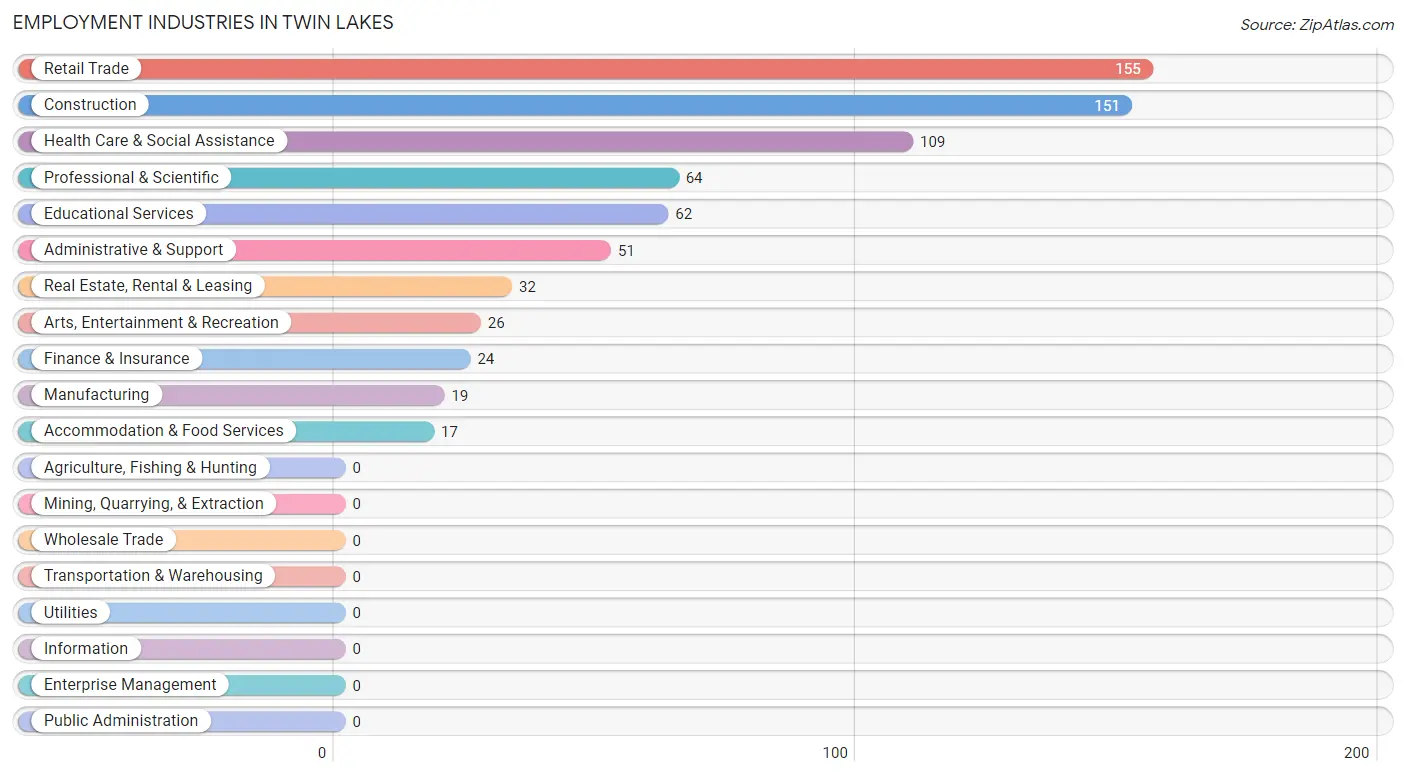
Employment Industries in Twin Lakes
The major employment industries in Twin Lakes include Retail Trade (155 | 20.8%), Construction (151 | 20.2%), Health Care & Social Assistance (109 | 14.6%), Professional & Scientific (64 | 8.6%), and Educational Services (62 | 8.3%).
Employment Industries by Sex in Twin Lakes
The Twin Lakes industries that see more men than women are Construction (100.0%), Manufacturing (100.0%), and Arts, Entertainment & Recreation (100.0%), whereas the industries that tend to have a higher number of women are Finance & Insurance (100.0%), Health Care & Social Assistance (100.0%), and Educational Services (75.8%).
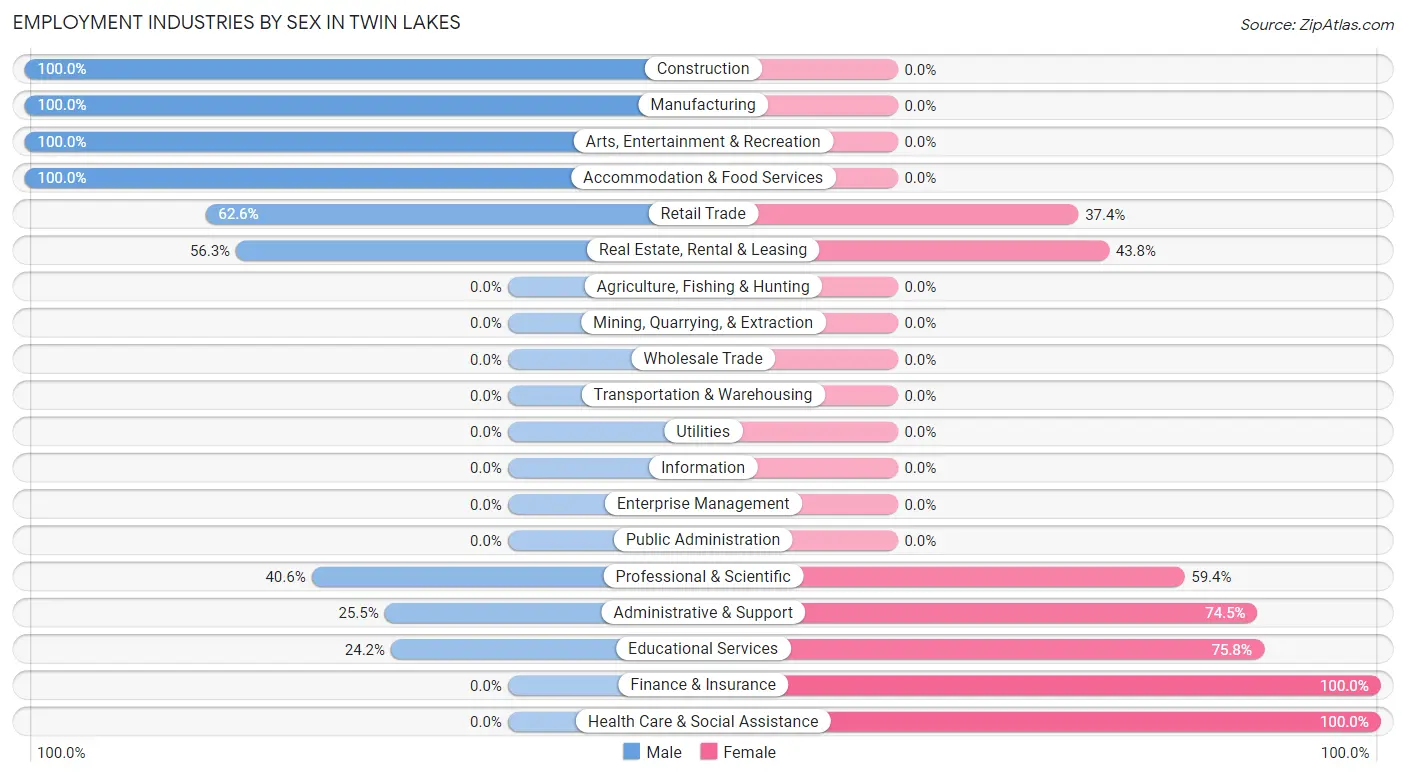
| Industry | Male | Female |
| Agriculture, Fishing & Hunting | 0 (0.0%) | 0 (0.0%) |
| Mining, Quarrying, & Extraction | 0 (0.0%) | 0 (0.0%) |
| Construction | 151 (100.0%) | 0 (0.0%) |
| Manufacturing | 19 (100.0%) | 0 (0.0%) |
| Wholesale Trade | 0 (0.0%) | 0 (0.0%) |
| Retail Trade | 97 (62.6%) | 58 (37.4%) |
| Transportation & Warehousing | 0 (0.0%) | 0 (0.0%) |
| Utilities | 0 (0.0%) | 0 (0.0%) |
| Information | 0 (0.0%) | 0 (0.0%) |
| Finance & Insurance | 0 (0.0%) | 24 (100.0%) |
| Real Estate, Rental & Leasing | 18 (56.2%) | 14 (43.8%) |
| Professional & Scientific | 26 (40.6%) | 38 (59.4%) |
| Enterprise Management | 0 (0.0%) | 0 (0.0%) |
| Administrative & Support | 13 (25.5%) | 38 (74.5%) |
| Educational Services | 15 (24.2%) | 47 (75.8%) |
| Health Care & Social Assistance | 0 (0.0%) | 109 (100.0%) |
| Arts, Entertainment & Recreation | 26 (100.0%) | 0 (0.0%) |
| Accommodation & Food Services | 17 (100.0%) | 0 (0.0%) |
| Public Administration | 0 (0.0%) | 0 (0.0%) |
| Total | 409 (54.8%) | 337 (45.2%) |
Education in Twin Lakes
School Enrollment in Twin Lakes
The most common levels of schooling among the 377 students in Twin Lakes are high school (132 | 35.0%), middle school (83 | 22.0%), and elementary school (76 | 20.2%).
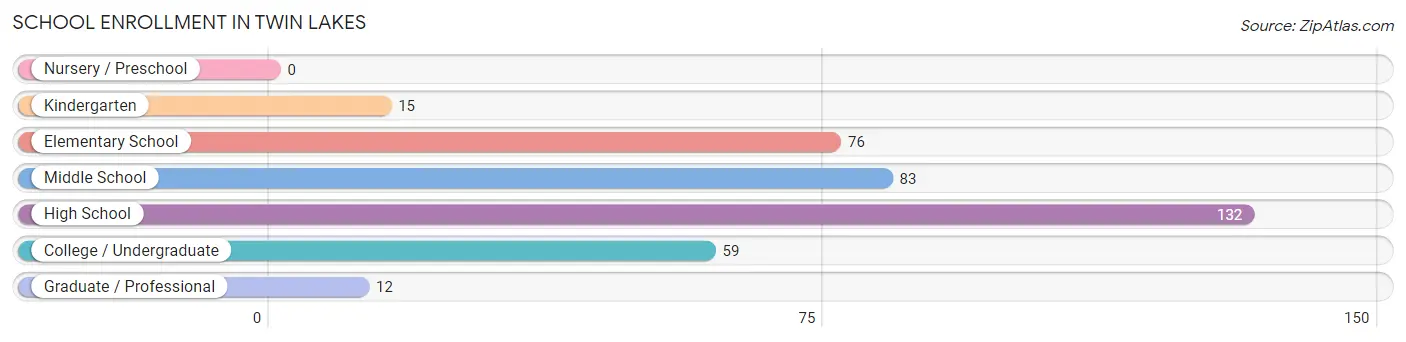
| School Level | # Students | % Students |
| Nursery / Preschool | 0 | 0.0% |
| Kindergarten | 15 | 4.0% |
| Elementary School | 76 | 20.2% |
| Middle School | 83 | 22.0% |
| High School | 132 | 35.0% |
| College / Undergraduate | 59 | 15.7% |
| Graduate / Professional | 12 | 3.2% |
| Total | 377 | 100.0% |
School Enrollment by Age by Funding Source in Twin Lakes
Out of a total of 377 students who are enrolled in schools in Twin Lakes, 61 (16.2%) attend a private institution, while the remaining 316 (83.8%) are enrolled in public schools. The age group of 35 years and over has the highest likelihood of being enrolled in private schools, with 47 (77.0% in the age bracket) enrolled. Conversely, the age group of 10 to 14 year olds has the lowest likelihood of being enrolled in a private school, with 120 (100.0% in the age bracket) attending a public institution.
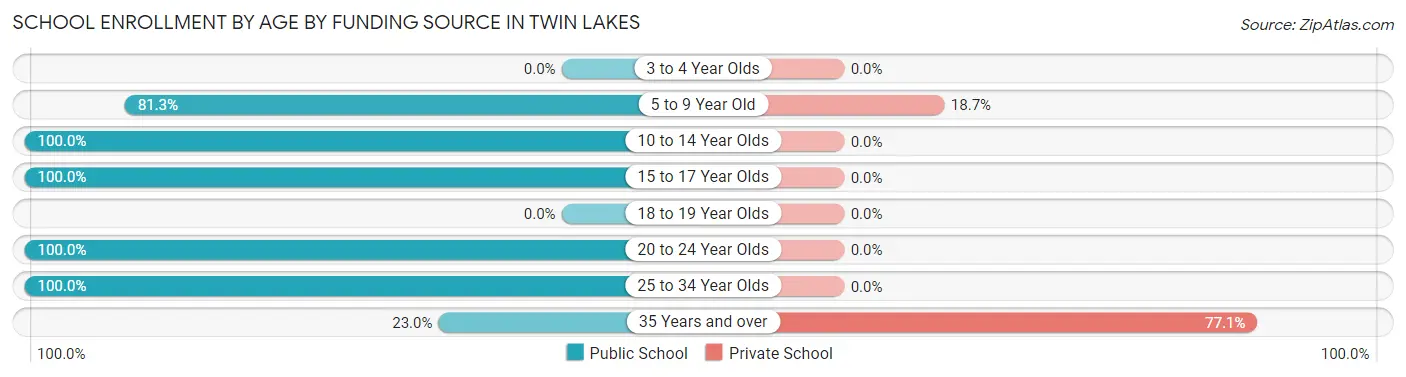
| Age Bracket | Public School | Private School |
| 3 to 4 Year Olds | 0 (0.0%) | 0 (0.0%) |
| 5 to 9 Year Old | 61 (81.3%) | 14 (18.7%) |
| 10 to 14 Year Olds | 120 (100.0%) | 0 (0.0%) |
| 15 to 17 Year Olds | 99 (100.0%) | 0 (0.0%) |
| 18 to 19 Year Olds | 0 (0.0%) | 0 (0.0%) |
| 20 to 24 Year Olds | 10 (100.0%) | 0 (0.0%) |
| 25 to 34 Year Olds | 12 (100.0%) | 0 (0.0%) |
| 35 Years and over | 14 (23.0%) | 47 (77.0%) |
| Total | 316 (83.8%) | 61 (16.2%) |
Educational Attainment by Field of Study in Twin Lakes
Arts & humanities (45 | 28.5%), social sciences (36 | 22.8%), visual & performing arts (32 | 20.3%), engineering (17 | 10.8%), and science & technology (15 | 9.5%) are the most common fields of study among 158 individuals in Twin Lakes who have obtained a bachelor's degree or higher.
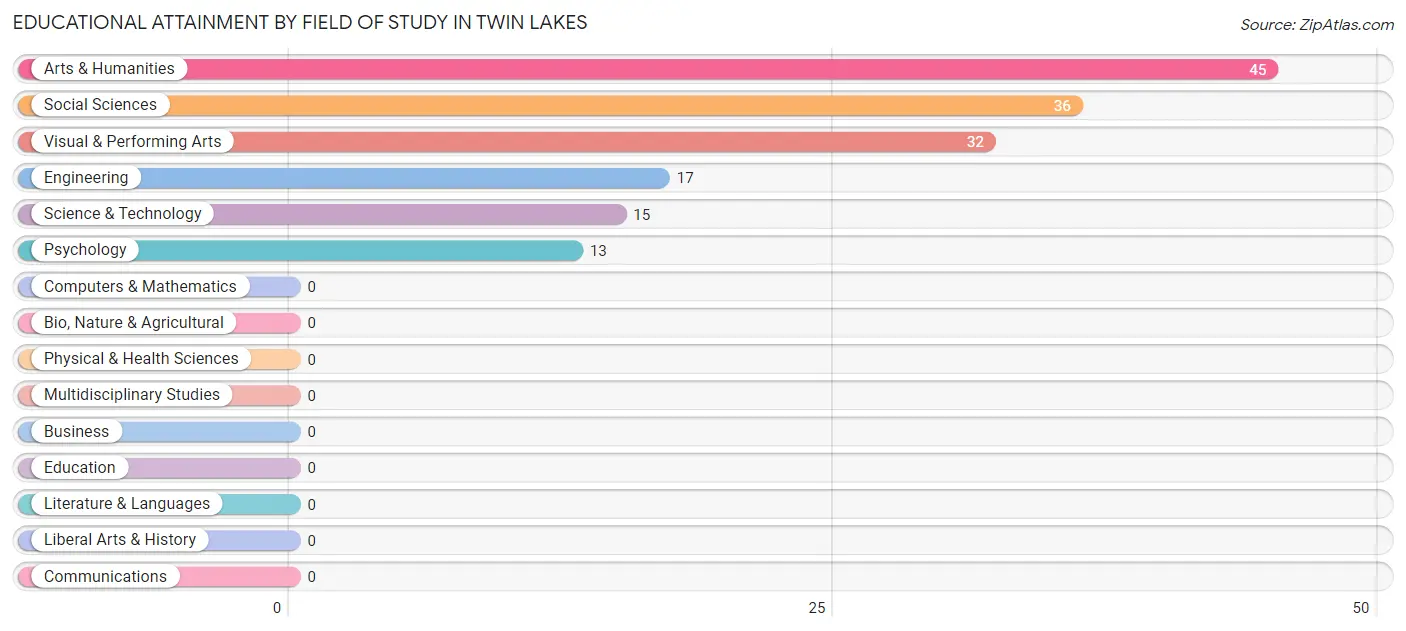
| Field of Study | # Graduates | % Graduates |
| Computers & Mathematics | 0 | 0.0% |
| Bio, Nature & Agricultural | 0 | 0.0% |
| Physical & Health Sciences | 0 | 0.0% |
| Psychology | 13 | 8.2% |
| Social Sciences | 36 | 22.8% |
| Engineering | 17 | 10.8% |
| Multidisciplinary Studies | 0 | 0.0% |
| Science & Technology | 15 | 9.5% |
| Business | 0 | 0.0% |
| Education | 0 | 0.0% |
| Literature & Languages | 0 | 0.0% |
| Liberal Arts & History | 0 | 0.0% |
| Visual & Performing Arts | 32 | 20.3% |
| Communications | 0 | 0.0% |
| Arts & Humanities | 45 | 28.5% |
| Total | 158 | 100.0% |
Transportation & Commute in Twin Lakes
Vehicle Availability by Sex in Twin Lakes
The most prevalent vehicle ownership categories in Twin Lakes are males with 3 vehicles (209, accounting for 55.4%) and females with 3 vehicles (116, making up 62.0%).
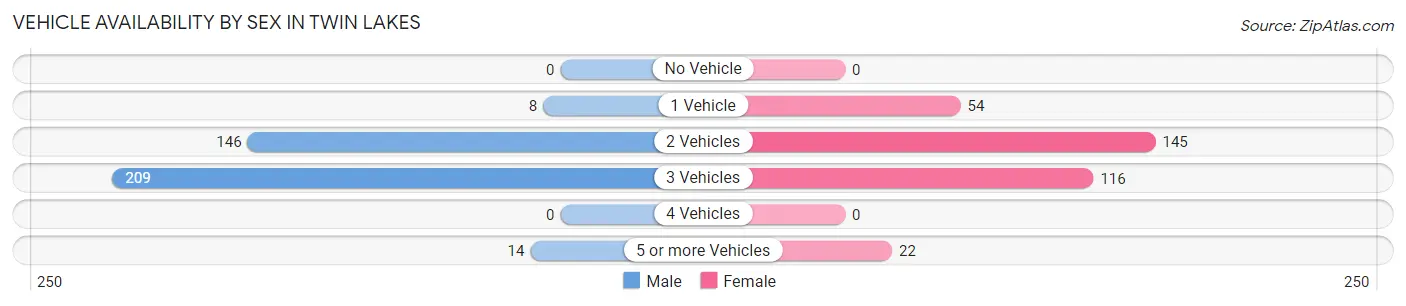
| Vehicles Available | Male | Female |
| No Vehicle | 0 (0.0%) | 0 (0.0%) |
| 1 Vehicle | 8 (2.1%) | 54 (16.0%) |
| 2 Vehicles | 146 (38.7%) | 145 (43.0%) |
| 3 Vehicles | 209 (55.4%) | 116 (34.4%) |
| 4 Vehicles | 0 (0.0%) | 0 (0.0%) |
| 5 or more Vehicles | 14 (3.7%) | 22 (6.5%) |
| Total | 377 (100.0%) | 337 (100.0%) |
Commute Time in Twin Lakes
The most frequently occuring commute durations in Twin Lakes are 10 to 14 minutes (112 commuters, 16.6%), 30 to 34 minutes (95 commuters, 14.1%), and 60 to 89 minutes (82 commuters, 12.1%).
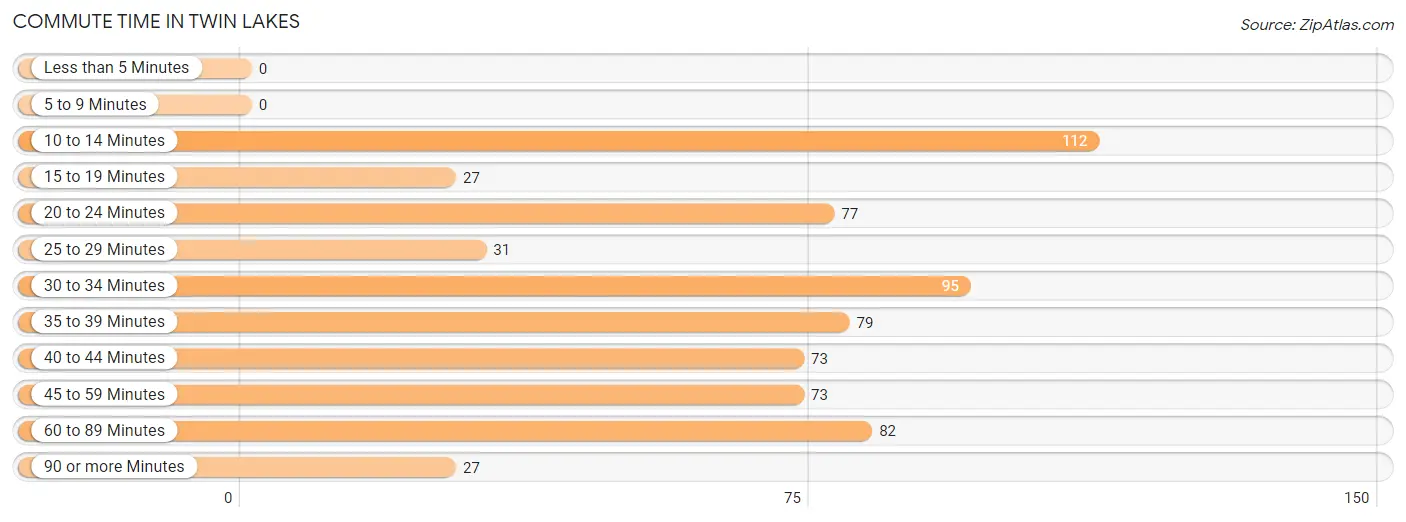
| Commute Time | # Commuters | % Commuters |
| Less than 5 Minutes | 0 | 0.0% |
| 5 to 9 Minutes | 0 | 0.0% |
| 10 to 14 Minutes | 112 | 16.6% |
| 15 to 19 Minutes | 27 | 4.0% |
| 20 to 24 Minutes | 77 | 11.4% |
| 25 to 29 Minutes | 31 | 4.6% |
| 30 to 34 Minutes | 95 | 14.1% |
| 35 to 39 Minutes | 79 | 11.7% |
| 40 to 44 Minutes | 73 | 10.8% |
| 45 to 59 Minutes | 73 | 10.8% |
| 60 to 89 Minutes | 82 | 12.1% |
| 90 or more Minutes | 27 | 4.0% |
Commute Time by Sex in Twin Lakes
The most common commute times in Twin Lakes are 30 to 34 minutes (64 commuters, 18.9%) for males and 35 to 39 minutes (57 commuters, 16.9%) for females.
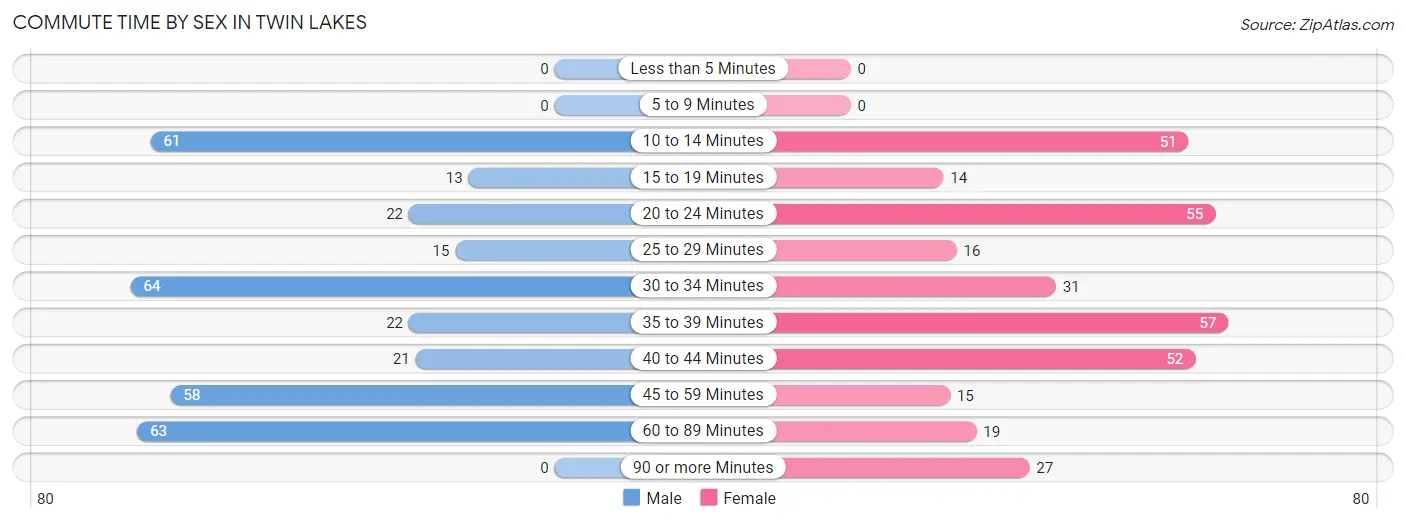
| Commute Time | Male | Female |
| Less than 5 Minutes | 0 (0.0%) | 0 (0.0%) |
| 5 to 9 Minutes | 0 (0.0%) | 0 (0.0%) |
| 10 to 14 Minutes | 61 (18.0%) | 51 (15.1%) |
| 15 to 19 Minutes | 13 (3.8%) | 14 (4.2%) |
| 20 to 24 Minutes | 22 (6.5%) | 55 (16.3%) |
| 25 to 29 Minutes | 15 (4.4%) | 16 (4.8%) |
| 30 to 34 Minutes | 64 (18.9%) | 31 (9.2%) |
| 35 to 39 Minutes | 22 (6.5%) | 57 (16.9%) |
| 40 to 44 Minutes | 21 (6.2%) | 52 (15.4%) |
| 45 to 59 Minutes | 58 (17.1%) | 15 (4.4%) |
| 60 to 89 Minutes | 63 (18.6%) | 19 (5.6%) |
| 90 or more Minutes | 0 (0.0%) | 27 (8.0%) |
Time of Departure to Work by Sex in Twin Lakes
The most frequent times of departure to work in Twin Lakes are 7:00 AM to 7:29 AM (106, 31.3%) for males and 7:00 AM to 7:29 AM (95, 28.2%) for females.
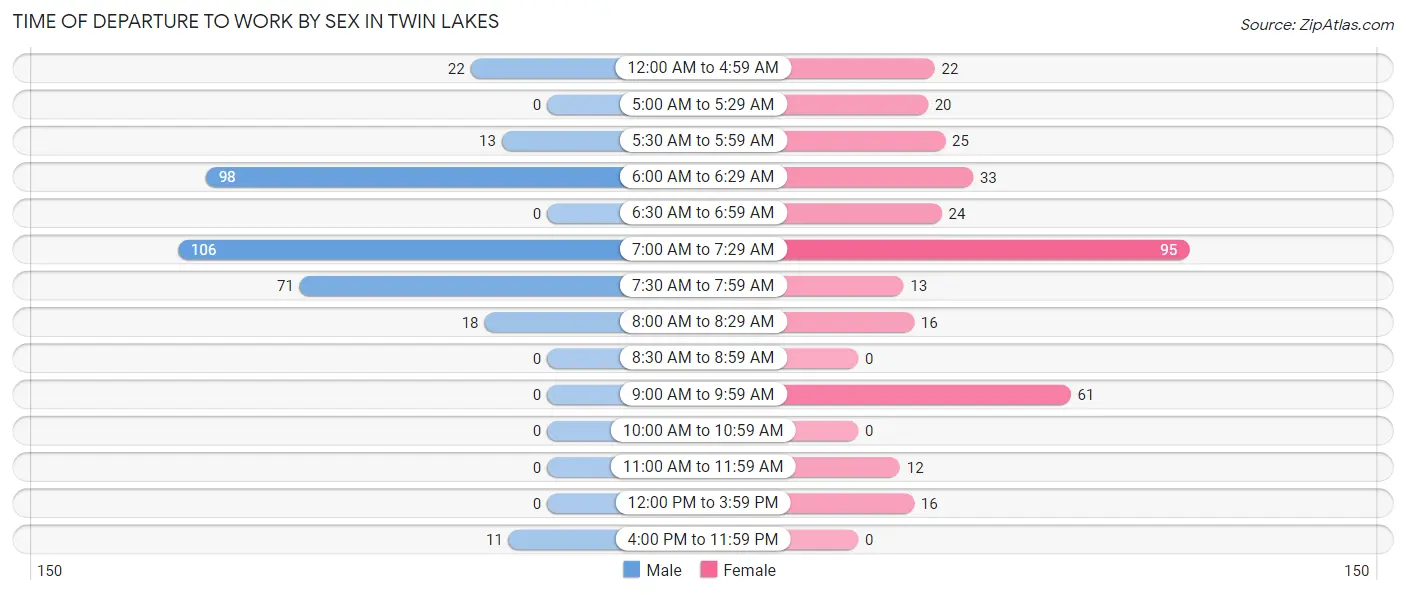
| Time of Departure | Male | Female |
| 12:00 AM to 4:59 AM | 22 (6.5%) | 22 (6.5%) |
| 5:00 AM to 5:29 AM | 0 (0.0%) | 20 (5.9%) |
| 5:30 AM to 5:59 AM | 13 (3.8%) | 25 (7.4%) |
| 6:00 AM to 6:29 AM | 98 (28.9%) | 33 (9.8%) |
| 6:30 AM to 6:59 AM | 0 (0.0%) | 24 (7.1%) |
| 7:00 AM to 7:29 AM | 106 (31.3%) | 95 (28.2%) |
| 7:30 AM to 7:59 AM | 71 (20.9%) | 13 (3.9%) |
| 8:00 AM to 8:29 AM | 18 (5.3%) | 16 (4.8%) |
| 8:30 AM to 8:59 AM | 0 (0.0%) | 0 (0.0%) |
| 9:00 AM to 9:59 AM | 0 (0.0%) | 61 (18.1%) |
| 10:00 AM to 10:59 AM | 0 (0.0%) | 0 (0.0%) |
| 11:00 AM to 11:59 AM | 0 (0.0%) | 12 (3.6%) |
| 12:00 PM to 3:59 PM | 0 (0.0%) | 16 (4.8%) |
| 4:00 PM to 11:59 PM | 11 (3.2%) | 0 (0.0%) |
| Total | 339 (100.0%) | 337 (100.0%) |
Housing Occupancy in Twin Lakes
Occupancy by Ownership in Twin Lakes
Of the total 541 dwellings in Twin Lakes, owner-occupied units account for 469 (86.7%), while renter-occupied units make up 72 (13.3%).
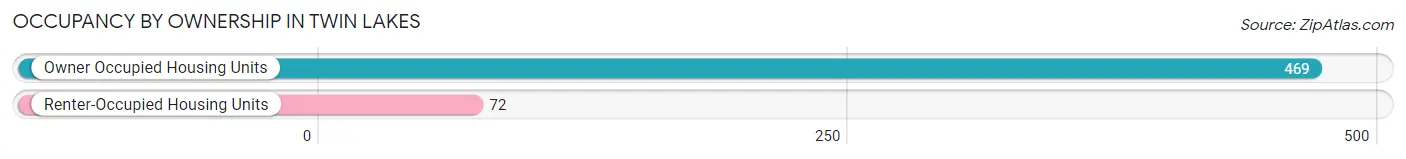
| Occupancy | # Housing Units | % Housing Units |
| Owner Occupied Housing Units | 469 | 86.7% |
| Renter-Occupied Housing Units | 72 | 13.3% |
| Total Occupied Housing Units | 541 | 100.0% |
Occupancy by Household Size in Twin Lakes
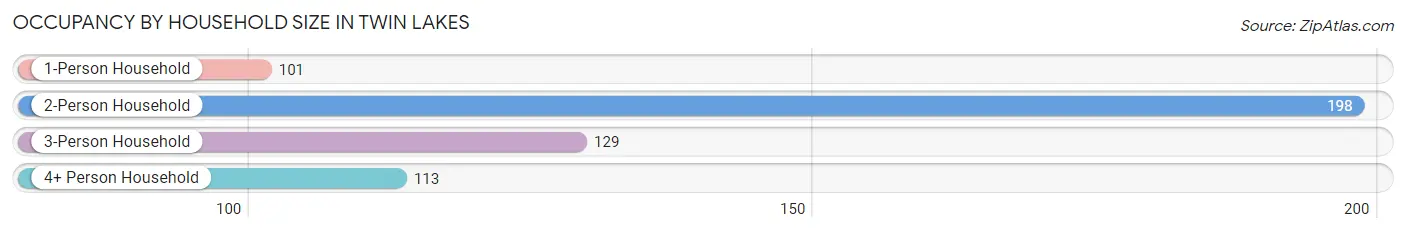
| Household Size | # Housing Units | % Housing Units |
| 1-Person Household | 101 | 18.7% |
| 2-Person Household | 198 | 36.6% |
| 3-Person Household | 129 | 23.8% |
| 4+ Person Household | 113 | 20.9% |
| Total Housing Units | 541 | 100.0% |
Occupancy by Ownership by Household Size in Twin Lakes
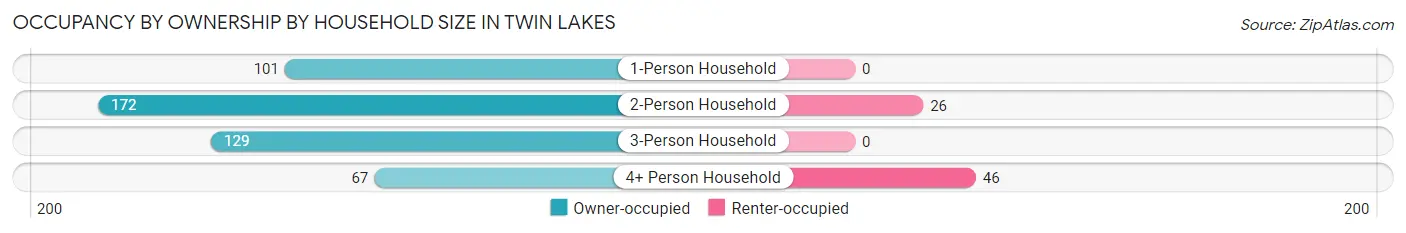
| Household Size | Owner-occupied | Renter-occupied |
| 1-Person Household | 101 (100.0%) | 0 (0.0%) |
| 2-Person Household | 172 (86.9%) | 26 (13.1%) |
| 3-Person Household | 129 (100.0%) | 0 (0.0%) |
| 4+ Person Household | 67 (59.3%) | 46 (40.7%) |
| Total Housing Units | 469 (86.7%) | 72 (13.3%) |
Occupancy by Educational Attainment in Twin Lakes
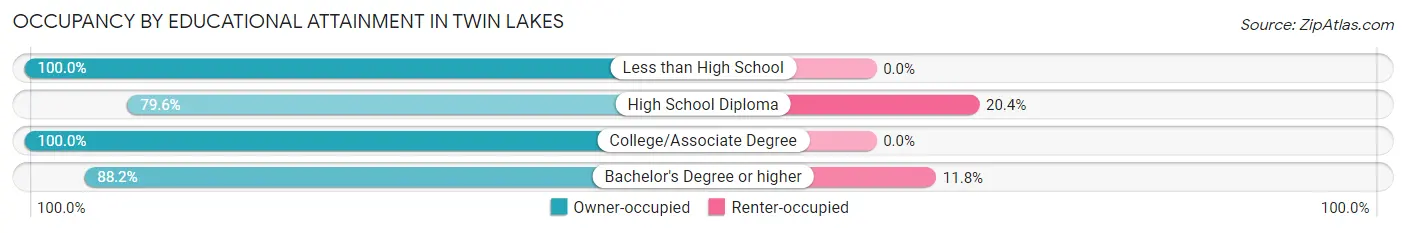
| Household Size | Owner-occupied | Renter-occupied |
| Less than High School | 15 (100.0%) | 0 (0.0%) |
| High School Diploma | 246 (79.6%) | 63 (20.4%) |
| College/Associate Degree | 141 (100.0%) | 0 (0.0%) |
| Bachelor's Degree or higher | 67 (88.2%) | 9 (11.8%) |
Occupancy by Age of Householder in Twin Lakes
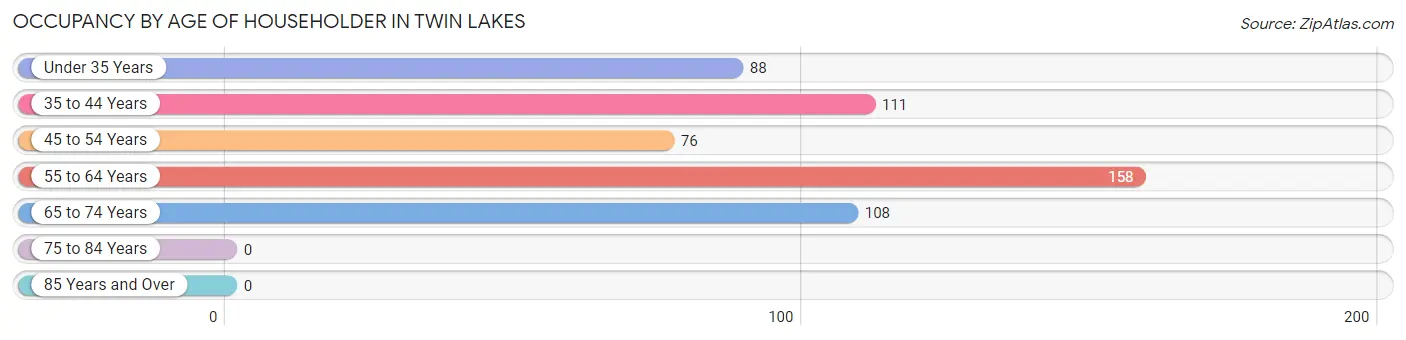
| Age Bracket | # Households | % Households |
| Under 35 Years | 88 | 16.3% |
| 35 to 44 Years | 111 | 20.5% |
| 45 to 54 Years | 76 | 14.1% |
| 55 to 64 Years | 158 | 29.2% |
| 65 to 74 Years | 108 | 20.0% |
| 75 to 84 Years | 0 | 0.0% |
| 85 Years and Over | 0 | 0.0% |
| Total | 541 | 100.0% |
Housing Finances in Twin Lakes
Median Income by Occupancy in Twin Lakes
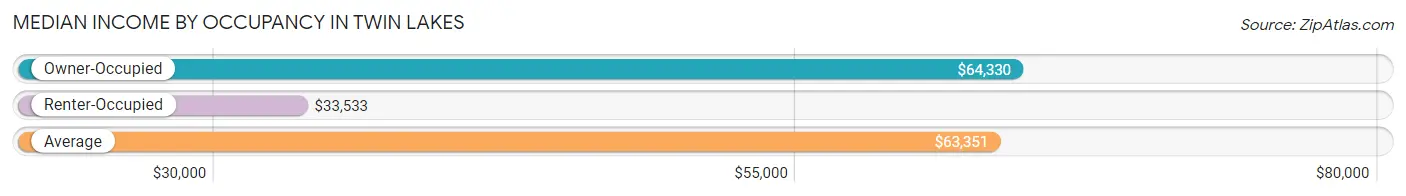
| Occupancy Type | # Households | Median Income |
| Owner-Occupied | 469 (86.7%) | $64,330 |
| Renter-Occupied | 72 (13.3%) | $33,533 |
| Average | 541 (100.0%) | $63,351 |
Occupancy by Householder Income Bracket in Twin Lakes
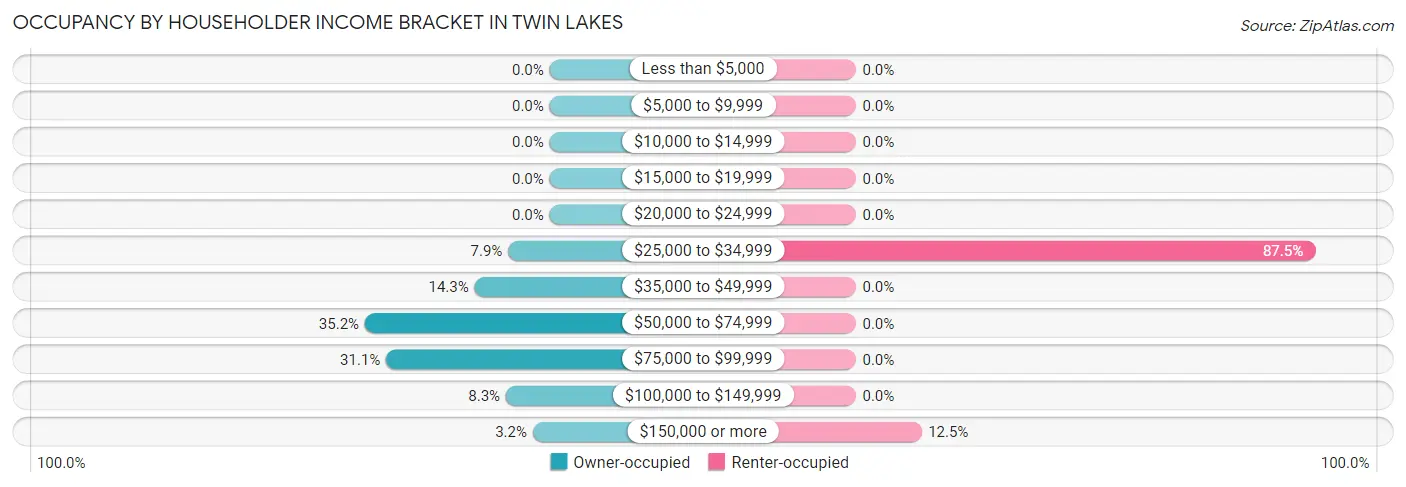
| Income Bracket | Owner-occupied | Renter-occupied |
| Less than $5,000 | 0 (0.0%) | 0 (0.0%) |
| $5,000 to $9,999 | 0 (0.0%) | 0 (0.0%) |
| $10,000 to $14,999 | 0 (0.0%) | 0 (0.0%) |
| $15,000 to $19,999 | 0 (0.0%) | 0 (0.0%) |
| $20,000 to $24,999 | 0 (0.0%) | 0 (0.0%) |
| $25,000 to $34,999 | 37 (7.9%) | 63 (87.5%) |
| $35,000 to $49,999 | 67 (14.3%) | 0 (0.0%) |
| $50,000 to $74,999 | 165 (35.2%) | 0 (0.0%) |
| $75,000 to $99,999 | 146 (31.1%) | 0 (0.0%) |
| $100,000 to $149,999 | 39 (8.3%) | 0 (0.0%) |
| $150,000 or more | 15 (3.2%) | 9 (12.5%) |
| Total | 469 (100.0%) | 72 (100.0%) |
Monthly Housing Cost Tiers in Twin Lakes
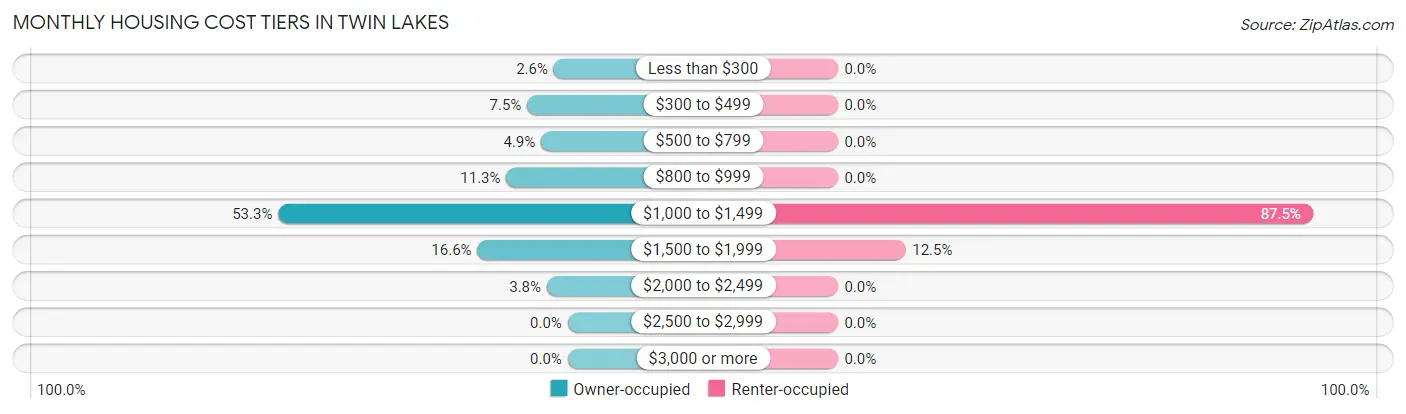
| Monthly Cost | Owner-occupied | Renter-occupied |
| Less than $300 | 12 (2.6%) | 0 (0.0%) |
| $300 to $499 | 35 (7.5%) | 0 (0.0%) |
| $500 to $799 | 23 (4.9%) | 0 (0.0%) |
| $800 to $999 | 53 (11.3%) | 0 (0.0%) |
| $1,000 to $1,499 | 250 (53.3%) | 63 (87.5%) |
| $1,500 to $1,999 | 78 (16.6%) | 9 (12.5%) |
| $2,000 to $2,499 | 18 (3.8%) | 0 (0.0%) |
| $2,500 to $2,999 | 0 (0.0%) | 0 (0.0%) |
| $3,000 or more | 0 (0.0%) | 0 (0.0%) |
| Total | 469 (100.0%) | 72 (100.0%) |
Physical Housing Characteristics in Twin Lakes
Housing Structures in Twin Lakes
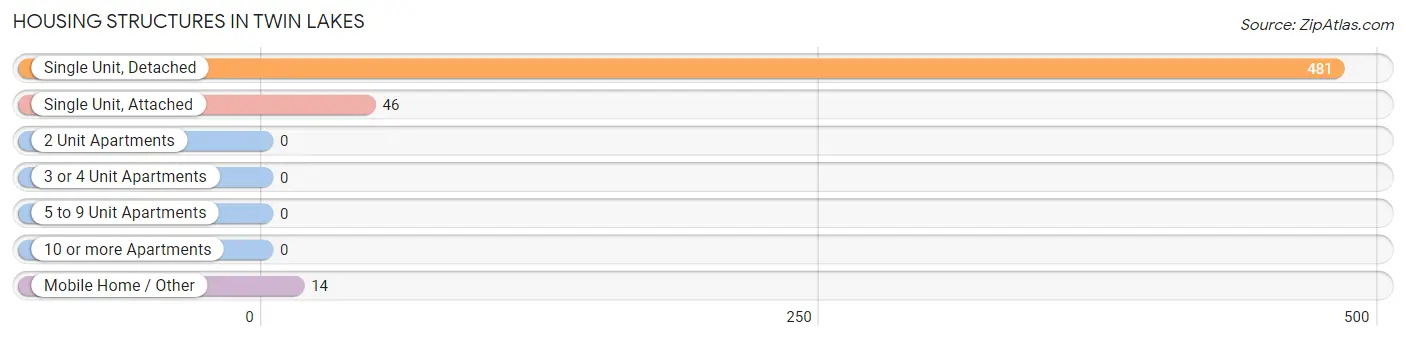
| Structure Type | # Housing Units | % Housing Units |
| Single Unit, Detached | 481 | 88.9% |
| Single Unit, Attached | 46 | 8.5% |
| 2 Unit Apartments | 0 | 0.0% |
| 3 or 4 Unit Apartments | 0 | 0.0% |
| 5 to 9 Unit Apartments | 0 | 0.0% |
| 10 or more Apartments | 0 | 0.0% |
| Mobile Home / Other | 14 | 2.6% |
| Total | 541 | 100.0% |
Housing Structures by Occupancy in Twin Lakes
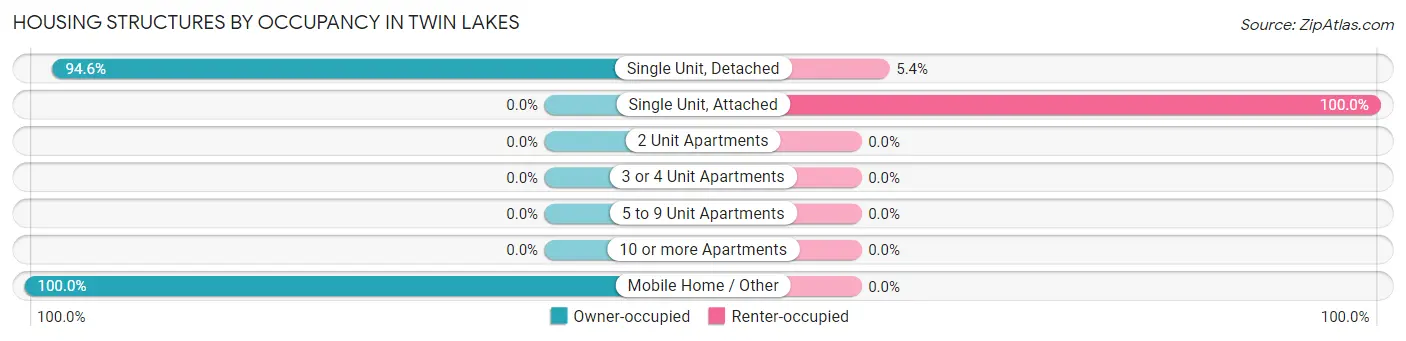
| Structure Type | Owner-occupied | Renter-occupied |
| Single Unit, Detached | 455 (94.6%) | 26 (5.4%) |
| Single Unit, Attached | 0 (0.0%) | 46 (100.0%) |
| 2 Unit Apartments | 0 (0.0%) | 0 (0.0%) |
| 3 or 4 Unit Apartments | 0 (0.0%) | 0 (0.0%) |
| 5 to 9 Unit Apartments | 0 (0.0%) | 0 (0.0%) |
| 10 or more Apartments | 0 (0.0%) | 0 (0.0%) |
| Mobile Home / Other | 14 (100.0%) | 0 (0.0%) |
| Total | 469 (86.7%) | 72 (13.3%) |
Housing Structures by Number of Rooms in Twin Lakes
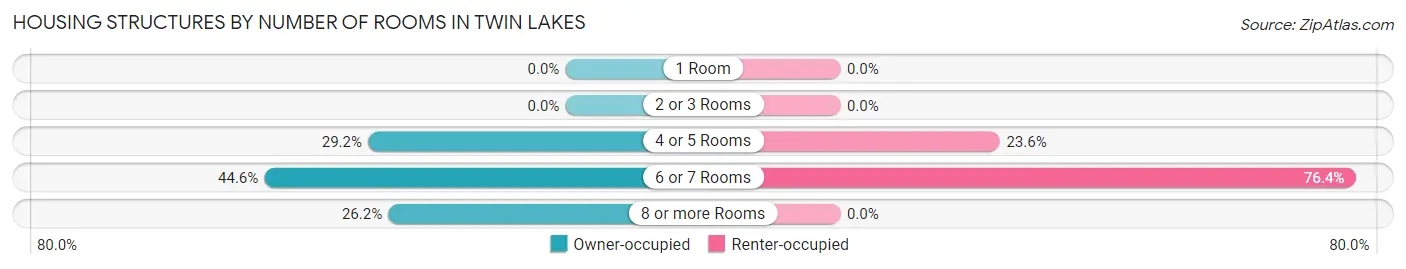
| Number of Rooms | Owner-occupied | Renter-occupied |
| 1 Room | 0 (0.0%) | 0 (0.0%) |
| 2 or 3 Rooms | 0 (0.0%) | 0 (0.0%) |
| 4 or 5 Rooms | 137 (29.2%) | 17 (23.6%) |
| 6 or 7 Rooms | 209 (44.6%) | 55 (76.4%) |
| 8 or more Rooms | 123 (26.2%) | 0 (0.0%) |
| Total | 469 (100.0%) | 72 (100.0%) |
Housing Structure by Heating Type in Twin Lakes
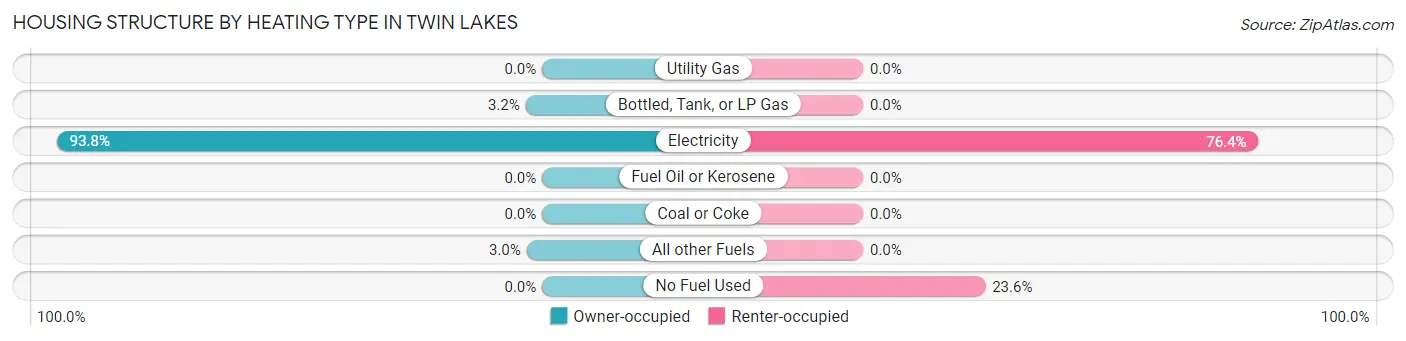
| Heating Type | Owner-occupied | Renter-occupied |
| Utility Gas | 0 (0.0%) | 0 (0.0%) |
| Bottled, Tank, or LP Gas | 15 (3.2%) | 0 (0.0%) |
| Electricity | 440 (93.8%) | 55 (76.4%) |
| Fuel Oil or Kerosene | 0 (0.0%) | 0 (0.0%) |
| Coal or Coke | 0 (0.0%) | 0 (0.0%) |
| All other Fuels | 14 (3.0%) | 0 (0.0%) |
| No Fuel Used | 0 (0.0%) | 17 (23.6%) |
| Total | 469 (100.0%) | 72 (100.0%) |
Household Vehicle Usage in Twin Lakes
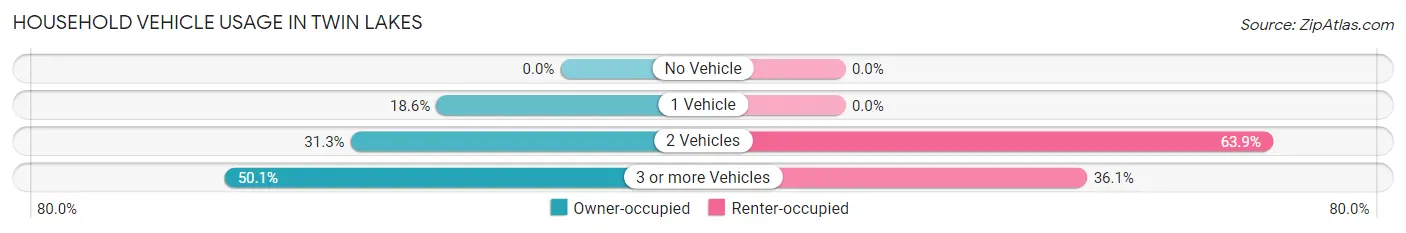
| Vehicles per Household | Owner-occupied | Renter-occupied |
| No Vehicle | 0 (0.0%) | 0 (0.0%) |
| 1 Vehicle | 87 (18.5%) | 0 (0.0%) |
| 2 Vehicles | 147 (31.3%) | 46 (63.9%) |
| 3 or more Vehicles | 235 (50.1%) | 26 (36.1%) |
| Total | 469 (100.0%) | 72 (100.0%) |
Real Estate & Mortgages in Twin Lakes
Real Estate and Mortgage Overview in Twin Lakes
| Characteristic | Without Mortgage | With Mortgage |
| Housing Units | 53 | 416 |
| Median Property Value | $273,000 | $216,200 |
| Median Household Income | - | - |
| Monthly Housing Costs | $385 | $0 |
| Real Estate Taxes | $1,250 | $53 |
Property Value by Mortgage Status in Twin Lakes
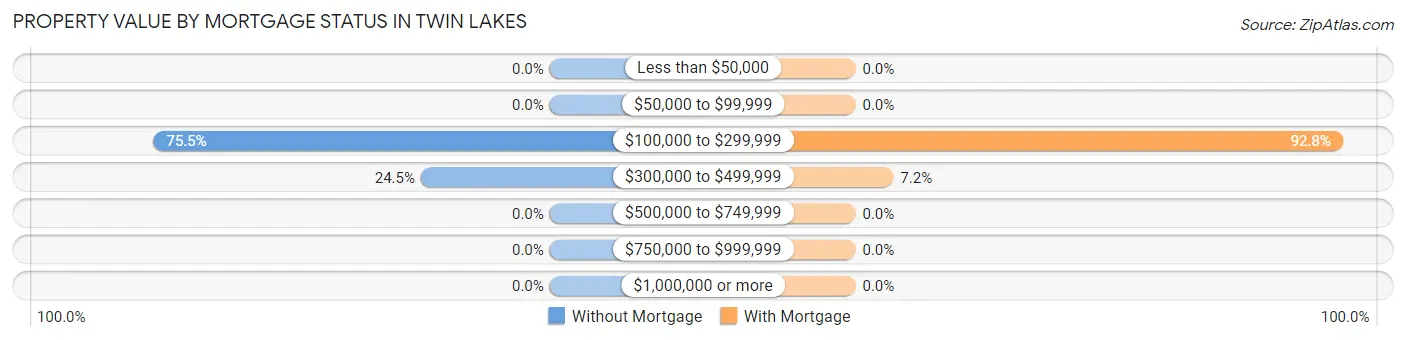
| Property Value | Without Mortgage | With Mortgage |
| Less than $50,000 | 0 (0.0%) | 0 (0.0%) |
| $50,000 to $99,999 | 0 (0.0%) | 0 (0.0%) |
| $100,000 to $299,999 | 40 (75.5%) | 386 (92.8%) |
| $300,000 to $499,999 | 13 (24.5%) | 30 (7.2%) |
| $500,000 to $749,999 | 0 (0.0%) | 0 (0.0%) |
| $750,000 to $999,999 | 0 (0.0%) | 0 (0.0%) |
| $1,000,000 or more | 0 (0.0%) | 0 (0.0%) |
| Total | 53 (100.0%) | 416 (100.0%) |
Household Income by Mortgage Status in Twin Lakes
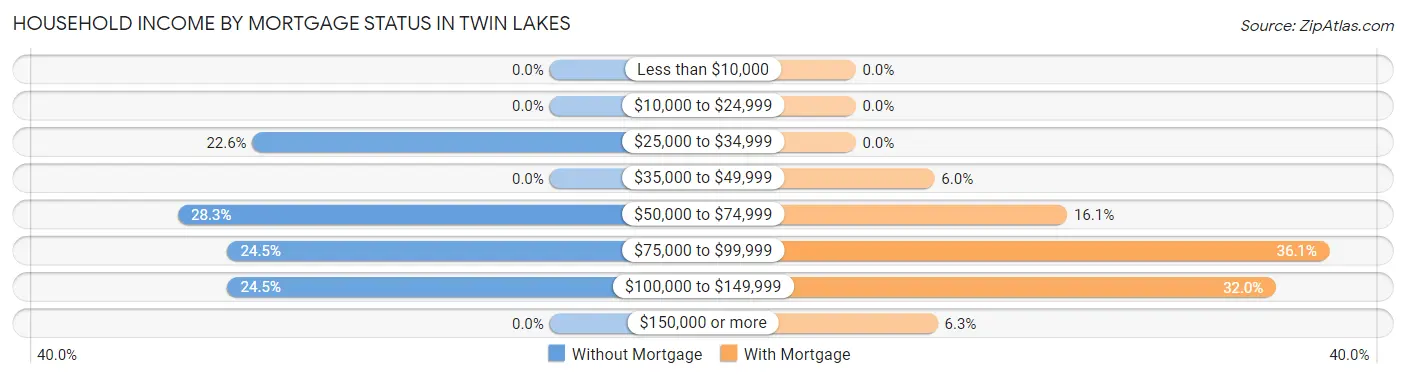
| Household Income | Without Mortgage | With Mortgage |
| Less than $10,000 | 0 (0.0%) | 0 (0.0%) |
| $10,000 to $24,999 | 0 (0.0%) | 0 (0.0%) |
| $25,000 to $34,999 | 12 (22.6%) | 0 (0.0%) |
| $35,000 to $49,999 | 0 (0.0%) | 25 (6.0%) |
| $50,000 to $74,999 | 15 (28.3%) | 67 (16.1%) |
| $75,000 to $99,999 | 13 (24.5%) | 150 (36.1%) |
| $100,000 to $149,999 | 13 (24.5%) | 133 (32.0%) |
| $150,000 or more | 0 (0.0%) | 26 (6.2%) |
| Total | 53 (100.0%) | 416 (100.0%) |
Property Value to Household Income Ratio in Twin Lakes
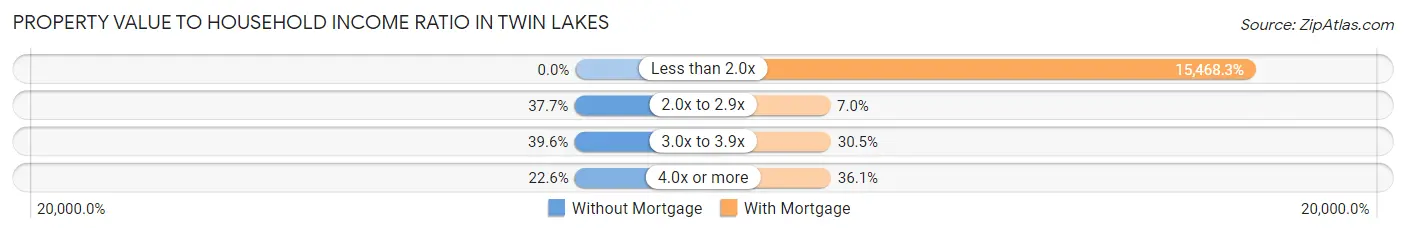
| Value-to-Income Ratio | Without Mortgage | With Mortgage |
| Less than 2.0x | 0 (0.0%) | 64,348 (15,468.3%) |
| 2.0x to 2.9x | 20 (37.7%) | 29 (7.0%) |
| 3.0x to 3.9x | 21 (39.6%) | 127 (30.5%) |
| 4.0x or more | 12 (22.6%) | 150 (36.1%) |
| Total | 53 (100.0%) | 416 (100.0%) |
Real Estate Taxes by Mortgage Status in Twin Lakes
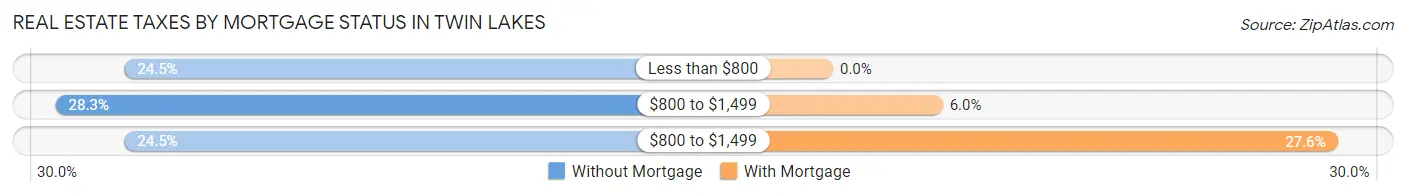
| Property Taxes | Without Mortgage | With Mortgage |
| Less than $800 | 13 (24.5%) | 0 (0.0%) |
| $800 to $1,499 | 15 (28.3%) | 25 (6.0%) |
| $800 to $1,499 | 13 (24.5%) | 115 (27.6%) |
| Total | 53 (100.0%) | 416 (100.0%) |
Health & Disability in Twin Lakes
Health Insurance Coverage by Age in Twin Lakes
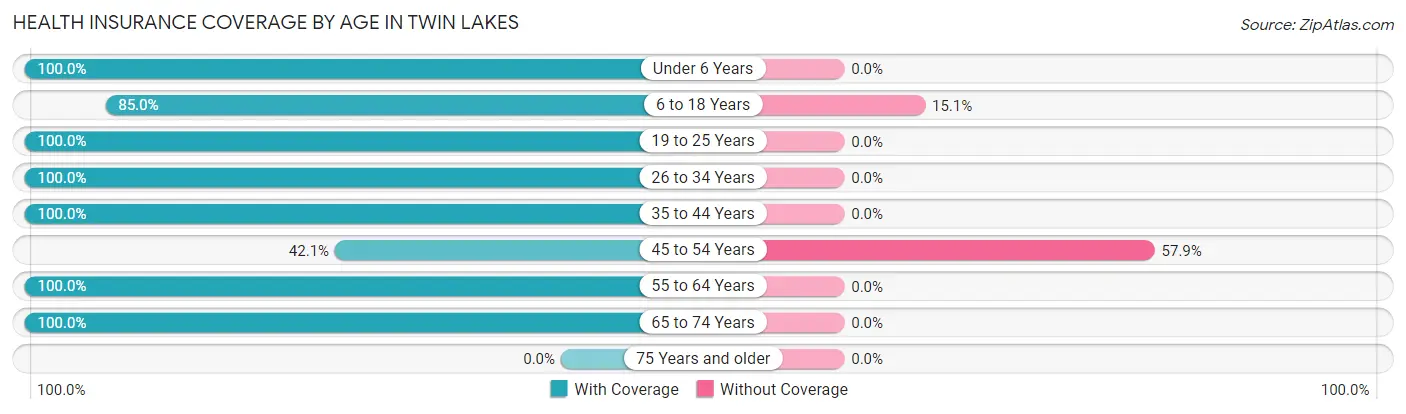
| Age Bracket | With Coverage | Without Coverage |
| Under 6 Years | 78 (100.0%) | 0 (0.0%) |
| 6 to 18 Years | 237 (85.0%) | 42 (15.0%) |
| 19 to 25 Years | 128 (100.0%) | 0 (0.0%) |
| 26 to 34 Years | 75 (100.0%) | 0 (0.0%) |
| 35 to 44 Years | 237 (100.0%) | 0 (0.0%) |
| 45 to 54 Years | 75 (42.1%) | 103 (57.9%) |
| 55 to 64 Years | 276 (100.0%) | 0 (0.0%) |
| 65 to 74 Years | 123 (100.0%) | 0 (0.0%) |
| 75 Years and older | 0 (0.0%) | 0 (0.0%) |
| Total | 1,229 (89.4%) | 145 (10.5%) |
Health Insurance Coverage by Citizenship Status in Twin Lakes
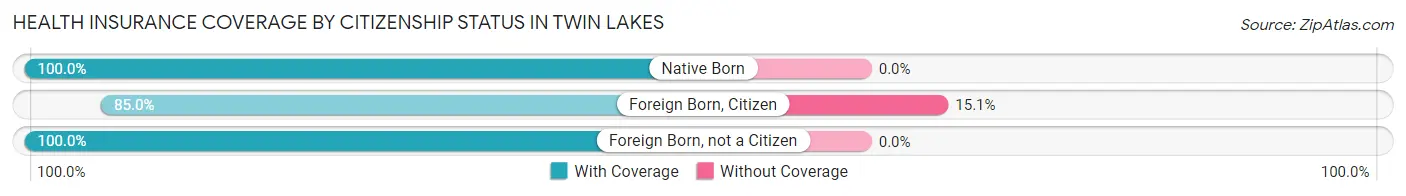
| Citizenship Status | With Coverage | Without Coverage |
| Native Born | 78 (100.0%) | 0 (0.0%) |
| Foreign Born, Citizen | 237 (85.0%) | 42 (15.0%) |
| Foreign Born, not a Citizen | 128 (100.0%) | 0 (0.0%) |
Health Insurance Coverage by Household Income in Twin Lakes
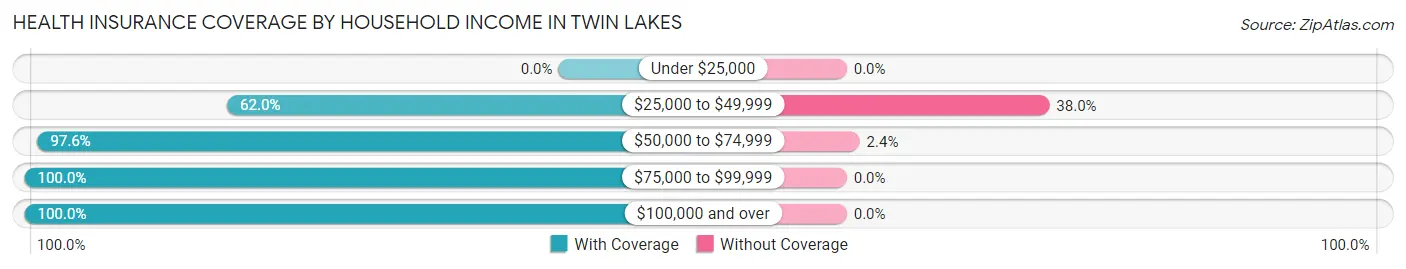
| Household Income | With Coverage | Without Coverage |
| Under $25,000 | 0 (0.0%) | 0 (0.0%) |
| $25,000 to $49,999 | 219 (62.0%) | 134 (38.0%) |
| $50,000 to $74,999 | 446 (97.6%) | 11 (2.4%) |
| $75,000 to $99,999 | 359 (100.0%) | 0 (0.0%) |
| $100,000 and over | 205 (100.0%) | 0 (0.0%) |
Public vs Private Health Insurance Coverage by Age in Twin Lakes
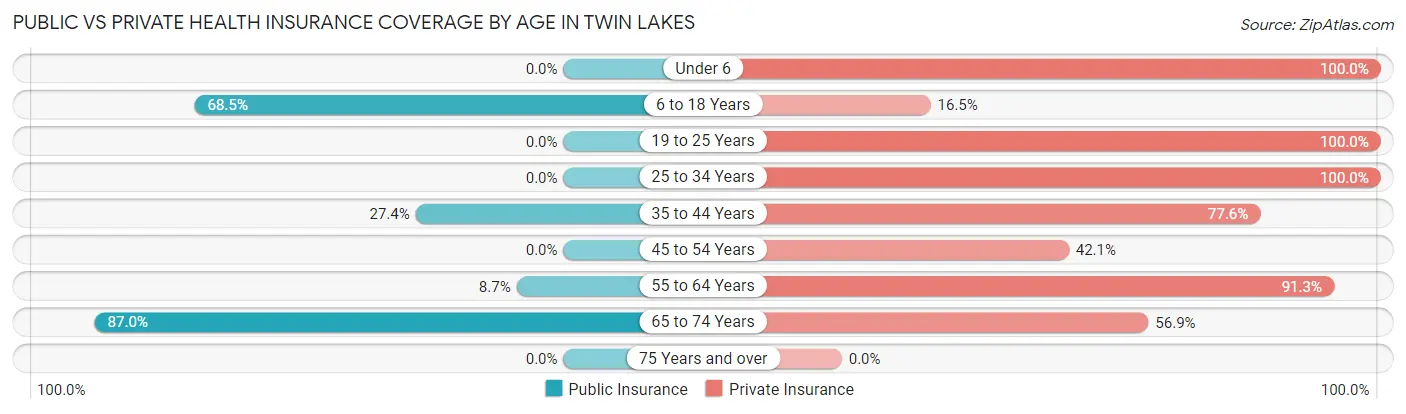
| Age Bracket | Public Insurance | Private Insurance |
| Under 6 | 0 (0.0%) | 78 (100.0%) |
| 6 to 18 Years | 191 (68.5%) | 46 (16.5%) |
| 19 to 25 Years | 0 (0.0%) | 128 (100.0%) |
| 25 to 34 Years | 0 (0.0%) | 75 (100.0%) |
| 35 to 44 Years | 65 (27.4%) | 184 (77.6%) |
| 45 to 54 Years | 0 (0.0%) | 75 (42.1%) |
| 55 to 64 Years | 24 (8.7%) | 252 (91.3%) |
| 65 to 74 Years | 107 (87.0%) | 70 (56.9%) |
| 75 Years and over | 0 (0.0%) | 0 (0.0%) |
| Total | 387 (28.2%) | 908 (66.1%) |
Disability Status by Sex by Age in Twin Lakes
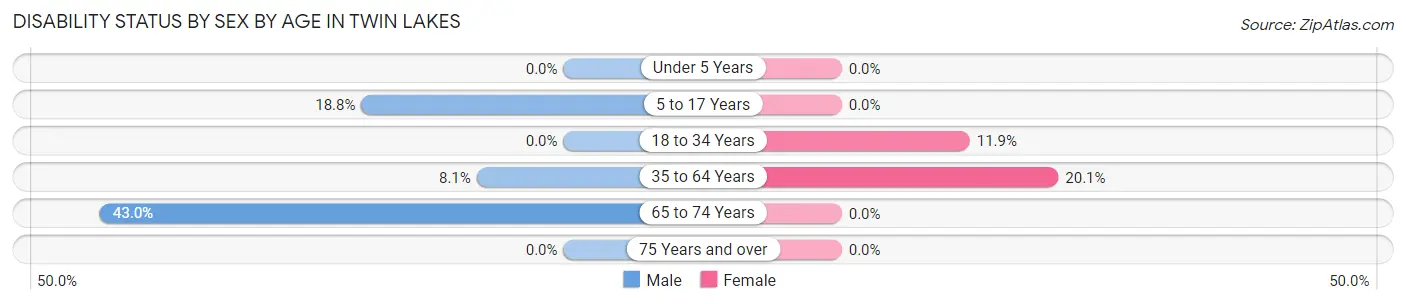
| Age Bracket | Male | Female |
| Under 5 Years | 0 (0.0%) | 0 (0.0%) |
| 5 to 17 Years | 15 (18.8%) | 0 (0.0%) |
| 18 to 34 Years | 0 (0.0%) | 12 (11.9%) |
| 35 to 64 Years | 24 (8.1%) | 79 (20.1%) |
| 65 to 74 Years | 40 (43.0%) | 0 (0.0%) |
| 75 Years and over | 0 (0.0%) | 0 (0.0%) |
Disability Class by Sex by Age in Twin Lakes
Disability Class: Hearing Difficulty
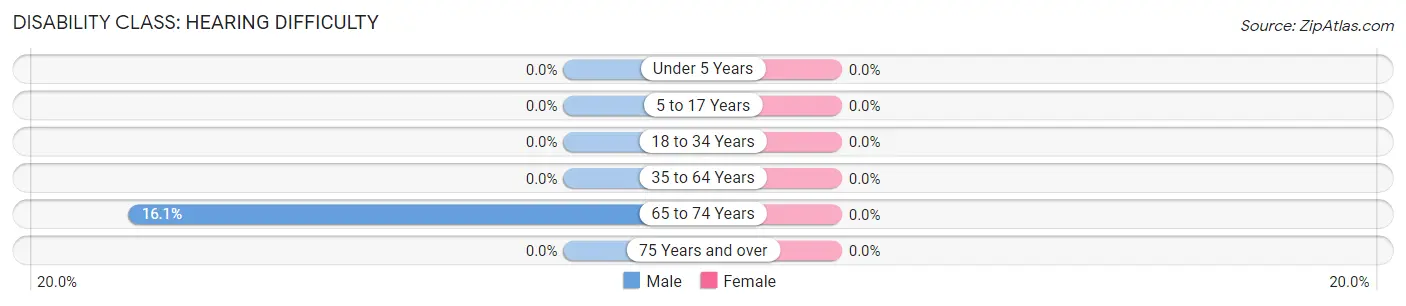
| Age Bracket | Male | Female |
| Under 5 Years | 0 (0.0%) | 0 (0.0%) |
| 5 to 17 Years | 0 (0.0%) | 0 (0.0%) |
| 18 to 34 Years | 0 (0.0%) | 0 (0.0%) |
| 35 to 64 Years | 0 (0.0%) | 0 (0.0%) |
| 65 to 74 Years | 15 (16.1%) | 0 (0.0%) |
| 75 Years and over | 0 (0.0%) | 0 (0.0%) |
Disability Class: Vision Difficulty

| Age Bracket | Male | Female |
| Under 5 Years | 0 (0.0%) | 0 (0.0%) |
| 5 to 17 Years | 0 (0.0%) | 0 (0.0%) |
| 18 to 34 Years | 0 (0.0%) | 0 (0.0%) |
| 35 to 64 Years | 0 (0.0%) | 0 (0.0%) |
| 65 to 74 Years | 15 (16.1%) | 0 (0.0%) |
| 75 Years and over | 0 (0.0%) | 0 (0.0%) |
Disability Class: Cognitive Difficulty
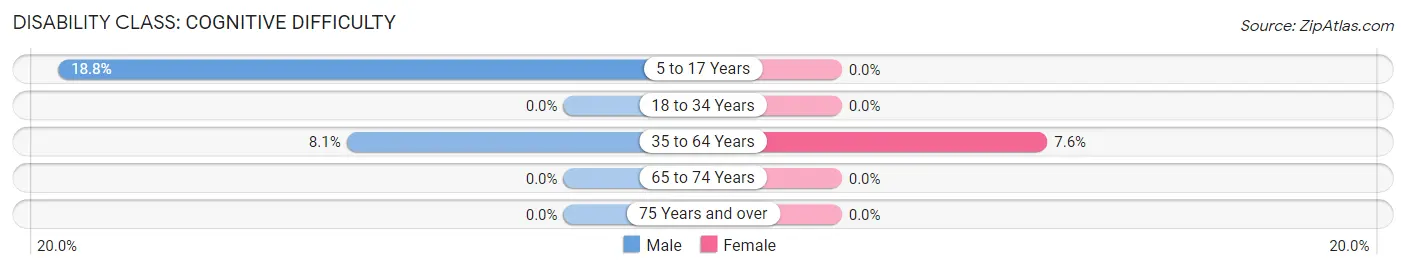
| Age Bracket | Male | Female |
| 5 to 17 Years | 15 (18.8%) | 0 (0.0%) |
| 18 to 34 Years | 0 (0.0%) | 0 (0.0%) |
| 35 to 64 Years | 24 (8.1%) | 30 (7.6%) |
| 65 to 74 Years | 0 (0.0%) | 0 (0.0%) |
| 75 Years and over | 0 (0.0%) | 0 (0.0%) |
Disability Class: Ambulatory Difficulty
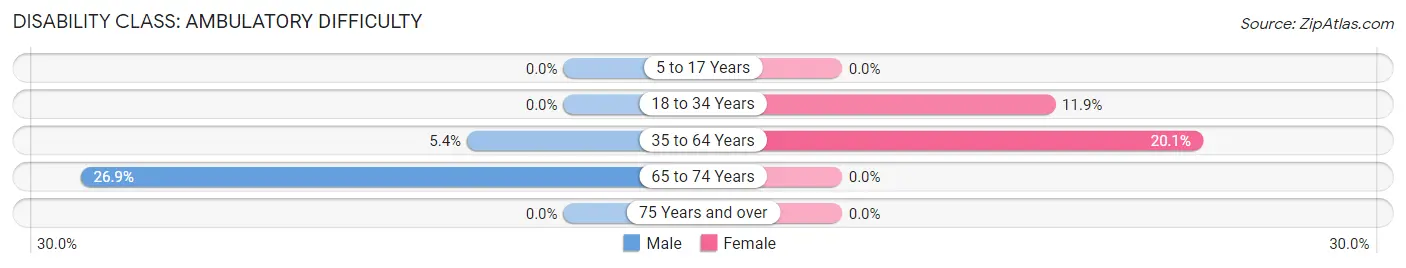
| Age Bracket | Male | Female |
| 5 to 17 Years | 0 (0.0%) | 0 (0.0%) |
| 18 to 34 Years | 0 (0.0%) | 12 (11.9%) |
| 35 to 64 Years | 16 (5.4%) | 79 (20.1%) |
| 65 to 74 Years | 25 (26.9%) | 0 (0.0%) |
| 75 Years and over | 0 (0.0%) | 0 (0.0%) |
Disability Class: Self-Care Difficulty
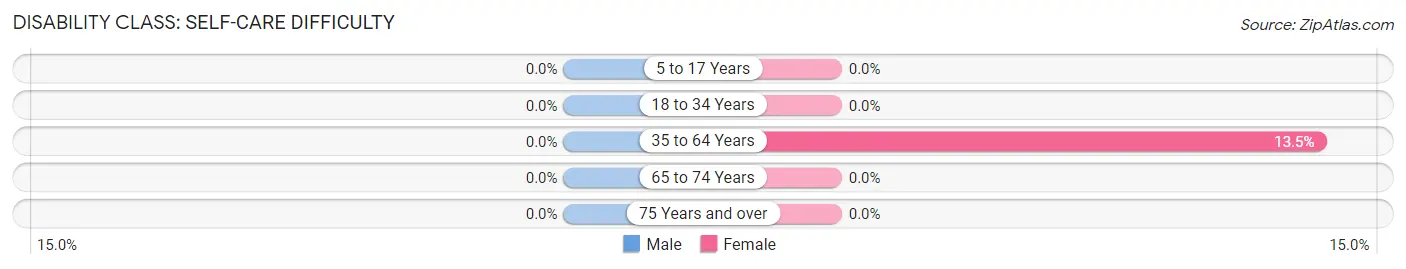
| Age Bracket | Male | Female |
| 5 to 17 Years | 0 (0.0%) | 0 (0.0%) |
| 18 to 34 Years | 0 (0.0%) | 0 (0.0%) |
| 35 to 64 Years | 0 (0.0%) | 53 (13.5%) |
| 65 to 74 Years | 0 (0.0%) | 0 (0.0%) |
| 75 Years and over | 0 (0.0%) | 0 (0.0%) |
Technology Access in Twin Lakes
Computing Device Access in Twin Lakes
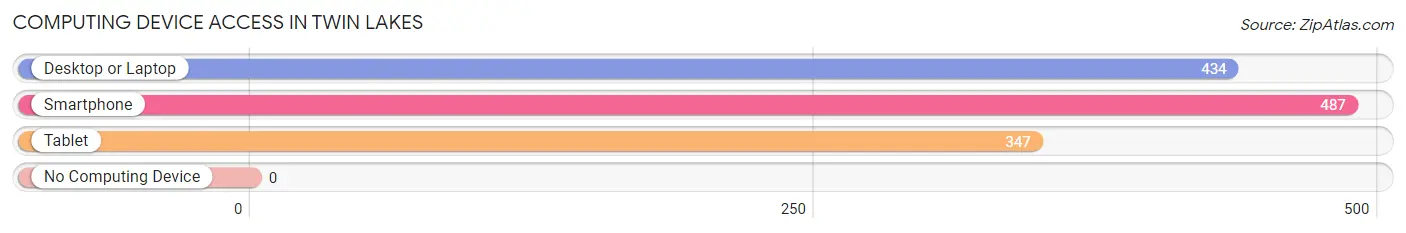
| Device Type | # Households | % Households |
| Desktop or Laptop | 434 | 80.2% |
| Smartphone | 487 | 90.0% |
| Tablet | 347 | 64.1% |
| No Computing Device | 0 | 0.0% |
| Total | 541 | 100.0% |
Internet Access in Twin Lakes
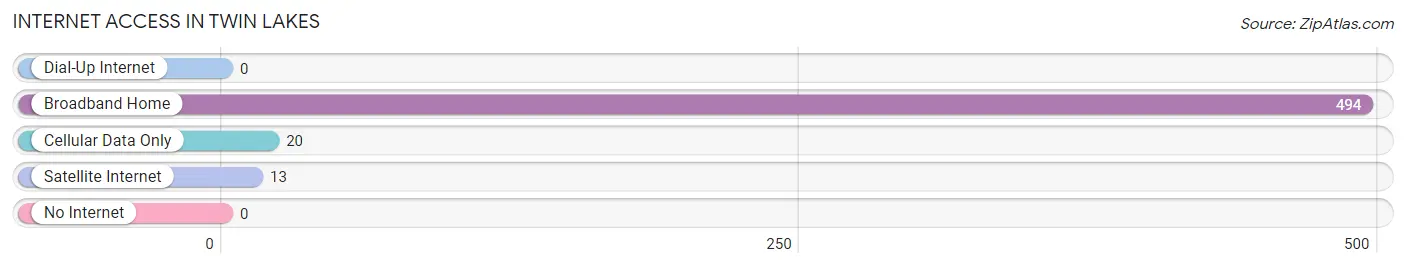
| Internet Type | # Households | % Households |
| Dial-Up Internet | 0 | 0.0% |
| Broadband Home | 494 | 91.3% |
| Cellular Data Only | 20 | 3.7% |
| Satellite Internet | 13 | 2.4% |
| No Internet | 0 | 0.0% |
| Total | 541 | 100.0% |
Twin Lakes Summary
Twin Lakes is a small unincorporated community located in the Blue Ridge Mountains of Virginia. It is situated in the northern part of the state, in the county of Bedford. The community is located on the banks of two small lakes, hence its name. Twin Lakes is a rural area with a population of just over 500 people.
History
Twin Lakes was first settled in the late 1700s by a group of settlers from Pennsylvania. The settlers were attracted to the area due to its abundance of natural resources, including timber and fish. The settlers built a small community around the two lakes, and the area quickly grew in population.
In the early 1800s, the area was home to a number of small farms and businesses. The community was also home to a number of churches, including the Twin Lakes Baptist Church, which was founded in 1820.
In the late 1800s, the area began to experience a period of growth and development. The Twin Lakes Railroad was built in 1891, connecting the community to the larger cities of Roanoke and Lynchburg. This allowed for increased trade and commerce in the area.
In the early 1900s, the area experienced a period of decline. The railroad was abandoned in the 1920s, and the population began to decline. The area remained largely rural until the 1950s, when the population began to increase again.
Geography
Twin Lakes is located in the northern part of Virginia, in the county of Bedford. The community is situated on the banks of two small lakes, hence its name. The area is surrounded by the Blue Ridge Mountains, and is located approximately 30 miles from the city of Roanoke.
The climate in Twin Lakes is temperate, with hot summers and cold winters. The average temperature in the summer is around 80 degrees Fahrenheit, and the average temperature in the winter is around 40 degrees Fahrenheit.
Economy
The economy of Twin Lakes is largely based on agriculture and tourism. The area is home to a number of small farms, which produce a variety of crops, including corn, soybeans, and hay. The area is also home to a number of small businesses, including restaurants, stores, and lodging.
Tourism is an important part of the economy of Twin Lakes. The area is home to a number of attractions, including the Twin Lakes State Park, which offers camping, fishing, and hiking opportunities. The area is also home to a number of wineries, which offer tastings and tours.
Demographics
As of the 2010 census, the population of Twin Lakes was 514. The racial makeup of the community was 97.3% White, 0.6% African American, 0.2% Native American, 0.4% Asian, and 1.5% from other races. The median household income in the area was $37,500, and the median age was 44.7 years.
Common Questions
What is Per Capita Income in Twin Lakes?
Per Capita income in Twin Lakes is $29,059.
What is the Median Family Income in Twin Lakes?
Median Family Income in Twin Lakes is $62,310.
What is the Median Household income in Twin Lakes?
Median Household Income in Twin Lakes is $63,351.
What is Income or Wage Gap in Twin Lakes?
Income or Wage Gap in Twin Lakes is 20.9%.
Women in Twin Lakes earn 79.1 cents for every dollar earned by a man.
What is Inequality or Gini Index in Twin Lakes?
Inequality or Gini Index in Twin Lakes is 0.25.
What is the Total Population of Twin Lakes?
Total Population of Twin Lakes is 1,374.
What is the Total Male Population of Twin Lakes?
Total Male Population of Twin Lakes is 636.
What is the Total Female Population of Twin Lakes?
Total Female Population of Twin Lakes is 738.
What is the Ratio of Males per 100 Females in Twin Lakes?
There are 86.18 Males per 100 Females in Twin Lakes.
What is the Ratio of Females per 100 Males in Twin Lakes?
There are 116.04 Females per 100 Males in Twin Lakes.
What is the Median Population Age in Twin Lakes?
Median Population Age in Twin Lakes is 38.8 Years.
What is the Average Family Size in Twin Lakes
Average Family Size in Twin Lakes is 2.7 People.
What is the Average Household Size in Twin Lakes
Average Household Size in Twin Lakes is 2.5 People.
How Large is the Labor Force in Twin Lakes?
There are 747 People in the Labor Forcein in Twin Lakes.
What is the Percentage of People in the Labor Force in Twin Lakes?
69.9% of People are in the Labor Force in Twin Lakes.